Traffic Sign Detection Method Based on Improved SSD


Institute of High Performance Computing and Bigdata, Nanjing University of Posts and Telecommunications, Nanjing 210003, China
*
Author to whom correspondence should be addressed.
Information 2020, 11(10), 475; https://0-doi-org.brum.beds.ac.uk/10.3390/info11100475
Submission received: 2 August 2020
/
Revised: 25 September 2020
/
Accepted: 29 September 2020
/
Published: 9 October 2020
(This article belongs to the Special Issue Artificial Intelligence and Decision Support Systems)
Abstract
:Due to changes in illumination, adverse weather conditions, and interference from signs similar to real traffic signs, the false detection of traffic signs is possible. Nevertheless, in order to improve the detection effect of small targets, baseline SSD (single shot multibox detector) adopts a multi-scale feature detection method to improve the detection effect to some extent. The detection effect of small targets is improved, but the number of calculations needed for the baseline SSD network is large. To this end, we propose a lightweight SSD network algorithm. This method uses some 1 × 1 convolution kernels to replace some of the 3 × 3 convolution kernels in the baseline network and deletes some convolutional layers to reduce the calculation load of the baseline SSD network. Then the color detection algorithm based on the phase difference method and the connected component calculation are used to further filter the detection results, and finally, the data enhancement strategy based on the image appearance transformation is used to improve the balance of the dataset. The experimental results show that the proposed method is 3% more accurate than the baseline SSD network, and more importantly, the detection speed is also increased by 1.2 times.
1. Introduction
The detection and recognition of traffic signs are major research areas of unmanned driving technology. They provide effective information for safe driving and navigation, and play a vital role in regulating driver behavior, ensuring smooth traffic and safe travelling [1]. However, the actual traffic conditions are complicated due to changes in illumination, adverse weather conditions, or similar false indications, so the research on traffic sign detection still faces huge challenges [2]. Since the warning, mandatory, and prohibitive traffic signs are colorful triangles, circles, and rectangles, traditional methods generally extract image features by segmenting areas of interest, and by using single or several classification operators to identify targets. Ayoub et al. [3] proposed a three-stage real-time traffic sign detection and recognition system based on random forest, and Gülcan et al. [4] put forward a traffic sign detection algorithm based on color and shape. In recent years, as methods based on deep learning have become increasingly popular in the field of traffic sign detection, they have broken the constraints of image semantic expression and are widely used in the detection and recognition of traffic signs. Algorithms based on improved network structure [5,6,7] have increased the detection accuracy of traffic signs, methods based on image segmentation [8,9] have realized the detection of traffic signs in complex environments, and the detection method based on attention mechanism [10,11] extracts the area of interest from the input image through the attention module, in order to refine the feature extraction under the complex background. Zhang and Song [12,13] designed a lightweight network based on model compression, which reduced the calculation of network parameters to a certain extent, and realized the rapid detection of traffic signs. These methods have improved the detection accuracy of traffic signs, and reduced false detections to some extent. However, no false detection filtering mechanism is provided, and deep neural networks are time-consuming and computationally intensive to use on mobile platforms. Inspired by these traffic sign detection methods, in this paper, a lightweight and high-precision detection scheme is proposed, which is based on the baseline SSD network structure combined with a color detection algorithm. Experiments show that our scheme can effectively improve the detection speed and accuracy. The main contributions of this paper are summarized as follows:
- Using the TT100K dataset [14] to complete the lightweight SSD model training, this model detects the traffic signs that are presented in the image and pinpoints their locations in the image and assigns them to the correct traffic categories.
- Cutting and adjusting the size of the alternative area of the traffic sign in the input image based on these coordinates as the input image for the next color detection.
- Converting the image from the RGB (red, green, blue) color space to the HSV (hue, saturation, value) space, and using the color detection algorithm based on the phase difference method to conduct color detection on the obtained image and connecting to the connected components to generate a binary image of the corresponding color.
- Calculating the connected component of the binary image obtained in the previous step, and filtering the qualified detection results according to the maximum threshold of the connected component area.
The rest of this paper is organized as follows. Section 2 introduces the related work of this subject and analyzes some existing traffic sign detection schemes. Section 3 mainly introduces the improved lightweight SSD traffic sign detection algorithm and the design and implementation of the algorithm in detail. In Section 4, we evaluate the performance through experiments. Finally, conclusions are drawn in Section 5.
2. Related Work
This section reviews the several existing types of traffic sign detection algorithms. They can be roughly divided into the traditional traffic sign detection algorithms, CNN-based (convolutional neural networks) traffic sign detection algorithms, and attention mechanism-based traffic sign detection algorithms.
2.1. Traditional Traffic Sign Detection Algorithm
The traditional traffic sign detection algorithms mainly extract image features based on the colors and shapes of traffic signs, combined with corresponding image processing techniques, and then recognizes traffic signs. Ayoub et al. [3] proposed a three-stage real-time traffic sign detection and recognition system based on random forest. The first stage of the system divides the image into areas of interest based on color information; the second stage uses the invariant geometric moment to detect circles, triangles, and rectangles; and the third stage uses a random forest classifier to combine HOG (histograms of oriented gradients) features with LSS (local self-similarity) features to identify the detected shapes. Gülcan et al. [4] put forward a traffic sign detection algorithm based on color and shape. This method comprehensively considers the color information and geometric characteristics of traffic signs in the feature extraction stage, uses RGB color space and connected components for shape recognition, removes the graphics without traffic signs in the image, and keeps the remaining traffic sign areas. Le et al. [15] proposed a new method of color detection and segmentation based on SVM (support vector machine), which is used to retrieve alternative areas of traffic signs in real-time, uses pixel blocks instead of taking each pixel as the input vector of SVM for color classification, and combines the Hough transform and contour detection to detect circles and triangles to verify the alternative areas. Chen et al. [16] combined the AdaBoost algorithm with SVR (support vector regression) and proposed a saliency estimation method based on the color, shape, and spatial information of traffic signs. Although the detection speed of the above algorithms is relatively fast, it is not universal, as the feature expression is one-sided and single. In the case of a complex background or many interference objects, or if the sign itself is twisted and damaged, the false detection rate and omission rate could get extremely high.
2.2. CNN-Based Traffic Sign Detection Algorithm
The traffic sign detection technology based on deep learning has been widely used due to its excellent performance. A traffic sign detection method based on a convolutional neural network is often an improvement on the existing general target detection network. Zhang et al. [17] proposed an end-to-end convolutional network based on YOLOv2, using multiple 1 × 1 convolutional layers in the middle layer of the network while decreasing the top convolutional layer to reduce computational complexity. Meanwhile, to effectively detect small traffic signs, the input images are divided into dense grids to obtain a finer feature map. Lee et al. [9] formulated the boundary estimation of traffic signs as a two-dimensional pose and shape category prediction problem, which was effectively solved by a single CNN. Specifically, the target sign was estimated by projecting the boundary of the corresponding template sign image into the input image plane. The boundary estimation problem is formulated as a CNN-based pose and shape prediction task. Ibrahem et al. [18] proposed a multi-purpose single convolutional neural network structure based on weak supervision, using MobileNetv2 as the basic network. In addition to being used as a classification network, this network was also adopted as a region proposal network. Nguyen et al. [19] used a lightweight and efficient network structure as the basic network to improve the speed of inference. Besides, to improve the performance of small traffic sign detection, a deconvolution module was used to aggregate low-level feature maps with high-level feature maps, to generate an enhanced feature map, and then the two improved region proposal networks were used to generate alternative frames from the highest-level feature map and the enhanced feature map. Zhang et al. [20] proposed a detection algorithm called MSA_YOlOv3, introducing a multi-scale spatial pyramid pool block in the Darknet53 network, which enabled the network to learn object features more comprehensively, provided a bottom-up enhancement path to strengthen the feature pyramid in YOLOv3, and effectively used the fine-grained features of the bottom layer to achieve precise target positioning. The above algorithm demonstrates improvement based on the existing target detection network and makes the high-precision recognition of traffic signs possible, but MSA_YOlOv3 et al. pursued target detection accuracy while neglecting the delay problem caused by the network calculation.
2.3. Traffic Sign Detection Algorithm Based on the Attention Mechanism
The method based on the attention mechanism can emphasize important information while ignoring unimportant information. Mnih et al. [21] proposed a new recurrent neural network model that can extract information from an image or video by adaptively selecting a series of areas or positions, and only conducting high-resolution processing on the selected areas. Yuan et al. [11] proposed a multi-resolution feature fusion network structure that uses a densely connected deconvolution layer with jump connections, which is conducive to the extraction of small target features, and traffic sign detection is classified as a space sequence and dealt with as a regression task, and a vertical spatial sequence attention module is proposed to obtain more contextual information, thereby realizing better detection. Tian et al. [22] proposed a new cyclic attention-based traffic sign detection method for multi-scale analysis and utilization of local context in images. Kastner et al. [23] used the attention mechanism to export potential alternative traffic sign areas, and then used a set of weak classifiers similarly to Viola and Jones to calculate the probability value of each area. Zhang et al. [2] proposed a cascaded R-CNN algorithm to obtain multi-scale features in the image pyramid. Except for the first layer, each layer of the cascaded network incorporates the export boundary box of the previous layer. To carry out joint training, the weighted multi-scale features are obtained through dot product and softmax, and the characteristics of traffic signs are highlighted by refined features to improve the accuracy of traffic sign detection. Zhang et al. [24] proposed a new end-to-end architecture to improve small target detection by combining Faster R-CNN with an attention mechanism, and by explicitly modeling the interdependence between channel features. The attention mechanism is used to enhance the feature response. Finally, the attention mechanism is used to select the discriminative features to generate boundary box regression and traffic sign classification. The above algorithm uses the attention mechanism to strengthen the local feature information, avoids the number of calculations caused by convolving the global information of the big image, and improves the detection performance of traffic signs. However, it does not conduct effective feature filtering on the results.
3. Proposed Method
The traffic sign detection algorithm proposed in this paper first uses a lightweight SSD network to detect traffic signs; it then obtains the coordinates of the alternative area based on the detection results, and intercepts the alternative area; Secondly, it uses the color detection algorithm based on the phase difference method to obtain the binary image of the corresponding alternative area. Finally, the connected component is calculated based on the obtained binary image and the calculation results are filtered. The specific flow of the algorithm is shown in Figure 1.
Firstly, the TT100K dataset is used to complete the lightweight SSD neural network model training, the traffic signs in the image are detected, and the locations of the traffic signs in the image and the categories of traffic sign are marked. The detection result obtained from this step is temporarily marked as an alternative area for traffic signs.
Secondly, the specific coordinates of the alternative area of the traffic sign are obtained based on the detection result of the input image in the previous step; then these coordinates are used to crop the alternative area of the traffic sign in the input image; and the image size is adjusted to 240 × 240 as the input for the next step of color detection in an image.
Thirdly, the color detection algorithm is used based on the phase difference method to detect the color of the image cropped in the previous step. Due to the particularity of the colors of Chinese traffic signs, this paper only detects yellow, red, and blue in the cropped image. In addition, because the color of a traffic sign is affected by factors such as light, newness, wear and tear, etc., this paper uses Python’s color function library Colorific to calculate the yellow, red, and blue RGB color space values of traffic signs and conduct statistical analysis. Then the color space ranges of yellow, red, and blue in traffic signs are appropriately expanded. After conducting the above operations on the cropped image in the previous step, the binary image of the corresponding color is obtained.
Finally, the connected component is calculated on the binary image obtained in the previous step. The calculation result may include the areas of multiple connected components; therefore, this paper only selects the area of the largest connected component as the calculation result, and judges whether the area of the largest connected component has reached the fixed threshold. If it is greater than or equal to the threshold set in this paper, it can be judged that the detection result is correct. Otherwise, the detection result is false, namely, a traffic sign misdetection.
3.1. Lightweight SSD Network Structure
As the distance between the vehicle and the traffic sign changes constantly during driving, the size of the traffic sign captured by the camera is also constantly changing. The architecture of the baseline SSD model [25] is shown in Figure 2. The main body of the network is composed of a basic network and an additional feature network. Its biggest feature is the use of a multi-scale feature map for detection to adapt to the detection of objects of different sizes, which can meet the requirements of detecting targets of different scales during driving. Baseline SSD uses VGG-16 as the basic network, and the input is a 300 × 300 pixel image. The 5 maximum pooling layers separate the basic network VGG-16 into 6 modules, and each of the first 5 modules contains 2, 2, 3, 3, and 3 convolutional layers. The sixth module has two layers of convolution, which respectively convert the fully connected layers FC6 and FC7 of VGG-16 into 3 × 3 convolution layers Conv6 and 1 × 1 convolution layers Conv7, and also change the pooling layer pool5 from the original 2 × 2 to 3 × 3, with the step size changing from 2 to 1. Furthermore, five additional stacked convolution modules are added, each of which has 2 layers of convolution. The 6 layers of Conv4_3, Conv7, Conv8_2, Conv9_2, Conv10_2, and Conv11_2 are taken and 6 layers of feature layers with different scales are used for target classification detection and position regression.
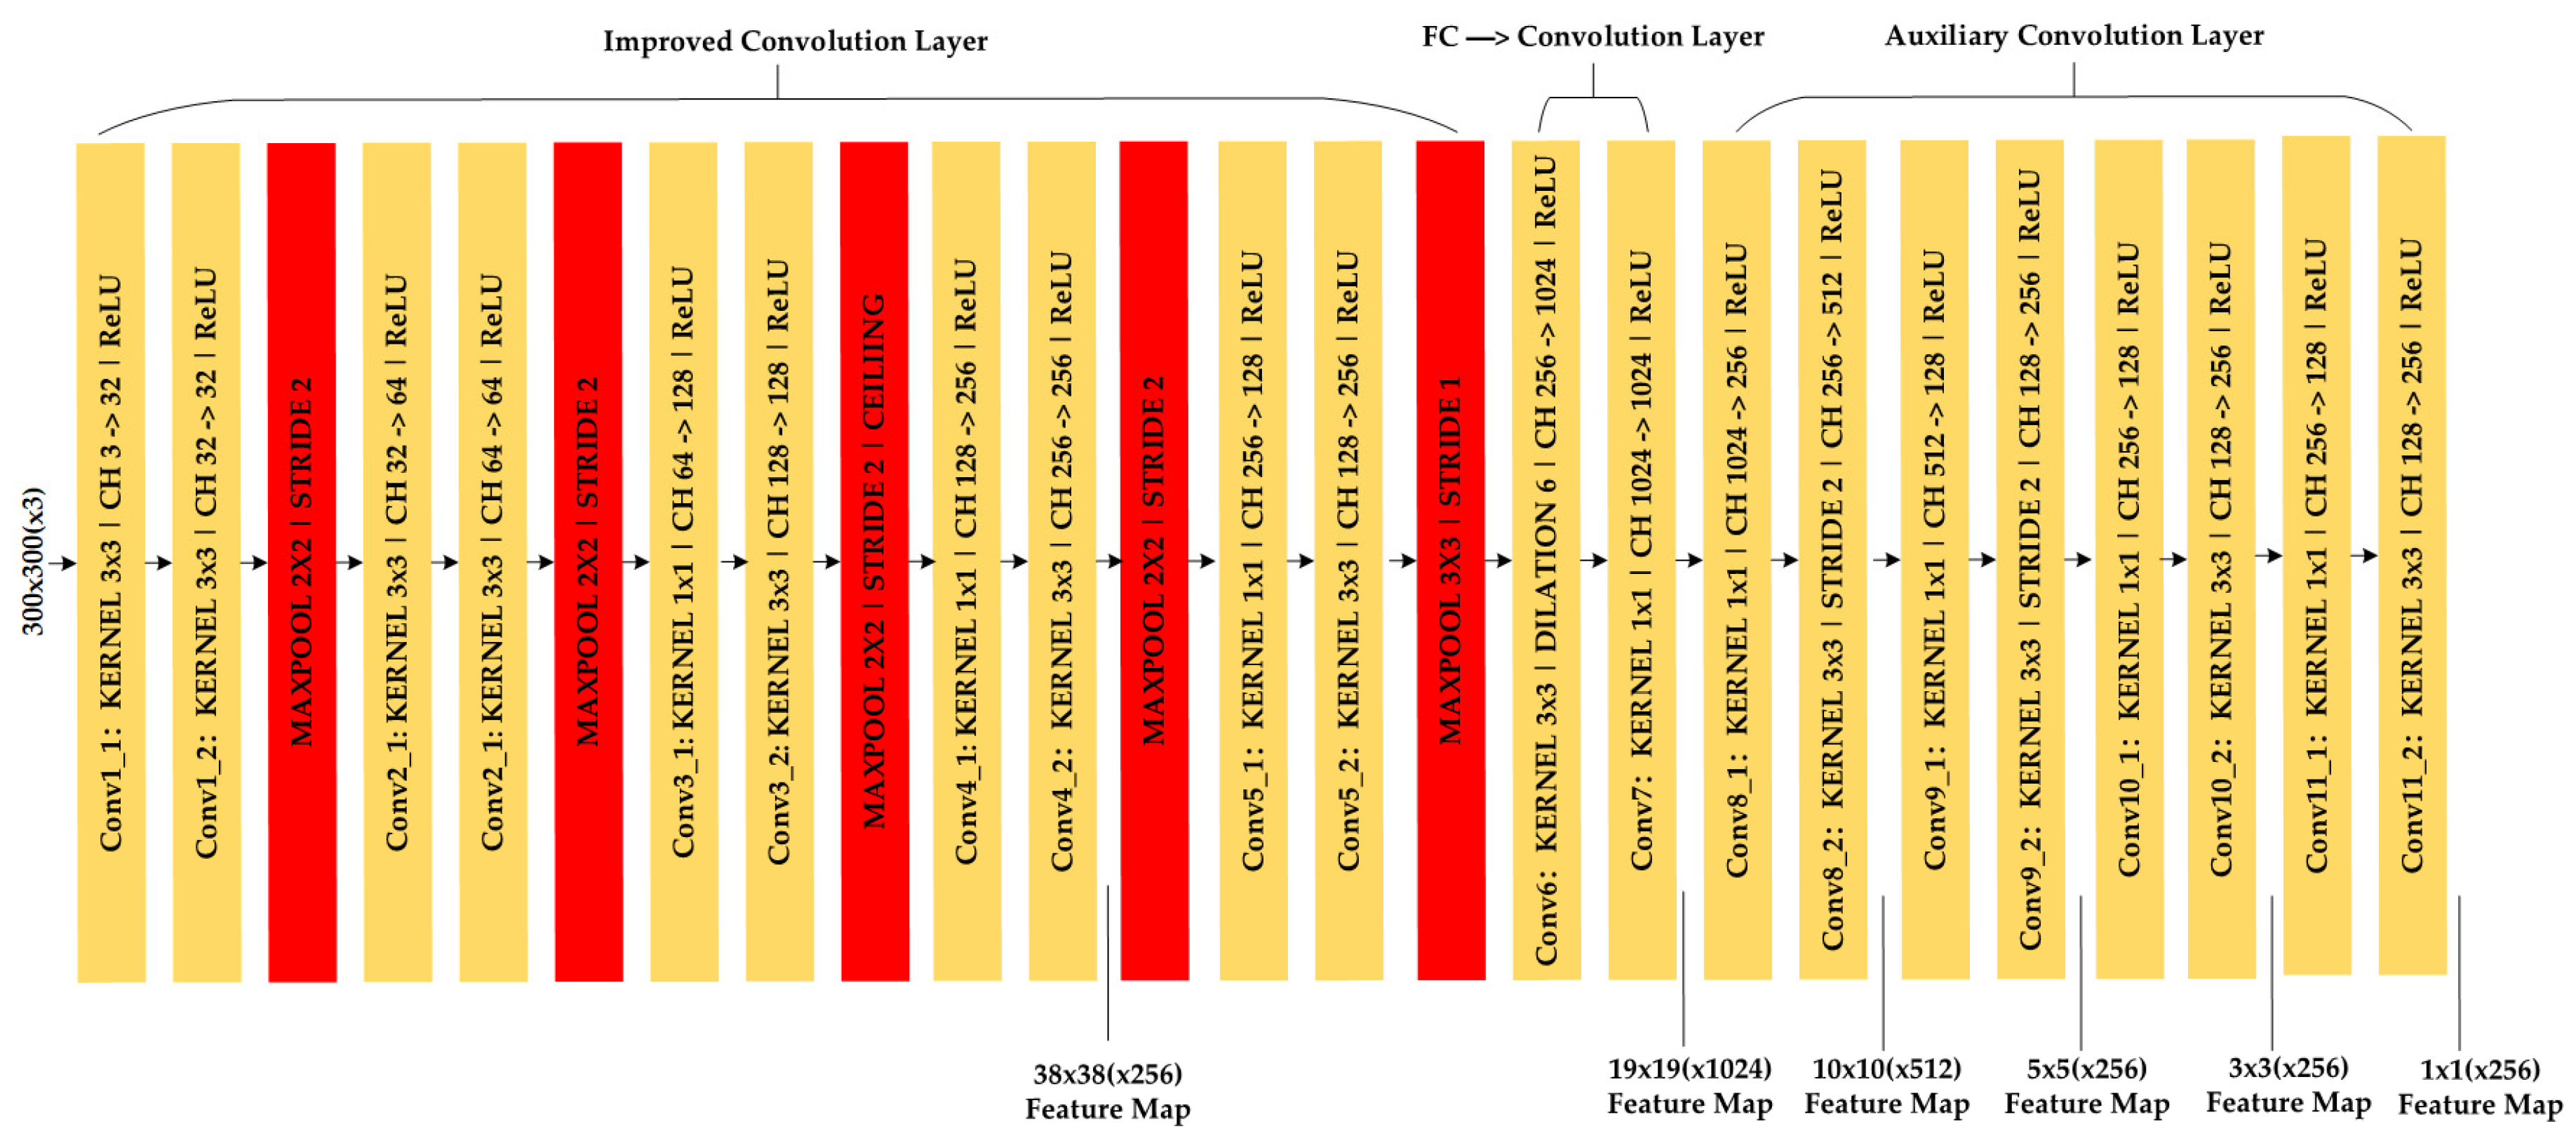
The lightweight SSD network structure proposed in this paper is based on the improvement of the baseline SSD network structure and is mainly aimed at improving the basic network structure VGG-16. Although the structure of VGG-16 is simple, the weight parameters contained in the network are relatively large, and it is difficult to adjust the parameters in the process of network training. The numbers of convolutional layers included in the first 5 parts of the network are 2, 2, 3, 3, and 3—that is, in the convolutional layers 1–13, the numbers of convolutional channels included are 64, 128, 256, 512, and 512 respectively. The size of each of the first 13 convolutional layer convolution kernels is 3 × 3, the product spans are all 1, the pooling window of the largest pooling layer is 2 × 2, and the step size is 2. The number of parameters of the baseline SSD is 22,935,232, and the number of parameters of the modified SSD is 7,036,768, and the network parameters of the baseline SSD are reduced by 3.3 times. Therefore, this paper replaces some of the 3 × 3 convolution kernels with some of the 1 × 1 convolution kernels in the baseline network to downgrade the dimensionality of the channel and delete part of the convolution layer. The improved network structure is shown in Figure 3. It shows that by reducing the number of channels and convolutional layers in the basic network part of the baseline SSD, the detection speed of the baseline SSD network model for traffic signs is improved and the real-time requirements are realized.
3.2. Color Detection Algorithm Based on the Phase Difference Method
Due to the uneven distribution of the number of traffic sign image categories in the dataset, the traffic sign detection algorithm proposed in this paper only detects prohibition signs, warning signs, and mandatory signs. The main traffic signs included are shown in Figure 4. Yellow corresponds to warning signs, red corresponds to prohibition signs, and blue corresponds to mandatory signs. Due to the particularity of the main colors of the three types of traffic signs, prohibitions, warnings, and instructions, the color detection algorithm in this paper mainly focuses on yellow, red, and blue.
The color models that are widely used in computer systems mainly include RGB and HSV. Since the HSV color space can better reflect the specific color information of the image compared to the RGB color space, such as the brightness, tone, and vividness of the color, it can facilitate the contrast between different colors. Therefore, the crop method in the Pillow image processing library of Python to crop the input image based on the detected coordinates of the alternative traffic sign area is used in this paper; the cropped image is resized to 240 × 240; then the color space of the obtained alternative traffic sign area is converted from RGB model to the HSV model [26]; finally, color detection is conducted.
According to the principle of three primary colors, , , and are set to the red, green, and blue coordinates of a certain color respectively, and their values are real numbers between 0 and 255; is set as the maximum value in , , and , as the minimum value, and the space conversion from RGB to HSV is shown in Equation (1).
In Equation (1), , , , and represent the three color values of the RGB color model respectively, and their values are real numbers between 0 and 1. , , and represent the values of the three basic elements of hue, saturation, and brightness of the HSV color model respectively.
Since the color of traffic signs is affected by factors such as light, newness, and wear and tear, the color value to be detected fluctuates in a certain range. Therefore, when the color detection of the alternative traffic sign area obtained by cropping is conducted, the set color space ranges of yellow, red, and blue are highly effective and reliable. We use the open-source color detection library Colorific to calculate the RGB color space values of the three types of traffic signs in the TT100K dataset and conducted statistical analysis. Among them, some warning signs containing the main color RGB value detection results are shown in Figure 5a; some prohibition signs containing the main color RGB value detection results are shown in Figure 5b; some mandatory signs containing the main color RGB value detection results are shown in Figure 5c.
After obtaining the RGB information of warning, prohibition, and mandatory traffic signs, Equation (1) is used to convert the color space model of the image to an HSV model to summarize and analyze the main color space ranges of warning, prohibition, and mandatory traffic signs in the HSV color space. The three types of traffic signs in this paper have three main colors; according to the experimental data’s statistics, their ranges of HSV color space are shown in Table 1.
After obtaining the main colors of the three types of traffic signs, namely, the HSV color space ranges of yellow, red and blue, the phase difference method based on the OpenCV to conduct color detection on the alternative area of cropped traffic signs is used in this paper. The color detection algorithm flow based on the phase difference method is shown in Figure 6. The flow can be summarized as follows:
Firstly, Equation (1) is used to convert the color space of the input image from the RGB model to the HSV model, which can facilitate the equalization of the histogram of the image.
Secondly, the phase difference method is used to detect the color of the image. The basic idea of the phase difference method is to set the HSV value of a pixel in the standard color library as . After the color detection is conducted on the cropped traffic sign image, the HSV value of a certain pixel in the image will be obtained and denoted as , and the difference between the two is denoted as D, and the value of D is shown in Equation (2):
If the absolute value of the difference between and is less than or equal to D, the absolute value of the difference between and is less than or equal to D, the absolute value of the difference between and is less than or equal to D, and the condition in Equation (3) is satisfied, then the HSV value of the pixel can be considered to be the same as that in the standard color library—that is, the colors of the two match each other.
The advantage of color detection based on the phase difference method is that the number of calculations is small, and the color range is a cube with as the center.
Finally, when the color to be detected is correctly detected, the pixel will be marked as white, and the other colors will be marked as black, and finally, a binary image with only black and white colors is exported. In order to avoid the influence of noise in some images, it is necessary to connect the nearby white pixel areas based on distance threshold, and finally, to export a binary image of a specified color.
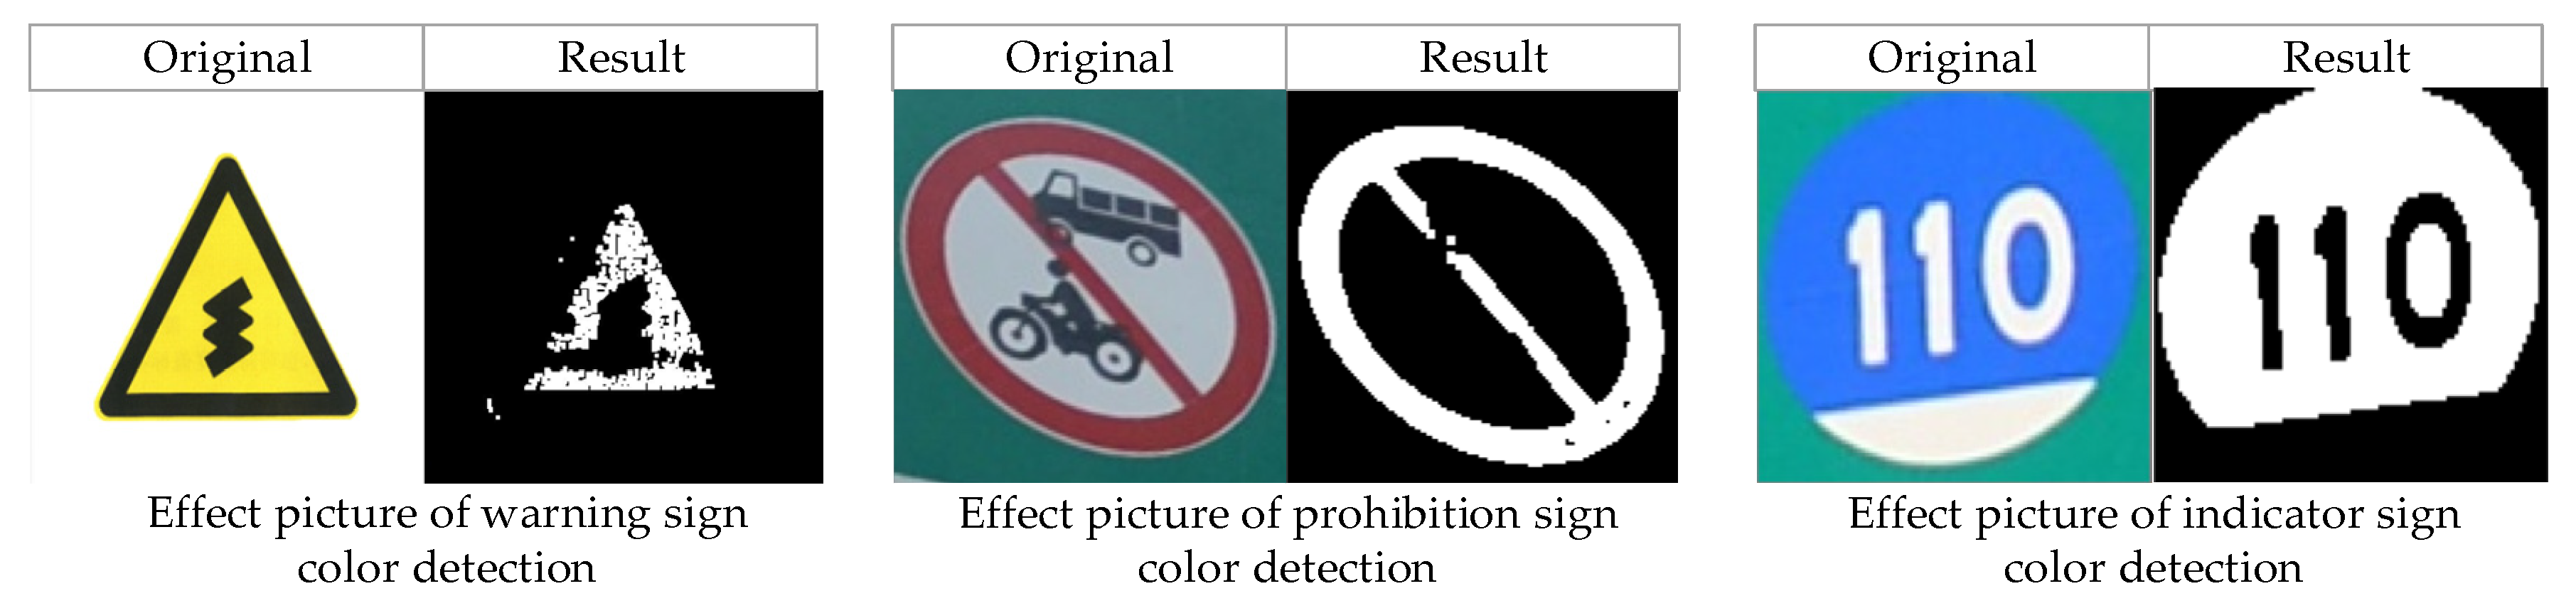
The color detection algorithm based on the phase difference method was used to detect the colors of warning signs, prohibition signs, and mandatory signs respectively. The results are shown in Figure 7.
3.3. Connected Component Calculation Based on the Two-Pass Algorithm
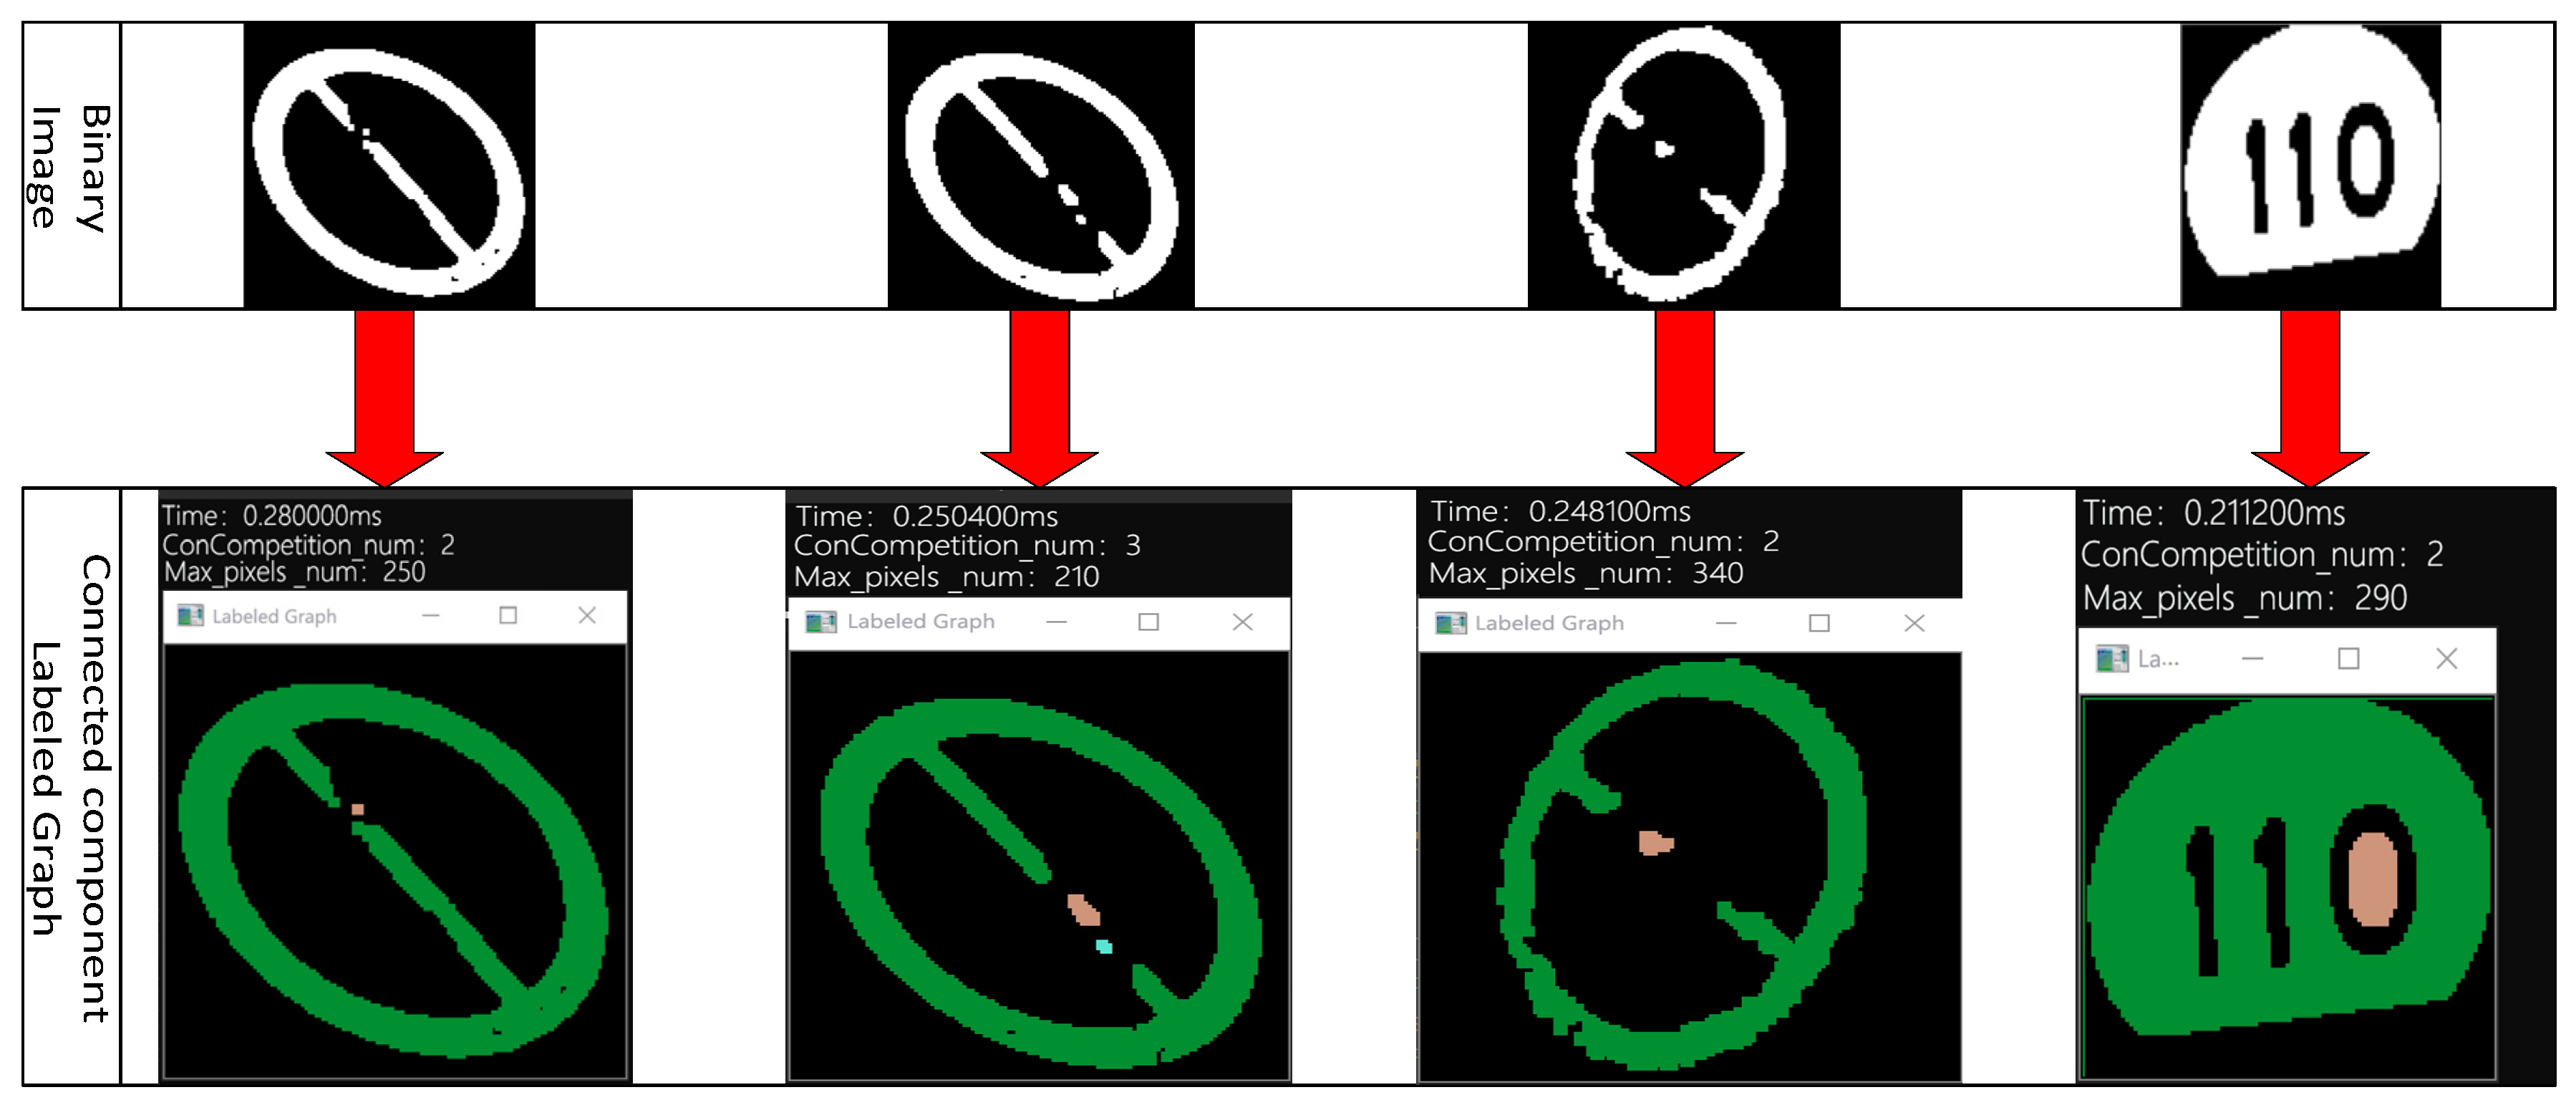
After the color detection of the alternative traffic sign area is obtained by cropping, the binary image of the alternative area will be obtained. However, due to the influence of image noise, there are connected components with different detected color areas in the binary image, so it is necessary to set a certain threshold for the area of the connected component to determine whether the connected component of the detected color is the connected component of the traffic sign color or the connected component of noise in the image. In this paper, the number of pixels in the connected component of the binary image is counted experimentally, and the experimental effect of marking the connected component is shown in Figure 8. In addition, according to the characteristics of the color distribution of traffic signs, the number of pixels in the red connected component is relatively small; therefore, this paper provides the minimum threshold of the area of the connected component based on the number of pixels in the red connected component, which means that the detected results lower than this threshold will be judged as a false detection.
The smallest unit of an image is a pixel. There are two commonly used methods to describe the adjacency relationship of each pixel: the four-neighboring method and the eight-neighboring method. The four-neighboring method is to select the pixels on the left, right, top, and bottom of the current pixel as adjacent pixels, and the eight-neighboring method is to select the pixels on the left, right, top, and bottom, and diagonal lines of the current pixel as adjacent pixels.
Since the calculation of the connected component based on the eight-neighboring method may contain more connected components of image noise, this paper uses the two-pass algorithm based on the four-neighboring method to calculate the connected components in the binary image [27]. The basic idea is that a label is assigned to each pixel position in the first scan. During the scanning process, the pixel set in the same connected component may be given one or more different labels. These different labels of the same connected component are connected, and their connectivity is recorded during this process; the second scan is to unify the different label values in each connected component according to the connectivity of all the labels recorded in the first scan. The pseudo-code of the two-pass algorithm is shown in Algorithm 1, where represents the current pixel.
| Algorithm 1: Two-Pass algorithm based on the four-neighboring method. |
| Input: Binary image Output: Connected component grouping
|
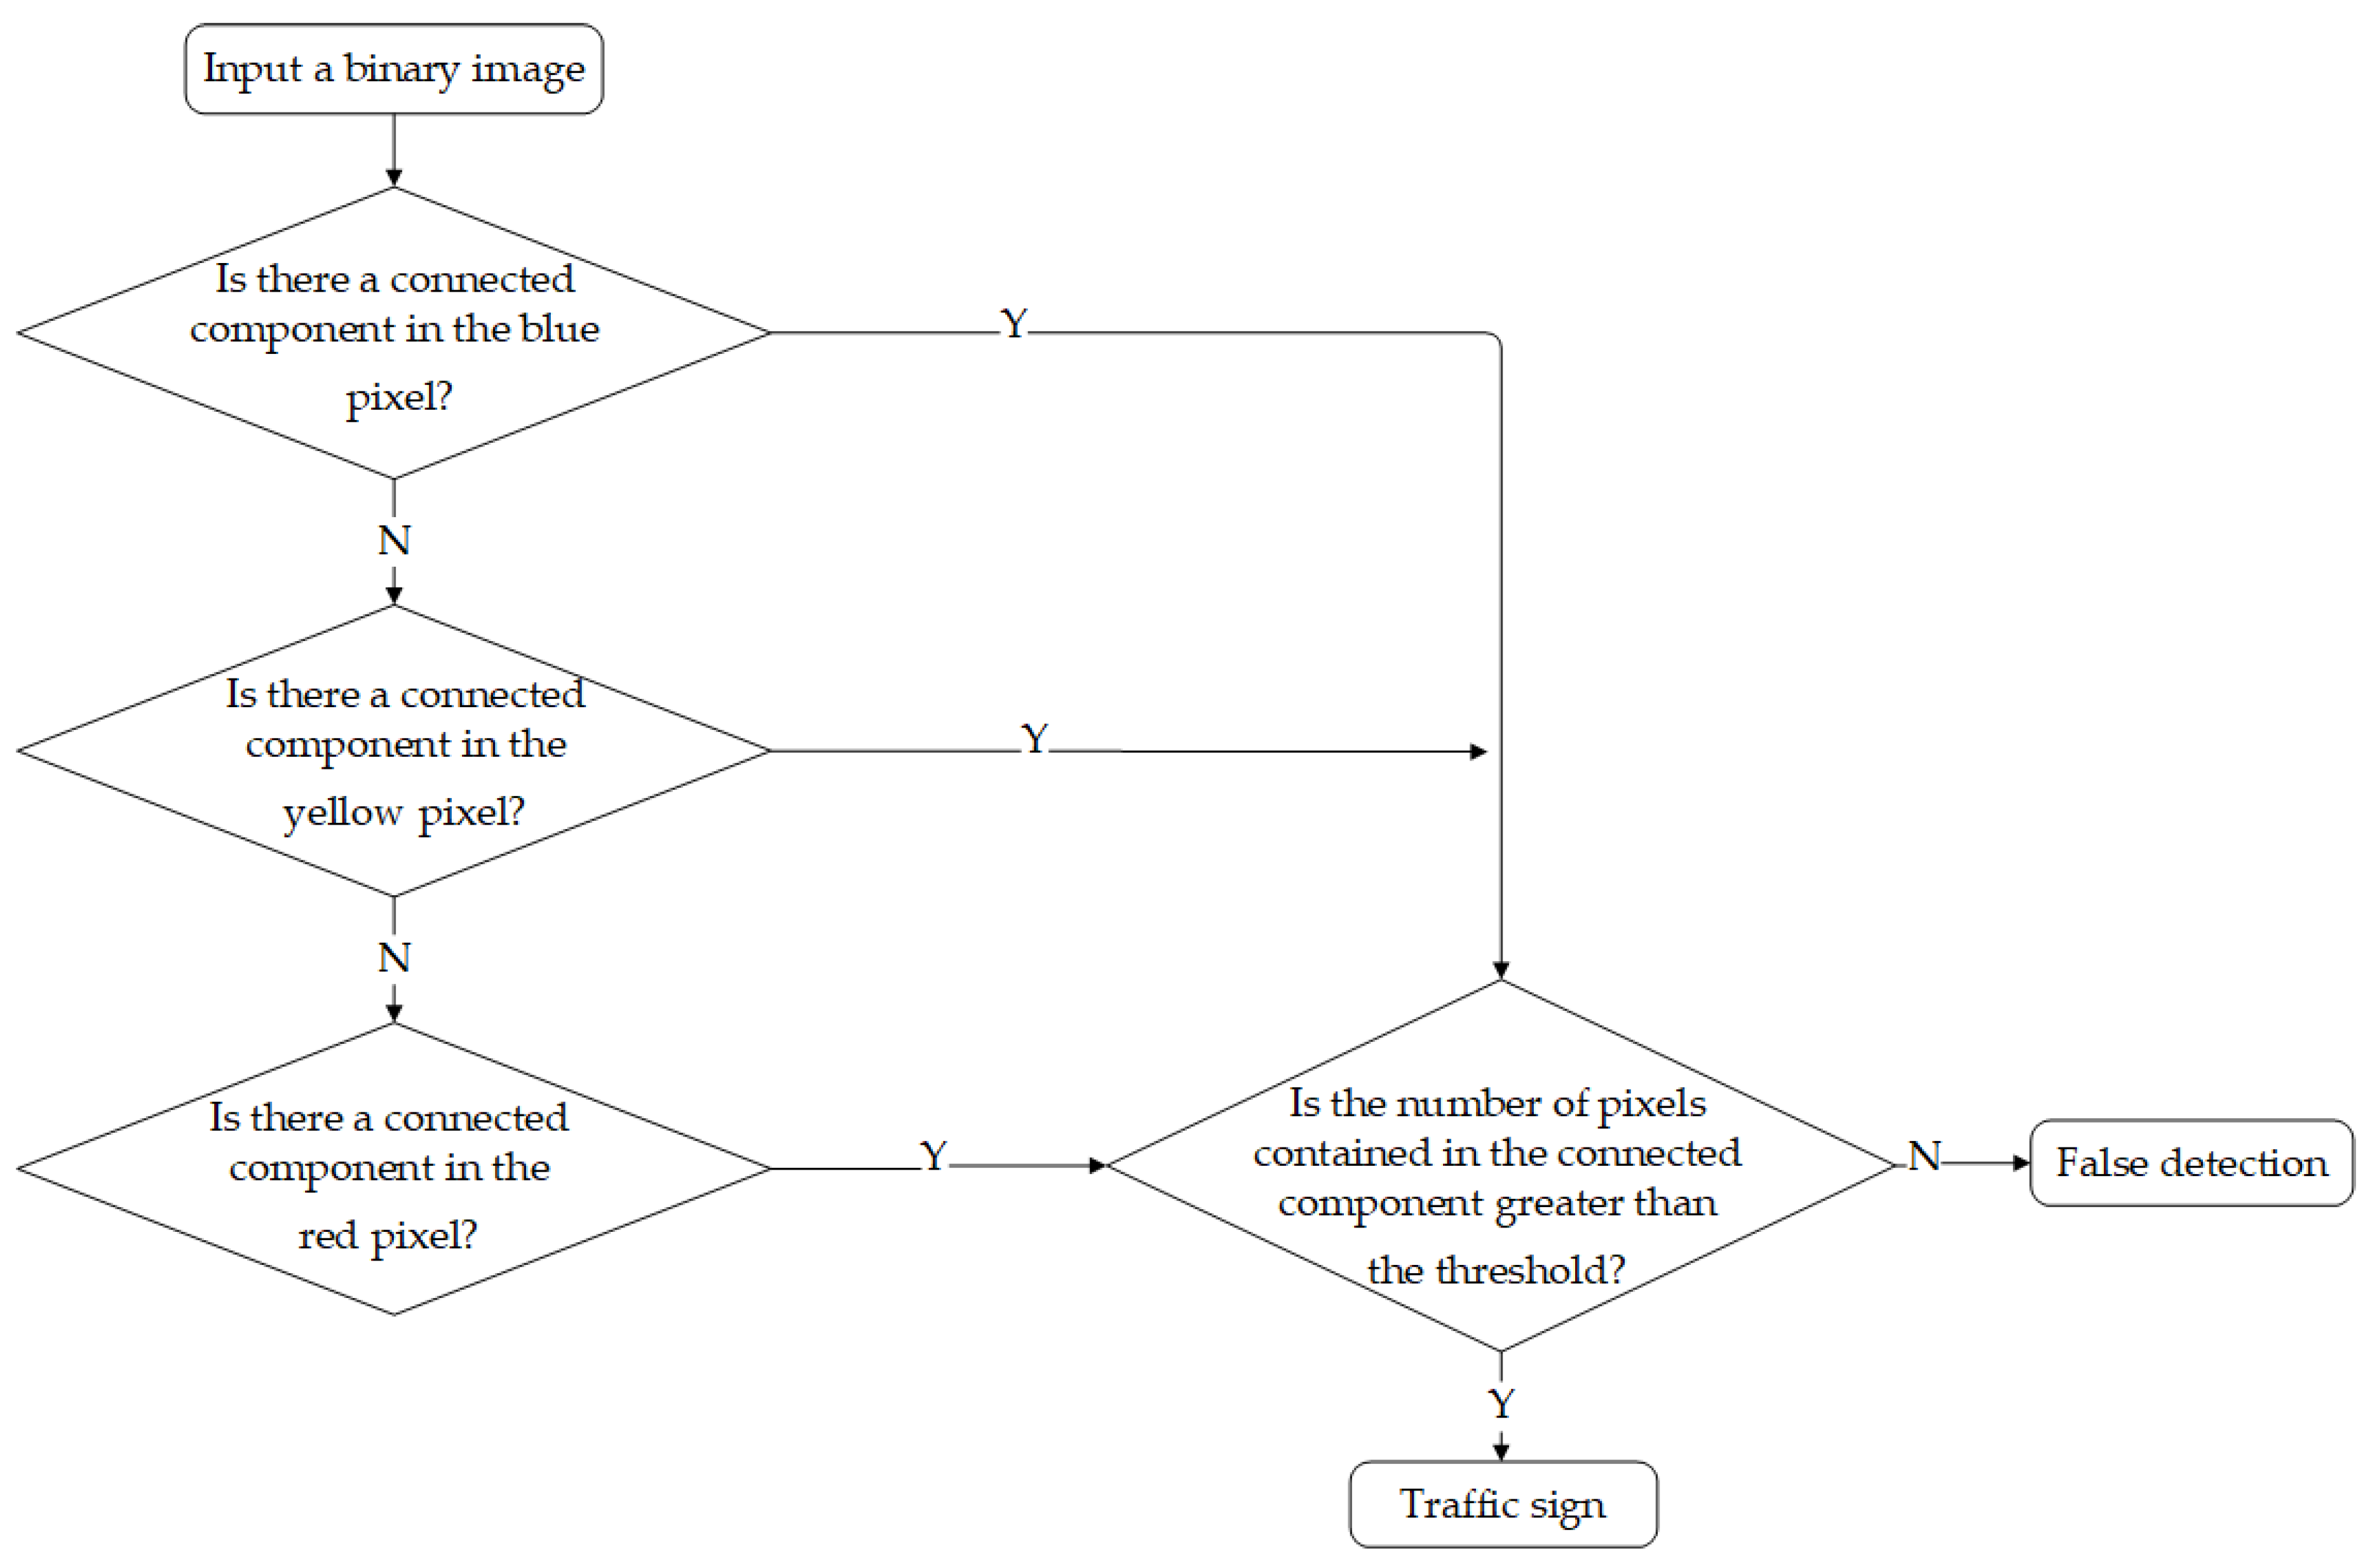
Based on the statistical data of calculating connected components, this paper sets the threshold of the number of pixels of the specified color contained in the connected component in the binary image to 200. Firstly, the specified color detection is conducted on the cropped alternative area of the traffic sign, and the obtained binary image is used as the input of the algorithm for calculating the connected component. According to the characteristics of the color distribution of traffic signs, the connected component of the specified color contains the largest number of pixels in blue, followed by yellow and red. If the connected component with a smaller number of pixels in the three colors is judged first, the number of pixels included tends to be less than the set threshold, which will cause the color that may be upwards of the threshold to fail to be judged. Therefore, our method sequentially judges whether there are blue, yellow, and red pixel-connected components in the binary image, and sequentially determines whether the number of pixels contained in the connected component is above the set threshold. If it is, it can be determined that the detection result of the traffic sign is correct. Otherwise, the detection result of the traffic sign based on the lightweight SSD is false. The specific process is shown in Figure 9.
4. Experiment
4.1. Datasets and Setting
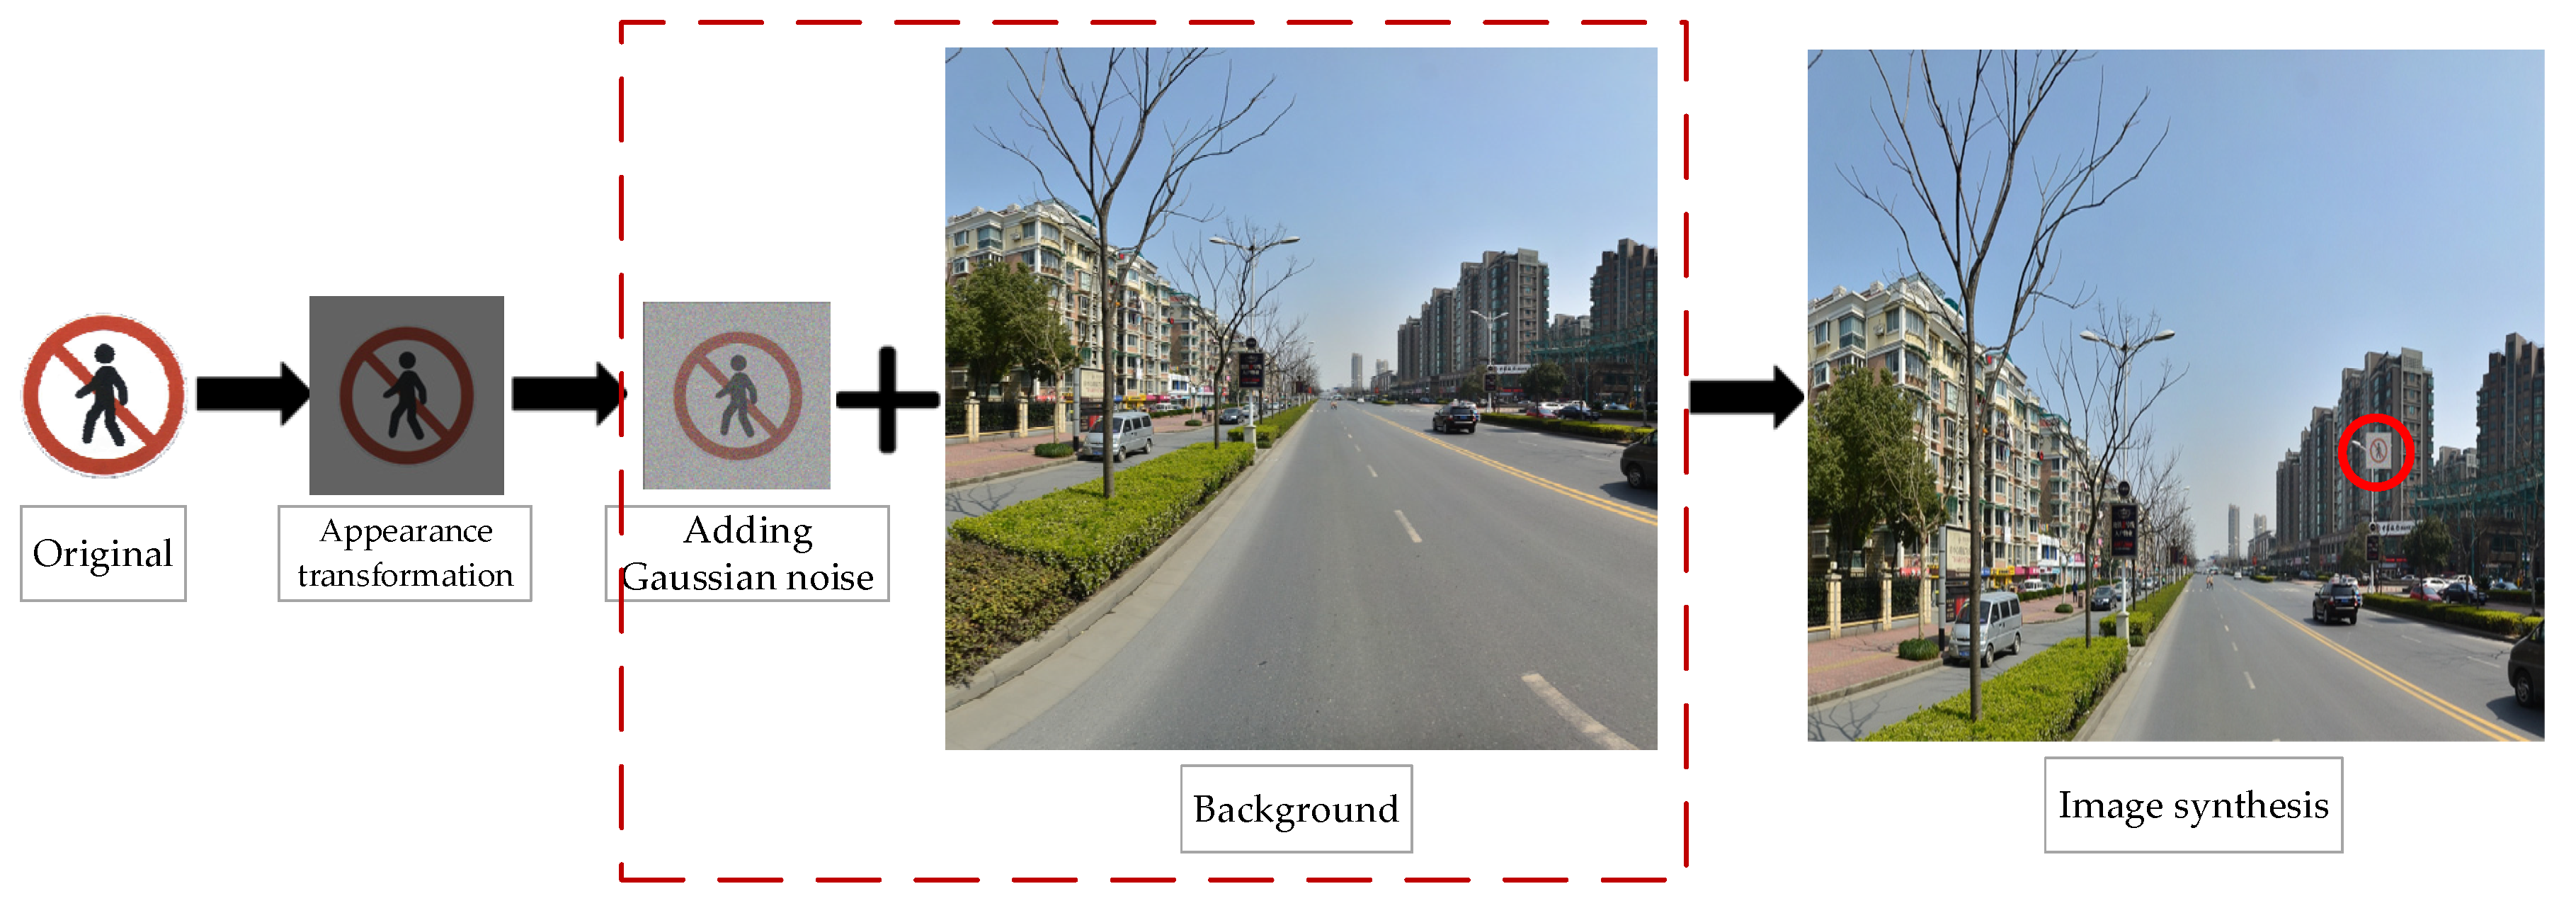
We used the TT100K traffic sign dataset, which contains 100,000 traffic sign images in real scenes, covering 151 different types of traffic signs. Due to the uneven distribution of the number of traffic sign instances in different categories, this led to insufficient training of the network model. Therefore, we selected 45 types of traffic signs with more than 100 instances in TT100K, and then usedv a data enhancement strategy based on image appearance transformation to enhance these 45 types of traffic signs based on the original dataset. Considering that the detection and recognition of traffic signs will be seriously affected by illumination, this paper provides a data enhancement strategy based on image appearance transformation. By changing the appearance of the image, the brightness of the image can be changed, which can better simulate the impact on traffic signs in the day and night.
Appearance transformation mainly refers to the change of image brightness and the level of image contrast. Image brightness adjustment is to increase or decrease the overall intensity of image pixels. Contrast adjustment is to reduce the intensity of pixels in dark areas of the image and raise the pixel intensity in bright areas to achieve display accuracy in a certain area. The contrast and brightness of the image can be calculated using Equation (4):
In Equation (4), is the gain which controls the brightness, is the offset value which controls the contrast of the image, is the channel value of the original image in the row and column pixels, and is the channel value of the target image in the row and column pixels.
The data enhancement strategy based on image appearance transformation in this paper is to randomly select a traffic sign from the traffic sign standard template library, transform its appearance first, add Gaussian noise, and finally mix the transformed traffic sign with a random background image. The specific experimental effect diagram is shown in Figure 10.
In terms of the experimental environment used in this study, the hardware configuration was an i7-8700 processor, 32 GB memory, and a GTX 1060 graphics card, and the software environment was ubuntu 16.04, python3.5, Colorific 0.3.0, OpenCV 3.2, and TensorFlow.
The loss function adopted included position loss and confidence loss, as shown in Equation (5). In the process of training the network, the value of the loss function can be reduced to improve the accuracy of the network’s prediction of traffic sign categories, and the prediction reliability of traffic sign location.
In Equation (5), is the confidence loss, using the softmax cross-entropy loss function [28]; is the number of default boxes; is the predicted value; represents the position loss, using the smooth-L1 loss function; is the true target box; represents the alternative prediction target box; indicates the predicted confidence value of the target in the alternative frame; is the weight parameter of position loss and confidence loss, which is set as 1 in this paper.
In addition, we used the migration learning training method to train the network model. First, the basic network part of the lightweight SSD network on the TT100K dataset was trained, and then the trained network parameters as the pre-training parameters of the entire network were set. Then, the entire network on the TT100K dataset was trained, which can speed up the convergence of the entire network and improve the model training effect. The number of traffic sign pictures for training was 6105, and the number of traffic sign pictures for testing was 3071. In the basic network training process, the learning rate is trained using polynomial decay. The initial value of the learning rate of the model was set as 0.001. After each iteration of the total 5000, the learning rate was multiplied by 0.1, and the momentum coefficient was set as 0.9, batch size was 64, subdivisions 16, and epochs 30. The overall training optimizer used the SGD algorithm.
4.2. Experimental Results and Analysis
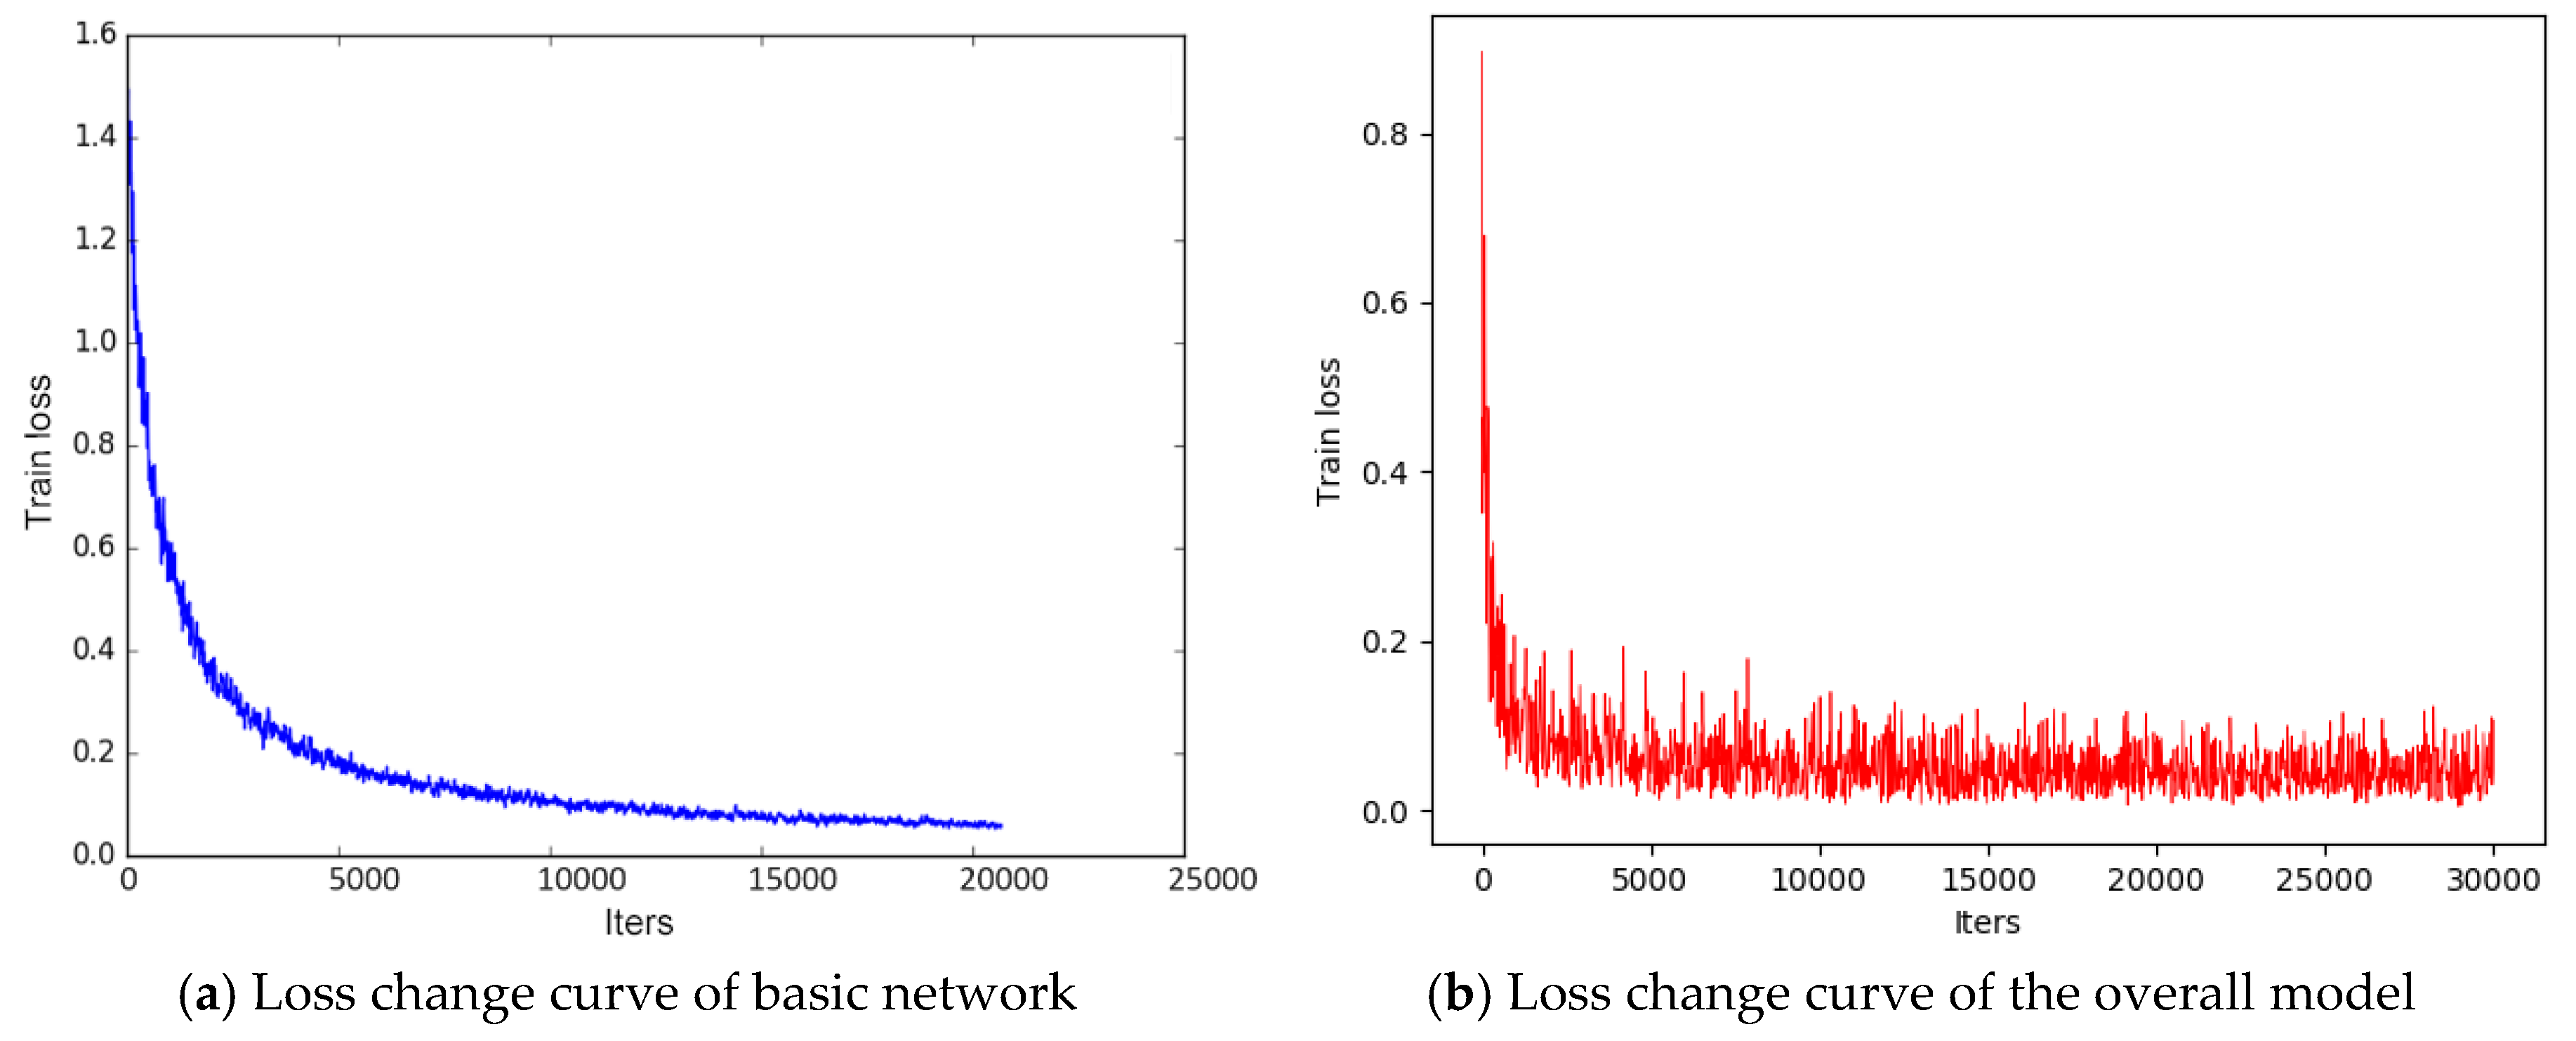
Our model training was conducted in two steps, and the loss change curve during network training is shown in Figure 11. Figure 11a shows the change of the basic network loss. The network was close to convergence when it iterated about 20,000 times. Transfer learning was adopted to train our model on the TT100K dataset; the loss change is shown in Figure 11b. The model was close to convergence at about 5000 iterations, and the model convergence speed is significantly faster.
This paper uses two types of model evaluation: precision and recall. The precision is the ratio of the number of samples that are tested correctly to the total number of samples that are predicted to be positive. The calculation is as follows:
The recall is the proportion of the number of samples that are tested correctly to the total number of samples that are positive in the real situation. The calculation is as follows:
In Equations (6) and (7), the test sets contain positive samples and negative samples: (true positives) is the number of positive samples that are correctly predicted as positive samples, (false positives) is the number of negative samples incorrectly predicted as positive samples, and (false negatives) is the number of positive samples incorrectly predicted as negative samples [29].
Next, we analyze the precision and recall of the three types of traffic signs, warning signs, prohibition signs, and mandatory signs in the experiment. Table 2 shows the AP and recall of different network models, where mAP is the abbreviation of mean average precision, and mR is the abbreviation of mean recall.
The experimental results show that our method improves the mR by 1% compared with the baseline SSD network and 6% compared with the lightweight SSD. In terms of detection accuracy, our method is more accurate in testing than the baseline SSD network in traffic signs. It can be seen from the experimental results that the method proposed in this paper improves the mAP and mR of the baseline SSD network. Since the mAP of the lightweight SSD network for traffic sign detection is lower than that of the baseline SSD network, and the lightweight SSD is used to improve the detection speed of the baseline SSD network, this paper also analyzes the performance of each model through experiments. The FPS (frames per second) comparison experiment results of each model are shown in Table 2. The experimental results show that the detection speed of the lightweight SSD network model for traffic sign detection is 1.3 times that of the baseline SSD network model, and the FPS reaches 32. The detection speed of our method is 1.2 times that of the baseline SSD, and the FPS also reaches 29. At the same time, in order to verify the effectiveness of our method, the proposed method is also compared with other models in this paper. Compared to PVANet [30], the mAP and mR of our method are improved by 4%, and the FPS aspects. Additionally, in comparison with faster-RCNN [14], our method offers significant improvements in detection accuracy and speed. As far as mAP, our method is not as good as CAB-s Net [32], but the FPS of our method is improved by 7%. In terms of mAP and mR, there is a gap between our method and two other methods called MSA_YOLOv3 [20] and CMA R-CNN [2], but our method has a significant advantage in FPS. In MSA_YOLOv3, the FPS is only 9. Besides, the FPS is only 3 in CMA R-CNN. Based on FPS, the gap between our method and TSD Net [31] is large, but our method improved 23% on mAP and 17% on mR. Therefore, our method has obviously advantages on mAP and mR. From this, it can be seen that the proposed method meets the requirements of actual traffic sign detection scenarios in terms of detection speed and accuracy.
5. Conclusions
Aiming at the problem of the misdetection of traffic signs in complex environments, in this paper, we propose a lightweight SSD network algorithm that reduces the amount of calculations for the baseline SSD network and the weight of the baseline SSD network. In addition, to improve the accuracy of the lightweight SSD network for traffic sign detection, this paper also combines the color detection algorithm and the connected component calculation algorithm. First, a lightweight SSD network is used to detect and recognize traffic signs, and then color detection algorithm and computation connected component algorithm are used to further filter the detection results. Experimental results show that the algorithm proposed in this paper has improved the detection speed and accuracy of the baseline SSD network. Besides, compared with mainstream methods, our method is more suitable for real-world scenarios of traffic sign detection. Finally, given the wide variety of traffic signs and the uneven number of images of each type of traffic sign in the dataset, a data enhancement strategy based on image appearance transformation is provided and was used to expand the traffic signs images in the dataset, offering sufficient data for the training of the network model.
Author Contributions
Conceptualization, S.Y., Y.J., S.L., and F.W.; methodology, S.Y. and Q.B.; software, S.Y., Q.B., and Y.F.; validation, S.Y., Q.B., and Y.F.; writing—original draft preparation, S.Y. and Q.B.; writing—review and editing, S.Y., Y.F., Q.B., Y.J., and S.L.; supervision, Y.J, F.W., and S.L.; project administration, Y.J. and S.L.; funding acquisition, Y.J. and S.L. All authors have read and agreed to the published version of the manuscript.
Funding
This work in this paper was supported by the National Key R&D Program of China (2017YFB1401300, 2017YFB1401302), Outstanding Youth of Jiangsu Natural Science Foundation (BK20170100), Key R&D Program of Jiangsu (BE2017166), Natural Science Foundation of the Jiangsu Higher Education Institutions of China (number 19KJB520046), Natural Science Foundation of Jiangsu Province (number BK20170900), Innovative and Entrepreneurial talents projects of Jiangsu Province, Jiangsu Planned Projects for Postdoctoral Research Funds (number 2019K024), Six talent peak projects in Jiangsu Province, the Ministry of Education Foundation of Humanities and Social Sciences (number 20YJC880104), NUPT DingShan Scholar Project and NUPTSF (NY219132), and CCF-Tencent Open Fund WeBank Special Funding (number CCF-WebankRAGR20190104).
Conflicts of Interest
The authors declare no conflict of interest.
References
- Zhang, J.; Huang, Q.; Wu, H.; Liu, Y. A shallow network with combined pooling for fast traffic sign recognition. Information 2017, 8, 45. [Google Scholar] [CrossRef] [Green Version]
- Zhang, J.; Xie, Z.; Sun, J.; Zou, X.; Wang, J. A cascaded R-CNN with multiscale attention and imbalanced samples for traffic sign detection. IEEE Access 2020, 8, 29742–29754. [Google Scholar] [CrossRef]
- Ellahyani, A.; El Ansari, M.; El Jaafari, I. Traffic sign detection and recognition based on random forests. Appl. Soft Comput. 2016, 46, 805–815. [Google Scholar] [CrossRef]
- Yıldız, G.; Dizdaroğlu, B. Traffic Sign Detection via Color and Shape-Based Approach. In Proceedings of the International Informatics and Software Engineering Conference, Ankara, Turkey, 6 November 2019; pp. 1–5. [Google Scholar]
- Luo, H.; Yang, Y.; Tong, B.; Wu, F.; Fan, B. Traffic sign recognition using a multi-task convolutional neural network. IEEE Trans. Intell. Transp. Syst. 2017, 19, 1100–1111. [Google Scholar] [CrossRef]
- Hussain, S.; Abualkibash, M.; Tout, S. A survey of traffic sign recognition systems based on convolutional neural networks. In Proceedings of the IEEE International Conference on Electro/Information Technology, Rochester, MI, USA, 3–5 May 2018; pp. 570–573. [Google Scholar]
- Arcos-Garcia, A.; Alvarez-Garcia, J.A.; Soria-Morillo, L.M. Evaluation of deep neural networks for traffic sign detection systems. Neurocomputing 2018, 316, 332–344. [Google Scholar] [CrossRef]
- Kamal, U.; Tonmoy, T.I.; Das, S.; Hasan, M.K. Automatic traffic sign detection and recognition using SegU-Net and a modified Tversky loss function with L1-constraint. IEEE Trans. Intell. Transp. Syst. 2019, 21, 1467–1479. [Google Scholar] [CrossRef]
- Lee, H.S.; Kim, K. Simultaneous traffic sign detection and boundary estimation using convolutional neural network. IEEE Trans. Intell. Transp. Syst. 2018, 19, 1652–1663. [Google Scholar] [CrossRef] [Green Version]
- Yang, T.; Long, X.; Sangaiah, A.K.; Zheng, Z.; Tong, C. Deep detection network for real-life traffic sign in vehicular networks. Comput. Netw. 2018, 136, 95–104. [Google Scholar] [CrossRef]
- Yuan, Y.; Xiong, Z.; Wang, Q. VSSA-NET: Vertical spatial sequence attention network for traffic sign detection. IEEE Trans. Image Process. 2019, 28, 3423–3434. [Google Scholar] [CrossRef]
- Zhang, J.; Wang, W.; Lu, C.; Wang, J.; Sangaiah, A.K. Lightweight deep network for traffic sign classification. Ann. Telecommun. 2019, 75, 369–379. [Google Scholar] [CrossRef]
- Song, S.; Que, Z.; Hou, J.; Du, S.; Song, Y. An efficient convolutional neural network for small traffic sign detection. J. Syst. Archit. 2019, 97, 269–277. [Google Scholar] [CrossRef]
- Zhu, Z.; Liang, D.; Zhang, S.; Huang, X.; Li, B.; Hu, S. Traffic-sign detection and classification in the wild. In Proceedings of the IEEE Conference on Computer Vision and Pattern Recognition, Las Vegas, NV, USA, 27–30 June 2016; pp. 2110–2118. [Google Scholar]
- Le, T.T.; Tran, S.T.; Mita, S.; Nguyen, T.D. Real time traffic sign detection using color and shape-based features. In Asian Conference on Intelligent Information and Database Systems; Springer: Berlin/Heidelberg, Germany, 2010; pp. 268–278. [Google Scholar]
- Chen, T.; Lu, S. Accurate and efficient traffic sign detection using discriminative adaboost and support vector regression. IEEE Trans. Veh. Technol. 2015, 65, 4006–4015. [Google Scholar] [CrossRef]
- Zhang, J.; Huang, M.; Jin, X.; Li, X. A real-time chinese traffic sign detection algorithm based on modified YOLOv2. Algorithms 2017, 10, 127. [Google Scholar] [CrossRef] [Green Version]
- Ibrahem, H.; Salem, A.; Kang, H.S. Weakly Supervised Traffic Sign Detection in Real Time Using Single CNN Architecture for Multiple Purposes. In Proceedings of the IEEE International Conference on Consumer Electronics, Las Vegas, NV, USA, 4–6 January 2020; pp. 1–4. [Google Scholar]
- Nguyen, H. Fast Traffic Sign Detection Approach Based on Lightweight Network and Multilayer Proposal Network. J. Sens. 2020. [Google Scholar] [CrossRef]
- Zhang, H.; Qin, L.; Li, J.; Guo, Y.; Zhou, Y.; Zhang, J.; Xu, Z. Real-Time Detection Method for Small Traffic Signs Based on Yolov3. IEEE Access 2020, 8, 64145–64156. [Google Scholar] [CrossRef]
- Mnih, V.; Heess, N.; Graves, A. Recurrent models of visual attention. In Proceedings of the Advances in Neural Information Processing Systems, Montreal, QC, Canada, 8–13 December 2014; pp. 2204–2212. [Google Scholar]
- Tian, Y.; Gelernter, J.; Wang, X.; Li, J.; Yu, Y. Traffic sign detection using a multi-scale recurrent attention network. IEEE Trans. Intell. Transp. Syst. 2019, 20, 4466–4475. [Google Scholar] [CrossRef]
- Kastner, R.; Michalke, T.; Burbach, T.; Fritsch, J.; Goerick, C. Attention-based traffic sign recognition with an array of weak classifiers. In Proceedings of the IEEE Intelligent Vehicles Symposium, La Jolla, CA, USA, 21–24 June 2010; pp. 333–339. [Google Scholar]
- Zhang, J.; Hui, L.; Lu, J.; Zhu, Y. Attention-based neural network for traffic sign detection. In Proceedings of the International Conference on Pattern Recognition, Sousse, Tunisia, 21–23 December 2018; pp. 1839–1844. [Google Scholar]
- Liu, W.; Anguelov, D.; Erhan, D.; Szegedy, C.; Reed, S.; Fu, C.Y.; Berg, A.C. Ssd: Single shot multibox detector. In European Conference on Computer Vision; Springer: Cham, Switzerland, 2016; pp. 21–37. [Google Scholar]
- Saravanan, G.; Yamuna, G.; Nandhini, S. Real time implementation of RGB to HSV/HSI/HSL and its reverse color space models. In Proceedings of the International Conference on Communication and Signal Processing, Apecmadras, India, 6–8 April 2016; pp. 462–466. [Google Scholar]
- Spagnolo, F.; Perri, S.; Corsonello, P. An Efficient Hardware-Oriented Single-Pass Approach for Connected Component Analysis. Sensors 2019, 19, 3055. [Google Scholar] [CrossRef] [Green Version]
- Zeng, Y.; Xu, X.; Fang, Y.; Zhao, K. Traffic sign recognition using deep convolutional networks and extreme learning machine. In International Conference on Intelligent Science and Big Data Engineering; Springer: Cham, Switzerland, 2015; pp. 272–280. [Google Scholar]
- Samir, S.; Emary, E.; El-Sayed, K.; Onsi, H. Optimization of a Pre-Trained AlexNet Model for Detecting and Localizing Image Forgeries. Information 2020, 11, 275. [Google Scholar] [CrossRef]
- Kim, K.H.; Hong, S.; Roh, B.; Cheon, Y.; Park, M. PVANet: Deep but lightweight neural networks for real-time object detection. arXiv 2016, arXiv:1608.08021. [Google Scholar]
- Song, Y.; Fan, R.; Huang, S.; Zhu, Z.; Tong, R. A three-stage real-time detector for traffic signs in large panoramas. Comput. Vis. Media 2019, 5, 403–416. [Google Scholar] [CrossRef] [Green Version]
- Cui, L.; Lv, P.; Jiang, X.; Gao, Z.; Zhou, B.; Zhang, L.; Shao, L.; Xu, M. Context-Aware Block Net for Small Object Detection. IEEE Trans. Cybern. 2020. [Google Scholar] [CrossRef] [PubMed]
Figure 1.
Flow chart of lightweight SSD-based traffic sign detection.

Figure 2.
Baseline SSD network structure.

Figure 3.
Lightweight SSD network structure.

Figure 4.
The signs in the yellow, red, and blue boxes are warning, prohibition, and mandatory signs respectively.
Figure 4.
The signs in the yellow, red, and blue boxes are warning, prohibition, and mandatory signs respectively.

Figure 5.
RGB detection results of three types of traffic signs.

Figure 6.
Flow chart of color detection based on the phase difference method.

Figure 7.
Color detection effect diagram.

Figure 8.
Statistical graph of connected components in binary images.

Figure 9.
Flow chart of connected component detection based on the two-pass algorithm.

Figure 10.
Data enhancement strategy.

Figure 11.
Change curve of iterative loss value of lightweight SSD network.


Table 1.
HSV spatial threshold ranges of the corresponding three colors.
| Color | H | S | V |
|---|---|---|---|
| Yellow | |||
| Red | |||
| Blue |
Table 2.
Results of comparative experiments between the models.
| Network Model | AP | Recall | FPS | ||||||
|---|---|---|---|---|---|---|---|---|---|
| Warning Signs | Prohibition Signs | Mandatory Signs | mAP | Warning Signs | Prohibition Signs | Mandatory Signs | mR | ||
| Lightweight SSD | 0.68 | 0.72 | 0.73 | 0.71 | 0.74 | 0.76 | 0.77 | 0.76 | 32 |
| PVANet [30] | 0.67 | 0.74 | 0.72 | 0.71 | 0.76 | 0.78 | 0.83 | 0.78 | 27 |
| MSA_YOLOv3 [20] | 0.84 | 0.86 | 0.88 | 0.86 | 0.80 | 0.81 | 0.92 | 0.84 | 9 |
| CMA R-CNN [2] | - | - | - | 0.98 | - | - | - | 0.90 | 3 |
| TSD Net [31] | 0.52 | 0.44 | 0.61 | 0.52 | - | - | - | 0.65 | 60 |
| Faster-RCNN [14] | 0.55 | 0.57 | 0.47 | 0.53 | 0.54 | 0.56 | 0.58 | 0.56 | 7 |
| CAB-s Net [32] | 0.87 | 0.88 | 0.91 | 0.89 | - | - | - | - | 27 |
| Baseline SSD | 0.70 | 0.72 | 0.74 | 0.72 | 0.81 | 0.80 | 0.82 | 0.81 | 24 |
| Ours | 0.73 | 0.78 | 0.74 | 0.75 | 0.80 | 0.84 | 0.82 | 0.82 | 29 |
Note: “-” means no data in reference papers.
© 2020 by the authors. Licensee MDPI, Basel, Switzerland. This article is an open access article distributed under the terms and conditions of the Creative Commons Attribution (CC BY) license (http://creativecommons.org/licenses/by/4.0/).
Share and Cite
MDPI and ACS Style
You, S.; Bi, Q.; Ji, Y.; Liu, S.; Feng, Y.; Wu, F. Traffic Sign Detection Method Based on Improved SSD. Information 2020, 11, 475. https://0-doi-org.brum.beds.ac.uk/10.3390/info11100475
AMA Style
You S, Bi Q, Ji Y, Liu S, Feng Y, Wu F. Traffic Sign Detection Method Based on Improved SSD. Information. 2020; 11(10):475. https://0-doi-org.brum.beds.ac.uk/10.3390/info11100475
Chicago/Turabian StyleYou, Shuai, Qiang Bi, Yimu Ji, Shangdong Liu, Yujian Feng, and Fei Wu. 2020. "Traffic Sign Detection Method Based on Improved SSD" Information 11, no. 10: 475. https://0-doi-org.brum.beds.ac.uk/10.3390/info11100475
Note that from the first issue of 2016, this journal uses article numbers instead of page numbers. See further details here.