Research on Power Demand Side Information Quality Indicators and Evaluation Based on Grounded Theory Approach

Management School, Nanchang University, Nanchang 330031, China
*
Author to whom correspondence should be addressed.
Information 2020, 11(10), 477; https://0-doi-org.brum.beds.ac.uk/10.3390/info11100477
Submission received: 24 September 2020
/
Revised: 5 October 2020
/
Accepted: 9 October 2020
/
Published: 12 October 2020
(This article belongs to the Section Information Theory and Methodology)
Abstract
:High-quality power demand side information is necessary for scientific decision-making of power grid construction projects. Literature research shows that the current demand side management (DSM) information quality theories and methods need to be improved, and the information quality indicators and evaluation work are essential. In this paper, based on the grounded theory, about 250 copies of relevant literatures and interview records are reviewed. Through open coding, spindle coding, and selective coding, 105 initial concepts are finally extracted to 35 categories and 10 main categories. On this basis, four information dimensions including load extraction, monitoring, management, and government planning are summarized. An index system containing 34 indicators for DSM information quality evaluation on the power demand side is constructed. Finally, using matter-element extension evaluation method, a case study in China is performed to verify the feasibility and scientificity of the indexes. The results show that DSM information quality evaluation indexes are effective, and the evaluation method is also applicable. The establishment of DSM information quality indicators and the evaluation methods in this paper can provide a reference for similar information quality evaluation work in power systems.
1. Introduction
1.1. Background
Demand Side Management (DSM) is to allow enterprises and users to manage their own electricity consumption by building a refined power management platform. Over the past 10 years, the development of DSM has achieved abundant energy conservation and emission reduction effects and formed a certain scale. For example, the State Grid Energy Research Institute of China counts that the generation capacity of DSM project is 640.7 billion kWh in China for 2011–2015, and estimates for 2016–2020, it is 1.3254 trillion kWh. It can reach 1.9661 trillion kWh during the period 2010–2020, equivalent to a reduction of 22,598 kWh in generation capacity, and nearly 57 billion USD in investment compared with the conventional power plants [1].
With the increase of DSM project scale, many problems in management have been exposed [2]. Among them, information quality is an important factor affecting the development and implementation of energy projects [3]. An important element in fully developing demand-side resources for electricity is the scientific management of demand-side information. Electricity demand-side information is not only information from the electricity user side but also information that directly or indirectly affects electricity demand, such as government policy information, grid construction and planning information, commercial information (e.g., energy efficiency service companies), etc. Power demand-side information management includes information collection, analysis, storage, processing and application with the aim of providing a sound information base for nurturing and supporting future projects and project decisions. The issue of information quality is a difficulty and a key point in electricity demand-side information management efforts. The quality of information on the demand side of electricity often has an important impact on the economic and social benefits of grid investment projects, and poor information quality seriously disturbs scientific decision-making on grid construction projects, making them unable to serve local socio-economic development well and causing serious waste.
1.2. Literature Review
In recent years, information quality has become a research hotspot in the field of information management. Different information quality evaluation indexes and methods are put forward by scholars and widely used in the field of enterprise management and information management. For example, Corbets et al. [4] used an information quality assessment system to assess the team’s performance. Dilruba et al. [5] applied dynamic data maintenance to study data quality. And Yeganeh et al. [6] developed a query collaboration framework to solve the problem of data quality-aware query system. Meanwhile, information quality is also widely used in other interdisciplinary fields, such as surgery [7], medical [8], nursing [9], emergency care [10], chemistry [11], and finance and accounting [12,13,14].
However, even if the quality of information is an important factor, most scholars prefer to focus on other aspects of DSM, such as in the economic field, billing [15], pricing [16] and cost-benefit analysis [17]; in the field of mathematics, such as scheduling [18] and planning [19], energy efficiency [20,21,22]; in the field of technology, such as renewable energy [23], smart distribution system [24] and others [25]. Some literatures considered the information quality of power information (energy information). Petushkov et al. [26] described intermodulation distortion influence on a transmitted information quality and examined an analog predistortion linearizer for TWTA that lowers third-order intermodulation distortion by 9.5 dB. Peng and Zhang [27] analyzed the basic principles of IEC series standard (IEC 61850, IEC60870-5-104, IEC60870-6, IEC 61970, etc.) based on IEC 62361-2 and domestic electric power industry standard (DL476) on information quality code from the perspective of interactive information quality of control data. Tie and Liu [28] defined all aspects of the domain software to be inspected by establishing an attribute model, obtained basic data on evaluation by analyzing and measuring evidence, tailor-made the computing logic of quality evaluation score by establishing an evaluation model, and classified domain software quality by establishing level model. Chang and Choi [29] suggested a research model which would explain the relationship among the bargaining power, partnership, information quality, and SCM features. Ciftcioglu et al. [30] focused on the time-varying nature of the observation quality of the environment in practical networks, which leads to uncertainty in satisfying QoI requirements specified by end users. However, the literature that studies the information quality of power demand side (user side) urgently needs to be supplemented. Therefore, this study of DSM information quality in this paper is innovative and of practical value.
2. Theories and Methods
2.1. DSM Information
With the rapid development of information technology, the power industry has also entered the era of big data, the main content of DSM is load management for end-users, which narrowly refers to the electricity consumption information of enterprises and other users, while the demand side of electricity information, which in a broad sense includes all the information that affects the demand for electricity such as government policies, regulations, documents, power load fluctuations, the speed of socio-economic development, natural disasters, and even the dictation of the person in charge, etc., will have an effect on electricity demand [31].
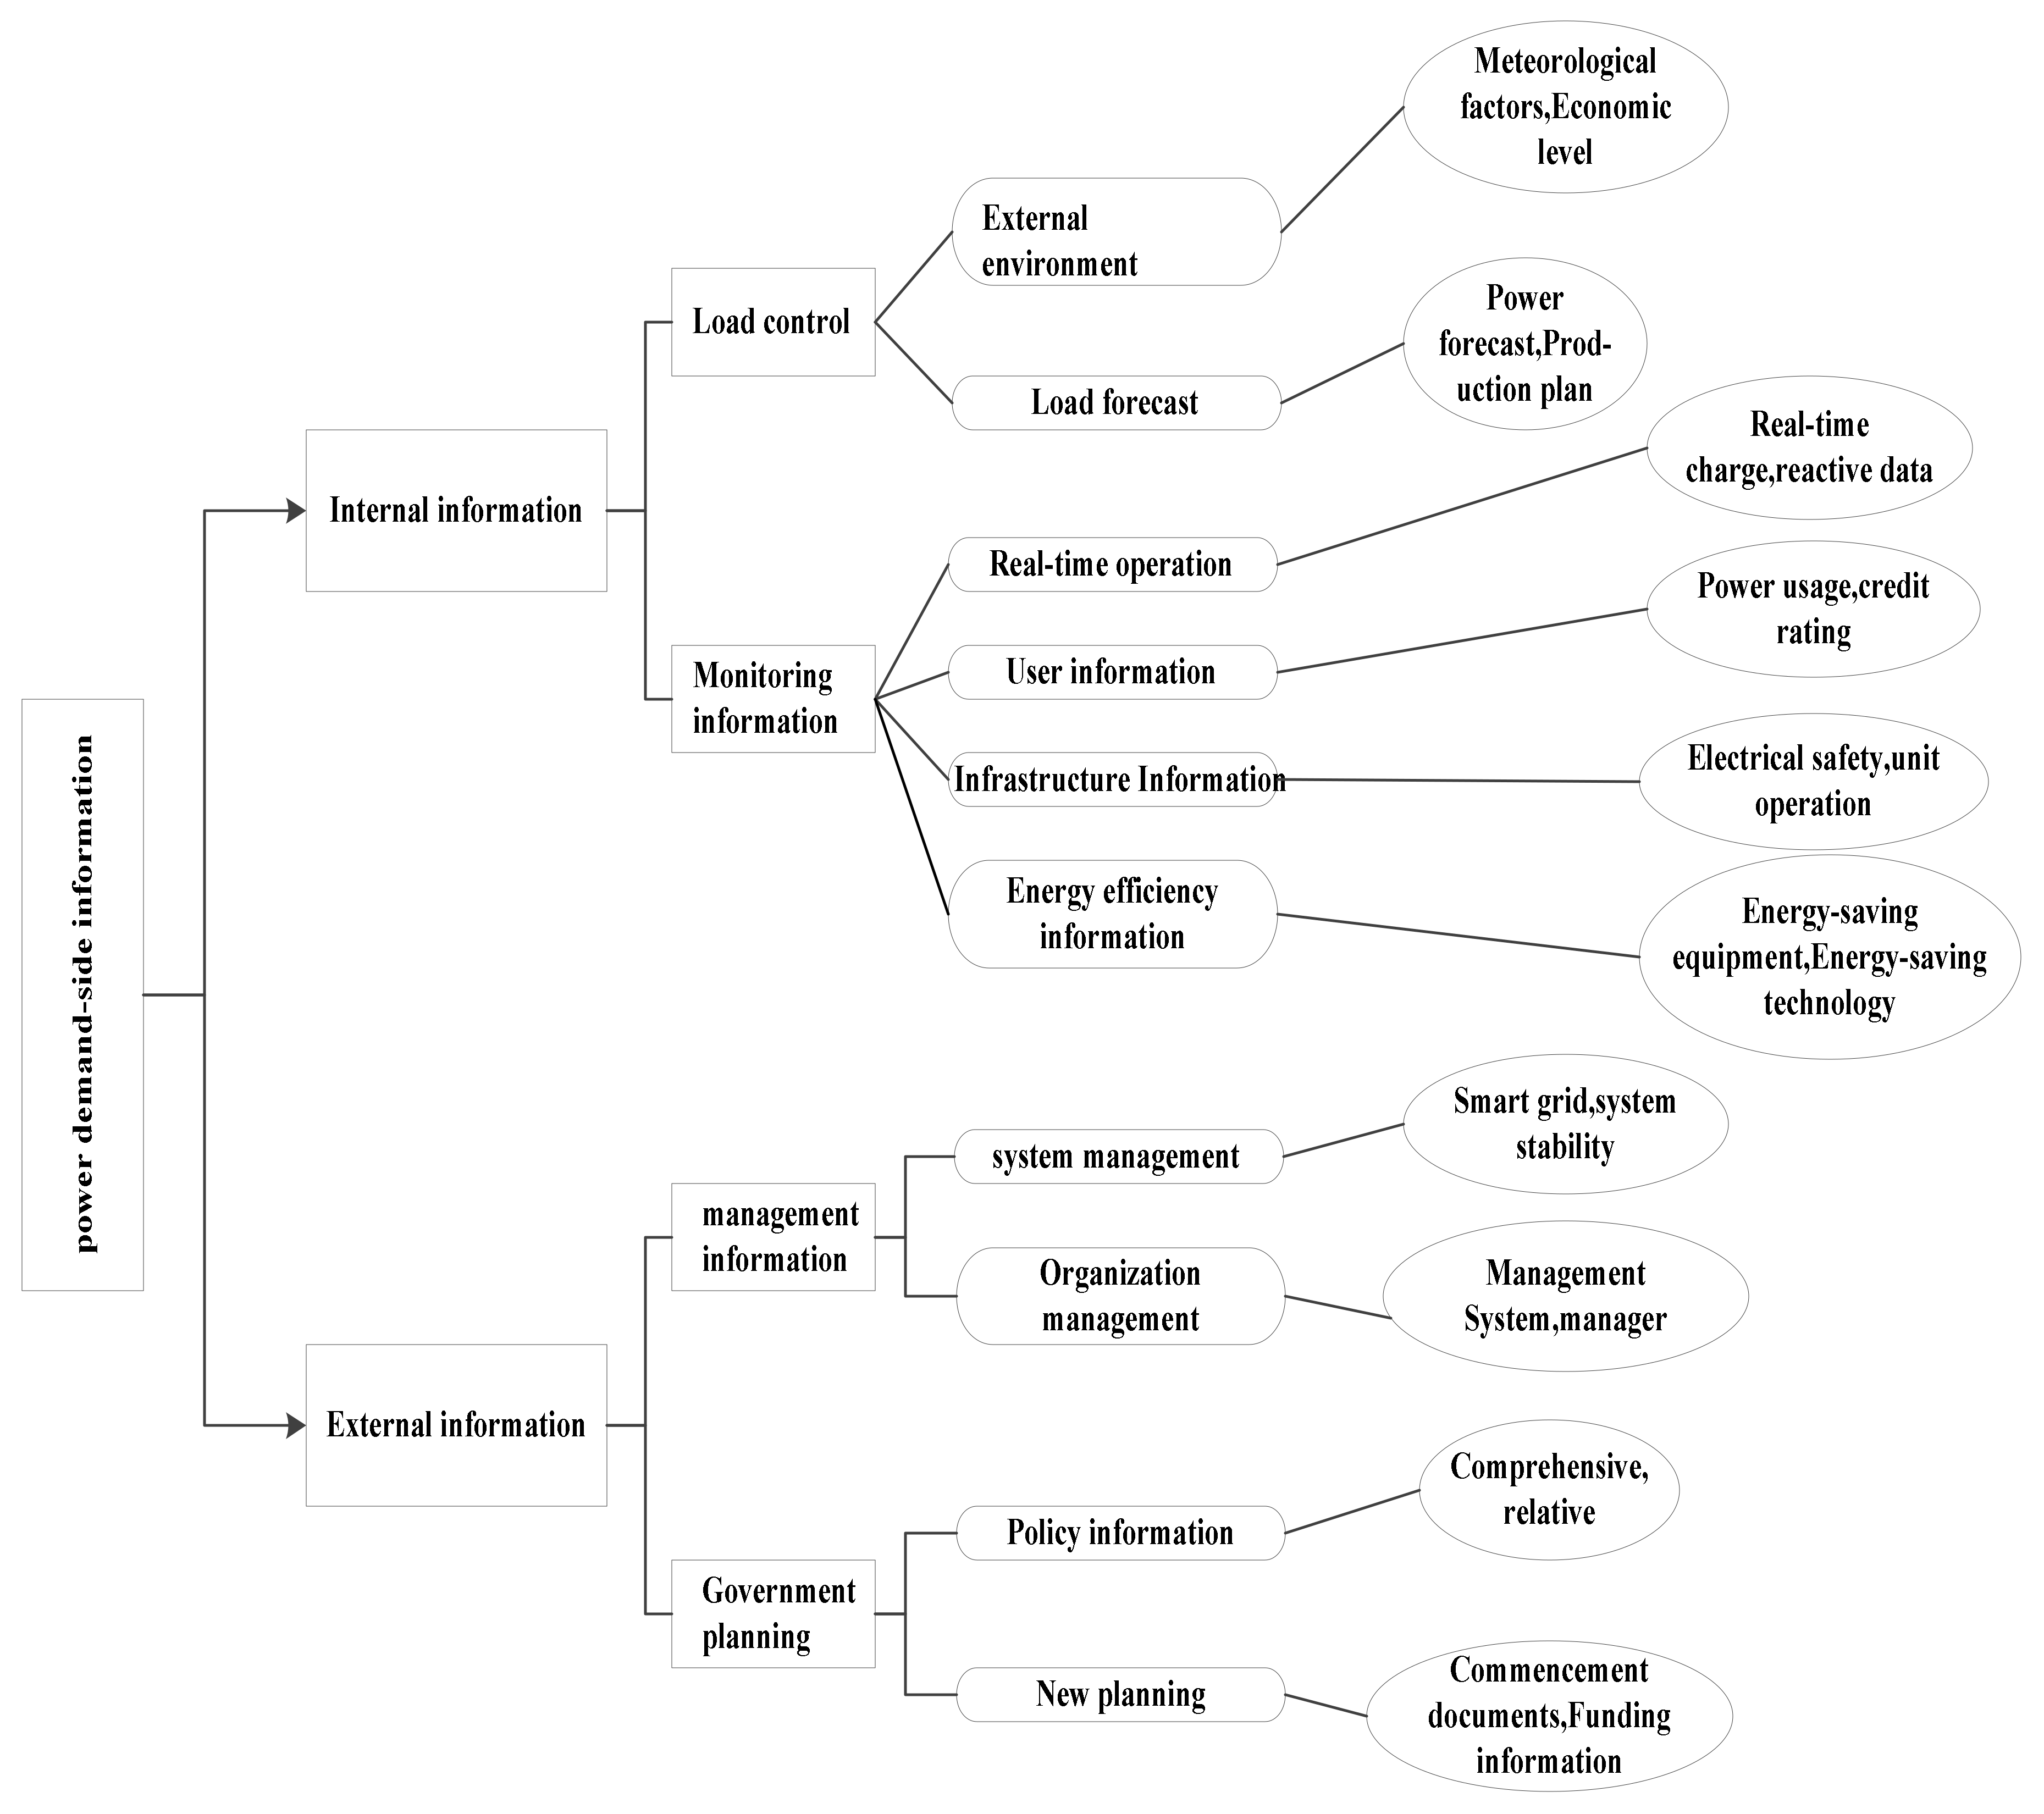
We summarize the previous discussion on electricity demand-side information and propose the framework and main contents of electricity demand-side information from two aspects: internal information and external information, as shown in Figure 1.
- (1)
- Internal information. Internal information refers to information related to management operations and is selected to be reflected in two aspects, “load control” and “monitoring information”. Load control information mainly refers to information that affects load forecasts, mainly including external environment information and load forecasting techniques and methods; monitoring information mainly focuses on the real-time monitoring status of power operation, users, infrastructure, and other information.
- (2)
- External information. External information refers to objective environmental information that has an impact on demand-side management of electricity and is reflected in two parts, “management information” and “government planning”. “Management information” can generally be divided into systems and organizations. In addition to this, there is a need to consider the impact of relevant government planning on grid development. “Government planning information” also includes information on regional policy releases and new planning documents.
2.2. Grounded Theory Approach
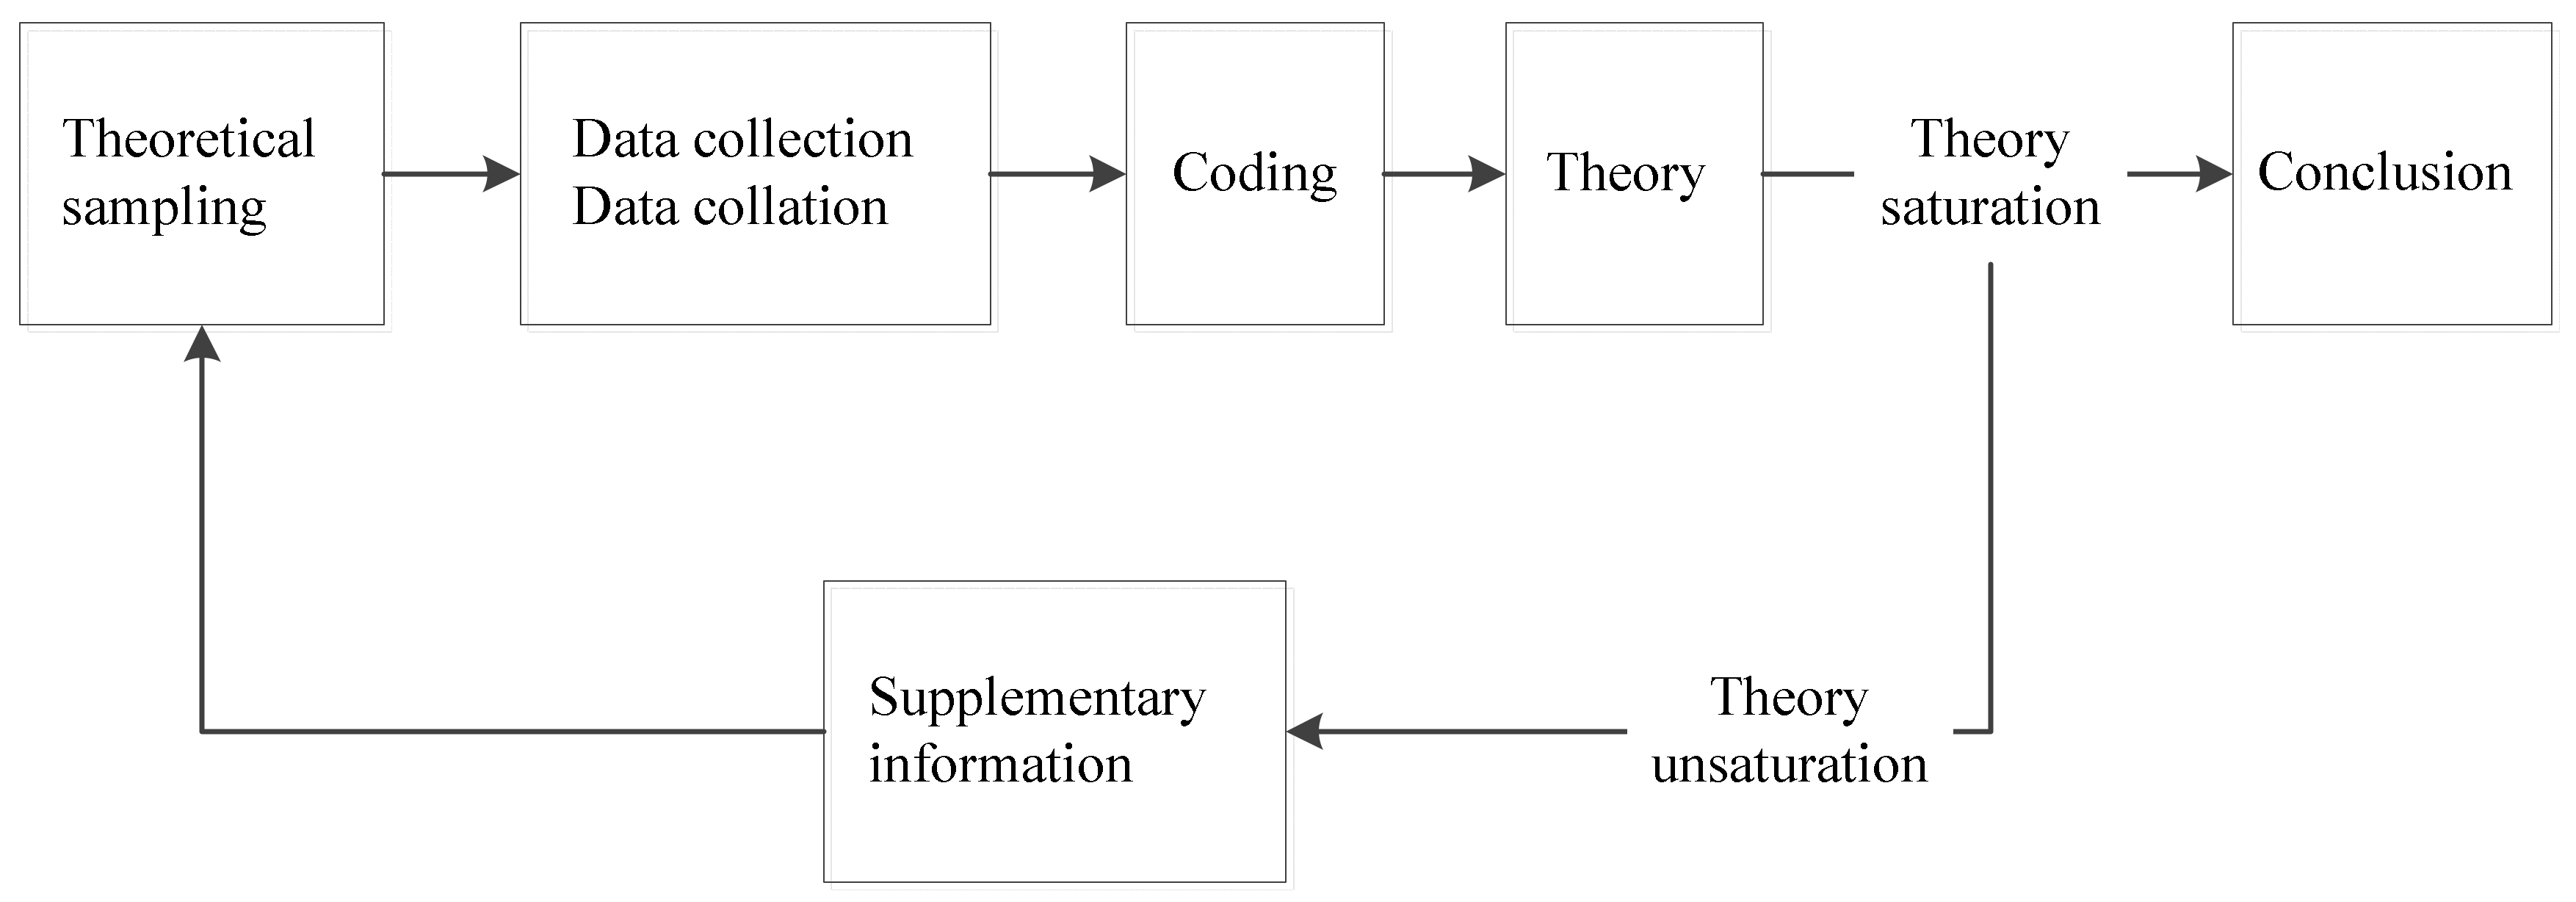
Grounded theory (short for GT) approach, proposed by Anselm Strauss and Barney Glaser [32] from Columbia University, is a well-known theory building method in the study of qualitative research, whose main purpose is to build a theory based on empirical information. Grounded theory approach is the process of continually starting from theoretical facts and then forming entity theories and then evolving from practice to formal theory; it is a theory and method based on accumulating scientific knowledge. Grounded theory approach is a process of moving from the concrete to the abstract, and its operative keywords include “coding”, “constant comparison”, “theoretical sampling”, “theory saturation”, “memo”, and “word for word” (Figure 2).
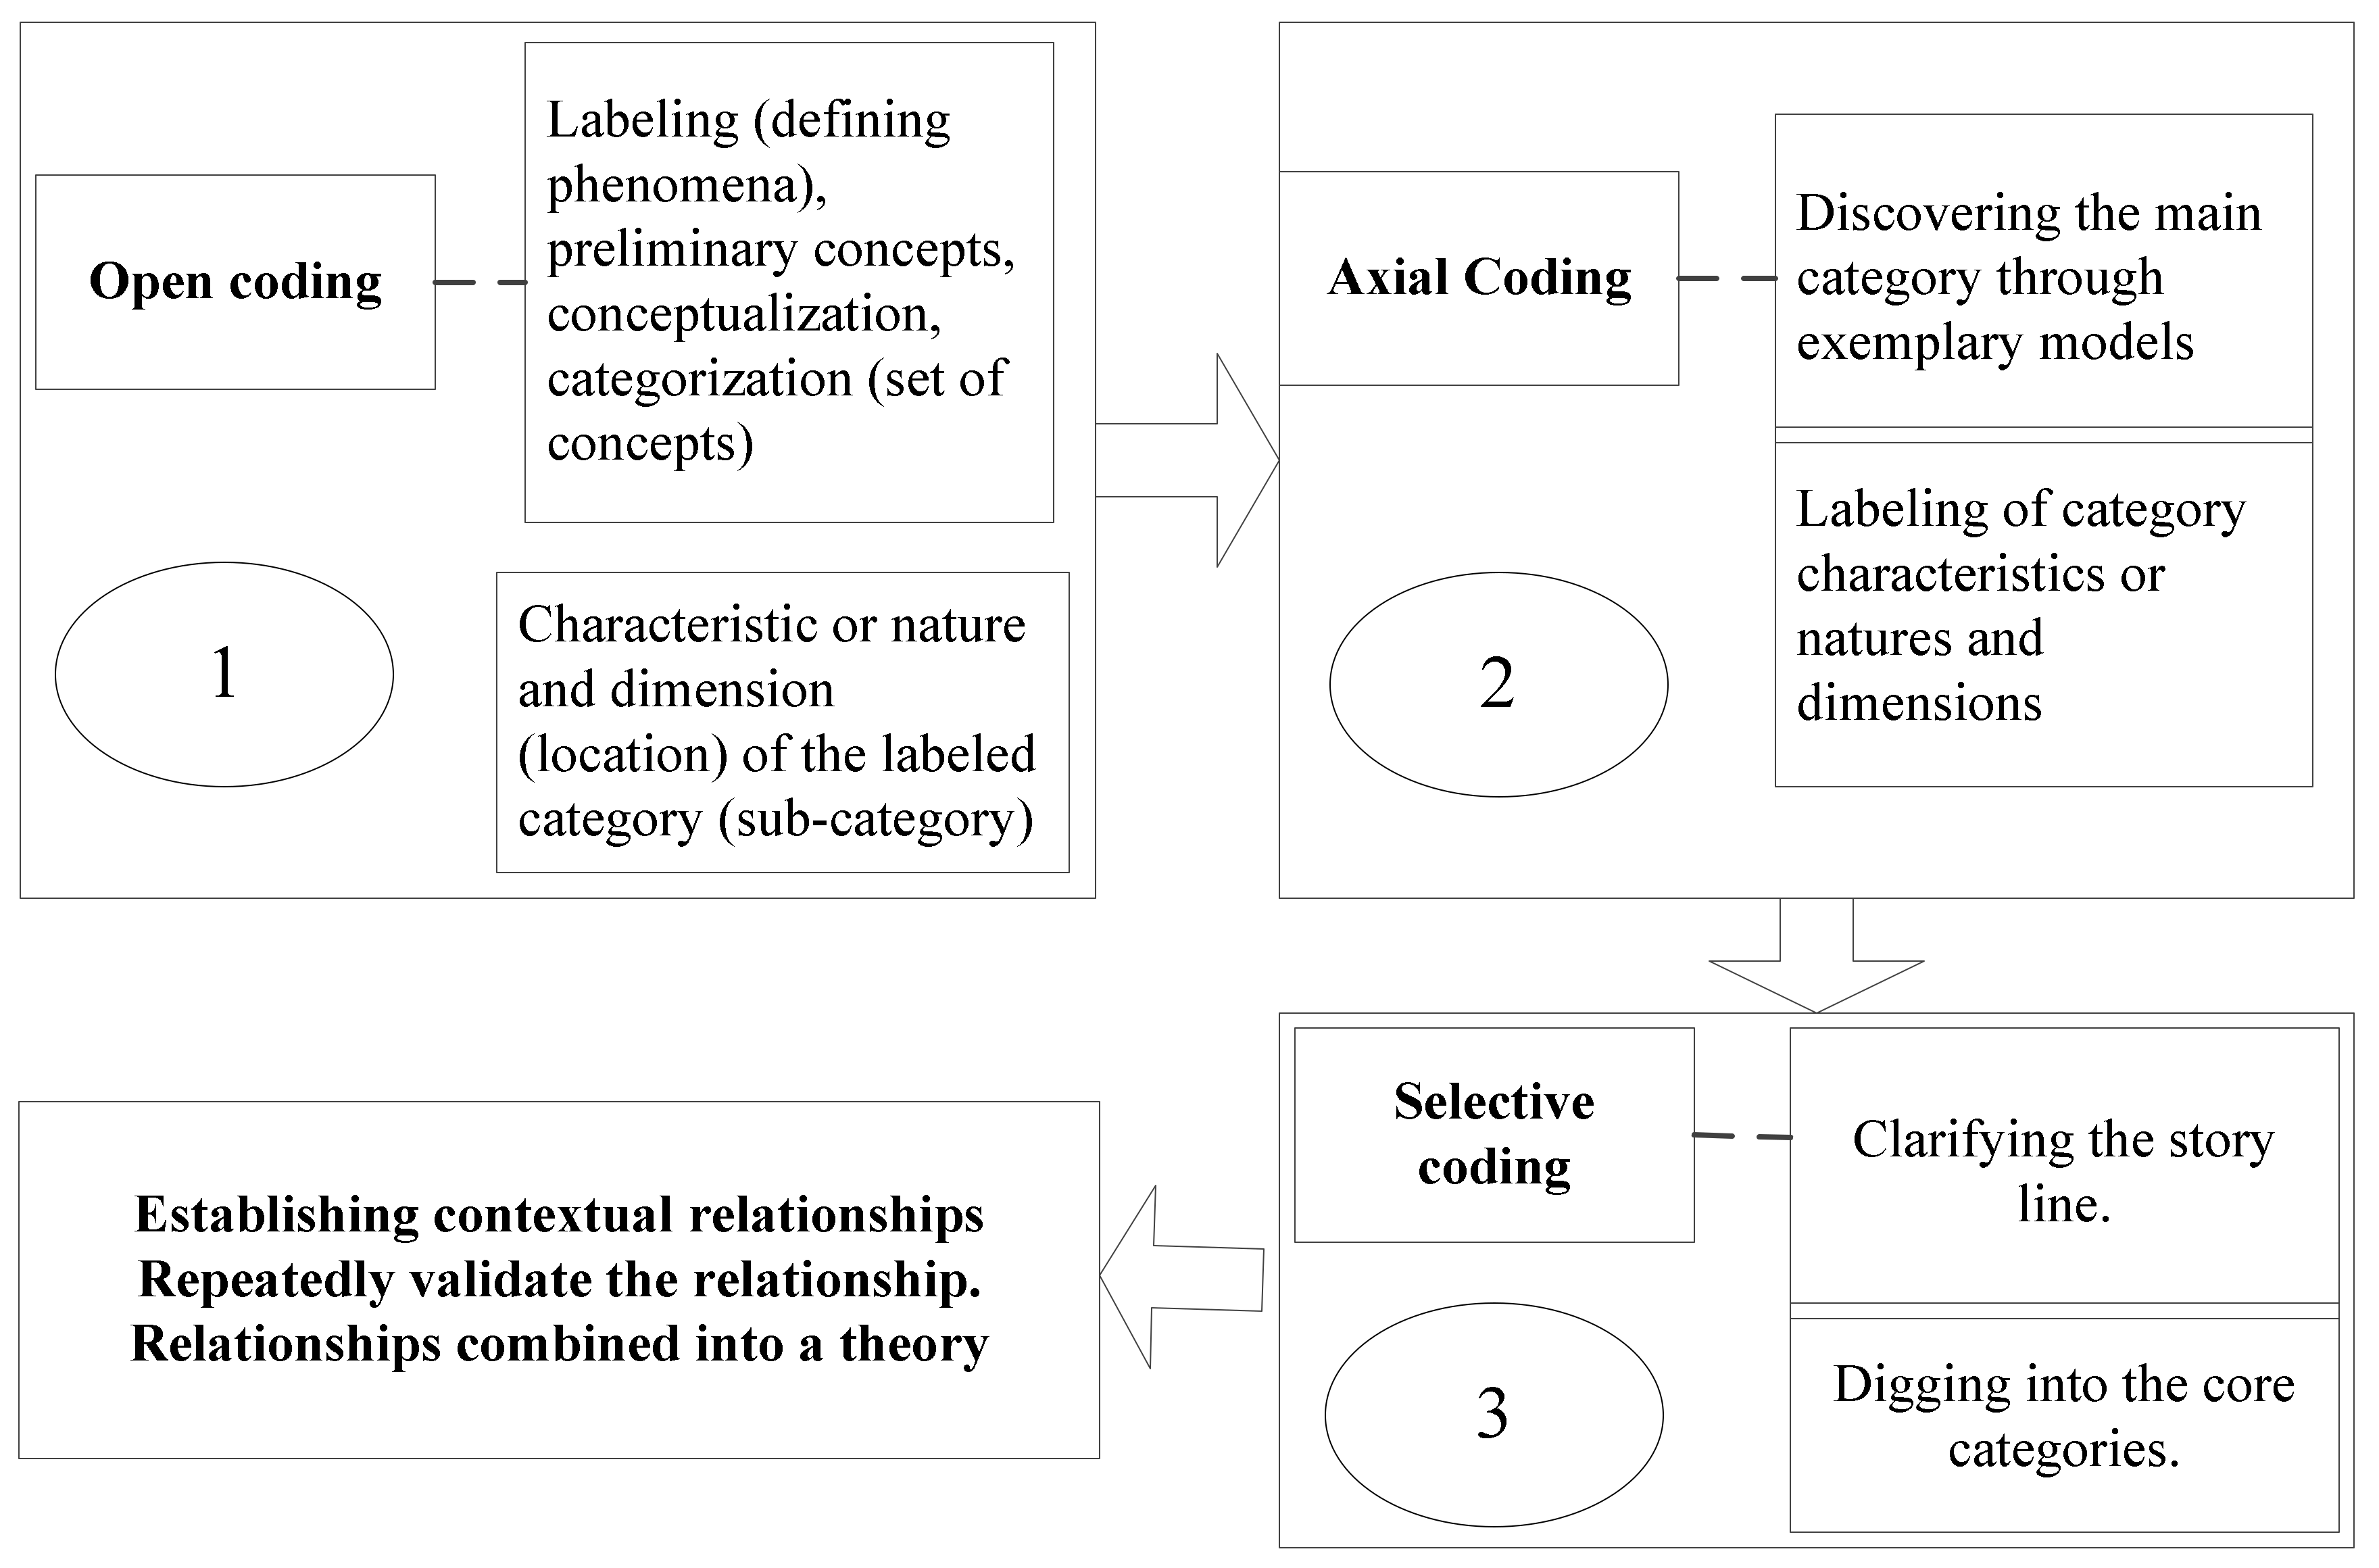
“Coding” is an important element of the Grounded Theory Approach, and coding is the formation of more categories, features, and conceptualized information in the context of different concepts, as well as in the contrast between different events and events. This phase is divided into three stages (Figure 3), and the questions that the researcher needs to keep asking in response to the information are the following: What is the study about which the data are collected? Which category is this incident pointing to? What is really happening in the data?
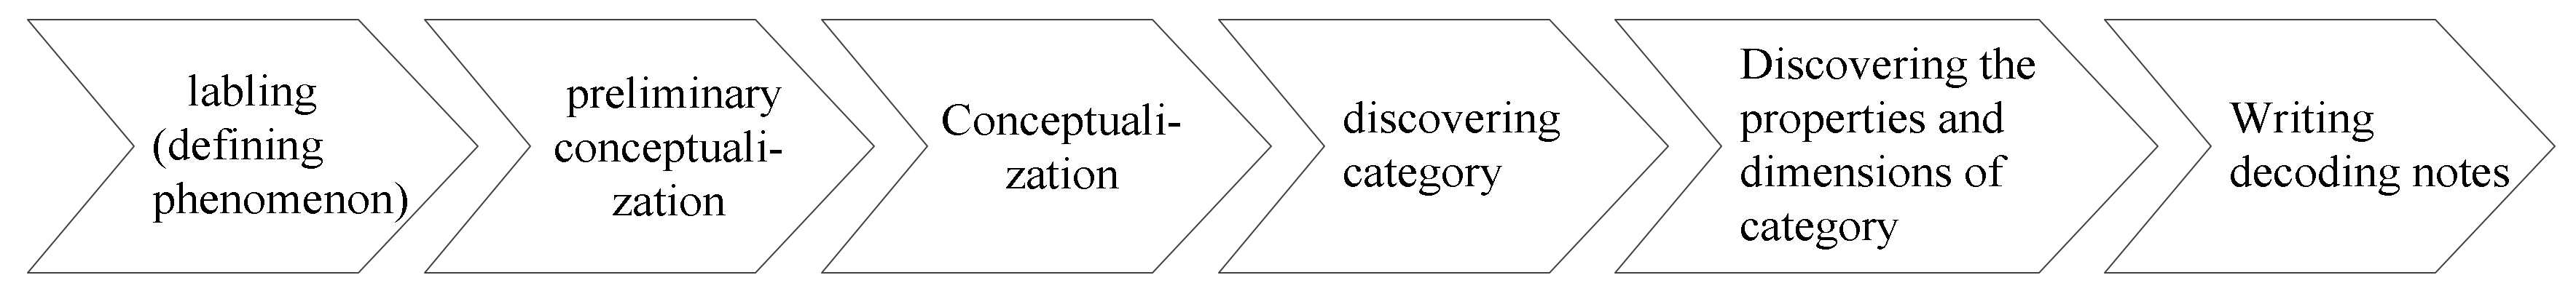
Open coding is the process of decomposing the original data and endowing the original data concepts and recombining them with new ones (Figure 4). The purpose of axial or mainline coding is to clarify concepts and the relationship between them. By thinking about and analyzing the relationships between concepts, higher levels of abstract categories can be integrated. Selective core coding, also known as axial core coding, is also present in the development of many general conceptual relationships through the principal category of core coding. The final step in grounded theory approach is to perform a theoretical saturation test.
2.3. Matter-Element Extension Evaluation Method
Extenics theory builds models with matter elements as primitives to describe paradoxical problems [33], uses matter element transformations as a means of resolving paradoxical problems, and quantitatively describes the quantitative and qualitative changes in things by building correlation functions in the extensible set, that is, quantitatively describes the process of quantitative and qualitative changes in things using extensible domains and critical elements. Therefore, the extension comprehensive evaluation can not only obtain the final evaluation results but also determine the specific position of the evaluation results at what level, which has a natural advantage for the direction of improvement of the evaluation results and analysis of the results.
The theoretical pillars of extenics are matter-element theory and extension set theory, whose logical cells are primitives, including matter-elements, affair-elements, etc. Extension comprehensive evaluation method is an evaluation method based on extension set by building a matter-element model and transforming the evaluation indicators into compatible problems, which leads to conclusions that combine both qualitative and quantitative aspects. Its evaluation model can be briefly described as follows:
In extension comprehensive evaluation, matter elements are expressed as ordered triples. If the thing N has n features, and the m matter-elements to be evaluated have the same feature C, then the object R with the same feature can be expressed as
where represents the element to be evaluated; represents the whole element to be evaluated; and represents the value of the ith feature of the jth element to be evaluated.
After forming the object to be described or evaluated, each feature, and the quantitative value of the object about the feature into an matter-element whole, using the relational degree of extension, set to describe the relationship between each feature and the object to be studied, so as to extend the qualitative description to quantitative description.
- (1)
- The correlation degree function of the th index number range belonging to the th level is the following:
- (2)
- The correlation degree of matter to be evaluated with respect to grade is as follows:
Finally, the evaluation grade of the matter to be evaluated is , after verifying the evaluation results, illustrating the relative accuracy of extension comprehensive evaluation results.
3. Results
3.1. Building DSM Information Quality Evaluation Indexes Based on the Grounded Theory
3.1.1. Data Sources
Research on demand-side information quality should not only consider users but also the current social environment and economic development trend, that is, pay attention to the social interactivity of the textual material, which fully demonstrates that the collected textual material is an objective material that can fully reflect the quality of demand-side information.
The published papers and documents are basically the secondary processing of existing original materials. In order to ensure the validity of the research process of grounded theory approach and to be more faithful to the original material, on the basis of research topics and situations, the material of this research sample, in addition to the research paper literature, also includes objective data such as online news, national power official website and newspaper news (including the full-text database of important Chinese newspapers (CNKI)), comments on “Zhihu” (a very famous question and answer community platform in China), national power grid, international power network, and Sina Weibo (China’s most widely used micro blogs).
Firstly, we searched the above repository with the keywords “power demand side management”, “power demand side information quality”, “power demand side response”, “power/grid information quality”, and “power load”, with a total time frame of 168 qualitative materials after 2013; secondly, the materials obtained were screened by initial reading, and the screening criterion is the evaluation of electricity demand information quality by users or professionals. The evaluation can best reflect the influence degree of power demand side information. Finally, 114 qualitative materials were obtained, including 15 research papers, 9 newspaper reports, 18 speeches at power grid expert meetings, 22 reports on the official website, 38 expert comments and 12 “Zhihu” comments. Second, we invited a total of 15 experts from grid companies, universities, research institutes, experts, enterprise users, residents, and third-party energy service companies; interviewed them about DSM information quality evaluation index system; made the interview records of more than 90 copies; deleted contradiction or expression of 8 questionnaires, and made 82 copies of effective interview records. The data and records of DSM information quality evaluation index are formed by the collection of two aspects of materials.
3.1.2. Data Coding and Analysis
Open Coding
Preliminarily, 105 free nodes (a1–a105) were obtained after excluding simple and ambiguous descriptions according to the qualitative analysis software NVivo11 and reserving 10 copies of the material for theoretical saturation tests. Through the screening of the frequency of occurrence of statements and the comparative analysis of the library and information professional group discussion, 34 categories (A1–A34) were formed. The specific coding results are shown in Table 1.
Axial Coding
The axial coding is based on the formation of open coding to clarify the interconnection of each category. According to the characteristics of power demand-side information, this study fully considers the application scenarios, and through repeated combing and refining, and through repeated inductive clustering by means of NVivo group function to form 10 main categories (B1–B10), which are finally loaded into the four dimensions of information quality, monitoring information quality, management information quality, and government planning information quality, as shown in Table 2.
Selective Coding
Selective coding is to further sort out the relationship between categories on the basis of the formation of the main category, and to systematically depict the relationship between the core category and other categories. The typical relationships among the main categories are shown in Table 3, which focuses on the core category of “demand-side information on electricity”.
3.1.3. DSM Information Quality Evaluation Indexes
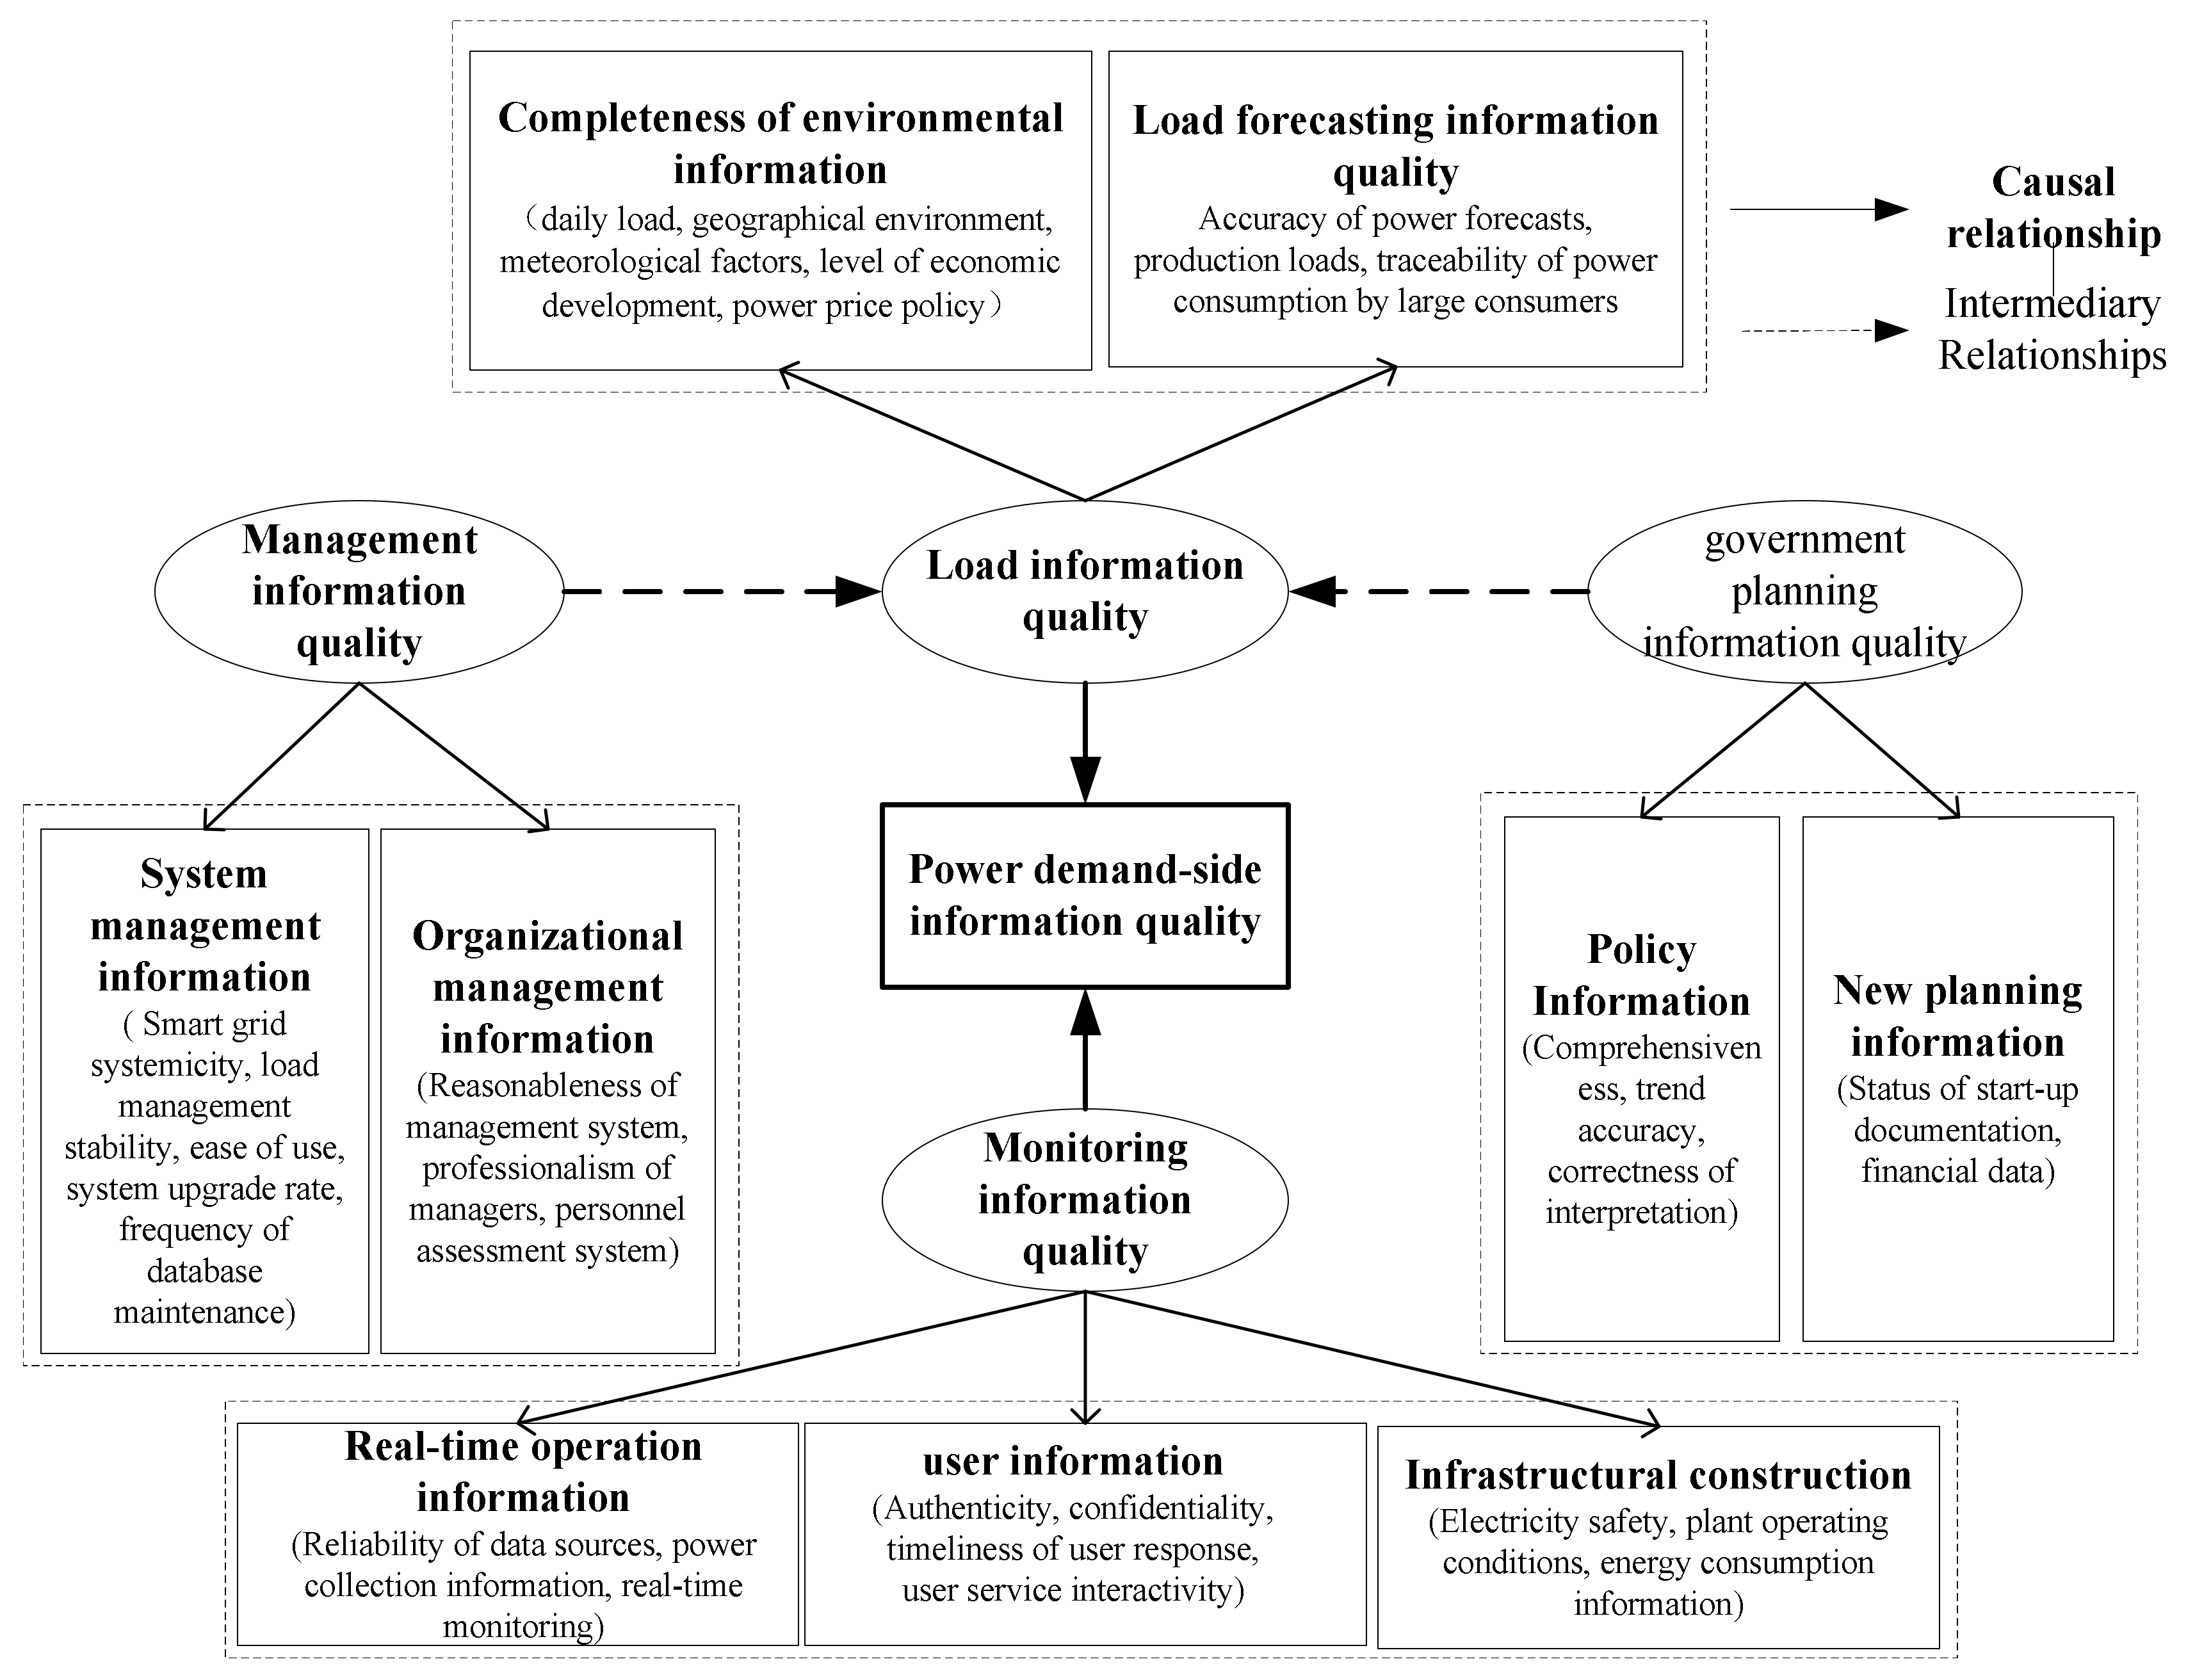
By coding the 10 data set aside, the coded labels can all be included in the above coded concepts, and no new categories or associations are found, which satisfies the principle of theoretical saturation; to this point, it is considered that the theoretical saturation verification passes. The purposes of power demand side management are to reduce energy consumption and load, to reduce air pollution from power plants, and to maintain energy service levels and achieve economic and social benefits. Therefore, it is crucial to understand what factors affect the quality of information on the demand side of e power. In this paper, the storyline formed by coding points out that the quality of information on the demand side of electricity is influenced by 10 main categories, which are environmental information quality, the load forecasting information quality, real-time operation information quality, user information quality, infrastructure information quality, energy efficiency information quality, system information quality, organization information quality, policy information quality, and new planning information quality. Based on this, the structural model of the relationship between the influencing factors is shown in Figure 5.
The model of factors influencing the power demand-side information quality shows 10 main categories that have been researched through grounded theory approach, which include 5 Causal and 5 intermediary relationships, forming 4 dimensions of load information quality, monitoring information quality, management information quality, and government planning information quality. Each of these 4 dimensions has its own characteristic mechanism for influencing the quality of information on the demand side of electricity.
Based on the above study, an indicator system for evaluating the power demand side information quality can be constructed, as shown in Table 4.
The following is an explanation of the indicators in Table 4:
- (1)
- Load information quality
Load control consists of two main categories, environmental factors and load forecasting, and is an indispensable link in power demand-side management. Load management requires the power supply department to do a good job in power consumption management, improve power consumption efficiency, and reduce power consumption cost by using scientific load forecasting. Therefore, from the point of view of power demand-side management practices, the first step is to improve the accuracy of power load control, which is not only related to the stability and safety of power system operation but also related to the scientific nature of power demand side management.
- (2)
- Monitoring information quality
Power demand side information management is inseparable from the support of monitoring technology. The dimension of monitoring information includes three main categories: real-time operation, user, and infrastructure. In the process of power demand side management, there has not been enough attention to the power quality of the demand side power grid. Problems such as voltage flicker and unbalanced power supply often affect users’ power consumption, and even pose a threat to the safe operation of the power grid, which requires power demand-side management and technical personnel to fully capture the data information of the line and can provide suggestions and requirements for technical transformation and other aspects for enterprise users who do not meet the requirements.
- (3)
- Management information quality
The management dimension includes two main categories, system management and organizational management, which can indirectly influence the demand side of electricity by having an impact on the load Quality of information. On the one hand, through the management of each information system, the efficiency and effectiveness of power information collection is improved, which not only reduces costs but also improves the data authenticity. On the other hand, the organization and management model of the company also affects the information quality on the demand side of power to some extent. The more advanced the grid company system is, the more it can integrate into the market environment and meet customer needs, and the more professional and visionary its employees are, the more excellent performance will be created.
- (4)
- Government planning information quality
The scientific management of power demand side is inseparable from the joint efforts of the government and enterprises. A benign grid environment, coupled with scientific power station planning and layout, can realize the relative stability of power station construction cost and electricity price. Therefore, DSM should be taken as an important part of energy planning to establish a higher level of DSM, as well as short- and long-term planning for power plants and power grids. At the same time, the construction planning of the enterprise affects the work arrangement of the electric power enterprises. In the early stage of the construction, whether the audit documents of each link are complete is related to the continuity and stability of the electric power of the enterprise, and power enterprises need to understand and collect this information.
Among the above indicators, qualitative indicators can be scored by experts to determine the specific grading and scale of indicators, such as accuracy standards, real-time time standards, and so on, which requires a lot of practical research and deliberation, due to space limitations; this part is not discussed in this paper.
3.2. Case Study of DSM Information Quality Evaluation Based on Matter-Element Extension Evaluation Method
3.2.1. Case Introduction
The author made a field investigation on the Nanchang Power Supply Company (in Nanchang City, Jiangxi Province, China) and investigated its power demand side information collection, analysis, system management, and utilization mechanism. The main investigation conclusions are as follows:
The power supply company covers an area of about 20,000 square kilometers and is responsible for the electricity needs of about 1.6 million households and 4.8 million people in 10 counties and 1 district and 1 economic development zone in Nanchang. Currently, there are 2500 kV substations, 13,220 kV substations, and 37,110 kV substations under construction. There are 42,220 kV lines/1222 km and 68,110 kV lines/1274 km. In recent years, the economy continues to develop, and the demand for electricity is on a straight upward trend. The last five years have sustained a high annual growth rate within the scope of power supply. The electricity consumption of the primary industry grows rapidly, while the demands of the tertiary industry and non-residents also show an expanding trend. The continuous popularization of the use of household appliances has also led to a great increase in household electricity consumption. In the implementation of demand-side management, Nanchang Power Supply Company clarified the responsibilities of each organization (as shown in Figure 3): adherence to market-oriented, service-oriented, and efficiency-centered organization of power production and operation activities to ensure that all aspects of electricity demand are covered.
The power demand side management of the power supply company mainly includes the following parts:
- (1)
- The large industrial power consumption in the power supply area of the company has always accounted for more than 60% of the total power consumption, so the implementation of DSM and load management for large industrial users will bring significant economic benefits and social significance.
- (2)
- The power company emphasizes regulating peak and flat loads, incentivizing underestimated power consumption, focusing examining on power consumption of underestimated periods, and adhering to hierarchical management and electricity conservation programs.
- (3)
- The Power Supply Company and relevant units in the city jointly carry out the publicity work of power demand side management and publicize the power demand side management project through media publicity, publicity activities, and rules and regulations.
- (4)
- The power supply company applies load control technology to ensure the safe and stable operation of the power system, to guarantee the basic electricity consumption of the community, and, through administrative and regulatory measures, to improve the load rate of the power grid.
- (5)
- In order to ensure the orderly power supply of the power grid, the power supply enterprises improve the security, reliability, and economic operation of the grid; strengthen the supervision and management; optimize the organizational management; scientifically and reasonably allocate and determine the power consumption indicators; and formulate corresponding assessment methods.
3.2.2. Index Weight
In order to evaluate the current power demand side information quality of the power supply company, the author invited more than 10 experts and professors from power supply companies, universities, and energy consulting companies to weigh the evaluation system and apply it to the evaluation language set of extension evaluation. The quantitative data are all from Nanchang Power Supply Company.
Questionnaires were issued to experts to investigate the mutual importance of secondary indicators, using analytic hierarchy process (AHP) to determine the weights of the evaluation index; using the 1–9 scale method to obtain the judgment matrix for each index; and using Yaahp software to calculate the maximum characteristic root , deviation consistency index , random consistency ratio , and weight vector of the judgment matrix, as shown in Table 5.
It can be seen from the above table that the random consistency ratios are all less than 0.1, and the judgment matrix has satisfactory consistency.
3.2.3. Evaluation Process
Evaluation Set Identification
By referring to relevant literature and combining with expert suggestions, we classify the quality of electricity demand-side information into five levels from high to low: excellent, good, general, poor, and very poor; the score intervals are shown in Table 6. The range of qualitative indexes from excellent to very poor values is 90~100, 80~90, 70~80, 60~70, 0~60. The qualitative indicators range from excellent to very poor scores are 90–100, 80–90, 70–80, 60–70, 0~60, and the quantitative indexes score ranges are shown in Table 6.
After asking experts to familiarize themselves with the index system, the content of the indexes and the evaluation criteria constructed in this study, the qualitative indicators were judged and scored, and quantitative indexes were calculated. The average score for each indicator is shown in Table 7.
Correlation Function and the Calculation of Comprehensive Correlation Degree
According to the calculation formula of correlation function in extension theory, the value of correlation function and comprehensive correlation degree of information quality level on the power demand side are obtained after calculation, as shown in Table 8.
Evaluation Results Analysis
Combining the correlation function values and the weight values of the indexes at all levels, the evaluation result of information quality on power demand-side of this power enterprise can finally be obtained, as shown in Table 9.
The greater the correlation degree is, the higher the probability of the object belonging to a certain rank is. The largest correlation degree of the overall information quality on power demand-side of Nanchang Power Supply Company is 0.0763, which corresponds to excellent, that is, the overall power demand-side information quality of the power supply company is excellent. However, through the analysis and evaluation process, the power demand side information quality of the power supply company can still be improved in detail. Specifically, in the process of managing the power demand side information, the power supply company needs to focus on improving the services related to user interaction in B22 and increasing the development and promotion of energy-saving equipment technology in B24, in order to minimize energy consumption in the power supply area. On top of this, more attention needs to be paid to the availability of information in the B42 enterprise planning documents information, so as to reduce the correlation degree between each index and the lower level and increase the correlation degree with the higher level, so as to improve the comprehensive correlation degree of the level information quality, thus effectively improving the level of information quality on power demand side.
4. Discussion
In this paper three important contents are put forward:
Firstly, we downloaded 168 copies of valuable materials from academic journals, news reports, and professional forums about DSM information quality; invited a total of 15 experts out of different stakeholders; and collected more than 90 interview records. These materials provide substantial and reliable data for the grounded process of DSM information quality indicators.
Secondly, we used grounded theory approach to build DSM information quality indicators. Through open coding, spindle coding, and selective coding, a total of 34 indicators from four dimensions were constructed.
Finally, we put forward the case study of Nanchang Power Supply Company (in Nanchang City, Jiangxi Province, China) based on matter-element extension evaluation method. The case study results show DSM information quality evaluation indexes are effective, and the evaluation method is also applicable.
Compared with previous studies, we have made some innovations or progress in this paper.
Compared to a previous study [34] about information and communication technology in the energy field, we propose a more explicit technical path, that is, to improve energy efficiency by improving the quality of information. Compared to literatures [35,36,37] mainly about economic and technical evaluation of DSM projects, we innovatively propose information quality evaluation. Compared to Vasco et al. [38] about evaluation indicators of DSM, we use the grounded theory to construct the index system and demonstrate the effectiveness of the index system through empirical analysis, which makes our research more grounded and logical.
5. Conclusions
As a capital-intensive industry, power grid construction projects have the characteristics of large investment amount, long payback period, and high risk. The information quality evaluation on the power demand side is of positive significance for ensuring the investment benefits of power grid construction projects, reducing risk losses, and promoting socio-economic development. The main work and conclusions of this paper are as follows:
- (1)
- Using the grounded theory to study the method of evaluating the information quality on the power demand side, the index system for evaluating the information quality on the power demand side was constructed, which is a beneficial supplement of the power demand-side management. The index system covers 4 dimensions (load information quality, monitoring information quality, management information quality, and government planning information quality) and includes 10 main categories (environmental information quality, load forecasting information quality, real-time operating information quality, user information quality, and infrastructure information quality, energy efficiency information quality, system information quality, organization information quality, policy information quality, and new planning information quality). The relationship between environment information, load forecasting information, real-time operating information, user information, infrastructure information, and power demand side information quality is causal; the relations between energy efficiency information, system information, organization information, policy information, new planning information, and power demand side information quality are intermediary relations. Through the interaction of factors, the evaluation index system of power demand side information quality is constructed. On this basis, the empirical analysis based on the extension comprehensive evaluation proves that the index system is feasible in theory and method. It is of practical significance to understand the current level of information quality on the demand side and point out the direction for improving information quality to the next higher stage.
- (2)
- The issue of power demand-side information quality is a complex and dynamic problem that cannot be solved entirely by a set of indicator systems and evaluation methods. Although we have done some work on the establishment of the index system and evaluation methods, there are still shortcomings. relevant research and the verification of specific cases can be further detailed, and the index system and evaluation methods can be further enriched and expanded. However, the original research on power demand side information evaluation can serve as a reference for future related research.
Author Contributions
Conceptualization, Y.Z.; methodology, Y.Z.; data curation, Z.Z.; writing—original draft preparation, Z.Z.; writing—review and editing, Y.Z. All authors have read and agreed to the published version of the manuscript.
Funding
This research was funded by the National Natural Science Foundation of China (NSFC, Grant No. 71964022), Jiangxi University Humanities and Social Science Project (Grant No. TQ18108), and Jiangxi Culture, Art and Science Planning Project (Grant No. YG2018037).
Conflicts of Interest
The authors declare no conflict of interest.
References
- Energy Research Institute of State Grid of China. Study on Ways and Means to the Construction of EPP; China Electric Power Press: Beijing, China, 2010. (In Chinese) [Google Scholar]
- Zhu, Y.P.; Feng, W.; Fan, L.Z. An Evolutionary Game study on Implementation of Energy Efficiency Power Plants between Government and Enterprise Considering Carbon Emission Right Trading. Appl. Ecol. Environ. Res. 2019, 17, 699–722. [Google Scholar] [CrossRef]
- Mauritzen, J. Are solar panels commodities? A Bayesian hierarchical approach to detecting quality differences and asymmetric information. Eur. J. Oper. Res. 2020, 280, 365–382. [Google Scholar] [CrossRef]
- Corbets, J.B.; Willy, C.J.; Bischoff, J.E. Evaluating System Architecture Quality and Architecting Team Performance Using Information Quality Theory. IEEE Syst. J. 2017, 12, 1139–1147. [Google Scholar] [CrossRef]
- Dilruba, O.E.; Kaan, O. Dynamic data maintenance for quality data, quality research. Int. J. Inf. Manag. 2012, 32, 282–293. [Google Scholar]
- Yeganeh, N.K.; Sadiq, S.; Sharaf, M.A. A framework for data quality aware query systems. Inf. Syst. 2014, 46, 24–44. [Google Scholar] [CrossRef]
- Engelmann, J.; Fischer, C.; Nkenke, E. Quality assessment of patient information on orthognathic surgery on the internet. J. Cranio-Maxillofacial Surg. 2020, 48, 661–665. [Google Scholar] [CrossRef]
- Pouyan, E.; Tala, M.; Spurthy, D. The impact of data entry structures on perceptions of individuals with chronic mental disorders and physical diseases towards health information sharing. Int. J. Med. Inf. 2020, 141, 104157. [Google Scholar]
- Kim, C.-J.; Kang, H.S.; Kim, J.S.; Won, Y.Y.; Schlenk, E.A. Predicting physical activity and cardiovascular risk and quality of life in adults with osteoarthritis at risk for metabolic syndrome: A test of the information-motivation-behavioral skills model. Nurs. Open 2020, 7, 1239–1248. [Google Scholar] [CrossRef]
- Sibel, Y.F.; Turkan, K. Evaluation of the reliability, utility, and quality of the information in cardiopulmonary resuscitation videos shared on Open access video sharing platform YouTube. Australas. Emerg. Care 2020, 23, 211–216. [Google Scholar]
- Comero, S.; Dalla Costa, S.; Cusinato, A.; Korytar, P.; Kephalopoulos, S.; Bopp, S.; Gawlik, B.M. A conceptual data quality framework for IPCHEM—The European Commission Information Platform for chemical monitoring. TrAC Trends Anal. Chem. 2020, 127, 115879. [Google Scholar]
- Fosu, S.; Danso, A.; Agyei-Boapeah, H.; Ntim, C.G.; Adegbite, E. Credit information sharing and loan default in developing countries: the moderating effect of banking market concentration and national governance quality. Review Quant. Fin. Acc. 2020, 55, 55–103. [Google Scholar]
- Ullah, B. Signaling value of quality certification: Financing under asymmetric information. J. Multinatl. Financ. Manag. 2020, 100629. [Google Scholar] [CrossRef]
- Frenkel, S.; Guttman, I.; Kremer, I. The effect of exogenous information on voluntary disclosure and market quality. J. Fin. Econ. 2020, 138, 176–192. [Google Scholar] [CrossRef] [Green Version]
- Çakmak, R.; Altaş, I.H. A novel billing approach for fair and effective demand side management: Appliance level billing (AppLeBill). Int. J. Electr. Power Energy Syst. 2020, 121, 106062. [Google Scholar] [CrossRef]
- Venizelos, V.; George, M.; Venizelos, E.; Georghiou, G.E. Methodology for deploying cost-optimum price-based demand side management for residential prosumers. Renew. Energy 2020, 153, 228–240. [Google Scholar]
- Wang, J.M.; Zhu, Y.P. Cost-benefit analysis of DSM energy-efficiency project in low-carbon vision: A case in China. Energy Ed. Sci. Technol. 2014, 32, 645–658. [Google Scholar]
- Chamandoust, H.; Bahramara, S.; Derakhshan, G. Day-ahead scheduling problem of smart micro-grid with high penetration of wind energy and demand side management strategies. Sustain. Energy Technol. Assess 2020, 40, 100747. [Google Scholar]
- Zhu, Y.; Hu, Y.; Zhang, F. Progressive IRP Models for Power Resources Including EPP. Math. Probl. Eng. 2017, 2017, 1–7. [Google Scholar] [CrossRef] [Green Version]
- Wang, J.; Zhu, Y.; Li, Y. EPP Energy Efficiency Calculation and Influencing Factor Analysis: Cases in China. Math. Probl. Eng. 2015, 2015, 1–8. [Google Scholar] [CrossRef] [Green Version]
- Wang, J.-M.; Ge, X.; Zhang, L.; Zhang, H. Management Index Systems and Energy Efficiency Diagnosis Model for Power Plant: Cases in China. Math. Probl. Eng. 2016, 2016, 1–13. [Google Scholar] [CrossRef]
- Chakraborty, N.; Mondal, A.; Mondal, S. Efficient Load Control Based Demand Side Management Schemes towards a Smart Energy Grid System. Sustain. Cities Soc. 2020, 59, 102175. [Google Scholar] [CrossRef]
- Kalair, A.R.; Abas, N.; Hasan, Q.U.; Seyedmahmoudian, M.; Khan, N. Demand side management in hybrid rooftop photovoltaic integrated smart nano grid. J. Clean. Prod. 2020, 258, 120747. [Google Scholar] [CrossRef]
- Reddy, K.S.; Panwar, L.K.; Panigrahi, B.K.; Kumar, R.; Xu, Y. A dual objective approach for aggregator managed demand side management (DSM) in cloud based cyber physical smart distribution system. Futur. Gener. Comput. Syst. 2020, 105, 843–854. [Google Scholar] [CrossRef]
- Mendes, D.L.; Rabêlo, R.A.; Veloso, A.F.; Rodrigues, J.J.P.C.; Junior, J.V.D.R. An adaptive data compression mechanism for smart meters considering a demand side management scenario. J. Clean. Prod. 2020, 255, 120190. [Google Scholar] [CrossRef]
- Petushkov, S.V.; Vilderman, E.N.; Belov, L.A. Influence of power amplifier’s intermodulation distortion on transmitted information quality. In Proceedings of the 2018 Systems of Signal Synchronization, Generating and Processing in Telecommunications (SYNCHROINFO), Minsk, Belarus, 4–5 July 2018; pp. 1–4. [Google Scholar] [CrossRef]
- Peng, Z.; Zhang, Q. A new method of information quality analysis of power grid dispatching automation system and its application. Dianli Xitong Baohu yu Kongzhi/Power Syst. Prot. Control 2018, 46, 150–157. [Google Scholar]
- Bao, T.; Liu, S.; Bao, T.; Shufen, L. Quality evaluation and analysis for domain software: Application to management information system of power plant. Inf. Softw. Technol. 2016, 78, 53–65. [Google Scholar] [CrossRef]
- Yoojung, C. A Study on the Effect of Bargaining Power on Partnership, Information Quality, and SCM Features. Manag. Inf. Syst. Rev. 2015, 34, 171–189. [Google Scholar] [CrossRef]
- Çiftçioğlu, E.N.; Michaloliakos, A.; Psounis, K.; La Porta, T.F.; Yener, A. Power minimization with quality-of-information outages. In Proceedings of the 2014 IEEE Wireless Communications and Networking Conference (WCNC), Istanbul, Turkey, 6–9 April 2014; pp. 1655–1660. [Google Scholar]
- 3Castro, M.F.; Bragança, L.; Machado, B.; Andrade, J.; Bragança, L. European legislation and incentives programmes for demand Side management. Sol. Energy 2019, 200, 114. [Google Scholar] [CrossRef] [Green Version]
- Barney, G.; Anselm, S. The Discovery of Grounded Theory: Strategies for Qualitative Research; Aldine de Gruyter: New York, NY, USA, 1968. [Google Scholar]
- Bi, A.; Luo, Z.; Kong, Y.; Zhao, L. Comprehensive weighted matter-element extension method for the safety evaluation of underground gas storage. R. Soc. Open Sci. 2020, 7, 191302. [Google Scholar] [CrossRef] [Green Version]
- Shahzad, K.; Jianqiu, Z.; Hashim, M.; Nazam, M.; Wang, L. Impact of using information and communication technology and renewable energy on health expenditure: A case study from Pakistan. Energy 2020, 204, 117956. [Google Scholar] [CrossRef]
- Ramandi, M.Y.; Afshar, K.; Gazafroudi, A.S.; Bigdeli, N. Reliability and economic evaluation of demand side management programming in wind integrated power systems. Int. J. Electr. Power Energy Syst. 2016, 78, 258–268. [Google Scholar] [CrossRef]
- Tolulope, O.A.; Peter, O.O.; Olubayo, M.B. Techno-economic and environmental evaluation of demand side management techniques for rural electrification in Ibadan, Nigeria. Int. J. Energy Environ. Eng. 2014, 5, 375–385. [Google Scholar]
- Eissa, M.M. Demand side management program evaluation based on industrial and commercial field data. Energy Policy 2011, 39, 5961–5969. [Google Scholar] [CrossRef]
- Medici, V.; Salani, M.; Nespoli, L.; Giusti, A.; Derboni, M.; Vermes, N.; Rizzoli, A.E.; Rivola, D. Evaluation of The Potential Of Electric Storage Using Decentralized Demand Side Management Algorithms. Energy Procedia 2017, 135, 203–209. [Google Scholar] [CrossRef]
Figure 1.
Main content of demand side management (DSM) information.

Figure 2.
Grounded theory approach research process.

Figure 3.
Coding process.

Figure 4.
Process of open coding.

Figure 5.
Relational structure model of influencing factors of power demand side information quality.
Figure 5.
Relational structure model of influencing factors of power demand side information quality.


Table 1.
Results of open coding.
| Category | Initial Concept |
|---|---|
| A1 daily load data | a1 social event, a2 holiday, a3 workday |
| A2 geo-environmental information | a4 geographical position, a5 regional differences, a6 terrain differences |
| A3 meteorological information | a7 temperature, a8 rainfall, a9 season change, a10 weather |
| A4 economic development data | a11 urbanization level, a12 industrialization level, a13 population resources, a14 economic status |
| A5 power price information | a15 power price reform, a16 time-of-use power price, a17 peak-valley power price |
| A6 rate of deviation from power forecast | a18 load forecasting method, a19 data mining analysis techniques, a20 forecast model |
| A7 production load information | a21 production plan, a22 production law, a23 sustained and stable power consumption |
| A8 traceability of large power users | a24 power for large industrial users, a25 high-power mechanical electricity, a26 large user equipment operating status, a27 high energy user, a28 small hydropower management |
| A9 reliability of data sources | a29 original data, a30 data availability |
| A10 power collection information | a31 electrical energy collection, a32 terminal power efficiency |
| A11 deviation rates of real-time monitoring | a33 abnormal power consumption, a34 power theft monitoring, a35 monitoring of metering unit operation, a36 distribution monitoring, a37 grid quality monitoring, a38 energy efficiency assessment |
| A12 authenticity of user information | a39 regularity of life, a40 power consumption habits, a41 consumer behavior, a42 power consumption mode |
| A13 confidentiality | a43 user information collection security, a44 user privacy |
| a14 timeliness of user response | a45 perceived risk, a46 power price budget, a47 power consumption adjustment |
| A15 user service interactivity | a48 user warranty, a49 user complaints, a50 message reply, a51 online state grid app |
| A16 electrical safety | a52 safety protection technology, a53 safety management |
| A17 conditions of unit operating | a54 line loss, variable loss, power loss, a55 aging of equipment, a56 telecommunications equipment for grids |
| A18 energy consumption information | a57 equipment utilization, a58 energy information |
| A19 effectiveness of energy-saving equipment | a59 eco-friendly appliances, a60 energy-saving inverters, a61 energy storage equipment |
| A20 availability of energy saving technology | a62 renewable energy, a63 power substitution |
| A21 universality of energy saving promotion | a64 promotion of energy-saving lamps, a65 publicity efforts |
| A22 smart grid systematic | a66 automatic collection system, a67 terminal collection system, a68 automatic meter reading |
| A23 stability of load management | a69 voltage control systems, a70 reactive power compensation system |
| A24 ease of use | a71 collection of fundamental data, a72 power transmission and transformation equipment ledger |
| A25 rate of system upgrades | a73 internal update, a74 service system update, a75 work procedures update |
| A26 frequency of database maintenance | a76 safe operation, a77 low-level maintenance, a78 oracle database |
| A27 rationalization of the management system | a79 attribute management, a80 contract management, a81 oversight mechanisms, a82 festive care |
| A28 professionalism of managers | a83 managerial talent, a84 professional talent, a85 professionalism of employees |
| A29 personnel assessment system | a86 skills assessment, a87 power simulation training, a88 system of rewards and penalties, a89 team performance assessment |
| A30 relevance and comprehensiveness | a90 industry policy, a91 technical standard, a92 scientific and technical planning |
| A31 directional accuracy | a93 power gap, a94 consumption structure, a95 power market development |
| A32 correctness of interpretation | a96 brief analysis of power reform, a97 guideline, a98 restrictive measures |
| A33 status of start-up documents | a99 new projects, a100 annual development report, a101 enterprise credit evaluation |
| A34 fund information | a102 bank-enterprise direct connect, a103 budget management, a104 specific investment, a105 economic calculation |
Table 2.
Results of axials coding.
| Dimensions | Main Categories | Categories | Category Connotation |
|---|---|---|---|
| load information quality | B1 environmental information quality | A1 daily load data | Daily load type is categorized into weekdays, holidays, and public holidays, with obvious cyclicality. |
| A2 geo-environmental information | Differentiated and complex development across regions and provinces, varying levels of electricity access, and whether the geographic information of the area under their jurisdiction is documented | ||
| A3 meteorological information | Weather affects the demand and delivery of electricity, consideration of meteorological factors can improve load forecasting accuracy, and whether meteorological factors in the area under jurisdiction are well documented | ||
| A4 economic development data | GDP, industrial structure and other economic development data is the reference basis for power load forecast, and the load curve also reflects the development of the economy to a certain extent. | ||
| A5 power price information | Flexibility in power price adjustments is prompting customers to change their electricity consumption structure, e.g., Off-peak power price, time-of-use power price | ||
| B2 load forecasting information quality | A6 rate of deviation from power forecast | The accuracy of power system load prediction is related to the stability and safety of power system operation | |
| A7 production load information | There are many different types of production processes, plans and rules | ||
| A8 traceability of large power users | Power load of large users changes violently and stochastically, which can reflect historical experience and processing capacity | ||
| monitoring information quality | B3 real-time operating information quality | A9 reliability of data sources | Only authentic and reliable data content has the value of analysis; the data source of collection must be true and reliable |
| A10 power collection information | Electric energy collection information includes data collection, analysis of electricity consumption, automatic settlement of electricity bills, assessment optimization, etc. | ||
| A11 deviation rates of real-time monitoring | The efficiency information mined in real-time dynamic monitoring data and its utilization degree affect the lean level of power enterprises | ||
| B4 user information quality | A12 authenticity of user information | Different types of residents, business locations, resident loads, and industrial loads have different degrees of impact on the load | |
| A13 confidentiality | Theft of electricity information and data mutations caused by incorrect data can lead to poor data quality and loss of user benefits | ||
| A14 timeliness of user response | Electricity consumption of electricity users is directly related to the price of electricity, region, temperature, lifestyle and the psychology of the consumer. | ||
| A15 user service interactivity | To provide business support and services for users, to provide data basis for intelligent power consumption work, and to serve the information system of power users. | ||
| B5 infrastructure information quality | A16 electrical safety | Mainly includes the user’s power imbalance, voltage flicker and other safe operations of the power grid. | |
| A17 conditions of unit operating | Device problems can lead to economic loss of power, real-time monitoring is good for efficient and economical electricity consumption. | ||
| A18 energy consumption information | Analysis of the energy consumption information of the power equipment and the energy saving potential of the equipment can improve the terminal power consumption rate and carry out scientific energy efficiency management | ||
| B6 energy efficiency information quality | A19 effectiveness of energy-saving equipment | Advanced, high-efficiency power-saving devices to achieve lower power consumption, more efficient power use and lower emissions from improved user-side power efficiency. | |
| A20 availability of energy saving technology | Can the development of renewable energy represented by wind and solar power replace coal, oil, and other energy sources and reduce pollution? | ||
| A21 universality of energy saving promotion | Energy conservation and environmental protection propaganda efforts to influence users’ awareness of energy conservation and environmental protection and users’ constant pursuit of consumption reduction and efficient electricity consumption behavior. | ||
| management information quality | B7 system information quality | A22 smart grid systematic | The smart grid is a combination of power grid and information technology for reliable, safe, economical, efficient, and environmentally friendly operation. |
| A23 stability of load management | Making full use of modern remote telemetry and other technical equipment, in-depth load management is the only way to modernize and refine power demand-side management. | ||
| A24 ease of use | Mainly reflected in the system is easy to use and operate, flexible, and accurate response, etc. | ||
| A25 rate of system upgrades | The system needs to be upgraded in time, and the 100% update rate of the system can guarantee the compatibility and normal operation of the system. | ||
| A26 frequency of database maintenance | Regular maintenance of the system improves system functionality and solves problems that occur during system operation. | ||
| B8 organization information quality | A27 rationalization of the management system | It includes the scientificity, rationality, operability and management efficiency of the management system. | |
| A28 professionalism of managers | The power demand side management, technology research and development team, and the professional team of power demand side management, which are related to the scientific nature of demand management. | ||
| A29 personnel assessment system | Organizational management should be based on the principle of objectivity and fairness, and implement a multi-level, multi-channel, comprehensive, and institutionalized evaluation system | ||
| government planning information quality | B9 policy information quality | A30 comprehensive | Macro power purchase policy is a guide to ensure normal and orderly production and life of citizens, key enterprises, and cities |
| A31 correctness of interpretation | Policies often reflect industry trends, and the policies included in the power information database can provide direction to business users. | ||
| A32 correctness of interpretation | Good power policy interpretation helps users and enterprises to better understand national policies and helps the implementation of national policies. | ||
| B10 new planning information quality | A33 status of start-up documents | This specifically includes the acceptance and audit of new plants and new projects. | |
| A34 fund information | Investment attraction and capital implementation of enterprise projects is a key part of the enterprise’s ongoing projects. |
Table 3.
Typical relationships structure of main categories.
| Typical Relationship | Relationship Structure | Connotation |
|---|---|---|
| Environmental information quality→ power demand side information quality | Causal relationship | Power load forecast is sensitive to weather, temperature, and season. Different factors such as temperature, weather, and season will have a significant impact on the power load. Even slight weather and temperature changes will cause fluctuations in power load forecast data. |
| Load forecast information quality→ power demand side information quality | Causal relationship | The production plan of the enterprise obviously affects the power load, and timely and accurate load forecast for large users can optimize the supply and distribution structure, improve the efficiency of the power grid and reduce the destructive impact of power load changes on the grid. |
| Real-time information quality→ power demand side information quality | Causal relationship | Information on grid operation, electricity consumption, real-time data and residential power consumption helps provide a comprehensive technical solution for lean metering and lean management of the demand-side grid. |
| User information quality→ power demand side information quality | Causal relationship | Electricity data from electricity consumers is the basis for effective management of the demand side of the power supply, and information should be collected from all customers, and the quality of customer information has an important impact on the quality of management. |
| Infrastructure information quality→ power demand side information quality | Causal relationship | By comparing the theoretical line loss and variable loss rate of power grid lines with the actual line loss and variable loss rate calculated from the power voltage, load current, and other data on the terminal equipment on the demand side, the actual line loss can be calculated for the variable loss statistics. |
| Energy efficiency information quality→ power demand side information quality | Intermediary Relationships | Energy efficiency management, which has an indirect impact on the amount of losses in households and society through the upgrading of power consumption equipment and the R&D and use of renewable energy technologies and power equipment, increasing the efficiency of the use of available energy and the users’ awareness to save electricity. |
| System information quality→ power demand side information quality | Intermediary Relationships | Power demand-side professional information management and application systems can reasonably allocate power resources, while reducing power demand, alleviating environmental pressures, realizing energy conservation and consumption reduction, and achieving economic operation on the premise of ensuring grid security. |
| Organization information quality→ power demand side information quality | Intermediary Relationships | The science of the system set up in the power company, the professionalism of the managers, and the reasonable division of work all affect the demand side of electricity management process. Optimizing the organization and management of electric power enterprises and building a modern and reasonable organization and management model are conducive to the formation of a unified and coordinated whole. |
| Policy information quality→ power demand side information quality | Intermediary Relationships | Implementing demand-side management systems to achieve power plant construction, power grid construction, short- and medium- and long-term planning of power grid operation, which improves the quality of the lines and ensures the power safety for the masses, and indirectly affect the stability of demand-side management. |
| New planning information quality→ power demand side information quality | Intermediary Relationships | Demand-side management of electricity requires high-quality expertise in a wide range of areas. It requires not only professional equipment and technology but also a large amount of human resources and investment. In the current situation, the lack of long-term and stable policy support in the power market environment makes it difficult for demand-side management and large-scale demand response business. Both enterprises and government agencies need to expand their professional teams to meet management needs and set up special management funds at the same time. |
Table 4.
Design table of evaluation index of DSM information quality.
| Primary Indictors | Secondary Indictors | Tertiary Indictors | Type of Indictors | Interpretation |
|---|---|---|---|---|
| load information quality C1 | external environment information quality C11 | daily load informationC111 | qualitative | Whether daily load data is recorded and whether there is significant cyclicality |
| geo-environmental informationC112 | qualitative | Whether geo-environmental information under its jurisdiction is recorded? | ||
| meteorological informationC113 | qualitative | Whether the meteorological factors in the area under their jurisdiction are well documented | ||
| economic development information C114 | qualitative | Whether GDP, industrial structure, and other economic development data and their data records are complete | ||
| information of flexibility of power price C115 | qualitative | Whether the recorded power price has certain flexibility, whether the peak and valley power prices and real-time power prices are recorded. | ||
| load forecasting information quality C12 | rate of deviation from power forecast C121 | quantitative | Whether power system load forecasts reflect power load trends | |
| production load informationC122 | qualitative | Whether the data on the enterprise’s production process, planned categories, and production laws are recorded. | ||
| traceability of large power usersC123 | qualitative | Whether the data recorded by large power users reflect historical experience and processing capacity | ||
| monitoring information quality C2 | real-time operation information quality C21 | reliability of data sourcesC211 | qualitative | Whether the source of the collected data is reliable and whether the data is available |
| power collection informationC212 | qualitative | Whether the collected data is comprehensive and accurate | ||
| deviation rates of real-time monitoringC213 | quantitative | Whether the information record is real-time monitoring | ||
| users information quality C22 | authenticityC221 | qualitative | Whether the user information such as the address of residents and enterprises and the type of work is true or not | |
| confidentialityC222 | qualitative | Whether the user data is secure | ||
| timeliness of user response C223 | qualitative | Whether user response and information feedback are timely | ||
| user service interactivityC224 | qualitative | Whether there is feedback from users’ complaints, and whether users are satisfied with business support and service capabilities | ||
| infrastructure information quality C23 | electrical SafetyC231 | qualitative | Whether infrastructure equipment can ensure the safe operation and safe use of electricity | |
| plant operating conditionsC232 | qualitative | Whether the operating condition of the device is recorded and whether the data is complete. | ||
| energy consumption informationC233 | qualitative | Whether energy consumption information is recorded and well documented. | ||
| energy efficiency information quality C24 | effectiveness of energy-saving equipmentC241 | qualitative | Whether energy-saving devices reduce power consumption and emissions | |
| availability of energy-saving technologiesC242 | qualitative | Whether renewable energy is useful and can replace energy sources such as coal and oil. | ||
| universality of energy-saving promotionC243 | qualitative | whether energy saving publicity efforts can influence users’ awareness of energy saving and power consumption behavior | ||
| management information quality C3 | system information quality C31 | smart grid systematicC311 | qualitative | Whether the power grid is deeply integrated with information technology and whether the smart grid is systematically complete |
| system stabilityC312 | qualitative | Whether load management is stable and whether it meets the requirements of refined management of power demand side | ||
| ease of useC313 | qualitative | Ease of use of the system and variety of search paths | ||
| system upgrade rateC314 | quantitative | The system software should be the latest version and meet the standard | ||
| frequency of database maintenance C315 | quantitative | Whether the system is routinely maintained and whether the frequency of maintenance meets the operational requirements of the system | ||
| organization information quality C32 | reasonableness of the management systemC321 | qualitative | Whether the power demand-side information management system meets management requirements. | |
| professionalism of managersC322 | qualitative | Whether power demand-side information managers can handle specialized work | ||
| personnel assessment systemC323 | qualitative | The existence of a fair and scientific assessment system for managers | ||
| government planning information quality C4 | policy information quality C41 | comprehensivenessC411 | qualitative | Whether the policy covers all aspects of power management |
| relevanceC412 | qualitative | Whether the collected policies are relevant to grid planning, and whether there is irrelevant policy information | ||
| accuracy of directionC413 | qualitative | Whether the collected policies are correct and consistent with power development trends | ||
| correctness of interpretationC414 | qualitative | Whether the interpretation of the power policy is correct and easy to understand | ||
| new planning information quality C42 | status of start-up documents C421 | qualitative | Whether the audit and review comments of the new project of the enterprise are collected and whether there is a report on the commencement. | |
| fund informationC422 | qualitative | Whether the project funds of the enterprise are implemented, and whether the investment information is grasped |
Table 5.
Judgment matrix consistency and index weight table.
| Judgment Matrix | Weight Vector | |||
|---|---|---|---|---|
| G | 4.2343 | 0.0781 | 0.89 | (0.5556,0.3000,0.0940,0.0504) |
| A1 | 2.0000 | 0 | 0 | (0.2500,0.7500) |
| A2 | 4.0687 | 0.0229 | 0.89 | (0.5628,0.1079,0.2671,0.0622) |
| A3 | 2.0000 | 0 | 0 | (0.8889,0.1111) |
| A4 | 2.0000 | 0 | 0 | (0.2500,0.7500) |
| B11 | 5.3328 | 0.0831 | 1.12 | (0.2100,0.0646,0.4853,0.1002,0.1399) |
| B12 | 3.0387 | 0.01935 | 0.52 | (0.2605,0.6333,0.1062) |
| B21 | 3.0542 | 0.0271 | 0.52 | (0.1822,0.1149,0.7028) |
| B22 | 4.1923 | 0.0641 | 0.89 | (0.6366,0.1267,0.1404,0.0963) |
| B23 | 3.0948 | 0.0474 | 0.52 | (0.5321,0.3661,0.1018) |
| B24 | 3.0658 | 0.0329 | 0.52 | (0.7235,0.1932,0.0833) |
| B31 | 5.3915 | 0.0979 | 1.12 | (0.5490,0.1892,0.0800,0.0527,0.1291) |
| B32 | 3.0387 | 0.0193 | 0.52 | (0.2605,0.6333,0.1062) |
| B41 | 4.2013 | 0.0671 | 0.89 | (0.5011,0.2630,0.0768,0.1591) |
| B42 | 2.0000 | 0 | 0 | (0.6667,0.3333) |
Table 6.
Score intervals of quantitative indexes.
| Quantitative Indexes | Level | ||||
|---|---|---|---|---|---|
| Excellent | Good | General | Poor | Very Poor | |
| Deviation rate of power forecasts | (0.5%) | (5%,10%) | (10%,20%) | (20%,30%) | (30%,100%) |
| Power collection information | (30%,100%) | (20%,30%) | (10%,20%) | (5%,10%) | (0,5%) |
| deviation rates of real-time monitoring | (0.5%) | (5%,10%) | (10%,20%) | (20%,30%) | (30%,100%) |
| System upgrade rate | (30%,100%) | (20%,30%) | (10%,20%) | (5%,10%) | (0,5%) |
| Database maintenance rate | (30%,100%) | (20%,30%) | (10%,20%) | (5%,10%) | (0,5%) |
Table 7.
Indexes scores.
| Tertiary Indexes | Variables | Average Scores |
|---|---|---|
| daily load data | C111 | 88 |
| geo-environmental information | C112 | 76 |
| meteorological information | C113 | 92 |
| economic development information | C114 | 86 |
| information of flexibility of power price | C115 | 83 |
| rate of deviation from power forecast [%] | C121 | 3 |
| production load information | C122 | 82 |
| traceability of large power users | C123 | 78 |
| reliability of data sources | C211 | 94 |
| power collection information [%] | C212 | 90 |
| deviation rates of real-time monitoring [%] | C213 | 2 |
| authenticity | C221 | 92 |
| confidentiality | C222 | 93 |
| timeliness of user response | C223 | 78 |
| user service interactivity | C224 | 76 |
| electrical safety | C231 | 88 |
| plant operating conditions | C232 | 92 |
| energy consumption information | C233 | 82 |
| effectiveness of energy-saving equipment | C241 | 75 |
| availability of energy-saving technologies | C242 | 78 |
| universality of energy-saving promotion | C243 | 76 |
| smart grid systematic | C311 | 92 |
| system stability | C312 | 94 |
| ease of use | C313 | 86 |
| system upgrade rate [%] | C314 | 95 |
| frequency of database maintenance [%] | C315 | 85 |
| reasonableness of the management system | C321 | 85 |
| professionalism of managers | C322 | 82 |
| personnel assessment system | C323 | 77 |
| comprehensiveness | C411 | 88 |
| relevance | C412 | 92 |
| accuracy of direction | C413 | 86 |
| correctness of interpretation | C414 | 82 |
| status of start-up documents | C421 | 75 |
| fund information | C422 | 78 |
Table 8.
Correlation function value of information quality level on the power demand side.
| Indexes | Grade | ||||
|---|---|---|---|---|---|
| Excellent | Good | General | Poor | Very Poor | |
| daily load dataC111 | −0.143 | 0.2 | −0.4 | −0.6 | −0.7 |
| Geo-environmental informationC112 | −0.368 | −0.143 | 0.4 | −0.2 | −0.4 |
| meteorological informationC113 | 0.2 | −0.2 | −0.6 | −0.733 | −0.8 |
| economic development informationC114 | −0.222 | 0.4 | −0.3 | −0.533 | −0.65 |
| information of flexibility of power priceC115 | −0.292 | 0.3 | −0.15 | −0.433 | −0.575 |
| rate of deviation from power forecastC121 | 0.4 | −0.4 | −0.76 | −0.867 | −0.9 |
| production load informationC122 | −0.308 | 0.2 | −0.1 | −0.4 | −0.55 |
| traceability of large power usersC123 | −0.353 | −0.083 | 0.2 | −0.267 | −0.45 |
| reliability of data sourcesC211 | 0.4 | −0.6 | −0.8 | −0.867 | −0.9 |
| power collection informationC212 | 0.4 | −0.6 | −0.84 | −0.911 | −0.933 |
| deviation rates of real-time monitoringC213 | 0.895 | 0.889 | −0.879 | −0.862 | 0.143 |
| authenticityC221 | 0.2 | −0.2 | −0.6 | −0.733 | −0.8 |
| confidentialityC222 | 0.3 | −0.3 | −0.65 | −0.767 | −0.825 |
| timeliness of user responseC223 | −0.353 | −0.083 | 0.2 | −0.267 | −0.45 |
| user service interactivityC224 | −0.368 | −0.143 | 0.4 | −0.2 | −0.4 |
| electrical safetyC231 | −0.143 | 0.2 | −0.4 | −0.6 | −0.7 |
| plant operating conditionsC232 | 0.2 | −0.2 | −0.6 | −0.733 | −0.8 |
| energy consumption informationC233 | −0.308 | 0.2 | −0.1 | −0.4 | −0.55 |
| effectiveness of energy-saving equipmentC241 | −0.375 | −0.167 | 0.5 | −0.167 | −0.375 |
| availability of energy-saving technologiesC242 | −0.353 | −0.083 | 0.2 | −0.267 | −0.45 |
| universality of energy-saving promotionC243 | −0.369 | −0.144 | 0.4 | −0.2 | −0.4 |
| smart grid systematicC311 | 0.2 | −0.2 | −0.6 | −0.73 | −0.8 |
| system stability C312 | 0.4 | −0.4 | −0.7 | −0.8 | −0.85 |
| ease of useC313 | −0.222 | 0.4 | −0.3 | −0.533 | −0.65 |
| system upgrade rateC314 | 0.947 | 0.944 | −0.934 | −0.931 | 0.071 |
| frequency of database maintenanceC315 | 0.842 | 0.833 | −0.818 | −0.793 | 0.214 |
| reasonableness of the management systemC321 | −0.25 | 0.5 | −0.25 | −0.5 | −0.625 |
| professionalism of managersC322 | −0.308 | 0.2 | −0.1 | −0.4 | −0.55 |
| personnel assessment systemC323 | −0.361 | −0.115 | 0.3 | −0.233 | −0.425 |
| comprehensivenessC411 | −0.143 | 0.2 | −0.4 | −0.6 | −0.7 |
| relevanceC412 | 0.2 | −0.2 | −0.6 | −0.733 | −0.8 |
| accuracy of directionC413 | −0.222 | 0.4 | −0.3 | −0.533 | −0.65 |
| correctness of interpretationC414 | −0.308 | 0.2 | −0.1 | −0.4 | −0.55 |
| status of start-up documentsC421 | −0.375 | −0.167 | 0.5 | −0.167 | −0.375 |
| fund informationC422 | −0.353 | −0.083 | 0.2 | −0.267 | −0.45 |
Table 9.
Evaluation result of information quality on power demand-side.
| Excellent | Good | General | Poor | Very Poor | Result of Extension Evaluation | |
|---|---|---|---|---|---|---|
| overall assessment | 0.0763 | 0.0431 | −0.2947 | −0.7345 | −0.7751 | excellent |
© 2020 by the authors. Licensee MDPI, Basel, Switzerland. This article is an open access article distributed under the terms and conditions of the Creative Commons Attribution (CC BY) license (http://creativecommons.org/licenses/by/4.0/).
Share and Cite
MDPI and ACS Style
Zhu, Y.; Zhou, Z. Research on Power Demand Side Information Quality Indicators and Evaluation Based on Grounded Theory Approach. Information 2020, 11, 477. https://0-doi-org.brum.beds.ac.uk/10.3390/info11100477
AMA Style
Zhu Y, Zhou Z. Research on Power Demand Side Information Quality Indicators and Evaluation Based on Grounded Theory Approach. Information. 2020; 11(10):477. https://0-doi-org.brum.beds.ac.uk/10.3390/info11100477
Chicago/Turabian StyleZhu, Yiping, and Zan Zhou. 2020. "Research on Power Demand Side Information Quality Indicators and Evaluation Based on Grounded Theory Approach" Information 11, no. 10: 477. https://0-doi-org.brum.beds.ac.uk/10.3390/info11100477
Note that from the first issue of 2016, this journal uses article numbers instead of page numbers. See further details here.