
Edge Detecting Method for Microscopic Image of Cotton Fiber Cross-Section Using RCF Deep Neural Network

School of Electronic Information, Wuhan University, Wuhan 430072, China
*
Author to whom correspondence should be addressed.
Information 2021, 12(5), 196; https://0-doi-org.brum.beds.ac.uk/10.3390/info12050196
Submission received: 13 April 2021
/
Revised: 27 April 2021
/
Accepted: 27 April 2021
/
Published: 29 April 2021
Abstract
:Currently, analyzing the microscopic image of cotton fiber cross-section is the most accurate and effective way to measure its grade of maturity and then evaluate the quality of cotton samples. However, existing methods cannot extract the edge of the cross-section intact, which will affect the measurement accuracy of maturity grade. In this paper, a new edge detection algorithm that is based on the RCF convolutional neural network (CNN) is proposed. For the microscopic image dataset of the cotton fiber cross-section constructed in this paper, the original RCF was firstly used to extract the edge of the cotton fiber cross-section in the image. After analyzing the output images of RCF in each convolution stage, the following two conclusions are drawn: (1) the shallow layers contain a lot of important edge information of the cotton fiber cross-section; (2) because the size of the cotton fiber cross-section in the image is relatively small and the receptive field of the convolutional layer gradually increases with the deepening of the number of layers, the edge information detected by the deeper layers becomes increasingly coarse. In view of the above two points, the following improvements are proposed in this paper: (1) modify the network supervision model and loss calculation structure; (2) the dilated convolution in the deeper layers is removed; therefore, the receptive field in the deeper layers is reduced to adapt to the detection of small objects. The experimental results show that the proposed method can effectively improve the accuracy of edge extraction of cotton fiber cross-section.
1. Introduction
Cotton is one of the most important crops in the world. It is widely used in industrial production and daily life because of its wide planting range, large yield, and low production cost. Being affected by varieties, planting environment, climate, weather, and other factors, the physical and chemical properties of cotton fibers will be different, which directly affects the quality of cotton and cotton products [1,2,3,4]. Evaluating the quality of cotton objectively and accurately is of great significance for making full use of cotton with different quality, designing optimal production processes, and improving the quality of cotton products. At present, many different indicators using for detecting the quality of cotton fiber have been presented, in which the maturity of cotton fibers is most important because it is closely related to color, strength, toughness, dyeability, and hygroscopicity of cotton. Therefore, detecting the maturity of cotton fiber has become the most important method of evaluating the quality of cotton [5].
Currently, the methods of detecting the maturity of cotton fiber include indirect detecting methods and direct detecting methods. Indirect detecting methods include sensory detection, polarized light-detecting, and airflow instrument detecting, etc. [6,7,8]. Direct detecting methods mainly include FIAS (Fiber Image Analysis System), cotton fibers cavity/wall contrasting, longitudinal morphology analyzing, and cross-section analyzing [2,9,10]. The direct detection method is more accurate than the indirect detection method in general, and the cross-section analysis that is based on microscopic image processing of cotton fibers is widely used and the most accurate direct detecting method.
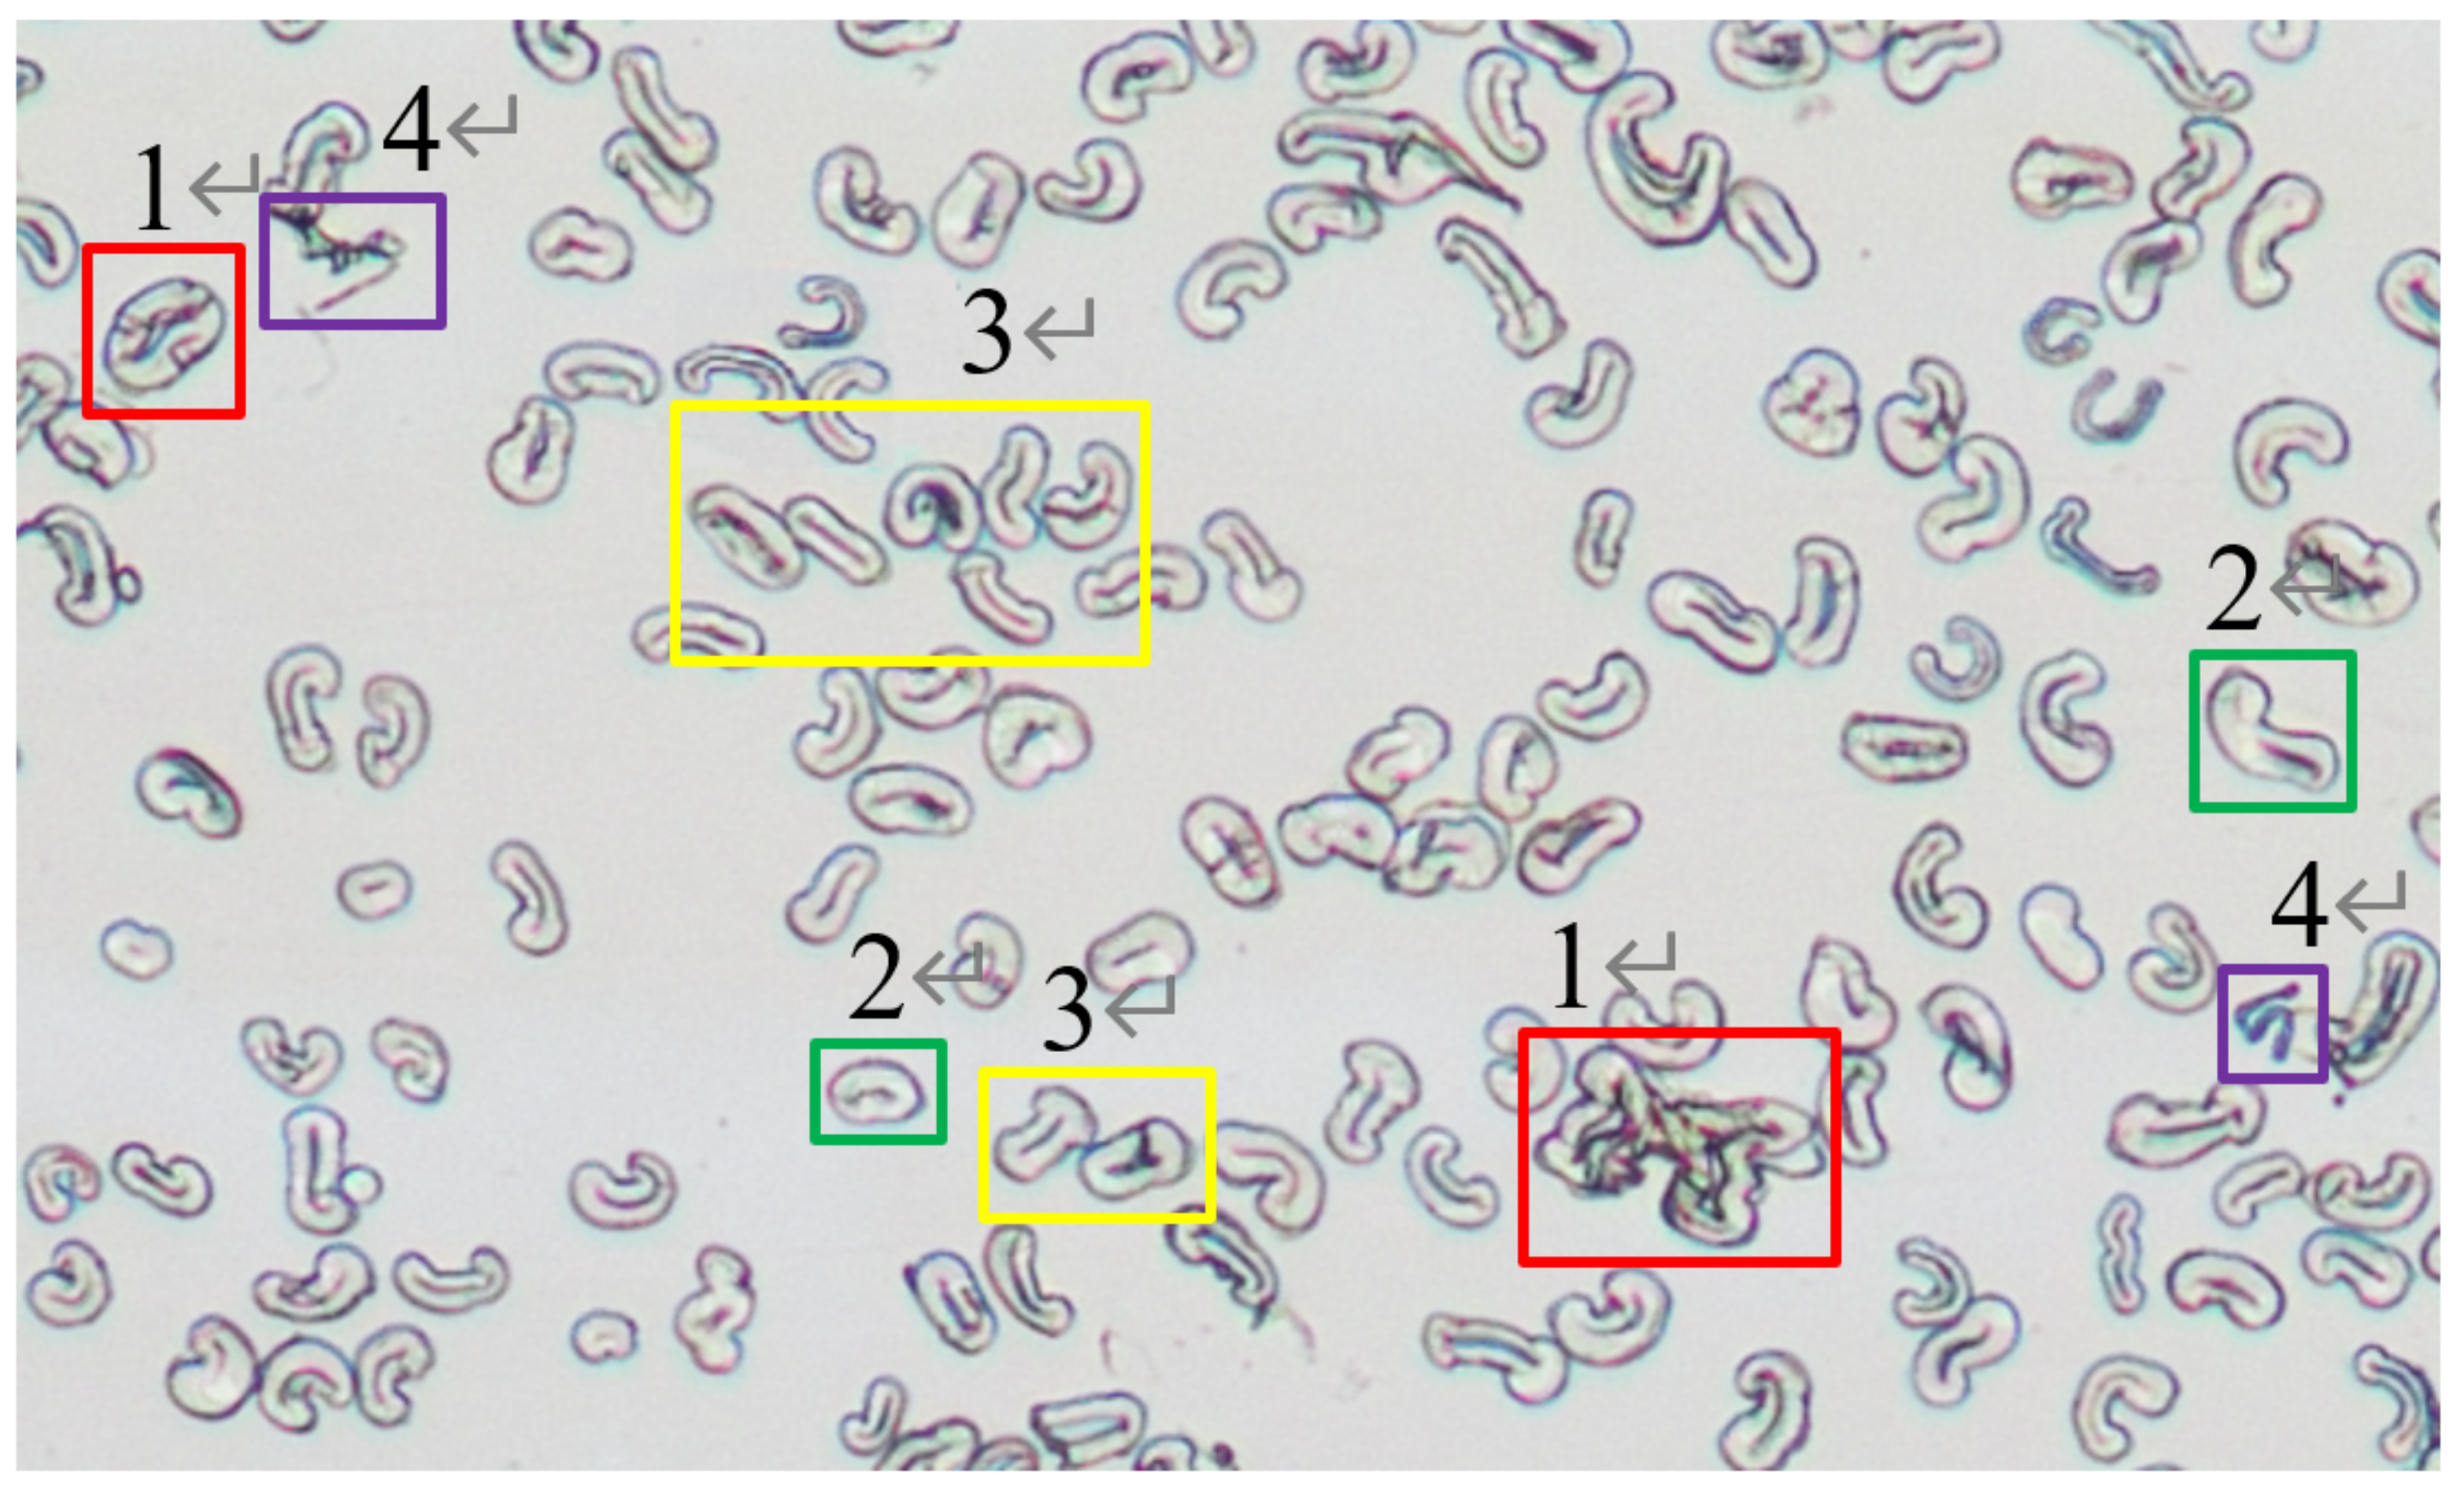
The cotton fiber cross-section analyzing method requires making the cross-sectional microscopic slide of the cotton sample firstly [11]. Subsequently, the microscopic image of the cotton fibers’ cross-sections is captured by microscope and CCD camera, and the maturity of each cotton fiber is analyzed by image processing method. Finally, the quality of the cotton sample is evaluated according to the statistical indicators of all the cotton fiber maturity. To analyze the cotton fiber maturity through a microscopic image of their cross-sections, it is necessary to extract the edge and features of the image area of each cotton fiber cross-section. From features of edge and image area, the growth status and maturity of the cotton fiber can be calculated. However, low contrast and high background noise are the main characteristics of microscopic image of cotton fiber cross-section, so it is difficult to extract an accurate edge using the traditional global threshold and local threshold image segmentation methods, as well as edge detection operators, such as Canny, Prewitt, Sobel, etc. Besides, the following problems may occur in the process of microscopic slide making and image capturing: (1) the cross-section of cotton fiber is scratched and damaged by the blade in the process of making the slide; (2) parts of the edge of the cross-section are a blur for uneven illumination or inaccurate microscope focusing; (3) some cross-sections of cotton fiber adhere to each other; and, (4) there are impurities in slides. Figure 1 shows the microscopic image, and the rectangular areas that are noted by 1–4 indicate four types of problems discussed above, respectively. Among them, problem (3) is more serious, because the number of cross-sections adhered to each other is usually large (about 44.6% in Figure 1). Extracting the edges of those cross-sections accurately may effectively improve the accuracy of evaluating their maturity.
Some scholars have presented different edge detecting methods for the cotton fiber cross-section. B. Xu used the local dynamic threshold segmentation method to detect the edge of cotton fiber cross-section [12]. Yan Wan designed a double-threshold image segmentation method, in which the advantages of global threshold and local threshold are comprehensively utilized. Xiaowen Guo used the adaptive threshold image segmentation method to detect the edge of the cross-section [11]. Quande Wang used the per-pixel adaptive dynamic threshold image segmentation method to extract the edge of cross-sections, and the Couple-Contour Model (CCM) is designed to describe the features of the cotton fiber cross-section that can be used to remove the wrong parts of edge extracted and repair defects on edge [13]. The performance of the above methods is good when the quality of the image is great enough. However, it is difficult to extract accurate and complete edges under conditions, such as if the edge of the cross-section is damaged, local blur, or adhered to each other, which will affect the accuracy of quality evaluating for cotton sample. Besides, it is necessary to analyze and calculate the maturity of cotton fibers in the cotton samples to be tested as more as possible in order to improve the accuracy of quality evaluating of cotton sample. However, an increased number of cotton fibers will further increase the opportunity that cross-sections have adhered to each other in the slide. Therefore, it is vital to study and design a better edge extracting method to improve the detection accuracy of cotton quality.
With the development of computer hardware and a great improvement in computing power, deep learning (DL) has been successfully applied in image edge extraction, image segmentation [14,15], image classification [16,17], object detection [18,19], tracking, etc. When compared with the traditional edge detecting methods, the deep neural network can learn stable image features with high distinguishing ability, different levels, and different scales that are beneficial for edge detecting. At present, edge detection methods that are based on deep neural network include Deepedge [20], N4-Fields [21], HED [22], RCF [23], etc. Among those methods, RCF has the best performance on the typical datasets for edge detecting testing, such as BSDS500, NYUD, and Multicue.
In this paper, we propose an edge information extraction method that is based on RCF. We first adopted the standard RCF for training and detection, according to the characteristics of the cotton fiber cross-section in the microscopic image. After analyzing the output images of RCF in each convolution stage, we draw the following two conclusions: (1) the shallow convolution layers of CNN learn the image features related to the edge of the cross-section of cotton fiber; (2) with the increase of the receptive field, the edge features learned from the deeper convolution layers become more and more coarse. Therefore, for the edge extraction of the cotton fiber cross-section, this paper makes the following two modifications to RCF: (1) modify the network supervision model and loss calculation structure; (2) the dilated convolution in the last convolution stage in RCF is removed. From the experimental results, the method that is presented in this paper can more accurately extract the edge of cross-sections, and it can especially improve the accuracy of edge extracting for cross-sections adhered to each other.
2. Process of Evaluating Maturity of Cotton Fiber by Image Analyzing
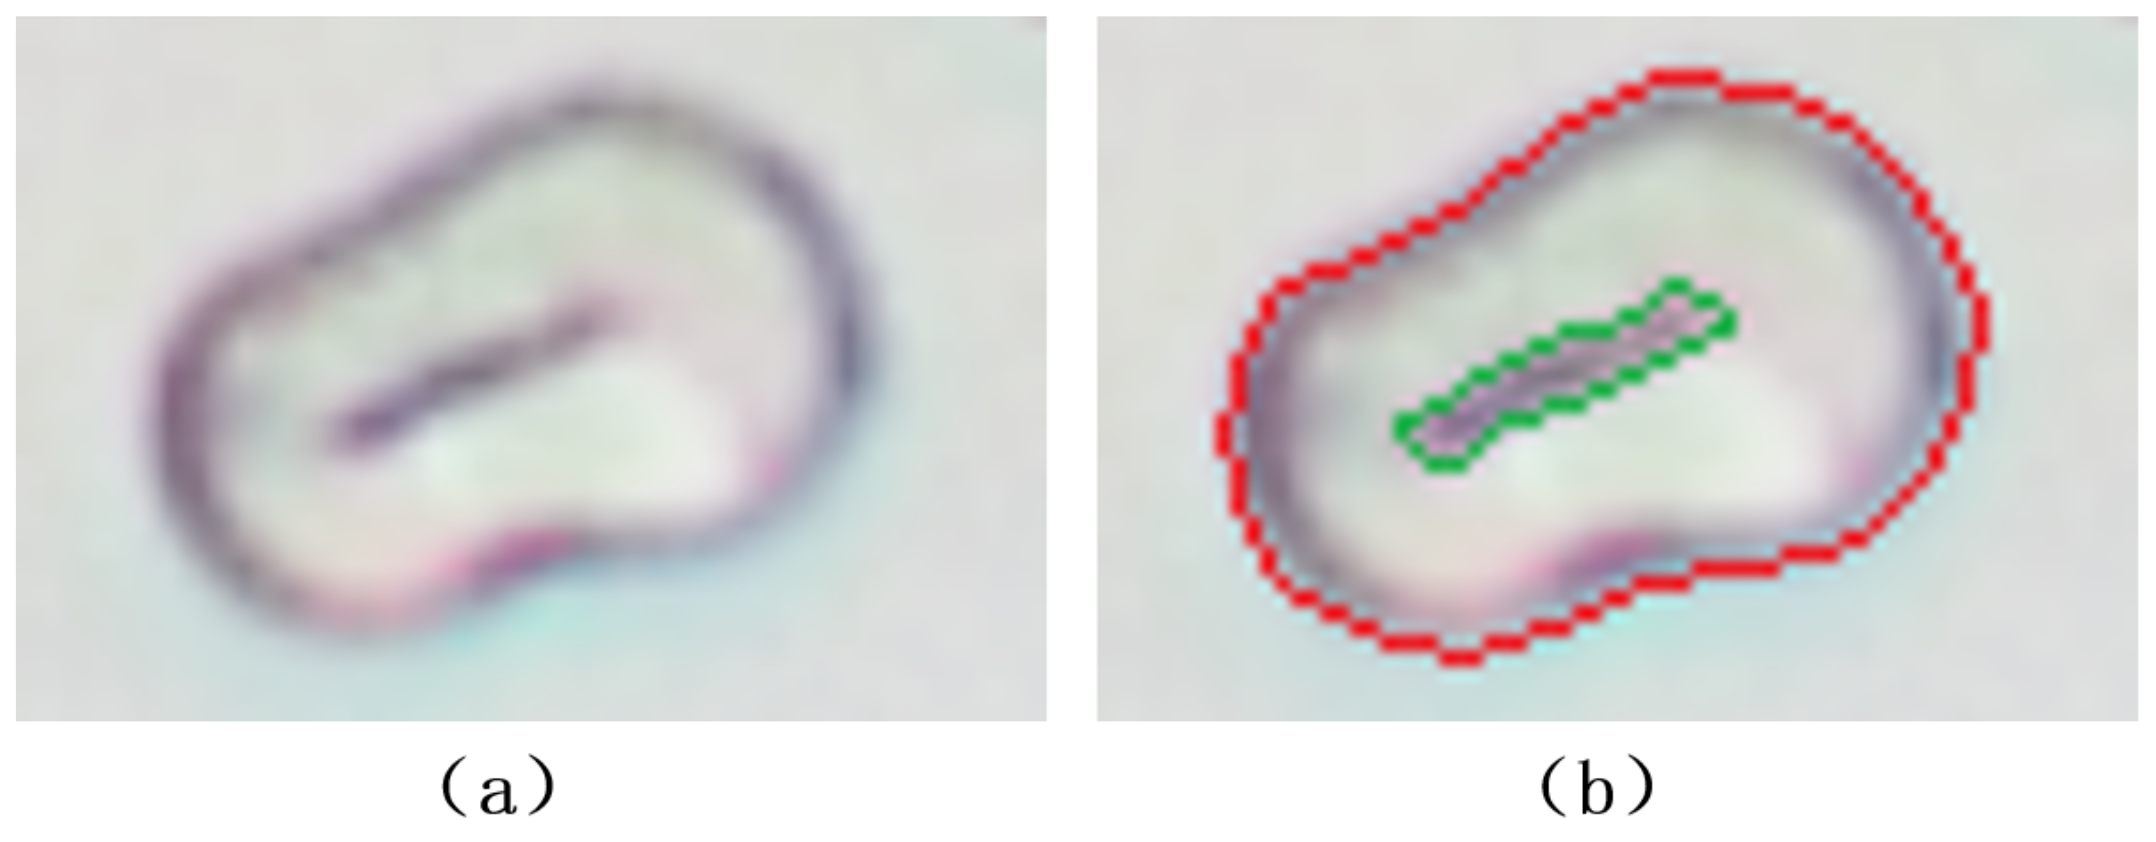
Each cotton fiber has an inner cavity, and the cotton fiber with higher maturity has a smaller inner cavity generally. Figure 2 shows microscopic image of a single cotton fiber cross-section. In Figure 2, (a) is microscopic image of a cotton fiber cross-section. (b) represents the edges that are used for maturity evaluating: the red line is the outer edge of the cross-section (denoted by ) and the green line is the edge of the inner cavity (denoted by ).
Let A (·) and P (·) denote functions to calculate the area and perimeter of the image region enclosed by an edge, respectively, then the maturity of the cotton fiber, as denoted by , can be calculated according to its outer edge and inner edge [24] by Formula (1):
Through manual analysis and statistics, in general, the value of cotton fiber with higher maturity is greater than 0.6; cotton fiber with low maturity is between 0.3 to 0.6; and, dead cotton fiber is less than 0.3 [11].
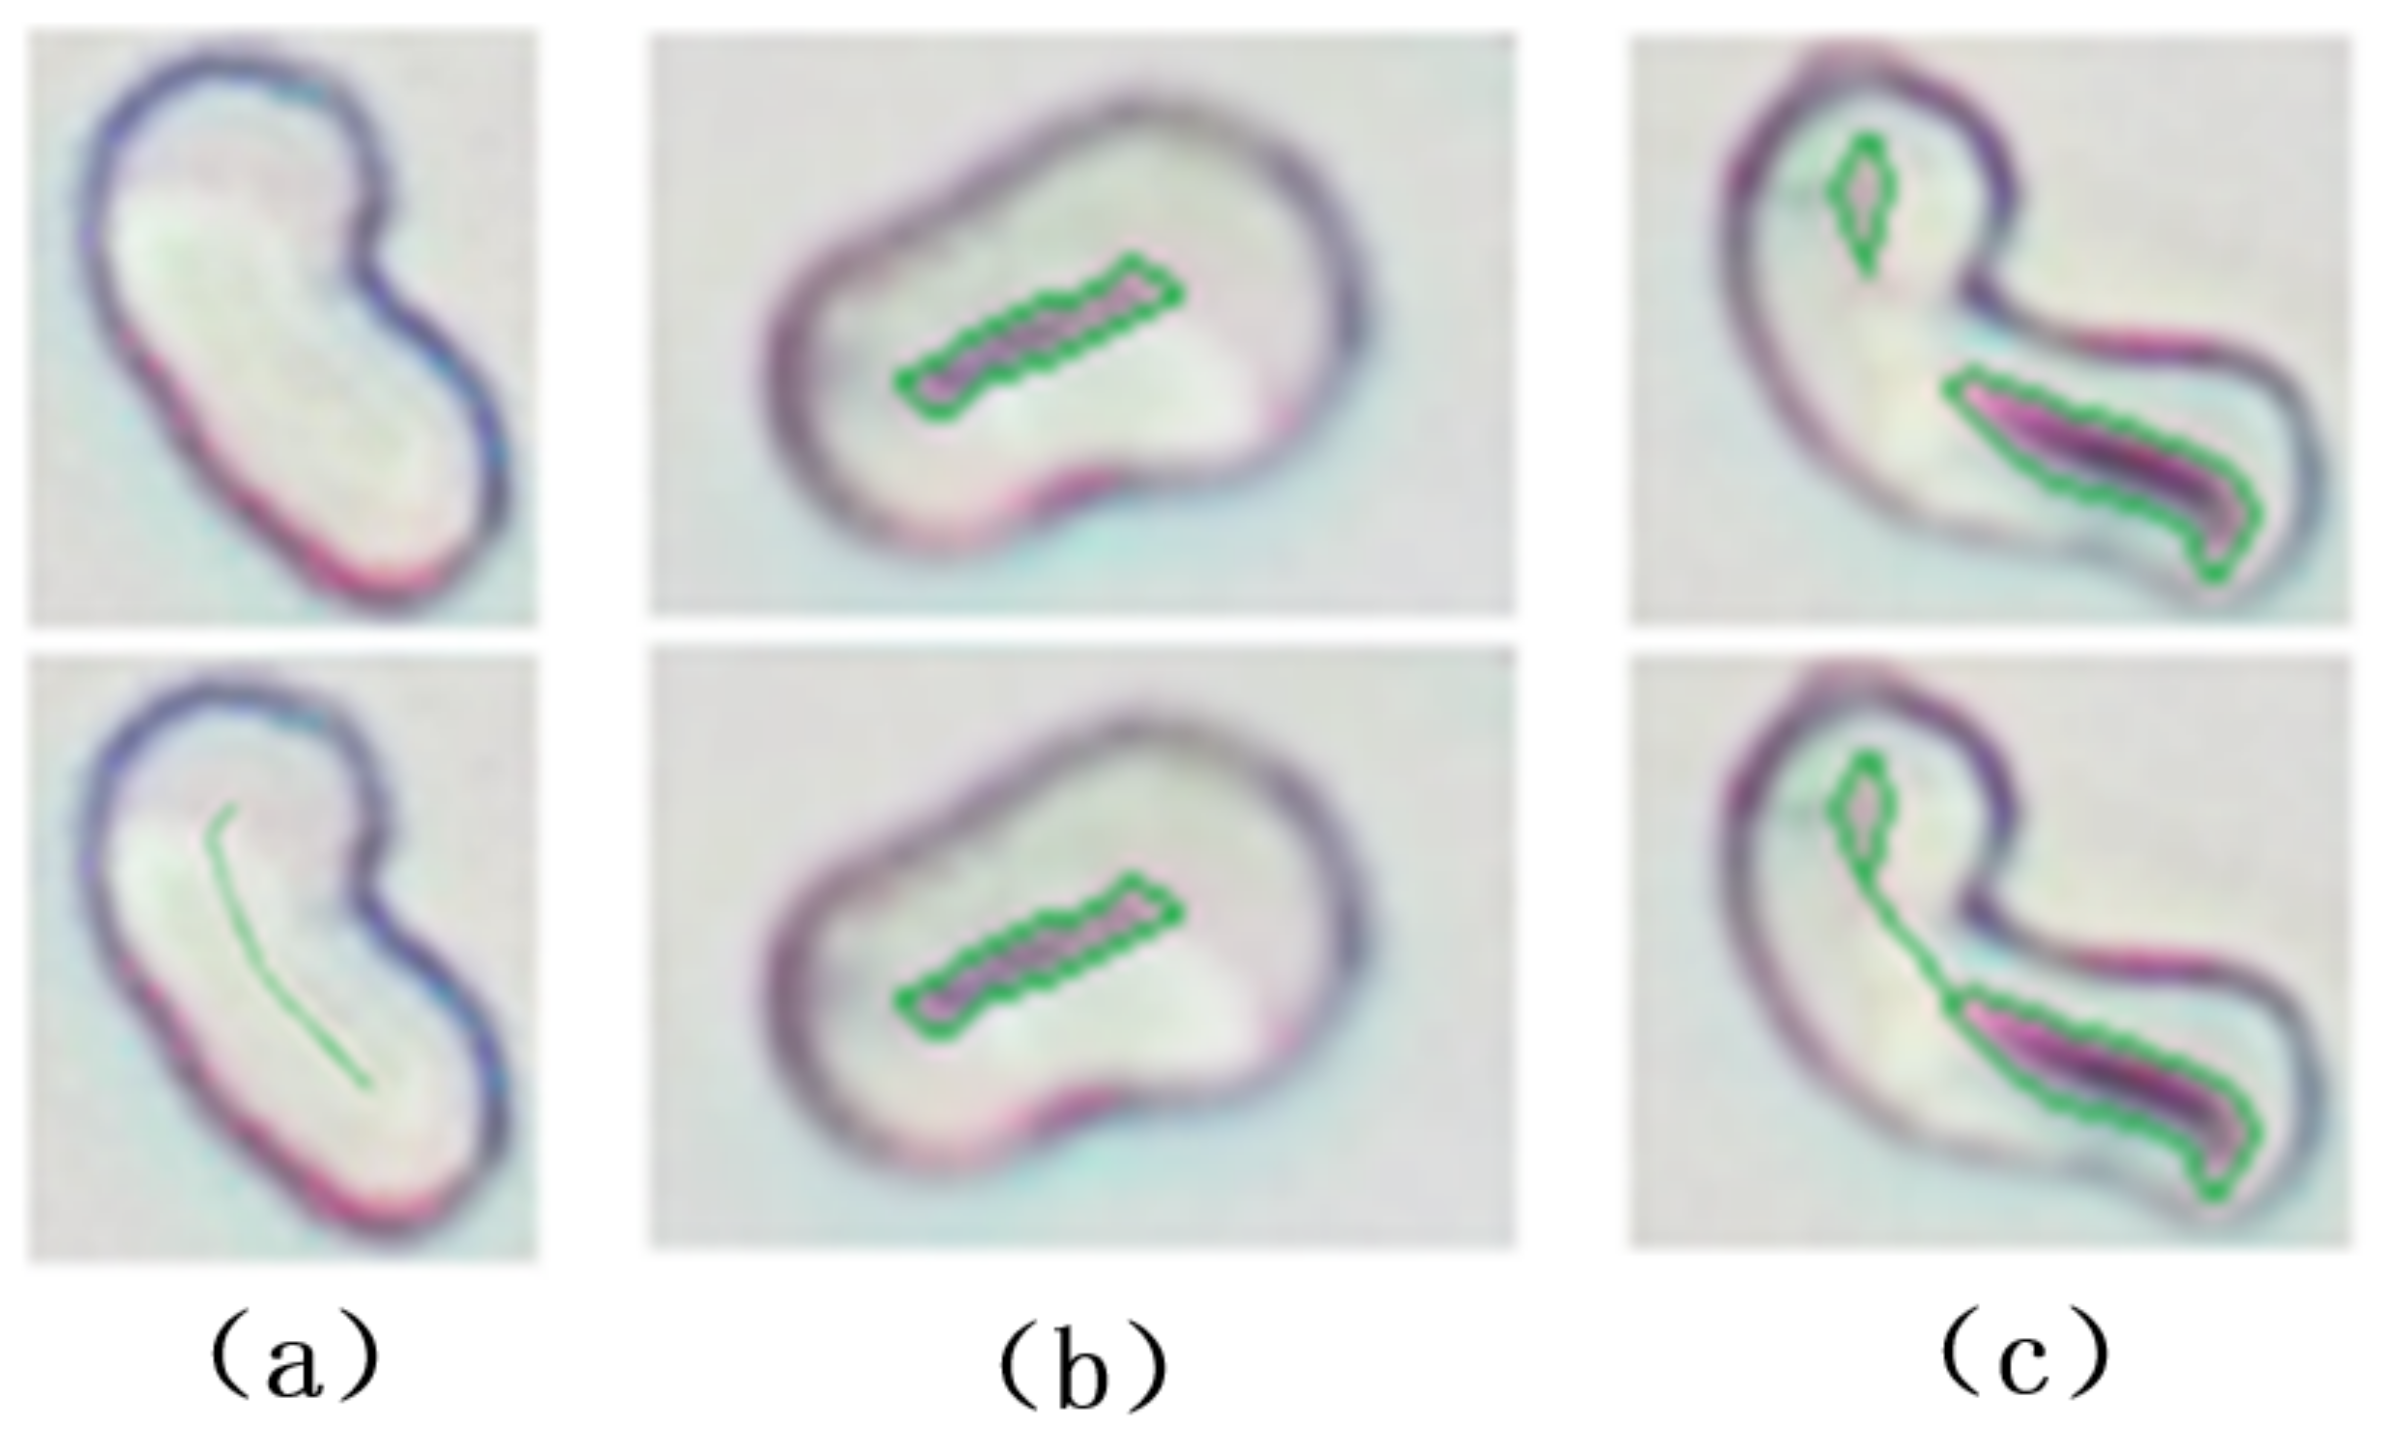
However, the quality of microscopic imaging and damage in slide making may result in being inner edge broken, or even disappeared, as shown in Figure 3. Therefore, after extracting the outer edge, it needs to process an inner edge: if there is no inner edge found, the skeleton of the region enclosed by the outer edge extracted as the inner edge; if the inner edge is broken, then multiple fragments of the inner edge are connected with lines to form whole inner edge [13]. Figure 3 shows the processing results.
If the number of cotton fibers in a cotton sample under test is denoted by , the set of their maturity calculated by Formula (1) is denoted by , and its mean and standard deviation are denoted by and , respectively, then the skewness of it can be calculated by Formula (2):
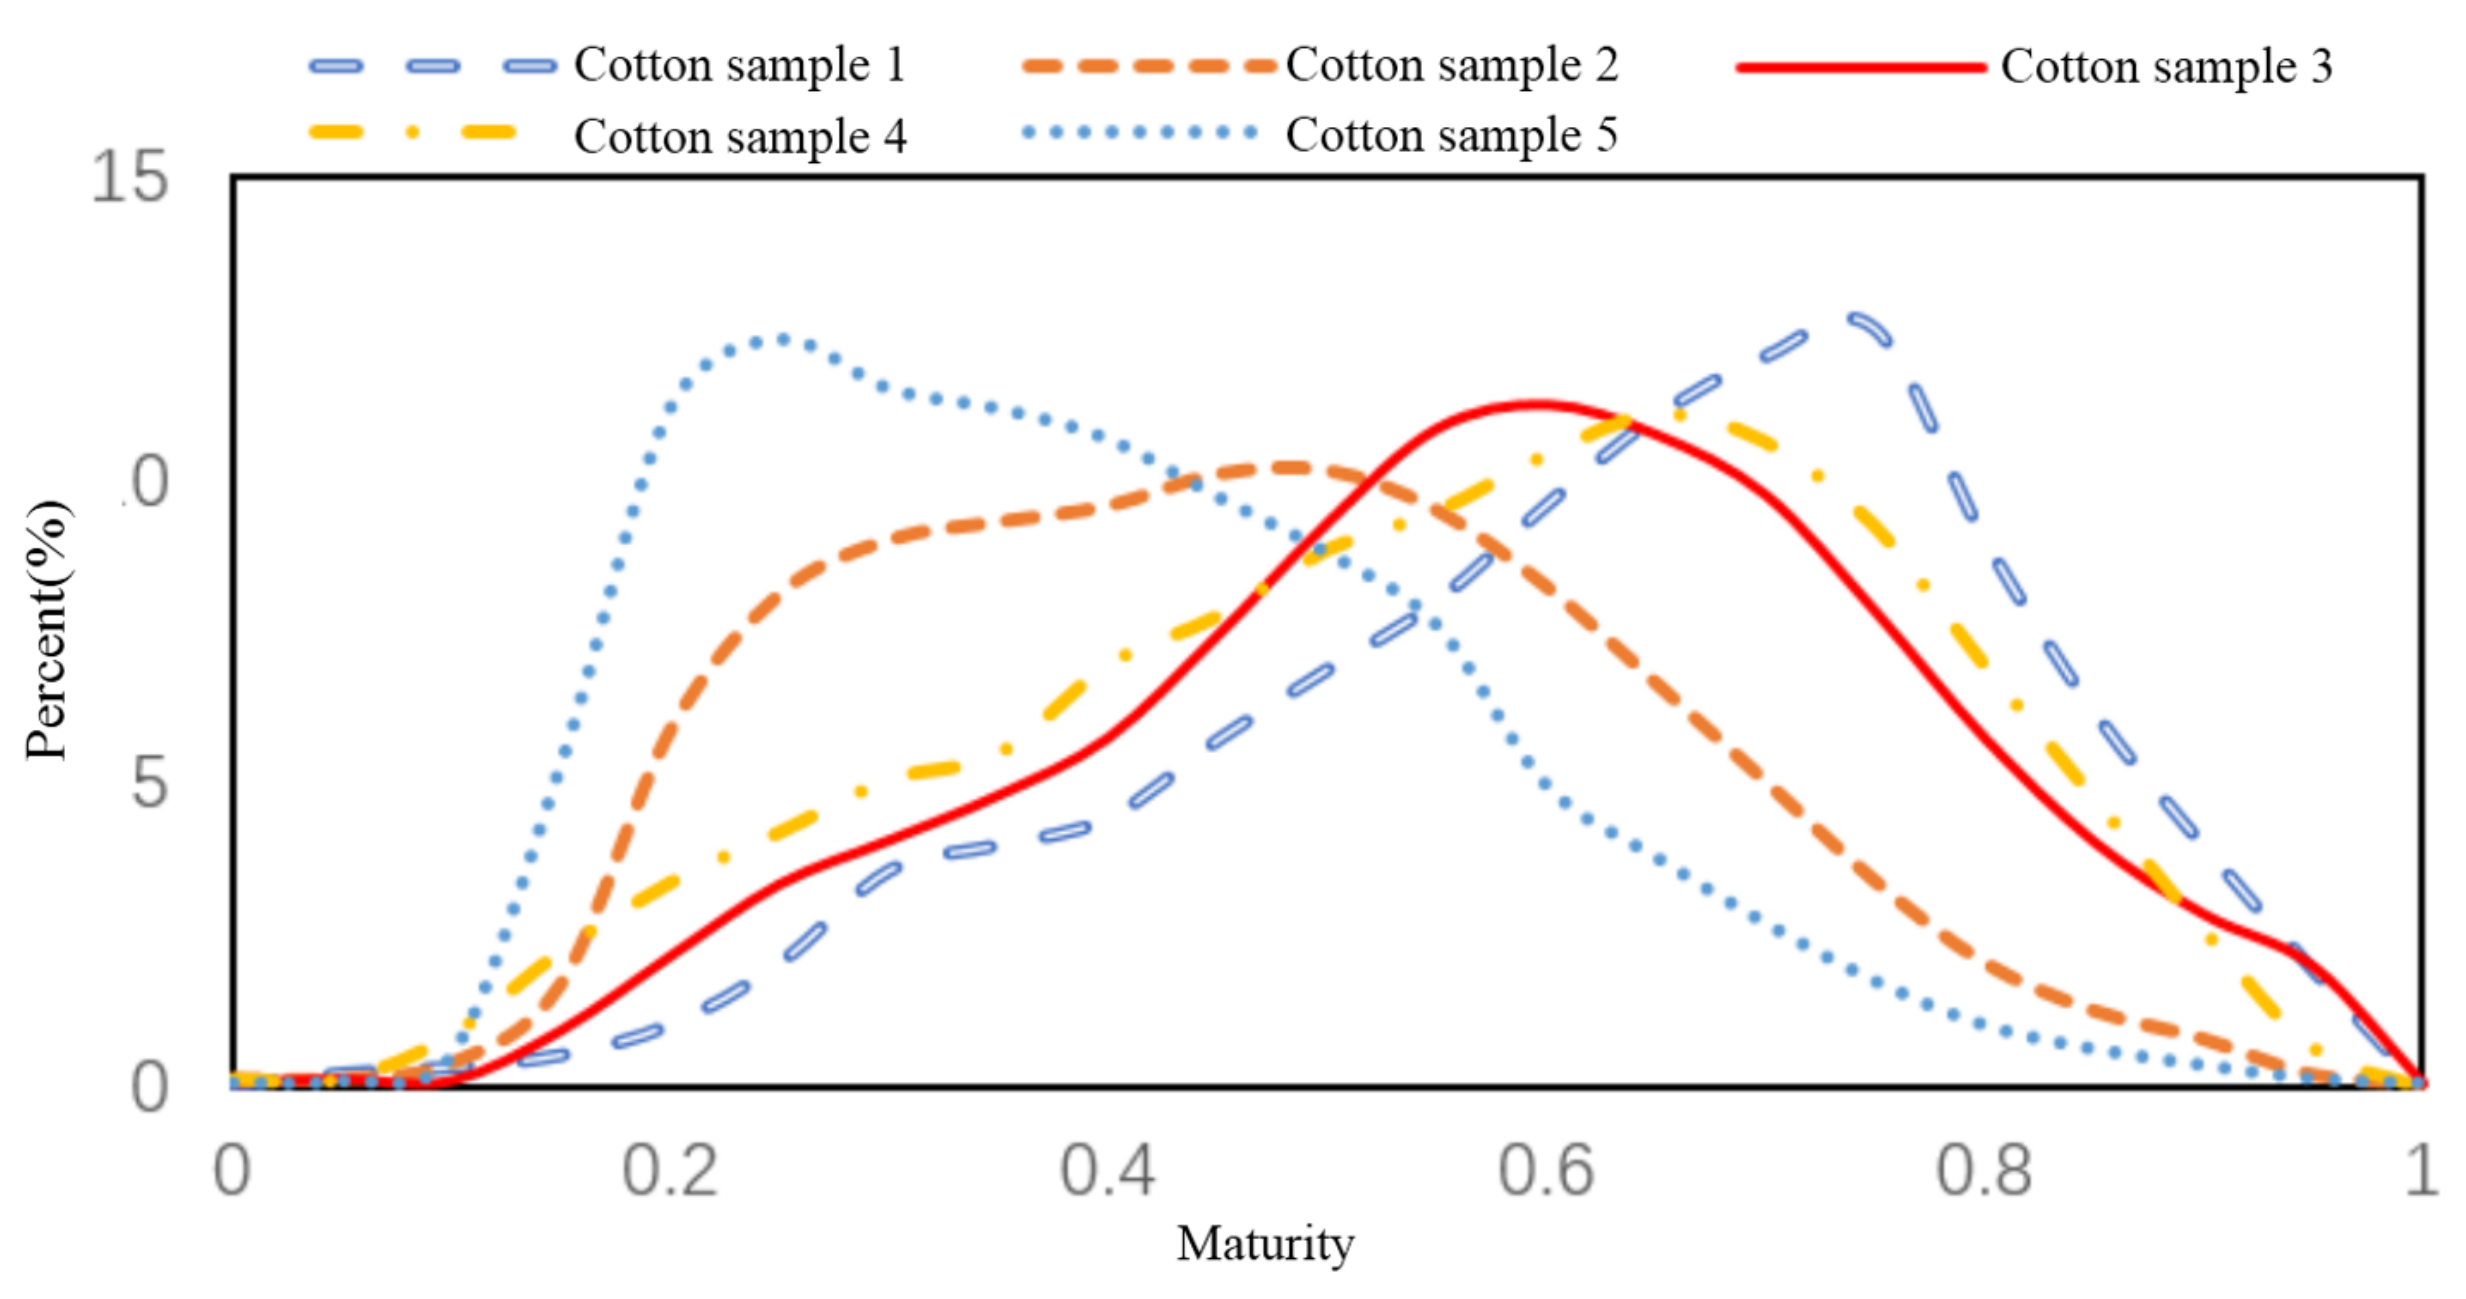
can be used to describe the statistical characteristic of maturity distribution in the cotton sample under test: If the proportion of cotton fibers with high maturity is relatively large, is positive; Conversely, if the proportion of cotton fibers with low maturity is relatively large, then is negative. Figure 4 is the maturity distribution curve of five cotton samples with different quality (the range of maturity is discretized into ten equal intervals, and proportions of cotton fibers where maturity is in every interval are calculated). Table 1 [11] shows the characteristic of the maturity distribution curve, skewness, and quality of cotton sample of five cottons samples. It can be seen, from Figure 4 and Table 1, that skewness can significantly distinguish the cotton samples with different qualities. Therefore, after calculating the maturity of all cross-sections, the quality of cotton samples can be evaluated by calculating the skewness of maturity of all cross-sections.
3. Edge Detection of Cotton Fiber Cross-Section Based on Modified Rcf
3.1. Rcf Architecture
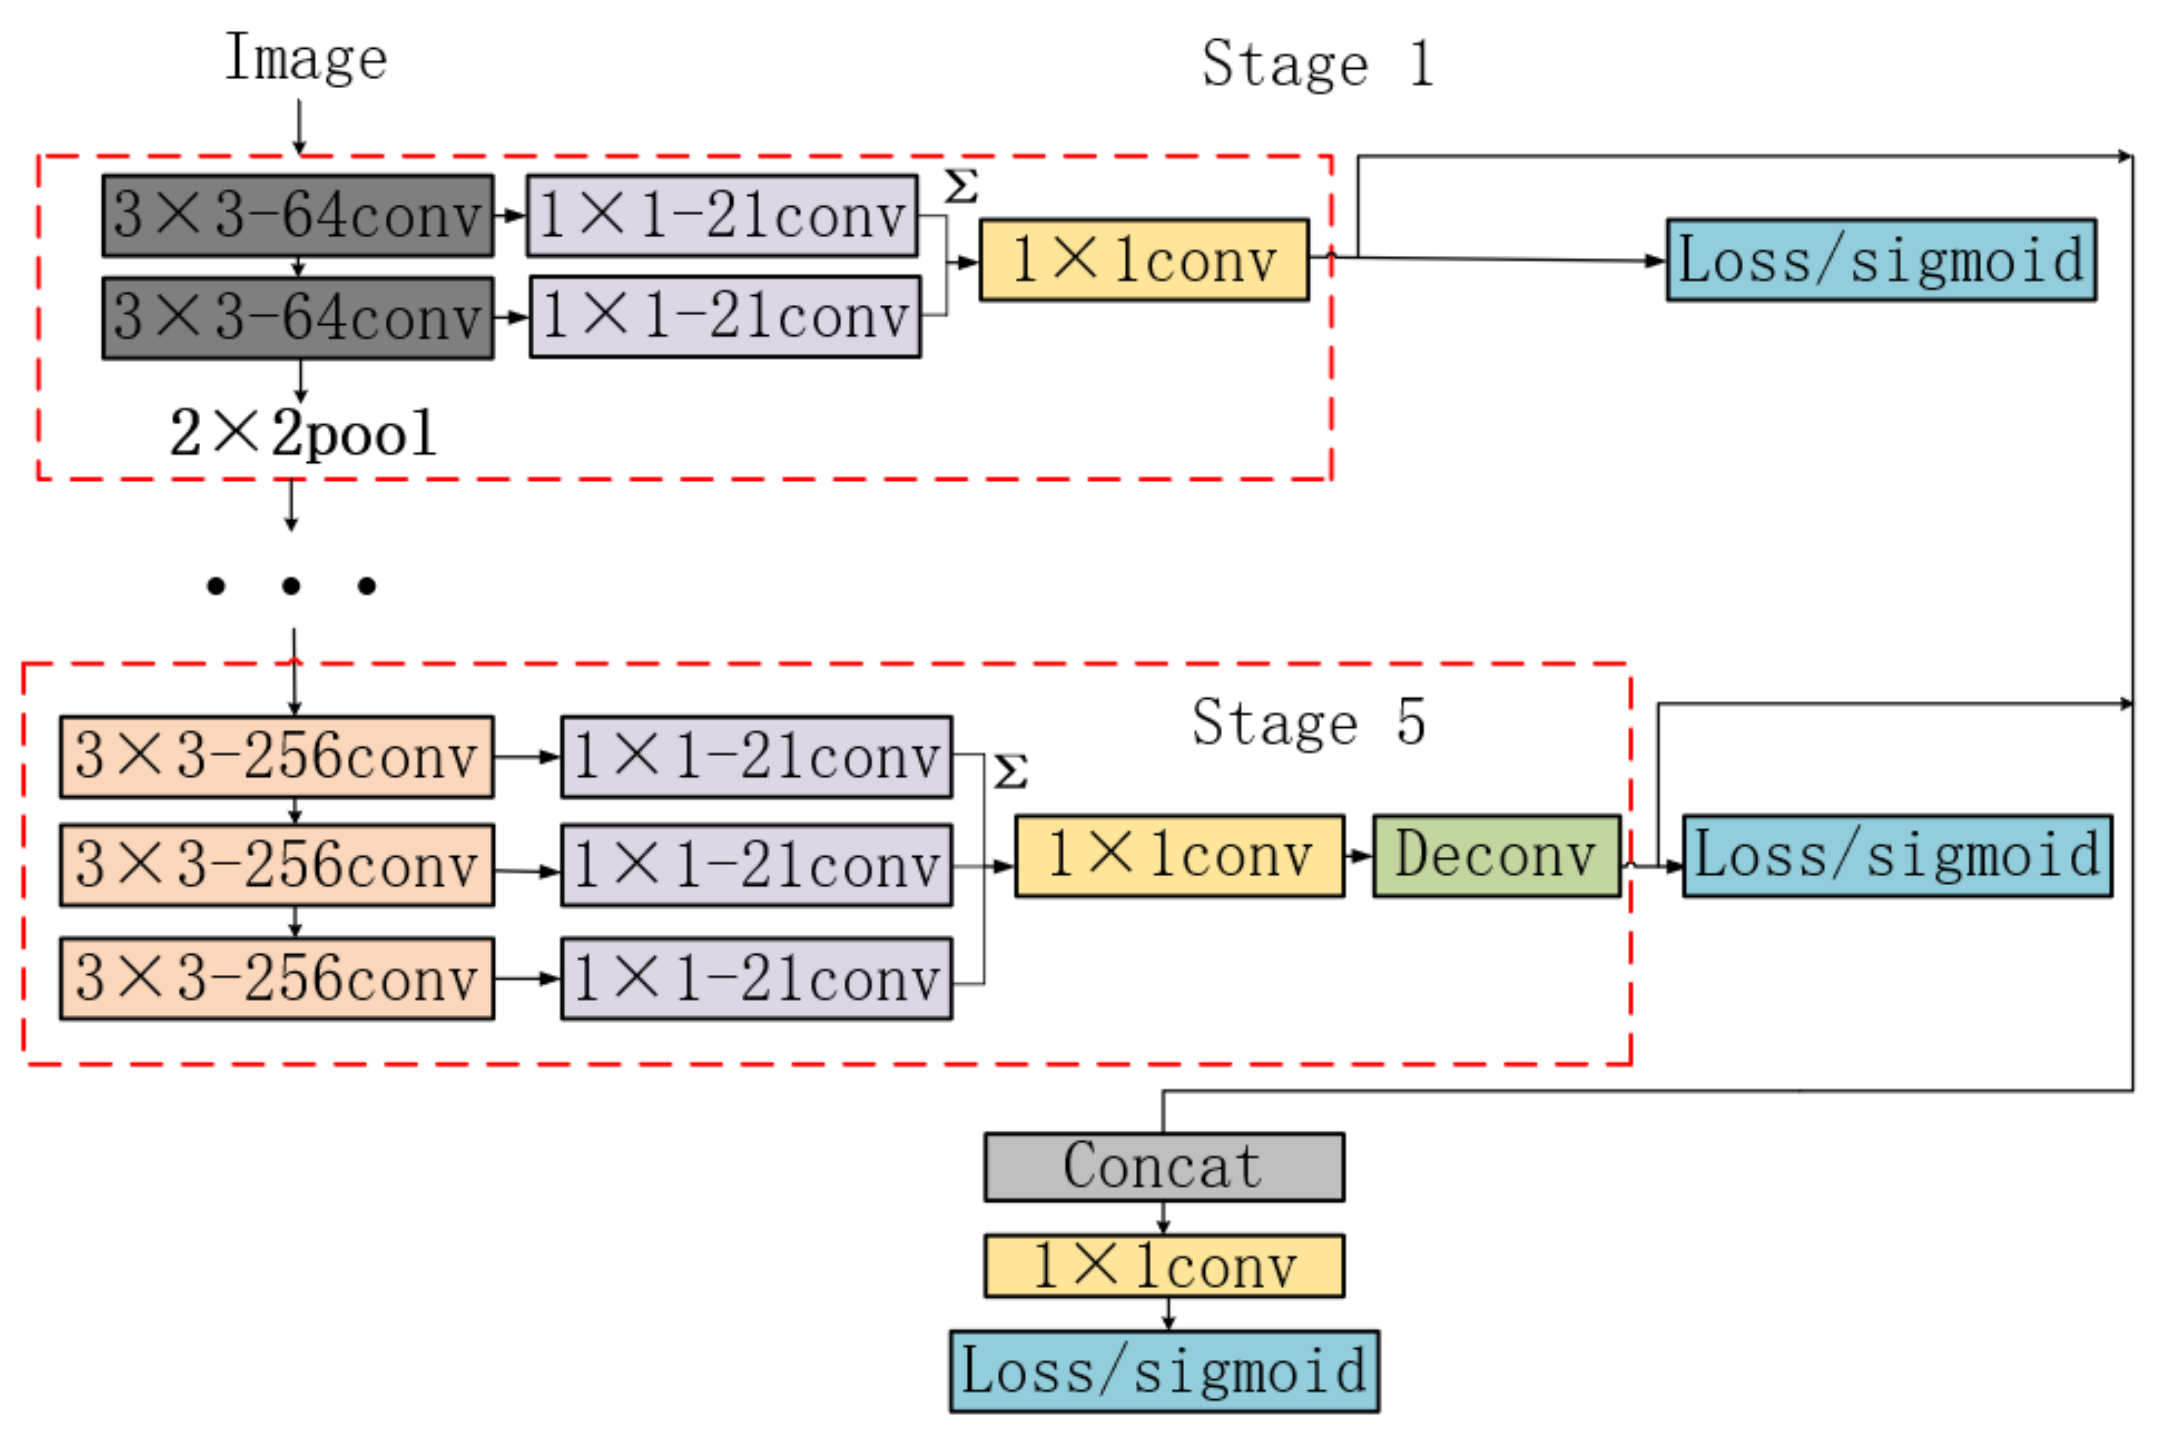
Because the VGG network has a strong ability of image characteristic extraction, and the network structure is simple and easy to modify, RCF uses VGG as the backbone network of edge detection. Figure 5 shows the RCF network architecture, and the specific changes of RCF to VGG can refer to reference [23].
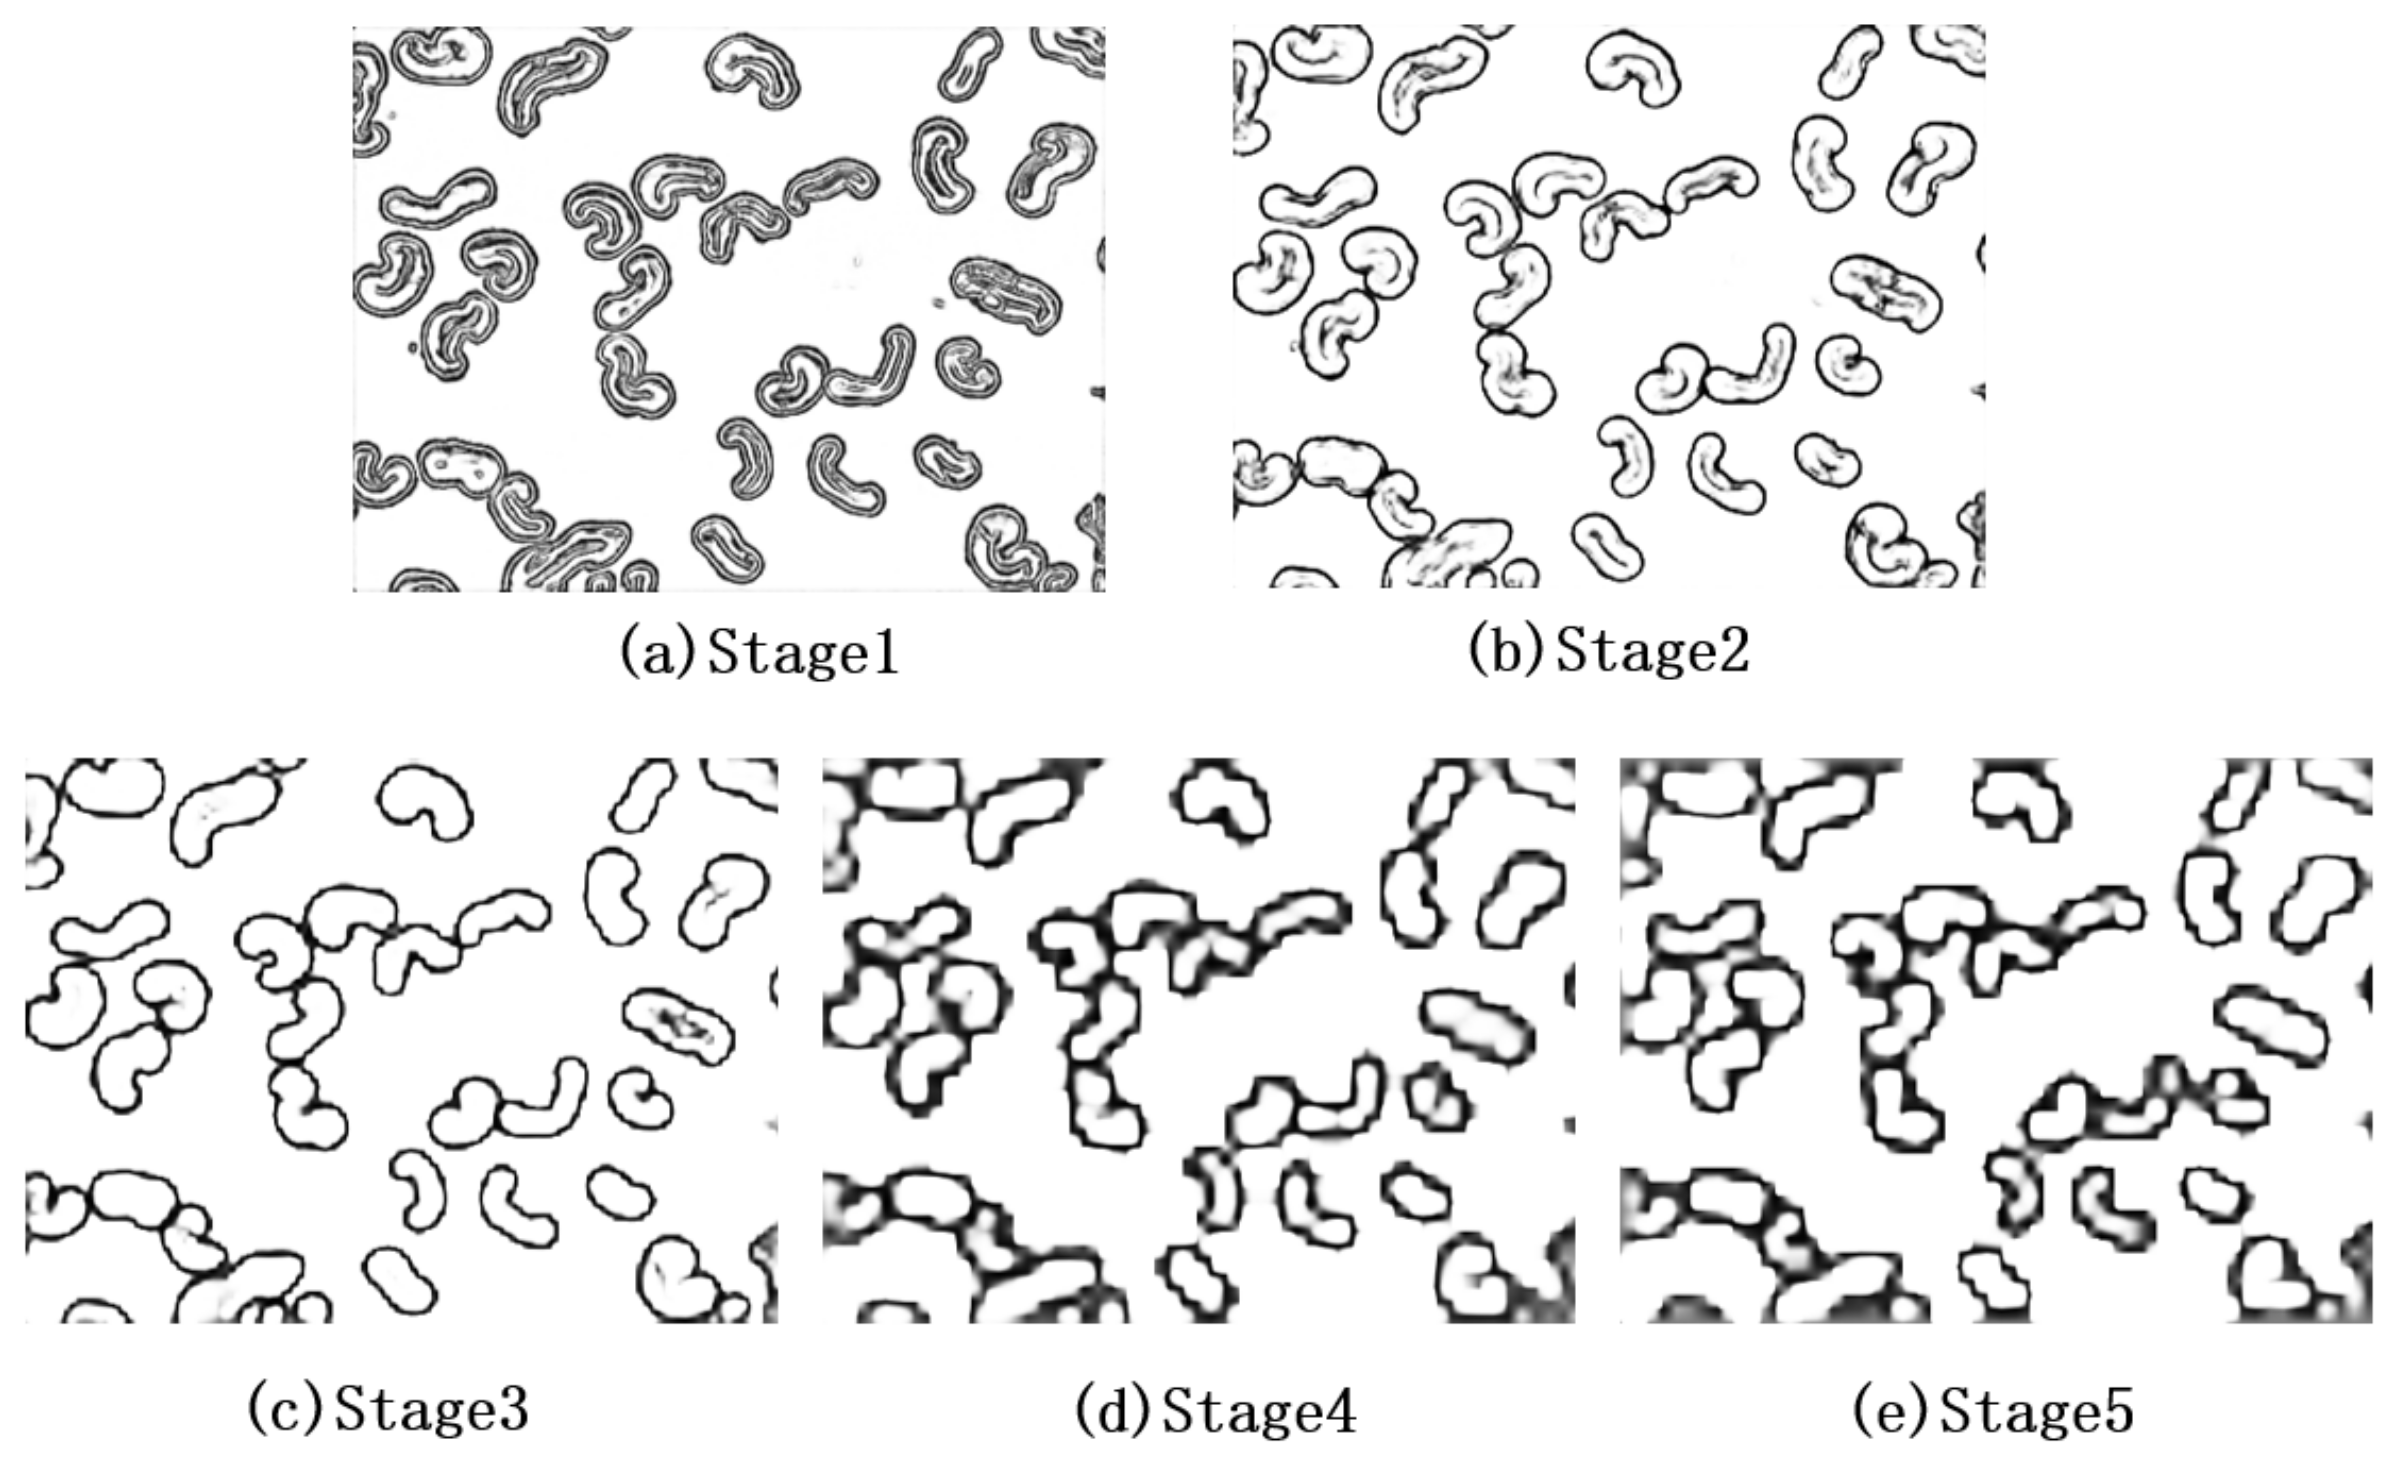
Figure 6 is an example of edge detection of cotton fiber cross-section using RCF, and Figure 7 is the output feature map of each stage of RCF. It can be seen from Figure 7 that: (1) the shallow layers extracts a large number of edge details, but it also contains part of the non-edge information, with the deepening of the network layers, the non-edge information is gradually removed (Figure 7a–c). (2) In the deeper layers of the RCF, dilated convolution is used to enlarge the receptive field, so the output becomes coarse (Figure 7d,e).
3.2. Optimization of Deep Supervision Network Structure
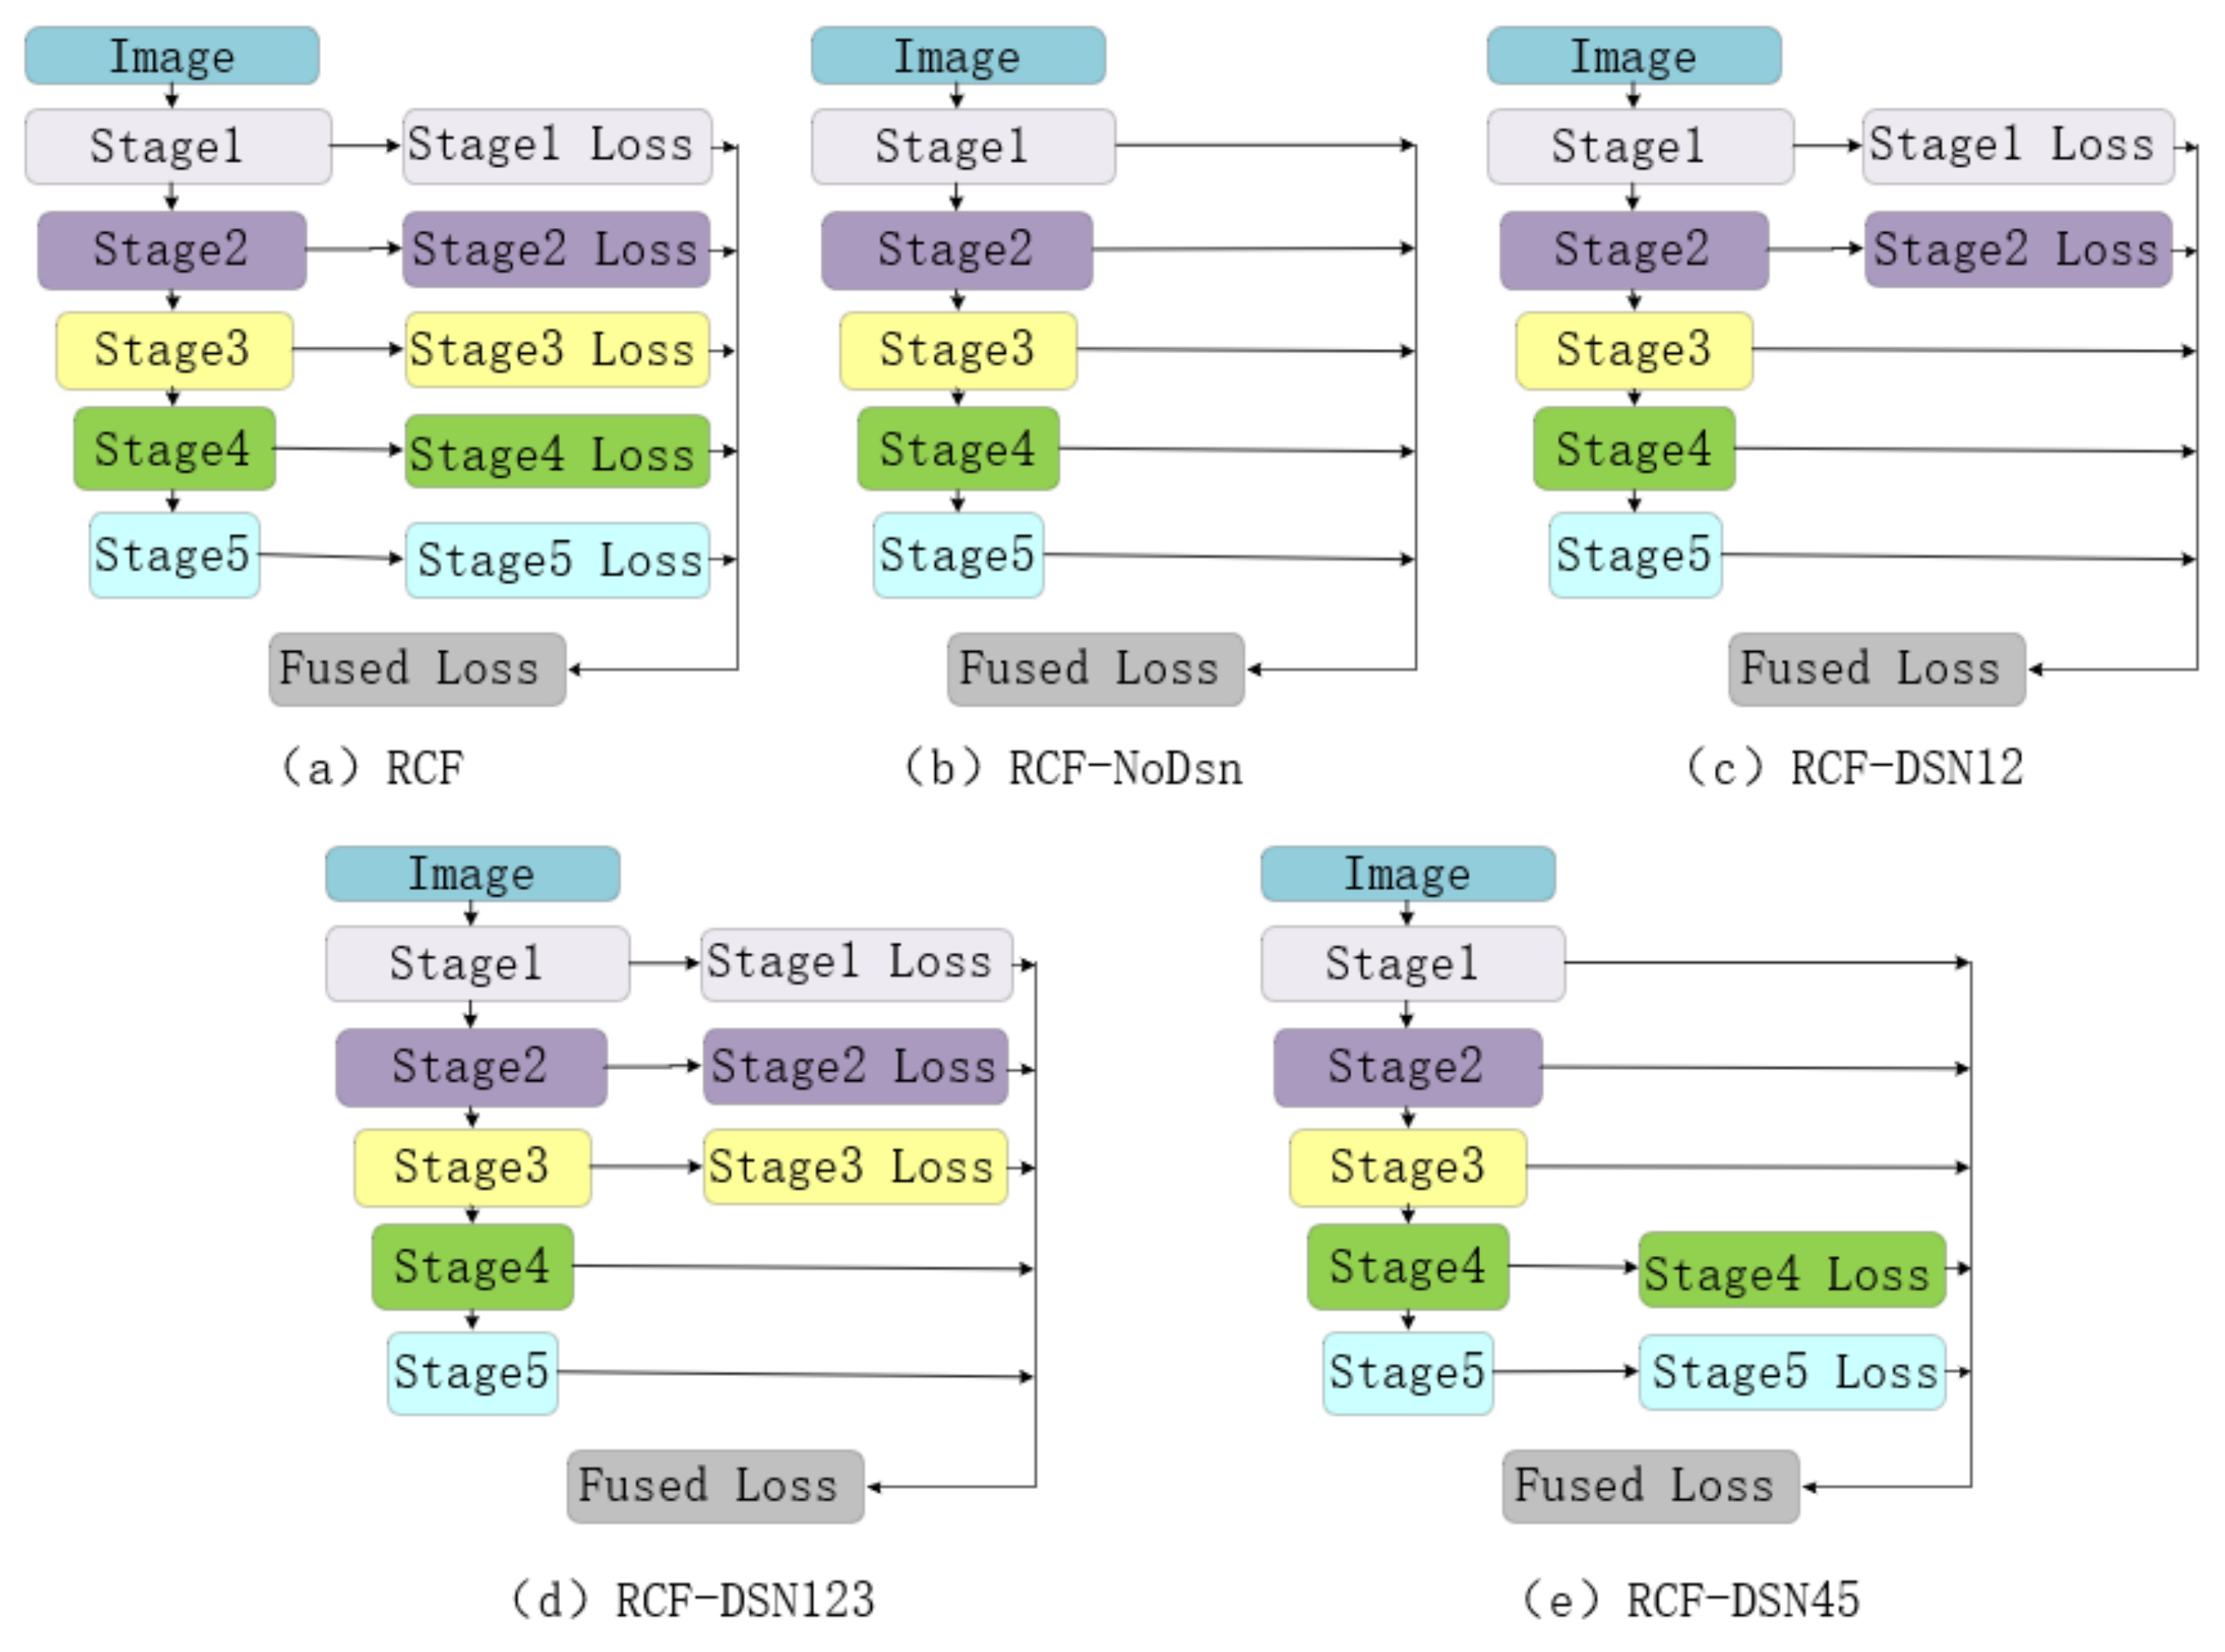
The RCF deep neural network calculates the loss value at each stage of VGG backbone network for deep supervised learning, as shown in Figure 8a. For the cotton fiber cross-section microscopic image with width and height and , respectively, let be the weight set of RCF deep neural network. is the feature vector at position in the output feature map of stage k (where , K is the total number of stages in RCF network, K = 5). is the probability that position is a true edge pixel. Subsequently, the loss value in stage K during RCF network training can be calculated by Formula (3):
where , , and are the positive and negative sample sets, respectively, and the super parameter is used to reconcile the number difference between positive and negative samples. Therefore, the total loss value of the whole deep neural network is calculated, as follows,
By analyzing the microscopic image of cotton fiber cross-section, it can be seen that the edge width of the cross-section is relatively consistent, so the deep supervised learning with too many levels may lead to the deterioration of the edge detection performance of the trained RCF deep neural network. Let the number of stages be set to , and the test error of RCF edge detection deep neural network trained with loss function is . Using RCF for the edge detection of cotton fiber cross-section, the optimal deep supervision level number can be obtained by solving the following optimization problem,
The solution of the above equation is very time-consuming, so we directly determine through experimental tests. Figure 8b–e presents the network structure after adjusting the deep supervision network structure of RCF to determine in this paper, (b) only calculates the loss after the fusion of output feature maps of each stage for network training, (c)∼(e) only calculate the loss of the output feature graphs of the first two, the first three, and the last two stages for network training. The training and test in the dataset constructed in this paper show that shallow supervision (Dsn12) has the best edge detection, whcih is, (c) in Figure 8 represents the optimal RCF deep neural network structure.
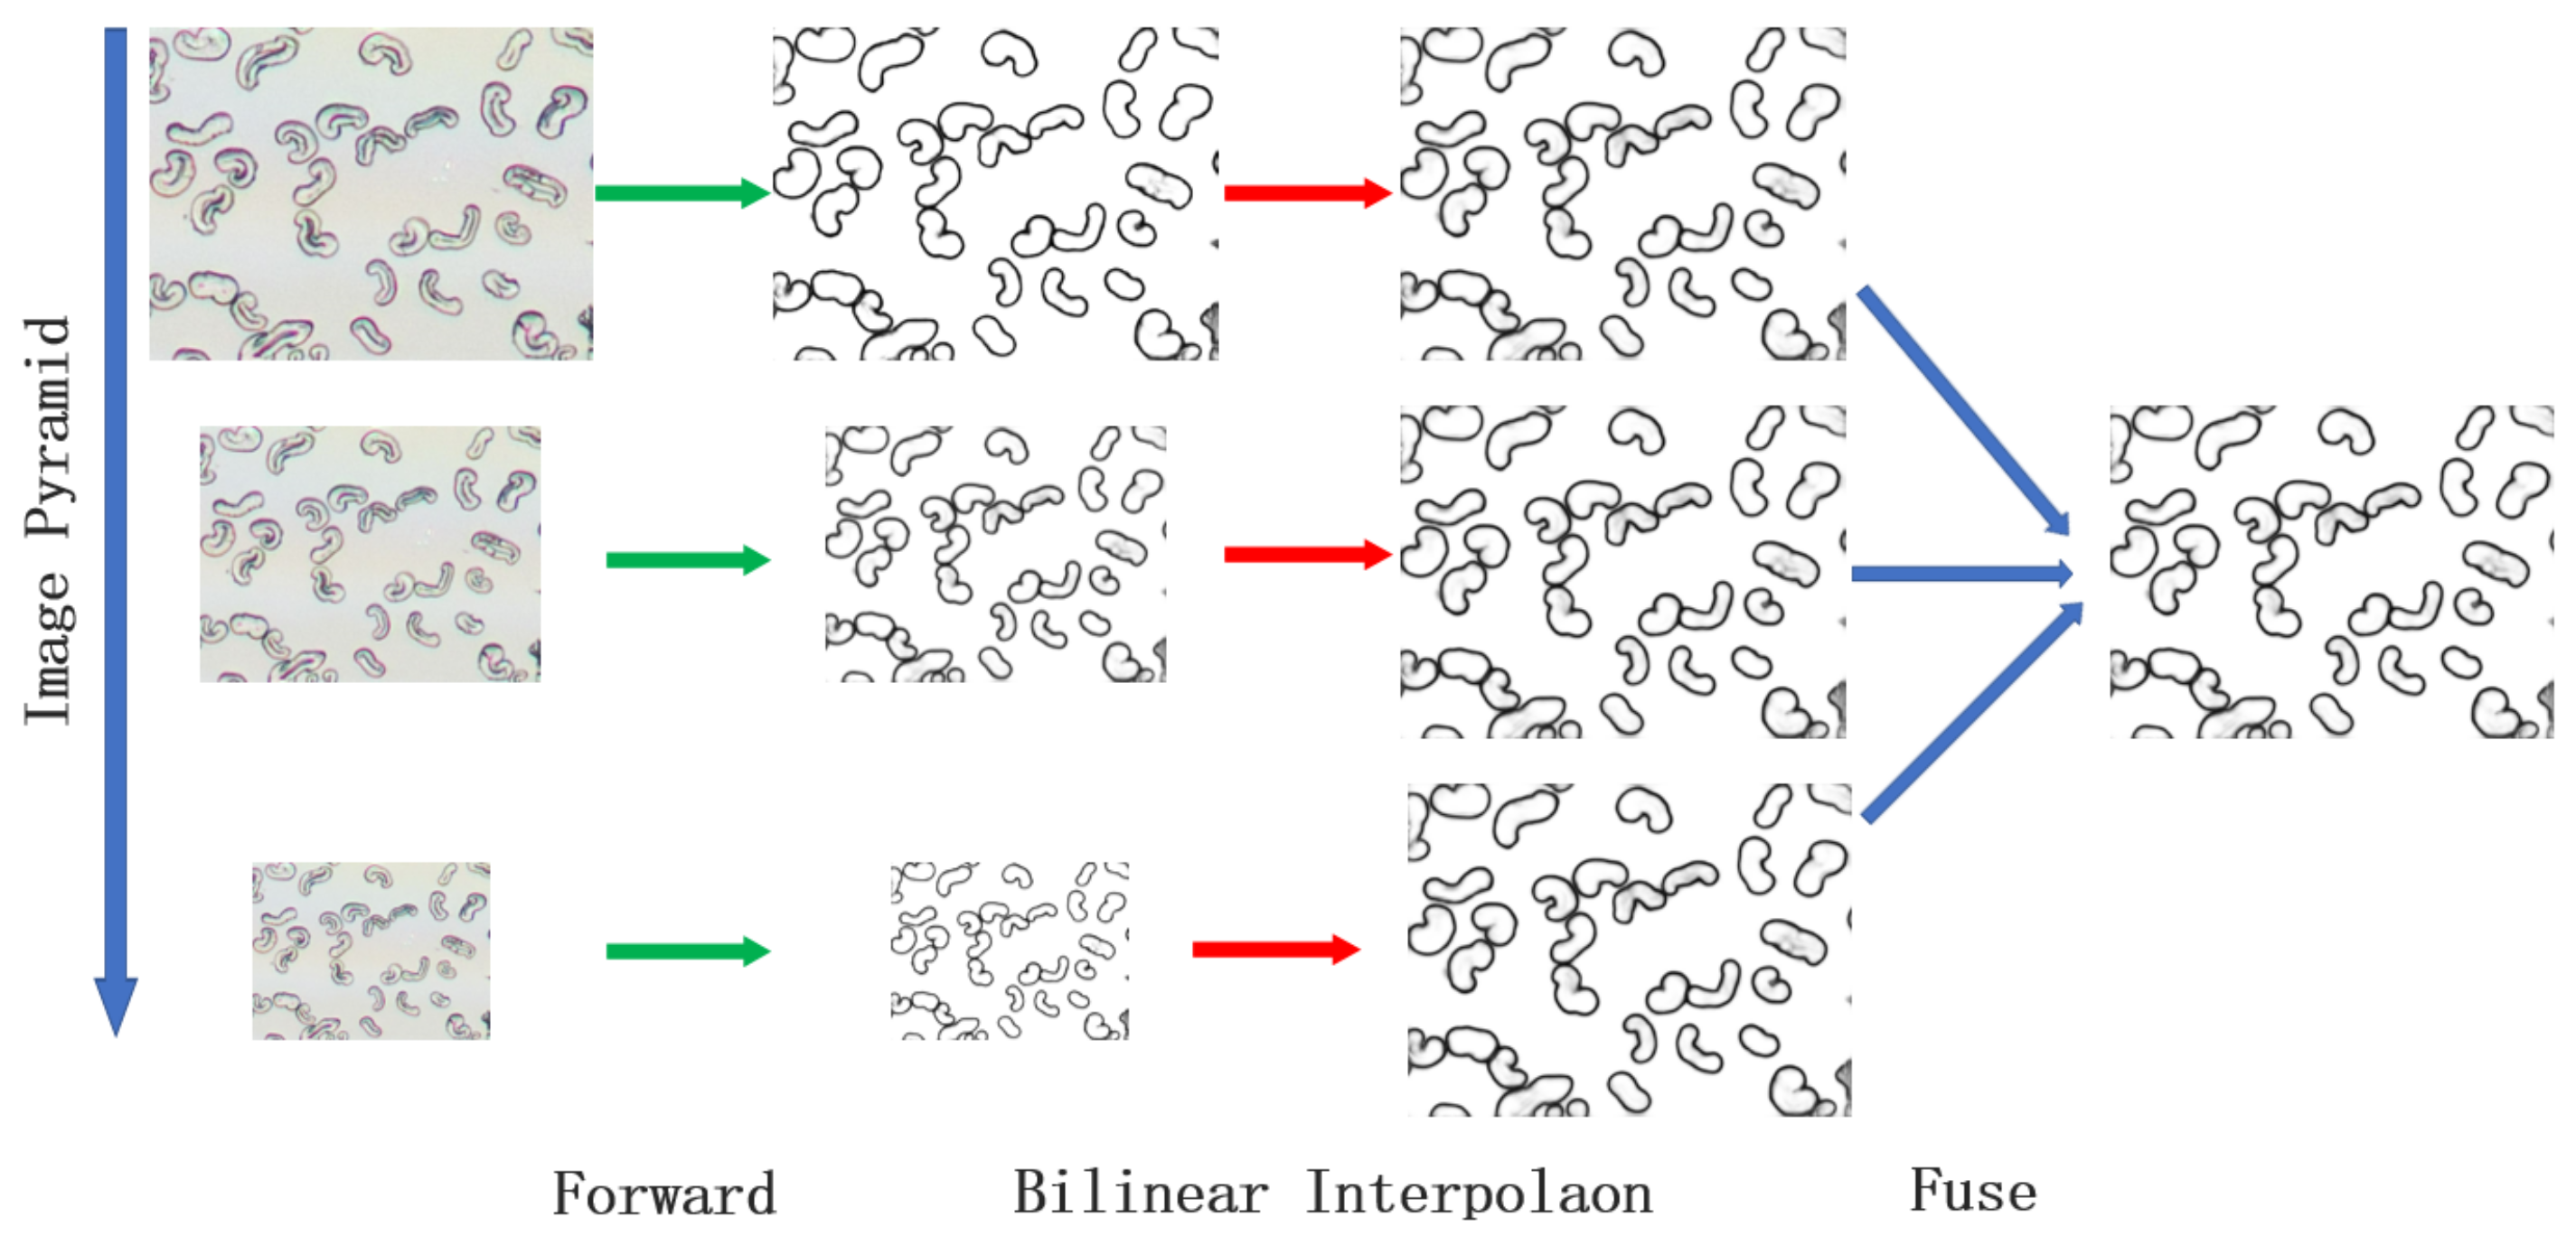
3.3. Multi-Scale Edge Detection and Fusion of Image Pyramid
The image pyramid is a multi-scale image representation method, and Figure 9 presents the schematic diagram of the fusion of multi-scale edge detection results cross-sectional microscopic image of cotton fiber. In the edge detection task of cross-sectional microscopic image of cotton fiber, the quality of edge detection can be improved by fusion of the results of network edge detection at different scales. For the microscopic image of the cross-section of cotton fiber with width and height and , the image in the layer of the image pyramid is denoted as , the width and height of are and , and the forward prediction result of is denoted as , for any , the forward predicted value of the pixel at position in image is . Subsequently, the fusion result of multi-scale edge detection at position in the microscopic image of cotton fiber cross-section is calculated according to the following formula,
in this paper, , the experimental results show that using an image pyramid to realize multi-scale fusion prediction can effectively improve the performance of edge detection.
4. Experimental Results And Discussion
4.1. Construct of the Experimental Dataset
The images used in this paper are captured through a 12-megapixel digital camera and a 20× objective lens on a light microscope (Olympus CH30). The phenomenon of “multi-focus” in microscope-focused imaging leads to local blurring in the collected microscopic images. Therefore, in the experiment, multi-focus microscopic image fusion is used to obtain clearer and complete images.
A total of 30 original images of cross-sectional microscopic images of cotton fiber with 4272 × 2848 resolution were collected from different cotton samples [12], and a total of 720 microscopic images of cotton cross-sectional with 427 × 320 resolution were generated by the random cutting method. All of the cross-sectional microscopic images of cotton fiber in the dataset are manually labeled with the edge-based semi-automatic image annotation tool ByLable that was developed by Xuebin Qin et al. [25]. Subsequently, the dataset containing 7200 cross-sectional microscopic images of cotton fiber was generated by data enhancement methods, such as scale scaling, image rotation, and mirror image. Among them, 5200 images were used for training, and 2000 images were used for testing.
4.2. Software and Hardware Equipment
In the experiment, the edge detection method of cotton cross-sectional is realized by the caffe platform. ImageNet pre-trains the VGG-16 backbone network, and the stochastic gradient descent (SGD) method is selected for network training [26]. The hyper-parameters are set, as follows: the initial learning rate is 1 × , the learning rate change index is 0.1, the momentum and weight attenuation are set to 0.9 and 0.0002, respectively, and the maximum number of iterations is set to 40,000. The server CPU for deep neural network training and testing is Intel (R) Core (TM) i7-8700K CPU @ 3.20 GHz, with 32 GB memory. It is equipped with two NVIDIA GeForce GTX 1080Ti graphics cards and it enables cuDNN (NVIDIA CUDA® Deep Neural Network library) acceleration.
4.3. Influence Test and Analysis of Dilated Convolution on Edge Detection
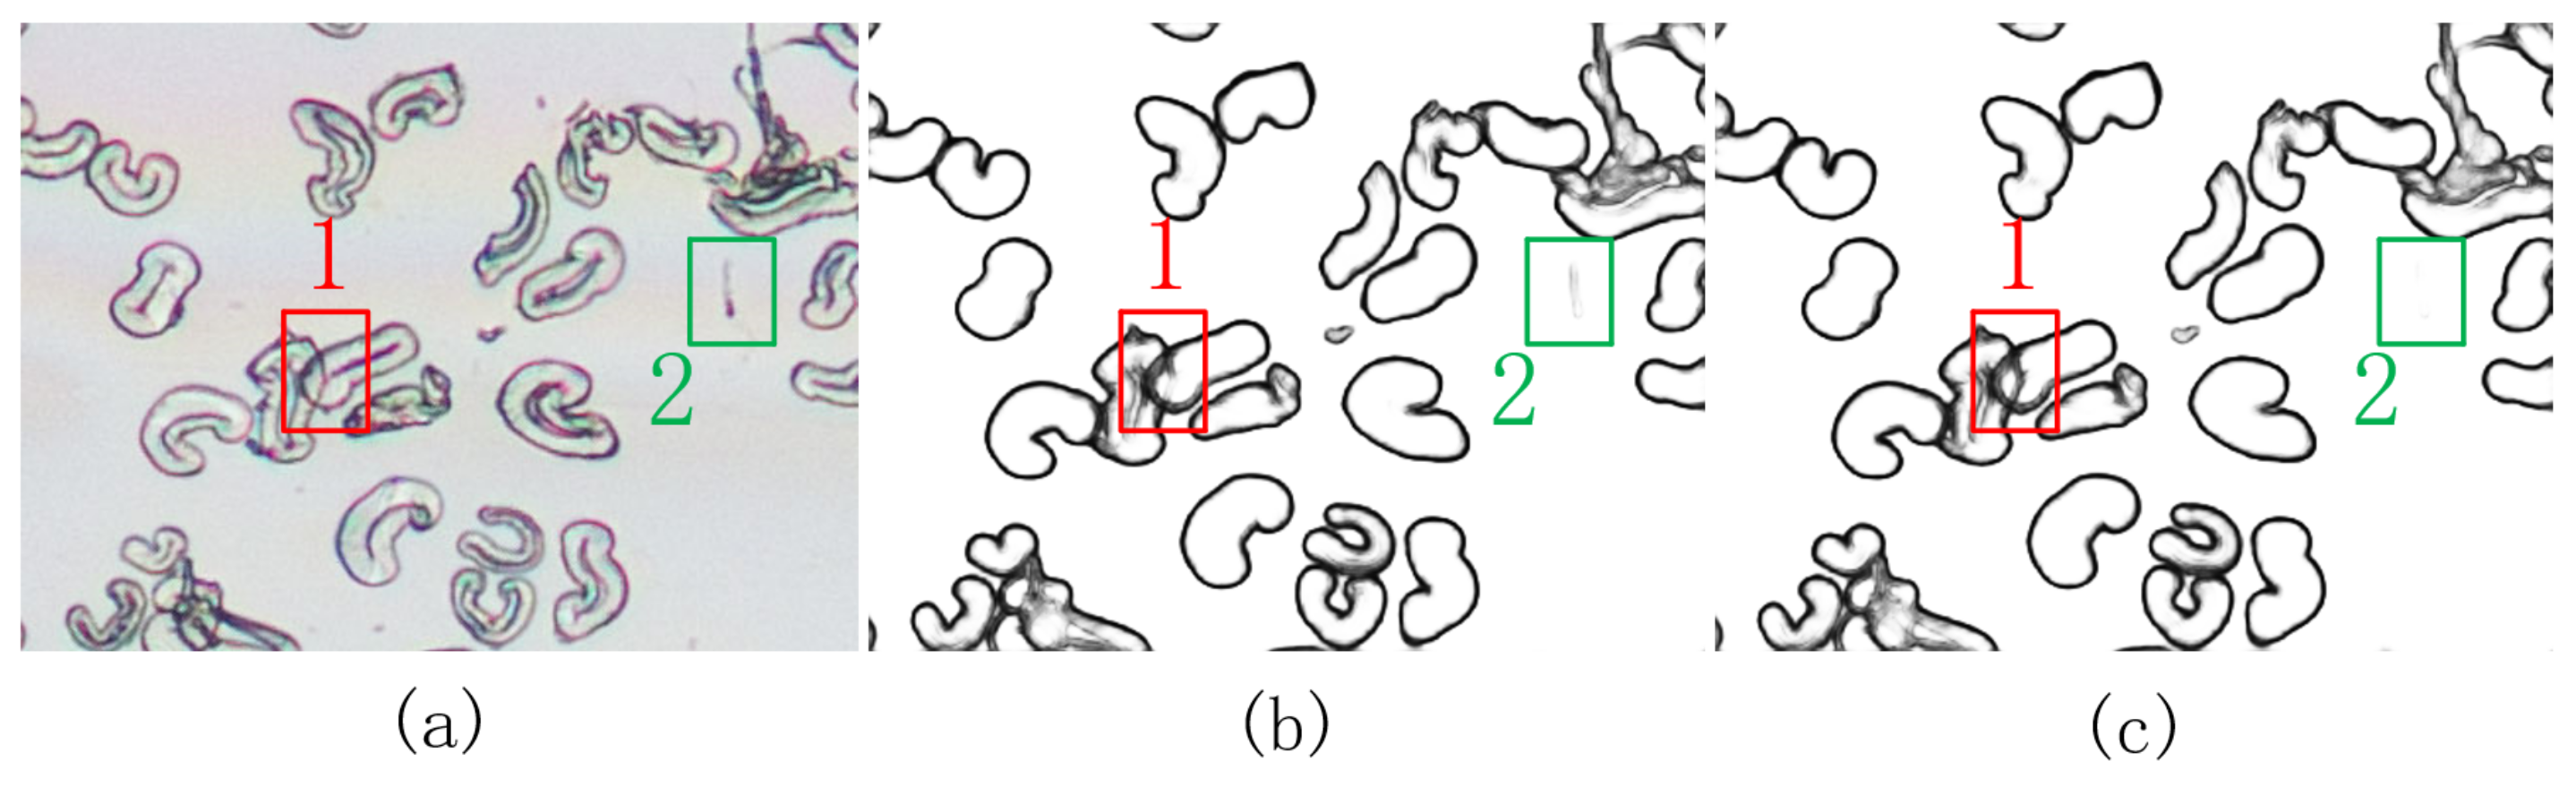
The original RCF and network RCF-NoDila (RCF network without dilated convolution) are tested on the well-known BSDS500 benchmark and the dataset constructed in this paper, and Table 2 shows the test results. From the experimental results on the BSDS500 benchmark, the dilated convolution makes the ODS value and AP value of the network increase to some extent. However, the ODS value and AP value on the microscopic image dataset of cotton fiber cross-section constructed in this paper are reduced, and it can be seen from Figure 10 that the edge detection performance without dilated convolution is better (the area that is shown in the red box in Figure 10). At the same time, some non-edge noises in the image are suppressed (the area is shown in the green box in Figure 10). The experimental results show that, for different types of datasets, the network structure should be adjusted appropriately according to the image characteristics.
4.4. Influence Test and Analysis of Deep Supervisory Structure on Edge Detection
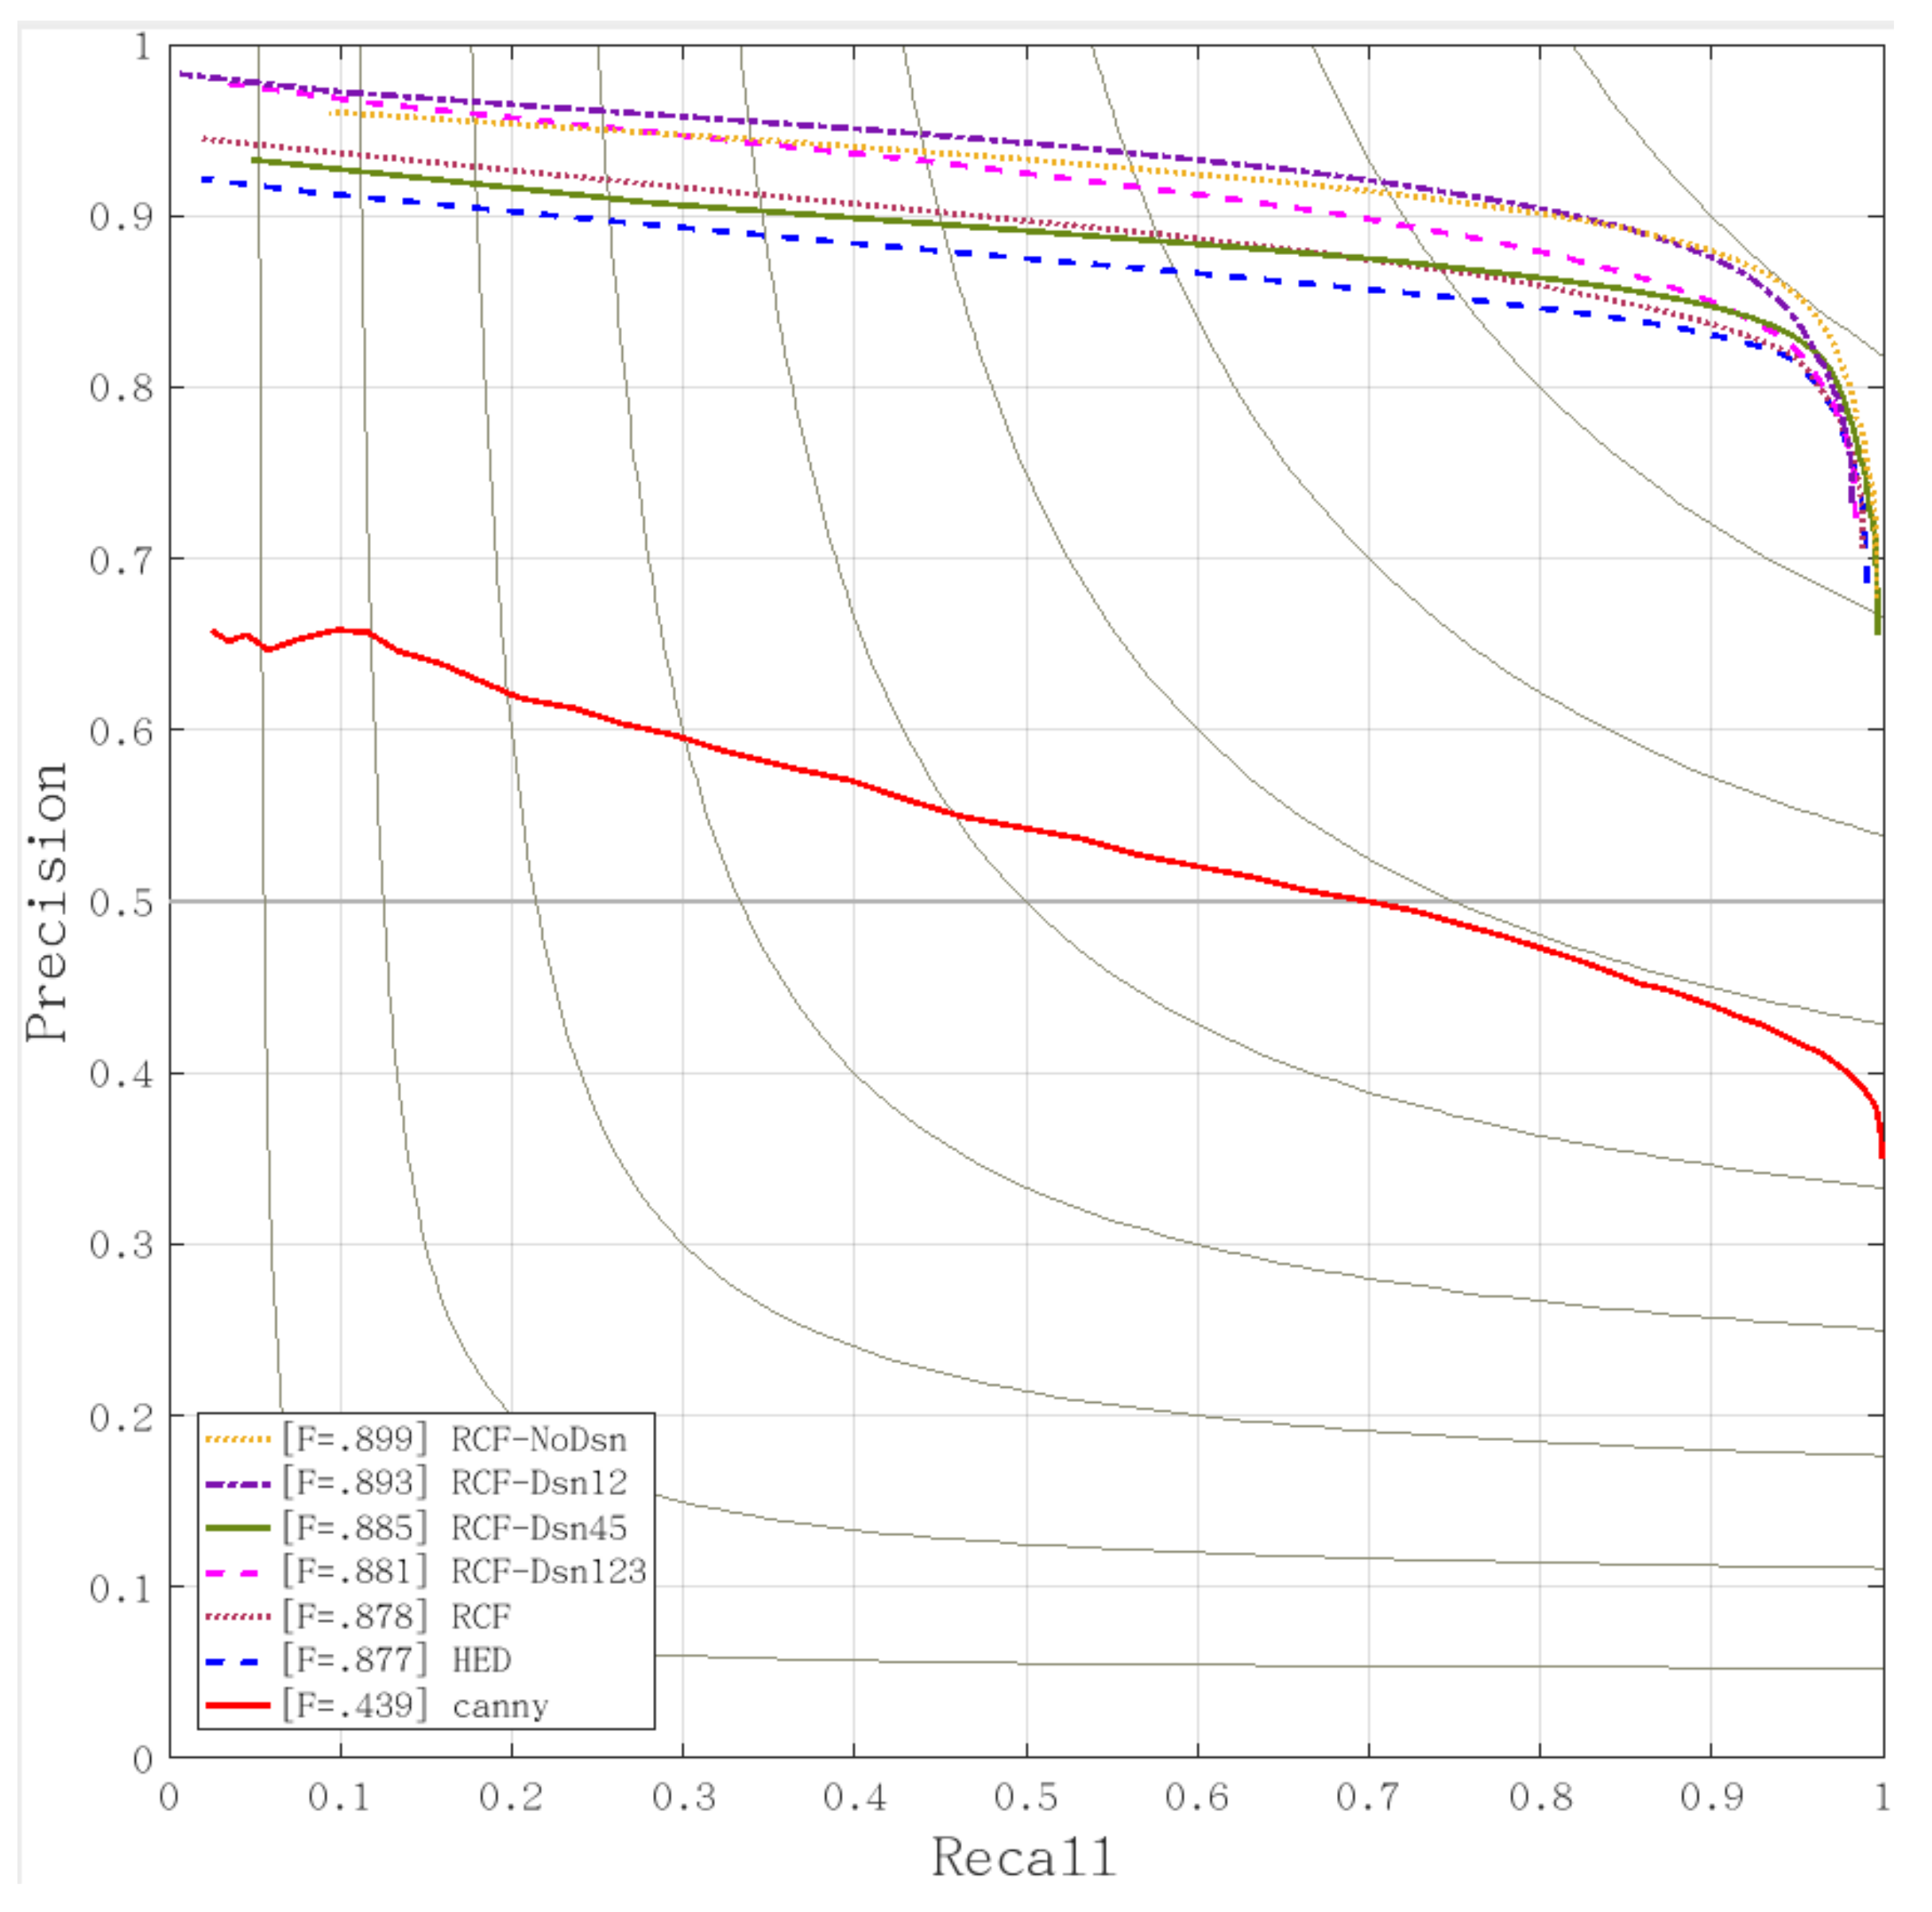
The networks in Figure 10, RCF, HED, and traditional Canny edge detection method are trained and tested on the dataset constructed in this paper in order to analyze the performance differences of different deep supervised network structures (shown in Figure 10) on the edge detection of microscopic image of cotton fiber cross-section. The ODS, OIS, and AP values of each method are calculated and the corresponding P-R curves are drawn for performance comparison and analysis.
Table 3 presents the performance index calculated according to the test results of each edge detection method. The suffixes NoDsn, Dsn12, Dsn123, and Dsn45 represent the network structure and loss calculation method that are shown in Figure 8b–e, respectively. Figure 11 is the P-R curve of each edge detection method. It can be seen from Table 3 and Figure 11 that, for the edge detection of cross-sectional microscopic images of cotton fiber, simplifying the deep supervision of the network can significantly improve the edge detection performance of the network. Better results can be obtained by simplifying supervision of deep neural network appropriately; with shallow supervision (RCF-Dsn12), the best edge detection effect can be obtained.
4.5. Influence Test and Analysis of Multi-Scale Edge Detection and Fusion of Image Pyramid
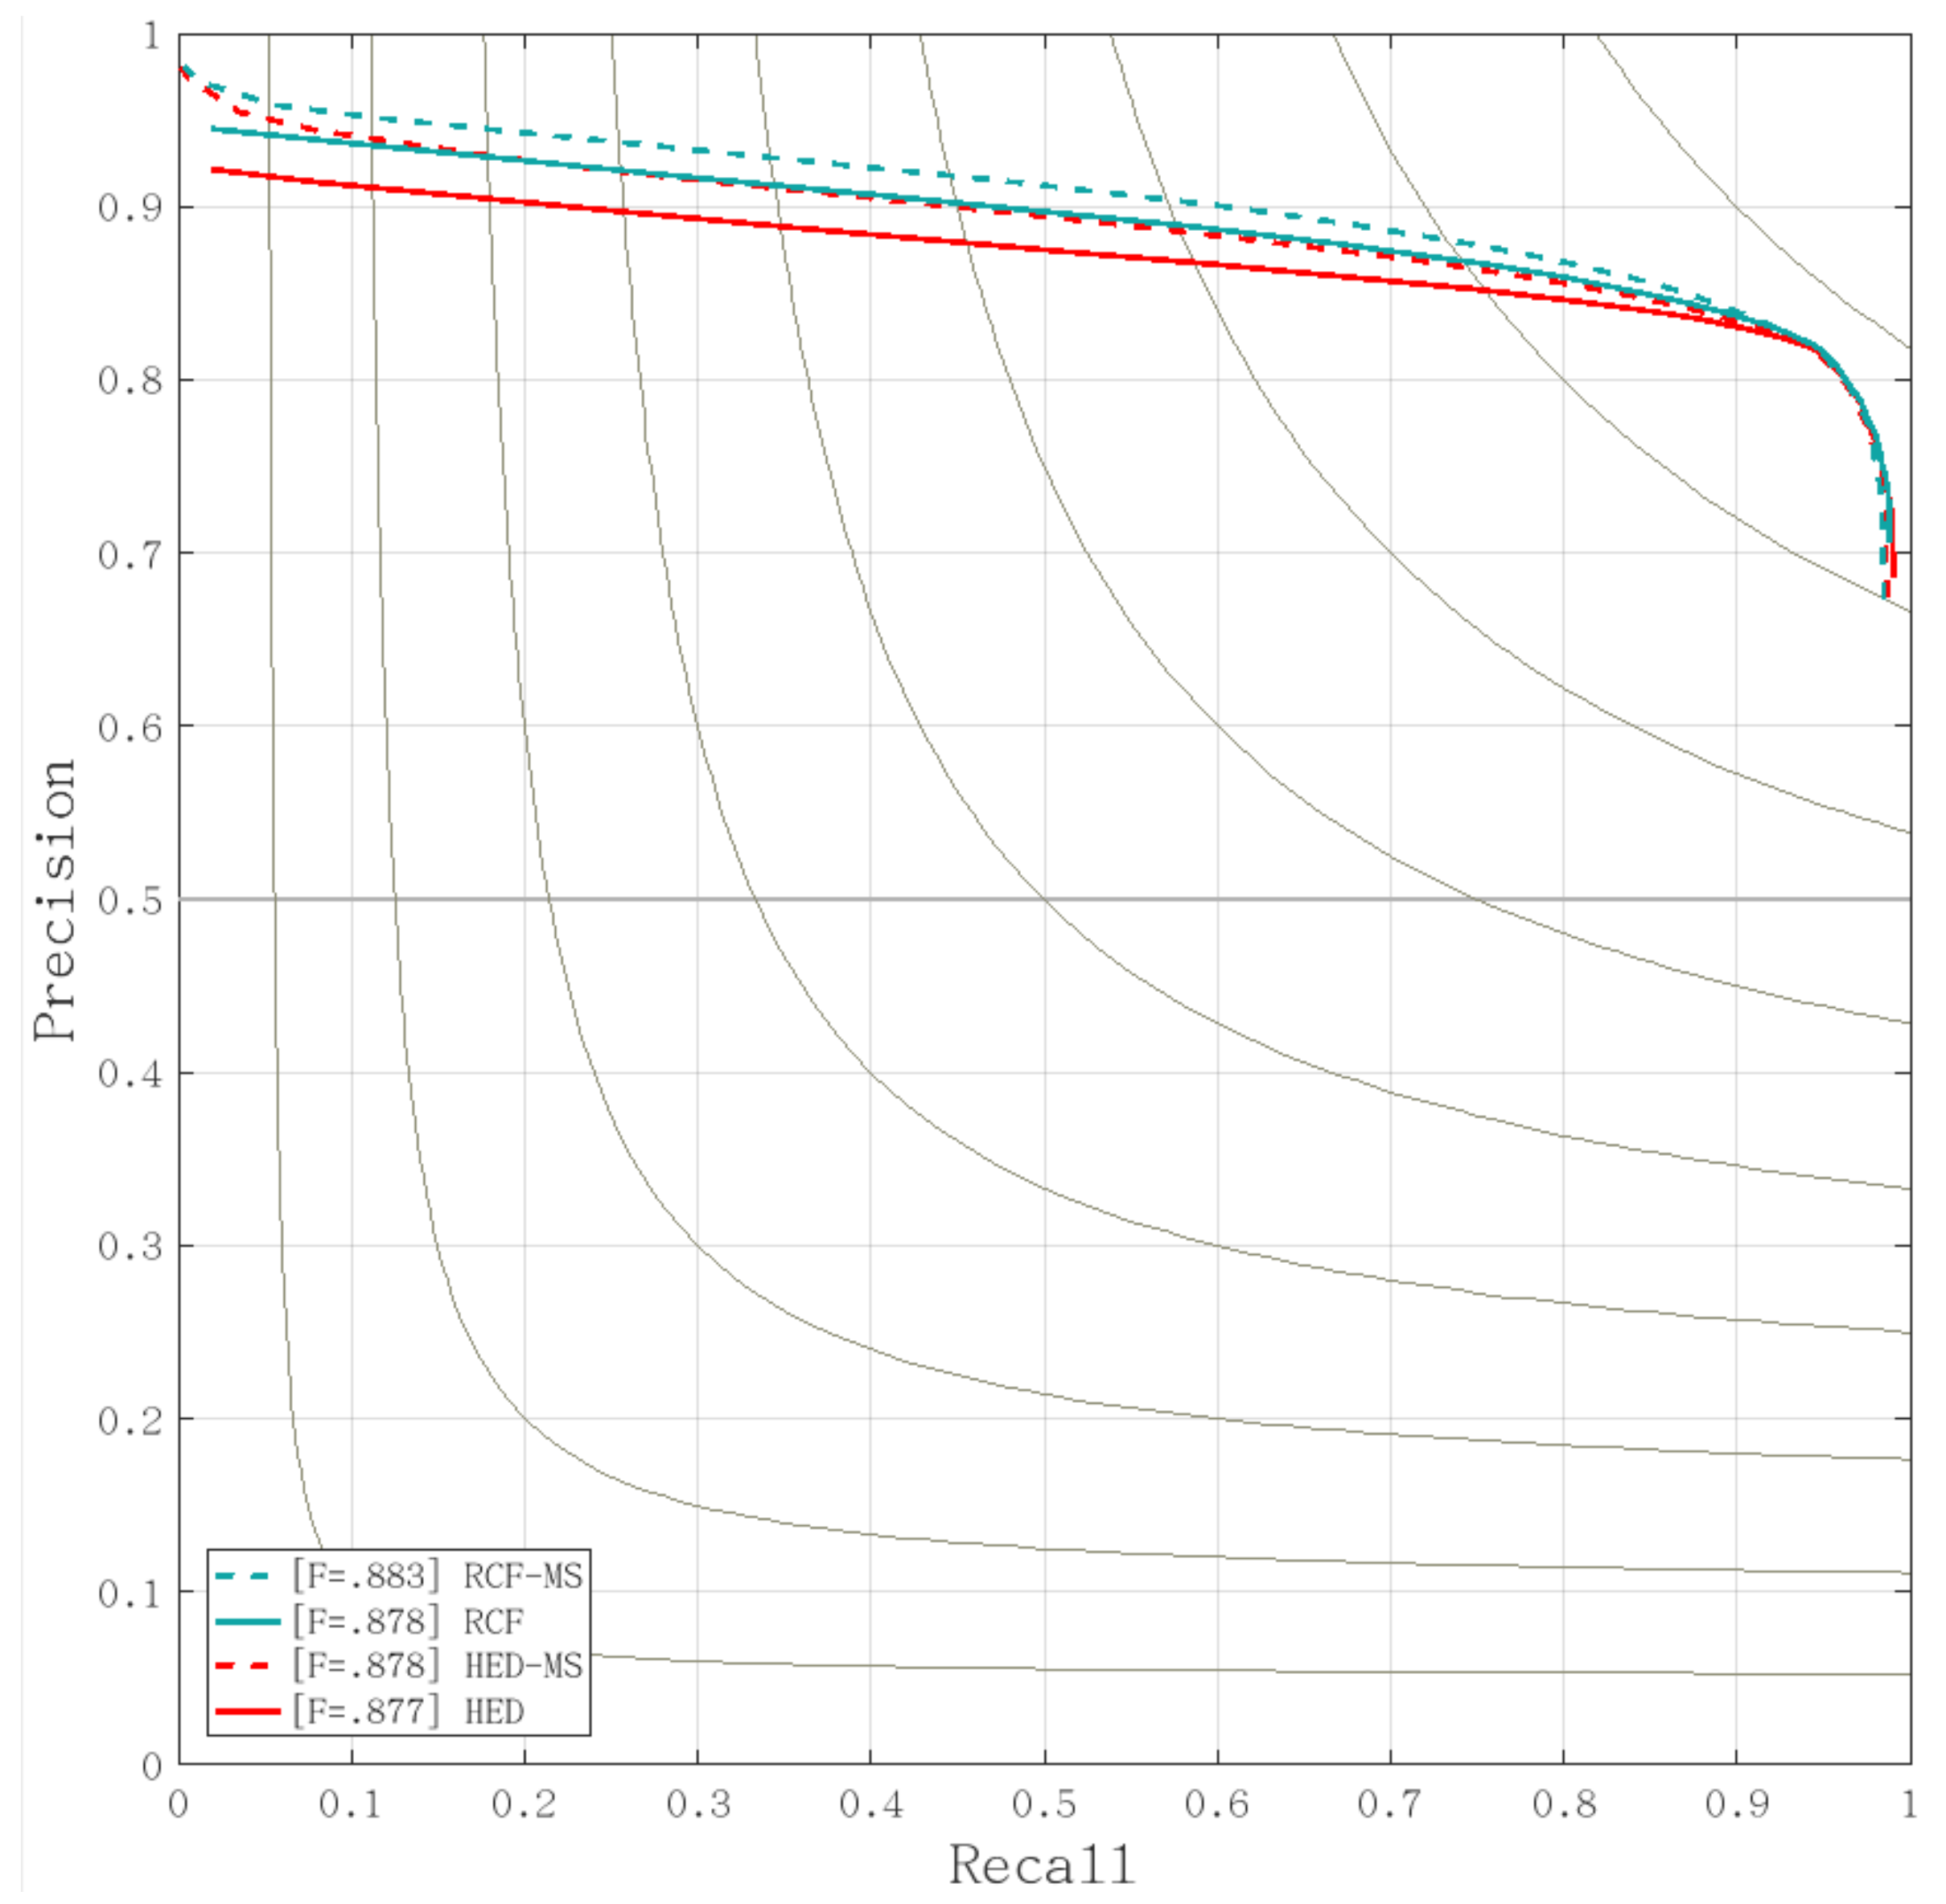
In order to test the effectiveness of multi-scale edge detection and fusion of image pyramid for improving the edge detection performance of microscopic image of cotton fiber ross-section, the performances of RCF and HED after multi-scale edge detection and fusion using image pyramid are tested respectively. The P-R curve drawn according to the test results is shown in Figure 12, and the edge detection performance index is shown in Table 4. The same color curve in Figure 12 corresponds to the same network structure. The real line is the P-R curve without image pyramid, and the imaginary line is the P-R curve with multi-scale edge detection and fusion of image pyramid. For the same kind of network, the P-R curve that is represented by the dotted line is always above the solid line, which is, the edge detection ability of the network is greatly improved by using multi-scale edge detection and fusion of image pyramid, and it can be seen from Table 4 that the changes of ODS and OIS values of the two algorithms using multi-scale edge detection and fusion of image pyramid are relatively small, but the AP value is greatly improved.
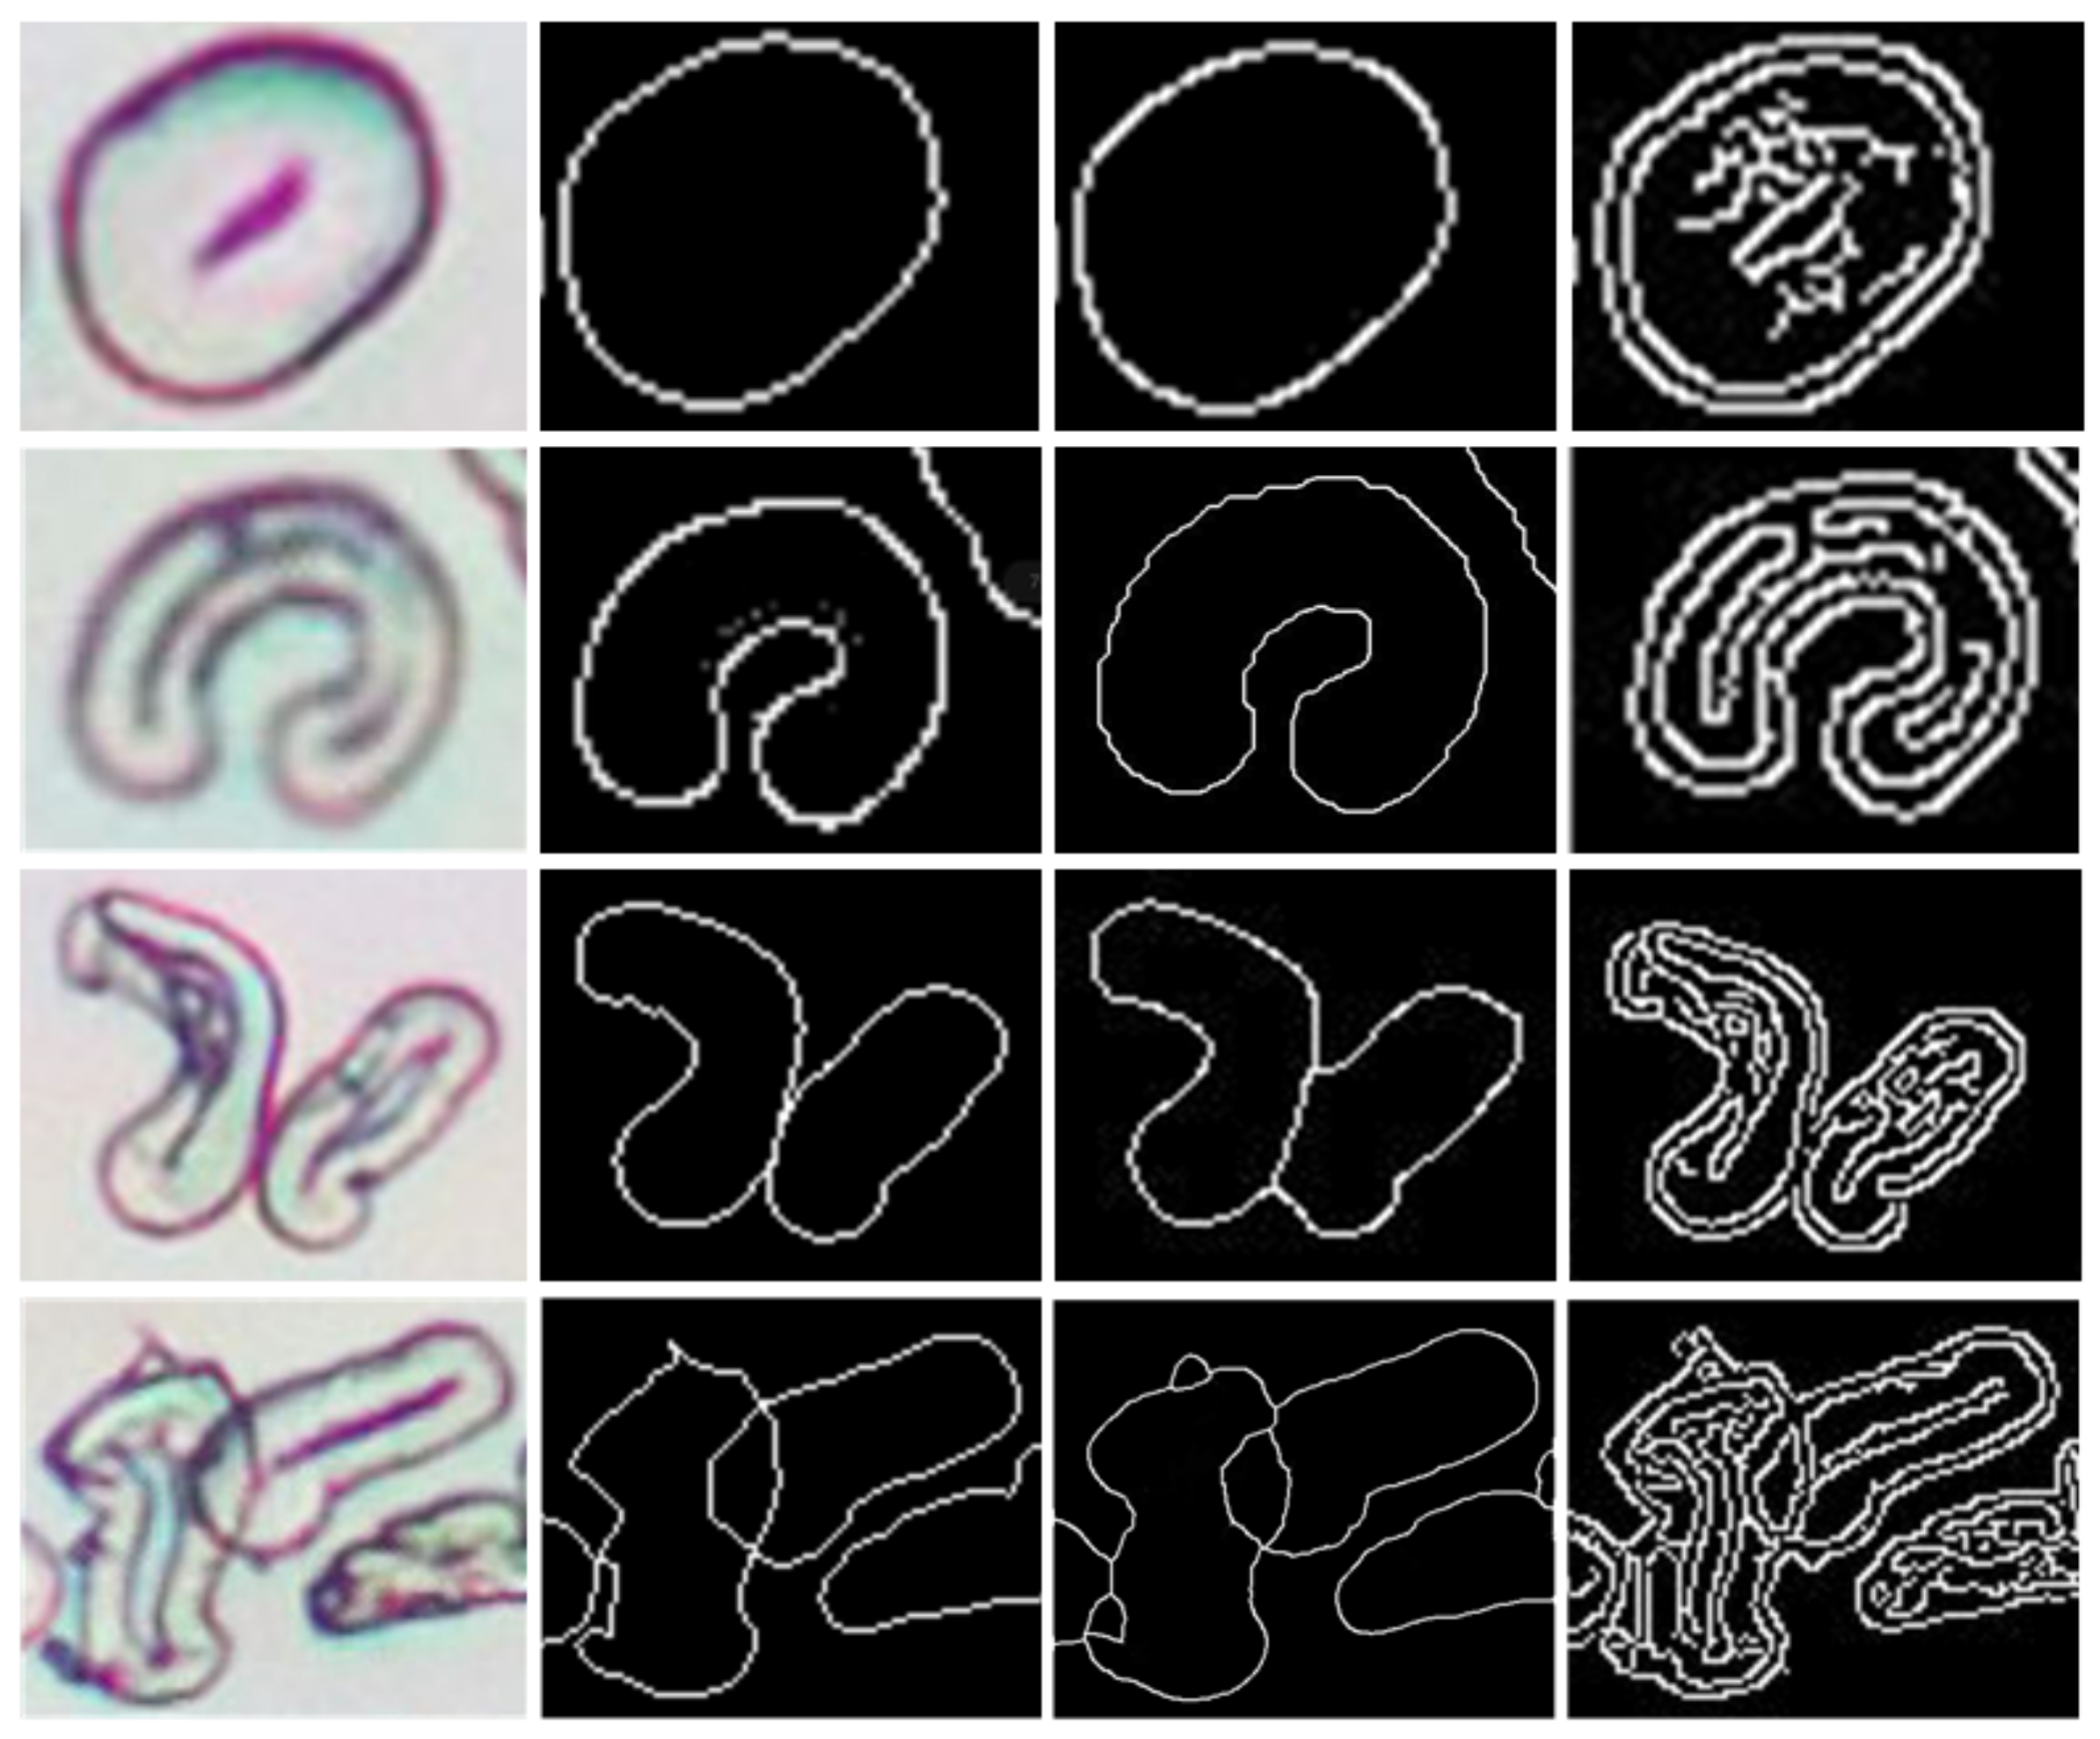
Figure 13 shows the edge detection method of microscopic image of cotton fiber cross-section with the best performance at present, which is, the edge detection effect of the adaptive threshold segmentation method in Reference [11] is compared with that of the method in this paper. From Figure 13, it can be seen that the edge information that is extracted by the adaptive threshold segmentation is chaotic, and there are many useless information and edge fracture phenomena, which is also the reason why the method needs to design the CCM model to remove the error edge information [13]. In contrast, the cross-sectional edge of cotton that was extracted by the method in this paper is clearer and more accurate.
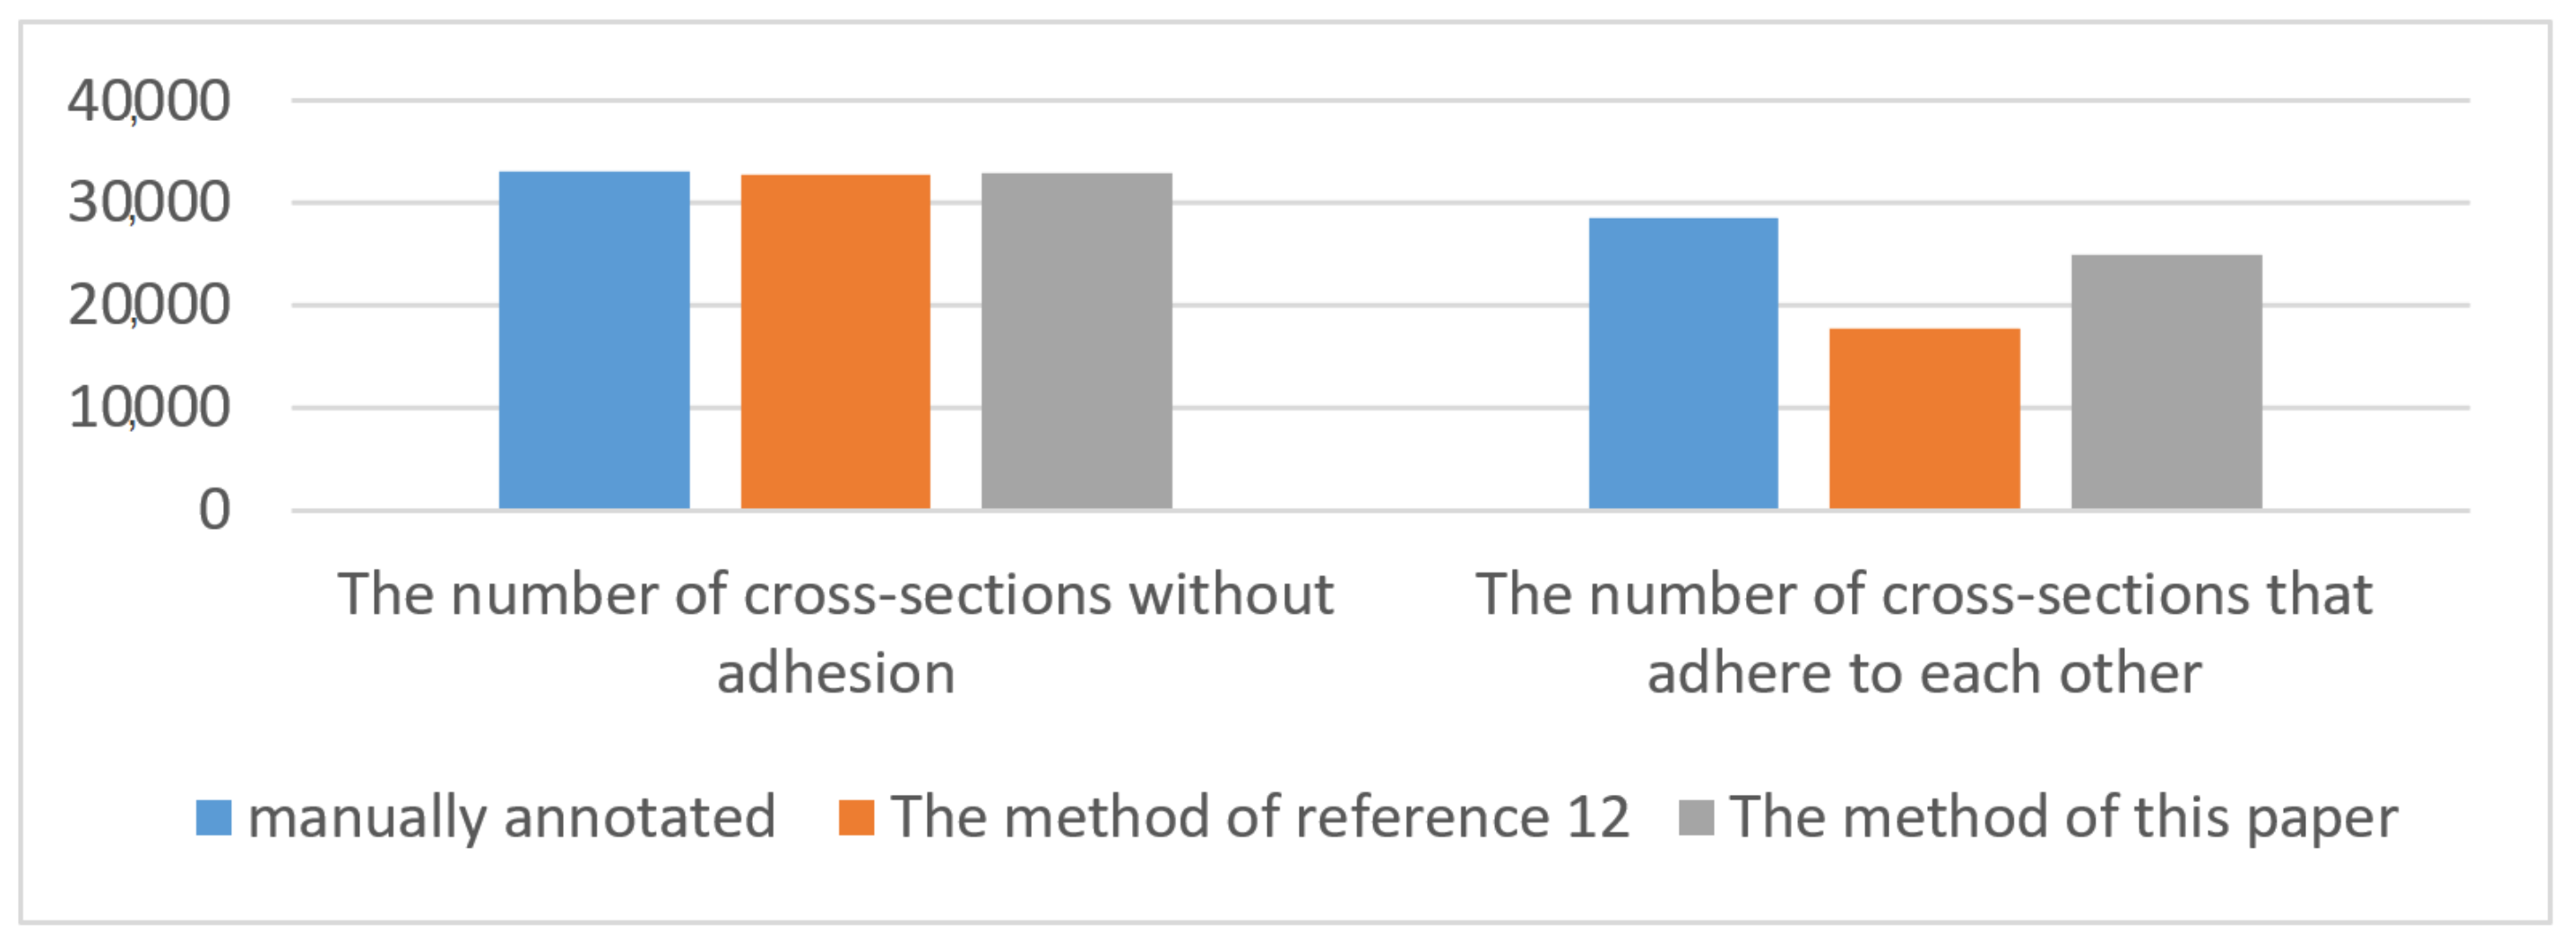
In a test dataset containing 2000 cross-sectional microscopic images of cotton fiber, the number of manually labeled cotton fiber cross-sections was 61,472, of which the number of cross-sections of cotton fiber adhered to each other was 28,461, and the number of cross-sections of cotton fiber without adhesion was 33,011. Figure 14 presents the comparison of the number of cross-sections of cotton fiber extracted by the two methods. In reference [11], 99.34% cross-sections of non-adhesion and 62.54% cross-sections of adhesion were successfully extracted by the method. In this paper, 99.63% cross-sections of non-adhesion and 87.84% cross-sections of adhesion were successfully extracted by the method. Figure 14 shows that the two methods are excellent in extracting cross-sectional areas of non-adhesion cotton. In contrast, the proposed method is more effective in extracting cross-sectional areas of adhesion cotton, and it can successfully extract nearly 90% of the cross-sectional areas of adhesion cotton, thus further improving the accuracy of cotton sample quality assessment.
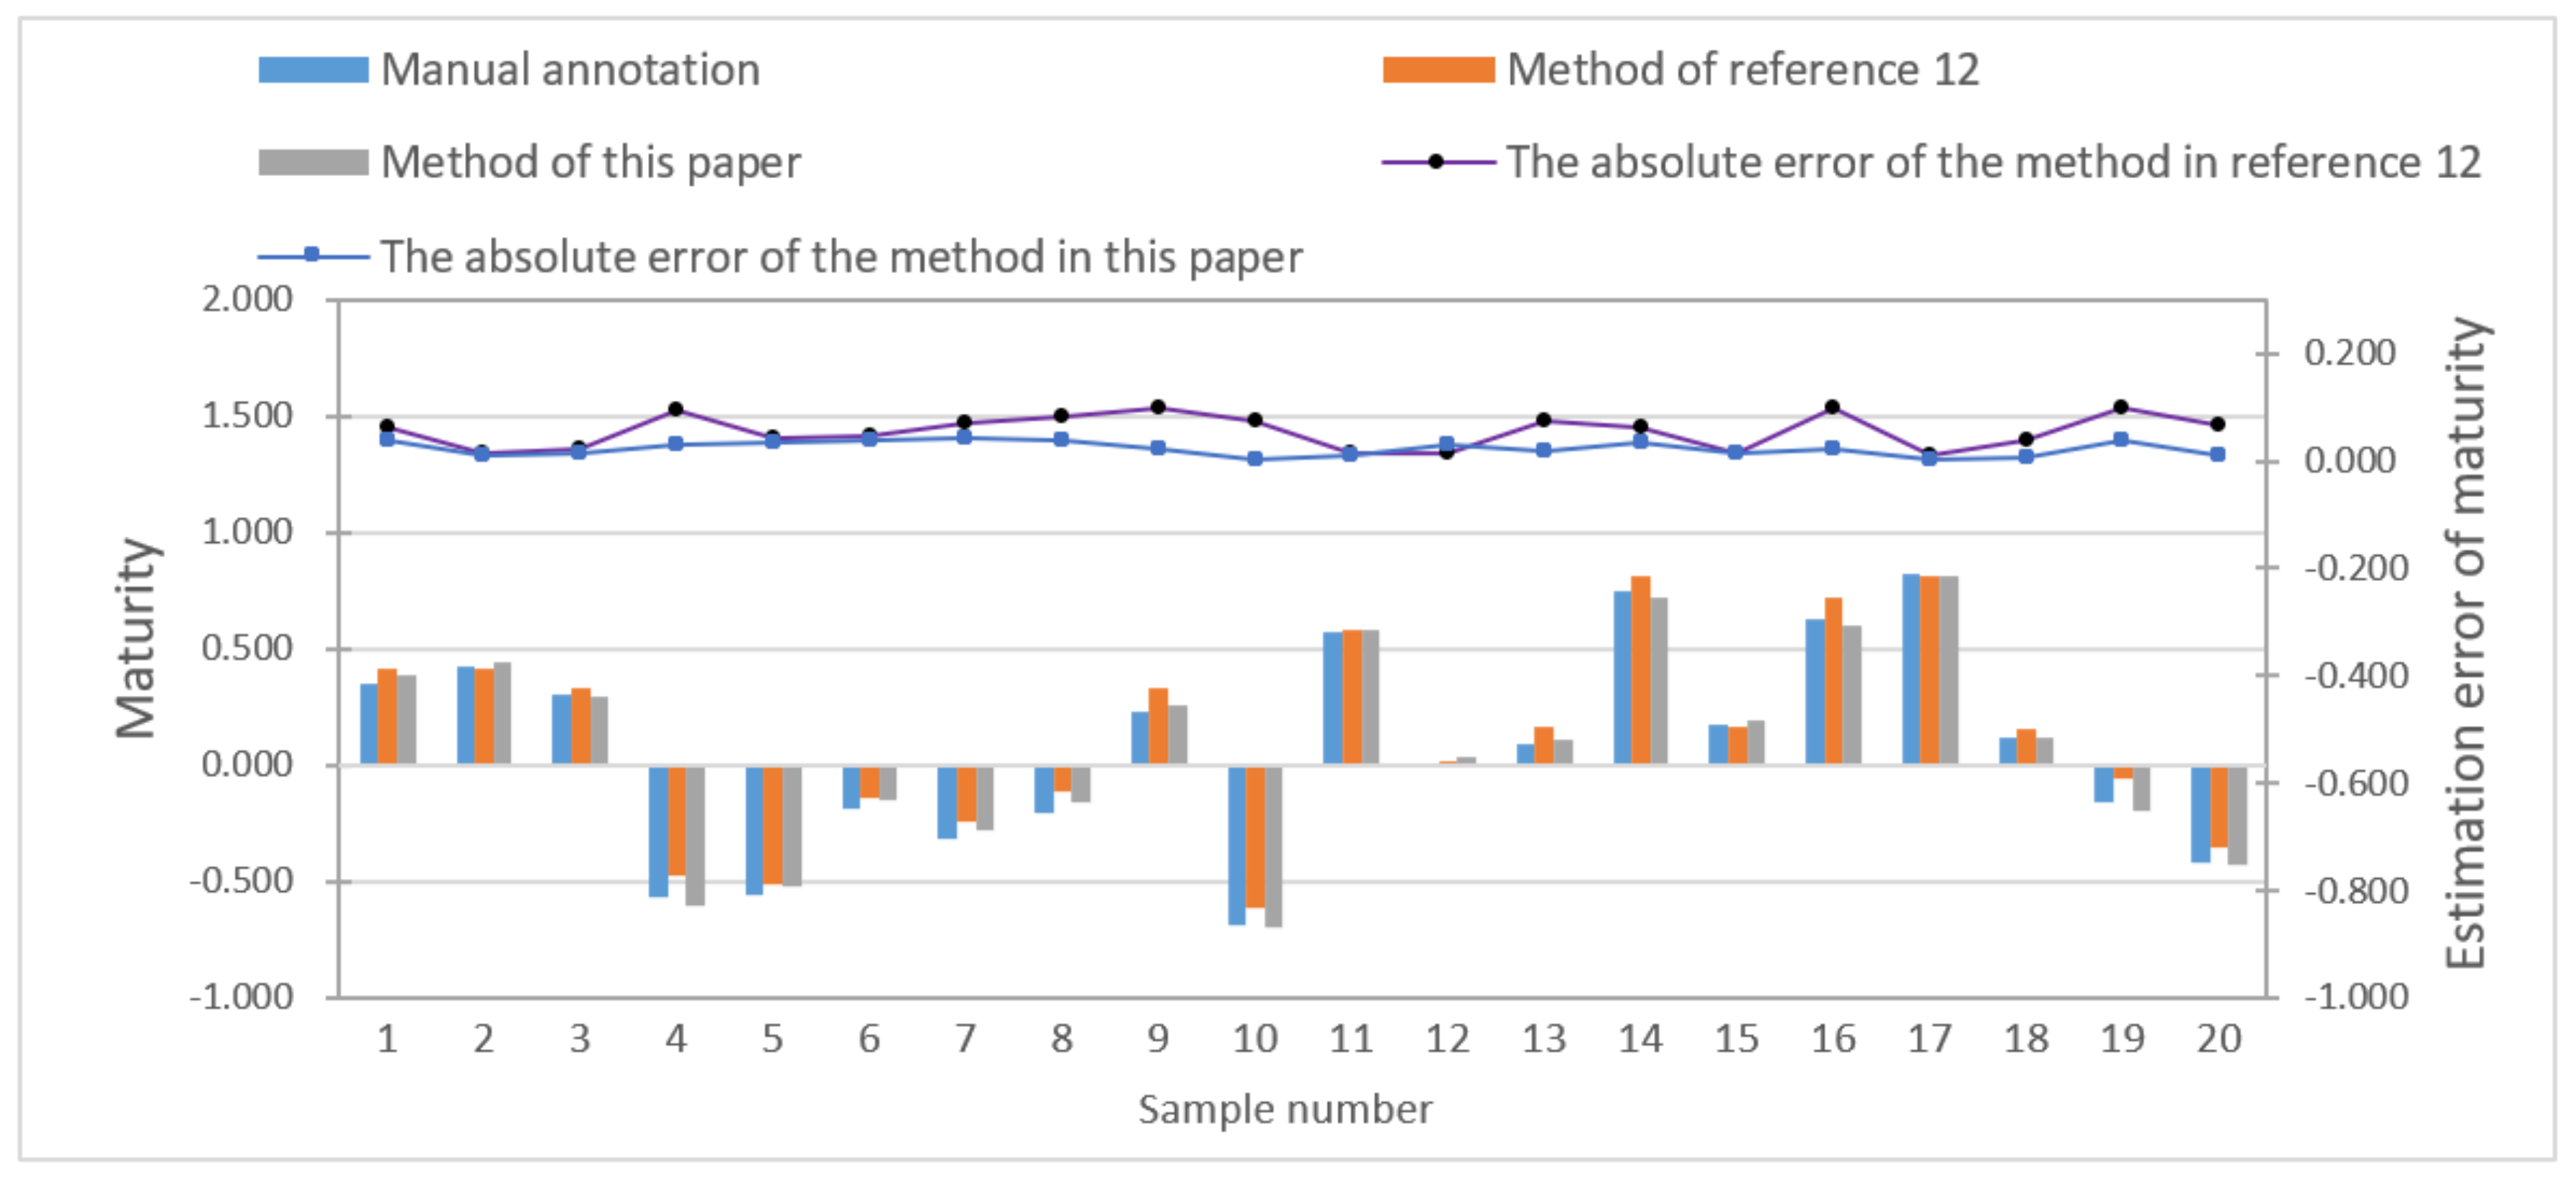
The extracted edge information of cotton fiber cross-section is the outer edge. After extracting the inner edge of each outer edge according to the method that is shown in Figure 2 and calculating the maturity according to formula (1), the maturity of cotton samples can be calculated according to formula (2). Figure 15 shows the quality evaluation results that were obtained by the method in reference [11] and the method in this paper after analyzing the cross-sectional microscopic images of cotton fiber of the other 20 cotton samples. The 20 groups of histograms presented in Figure 15 show the maturity of 10 cotton samples calculated according to the results of manual labeling, the edge detection results of the method in reference [11], and the edge detection results of the method in this paper. The lines in the line chart show the difference between the maturity of cotton samples calculated by the two methods and the maturity of cotton samples calculated according to the manual labeling results. It can be seen, from Figure 15, that the method in reference [11] has insufficient ability to detect the edge of the cross-sections adhere to each other, which makes the calculated maturity of cotton sample larger, with an average error of 0.055. The method in this paper effectively overcomes the above problem, and it makes the deviation of the calculated maturity of the cotton sample smaller and more accurate, with an average error of 0.023.
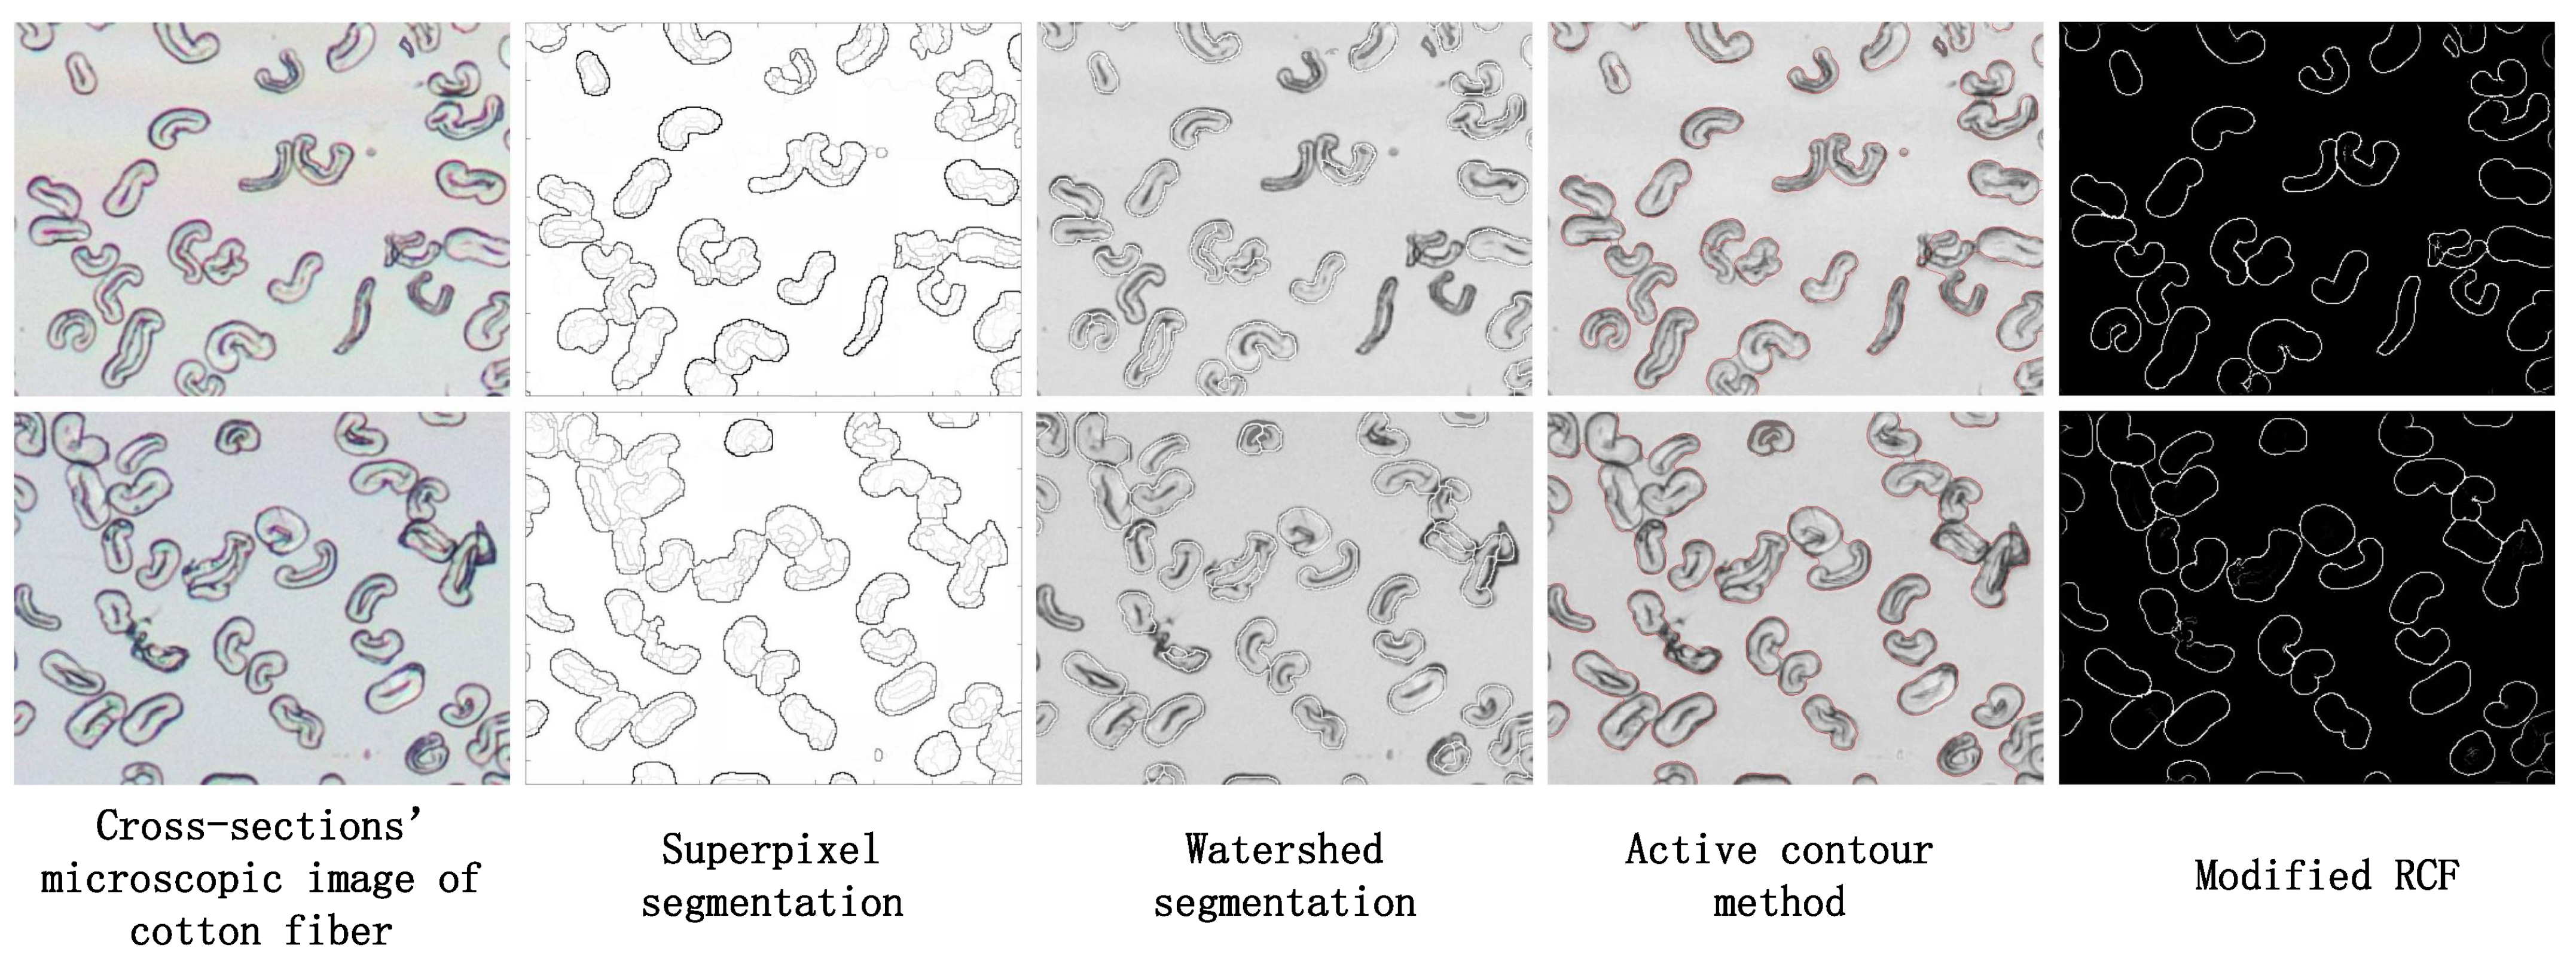
In addition, we also select several widely used image segmentation algorithms to compare with our method, including super-pixel segmentation method [27,28], watershed method [29,30], and automatic contour method [31,32]. The corresponding experimental results are shown in Figure 16. The superpixel segmentation can be used to extract the external edge information of the region where the cotton fiber cross-section is located; however, this method cannot extract the cross-section edge of a single cotton fiber correctly when the cross-section of cotton fiber has adhered to each other or close together. The watershed segmentation can detect the faint edges of adhered objects in the image; however, it is susceptible to sharp changes in the edge, leading to false detection and missed detection. The active contour method is similar to superpixel segmentation and it can be used to extract the external edge information of the region where the cotton fiber cross-section is located; however, the edge of cotton fiber cross-section in the image cannot be extracted intact.
5. Conclusions
According to the characteristics of the cross-sectional microscopic image of cotton fiber, this paper adjusts the network structure and convolution method of the RCF deep neural network that has achieved the best detection performance on the current typical edge detection datasets BSDS500, NYUD, and Multicue. The experimental results show that better detection can be achieved by adjusting the network structure and convolution method according to the characteristics of the microscopic image of cotton fiber cross-section. At the same time, this paper uses multi-scale edge detection and the fusion of image pyramid to further improve the performance of edge detection, so as to ultimately improve the accuracy of cross-section extraction quantity and cotton sample quality evaluation.
In the future, I think that the following aspects can be further studied: in terms of technical improvement, it can be combined with object detection, image segmentation, and other technologies. For example, in combination with object detection, we can first determine the rectangular region where the cotton fiber cross-section is located and then perform boundary extraction within the region. In image acquisition, there is also a lot of research and progress in the technology that is related to macrolide making and image acquisition, so it is advisable to adopt more advanced technology to obtain higher quality micro slides and better cameras in order to obtain clear images.
Author Contributions
Formal analysis, Q.W.; investigation, Q.W.; validation, D.H.; writing—original draft, D.H. and Q.W. All authors have read and agreed to the published version of the manuscript.
Funding
This research received no external funding.
Data Availability Statement
Authors can confirm that all relevant data are included in the article.
Acknowledgments
Thanks to Xubu Gao of Texas State University for his assistance in the production of microscopic slides and image acquisition.
Conflicts of Interest
The authors declare no conflict of interest.
References
- Rodgers, J.E. Rapid Cotton Maturity and Fineness Measurements Using the COTTONSCOPE®. In Proceedings of the Beltwide Cotton Conference, Memphis, TN, USA, 3–6 January 2012. [Google Scholar]
- Shahriar, M.; Scott-Fleming, I.; Sari-Sarraf, H.; Hequet, E. A machine vision system to estimate cotton fiber maturity from longitudinal view using a transfer learning approach. Mach. Vis. Appl. 2013, 24, 1661–1683. [Google Scholar] [CrossRef]
- Zhang, Z.; Li, J.; Muhammad, J.; Shi, Y.; Yuan, Y. Genome-wide quantitative trait loci reveal the genetic basis of cotton fibre quality and yield-related traits in a Gossypium hirsutum recombinant inbred line population. Plant Biotechnol. J. 2020, 18, 239–253. [Google Scholar] [CrossRef] [PubMed] [Green Version]
- Negm, M.; Sanad, S. Cotton fibres, picking, ginning, spinning and weaving. In Handbook of Natural Fibres, 2nd ed.; Woodhead Publishing: Cambridge, UK, 2020; pp. 3–48. [Google Scholar]
- Kljun, A.; El-Dessouky, H.M.; Benians, T.; Goubet, F.; Meulewaeter, F.; Knox, J.P.; Blackburn, R.S. Analysis of the physical properties of developing cotton fibres. Eur. Polym. J. 2014, 51, 57–68. [Google Scholar] [CrossRef]
- Paudel, D.R.; Hequet, E.F.; Abidi, N. Evaluation of cotton fiber maturity measurements. Ind. Crop. Prod. 2013, 45, 435–441. [Google Scholar] [CrossRef]
- Liu, Y.; Kim, H.J.; Delhom, C.D.; Thibodeaux, D.P. Investigation of fiber maturity measurement by cross-sectional image analysis and Fourier transform infrared spectroscopy on developing and developed upland cottons. Cellulose 2019, 26, 5865–5875. [Google Scholar] [CrossRef]
- Yin, K.C.; Yu, W.D. Cotton Fibre Maturity System Based on Polarized Light. Comput. Eng. 2008, 17, 235–237. [Google Scholar]
- Huang, Y.; Xu, B. Image Analysis for Cotton Fibers: Part I: Longitudinal Measurements. Text. Res. J. 2016, 72, 713–798. [Google Scholar] [CrossRef]
- Liu, Y.; Thibodeaux, D.; Gamble, G.; Bauer, P.; VanDerveer, D. Comparative Investigation of Fourier Transform Infrared (FT-IR) Spectroscopy and X-ray Diffraction (XRD) in the Determination of Cotton Fiber Crystallinity. Appl. Spectrosc. 2012, 66, 983–986. [Google Scholar] [CrossRef] [PubMed]
- Guo, X.; Ouyang, W.; Xu, B. Assessing cotton maturity using distributional parameters of fiber cross-section measurements. Text. Res. J. 2015, 84, 1666–1676. [Google Scholar] [CrossRef]
- Xu, B.; Huang, Y. Image Analysis for Cotton Fibers Part II: Cross-Sectional Measurements. Text. Res. J. 2004, 74, 409–416. [Google Scholar] [CrossRef]
- Wang, Q.; Xu, B. A coupled-contour model for effective segmentation of cotton cross-sections in wide-field microscopic images. Text. Res. J. 2016, 87, 1509–1521. [Google Scholar] [CrossRef]
- Long, J.; Shelhamer, E.; Darrell, T. Fully Convolutional Networks for Semantic Segmentation. IEEE Trans. Pattern Anal. Mach. Intell. 2015, 39, 640–651. [Google Scholar]
- He, K.; Gkioxari, G.; Dollár, P.; Girshick, R. Mask R-CNN. In Proceedings of the IEEE International Conference on Computer Vision, Venice, Italy, 22–29 October 2017. [Google Scholar]
- Kim, I.; Baek, W.; Kim, S. Spatially Attentive Output Layer for Image Classification. In Proceedings of the 2020 IEEE/CVF Conference on Computer Vision and Pattern Recognition (CVPR), Seattle, WA, USA, 13–19 June 2020. [Google Scholar]
- Schmarje, L.; Santarossa, M.; Schrder, S.M.; Koch, R. A survey on Semi-, Self- and Unsupervised Learning in Image Classification. arXiv 2020, arXiv:2002.08721. [Google Scholar]
- Bochkovskiy, A.; Wang, C.Y.; Liao, H. YOLOv4: Optimal Speed and Accuracy of Object Detection. arXiv 2020, arXiv:2004.10934. [Google Scholar]
- Ren, S.; He, K.; Girshick, R.; Sun, J. Faster R-CNN: Towards Real-Time Object Detection with Region Proposal Networks. IEEE Trans. Pattern Anal. Mach. Intell. 2017, 39, 1137–1149. [Google Scholar] [CrossRef] [PubMed] [Green Version]
- Bertasius, G.; Shi, J.; Torresani, L. DeepEdge: A Multi-Scale Bifurcated Deep Network for Top-Down Contour Detection. In Proceedings of the Computer Vision & Pattern Recognition, Boston, MA, USA, 7–12 June 2015. [Google Scholar]
- Ganin, Y.; Lempitsky, V. N4-Fields: Neural Network Nearest Neighbor Fields for Image Transforms; Springer: Cham, Switzerland, 2014. [Google Scholar]
- Xie, S.; Tu, Z. Holistically-Nested Edge Detection. Int. J. Comput. Vis. 2015, 125, 3–18. [Google Scholar] [CrossRef]
- Liu, Y.; Cheng, M.M.; Hu, X.; Bian, J.W.; Zhang, L.; Bai, X.; Tang, J. Richer Convolutional Features for Edge Detection. IEEE Trans. Pattern Anal. Mach. Intell. 2019, 41, 1939–1946. [Google Scholar] [CrossRef] [Green Version]
- Naylor, G.; Pate, M.; Higgerson, G.J. Determination of cotton fiber maturity and linear density (fineness) by examination of fiber cross-sections. Part 2: A comparison optical and scanning electron microscopy. Text. Res. J. 2014, 84, 1939–1947. [Google Scholar] [CrossRef]
- Qin, X.; He, S.; Zhang, Z.; Dehghan, M.; Jagersand, M. ByLabel: A Boundary Based Semi-Automatic Image Annotation Tool. In Proceedings of the 2018 IEEE Winter Conference on Applications of Computer Vision (WACV), Lake Tahoe, NV, USA, 12–15 March 2018. [Google Scholar]
- Simonyan, K.; Zisserman, A. Very Deep Convolutional Networks for Large-Scale Image Recognition. arXiv 2014, arXiv:1409.1556. [Google Scholar]
- Levinshtein, A.; Stere, A.; Kutulakos, K.N.; Fleet, D.J.; Dickinson, S.J.; Siddiqi, K. TurboPixels: Fast Superpixels Using Geometric Flows. IEEE Trans. Pattern Anal. Mach. Intell. 2009, 31, 2290–2297. [Google Scholar] [CrossRef] [PubMed] [Green Version]
- Stutz, D.; Hermans, A.; Leibe, B. Superpixels: An evaluation of the state-of-the-art. Comput. Vis. Image Underst. 2018, 166, 1–27. [Google Scholar] [CrossRef] [Green Version]
- Gaetano, R.; Masi, G.; Poggi, G.; Verdoliva, L.; Scarpa, G. Marker-Controlled Watershed-Based Segmentation of Multiresolution Remote Sensing Images. IEEE Trans. Geosci. Remote Sens. 2015, 53, 2987–3004. [Google Scholar] [CrossRef]
- Zhang, H.; Tang, Z.; Xie, Y.; Gao, X.; Chen, Q. A watershed segmentation algorithm based on an optimal marker for bubble size measurement. Measurement 2019, 138, 182–193. [Google Scholar] [CrossRef]
- Ciecholewski, M.; Spodnik, J. Semi—Automatic Corpus Callosum Segmentation and 3D Visualization Using Active Contour Methods. Symmetry 2018, 10, 589. [Google Scholar] [CrossRef] [Green Version]
- Jin, R.; Yin, J.; Wei, Z.; Jian, Y. Level Set Segmentation Algorithm for High-Resolution Polarimetric SAR Images Based on a Heterogeneous Clutter Model. Sel. Top. Appl. Earth Obs. Remote Sens. IEEE J. 2017, 10, 4565–4579. [Google Scholar] [CrossRef]
Figure 1.
Microscopic image of cotton fiber cross-section (part).

Figure 2.
Cross-section and edge of cotton fiber. (a) Microscopic image of a cotton fiber cross-section. (b) Edge of cross-section.
Figure 2.
Cross-section and edge of cotton fiber. (a) Microscopic image of a cotton fiber cross-section. (b) Edge of cross-section.

Figure 3.
Processing of inner edge of cross-section.(a) Cross-section without inner edge. (b) Normal cross-section. (c) Cross-section with multiple fragments of the inner edge.
Figure 3.
Processing of inner edge of cross-section.(a) Cross-section without inner edge. (b) Normal cross-section. (c) Cross-section with multiple fragments of the inner edge.

Figure 4.
Maturity distribution curves of five cotton samples with different quality.

Figure 5.
RCF network architecture.

Figure 6.
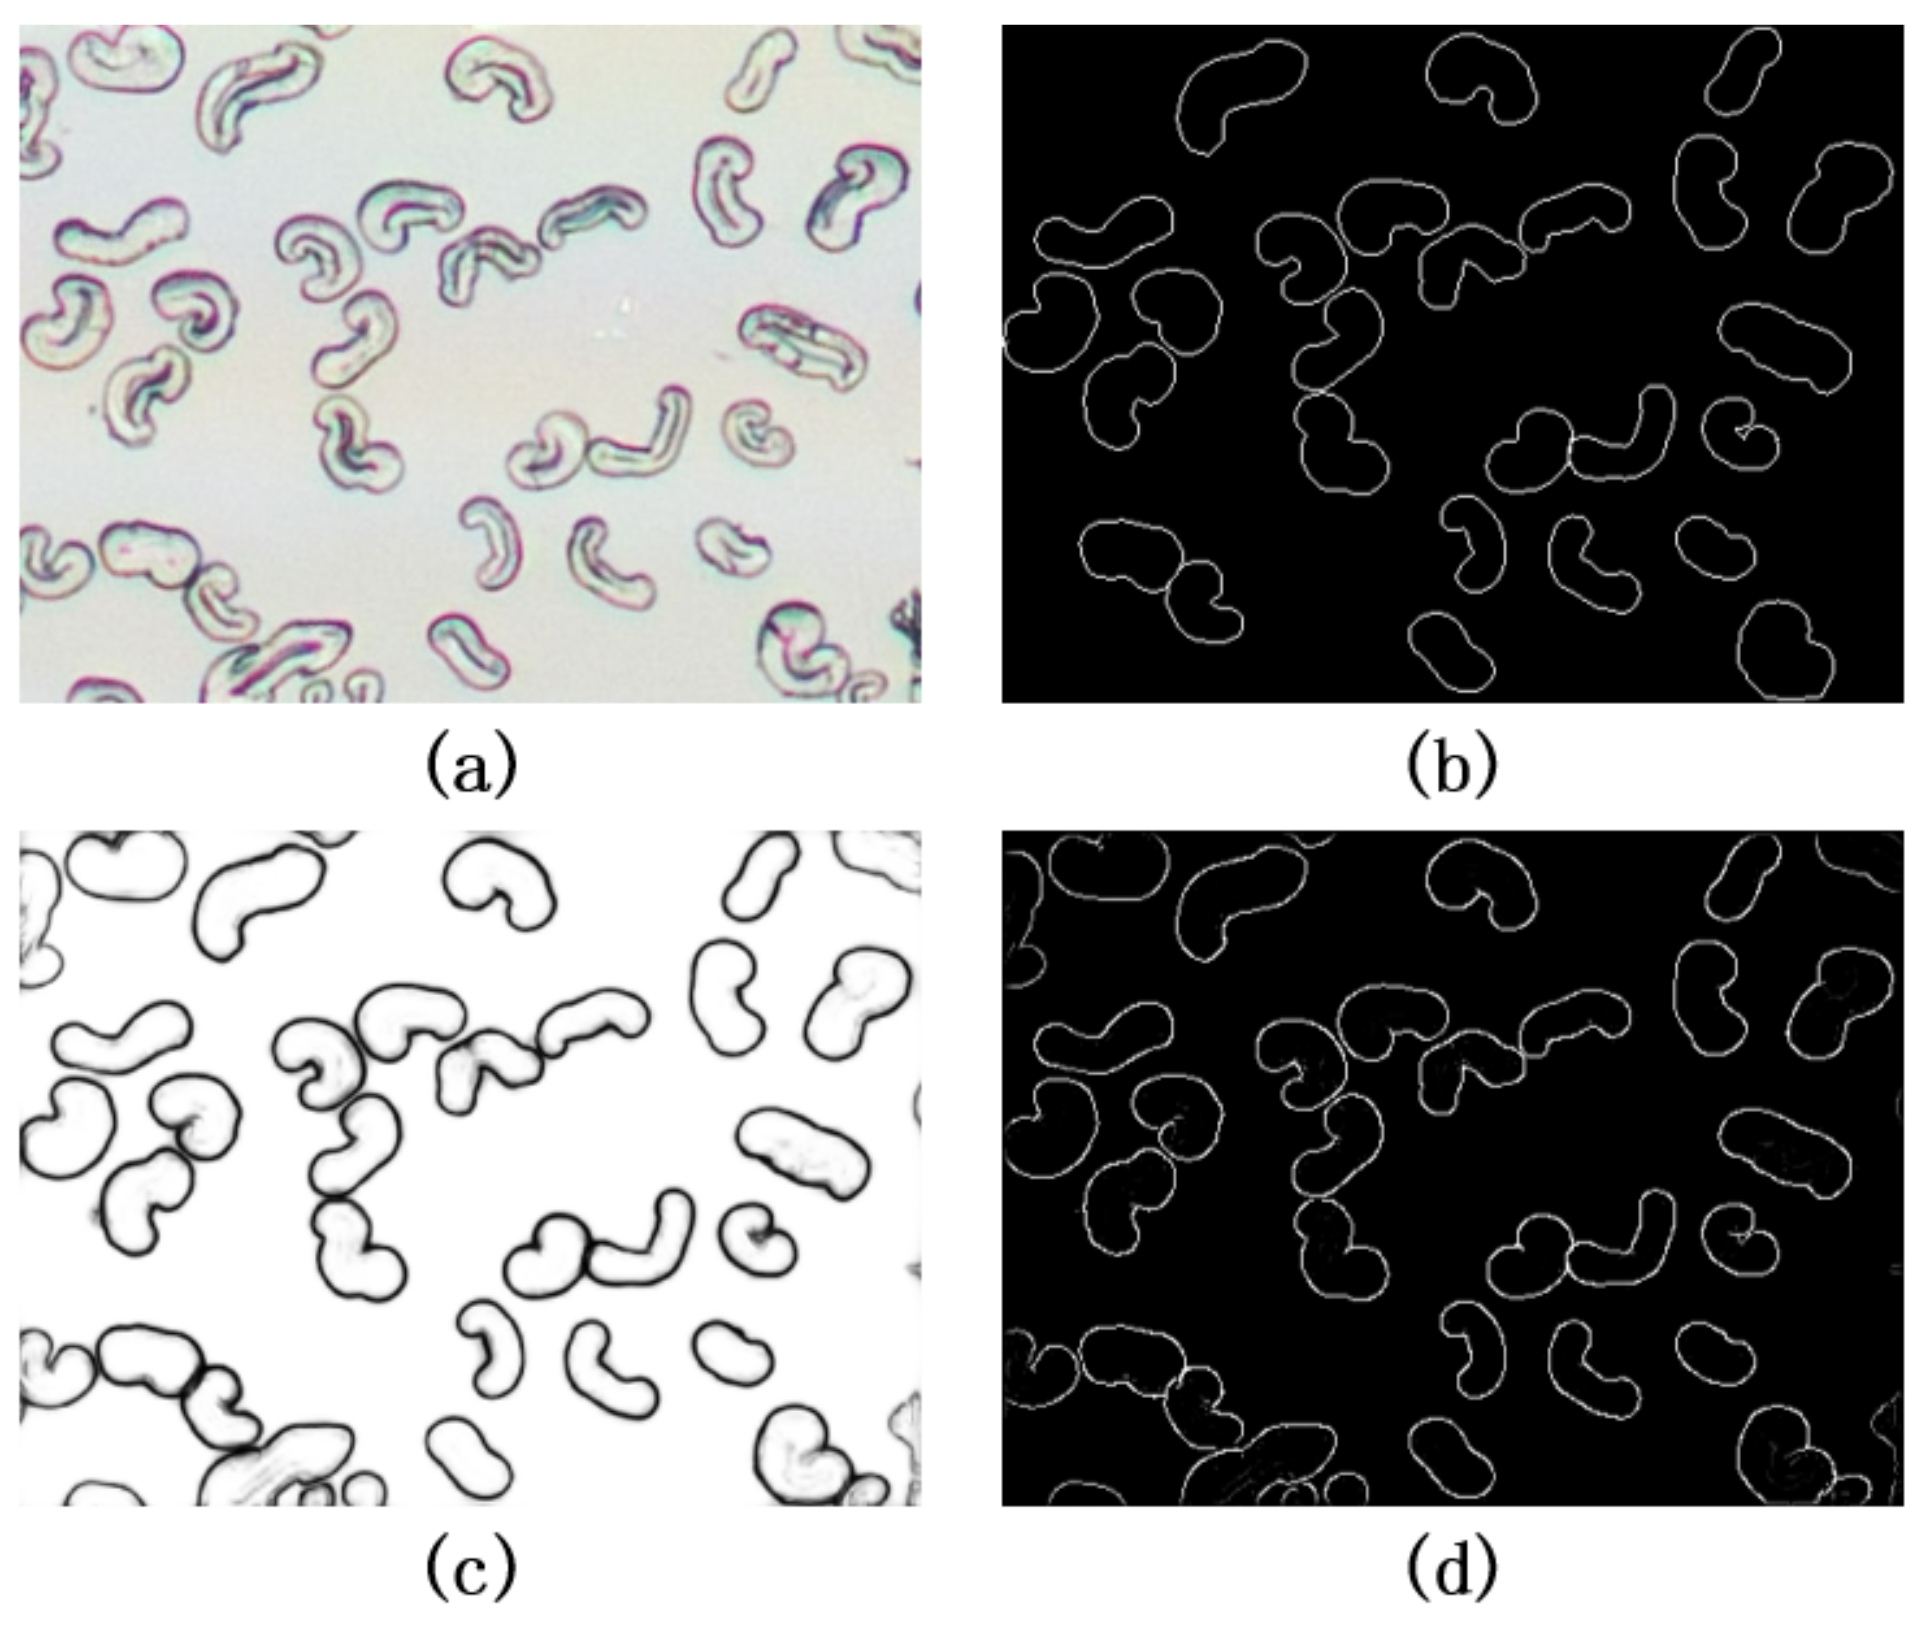
Edge detection of microscopic image of cotton fiber cross-section using RCF. (a) is the original image. (b) is the true edge of the manual annotation. (c) is output image of RCF. (d) is the edge of cross-sections image that is obtained by Non-Maximum Suppression (NMS).
Figure 6.
Edge detection of microscopic image of cotton fiber cross-section using RCF. (a) is the original image. (b) is the true edge of the manual annotation. (c) is output image of RCF. (d) is the edge of cross-sections image that is obtained by Non-Maximum Suppression (NMS).

Figure 7.
Output image of each stage in RCF.

Figure 8.
RCF networks with different Deeply-Supervised Structure.

Figure 9.
The schematic diagram of multi-scale edge detection and fusion of image pyramid.

Figure 10.
The influence of dilated convolution on different datasets. (a) The original image. (b) RCF. (c) RCF-NoDila.
Figure 10.
The influence of dilated convolution on different datasets. (a) The original image. (b) RCF. (c) RCF-NoDila.

Figure 11.
P-R curve of each edge detection algorithm.

Figure 12.
P-R curve of multi-scale edge detection and fusion of image pyramid.

Figure 13.
The comparison of edge detection effect between the method in this paper and the method in reference [11]. The first column is the cross-sectional microscopic images of cotton fiber, the second column is the manually labeled edge information, the third column is the edge detection result of the method in this paper, and the fourth column is the edge detection result of the method in reference [11].

Figure 14.
The comparison of edge detection effect between the method in this paper and the method in reference [11].
Figure 14.
The comparison of edge detection effect between the method in this paper and the method in reference [11].

Figure 15.
The comparison of evaluation results of cotton fiber quality between method in this paper and method in Reference [11].
Figure 15.
The comparison of evaluation results of cotton fiber quality between method in this paper and method in Reference [11].

Figure 16.
Comparison of detection results of different algorithms.


Table 1.
Relation among , characteristic of maturity distribution curve, quality of cotton sample.
| Characteristic of Quality of Cotton Sample | Maturity Distribution Curve | |
|---|---|---|
| Sharp right inclining | Excellent | |
| Right inclining | Good | |
| Approximate normal distribution | Normal | |
| Left inclining | Poor | |
| Sharp left inclining | Bad |
Table 2.
Comparison of edge detection results of dilated convolution on different datasets.
| Method | BSDS500l | Our Dataset | ||
|---|---|---|---|---|
| ODS | AP | ODS | AP | |
| RCF | 0.806 | 0.816 | 0.878 | 0.874 |
| RCF-NoDila | 0.803 | 0.812 | 0.879 | 0.880 |
Table 3.
Comparison of experimental results of edge detection algorithms.
| Method | ODS | OIS | AP |
|---|---|---|---|
| RCF-NoDsn | 0.899 | 0.903 | 0.828 |
| RCF-Dsn12 | o.893 | 0.897 | 0.914 |
| RCF-Dsn45 | 0.885 | 0.888 | 0.841 |
| RCF-Dsn123 | 0.881 | 0.887 | 0.899 |
| RCF | 0.878 | 0.882 | 0.874 |
| HED | 0.877 | 0.879 | 0.863 |
| Canny | 0.439 | 0.439 | 0.000 |
Table 4.
Comparison of multi-scale edge detection and fusion of image pyramid experiments.
| Method | ODS | OIS | AP |
|---|---|---|---|
| RCF-MS | 0.883 | 0.884 | 0.886 |
| RCF | 0.878 | 0.882 | 0.874 |
| HED-MS | 0.878 | 0.883 | 0.880 |
| HED | 0.877 | 0.879 | 0.863 |
Publisher’s Note: MDPI stays neutral with regard to jurisdictional claims in published maps and institutional affiliations. |
© 2021 by the authors. Licensee MDPI, Basel, Switzerland. This article is an open access article distributed under the terms and conditions of the Creative Commons Attribution (CC BY) license (https://creativecommons.org/licenses/by/4.0/).
Share and Cite
MDPI and ACS Style
He, D.; Wang, Q. Edge Detecting Method for Microscopic Image of Cotton Fiber Cross-Section Using RCF Deep Neural Network. Information 2021, 12, 196. https://0-doi-org.brum.beds.ac.uk/10.3390/info12050196
AMA Style
He D, Wang Q. Edge Detecting Method for Microscopic Image of Cotton Fiber Cross-Section Using RCF Deep Neural Network. Information. 2021; 12(5):196. https://0-doi-org.brum.beds.ac.uk/10.3390/info12050196
Chicago/Turabian StyleHe, Defeng, and Quande Wang. 2021. "Edge Detecting Method for Microscopic Image of Cotton Fiber Cross-Section Using RCF Deep Neural Network" Information 12, no. 5: 196. https://0-doi-org.brum.beds.ac.uk/10.3390/info12050196
Note that from the first issue of 2016, this journal uses article numbers instead of page numbers. See further details here.