An Integrated Graph Model for Document Summarization


School of Information Science and Engineering, Central South University, Changsha 410083, China
*
Author to whom correspondence should be addressed.
Information 2018, 9(9), 232; https://0-doi-org.brum.beds.ac.uk/10.3390/info9090232
Submission received: 9 July 2018
/
Revised: 6 September 2018
/
Accepted: 6 September 2018
/
Published: 13 September 2018
(This article belongs to the Section Artificial Intelligence)
Abstract
:Extractive summarization aims to produce a concise version of a document by extracting information-rich sentences from the original texts. The graph-based model is an effective and efficient approach to rank sentences since it is simple and easy to use. However, its performance depends heavily on good text representation. In this paper, an integrated graph model (iGraph) for extractive text summarization is proposed. An enhanced embedding model is used to detect the inherent semantic properties at the word level, bigram level and trigram level. Words with part-of-speech (POS) tags, bigrams and trigrams were extracted to train the embedding models. Based on the enhanced embedding vectors, the similarity values between the sentences were calculated in three perspectives. The sentences in the document were treated as vertexes and the similarity between them as edges. As a result, three different types of semantic graphs were obtained for every document, with the same nodes and different edges. These three graphs were integrated into one enriched semantic graph in a naive Bayesian fashion. After that, TextRank, which is a graph-based ranking algorithm, was applied to rank the sentences, before the top scored sentences were selected for the summary according to the compression rate. Evaluated on the DUC 2002 and DUC 2004 datasets, our proposed method shows competitive performance compared to the state-of-the-art methods.
1. Introduction
The exponential growth of online publishing provides users with a large amount of text on a great diversity of topics, which leads to redundancy and makes it difficult for users to find relevant information. To obtain information-rich text contents, finding techniques that can generate a concise description of large documents has become urgent [1].
In this scenario, automatic document summarization is considered to be an effective solution. Automatic text summarization takes single or multiple documents as an input and creates a short form of the document/documents by identifying the relevant contents, removing the redundant information and shortening the length [2]. If the significance of every sentence were weighted almost equally, generating a summary would not be easy, as any reduction in the content of a document would result in a loss of information. Fortunately, one can identify rich and poor informative contents since the text content in a document appears in bursts. Therefore, the main challenge is distinguishing the salient sentence segments [3].
Automatic document summarization is a significant task that has been applied in natural language understanding and information retrieval [4]. Summarization is not a new topic. In the past fifty years, text summarization has been greatly improved since it was first proposed [5]. Recently, many summarization methods and techniques have been proposed.
The existing summarization methods can be mainly categorized into two types: extractive and abstractive [6]. Extractive summarization generates the summary by concatenating several sentences that are extracted directly from the original document or documents. In contrast, abstractive summarization produces an abstract summary, which consists of the main information or ideas from the original document, which is rephrased in a different form [5]. Extractive approaches are more widely used today, because less computation is required. Abstractive summarization demands more complicated understanding and deeper analysis of text documents. For this reason, extractive methods often have better results compared with abstractive methods [7]. In this paper, our approach focuses on the extractive summarization of a single document.
Graph-based summarization methods have achieved robust and promising results [8,9,10,11]. In these approaches, the sentences are treated as nodes and the relationships between them are the edges. The significance score of each sentence in a document is considered to be related to other sentences. An edge (or link) with a related weight is created if there is a relatedness between two sentences, while the weights between the sentences in a document are used to assign a score for each sentence. The first and most important step of this method is to obtain the representation of a high-quality relationship among the sentences in a document. Generally, these methods build the graph by modeling the sentence as nodes and the similarity values between two sentences as edges. After the graph is constructed, the graph algorithms, e.g., PageRank [12] and TextRank [8], are often used as an unsupervised way to compute the sentence importance score.
Despite the encouraging performance of the graph-based summarization methods that have been proposed by previous researchers, the inner semantic similarity is often ignored because of the limitation of text representation [13,14,15]. The classical text representation is bag-of-words (BOW). It is widely used for its simplicity and ease of use. However, many disadvantages, such as a poor sense of semantics, sparsity and high-dimensionality, make BOW unable to produce a good text representation with accurate semantic meaning [16]. When Mikolov et al. from Google proposed the algorithm word2vec [17] in 2013, word embedding witnessed a sharp increase in interest. Word embeddings could largely catch the semantic similarity on the word level. Several more complex semantic phenomena, such as polysemy and the meaning of phrases, lead to inaccurate similarity calculations. Since many previous studies show that graph-based ranking algorithms usually perform better, especially when fed a good feature matrix, we used the TextRank [15] algorithm to rank and select sentences for the summary in this present paper.
The main contribution of our work is the proposal of an integrated graph-based model for summarization, which extracts sentences from a document by applying the TextRank algorithm. We train the word embedding model with part-of-speech (POS) tags to improve the efficiency of the text representation, which possibly occurs by improving the handling of homographs and polysemy, and we train the embedding of N-grams to try to help to capture the phrase meaning. Therefore, the semantic graph includes multiple aspects. We propose an integrated graph model that combines three semantic graphs. Finally, we propose a redundancy elimination technique for further improvement of the summary.
The rest of this paper is organized as follows. In Section 2, we discuss the related work. The proposed method for determining the similarity of sentences and the extractive summarization method is detailed in Section 3. Section 4 presents the experimental results and comparison with baselines. Finally, we conclude this work in Section 5.
2. Related Work
2.1. Graph-Based Approaches
Constructing a graph by treating sentences as vertexes and regarding the relatedness between them as edges has been considered by former researchers. There are several papers constructing the edges between two sentences using their similarity.
As early as 2004, with TextRank [8], the authors proposed an undirected weighted graph according to the sentence similarity. In their work, sentence overlap is applied to measure the relationship. Sentences that include the certain concepts in the document are likely to share the same information, and thus an edge can be formed by the link between two sentences that contain the same content. In CoRank [15] and many other studies, the same definition of similarity is applied. Researchers in reference [18] excluded all other words but meaningful nouns when determining the common contents. In other words, only the meaningful nouns were taken into consideration when calculating the similarity of sentences.
Erkan and Radev represent sentences as the N-dimension vectors using the bag-of-words model [7], where N is the vocabulary size. They calculate the similarity score by the cosine value of two sentence vectors. This representation of text faces many drawbacks, such as high dimensions and sparsity. In reference [19], a weighted word-frequency vector is used to represent sentences.
Another work that is highly related to ours is GraphSum (graph-based summarizer) [20], which is a graph-based multi-document summarizer. In their graph model, the nodes represent terms. Frequent itemset mining techniques are applied to determine the association rules, which are taken into account when representing the correlations between multiple terms that are usually ignored. For the graph-based multi-document summarizer, the affinity graph-based approach proposed by Wan and Yang in reference [21] includes a diffusion procedure to capture the semantic relationships among sentences. The graph ranking algorithm runs on the differentiated intra-document edges and inter-document edges between the sentences to choose information-rich sentences for the final summary.
The human-created knowledge bases, such as Wikipedia, offer a further possibility for automatic document summarization. In reference [22], the researchers used Wikipedia to help understand the input text in terms of salient concepts. They represented the document using a bipartite sentence-concept graph, before an iterative ranking algorithm was used to rank the sentences for the candidates to be included in the summary.
Fang et al. tried to utilize the word–sentence relationship to rank the sentences. They represent the document as two matrices. The first one represents the adjacent matrix of the sentence graph. The second matrix is the word–sentence matrix, which represents the relationship between words and sentences. After this, a linear combination between the sentence graph and word–sentence weight is used to obtain the scores for each sentence [15]. Most of the graph-based extractive approaches represent the sentence as a bag of words to measure the content similarity value, which might fail to detect redundant sentences that are semantically similar. Extra time and effort from the domain expert is needed to build a semantic graph from a manually created ontology, especially in graph-based abstractive summarization [23]. Khan et al. built a semantic graph in which the nodes denote the predicate argument structures (PAS). The redundant PASs are removed using the maximal marginal relevance for re-ranking.
This paper focuses on two interesting points that are different from the previous work: (1) how to improve the text representation while computing the sentence similarity values; and (2) how to measure the sentence similarity from different resources and how to integrate different feature graphs to build a final enhanced graph for summarization.
2.2. Word Embeddings
Word embedding is used in many NLP tasks. Being able to determine the semantic similarity between two sentences is of great benefit. The challenge in employing word embedding lies in moving from word-level semantics to sentence-level semantics and text-level semantics [24], with the researchers striving to go from word embedding to sentence-level and document-level embedding.
Wieting et al. tried to build sentence embedding based on a large scale corpus set of paraphrase pairs [25]. The objective function of the neural network model is to optimize the word embedding in order to maximize the cosine similarity of the sentence embedding for the pairs. They used paraphrase pairs and word embedding to build the sentence embedding.
Kobayashi et al. used document-level similarity to summarize the document [26]. They proposed a sub-modular function based on word embedding in the document. The objective function is calculated based on the k-nearest neighbor distance for embedding distributions. After that, they used a modified greedy algorithm to select the sentences to form the summary. The weight that they used in the cosine similarity measure was based on word embedding instead of term frequency-inverse document frequency (TF-IDF).
The learning of word embeddings is entirely unsupervised. The ability to train on large unlabeled datasets allows the model to learn complex word relationships. In view of the shortcomings of the traditional word embedding methods, we propose a method to help improve the representation when calculating the relatedness at the sentence level.
3. Integrated Graph Model
In this section, our proposed model, an integrated graph (iGraph), will be detailed. First, we introduce the enhanced embedding models, which will be used to calculate the semantic similarity between sentences. After that, three graphs will be built from different aspects of one document to reveal the relationship between the sentences. After this, we will detail the approach for integrating the graphs. Finally, the TextRank algorithm is applied to rank the sentences, before the redundancy elimination technique is used for further sentence selection for the summary.
3.1. Enhanced Embedding Models
Word embedding models, such as CBOW, Skip-gram and so on, are mainly based on the hypothesis that words accompanied with similar contexts are likely to have similar meaning [27]. Based on this hypothesis, we are convinced that some specific features also have a certain relationship with their contexts. In fact, there are already studies that aim to conduct word sense disambiguation based on contexts [28]. For homographs and polysemy, we treated them as different words when they have different POS. In our enhanced embedding model, the homographs were trained as different embeddings so that they could be distinguished. We found that the training embedding model using bigrams/trigrams as the basic units was able to map the bigrams/trigrams feature to fixed length vectors so that the semantic information of the phrase might be captured. This process helps to reveal some hidden information that traditional sentence embedding or word embedding cannot capture.
3.1.1. Part of Speech Feature
Part of speech (POS) tagging plays an essential role in many NLP tasks. In this work, we use POS tagging to help solve the polysemy problem when calculating the sentence relatedness. Consider the following example:
- (a)
- Please write your address on an envelope.
- (b)
- Now, I am hosting a summit with President Xi of China at the Southern White House to address the many critical issues affecting our two peoples.
It is hard for the traditional models to tell the difference in this specific polysemy phenomenon. Fortunately, POS allows us to distinguish these sentences. In sentence (a), “address” is a noun, while the “address” in sentence (b) acts as a verb. However, the typical embedding models, such as CBOW, Skip-gram and PV, treat the polysemy words as the same words although they have a totally different meaning when they are used with a different POS. Therefore, typical sentence embedding fails to handle the polysemy problem, which inspired us to utilize word–POS pairs. Every single word attached to its POS tags, forming word–POS pairs, is used to train the embedding model as a POS-enhanced embedding model.
In Table 1, the traditional embedding model is utterly confused by polysemy and it recognizes “address” as a noun in most cases. Fortunately, with the application of POS, the vectors in the POS-enhanced embedding model demonstrate a clear understanding of the difference. Most similar words to “address” when it acts as a noun are object words, such as “email”, “postcodes” etc., while “address” in a verb form has more similarity to action words, such as “discuss” and “focus”. When measuring relatedness in the process of constructing the graphs, the “verb-address” is unlikely to have a close similarity with “IP”, “email” and “telephone”. The “noun-address” is more likely to have higher similarity with “postcodes” and “email”. However, it is clear that the typical embedding model is confused regarding the difference, which will add noise or imprecise factors when calculating the similarity. Therefore, we have reasons to say that the POS-enhanced embedding model effectively distinguishes words that act as different parts of speech.
3.1.2. N-Gram Feature
The training process of the typical embedding model is based on word surface, which causes the semantic information of the phrase and the group of words to be lost. For instance,
I wish your dreams come true.
In this sentence, the semantics of “come true” are not equal to the rough summation of “come” and “true”. Simply averaging the word vectors of “come” and “true” not only cannot catch the phrase details but also remove the semantics of the original word vectors. In order to solve this problem, the n-grams are extracted as another enhanced feature. Similar to the POS mentioned before, the n-grams are fed as the basic units to train the n-gram embedding model, which helps us to keep the semantics of phrase and the groups of words. The later part of Table 1 shows the most similar bigrams of the phrase “come true”. It is obvious that the semantic information of phrases are preserved by the n-gram-enhanced embedding model. In particular, words, such as “biggest dream” and “wish come”, have important relationships with “come true” in semantics and this relationship is ignored in the word embedding model. Considering the amount of computation in this work, we only take the bigrams and trigrams into consideration while training the n-gram enhanced models.
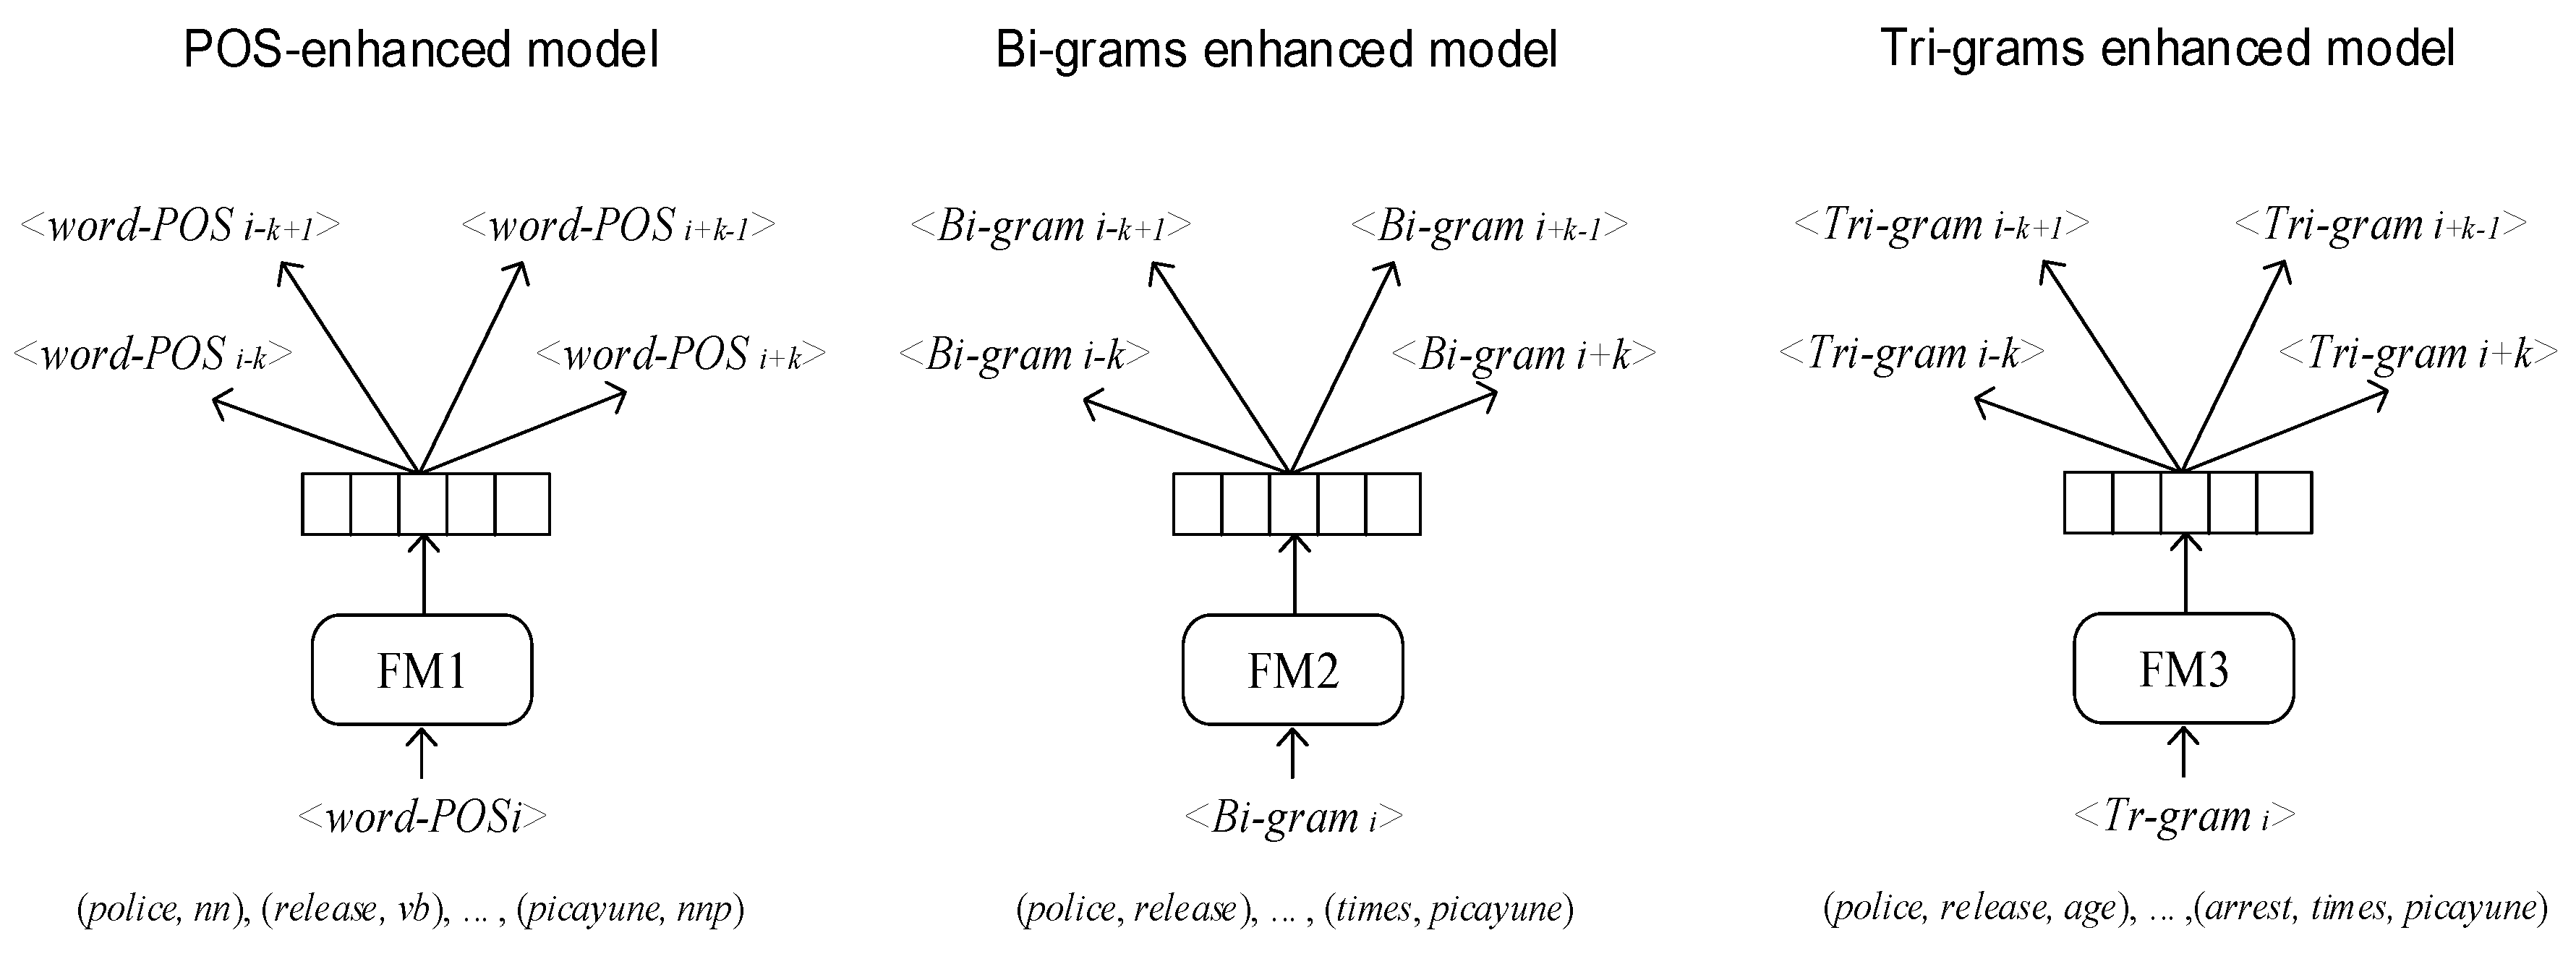
In this work, the enhanced features extracted above are fitted into the word embedding models, thus each feature instance can be mapped into a fixed length vector. For each type of enhanced feature, the word-POS, bigram and trigram, and enhanced feature embedding model is trained. Figure 1 shows the enhanced feature embedding models with the Skip-gram.
3.2. Integrated Graph Model for Summarization
The integrated graph model combines the semantic relatedness from three different dimensions. We will start to describe the calculation of sentence similarity and how to build the semantic graph from three different aspects.
In practice, representing sentences or documents by simply averaging the word vectors that are contained in texts has proven to be an efficient and effective method of sentence embedding. Generally, sentences that share the same meaning tend to contain words with similar meanings. If words are represented by word embedding, similar words will be mapped closer in the vector space, which means that the averages of those word vectors will also be similar.
Definition 1.
Suppose that the given document D (preprocessed) consists of a set S of n sentences. For a single sentencethat includes T tokens, the word-POS pairs (wp), bigrams (bi) and trigrams (tri) are defined as follows:
We represent the sentence by averaging the enhanced feature vectors contained in wp, bi and tri. After this, in Equations (1)–(3), we obtain three types of representation of a sentence.
Cosine values between sentence vectors are calculated as the semantic similarity between them. According to the sentence similarity values, three undirected weighted graphs are built for the sentences in a document. Mathematically, the adjacency matrix of the sentence graph is denoted as with each entry .
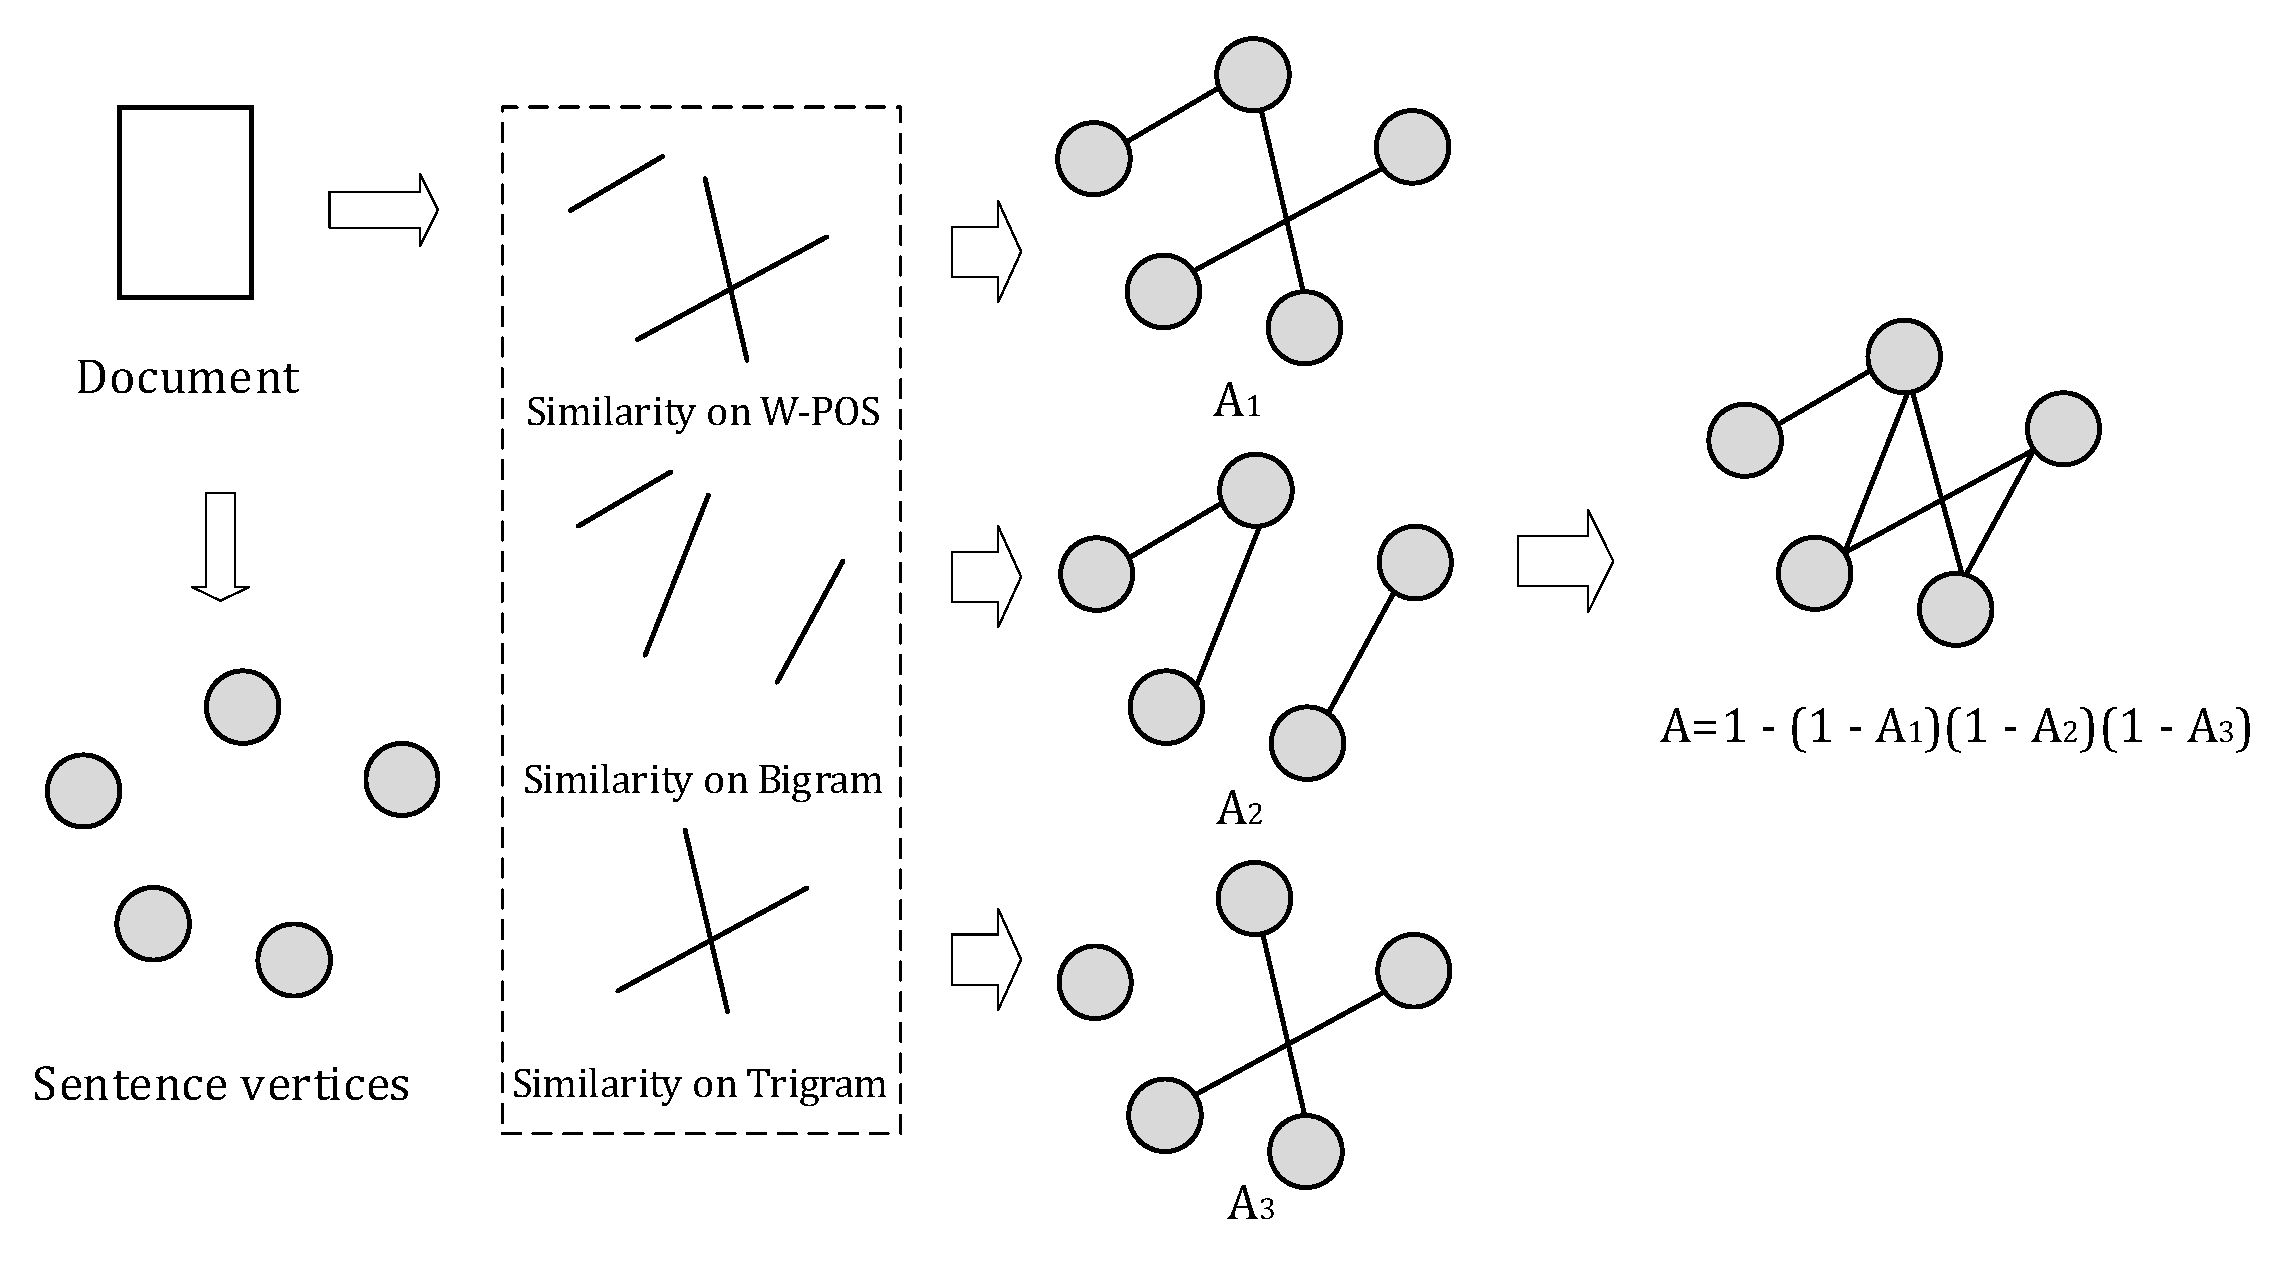
After building the three types of sentence semantic graphs for a document, we compute a final “combined weight” between every other sentence. This final weight is usually larger than the individual weight in the subgraph. When a semantic association receives several types of evidence, it expresses greater confidence [29]. We used the naive Bayesian fashion to integrate graphs from different sources, which are supposed to be independent. The integration can be expressed by the individual matrix using Equation (4):
where 1 represents the matrix with the same size as and all items being ones; is the individual adjacency matrix; and is the final one. Here, in Equation (4), the matrices multiplication is a Hadamard product. The overall framework of our graph integration is illustrated in Figure 2.
In the graph, sentences are represented by the nodes or vertexes and the final semantic similarity values between them are seen as undirected edges. The TextRank algorithm is the most popular graph-based ranking algorithm that is used to determine the importance of vertex within a graph. The intuition regarding TextRank is that it applies a type of “voting” or “recommendation” [8] such that when one node links to another one, it is basically casting a vote. Node importance is not only decided based on the number of votes or edges, but also the importance of the node. This helps determine the score or rank for each vertex.
All nodes’ TextRank values (TR) are randomly initialized at first, before updating until convergence in the condition of a given threshold. As we carry a random walk algorithm on the sentence graph, the TextRank (TR) score is defined as follows:
where indicates the TextRank score of the i-th vertex; and is a damping factor that is used to deal with the dangling node (node with 0 degree). In this work, the factor is denoted as 0.85. After the TextRank algorithm is run on the graph, the sentences are ranked in decreasing order of their score. According to the compression rate, the top ranked sentences are selected to generate the final summary.
3.3. Redundancy Removal
In this part, as a refinement of our summarization model, we propose the redundancy removal for further improvement. As a matter of fact, multiple sentences occur in a document to reflect the main idea, in which there are probably many co-occurrence words and phrases. To ensure that there is little repetitive information in the generated summary, we add a redundancy removal procedure when selecting the summary sentences.
Definition 2.
Suppose thatis a set of sentences that have been chosen as the summary. Letdenote the current candidate sentence. The redundancy measure is defined as follows:
whereis used to measure the similarity between the candidate sentence and every summary sentence. The similarity values are calculated in the graph integration process, which is defined in Equation (4).
It can be noticed that all the similarity values needed to calculate for redundancy are included in . After adding the first candidate sentence to the summary, only the sentences that have a similarity score of less than the threshold () are selected. In our implementation, and the process was repeated whenever we obtained a candidate sentence.
4. Experiments
4.1. Corpora and Baselines
For our experiments, two summarization test corpus published by the Document Understanding Conference (DUC), were used to evaluate the proposed method for summarization.
The DUC2002 corpus consists of 567 news articles from 1987–1992 and the corresponding summaries that have a length of approximately 100 words, which contains 59 subjects. Each cluster of documents is formed by 5–15 articles with the same theme and this dataset can be used both for evaluating single-document and multiple-document summarization. The DUC 2004 corpus consists of five tasks. Task 1 consists of 500 newspaper and newswire articles. Each document includes four very short gold standard summaries with a maximum length of 75 characters used for evaluation. Task 2 used 50 clusters of related documents, each of which contains 10 documents. Each cluster of documents also includes four gold summaries with a maximum length of 665 characters (about 100 words) for each summary, including spaces and punctuation. In this work, single-document summarization tasks were used. We used the following baselines.
Leading sentences (Lead-3 model) simply produces the leading three sentences of the document as the summary, which we applied to both datasets. For DUC 2002, we also report the results of the integer linear programming approach [30] and the performance of LReg as a baseline, which is used widely. We also average the Google pre-trained (100 dim) word2vec embeddings to construct a cosine graph as a baseline (EmbAvg) for both datasets. We also report the results of the Wikipedia-based summarizer [22] in a single-document summarization task. The other two models we chose, which were TGRAPH [31] and URANK [11], are the state-of-the-art graph-based summarization methods. The SummaRuNNer [4] and neural Summarization model [32] proposed by Cheng et al. are also evaluated on DUC2002 as an out-of-domain dataset.
From the DUC 2004 task, we included the PREFIX baseline that simply returns the first 75-bytes of the input as the headline. TOPIARY is also widely used as a baseline, and returns a set of topic descriptors [33].
To make sure that the recall-only evaluation will not be biased to the length of summary, we used the “-l 100” and “-b 75” settings in ROUGE respectively for DUC2002 and DUC2004.
Our summarization system was implemented in the Python 3.6 version. The module nltk (natural language toolkit) was used for preprocessing, including paragraph splitting, sentence splitting, word tokenization, POS tagging, stop word removal, bigram tokenization and trigram tokenization. We trained the enhanced feature embeddings on DUC 2002/2004 and DailyMail/CNN using word2vec implementation in the genism module.
4.2. Automatic Evaluation
In our experiments, described below, the proposed method iGraph (integration graph summarization model) was evaluated using different variants of the ROUGE metric computed with the corresponding summaries. The evaluation of the proposed methods on every dataset was conducted using ROUGE, ROUGE-1, ROUGE-2 and ROUGE-L scores. ROUGE-N was defined using Equation (7) as follows:
where n stands for the length of the n-gram; and is the maximum number of n-grams occurring in both the candidate summary and a set of reference summaries.
ROUGE-L computes the ratio between the length of the two summaries’ LCS (longest common subsequence) and the length of the reference summary. The advantage is that it automatically includes the longest in-sequence common n-grams and thus, no predefined n-gram length is necessary [34].
The ROUGE toolkit was applied by all techniques to assess the summaries produced. The comparative analysis of the various methods was then carried out [35].
4.3. Experiment Results and Discussion
The comparison between our integrated graph model (iGraph) and two state-of-the-art graph-based models and other baselines is shown in Table 2, and was conducted using Rouge recall with a limited summary length of 100 words. In the later part of Table 2, we present the results of summaries from the sentence ranking in relation to each individual semantic graph and its integration on the DUC 2002.
For the W-POS graph sentence ranking on DUC 2002, we obtained better results than the EmbAvg. We implemented EmbAvg by using the pretrained word2vec embeddings, which do not take into account the different meanings when a word acts in various parts of speech. There may be noise effects when calculating the similarity between sentences. This shows that our W-POS similarity performs better than the typical embeddings when building the semantic graph for sentences.
We found that the performance of the Bigram graph sentence ranking was very close to the W-POS (narrowly lower in the Rouge-1 and Rouge-2 metrics) on DUC 2002. At the bigram level, the same word in a bigram can be distinguished by the context of the bigrams, and this may help solve the polysemy problem. Moreover, the performance shows that the individual performance of the bigram similarity graph is promising and valid.
One possible reason for why Trigram did not consistently outperform the typical EmbAVg and even the Lead-3 baseline is that we removed all the trigrams that contained the stop words. Furthermore, the similarity between sentences on the trigram level was sparse compared to the relatedness on the word and bigram surface. In particular, we measured similarity in three different dimensions to encourage the diversity of the integration while calculating the combined weight of sentence similarity using the naive Bayesian fashion.
We can observe that the sentence ranking on the integration graph (iGraph) achieved competitive performance compared to the TGRAPH and URANK in Rouge-1. With the refinement of redundancy removal, although TGRAPH still achieved the highest Rouge-2 score, iGraph-R outperformed the state-of-the-art graph-based models in almost all Rouge metrics on DUC 2002.
We also report the performance comparison using DUC 2004, which is shown on Table 3. The ROUGE metrics for DUC 2004 are not as good as for DUC 2002. The reference summaries in the DUC 2004 single-document summarization tasks are short, headline-like summaries. We used the limited length recall variants of Rouge with respect to the gold summaries at 75 bytes. This may explain why the redundancy removal procedure did not improve much.
However, the results show that our proposed method outperformed the two baselines in all three ROUGE metrics. W-POS showed improvement compared to EmbAvg even if this is not as huge a margin as on DUC 2002. The performance of iGraph provided proof of the validation of the graph integration of W-POS, Bigram and Trigram. Sentence ranking on the Bigram graph obtained the best Rouge-2 score, while the integration may also add some noise as well as reduce confidence when creating the edges. One possible reason is that the assumption of independence for the three types of graphs may not be that strong.
As a supplementary experimental verification, we also evaluated our method using a multi-document summarization task. We applied our model for the second DUC-2004 multi-document summarization task. To make it simple, 10 documents in a collection were concatenated into one and we treated the multi-document summarization task as a single-document summarization. For a fair comparison, the summaries had an average length of 100 words (665 characters) instead of 75 characters for DUC-2004 single-document summarization task.
For the comparison, we applied the following baselines:
LEAD outputs the first 665 bytes from the most recent document in the collection.
Peer65 is the winning model in DUC2004 task 2.
LexRank, proposed by reference [7], is also a popular baseline.
NMF (non-negative matrix factorization) was used to adopt the generic relevance of the sentences in [36], which also uses compact and dense representation.
C_SKIP, which was proposed by reference [37] in 2017, is the state-of the-art method for DUC 2004.
As shown in Table 4, while our model did not reach the level of other state-of-the-art methods, the proposed model still outperformed the basic baselines, which proves the feasibility and the superiority of the proposed model. In the multi-document summarization task, our method needs more refinement and improvement.
The evaluation results of all the tests above show that in most cases, the enhanced embedding models improve the document representation compared to the traditional embedding model. Moreover, our integration graph model shows significant improvement when competing with the state-of-the-art graph-based methods.
5. Conclusions
Due to the information overload in the internet, automatic document summarization has received a great deal of attention. In this paper, we proposed an integrated graph model that utilizes three types of enhanced features to create the graph. Word-POS features, bigrams and trigrams were extracted to train the enhanced embedding vectors, while sentence similarity from three dimensions was calculated. After that, given the independent assumption, we used the naive Bayesian fashion to integrate the graphs from different sources. The final graph was fed into the TextRank algorithm to rank the sentences. As a refinement, the redundancy removal procedure was applied to generate the final summaries. Experimental results for two datasets did not show the improvement of the enhanced embedding models compared to typical embeddings, but also proved that our model outperformed the state-of-the-art method.
This work is different from the previous research in the following three aspects. First, the enhanced feature embedding model, word-POS, improves the efficiency of the text representation, which possibly occurs due to the better handling of homographs and polysemy. Second, N-gram embedding models provide the distributed representation at the phrase level, which offers a novel channel when evaluating the similarity between sentences. Third, we built the similarity graph from three different aspects and the integration of graphs was obtained by fusing multiple sources. We are convinced that our enhanced feature embedding model can be applied to improve text representation in other NLP tasks, such as sentiment analysis. In future work, we will explore other methods that are suitable for our problem, with the deep-learning-based approach holding great promise.
Author Contributions
K.Y. designed, wrote the paper and did the experiments, K.A.-S. did data analysis, Y.X. surveyed the related works, Z.Z. supervised the work and offered financial support. All authors have read and approved the final manuscript.
Funding
This research was funded by National Natural Science Foundation of China (Grant Nos. 61379109, and M1321007), Science and Technology Plan of Hunan Province (Grant Nos. 2014GK2018, and 2016JC2011) and the Fundamental Research Funds for the Central South University (Grant No. 2018zzts587).
Acknowledgments
This work is supported by the Funding above. Authors would like to thank anonymous reviewers for the valuable comments and feedbacks. Moreover, Kang Yang wants to express his gratitude to Sitong Ji for her spiritual encouragement and support. Kang Yang wishes Jiannan Wang & Qun Wang a meaningful wedding and a happy life.
Conflicts of Interest
The authors declare no conflict of interest.
References
- Liu, W.; Luo, X.; Zhang, J.; Xue, R.; Xu, R.Y.D. Semantic summary automatic generation in news event. Concurr. Comput. Pract. Exp. 2017, 29, e4287. [Google Scholar] [CrossRef]
- Ferreira, R.; Cabral, L.D.S.; Freitas, F.; Lins, R.D.; Silva, G.D.F.; Simske, S.J.; Favaro, L. A multi-document summarization system based on statistics and linguistic treatment. Expert Syst. Appl. 2014, 41, 5780–5787. [Google Scholar] [CrossRef]
- Radev, D.R.; Hovy, E.; McKeown, K. Introduction to the special issue on summarization. Comput. Linguist. 1994, 28, 399–408. [Google Scholar] [CrossRef]
- Nallapati, R.; Zhai, F.; Zhou, B. SummaRuNNer: A recurrent neural network based sequence model for extractive summarization of documents. In Proceedings of the 31st AAAI Conference on Artificial Intelligence, San Francisco, CA, USA, 4–9 February 2017. [Google Scholar]
- Gambhir, M.; Gupta, V. Recent automatic text summarization techniques: A survey. Artif. Intell. Rev. 2017, 47, 1–66. [Google Scholar] [CrossRef]
- Nenkova, A.; Maskey, S.; Liu, Y. Automatic summarization. Found. Trends Inf. Retr. 2011, 5, 103–233. [Google Scholar] [CrossRef]
- Erkan, R.; Dragomir, R. LexRank: Graph-based lexical centrality as salience in text summarization. J. Artif. Intell. Res. 2004, 22, 457–459. [Google Scholar] [CrossRef]
- Mihalcea, R.; Tarau, P. TextRank: Bringing Order into Texts. In Proceedings of the 2004 Conference on Empirical Methods in Natural Language Processing, Barcelona, Spain, 25–26 July 2004; pp. 404–411. [Google Scholar]
- Sornil, O.; Gree-Ut, K. An automatic text summarization approach using Content-Based and Graph-Based characteristics. In Proceedings of the IEEE Conference on Cybernetics & Intelligence System, Bangkok, Thailand, 7–9 June 2006; pp. 1–6. [Google Scholar]
- Fattah, M.A.; Ren, F. GA, MR, FFNN, PNN and GMM based models for automatic text summarization. Comput. Speech Lang. 2009, 23, 126–144. [Google Scholar] [CrossRef]
- Wan, X. Towards a unified approach to simultaneous Single-Document and Multi-Document summarizations. In Proceedings of the 23rd International Conference on Computational Linguistics, Beijing, China, 23–27 August 2010; pp. 1137–1145. [Google Scholar]
- Page, L. The PageRank citation ranking: Bringing order to the web. Stanf. Digit. Libr. Work. Pap. 1998, 9, 1–14. [Google Scholar]
- Lin, H.; Bilmes, J.; Xie, S. Graph-based submodular selection for extractive summarization. In Proceedings of the IEEE Automatic Speech Recognition and Understanding (ASRU), Merano, Italy, 13–17 December 2009; pp. 381–386. [Google Scholar]
- Barrera, A.; Verma, R. Combining syntax and semantics for automatic extractive Single-Document summarization. In Proceedings of the International Conference on Intelligent Text Processing and Computational Linguistics, New Delhi, India, 11–17 March 2012; Lecture Notes in Computer Science. Volume 7182, pp. 366–377. [Google Scholar]
- Fang, C.; Mu, D.; Deng, Z.; Wu, Z. Word-Sentence Co-Ranking for automatic extractive text summarization. Expert Syst. Appl. 2016, 72, 189–195. [Google Scholar] [CrossRef]
- Boom, C.D.; Canneyt, S.V.; Bohez, S.; Demeester, T.; Dhoedt, B. Learning semantic similarity for very short texts. In Proceedings of the 2015 International Conference on Data Mining Workshop, Atlantic City, NJ, USA, 14–17 November 2015; pp. 1229–1234. [Google Scholar]
- Mikolov, T.; Sutskever, I.; Chen, K.; Corrado, G.; Dean, J. Distributed representations of words and phrases and their compositionality. In Proceedings of the 27th Annual Conference on Neural Information Processing Systems, Lake Tahoe, NV, USA, 5–8 December 2013; pp. 3111–3119. [Google Scholar]
- Antiqueira, L.; Nunes, M.G.V. Complex Networks and Extractive Summarization. In The Extended Activities, Proceedings of the 9th International Conference on Computational Processing of the Portuguese Language–PROPOR, Porto Alegre, Brazil, 27–30 April 2010; Springer: Berlin/Heidelberg, Germany, 2010. [Google Scholar]
- Ge, S.S.; Zhang, Z.; He, H. Weighted graph model based sentence clustering and ranking for document summarization. In Proceedings of the 2011 4th International Conference on Interaction Sciences (ICIS), Busan, Korea, 16–18 August 2011; pp. 90–95. [Google Scholar]
- Baralis, E.; Cagliero, L.; Mahoto, N.; Fiori, A. Graph Sum: Discovering correlations among multiple terms for graph-based summarization. Inf. Sci. 2013, 249, 96–109. [Google Scholar] [CrossRef]
- Wan, X.; Yang, J. Improved affinity graph based multi-document summarization. In Proceedings of the Human Language Technology Conference of the NAACL, New York City, NY, USA, 4–9 June 2006; pp. 181–184. [Google Scholar]
- Sankarasubramaniam, Y.; Ramanathan, K.; Ghosh, S. Text summarization using Wikipedia. Inf. Process. Manag. 2014, 50, 443–461. [Google Scholar] [CrossRef]
- Khan, A.; Salim, N.; Farman, H.; Khan, M.; Jan, B.; Ahmad, A.; Ahmed, I.; Paul, A. Abstractive Text Summarization based on Improved Semantic Graph Approach. Int. J. Parallel Program. 2018, 1–25. [Google Scholar] [CrossRef]
- Kenter, T.; Rijke, M.D. Short text similarity with word embeddings. In Proceedings of the 24th ACM International on Conference on Information and Knowledge Management, Melbourne, Australia, 19–23 October 2015; pp. 1411–1420. [Google Scholar]
- Triantafillou, E.; Kiros, J.R.; Urtasun, R.; Zemel, R. Towards generalizable sentence embeddings. In Proceedings of the 1st Workshop on Representation Learning for NLP, Berlin, Germany, 11 August 2016; pp. 239–248. [Google Scholar]
- Kobayashi, H.; Noguchi, M.; Yatsuka, T. Summarization Based on Embedding Distributions. In Proceedings of the 2015 Conference on Empirical Methods for Natural Language Processing, Lisbon, Portugal, 17–21 September 2015; pp. 1984–1989. [Google Scholar]
- Lai, S.; Liu, K.; He, S.; Zhao, J. How to generate a good word embedding. IEEE Intell. Syst. 2016, 31, 5–14. [Google Scholar] [CrossRef]
- Huang, S.; Zheng, X.; Kang, H.; Chen, D. Word sense disambiguation based on positional weighted context. J. Inf. Sci. 2013, 39, 225–237. [Google Scholar] [CrossRef]
- Mering, C.V.; Jensen, L.J.; Snel, B.; Hooper, S.D.; Krupp, M.; Foglierini, M.; Jouffre, N.; Huynen, M.A.; Bork, P. STRING: Known and predicted protein–protein associations, integrated and transferred across organisms. Nucl. Acids Res. 2005, 33, 433–437. [Google Scholar] [CrossRef] [PubMed]
- Woodsend, K.; Lapata, M. Automatic generation of story highlights. In Proceedings of the 48th Annual Meeting of the Association for Computational Linguistics, Uppsala, Sweden, 11–16 July 2010; pp. 565–574. [Google Scholar]
- Parveen, D.; Ramsl, H.M.; Strube, M. Topical coherence for graph-based extractive summarization. In Proceedings of the 2015 Conference on Empirical Methods for Natural Language Processing, Lisbon, Portugal, 17–21 September 2015; pp. 1949–1954. [Google Scholar]
- Cheng, J.; Lapata, M. Neural summarization by extracting sentences and words. In Proceedings of the 54th Annual Meeting of the Association for Computational Linguistics, Berlin, Germany, 7–12 August 2016. [Google Scholar]
- Wang, R.; Stokes, N.; Doran, W.P.; Newman, E.; Carthy, J.; Dunnion, J. Comparing Topiary-Style approaches to headline generation. In Proceedings of the European Conference on Information Retrieval, Santiago de Compostela, Spain, 21–23 March 2005; Lecture Notes in Computer Science. Volume 3408, p. 11. [Google Scholar]
- Lin, C.Y.; Och, F.J. Looking for a few good metrics: ROUGE and its evaluation. In Proceedings of the Fourth NTCIR Workshop on Research in Information Access Technologies Information Retrieval, Question Answering and Summarization, NTCIR-4, Tokyo, Japan, 2–4 June 2004. [Google Scholar]
- Lin, C.Y. ROUGE: A Package for Automatic Evaluation of summaries. In Proceedings of the Workshop on Text Summarization Branches Out, Barcelona, Spain, 25–26 July 2004. [Google Scholar]
- Lee, J.H.; Sun, P.; Ahn, C.M.; Kim, D. Automatic generic document summarization based on non-negative matrix factorization. Inf. Process. Manag. 2009, 45, 20–34. [Google Scholar] [CrossRef]
- Rossiello, G.; Basile, P.; Semeraro, G. Centroid-based text summarization through compositionality of word embeddings. In Proceedings of the MultiLing 2017 Workshop on Summarization and Summary Evaluation across Source Types and Genres, Valencia, Spain, 3 April 2017; pp. 12–21. [Google Scholar]
Figure 1.
Enhanced feature embedding models with skip-gram.

Figure 2.
Graph integration using the naive Bayesian fashion.


Table 1.
Most similar word/N-gram to the target word/N-gram in embedding models.
| Target | Model. Mostsimilar (“Target”, Top n = 10) |
|---|---|
| address | addresses, addressed, ip, email, telephone, login, sender, answered, disscuss, call |
| (address, nn) | (addresses, nns), (email, nn), (postcodes, nns), (ip, nn), (names, nns), (ip, nn), (databases, nns), (usernames, rb), (contacts, nns), (login, nn) |
| (address, vb) | (discuss, vb), (addressing, vbg), (addressed, vb), (repercussions, vb), (deal, vb), (answer, vb), (resolved, vb), (reconsider, vb), (focus, vb), (tackle, vb) |
| come | coming, go, bring, see, came, get, going, look, give, want |
| true | indeed, fact, truth, truly, certainly, real, love, dreams, genuine, never |
| (come, true) | (dream, come), (dream, come), (make, dreams), (wishs, come), (wish, come), (would, dream), (experience, dream), (biggest, dream), (true, play), (absolute, dream) |
Table 2.
The Rouge score (%) of various models on DUC 2002 using the limited length recall variants of Rouge at 100 words. Word part-of-speech (POS) pairs similarity = W-POS; Bigram similarity = Bigram; Trigram similarity = Trigram; The integration of three types of graphs = iGraph; The iGraph with the redundancy removal = iGraph-R.
| Models | Rouge-1 | Rouge-2 | Rouge-L |
|---|---|---|---|
| Lead-3 | 43.6 | 21.0 | 40.2 |
| LReg | 43.8 | 20.7 | 40.3 |
| ILP | 45.4 | 21.3 | 42.8 |
| EmbAvg | 45.6 | 19.3 | 41.6 |
| Wikipedia-based summarizer | 46.0 | 23.0 | - |
| SummaRuNNer | 46.6 ± 0.8 | 23.1 ± 0.9 | 43.03 ± 0.8 |
| Cheng et al.’ 2016 | 47.4 | 23.0 | 43.5 |
| TGRAPH | 48.1 | 24.3 | - |
| URANK | 48.5 | 21.5 | - |
| W-POS | 47.4 | 22.4 | 43.0 |
| Bigram | 46.9 | 21.2 | 43.1 |
| Trigram | 43.1 | 18.6 | 40.5 |
| iGraph | 48.5 ± 0.4 | 22.0 ± 0.2 | 43.7 ± 0.3 |
| iGraph-R | 49.2 ± 0.3 | 23.1 ± 0.2 | 44.1 ± 0.2 |
Table 3.
The performance of various models on DUC 2004 using the limited length recall variants of Rouge at 75 bytes.
Table 3.
The performance of various models on DUC 2004 using the limited length recall variants of Rouge at 75 bytes.
| Models | Rouge-1 | Rouge-2 | Rouge-L |
|---|---|---|---|
| PREEFIX | 22.4 | 6.5 | 19.6 |
| TOPIARY | 25.1 | 6.5 | 20.1 |
| EmbAvg | 29.9 | 7.3 | 25.9 |
| W-POS | 30.6 | 7.0 | 27.3 |
| Bigram | 29.2 | 7.6 | 25.1 |
| Trigram | 24.3 | 6.4 | 19.5 |
| iGraph | 31.3 ± 0.4 | 7.3 ± 0.3 | 26.2 ± 0.3 |
| iGraph-R | 31.7 ± 0.2 | 7.3 ± 0.2 | 26.9 ± 0.2 |
Table 4.
The performance of various models on DUC 2004 using the limited length recall variants of Rouge at 100 words (665 bytes).
Table 4.
The performance of various models on DUC 2004 using the limited length recall variants of Rouge at 100 words (665 bytes).
| Models | Rouge-1 | Rouge-2 |
|---|---|---|
| LEAD | 32.4 | 6.4 |
| Peer65 | 38.2 | 9.2 |
| LexRank | 37.6 | 8.8 |
| NMF | 31.6 | 6.3 |
| C_SKIP | 38.8 | 9.97 |
| iGraph | 37.8 ± 0.3 | 8.2 ± 0.2 |
| iGraph-R | 38.0 ± 0.2 | 8.3 ± 0.4 |
© 2018 by the authors. Licensee MDPI, Basel, Switzerland. This article is an open access article distributed under the terms and conditions of the Creative Commons Attribution (CC BY) license (http://creativecommons.org/licenses/by/4.0/).
Share and Cite
MDPI and ACS Style
Yang, K.; Al-Sabahi, K.; Xiang, Y.; Zhang, Z. An Integrated Graph Model for Document Summarization. Information 2018, 9, 232. https://0-doi-org.brum.beds.ac.uk/10.3390/info9090232
AMA Style
Yang K, Al-Sabahi K, Xiang Y, Zhang Z. An Integrated Graph Model for Document Summarization. Information. 2018; 9(9):232. https://0-doi-org.brum.beds.ac.uk/10.3390/info9090232
Chicago/Turabian StyleYang, Kang, Kamal Al-Sabahi, Yanmin Xiang, and Zuping Zhang. 2018. "An Integrated Graph Model for Document Summarization" Information 9, no. 9: 232. https://0-doi-org.brum.beds.ac.uk/10.3390/info9090232
Note that from the first issue of 2016, this journal uses article numbers instead of page numbers. See further details here.