Article

Artificial Intelligence-Based Optimization of a Bimorph-Segmented Tapered Piezoelectric MEMS Energy Harvester for Multimode Operation

1
National MEMS Design Centre, Department of Electronics and Communication Engineering, National Institute of Technology, Silchar 788010, Assam, India
2
Center of Microelectronic Technologies, Institute of Chemistry, Technology and Metallurgy, National Institute of the Republic of Serbia, University of Belgrade, Njegoševa 12, 11000 Belgrade, Serbia
*
Author to whom correspondence should be addressed.
Submission received: 13 June 2021 / Revised: 23 July 2021 / Accepted: 26 July 2021 / Published: 29 July 2021
(This article belongs to the Section Computational Engineering)

Abstract

:
This paper presents a study on the design and multiobjective optimization of a bimorph-segmented linearly tapered piezoelectric harvester for low-frequency and multimode vibration energy harvesting. The procedure starts with a significant number of FEM simulations of the structure with different geometric dimensions—length, width, and tapering ratio. The datasets train the artificial neural network (ANN) that provides the fitting function to be modified and used in algorithms for optimization, aiming to achieve minimal resonant frequency and maximal generated power. Levenberg–Marquardt (LM) and scaled conjugate gradient (SCG) methods were used to train the ANN, then the goal attainment method (GAM) and genetic algorithm (GA) were used for optimization. The dominant solution resulted from optimization by the genetic algorithm integrated with the ANN fitting function obtained by the SCG training method. The optimal piezoelectric harvester is 121.3 mm long and 71.56 mm wide and has a taper ratio of 0.7682. It ensures over five times greater output power at frequencies below 200 Hz, which benefits the low frequency of the vibration spectrum. The optimized design can harness the power of higher-resonance modes for multimode applications.

1. Introduction

A vibration energy harvester (VEH) provides a self-sufficient and sustainable power solution for low-power devices in a wireless sensor network (WSN), replacing conventional bulky batteries with a limited lifetime [1]. The major challenge in a micro-energy harvester is low power generation. A piezoelectric vibration energy harvester (PVEH), which uses direct piezoelectric effects to convert mechanical vibrations into electrical energy, is popular because of its high power density, compared to other transduction mechanisms, such as electromagnetic and electrostatic harvesters. Sil et al. showed that increasing the beam’s length and reducing the beam’s width and thickness improved the output generation of the VEH [2]. The tapered beam design of the linear PVEH produces greater output voltage, as the beam will experience a higher strain for a particular mechanical input. A trapezoidal cantilever beam provides a more efficient and more robust design than a conventional rectangular beam, as the distribution of the strain is more uniform across the length of the beam [3,4]. Almeida et al. concluded that thinner substrates yield harvesters with a better energy conversion factor and a higher output voltage [5]. The cantilever-based PVEH in higher vibration modes has specific strain nodes where the cancellation of electric charge reduces the generated output [6]. Segmentation of the piezoelectric layer or electrodes at this strain node reduces the resonant frequency and increases the power generation in higher vibration modes [7].
Another major limitation for the VEH is its relatively narrow operational bandwidth. Researchers have adopted various approaches to increase the operating frequency range, to find an alternative to the linear VEH, which works only for a single frequency resonance. Multimodal structures with an array of generators, each with a different resonant frequency, have been developed to achieve wider bandwidth [8,9,10]. However, for a particular excitation frequency, only one structure of the array is excited, and the rest remain idle, which limits the power density of the device. There is a requirement to reduce device size and complexity while addressing the limitation of narrow bandwidth. It has been experimentally evaluated that the operational frequency range of the PVEH increases when segmented at strain nodes of higher vibration modes [11,12], while the use of higher vibration modes results in an improvement of the sensitivity, reliability, and performance of microelectromechanical system (MEMS) devices [13,14]. Therefore, optimizing a piezoelectric energy harvester’s physical geometry and design is crucial for cost reduction and for improving performance by generating maximum electrical output.
Fu reviewed different tools for simulation-based optimization [15]. Park et al. designed an optimization procedure based on the finite element model (FEM) by ANSYS to optimize the objective function of the average power spectrum and mechanical stress of a piezoelectric energy harvester [16]. Recently, artificial intelligence-based optimization has become popular due to computational time and complexity involving numerous simulations or the study of various parameters of the mathematical model of the harvester [17,18,19]. Nabavi et al. optimized the physical aspects of a doubly clamped cantilever with a serpentine pattern using a deep neural network with an accuracy of 90% [20]. Singh et al. proposed a novel artificial neural network (ANN)-based feedback loop control system to optimize a real-time vibration energy harvester inside a tire to power a sensor module [21].
In this paper, a tapered optimal structural design of a PVEH with structural modification of segmentation at the strain nodes of the third vibration mode is presented to improve its operation at a higher resonant frequency (second and third) to boost output voltage in a wider operational frequency range. The paper also presents the investigation of the optimization of segmented multimode design to provide maximum power generation in lower-frequency (below 500 hertz) applications. The paper’s content is organized as follows: the mathematical model based on the beam theory of the tapered harvester and FEM simulations, along with the method used for finding optimal design, is first presented. A custom-designed AI-assisted software solution is presented in detail in the next section. Section 3 provides discussions and observations related to the outcomes of the developed codes. Concluding remarks are presented in Section 4.

2. Materials and Methods

To design an optimal bimorph-segmented tapered piezoelectric MEMS energy harvester that would provide us with maximal possible power at low frequencies, we used different procedures. The first decision was related to the parameter space, i.e., which parameters would be variable, and what were the physically reasonable bounds for them. According to the state of the art, there is no universal figure of merit of piezoelectric harvesters. Based on previous studies, various aspects of the cantilever-based vibration PEH are listed in Table 1. A comprehensive study in [22] addresses the dependency of the output on load resistance, taper ratios in width and thickness of the cantilever, the thickness on the tip end, and the location and the dimensions of the PZT patch. Furthermore, electrodes and structures with curved PZT patches are optimized in a study by Yang et al. [23]. As described in the study on PEH operation under different working temperatures [24], optimization can relate to the mode of operation and working conditions. In [25], the optimization of the structure of PEH is performed for durability and crack issues that arise in the structure over time. In [26], the focus is on the cantilever-based PVEH material itself, and the results show that newly engineered metamaterials may provide the structure with high flexibility and deformation capabilities in transverse and longitudinal directions. As shown in [27], simulations are a reliable substitute for the performance determined by laboratory experiments on cantilever-based PVEH. In [28], the performance of a serpentine PVEH—output voltage and resonant frequency—is reliably deduced by a trained artificial neural network.
We based our present work on the following: the load resistance affects the output power but not the resonant frequency, and scaling different dimensions of the structure affects both the output power and the resonant frequency. However, some structures may yield promising results in simulations but simultaneously pose problems related to their actual fabrication. The length, width at the anchor (fixed end), and tapering ratio are varied for datasets considering that the cantilever’s built-in resistor is constant, and the proof mass at the cantilever tip is structure dependent. We propose numerical simulations and the use of artificial intelligence-based methods to determine the optimal dimensions of a linearly tapered multimode bimorph cantilever-based PVEH.
First, FEM-based simulations were performed to provide the initial set of parameters related to an unoptimized structure of the linearly tapered multimode bimorph cantilever-based PVEH. Further modifications of the structure and related FEM simulations provided examples for training an artificial neural network by the supervised learning method. The trained ANN provided the resonant frequency of the first resonant mode and the output power. However, the purpose of the designed ANN was not to substitute numerical experiments but to serve as a means for finding the optimal structure. ANN provided a function suitable for the integration with the optimization algorithms. Every stage in this procedure was performed multiple times to ensure the best possible result. Numerical experiments were repeated 124 times. ANN was trained in two ways: the Levenberg–Marquardt training algorithm and the scaled conjugate gradient algorithm. The optimization was conducted in two steps: first, by applying the goal attainment method and then by applying a genetic algorithm. For the best results, the data related to the outcome of the FEM simulation and the data generated by the ANN itself had to be altered. The output data of numerical experiments used for feeding the ANN had to be properly scaled, and the output data of ANN were adapted to the scalarized multiobjective optimization.
Different paths toward finding the optimal structure resulted in different sets of structural parameters. Then, additional numerical experiments were used for the comparative analysis to point to the best method and provide the final set of the cantilever’s parameters. The datasets, functions, and routines developed for this purpose are described in detail in subsequent sections and are available upon request.

2.1. Theoretical Model

The structure we investigated is a linearly tapered bimorph segmented vibration PEH with PZT-5H patches. The schematic diagram of the tapered piezoelectric energy harvester is shown in Figure 1 and Figure 2. The proposed structure is a bimorph cantilever with piezoelectric layers and a steel substrate. PZT-5H was selected for the piezoelectric layer because of its higher coupling coefficient and lower frequency, compared to other piezoelectric materials such as AlN. The tip-proof mass was attached to the free side to decrease the frequency further. Table 1 lists the geometric parameters and the properties of the used materials.
The PZT layers were segmented at the strain nodes (Table 2) by creating separation at a distance of d between the PZT segments (see Figure 1). The gaps were located exactly at the points of strain nodes for the third resonant mode. The linearly varying tapered beam’s width with the taper ratio T = b L b 0 over the length L is
b   ( x ) = b 0   [ 1 1 T x L ] 0 x L
Figure 3 shows the strain curves, and Table 2 shows the strain nodes locations for a trapezoidal bimorph cantilever with a tip mass and with a segmented PZT. The strain node remains the same irrespective of beam length. For any slight variation in strain node because of geometry alteration, the separation between the PZT segments was considered for a distance of 0.5 mm to cover the variation region keeping the strain node at the center.
Euler–Bernoulli assumptions provide equation of motion (EoM) of a cantilever with piezoelectric layer as [7]
EI x 4 w x , t x 4 + m x 2 w x , t t 2 = M t δ x L + m x 2 w b x , t t 2
where δ x is Dirac delta function, w b is the base excitation displacement in z direction, w is the cantilever transverse deformation, and M t is the tip mass. The rest of the terms change along the length as per the following expressions:
The bending stiffness is given by
EI x = b x h s 3 12 + E p 3 E s h s 2 + h p 3 h s 3 8
The mass per unit length is
m x = b x ρ p h p + ρ s h s ,
where h p , h s and L are geometry parameters while ρ p , ρ s , E p and E s are material properties. Using the Galerkin method for a free vibration w b x , t = 0 , the beam transverse displacement is expressed as a function of position and time in the form
w x , t = Ψ x T t
where Ψ x is the mode shape and T t = sin ω t is the harmonic response. The mode shape Ψ r x of the r th vibration mode of cantilever boundary condition is given as
Ψ r x = C r cos β r L x cosh β r L x + ξ r ( sin β r L x sinh β r L x )
ξ r = sin β r sinh β r + β r M t m x L   ( cos β r cosh β r ) cos β r + cosh β r + β r M t m x L sin β r sinh β r
where C r is the modal amplitude constant found by normalizing Ψ r x based on the orthogonality settings. β r denotes eigenvalues of the system obtained from characteristic Equation (6).

2.1.1. Estimation of Natural Frequency

The natural eigenfrequency of a tapered beam can be derived from the Rayleigh method of energy conservation. The kinetic energy is calculated as
K . E = 1 2 0 L m x W r x , t t 2 d x ,
while the potential energy is calculated as
P E = 1 2 0 L E I x 2 W r x , t x 2 2 d x
Substituting Equations (3), (4), and (6) in the above equations, the natural frequency of the tapered beam can be expressed as
ω r = β r L 4 h s 3 12 + E p 3 E s h s 2 + h p 3 h s 3 8 × 0 L b x cos β r L x cosh β r L x + ξ r ( sin β r L x sinh β r L x ) 2 d x ρ p h p + ρ s h s × 0 L b x cos β r L x cosh β r L x + ξ r ( sin β r L x sinh β r L x ) 2 d x

2.1.2. Estimation of General Power

A piezoelectric energy harvester converts mechanical vibration into electrical energy via the piezoelectric effect. The discrete PZT layers formed after segmentation are parallelly connected across a common load resistance R for the maximum output voltage.
The generated output voltage is directly proportional to the developed strain. The strain σ of a piezoelectric cantilever vibrator at the distance of x is given by [29]
σ 1 = h p c 2 W r x , t x 2
where h p c = h p + h s 2 is the distance from the neutral axis of the beam to the center of the piezoelectric layer. The developed electric field in terms of electric potential is given by
E 3 t = V t h p
Now, the electrical output can be obtained from Gauss law, which is given as [30]
d d t D 3 . n d A = I t = V t R
The scalar equation D 3 = d 31 σ 1 + ε 33 E 3 gives the electric displacement. The constants d 31 and ε 33 denote the piezoelectric constant and permittivity of piezoelectric material, respectively. Equation (13) becomes
d 31 h p c 0 L b x 3 w x , t x 2 t + ε 33 L h p 0 L b x d v t d t + V t R = 0
Therefore, the generated piezoelectric voltage is given as
V p t = 3 R 0 L b x E p d 31 h p c 3 w x , t x 2 t d x + L i 1 L i n = 1 3 C n x d v t d t d x
The average output power delivered across the load resistance for a period of T is given as
P = 1 T 0 T V p t 2 R

2.2. Numerical Model

A finite element model was developed to investigate the natural frequency and the output power of the tapered piezoelectric energy harvester using COMSOL Multiphysics. Solid mechanics COMSOL module with multiphysics of piezoelectric effect and electrical circuits (cir), electrostatics (es) was used to create mechanical and electrical responses of the proposed models. The tapered PEH comprised a bimorph cantilever and a proof mass at the distal end. The piezoelectric layers were segmented at the strain nodes of the 3rd vibration mode. The proof mass, whose role is to reduce the frequency, was kept constant for a particular taper ratio of the width at a particular length and thickness of the beam. The width of the proof mass was always kept the same as the width of the wider proximal end of the beam due to the physical limits such as stability of the structure due to gravity load. The final geometry had 9 domains, 56 boundaries, 108 edges, and 64 vertices. The complete mesh consisted of 65,070 domain elements, 28,872 boundary elements, and 1524 edge elements. The number of degrees of freedom was solved for 61,665. The cantilever was mechanically fixed at its wider end, and the other end was free to move. The harvester was excited by a 0.5 g acceleration load at its resonant frequencies. A parametric sweep of the geometric parameters was performed for different tapering ratios from 0.1 to 1. The dataset was collected for different lengths of the beam (80 mm, 85 mm, 90 mm, 95 mm, and 100 mm) and widths of the beam (15 mm, 20 mm, 25 mm, 30 mm, and 35 mm) for a given tapering ratio. Figure 4 shows the first three vibration modes of the cantilever-based bimorph PEH segmented at strain nodes of the third vibration mode with a tapering ratio of 0.7. No damping was included in the structure; the undamped first three natural frequencies were computed as 59.866 Hz, 452.31 Hz, and 455.66 Hz. In terms of electrical boundary conditions, the inner faces of the piezoelectric layer were grounded, while the top ones were set to the potential condition. A load resistance R was connected across the terminals to measure generated power. Figure 5 depicts the generated voltage and power for a parametric sweep of load resistance R for the cantilever with a length of 100 mm, a width at the proximal end of 35 mm, and a taper ratio of 0.7 in the first, second, and third resonant mode. Since the proposed harvester was segmented at the strain nodes of the third vibration mode, the optimum load resistance of 2.7 kΩ of the third mode was considered to calculate the generated electrical output.
The voltage and frequency plots for the different tapering ratios are shown in Figure 6, Figure 7 and Figure 8. At the first resonant mode at a frequency of 57.5 Hz, a maximum output voltage of 32.26 V and maximum output power of 192.8 mW are generated for a tapering ratio of 0.1. A minimum output voltage of 25.928 V and minimum output power of 124.49 mW are generated for a tapering ratio of 0.7 at a resonant frequency of 60 Hz. For the second mode of vibration at a resonant frequency of 452 Hz, a maximum output voltage of 12.88 V and maximum output power of 30.22 mW are generated for a tapering ratio of 0.5. A minimum output voltage of 3.08 V and minimum output power of 1.76 mW are generated for a 0.1 tapering ratio at a resonant frequency of 441 Hz. In the third mode of vibration, a maximum output voltage of 7.25 V and maximum output power of 9.7 mW are generated for a tapering ratio of 0.9 at a resonant frequency of 455 Hz. A minimum output voltage of 0.8 V and minimum output power of 0.15 mW are generated for a 0.1 tapering ratio at 440 Hz. Since the harvester is segmented at the strain nodes of the third vibration mode, the output generated even at the third mode is significant, compared to the state-of-the-art multimode energy harvesters. Therefore, the tapered structure shows an improved performance in all the modes. The uniform strain distribution along the length of the tapered beam, compared to a nontapered beam (taper ratio = 1), improves the voltage generation of the tapered structure [4]. A pattern is observed that the operating frequency reduces with the tapering ratio in all the vibration modes, while the taper ratio for the maximum output generation is different for all the modes. However, the optimal selection should be considered at low frequencies and for a high output generation.

3. AI-Assisted Software Solution

The solution described in this section was implemented in Octave, release 6.2.0, and MathWorks MATLAB, release R2015a. Before designing the ANN, we performed a simple visual analysis of the data obtained by numerical experiments. 
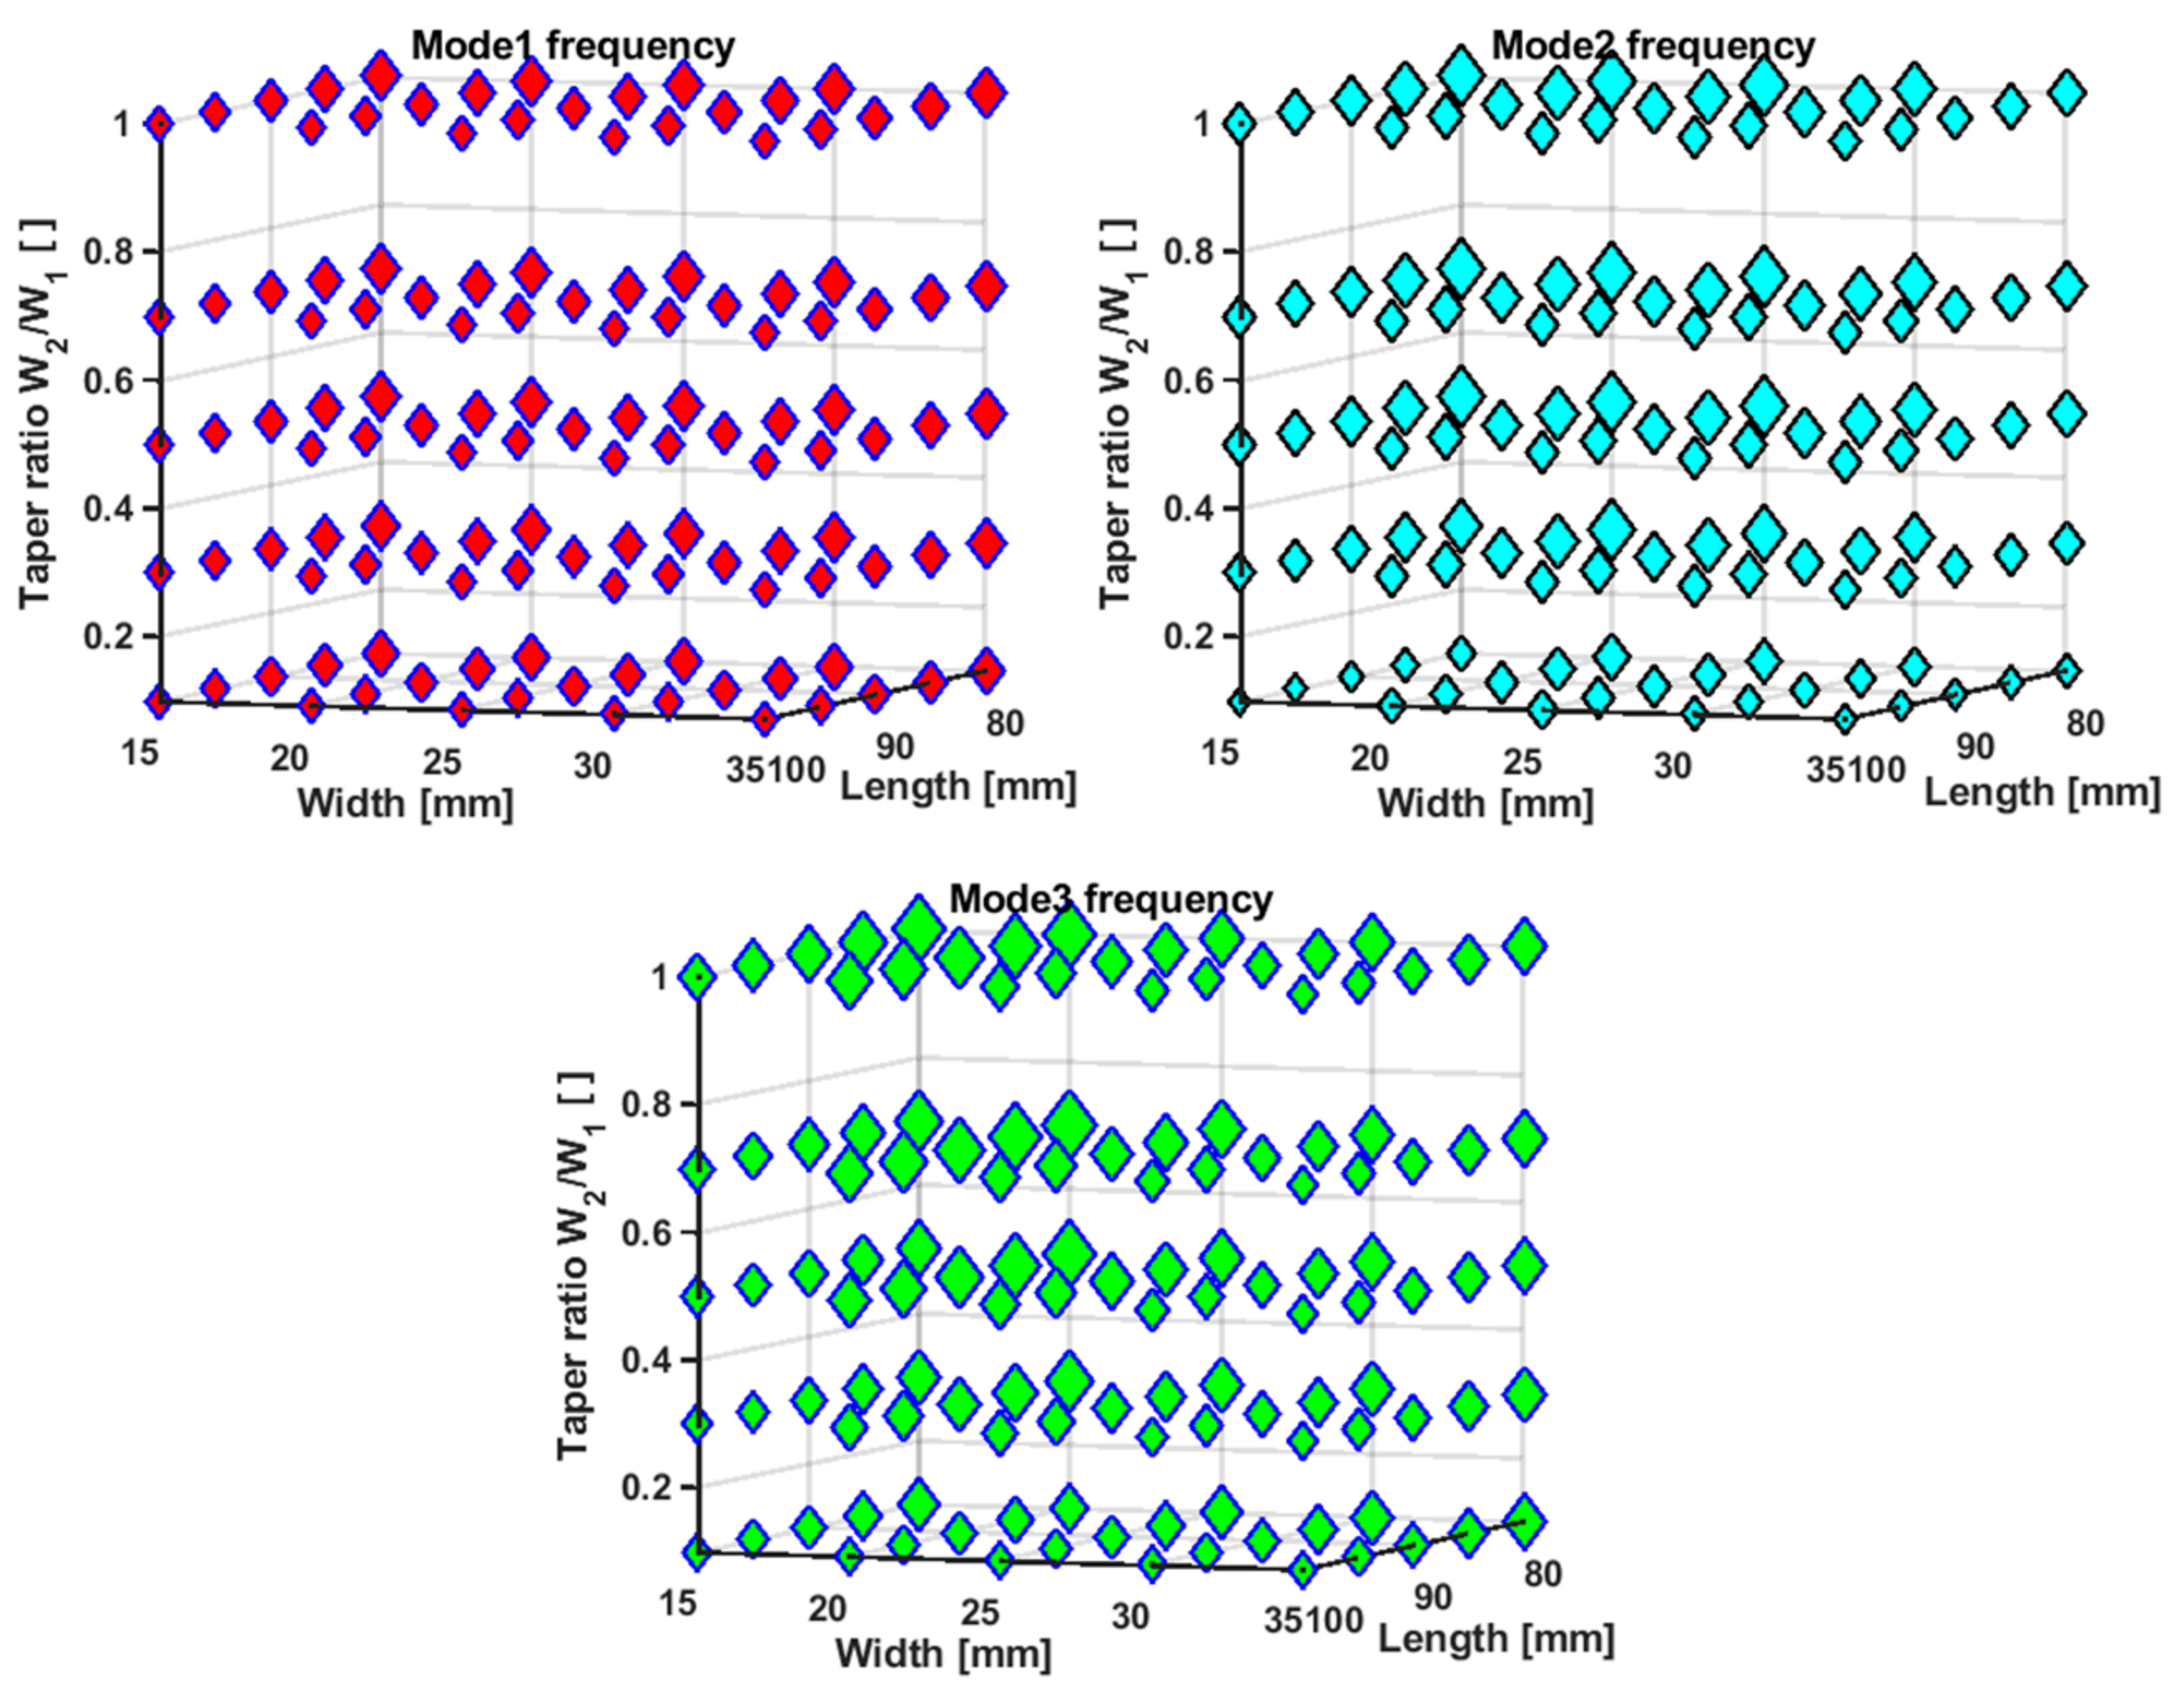
Figure 9 presents 4D graphs related to the first three resonant modes of the linearly tapered multimode bimorph cantilever-based PVEH, where x, y, and z-axis refer to its length, width at the anchor and the taper ratio, respectively, and the values of the frequencies related to each triplet (length, width, taper ratio) are proportionally scaled and used for defining the marker size. The greater the marker size is, the greater is the resonant frequency related to the parameter set defined by the marker coordinates. Thus, we visualize the trend of change in resonant frequencies caused by varying the cantilever beam’s dimensions.
In the same way, Figure 10 presents 4D graphs of the power related to the first three resonant modes of the linearly tapered multimode bimorph cantilever-based PVEH. However, the values of the power of the second and third modes are not just normalized but scaled exponentially in order to make all markers visible. The numerical value for the power related to the second resonant mode can be as low as 35.7 nW for the beam long 80 mm, wide 15 mm at the anchor, with the taper ratio of 0.1.
The analysis of raw data further proves that the longer the beam is, the lower the resonant frequencies of all three resonant modes are, and the greater the power of the first mode is. The wider the beam is, the greater the output power related to the first resonant mode is (if the length and the taper ratio are kept constant). For long and wide beams, the taper ratio of 0.5 seems to be optimal for the power related to the third resonant mode. The interdependencies of these values are complex; however, the decision on which data to use for training the ANN and which data should be the focus of multiobjective optimization is simple. For the first preliminary results, we used the data related to the first resonant mode only. The reasoning for this is based on the analysis of the data shown in Figure 9 and 
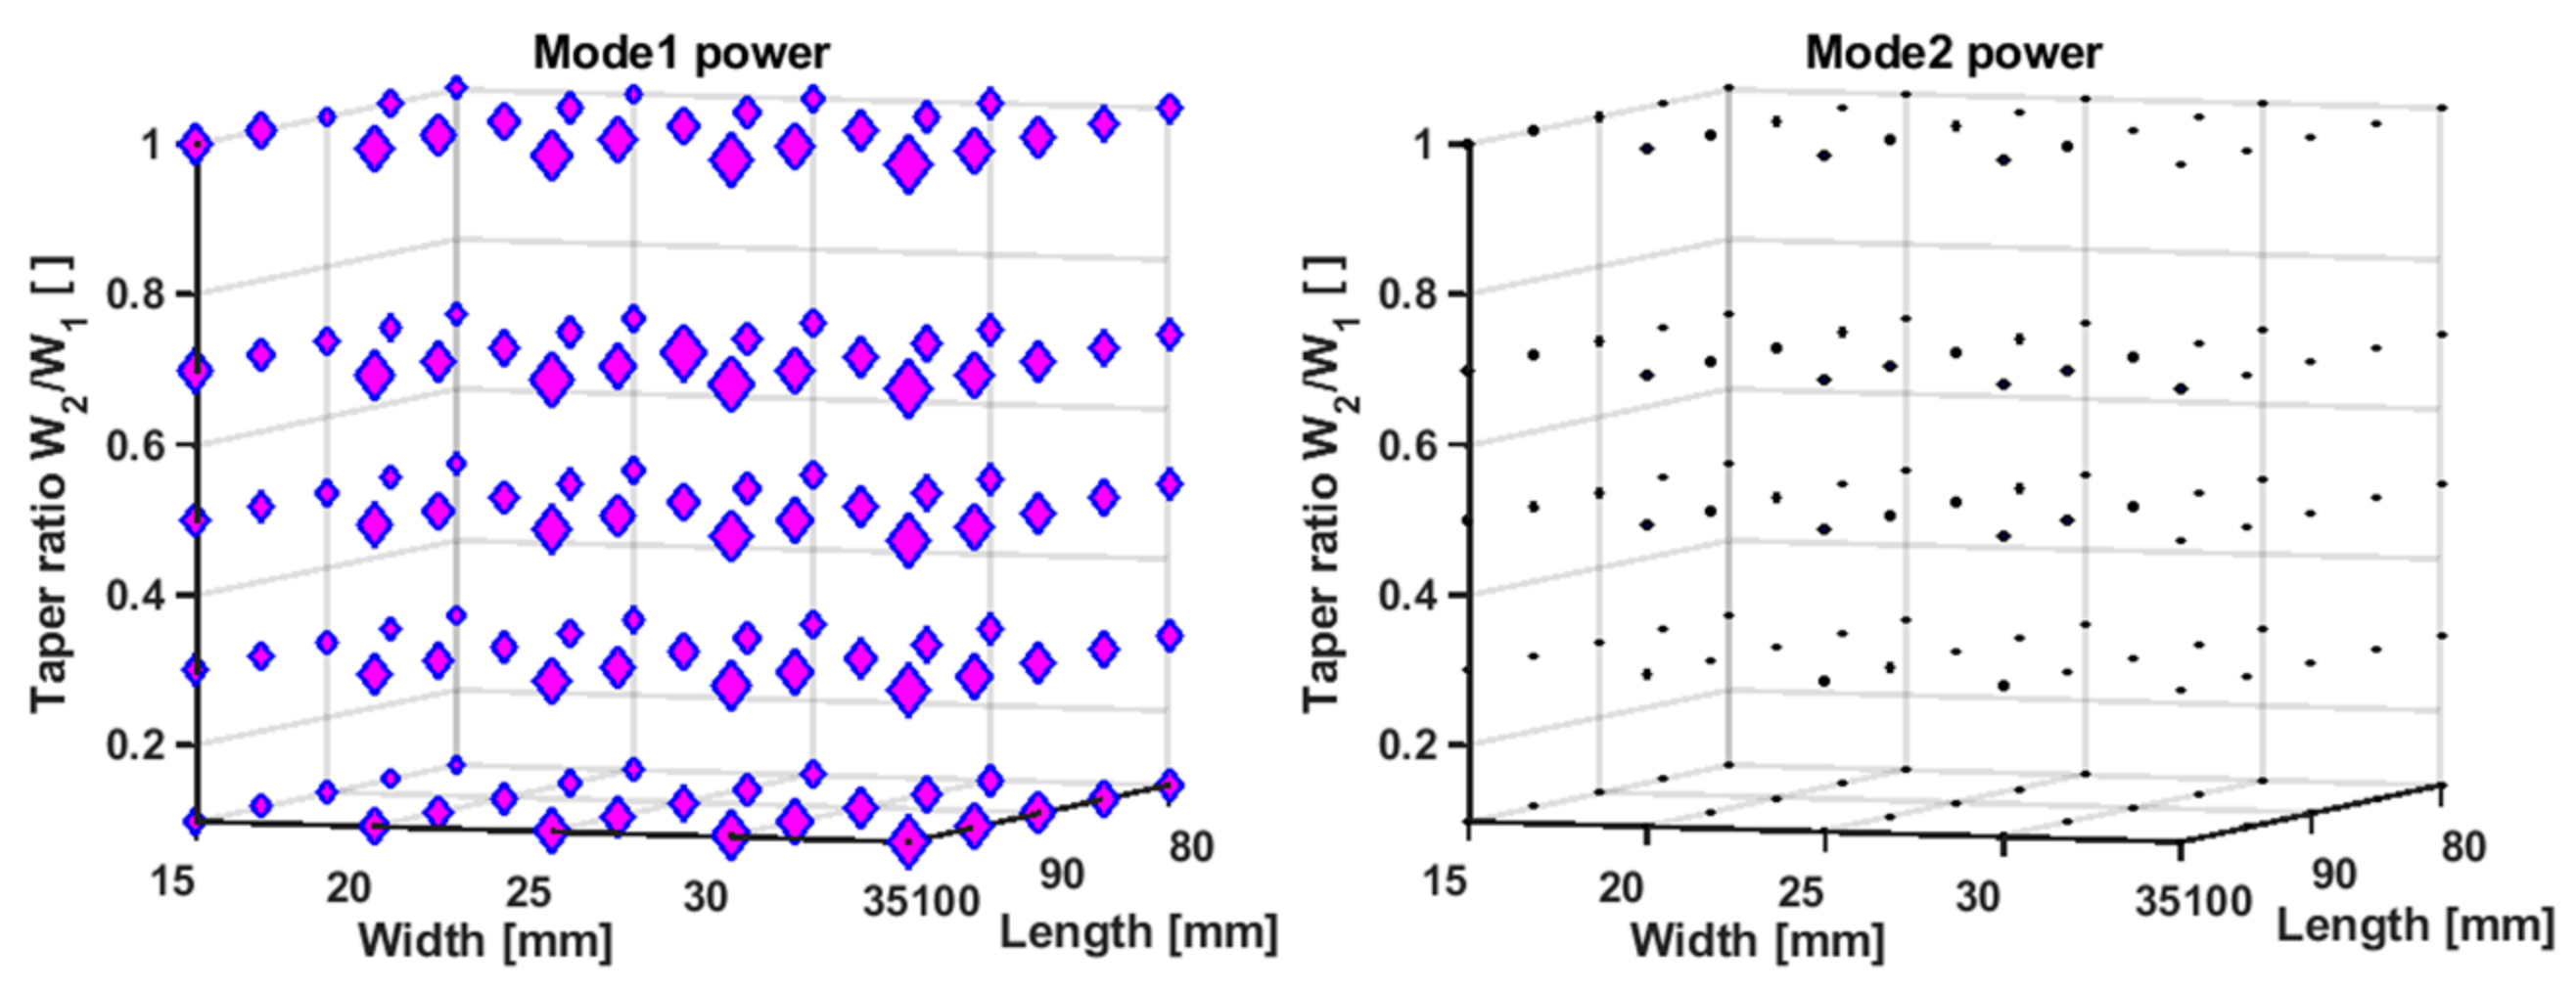
Figure 10. The marker size in Figure 10 is proportional to the power generated by a specific structure related to the marker’s location; however, the correlation between powers of different modes is not clear. Longer structures would resonate with all three modes at lower frequencies than the starting structure and hence enable harnessing more vibration energy. The amount of that improvement is visualized in Figure 11, which presents a 4D graph of the trend of gain from higher modes. Again, marker location is related to the beam’s dimensions and now the marker size is proportional to the ratio of the power of the third and the first resonant mode. Markers related to frequencies higher than 450 Hz are excluded because we are interested in low-frequency applications. The power of the second resonant mode is lower than the power of the first resonant mode for orders of magnitude, and hence, the trend of their correlation is not visualized. With different scaling of the beam’s dimensions, the impact of the third mode becomes noticeable in a similar manner as the power of the first mode becomes greater.
Therefore, in the search for the triplet (beam length, width, and taper ratio) related to high powers at low frequencies, we first constructed an ANN capable of predicting the vector of values related to the frequency and output power related to the first resonant mode of the linearly tapered multimode bimorph cantilever-based PVEH. The primary aim of the ANN was to ensure the proper trend in the search for the optimal structure and not to replace the numerical experiments per se.

3.1. ANN Capable of Predicting Frequency and Power of the First Resonant Mode

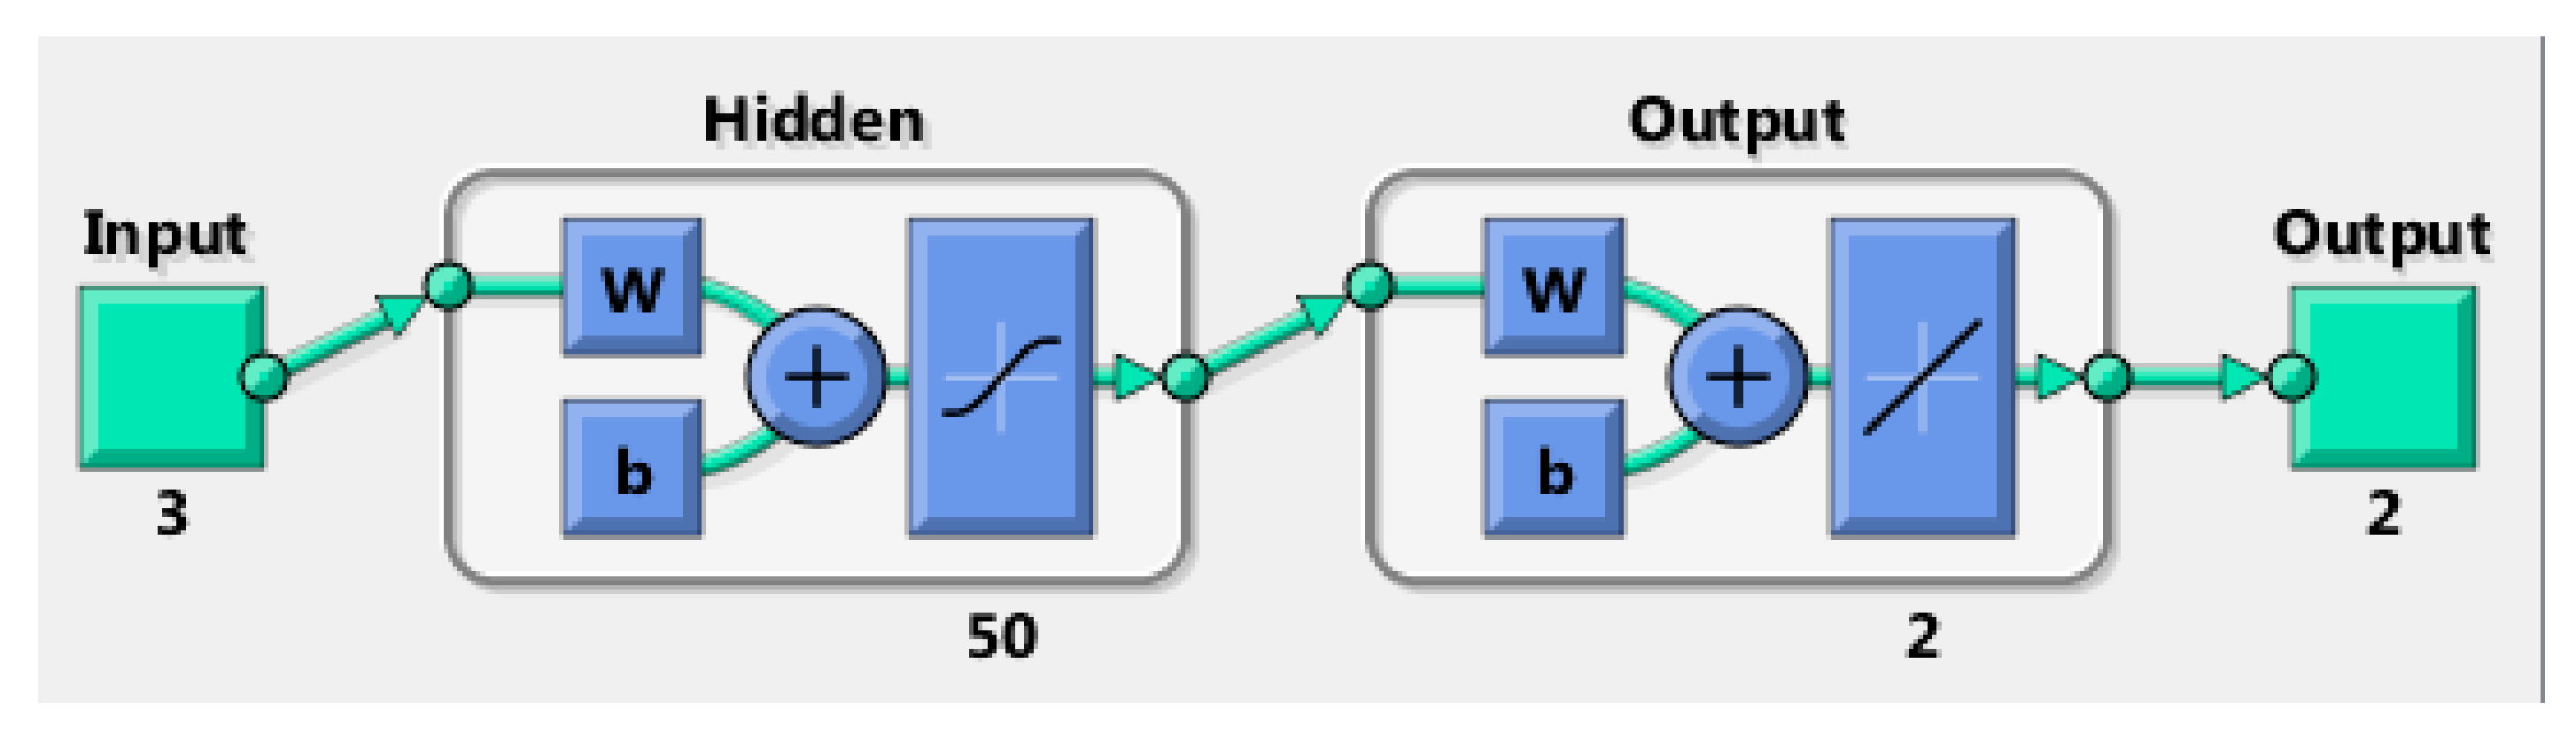
Since the ANN is used for fitting the exemplary data in order to provide a function that can predict the frequency and power related to the first resonant mode of a linearly tapered multimode bimorph cantilever-based PVEH, based on the beam length, the width at the anchor, and the taper ratio, the structure of the ANN is such that it has three inputs (related to the cantilever size) and two outputs (related to desired function output). As shown in Figure 12, there is a hidden layer with 50 neurons between the ANN input and output layer.
Every segment in the design of this network directly affects the results. After an intense search through numerous variants of the basic structure, the final one was chosen. In the final structure, the inputs were scaled so that their length and width were normalized, divided by 100, and thus, they did not differ from the taper ratio for more than an order of magnitude. The number of neurons in the hidden layer was 50. In the hidden layer, a sigmoid transfer function (hyperbolic tangent) was used, and the output layer computed the linear combination of the outputs of the hidden layer. The raw data related to the output were conditioned so that the frequencies were normalized and divided by 100, and powers were represented by their inverse multiplied by 100. The reason for conditioning the raw output data is the scalarization of outputs that was performed later in the process of multiobjective optimization. We later constructed a new function based on the obtained two output ANN functions by summing their squared components so that the new function was a scalar whose minimum was of our interest.
The starting point in exploring the behavior of nonlinear regression in this multilayer perception with backpropagation was the Neural Net Fitting application provided in the MathWorks environment, where training algorithms based on Levenberg–Marquardt (LM) method, Bayesian regularization (BR) method, and scaled conjugate gradient (SCG) method are available. The codes resulting from using the Neural Net Fitting were then altered and augmented so that they would allow the use of training methods other than the three provided in the Neural Net Fitting application, and thus, they could be a part of the code developed for the optimization purposes in MATLAB or Octave environment.
Another decision that directly affects results is the arrangement of the data. Out of 124 examples, we used 99 to create the ANN fitting functions, and we used the remaining 25 examples stochastically excerpted from the set of 124 examples later to assess the generalization capabilities of ANN fitting functions. The final decomposition of the 99 examples into three categories was 70% for training (69 samples), 15% for validation (15 samples), and 15% for testing (15 samples).
One-attempt training and multiple training with different training methods result in different ANN fitting functions. The quality of the resulting ANN fitting functions is assessed using two figures of merit. One is the mean squared error (MSE), the discrepancy between the target (the true output provided to the ANN in the example used for supervised learning) and the output generated by the ANN itself. The closer the MSE is to zero, the better. Another figure of merit for the assessment of the quality of an ANN is the regression coefficient R, also called the coefficient of correlation because it is related to the correlation between the target t and the ANN’s output a. R is related to the coefficient of determination, R2 calculated by the following expression:
R 2 = 1 i = 1 N ( t i a i ) 2 i = 1 N ( t ¯ t i ) 2
where N is the number of examples in a dataset, and t ¯ i is the arithmetic mean of the target values. The closer the R is to one, the better. 
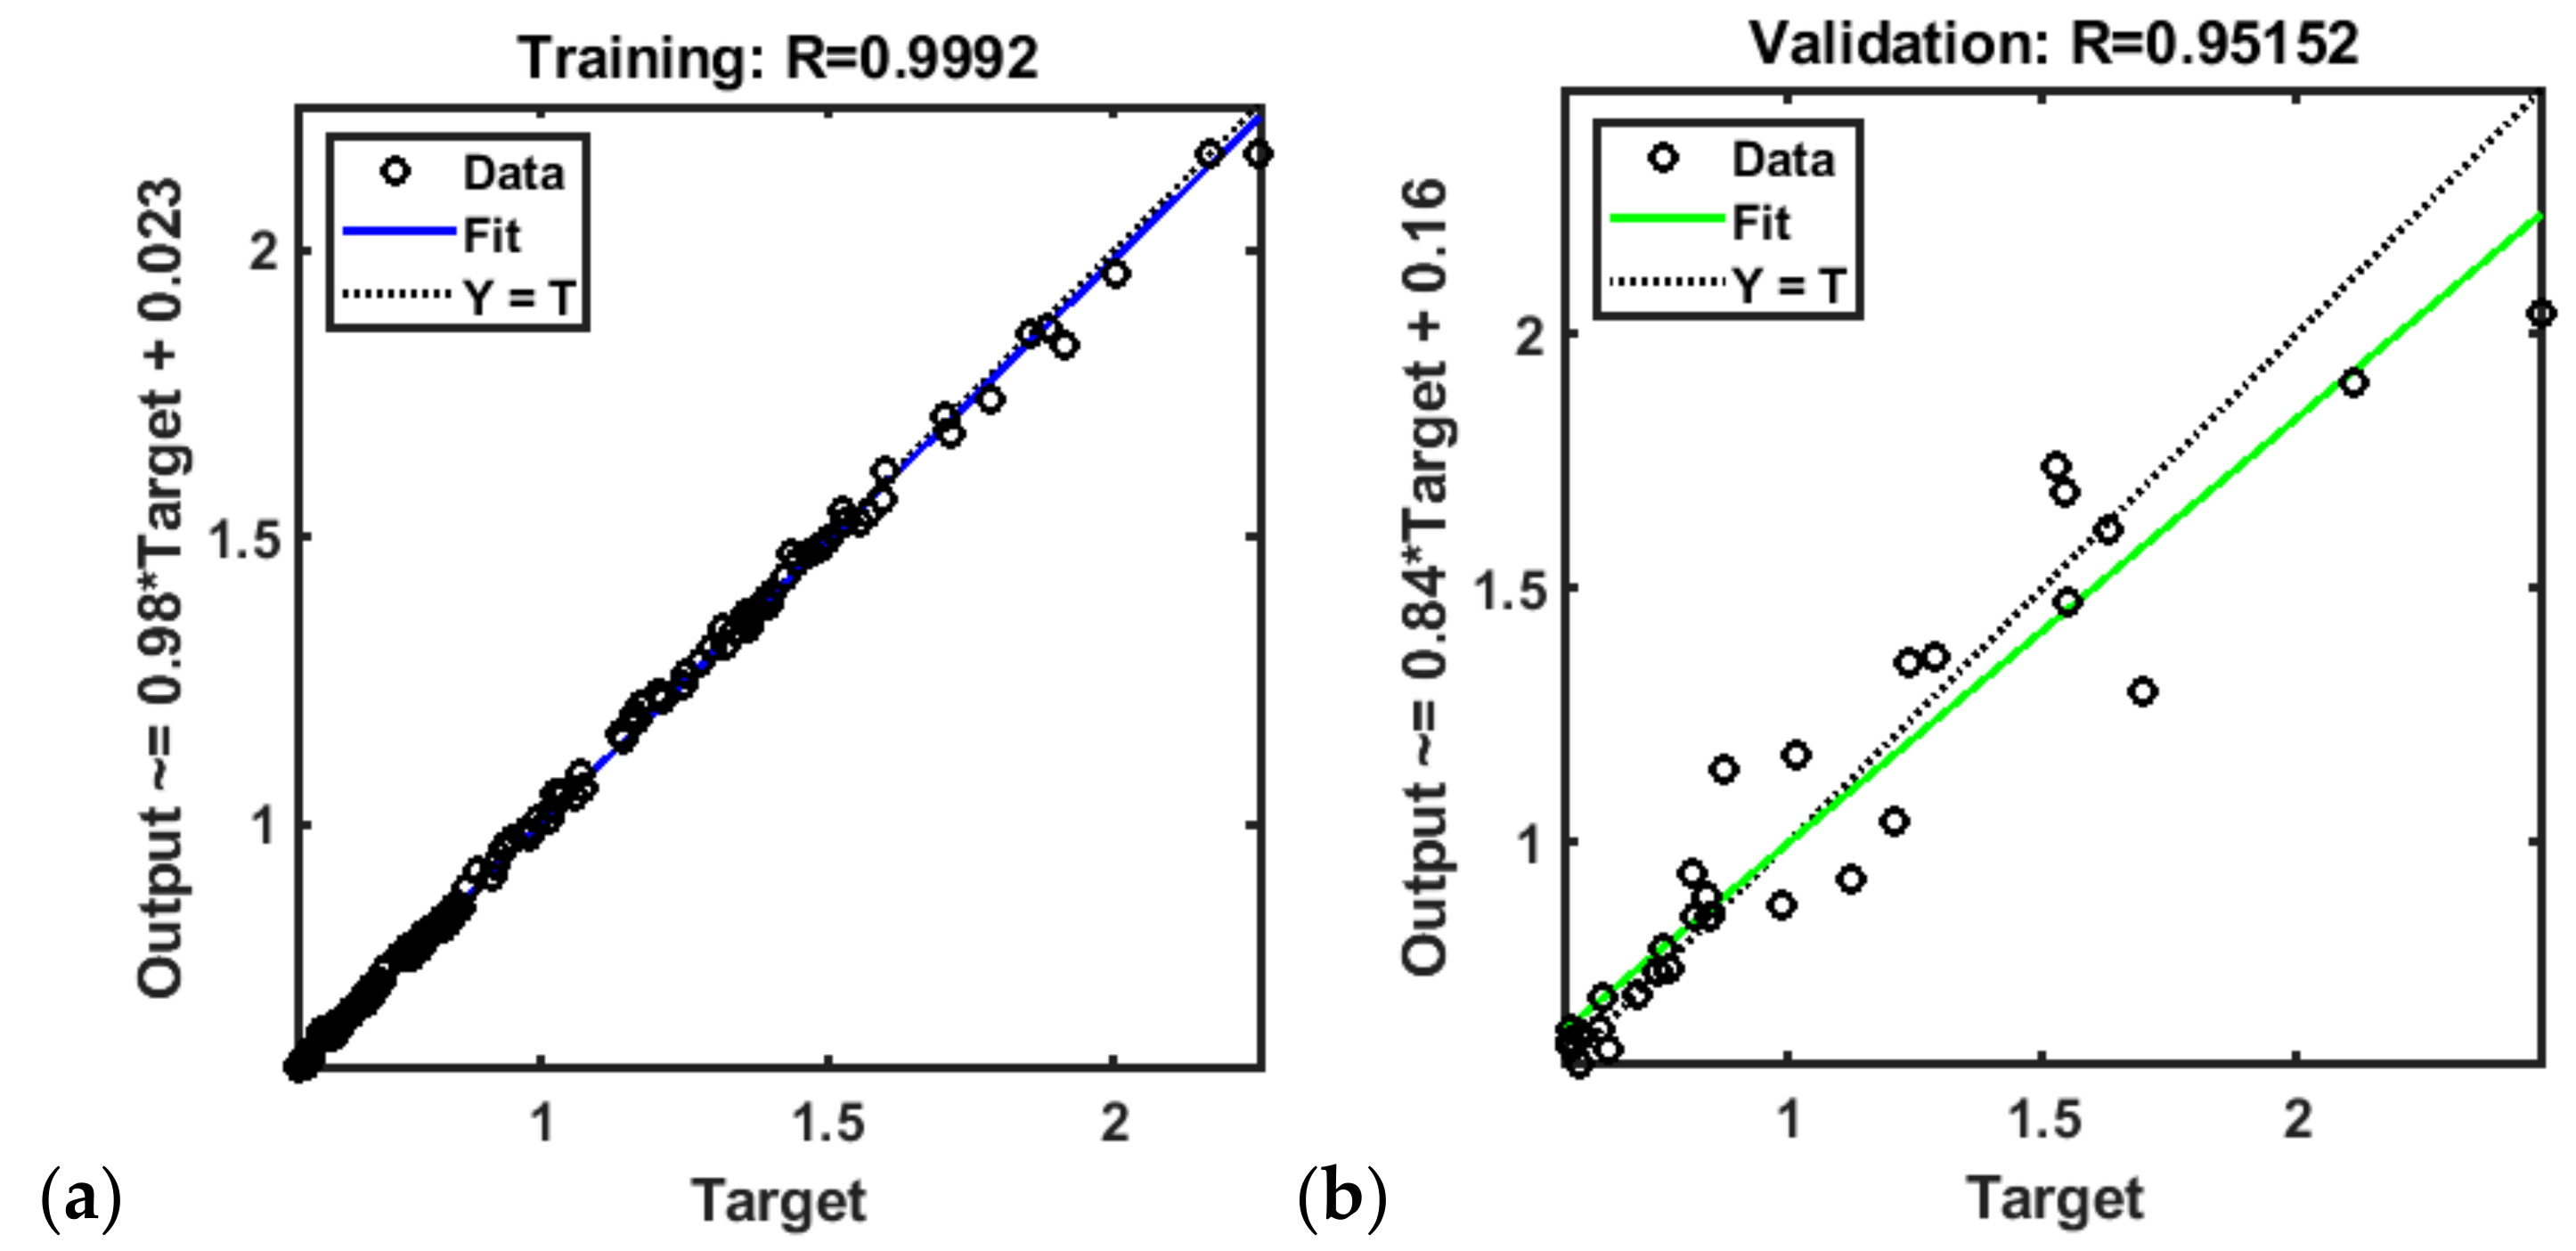
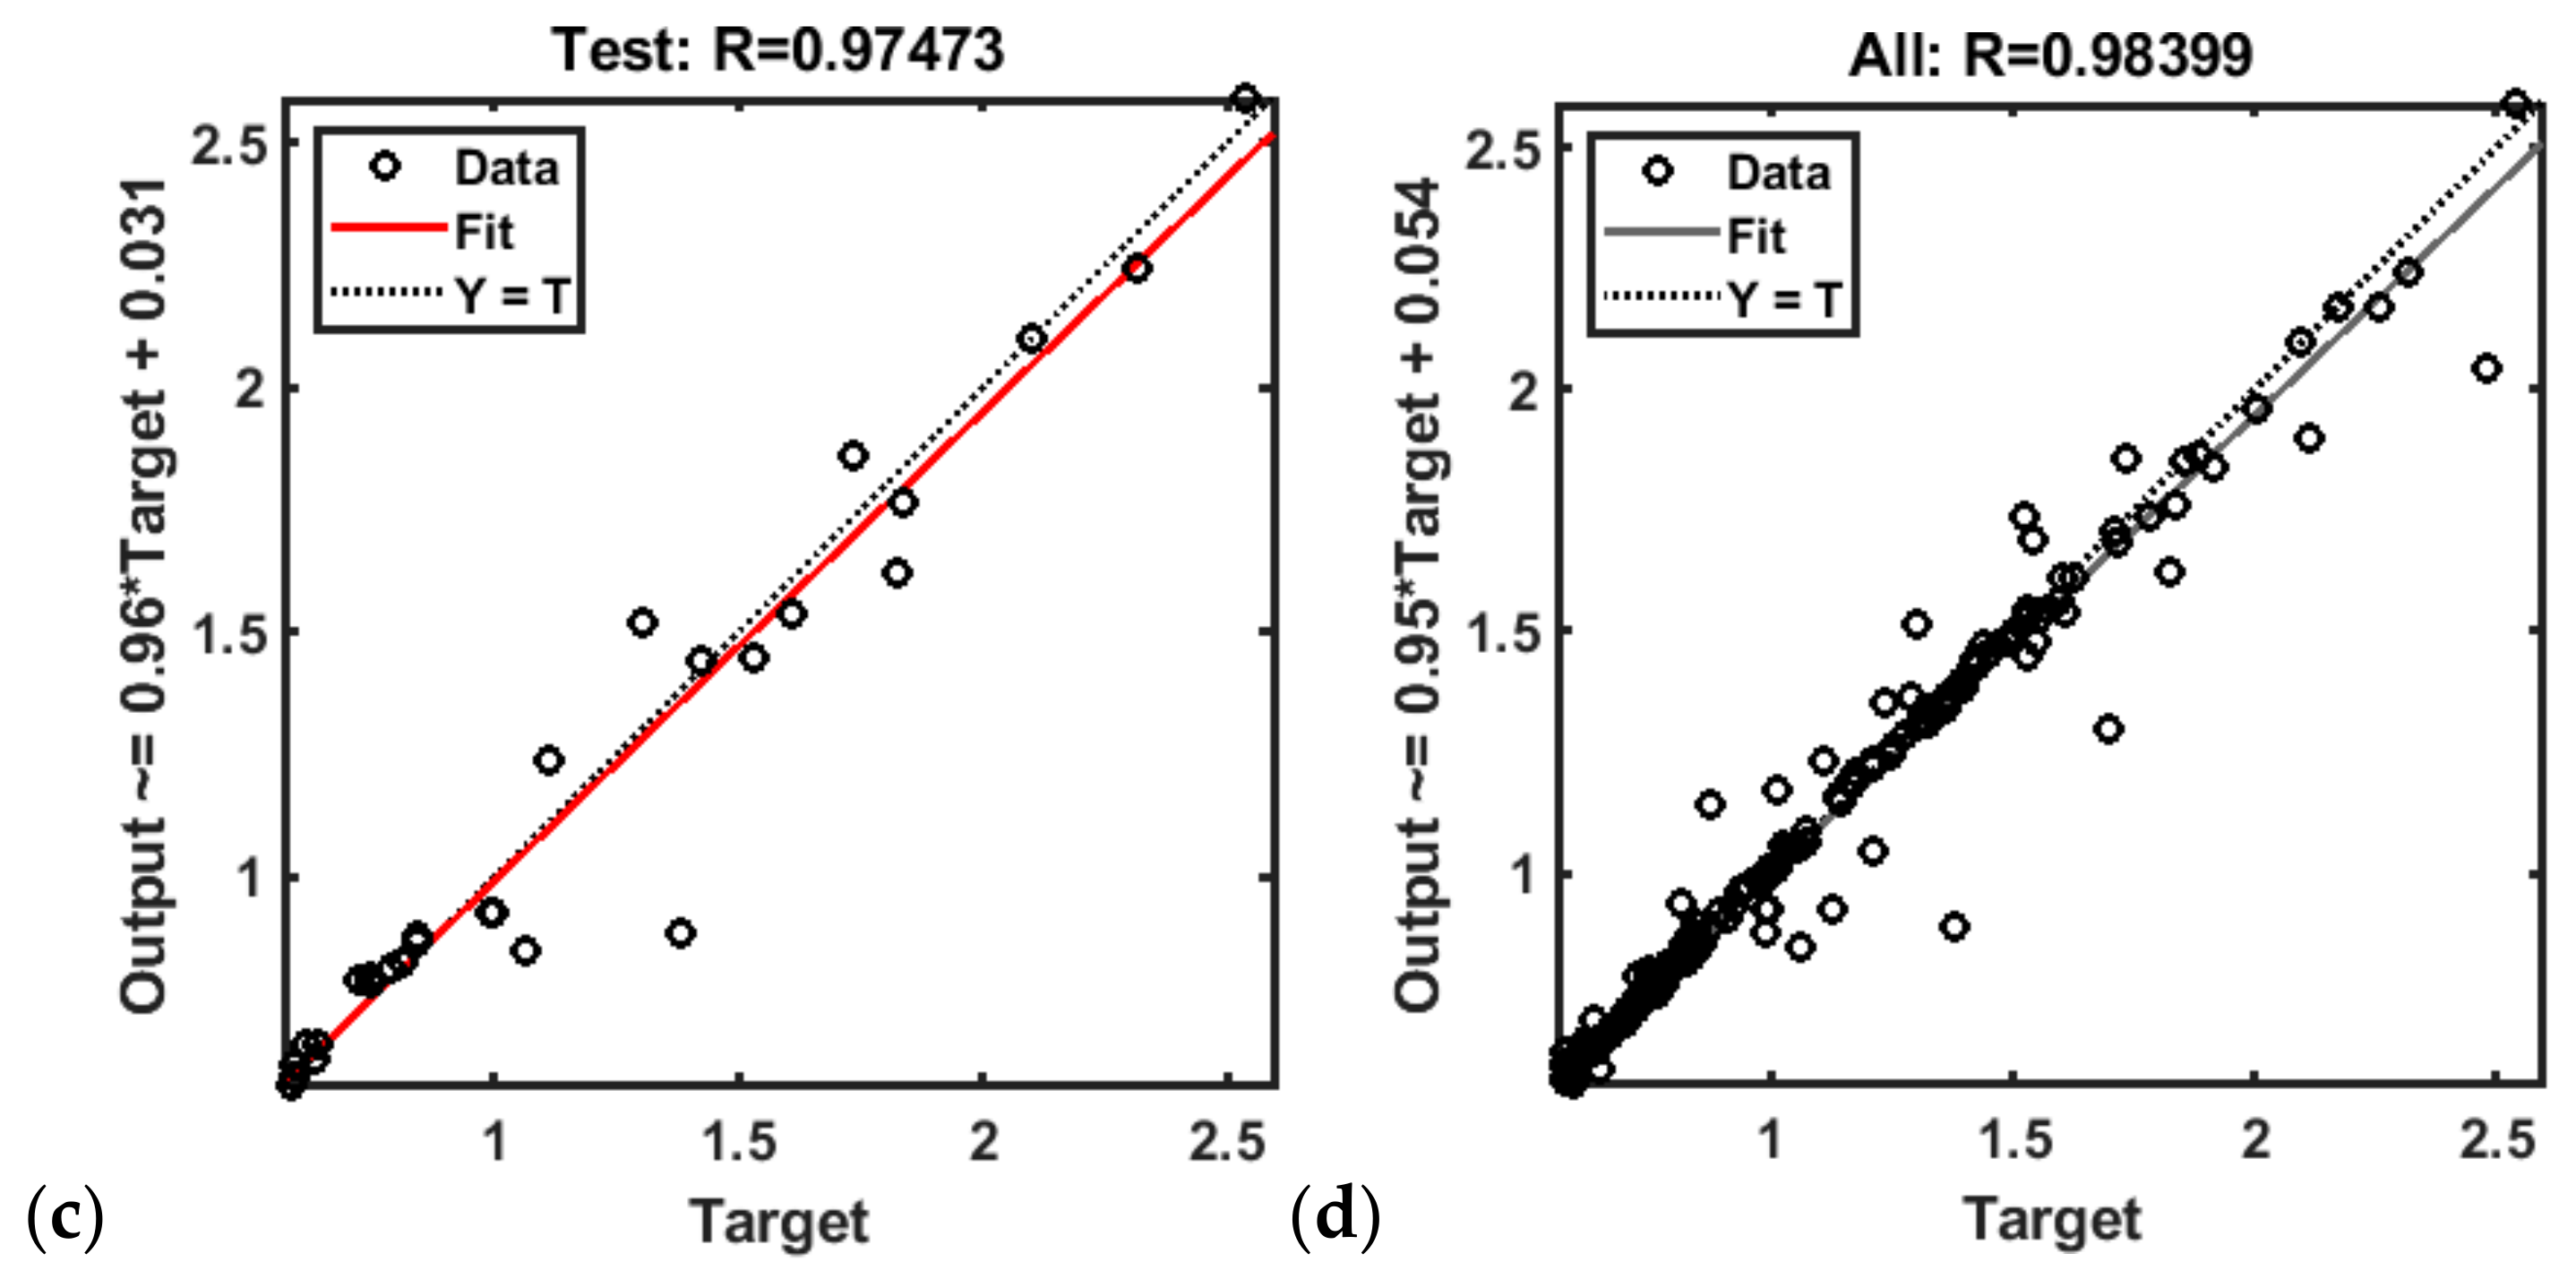
Figure 13 shows the regression coefficient of the ANN fitting function obtained by applying the LM training algorithm. All regression coefficients are above 95.152%, which is considered a good result. Since the ANN fitting function generates output as a two-column vector, the correlation between the targets and the ANN outputs is not computed automatically for any of the two outputs. We analyze separate outputs later by assessing the capability of the ANN fitting function to give a good, never previously achieved result for the new data.
Figure 14 shows the regression coefficient of the ANN fitting function obtained by applying the SCG training algorithm. The related regression coefficients are even better, all exceeding 95.468%. Table 3 shows the related MSE for these two ANN fitting functions. In terms of MSE, the LM training method proved itself superior over other training methods since its MSE is better in predicting the frequency and power related to the first resonant mode than that of the SCG training method. For predicting the (normalized) frequency of the resonant mode, its MSE is 3.8398 × 10⁻⁴, an order of magnitude lower than the MSE of the ANN fitting function obtained by applying the SCG training method. If an ANN finds a complex surface that connects all the examples, it has been fed with, then the training error may happen to be zero, but it is not certain that the ANN, although fitting the training data perfectly, can be used as a good predictive model. Thus, we tested the ANN by using the data never presented to the ANN before.
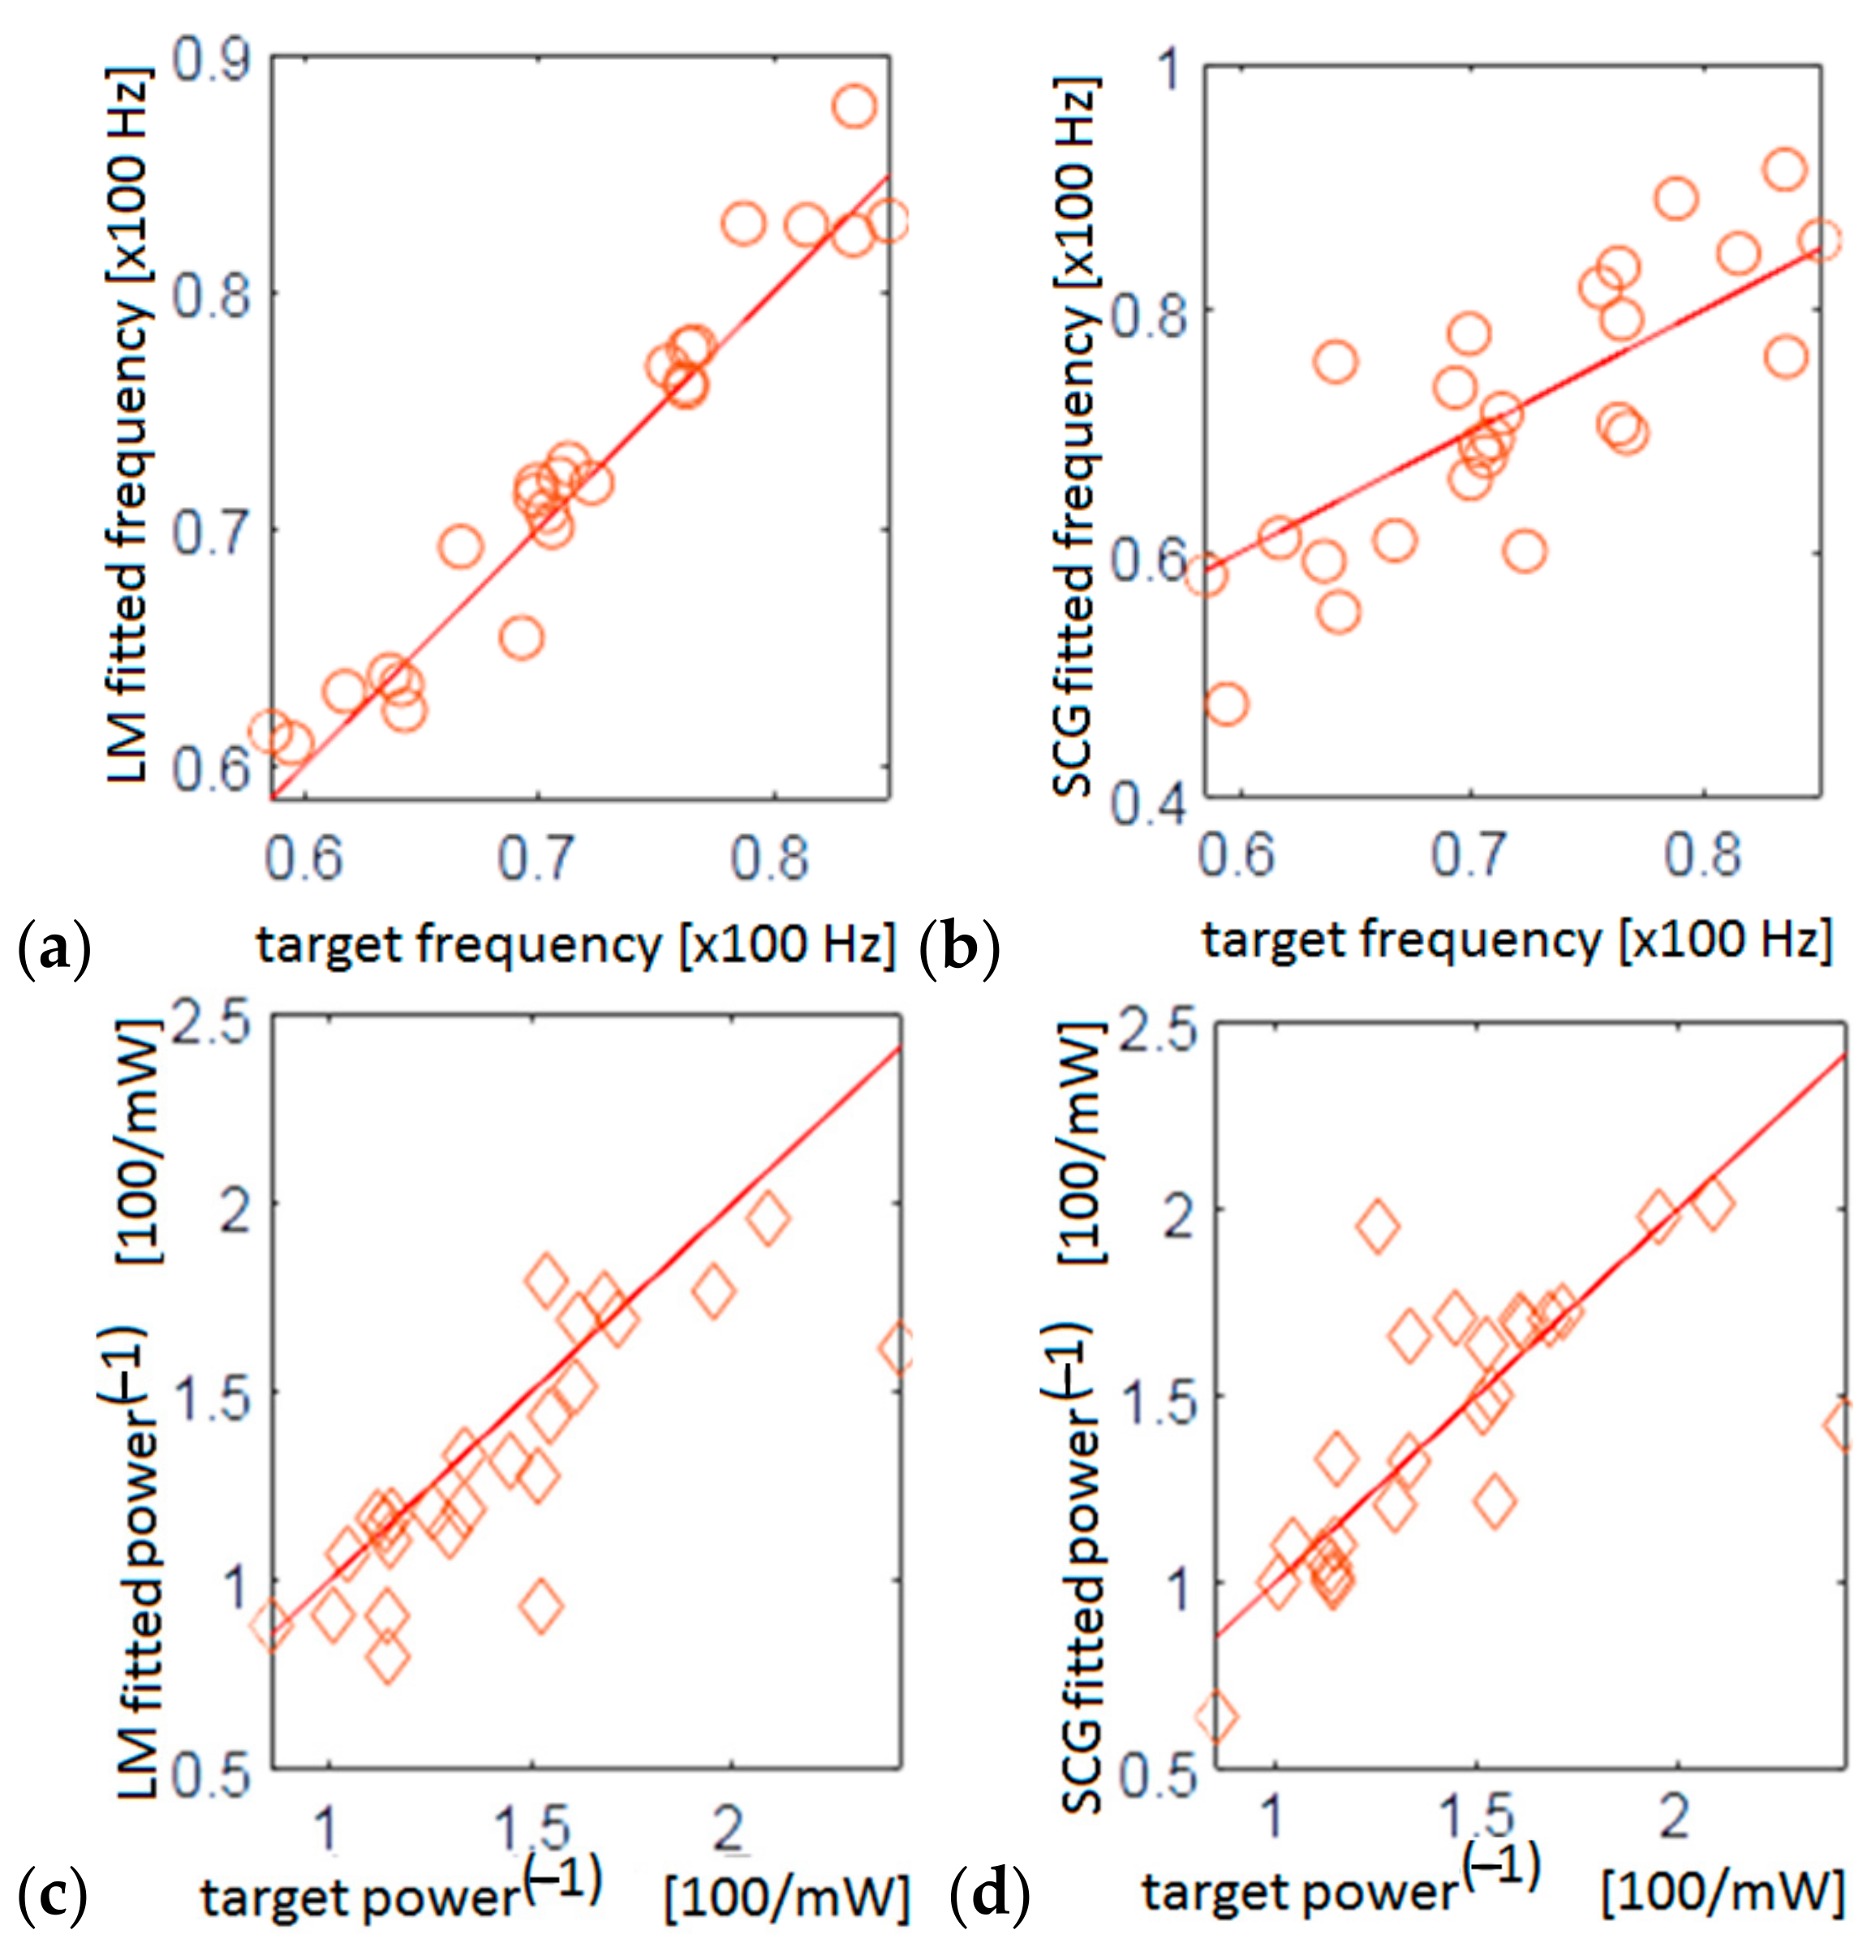
In terms of its capability for generalization, the ANN fitting function obtained by applying the LM training method outperforms the ANN fitting function obtained by applying the SCG training method as shown in Figure 15, where the correlation between the target data and the data generated by the ANN fitting functions is calculated for the new data, entirely unknown to the ANN.
However, the ANN fitting functions themselves, although they can serve for reverse calculations of the frequency and power related to the first resonance mode of a linearly tapered multimode bimorph cantilever with segmented PZT-5H patches, are here just an intermediary result. The tool that we need aims to deliver the optimal dimensions of a cantilever beam with respect to PVEH applications. As we describe later, we integrate the obtained ANN fitting functions in the optimization algorithms to achieve that.
Since the number of neurons in the hidden layer is high (50), the expressions for obtained functions are not given here in the analytical form but are available upon request.

3.2. Optimization: Goal Attainment Method and Genetic Algorithm

Our goal is simultaneous minimization of the resonant frequency and maximization of the output power. Frequency and power form a vector of objective functions. Hence, there is no unique solution to this optimization problem, but a set of solutions related to the tradeoff between the competing objectives [31]. We perform the multiobjective optimization or perform scalarization of the output before searching for the minimum of the scalarized function. In both cases, we need to define the parameter space, the domain in which we seek the solution. All dimensions are positive; thus, the lower bound for the length, the width, and the taper ratio are zero. The upper bound for the taper ratio is one. As for the upper bounds of the beam’s length and width, they are application specific. Here, we used values up to 150–200 mm (the scaled value is equal to 2) as the upper bound for the length of the cantilever and the same values for its width.
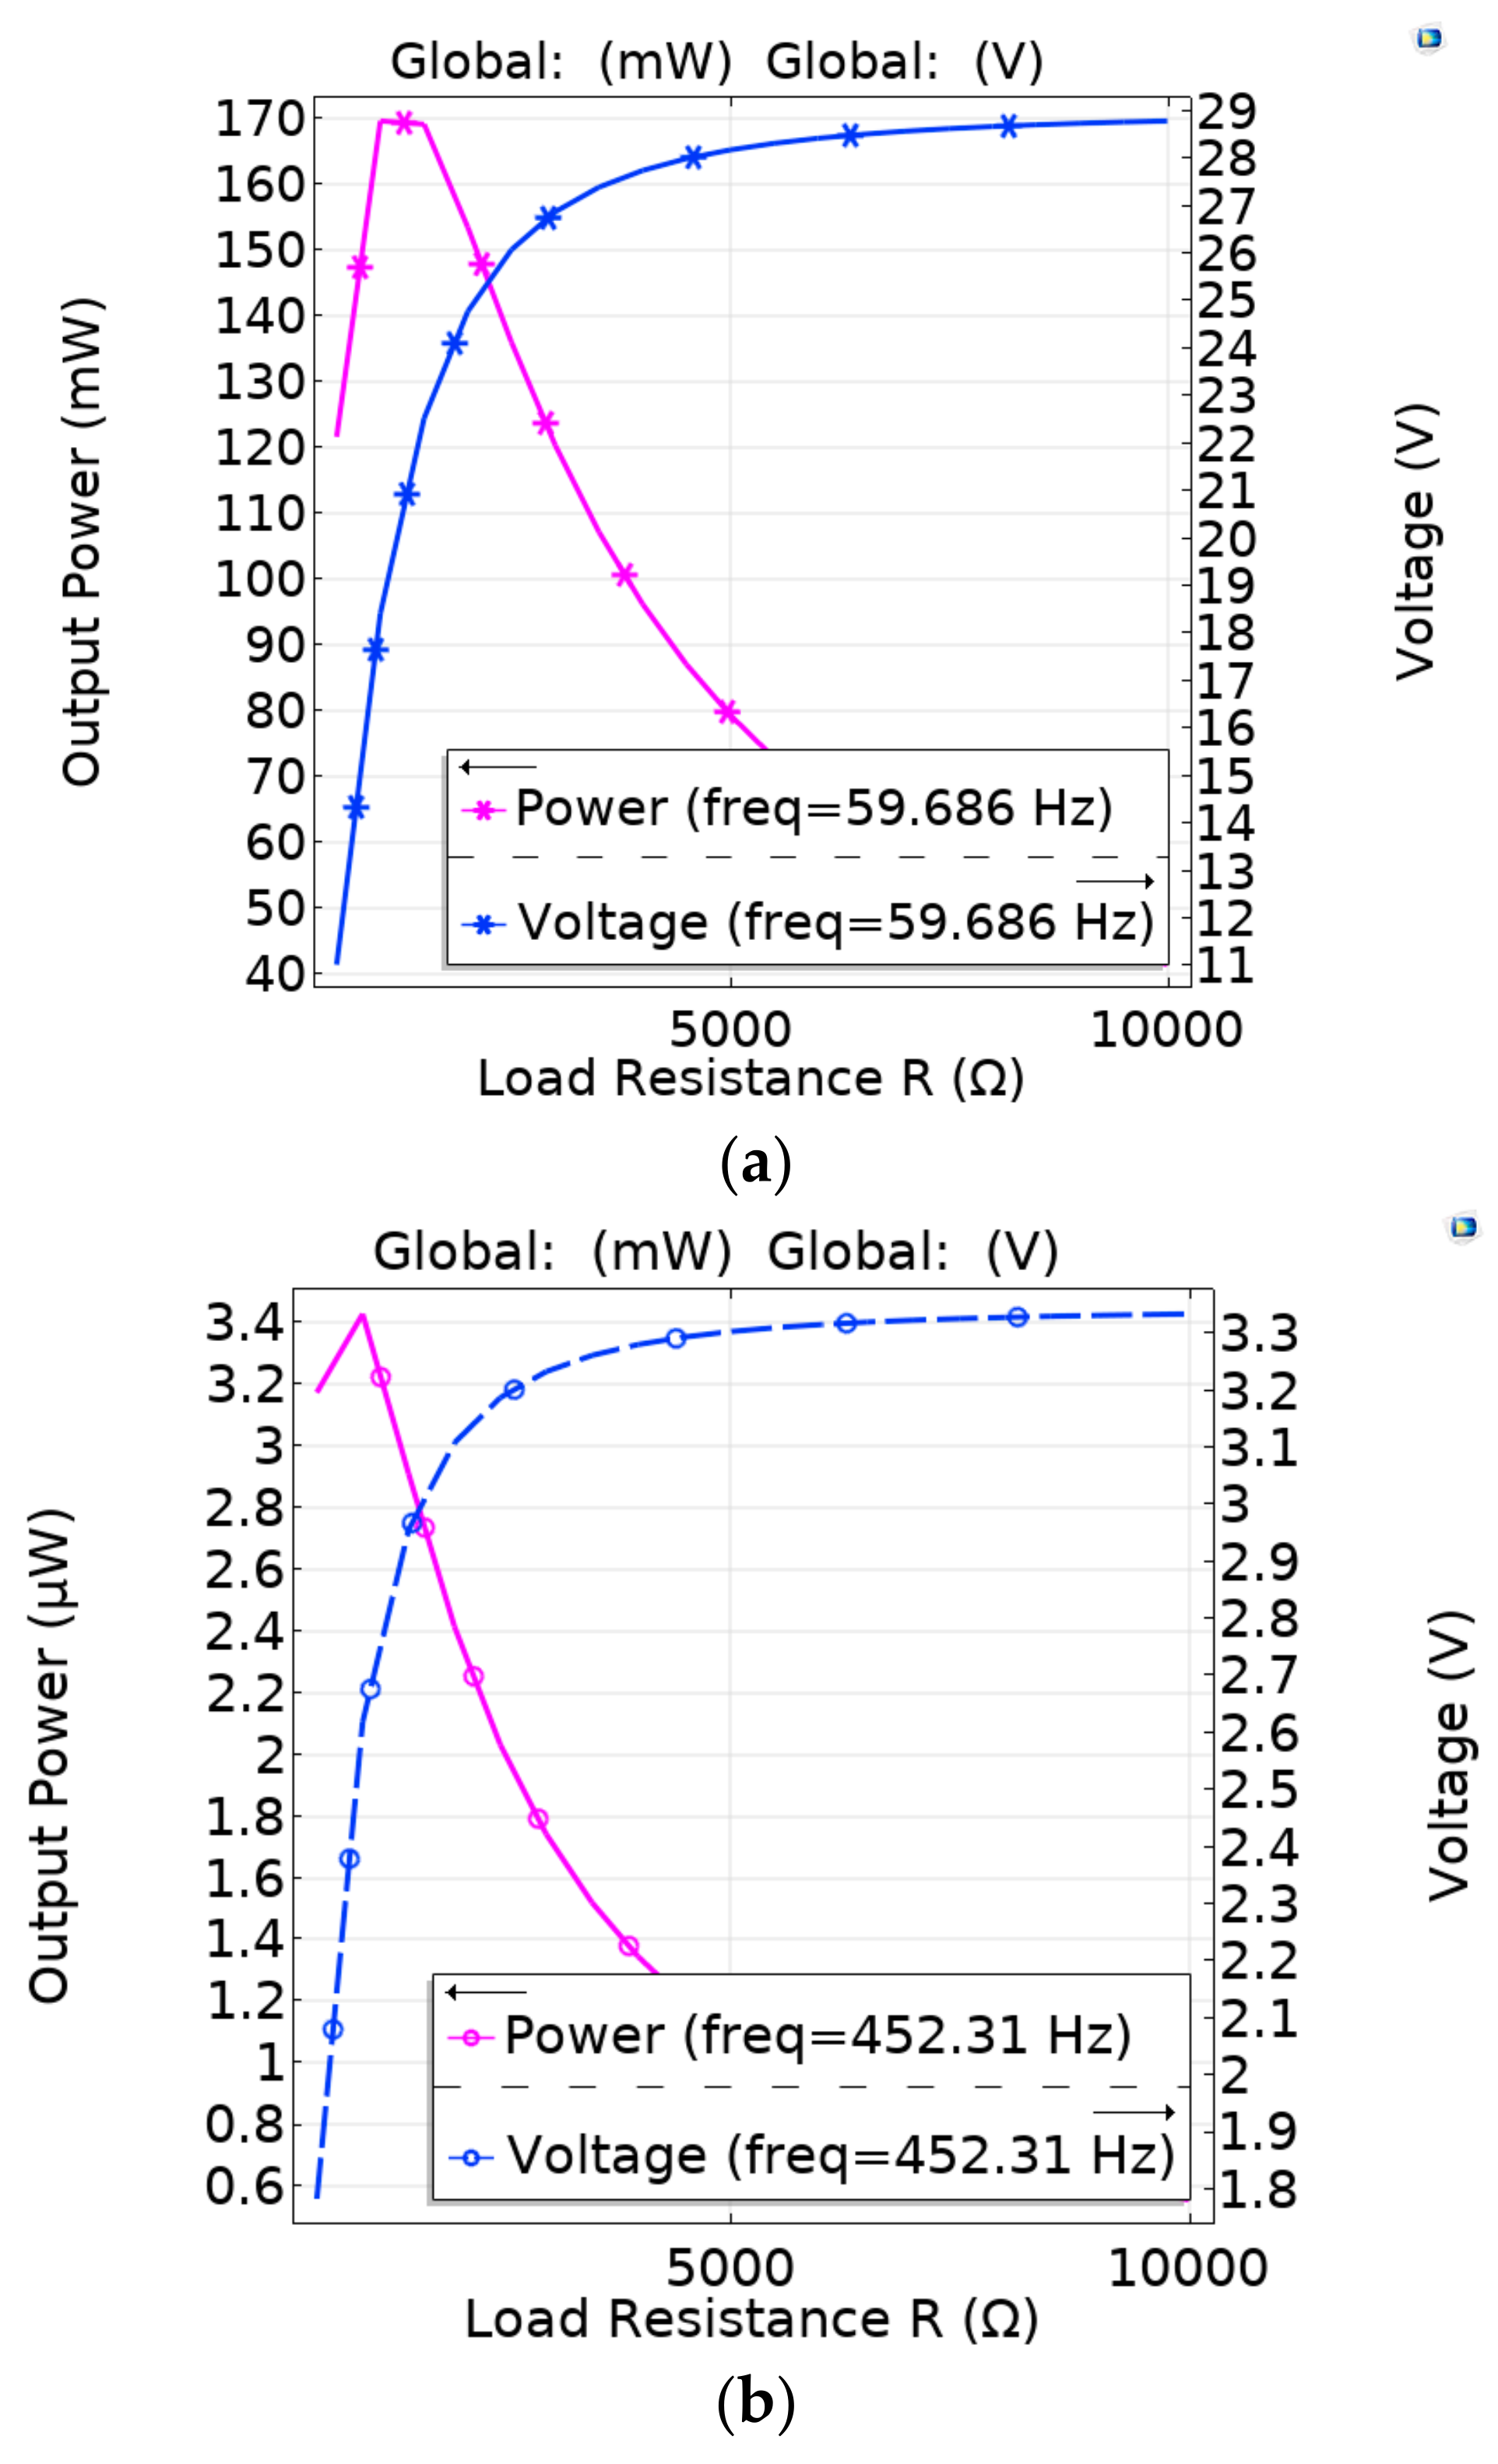
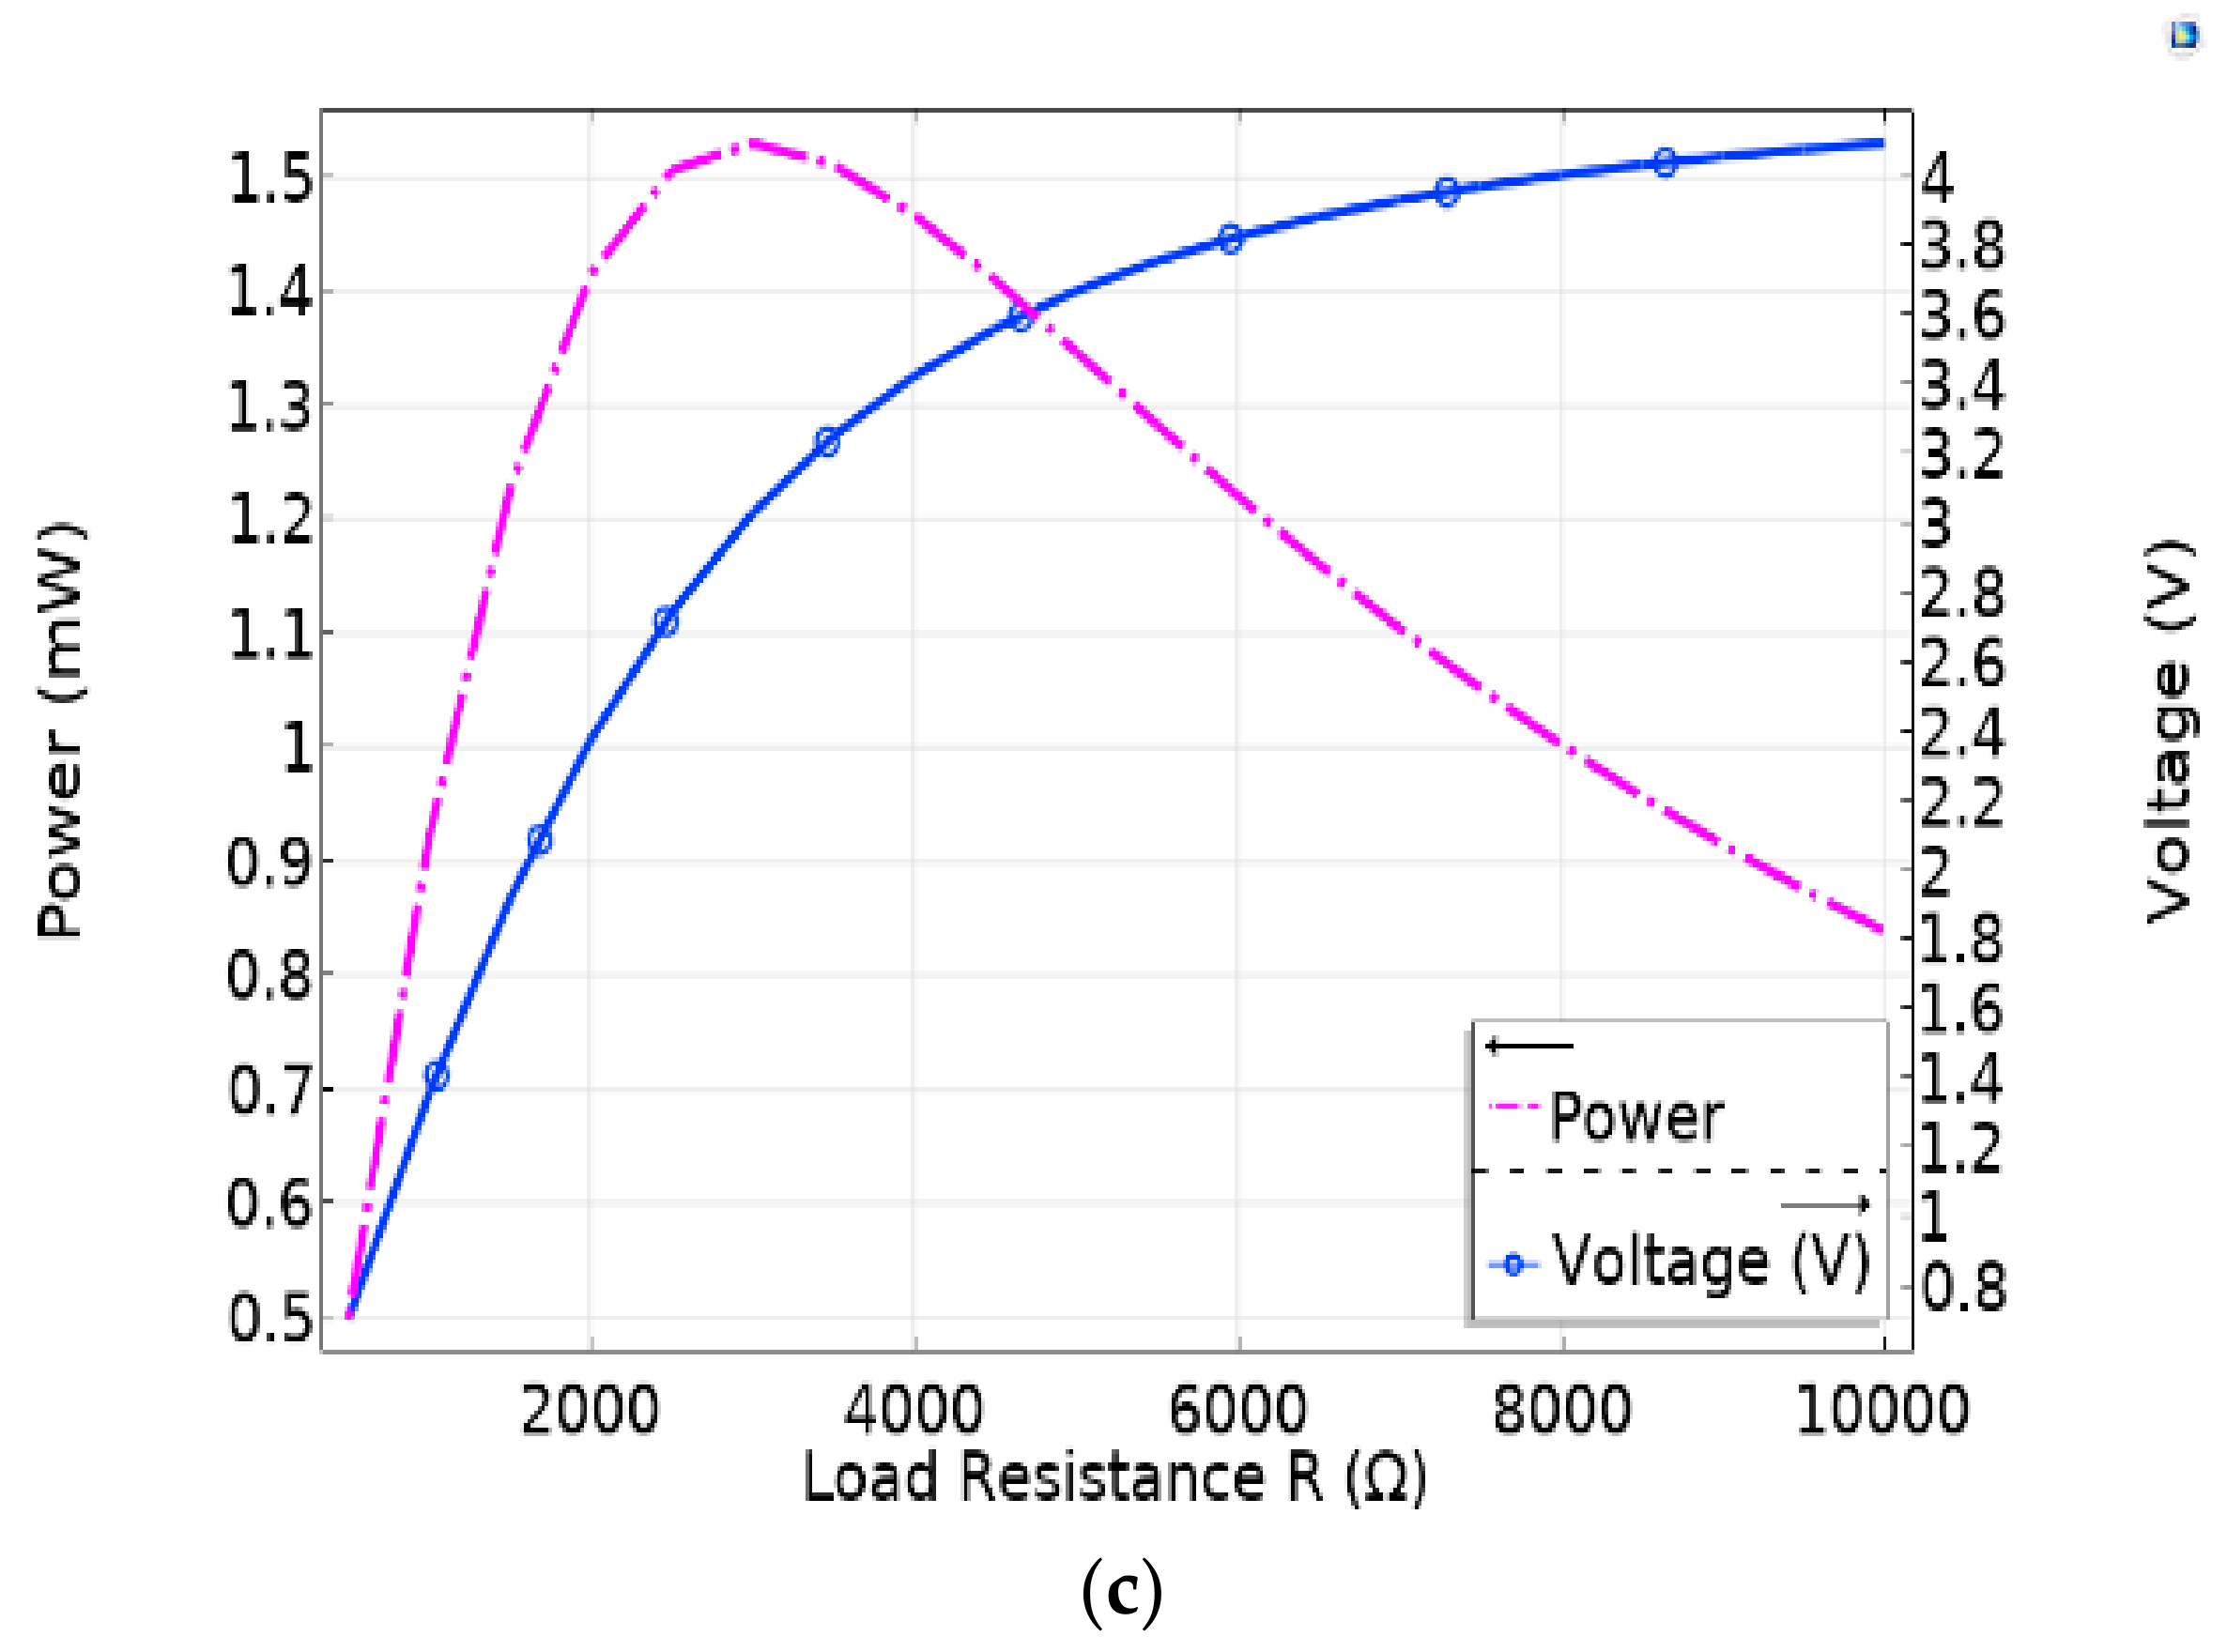
As shown in Figure 5, apart from the cantilever dimensions, the load resistance can also be optimized with respect to the resonant frequencies and the output power. The optimal value of the load resistance varies with the geometry and the vibration modes. The lowest value of the optimum load resistance occurring for all the geometry and vibration modes of the structures under consideration is at the third mode of vibration with 2.7 kΩ. Since PVEH is segmented at strain nodes of third vibration modes to optimize the performance at higher (second and third) modes (especially the third mode), we considered the abovementioned optimum load of 2.7 kΩ to reduce the data computation time, and performed optimization seeking the optimal triplet of parameters related to the cantilever beam length, the width at the proximal end, and the taper ratio.
We first performed the scalarization of the objectives. Both ANNs (the one trained with the LM method and the one trained with the SCG method) are trained to predict the normalized resonant frequency and the normalized reciprocal power related to the first resonant mode. The sum of their squares is the function we aim to minimize. We performed the minimization in two ways—by applying the goal attainment method and by integrating each ANN with a code that implements the genetic algorithm.
The optimization algorithm related to the goal attainment method starts with defining the starting values for optimal parameters that we seek. In our case, those are the geometrical parameters (the beam length, width, and taper ratio). The goal refers to the output, i.e., the function we want to achieve. Although the MathWorks MATLAB statement fgoalattain allows for the use of vector functions, and therefore, we can define separate goals for the frequency and power (we can even have them weighted with different weights), we opted for the optimization of the scalarized function obtained by postprocessing of the fitting function generated by the artificial neural network. If F i are ANN output functions (frequency and power) used as optimization objectives, and F i are the goal functions, the goal attainment method aims to find x to minimize the maximum of
F i ( x ) F i w i
where wi denotes a set of positive weights.
The figure of merit of this optimization, as provided by the MathWorks MATLAB toolbox, is the attainfactor, a value related to the percentage of the objectives that may be overachieved (in which case the attainfactor is negative) or underachieved (in which case the attainfactor is positive). The closer this figure of merit is to zero, the better the optimization results will be.
The optimization algorithm related to the genetic algorithm, on the other hand, does not have a starting point related to the set of parameters that we seek; it starts instead from the whole parameter space. In our case, we allowed the length and the width at the anchor to spread from 0.1 mm to 160 mm, while the taper ratio varied from 0.1 to 1. The function is evaluated for all the triplets in the parameter space. Analogously to the biological evolution, in the genetic algorithm method, in every iteration, the selection is based on previous reproductions, crossovers, or mutations. These selections stochastically navigate the search [31]. The great advantage here is the ability to find global extrema rather than to stick to some of the local ones. The number of iterations is not crucial for finding an extremum, but the population size is the factor that has a great impact on the success of the genetic algorithm. The greater the population size is, the smoother the road towards the global extremum. The number of iterations that we used was 40, and the population size we chose was up to 1000.
Both optimization methods—the goal attainment method and the genetic algorithm—allow for setting lower and upper bounds for the optimal values we seek. Our bounds were the same in both methods. They were also equal to the edges of the parameter space defined for the genetic algorithm (the lower bound for all three parameters was 0.1, the upper bound for the beam length, and its width at the anchor was 160 mm).

4. Results

We constructed a single-objective optimization problem and solved it in different ways. Each of the approaches resulted in a different triplet. Here, we present the obtained solutions and seek the superior one. The superior solution is chosen by comparing the objective function values of all the solutions and selecting the one closest to zero. According to this reasoning, the best candidate for the optimal parameter set in Table 4 is the triplet because its scalar function has the lowest value. The triplet choice is obtained by the goal attainment method applied to the ANN function adapted for single-objective optimization that fitted examples with the scaled conjugate gradient method. For different starting values, the described procedure results in a wide span of scalar values (as per Table 4, the lines related to the SCG/GAM). The scalar values are 0.13, 0.132, and 0.7. The goal attainment method integrated with the adapted Levenberg–Marquardt training function also suggests different structures with different values of the scalar function. A similar observation is found in those suggested by the use of the genetic algorithm with longer, wider, and higher taper ratios than the starting structure (whose parameters were 80 mm length, 15 mm width at the anchor, and 0.1 taper ratio).
The final solution is determined by the dominance of one solution over the others, with regard to the numerical values of particular objectives. Therefore, we performed final simulations and analyzed the results related to all three resonant modes. To present the results clearly, we display the results both in a tabular form (Table 5) and graphically (Figure 16). The unoptimized structure operates at higher frequencies and generates lower output than the optimized structure.
According to the numerical and graphical results, the candidates for the superior solution are the triplets 2, 3, and 5. Figure 16a presents the output powers at the first three resonant modes for the starting, unoptimized structure 80 mm long, 15 mm wide, and 0.1 taper ratio, along with the output powers at the first three resonant modes related to triplet 5 (Table 5). After optimization, for all triplets, all the three modes are at lower frequencies. Figure 16b shows that triplets 2 and 3 ensure the second mode below 200 Hz. Due to a greater harvested power with respect to the one obtained by the starting structure, the optimal structure relates to triplets 2 and 3 in Table 5, ensuring four times greater power at frequencies below 200 Hz. However, the improvements related to triplet 5 ensure over five times greater power at frequencies below 200 Hz, although harnessed from the first mode only.
In general, a multiobjective optimization has no unique solution. In applications related to low-frequency harnessing, the results depend not just on the tradeoff between the objective functions but on the particular constraints related to a specific application as well. The host structure that carries the VEPH dictates the values for the upper bound for the length and width of the PVEH as well as the upper-frequency limit. For the results presented here, we considered the upper limit of 200 Hz.
The normalized power can be used to measure the efficiency of the harvesters, which is the output power per acceleration squared. Table 6 shows the optimal harvester suggested by different optimization techniques in normalized power. The optimum normalized power for all modes is obtained for the triplet (121.3, 71.56, 0.7682). Table 7 shows a comparison of our harvester to different harvesters from the literature in terms of normalized power. The proposed design shows a higher efficiency, compared to other multimode harvester designs.
Our results complement the results from the literature [35,36,37,38,39,40,41,42]. In [35,36], it is shown that the optimization of the unimorph rectangular cantilever-based VPEH structure by the use of the genetic algorithm outperformed the built-in optimization tool of COMSOL Multiphysics. The fitting function in the genetic algorithm was an analytic expression. Our results on the taper ratio agree with experimental results. In [37,38], triangular or trapezoidal structures are favored over rectangular structures. Here, we infer that there is an optimum value of the taper ratio for the bimorph segmented beam.
Since the validation of the accuracy of ANN for modeling of the response of MEMS-based VPEH has already been proved in [20], we do not elaborate it further here. We state here that, in addition to their accuracy, the ANN functions show the value of simplicity. For cantilever-based complex MEMS, analytic expressions may be cumbersome or even may not exist, but for simpler structures, ANN functions may perform faster. Although the number of nodes in the hidden layer in the ANN we used (50) is high, the combination of linear and sigmoid functions is not computationally demanding. In order to facilitate further research on the subject, we made source codes freely available from the Mendeley Data Online Repository [43].

5. Conclusions

The paper presents the method for designing and optimizing the piezoelectric vibration energy harvester based on a bimorph PZT-5 segmented linearly tapered cantilever of steel with a proof mass at its end. The beam length, width at the anchor, and the taper ratio were optimized for the maximum output power and low resonant frequencies.
The cantilever dimensions were taken as input, and the output consisted of the resonant frequency of the first mode and the generated power. The datasets were generated by FEM simulations and used for training the artificial neural network (ANN) that provided the fitting function in the optimization algorithms. Two methods were used for the training of the ANN—Levenberg–Marquardt (LM) and scaled conjugate gradient (SCG)—and two ways for the optimization—the goal attainment method (GAM) and genetic algorithm (GA). The comparative analysis of the results of this basically multiobjective optimization, performed in four different ways, showed that here, LM outperformed SCG in terms of generalization and that both GAM and GA resulted in significantly improved performance. The superior solution results from optimization by the genetic algorithm integrated with the ANN fitting function obtained by the SCG training method. The solution refers to a structure with a length of 121.3 mm, a width of 71.56 mm, and a taper ratio toward the beam’s tip of 0.7682. The optimized structure ensures over five times greater power at frequencies below 200 Hz than the starting unoptimized structure. Hence, the new optimal design is highly convenient for low-frequency applications. The proposed harvester is able to generate satisfactory output power in the frequency ranges from 57.5 Hz to 455 Hz before optimization and from 38 Hz to 608 Hz after optimization. With the optimized structure, it is also possible to harness optimum power at higher resonant modes. The results are suitable for the implementation in applications related to low-frequency energy harvesting. Furthermore, the developed tools are suitable for use in optimizing either similar or more complex structures.
Additionally, the approach is suitable for further improvements and investigations (by implementing other algorithms for ANN training or optimization).

Author Contributions

Conceptualization, O.J. and K.G.; methodology, O.J. and K.G.; software, O.J. and O.P.; validation, O.J. and K.G.; formal analysis, O.J. and O.P.; investigation, O.P. and O.J.; resources, O.P., K.G. and O.J.; writing—original draft preparation, O.P. and O.J.; writing—review and editing, O.J., O.P. and K.G.; visualization, O.P. and O.J.; supervision, O.J. and K.G.; project administration, O.J.; funding acquisition, O.J. All authors have read and agreed to the published version of the manuscript.

Funding

This work was financially supported by the Ministry of Education, Science and Technological Development of the Republic of Serbia (Grant No 451-03-9/2021-14/200026).

Data Availability Statement

Data available from the authors upon request. Data related to ANN and optimization are available from Mendeley Data, an open access data repository [43].

Acknowledgments

Authors acknowledge the National MEMS Design Center, NIT Silchar for carrying out the design and simulation of the proposed device. The authors express gratitude to Nada Ratković-Kovačević for her beneficial suggestions and instructions on implementing the optimization methods in the Octave environment.

Conflicts of Interest

The authors declare no conflict of interest.

References

  1. Roundy, S.; Wright, P.K. A piezoelectric vibration based generator for wireless electronics. Smart Mater. Struct. 2004, 13, 1131. [Google Scholar] [CrossRef] [Green Version]
  2. Sil, I.; Biswas, K. Investigation of Design Parameters in MEMS Based Piezoelectric Vibration Energy Harvester. In Proceedings of the International Conference on 2018 IEEE Electron Device Kolkata Conference (EDKCON), Kolkata, India, 24–25 November 2018; pp. 64–69. [Google Scholar] [CrossRef]
  3. Baker, J.L.; Roundy, S.; Wright, P. Alternative geometries for increasing power density in vibration energy scavenging for wireless sensor networks. In Proceedings of the 3rd International Energy Conversion Engineering Conference, San Francisco, CA, USA, 18 August 2005; p. 5617. [Google Scholar] [CrossRef] [Green Version]
  4. Pertin, O.; Shrivas, P.; Guha, K.; Rao, K.S.; Iannacci, J. New and efficient design of multimode piezoelectric vibration energy harvester for MEMS application. Microsyst. Technol. 2021, 27, 3523–3531. [Google Scholar] [CrossRef]
  5. Almeida, B.V.D.; Pavanello, R. Topology optimization of the thickness profile of bimorph piezoelectric energy harvesting devices. J. Appl. Comput. Mech. 2019, 5, 113–127. [Google Scholar] [CrossRef]
  6. Erturk, A.; Tarazaga, P.A.; Farmer, J.R.; Inman, D.J. Effect of strain nodes and electrode configuration on piezoelectric energy harvesting from cantilevered beams. J. Vib. Acoust. Trans. 2009, 131, 01101011. [Google Scholar] [CrossRef] [Green Version]
  7. Krishnasamy, M.; Lenka, T.R. Distributed parameter model for assorted piezoelectric harvester to prevent charge cancellation. IEEE Sens. Lett. 2017, 1, 1–4. [Google Scholar] [CrossRef]
  8. Ferrari, M.; Ferrari, V.; Guizzetti, M.; Marioli, D.; Taroni, A. Piezoelectric multifrequency energy converter for power harvesting in autonomous microsystems. Sens. Actuators A Phys. 2008, 142, 329–335. [Google Scholar] [CrossRef]
  9. Qi, S.; Shuttleworth, R.; Oyadiji, S.O.; Wright, J. Design of a multiresonant beam for broadband piezoelectric energy harvesting. Smart Mater. Struct. 2010, 19, 094009. [Google Scholar] [CrossRef]
  10. Mažeika, D.; Čeponis, A.; Yang, Y. Multifrequency piezoelectric energy harvester based on polygon-shaped cantilever array. Shock. Vib. 2018, 2018, 11. [Google Scholar] [CrossRef] [Green Version]
  11. Janusas, G.; Milasauskaite, I.; Ostasevicius, V.; Dauksevicius, R. Efficiency improvement of energy harvester at higher frequencies. J. Vibroeng. 2014, 16, 1326–1333. [Google Scholar]
  12. Jabbari, M.; Ghayour, M.; Mirdamadi, H.R. Increasing the performance of energy harvesting in vibration mode shapes. Adv. Comput. Des. 2016, 1, 155–173. [Google Scholar] [CrossRef]
  13. Ostasevicius, V.; Gaidys, R.; Dauksevicius, R. Numerical analysis of dynamic effects of a nonlinear vibro-impact process for enhancing the reliability of contact-type MEMS devices. Sensors 2009, 9, 10201–10216. [Google Scholar] [CrossRef] [Green Version]
  14. Ghatkesar, M.K.; Barwich, V.; Braun, T.; Ramseyer, J.P.; Gerber, C.; Hegner, M.; Despont, M. Higher modes of vibration increase mass sensitivity in nanomechanical microcantilevers. Nanotechnology 2007, 18, 445502. [Google Scholar] [CrossRef] [Green Version]
  15. Fu, M.C. Optimization via simulation: A review. Ann. Oper. Res. 1994, 53, 199–247. [Google Scholar] [CrossRef]
  16. Park, J.C.; Lee, D.H.; Park, J.Y.; Chang, Y.S.; Lee, Y.P. High performance piezoelectric MEMS energy harvester based on D33 mode of PZT thin film on buffer-layer with PBTIO3 inter-layer. In Proceedings of the TRANSDUCERS 2009–2009 International Solid-State Sensors, Actuators and Microsystems Conference, Denver, CO, USA, 21–25 June 2009; IEEE: Piscataway, NJ, USA, 2009; pp. 517–520. [Google Scholar] [CrossRef]
  17. Bagheri, S.; Wu, N.; Filizadeh, S. Simulation-based optimization of a piezoelectric energy harvester using artificial neural networks and genetic algorithm. In Proceedings of the 2019 IEEE 28th International Symposium on Industrial Electronics (ISIE), Vancouver, BC, Canada, 12–14 June 2019; IEEE: Piscataway, NJ, USA, 2019; pp. 1435–1440. [Google Scholar] [CrossRef]
  18. Mohammadi, S.; Cheraghi, K.; Khodayari, A. Piezoelectric vibration energy harvesting using strain energy method. Eng. Res. Express 2019, 1, 015033. [Google Scholar] [CrossRef]
  19. Keshmiri, A.; Bagheri, S.; Wu, N. Simulation-Based Optimization of a Non-Uniform Piezoelectric Energy Harvester with Stack Boundary. Int. J. Mech. Mater. Eng. 2019, 13, 500–505. [Google Scholar]
  20. Nabavi, S.; Zhang, L. Design and optimization of wideband multimode piezoelectric MEMS vibration energy harvesters. Multidiscip. Digit. Publ. Inst. Proc. 2017, 1, 586. [Google Scholar] [CrossRef] [Green Version]
  21. Singh, K.B.; Bedekar, V.; Taheri, S.; Priya, S. Piezoelectric vibration energy harvesting system with an adaptive frequency tuning mechanism for intelligent tires. Mechatronics 2012, 22, 970–988. [Google Scholar] [CrossRef]
  22. Nawir, N.A.A.; Basari, A.A.; Saat, M.S.M.; Yan, N.X.; Hashimoto, S. A review on piezoelectric energy harvester and its power conditioning circuit. ARPN J. 2018, 13, 2993–3006. [Google Scholar]
  23. Yang, Z.; Zhou, S.; Zu, J.; Inman, D. High-performance piezoelectric energy harvesters and their applications. Joule 2018, 2, 642–697. [Google Scholar] [CrossRef] [Green Version]
  24. Kuo, Y.C.; Chien, J.T.; Shih, W.T.; Chen, C.T.; Lin, S.C.; Wu, W.J. The fatigue behavior study of micro piezoelectric energy harvester under different working temperature. In Active and Passive Smart Structures and Integrated Systems XII; International Society for Optics and Photonics: Bellingham, WA, USA, 2019; Volume 10967. [Google Scholar] [CrossRef]
  25. Chen, C.T.; Fu, Y.H.; Tang, W.H.; Lin, S.C.; Wu, W.J. The output power improvement and durability with different shape of MEMS piezoelectric energy harvester. In Smart Structures and NDE for Industry 4.0; International Society for Optics and Photonics: Bellingham, WA, USA, 2018; Volume 10602, p. 106020N. [Google Scholar] [CrossRef]
  26. Farhangdoust, S.; Georgeson, G.; Ihn, J.B.; Chang, F.K. Kirigami auxetic structure for high efficiency power harvesting in self-powered and wireless structural health monitoring systems. Smart Mater. Struct. 2020, 30, 015037. [Google Scholar] [CrossRef]
  27. Wu, H.; Tang, L.; Yang, Y.; Soh, C.K. A novel two-degrees-of-freedom piezoelectric energy harvester. J. Intell. Mater. Syst. Struct. 2013, 24, 357–368. [Google Scholar] [CrossRef]
  28. Nabavi, S.; Zhang, L. Design and optimization of a low-resonant-frequency piezoelectric MEMS energy harvester based on artificial intelligence. Multidiscip. Digit. Publ. Inst. Proc. 2018, 2, 930. [Google Scholar] [CrossRef] [Green Version]
  29. Sunithamani, S.; Lakshmi, P.; Flora, E.E. PZT length optimization of MEMS piezoelectric energy harvester with a non-traditional cross section: Simulation study. Microsyst. Technol. 2014, 20, 2165–2171. [Google Scholar] [CrossRef]
  30. Erturk, A.; Inman, D.J. An experimentally validated bimorph cantilever model for piezoelectric energy harvesting from base excitations. Smart Mater. Struct. 2009, 18, 025009. [Google Scholar] [CrossRef]
  31. Mitchell, M. An Introduction to Genetic Algorithms; MIT Press: Cambridge, MA, USA, 1998; ISBN 0262631857. [Google Scholar]
  32. Nabavi, S.; Zhang, L. Nonlinear multi-mode wideband piezoelectric mems vibration energy harvester. IEEE Sens. J. 2019, 19, 4837–4848. [Google Scholar] [CrossRef]
  33. Li, X.; Upadrashta, D.; Yu, K.; Yang, Y. Analytical modeling and validation of multi-mode piezoelectric energy harvester. Mech. Syst. Signal Process. 2019, 124, 613–631. [Google Scholar] [CrossRef]
  34. Wang, H.; Tang, L.; Shan, X.; Xie, T.; Yang, Y. Modeling and comparison of cantilevered piezoelectric energy harvester with segmented and continuous electrode configurations. In Active and Passive Smart Structures and Integrated Systems 2013; International Society for Optics and Photonics: Bellingham, WA, USA, 2013; Volume 8688, p. 86882B. [Google Scholar] [CrossRef]
  35. Nabavi, S.; Zhang, L. Design and optimization of piezoelectric MEMS vibration energy harvesters based on genetic algorithm. IEEE Sens. J. 2017, 17, 7372–7382. [Google Scholar] [CrossRef]
  36. Nabavi, S.; Zhang, L. Frequency tuning and efficiency improvement of piezoelectric MEMS vibration energy harvesters. J. Microelectromech. Syst. 2018, 28, 77–87. [Google Scholar] [CrossRef]
  37. Goldschmidtboeing, F.; Woias, P. Characterization of different beam shapes for piezoelectric energy harvesting. J. Micromech. Microeng. 2008, 18, 104013. [Google Scholar] [CrossRef]
  38. Jackson, N.; O’Keeffe, R.; Waldron, F.; O’Neill, M.; Mathewson, A. Evaluation of low-acceleration MEMS piezoelectric energy harvesting devices. Microsyst. Technol. 2014, 20, 671–680. [Google Scholar] [CrossRef]
  39. Ramírez, J.M.; Gatti, C.D.; Machado, S.P.; Febbo, M. A multi-modal energy harvesting device for low-frequency vibrations. Extrem. Mech. Lett. 2018, 22, 1–7. [Google Scholar] [CrossRef]
  40. Zergoune, Z.; Kacem, N.; Bouhaddi, N. On the energy localization in weakly coupled oscillators for electromagnetic vibration energy harvesting. Smart Mater. Struct. 2019, 28, 07LT02. [Google Scholar] [CrossRef] [Green Version]
  41. Gatti, C.; Ramirez, J.; Febbo, M.; Machado, S. Multimodal piezoelectric device for energy harvesting from engine vibration. J. Mech. Mater. Struct. 2018, 13, 17–34. [Google Scholar] [CrossRef]
  42. Aouali, K.; Kacem, N.; Bouhaddi, N.; Mrabet, E.; Haddar, M. Efficient broadband vibration energy harvesting based on tuned non-linearity and energy localization. Smart Mater. Struct. 2020, 29, 10LT01. [Google Scholar] [CrossRef]
  43. Jakšić, O. ANN Assisted Optimization of a Multimode Linearly Tapered Bimorph PYT-5 Cantilever Beam for Low Frequency Energy Harvesting; Version 1; Elsevier: Amsterdam, The Netherlands, 2021. [Google Scholar] [CrossRef]
Figure 1. Segmented trapezoidal PEH.
Computation 09 00084 g001
Figure 2. Side view of the segmented PEH.
Computation 09 00084 g002
Figure 3. Mode shape of the continuous tapered beam with tip mass before segmentation.
Computation 09 00084 g003
Figure 4. First three vibration modes of the cantilever-based bimorph segmented PVEH with a tapering ratio of 0.7.
Computation 09 00084 g004
Figure 5. Load response curves of the PVEH (whose L = 100 mm, b0 = 35 mm, and T = 0.7) segmented at strain nodes of the third vibration mode at a mechanical excitation of 0.5 g for the (a) first, (b) second and (c) third resonant frequency. Optimal loads are (a) 1.3 kΩ, (b) 1.1 kΩ, and (c) 2.7 kΩ.
Computation 09 00084 g005aComputation 09 00084 g005b
Figure 6. Frequency response of generated output voltage (a) and output power (b) of the first natural frequency for different tapering ratios of the segmented PVEH for a mechanical input acceleration of 0.5 g.
Computation 09 00084 g006
Figure 7. Frequency response of generated output voltage (a) and output power (b) at the second vibration mode for different tapering ratios of the segmented PVEH for a mechanical input acceleration of 0.5 g.
Computation 09 00084 g007aComputation 09 00084 g007b
Figure 8. Frequency response of generated output voltage (a) and output power (b) at the third mode frequency for different tapering ratios of the segmented PVEH for a mechanical input acceleration of 0.5 g.
Computation 09 00084 g008
Figure 9. Tendency graphs for the frequency of the first three resonant modes of a multimode bimorph segmented tapered cantilever-based PVEH.
Computation 09 00084 g009
Figure 10. Tendency graphs for the power of the first three resonant modes of a multimode bimorph segmented tapered cantilever-based PVEH.
Computation 09 00084 g010aComputation 09 00084 g010b
Figure 11. Tendency graph of the contribution of the third mode for structures whose third resonant mode is below 450 Hz.
Computation 09 00084 g011
Figure 12. Structure of the ANN used for fitting the simulation results.
Computation 09 00084 g012
Figure 13. Regression diagrams for the ANN trained by applying Levenberg–Marquardt algorithm calculated for (a) training dataset (b) validation dataset (c) dataset used for testing and (d) dataset with all three aforementioned groups of data.
Computation 09 00084 g013aComputation 09 00084 g013b
Figure 14. Regression diagrams for the ANN trained by applying scaled conjugate gradient algorithm calculated for (a) training dataset (b) validation dataset (c) dataset used for testing and (d) dataset with all three aforementioned groups of data.
Computation 09 00084 g014
Figure 15. Performances of the obtained ANN functions fed with unknown data. LM refers to the Levenberg–Marquardt algorithm, SCG refers to scaled conjugate gradient algorithm, red line is y = x, the ideal correlation between the true and fitted data.
Computation 09 00084 g015
Figure 16. The output power for the first three resonant modes: (a) the unoptimized structure (red narrow bars) and the structure based on triplet 5 from Table 4 (blue wider bars); (b) the structures based on the triplet 2 (red solid lines with + on the top), 3 (blue dashed lines with triangle on the top), and 5 (solid magenta line with an x on the top).
Computation 09 00084 g016aComputation 09 00084 g016b
Table 1. Geometric dimension and material properties.
ParameterDescriptionValue
LLength of beam80–100 mm
b 0 Beam Width at fixed end (x = 0)2–3 mm
b L Beam width at free end (x = L)20–30 mm
h p Thickness of PZT0.5 mm
h s Thickness of steel substrate1 mm
ρ p Density of PZT7500 (kg/ m 3 )
ρ s Density of steel7850 (kg/ m 3 )
E p Young Modulus of PZT64 (GPa)
E s Young Modulus of steel200 (GPa)
d 31 Piezoelectric constant−16.6 (C/ m 2 )
ε s s Permittivity constant25.55 (nF/ m )
M t Tip Mass12.56–18.84 (mg)
dSeparation between PZTs0.5 mm
Table 2. Strain mode position of a trapezoidal cantilever beam with tip mass.
ModeStrain Node Position on the x-Axis x ¯ = x L
1st2nd3rd
1___
20.26__
30.14680.490_
40.1300.4300.611
Table 3. Mean squared error calculated for the target data and the data generated by the ANN fitting functions obtained by applying the LM and SCG training method.
LMSCG
Normalized frequency3.8398 × 10−40.0043
Normalized reciprocal power0.05850.0774
Table 4. List of optimal dimensions as obtained per different methods. GA stands for the genetic algorithm and its upper and lower bounds, starting point is related to the goal attainment method (GAM). Notation is as per Table 1 and T denotes tapering ratio.
Triplet L   [ mm ] ,   b 0 [ mm ] ,   T ANN/
Optimization
Bounds or Starting PointScalar
1117.98, 66.06, 0.7276SCG/GAM[80 20 0.7]0.13
2114.9, 72.69, 0.15LM/GA[0.1;0.1;0], [1.5;1.5;1]0.1336
3115.87, 73.73, 0.1983LM/GAM[70 35 0.7]0.135
4111.64, 39.88, 0.2525LM/GAM[90 35 0.3]0.3935
5121.3, 71.56, 0.7682SCG/GA[0.1;0.1;0.1], [1.5;1.5;1]0.132
6101.88, 19.45, 0.8636SCG/GAM[70 35 0.7]0.7162
Table 5. The first three resonant frequencies and the related output powers for structures suggested by the optimization techniques listed in Table 4. F 1 , F 2 , and F 3 are the first three natural frequencies of the tapered PVEH. P 1 , P 2 , and P 3 are the output power generated at F1, F2, and F3, respectively.
Triplet L   [ mm ] ,   b 0   [ mm ] ,   T F 1   [ Hz ] P 1   [ mW ] F 2   [ Hz ] P 2   [ mW ] F 2   [ Hz ] P 3   [ mW ]
1117.98, 66.06, 0.727646.279191.05232.692.3735338.772.9661
2114.9, 72.69, 0.1538.411172.7136.713.54713120.63
3115.87, 73.73, 0.198338.244174.21142.463.6312308.91.209
4111.64, 39.88, 0.252540.797128.6267.60.90212331.70.94383
5121.3, 71.56, 0.768244.3205.56211.62.7964322.853.1552
6101.88, 19.45, 0.863648.32873.468391.81278607.747.95 × 10−5
Table 6. Comparison of optimal parameters presented in Table 4 under acceleration of 0.5 g.
S.noTripletNormalized Power (mW/g2)
L [ mm ] ,   b 0 [ mm ] , TMode 1Mode 2Mode 3
1117.98, 66.06, 0.72767649.49411.864
2114.9, 72.69, 0.15690.814.1882.52
3115.87, 73.73, 0.1983696.8414.52484.836
4111.64, 39.88, 0.2525514.43.63.775
5121.3, 71.56, 0.7682822.2411.185612.621
6101.88, 19.45, 0.8636293.8725.1120.00032
Table 7. Comparison of different multimode harvester designs.
Multi-Frequency HarvesterAcceleration (g)Normalized Power (mW/g2)
Mode 1Mode 2Mode 3
Array Harvester [8]10.0890.0570.057
Optimized Nonlinear [32]0.050.0080.2440.056
Nonlinear 3-DOF [33]0.246.7390.5681.538
Segmented Electrode [34]15.8000.121
Optimized, Tapered and Segmented [Our work]0.5822.2411.185612.621
Publisher’s Note: MDPI stays neutral with regard to jurisdictional claims in published maps and institutional affiliations.

