1. Introduction
Traumatizing skeletal anatomy—the hard, mineralized, interconnected tissue which facilitates locomotion, with crucial functions in the body (protection of vital organs as well as calcium and phosphorus levels regulation) [
1]—severely alters the patient’s quality of life. Bone tissue has the ability to self-regenerate after minor injuries or small fractures. From the moment of the trauma, the process of healing consists of five stages and lasts from two months to two years, depending on the seriousness of the injury [
2]. Yet, if the lesions in the bone are major, the tissue will not have the capacity to heal on its own. These kind of surgical interventions are very meticulous, and the donor can suffer from morbidity at the sampling site. Therefore, the field of bone-tissue engineering (BTE) seems to hold great promise in reducing patient discomfort and surgical risks, as well as minimizing costs. However, BTE is epitomized by three commanding features: (1) a scaffold that mimics the structure of bone extracellular matrix (bECM); (2) a cell source that can follow the bone lineage, and (3) growth factors to support cell growth and development [
3], which often prove to be delicate in addressing altogether.
Lately, tremendous efforts have been made in generating tridimensional (3D) biomaterials based on natural and synthetic compounds for BTE. These substitutes need to have specific proprieties, namely, to be biocompatible, biodegradable, and fashionable into designs that mimic native bone morphology in order to provide a familiar environment for tissue regeneration. It is imperative for an implanted scaffold to harmoniously interact with cells, not to generate significant inflammatory response, and—upon completing cell integration—to degrade without releasing toxic species [
4].
In the research and development field, numerous polymer and composite blends have been reported as capable of enacting physiological signals with regenerative outcomes. However, most of these studies are indefinite and exhaustive conclusions are yet to arise. Blending has become a common approach in designing structures with appropriated features on the principle of complementarity. In this context, it is preferred to opt for natural polymer formulations. Among them, gelatin (G) and chitosan (Cs) emerged as robust materials for bone regeneration support due to the affinity shown by various cell types used in BTE [
5]. Chitosan has been safely used to fabricate tridimensional scaffolds with biomineralization promoting abilities that elude a post-implantation inflammatory response [
6]. Gelatins, structurally derived from collagen, naturally found in bECM too, can support osseous regeneration due to the affinity cells manifest towards its reactive side chain radicals and arginine–glycine–aspartate (RGD) sequence in particular [
7]. Aquatic gelatins, like ones derived from cold-water fish, provide a series of advantages over mammalian strains, which could be less microbiologically safe and become vehicles for viral outbreaks in particular and are conflicting with the spiritual conviction of billions (kosher, halal, or ahimsa) and are less versatile with respect to solubility and viscosity in variable environmental conditions [
8]. Both macromolecular compounds have been studied for decades, apart and in combination. Genipin (Gp), a naturally occurring compound, was preferred as a substitute to typical crosslinking agents for its lower cytotoxicity and potency to stabilize primary amine group molecules [
9]. In tissue engineering, the appealing route that involves Gp crosslinking of Cs and mammalian G networks was previously described as a mean to ensure the support for various cell cultures, including neuroblastoma cells [
10], HepG2 [
11], or fibroblasts [
12] with short in-depth reflection on the hybrid’s perspectives on other types of tissue reconstructions. To the best of our knowledge, only one group [
13] has taken up the assessment of GCs uncrosslinked networks loaded with graphene oxide (GO) for BTE prospects.
GO is a monolayered carbonaceous nanostructure consisting of a single atomic sheet of sp
2 hybridized atoms promising for substrate fabrication in the field of BTE [
14]. GO associates with proteins via electrostatic and hydrophobic interactions, which probably provide structural bone-oriented matrices with osteogenic differentiation cues for progenitor lines [
15,
16]. At the same time, GO induced cytotoxicity has been reported [
17], with little understanding on the short- and long-time outcomes, suggesting that GO use comes with risks that need better exploration.
In restorative medicine studies, due to the complex molecular structuration and the patterning particularities of the living matter, hybrids are the closest commodities to address biomimicry, which is pivotal in robust scaffold fabrication. In this context, the aim of this study was to undertake the fabrication and characterization of 3D freeze-dried scaffolds consisting of chitosan/fish gelatin/genipin enriched with various ratios of GO and to assess its biocompatibility in vitro with murine preosteoblasts, as well as in vivo on CD1 mouse models with respect to GO proportions. The two controls and composite 3D architectures hereby synthesized and described next will be referred to as: GCs for gelatin-chitosan, GCsGp for genipin-crosslinked gelatin-chitosan, GCsGp/GO (0.5/1/2/3) for genipin-crosslinked chitosan-gelatin with 0.5, 1, 2, and 3 wt.% GO supplementation. Our group have previously undertaken a pilot survey of these compositions from the standpoint of material structuration and thermomechanical alterations to determine whether GO is able to tailor the properties of the blend in a constructive manner [
18]. With this, however, we round up the investigation of these bio-based hybrid composites by steering the focus towards the implications of GO additivation in porogenesis, morphology and cellular response, and internal medium behavior.
3. Results
3.1. Swelling Degree Assessment
Graphene-biopolymer composite networks swell and soften in simulated physiological environments, such as, PBS without dissolving. To assess both shape, stability, and swelling capacity of the 6 formulations and predicate their behavior post implantation, preweighted specimens were immersed in PBS solution (pH 7.4, 37 °C). At different time intervals, the specimens were weighted after the excess buffer was purged from the surface. The scheme was repeated until weight stabilization.
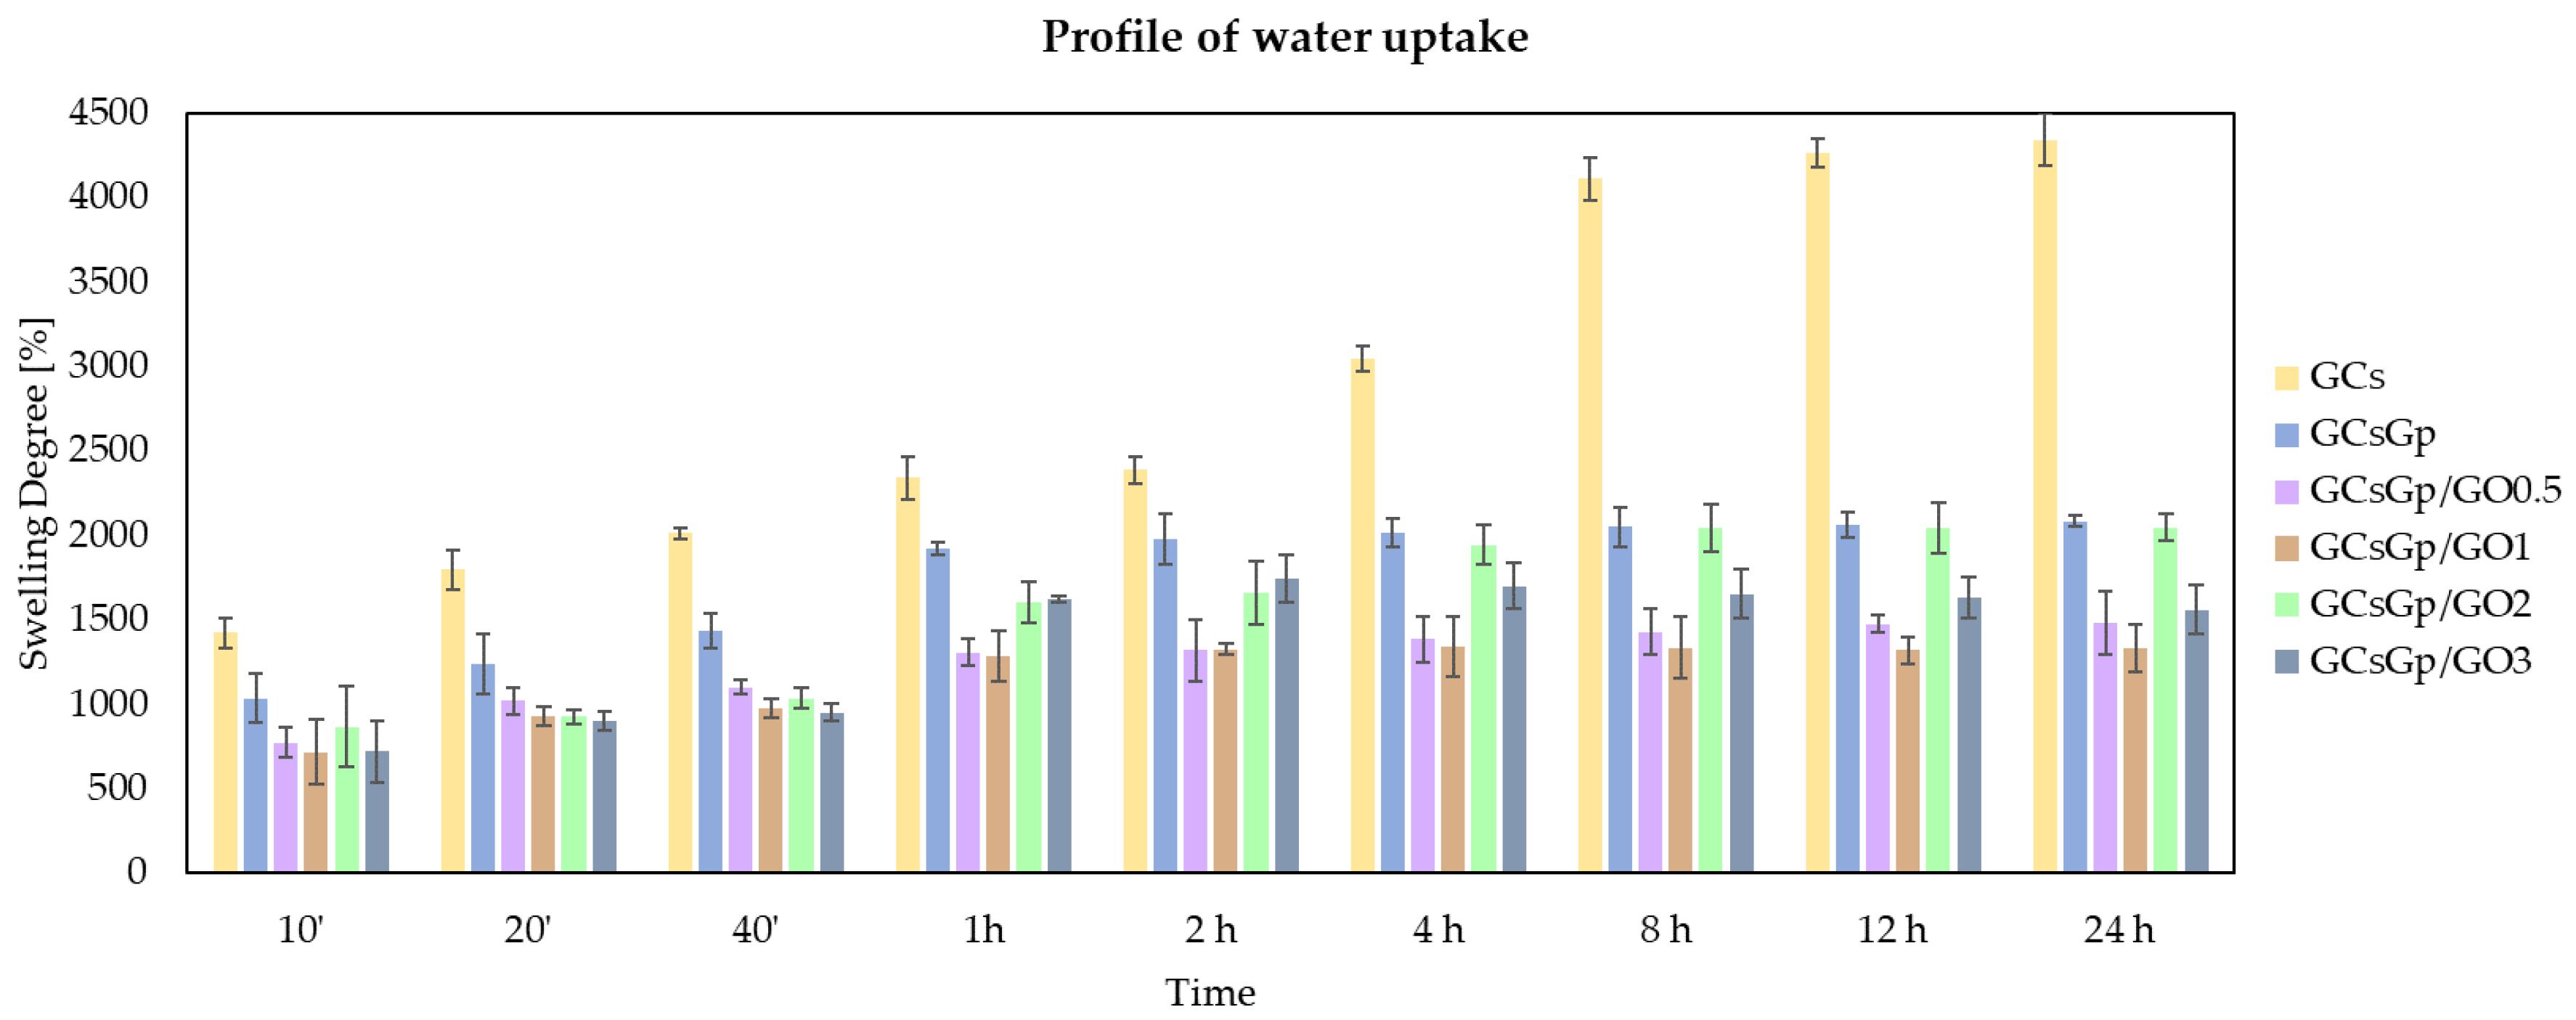
A time-dependent water uptake survey is charted in
Figure 1 for all compositions, since the ability to rehydrate post dehydration is exhaustive regardless of GO supplementation. At the end of PBS incubation, the obtained composite constructs preserved their original shape, the only fragmentation that occurred was in the case of GCs specimens, proving that the networks are stable due to the efficient crosslinking process. The pristine and GO enhanced compositions exhibited different rates of swelling before reaching the maximum SD. The initial rapid swelling indicated that a state of equilibrium would be reached in 1 h, however GCs and some GO-rich gels regulated their water uptake profile within 12 h and remained constant thereafter. The measured swelling degrees were in the range of 14–44 g PBS solution/g solid gel whereby uncrosslinked GCs was the highest (probably due to the highest amount of amine and imine functionalities available for protonation [
13]) and GCsGp/GO 1 in the lowest. Water uptake was highly influenced by the Gp crosslinking as the average hydration degree of GCsGp was half (21.5 g PBS solution/g solid content) of the GCs’.
3.2. Gel Fraction Estimation
The in vitro stability of the six compositions was assessed in simulated biological fluid enriched with type II collagenase (COLase II). In vitro assessment of COLase II activity should be discussed, considering also the physical conditions of the experiment. The incubation was static and did not involve mechanical loads or spread restraints common in clinical live models. As a result, the degree of sample expansion is not conditioned in space; COLase II percolation is favored at microscale, and molecular reach and its thrust is maximized in vitro. A complex cellular environment also has the benefit of favoring a prolonged and regulated degradation: after the artificial cell support is populated, the extracellular matrix enveloping the implant contributes to balancing the opposite processes of tissue regeneration and scaffold degradation.
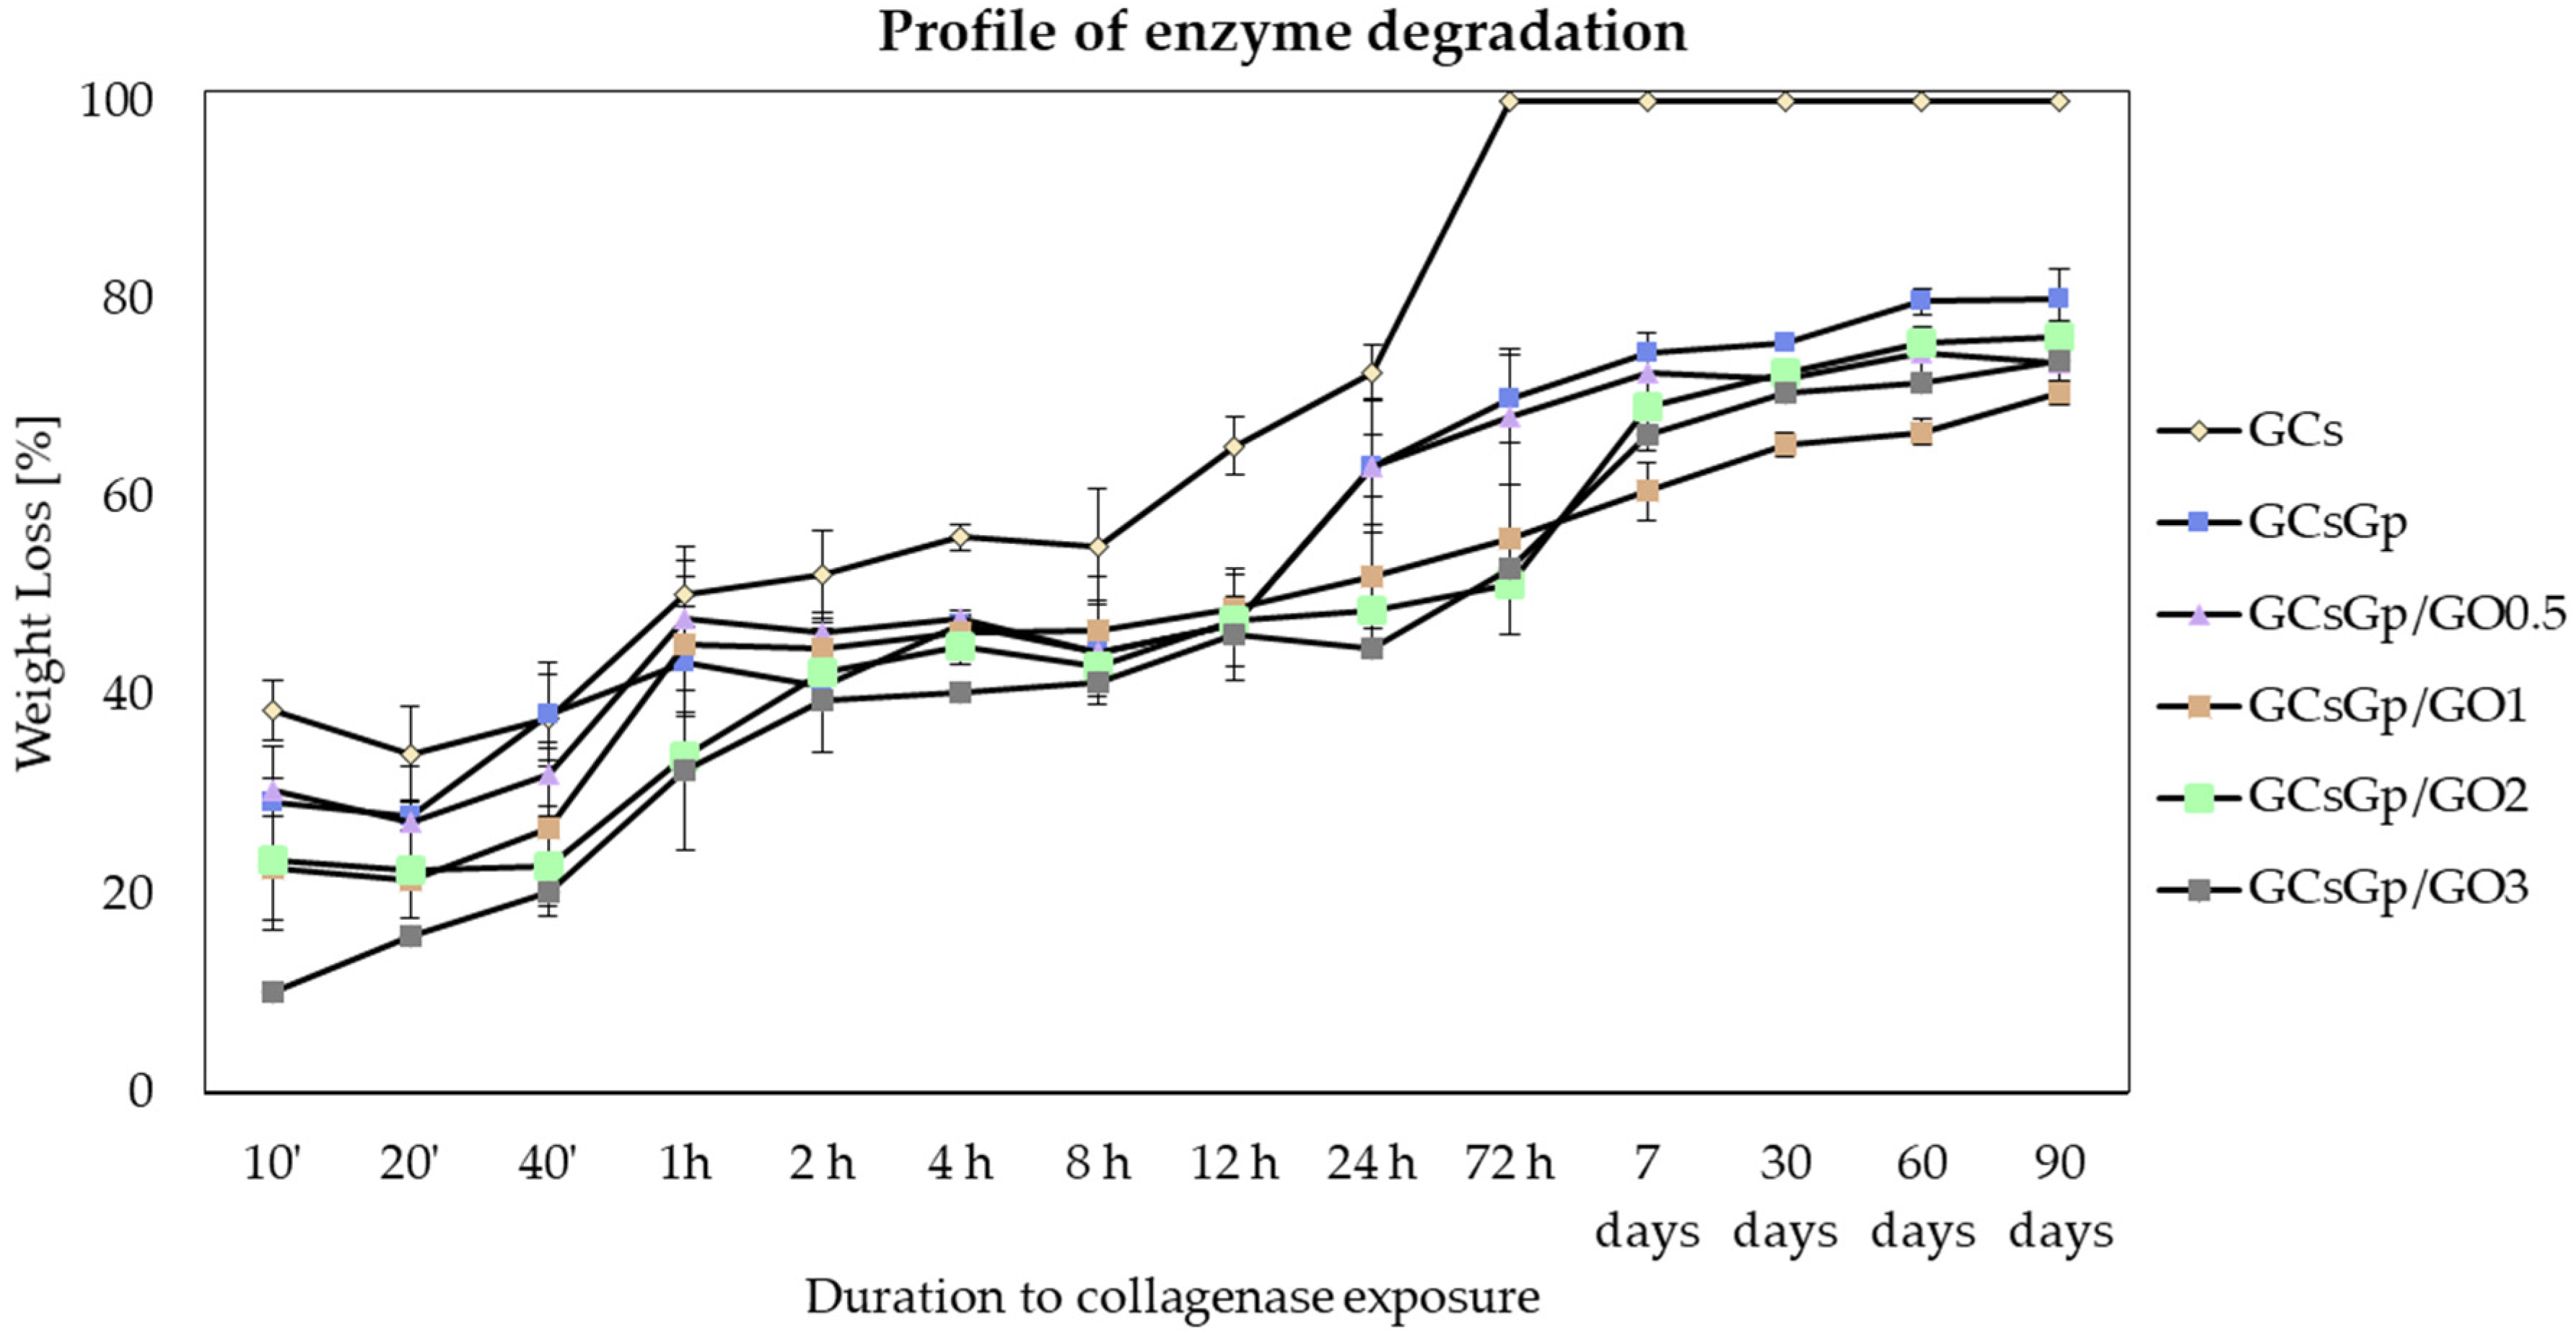
By visually inspecting the process, it was perceived that complete degradation of the materials did not occur before 72 h and only for GCs. However, the survey made apparent reduced cohesiveness in all freeze-dried specimens after 4–12 h of incubation. COLase II exposure of more than 3 days induced dramatic changes in the morphological integrity of the specimens that were due to both swelling and an enzyme attack. Nonetheless, the maneuverability of the GO composites and chemically crosslinked reference, though demanding, was possible without altering their unitary integrity 3 months after COLase II quenching.
GCs’ reference is the most susceptible for degradation, followed by crosslinked control and 0.5% GO additivated composition in alike rates. The initial contact of GCs with COLase II determined a weight loss of about 55% in less than 8 h that increased to 72% in 24 h; enhanced resistance was outlined for Gp’s stabilized reference. With respect to the crosslinked batch, the behavior is not surprising considering that crosslinking enables the fabrication of implantable biodevices with superior output in tissue restauration; still, elevated crosslinking should be paid attention to since it could generate upraised foreign body response. Low amounts of GO (0.5 wt.%) slightly induced behavioral changes onto GCsGp formulation, however the increase of GO content in the composite networks supported the intrinsic resistance of the materials to COLase II. Chemically crosslinked materials with 1, 2, and 3 wt.% GO better withheld COLase II degradation during 24 h exposure (44–52% weight loss), per the depiction in
Figure 2.
3.3. Morpho-Structural Investigations
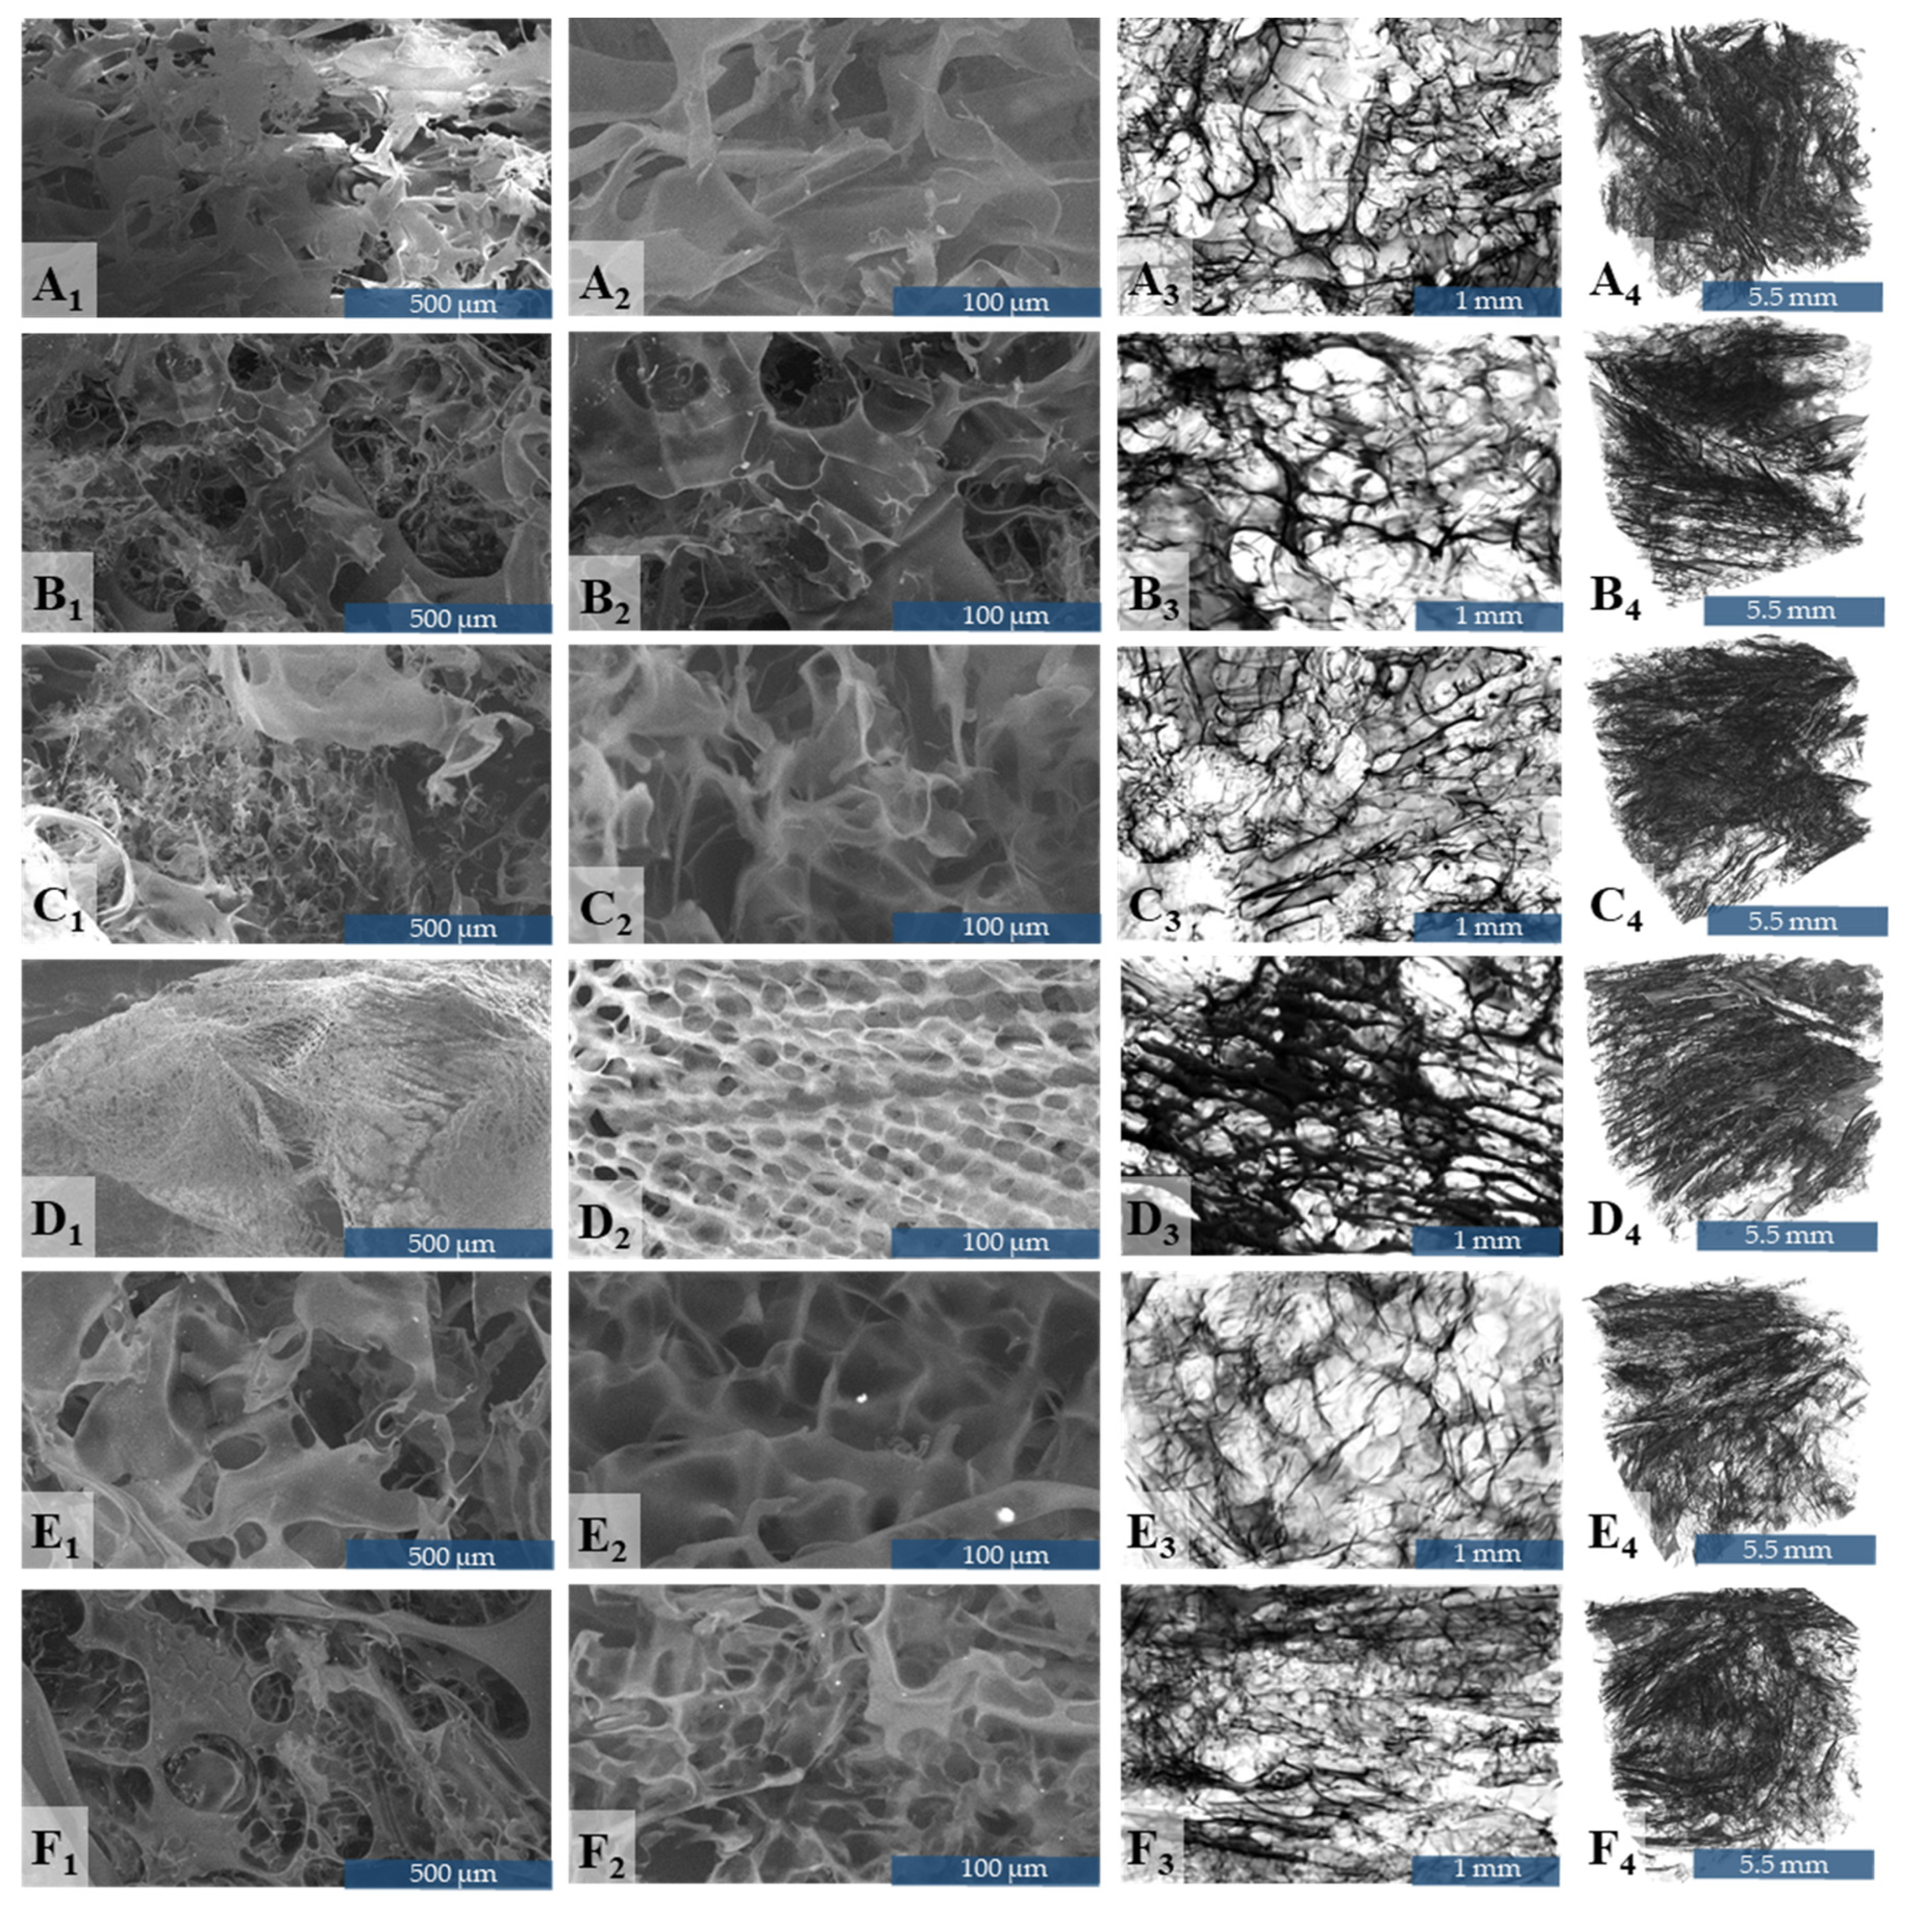
Morpho-structural features of biopolymer-GO dry-state composite porous scaffolds were investigated by scanning electron microscopy and microcomputer tomography. In
Figure 3, the internal architecture of the scaffolds is illustrated. In brief, all freeze-dried composites exhibited highly interconnected pore networks (
Figure 3A–F). Through visual inspection, the pore size distribution seems broad. Upon GO load, at higher magnifications (
Figure 3C2–F2), the biopolymer matrix develops a propensity to organize in an ordered fashion. Pores of similar size significantly oriented in parallel patterns that resemble bone structure. The occurrence of this periodic architecture within the porous scaffold was, however, intermittent. Thin pore walls were noticed in all compositions. Even though the wall morphology was sinuous, topographically their surface was smooth, with little rough protrusions and rather curved edges.
In
Figure 3, CTVox 3D displays of GCsGp/GO volumes are rendered with reciprocal 2D thin slice illustrating materials dominant and bone-like morphology. Scale was fixed for all six formulations. The architecture of the freeze-dried specimens is porous, almost entirely interconnected, highly anisotropic, featuring random pore orientation. Referring to the total pore volume of the scanned object, closed porosity extended to less than 0.1%.
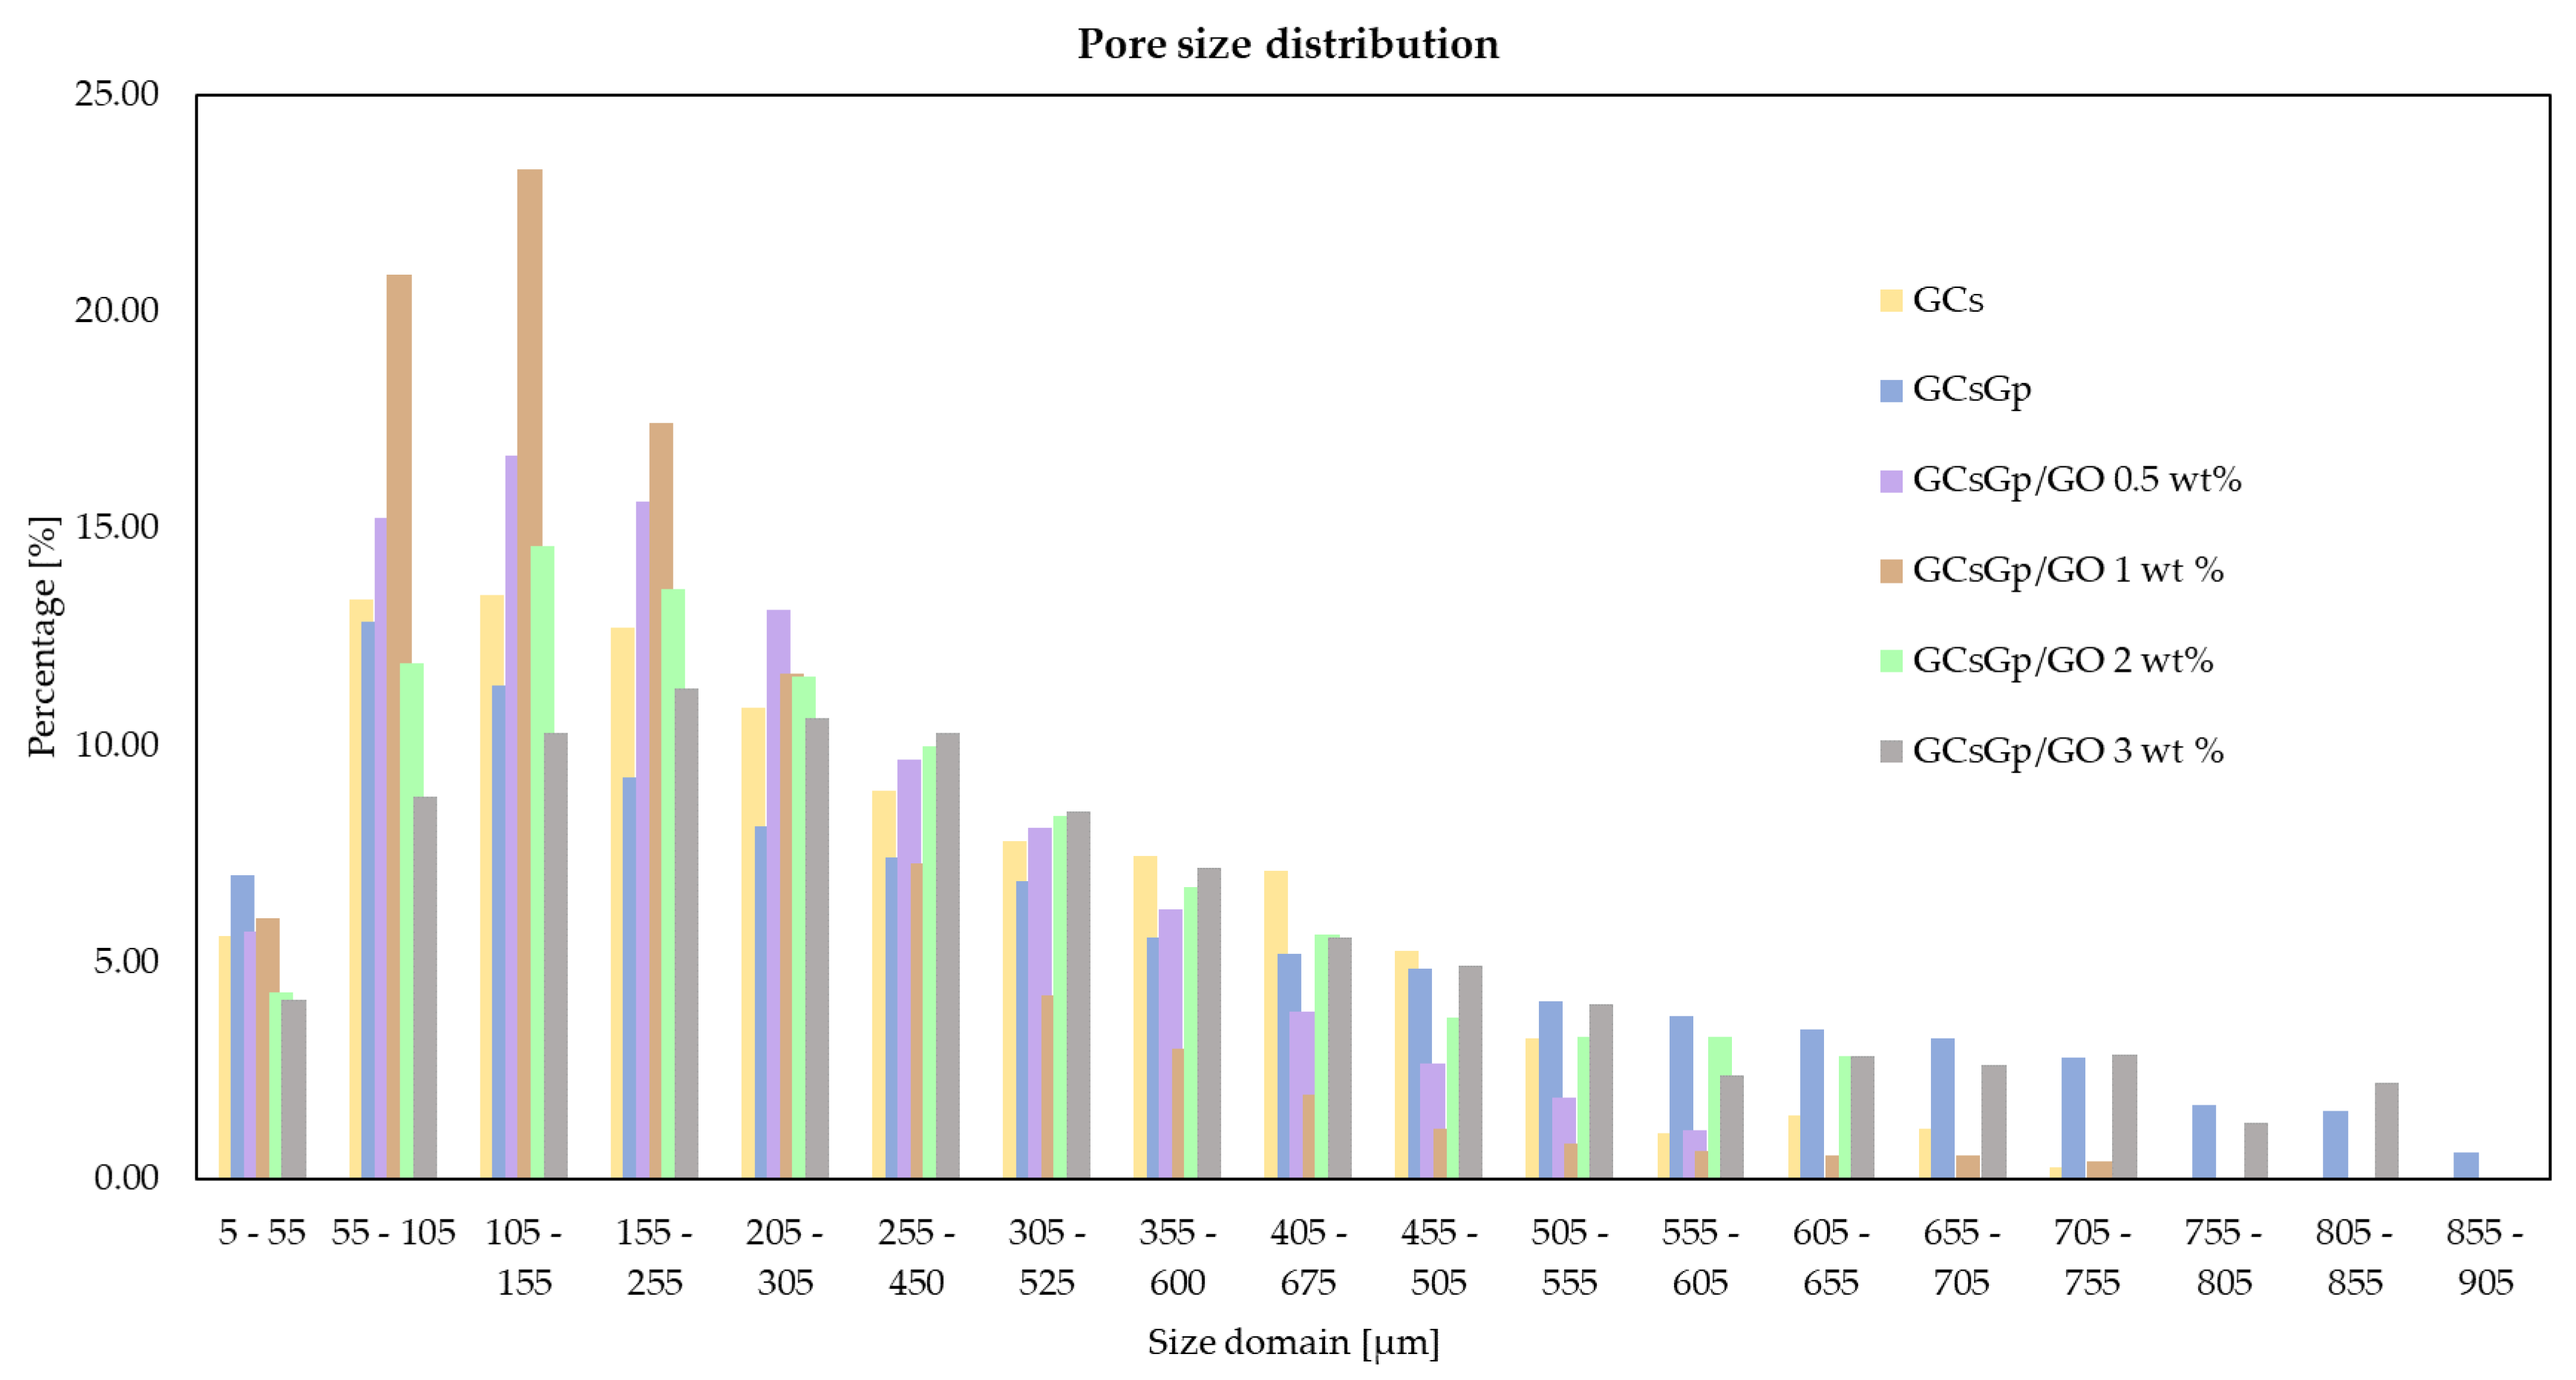
Table 1 summarizes total porosity, average wall thickness, and specific surface. Specific surface was asserted as the ratio between all walls’ surface and object (walls and pores) volume, hence it is heavily influenced by the magnitude of porosity, while
Figure 4 depicts the weighted-average pore-size distribution within the six compositions.
Pore size distribution within the GCs batch is illustrated in
Figure 4. The measurements resulted from 3D tomograms processing in CTAn (Bruker company software) by means of thresholding (clear separation of solid matter from aerial environment), despeckling (scanning artefacts reduction to minimal values), and 3D analysis (distinct quantifications of the number of three dimensional pixels associated to the physical object and pores). 3D analysis is able to provide metric values for various morphological features of the scanned object by converting the size of the 3D pixel (called voxel) to standard units according to the scanning resolution. All objects were scanned at the same resolution of 5 µm, which entails that a pixel of the 2D-acquired images covers 5 µm from the sample (and a voxel a volume of 125 µm
3). For clarity, values were assembled in 50 µm domains and plotted in a histogram.
All six distributions followed a left-skewed Gaussian arrangement. The dimensional array was more or less broad considering the composite content and GO share. There was no proportionality between GO content and the size–value range, however a bell-flattening trend arose. In particular, with GO content increase, more dimensionally ordered pore domains occur. Porogenesis in GCsGp/GO composites underwent a templating refinement meaning that the pore dimensional range evened and the ratio of larger pores marginally increased. The presence of larger pores in implantable devices is favorable for cell migration mitigated also by a smoother flow of nutrients and bioactive factors.
3.4. Preosteoblast Viability Evaluation in Contact with GCS/GO Scaffolds
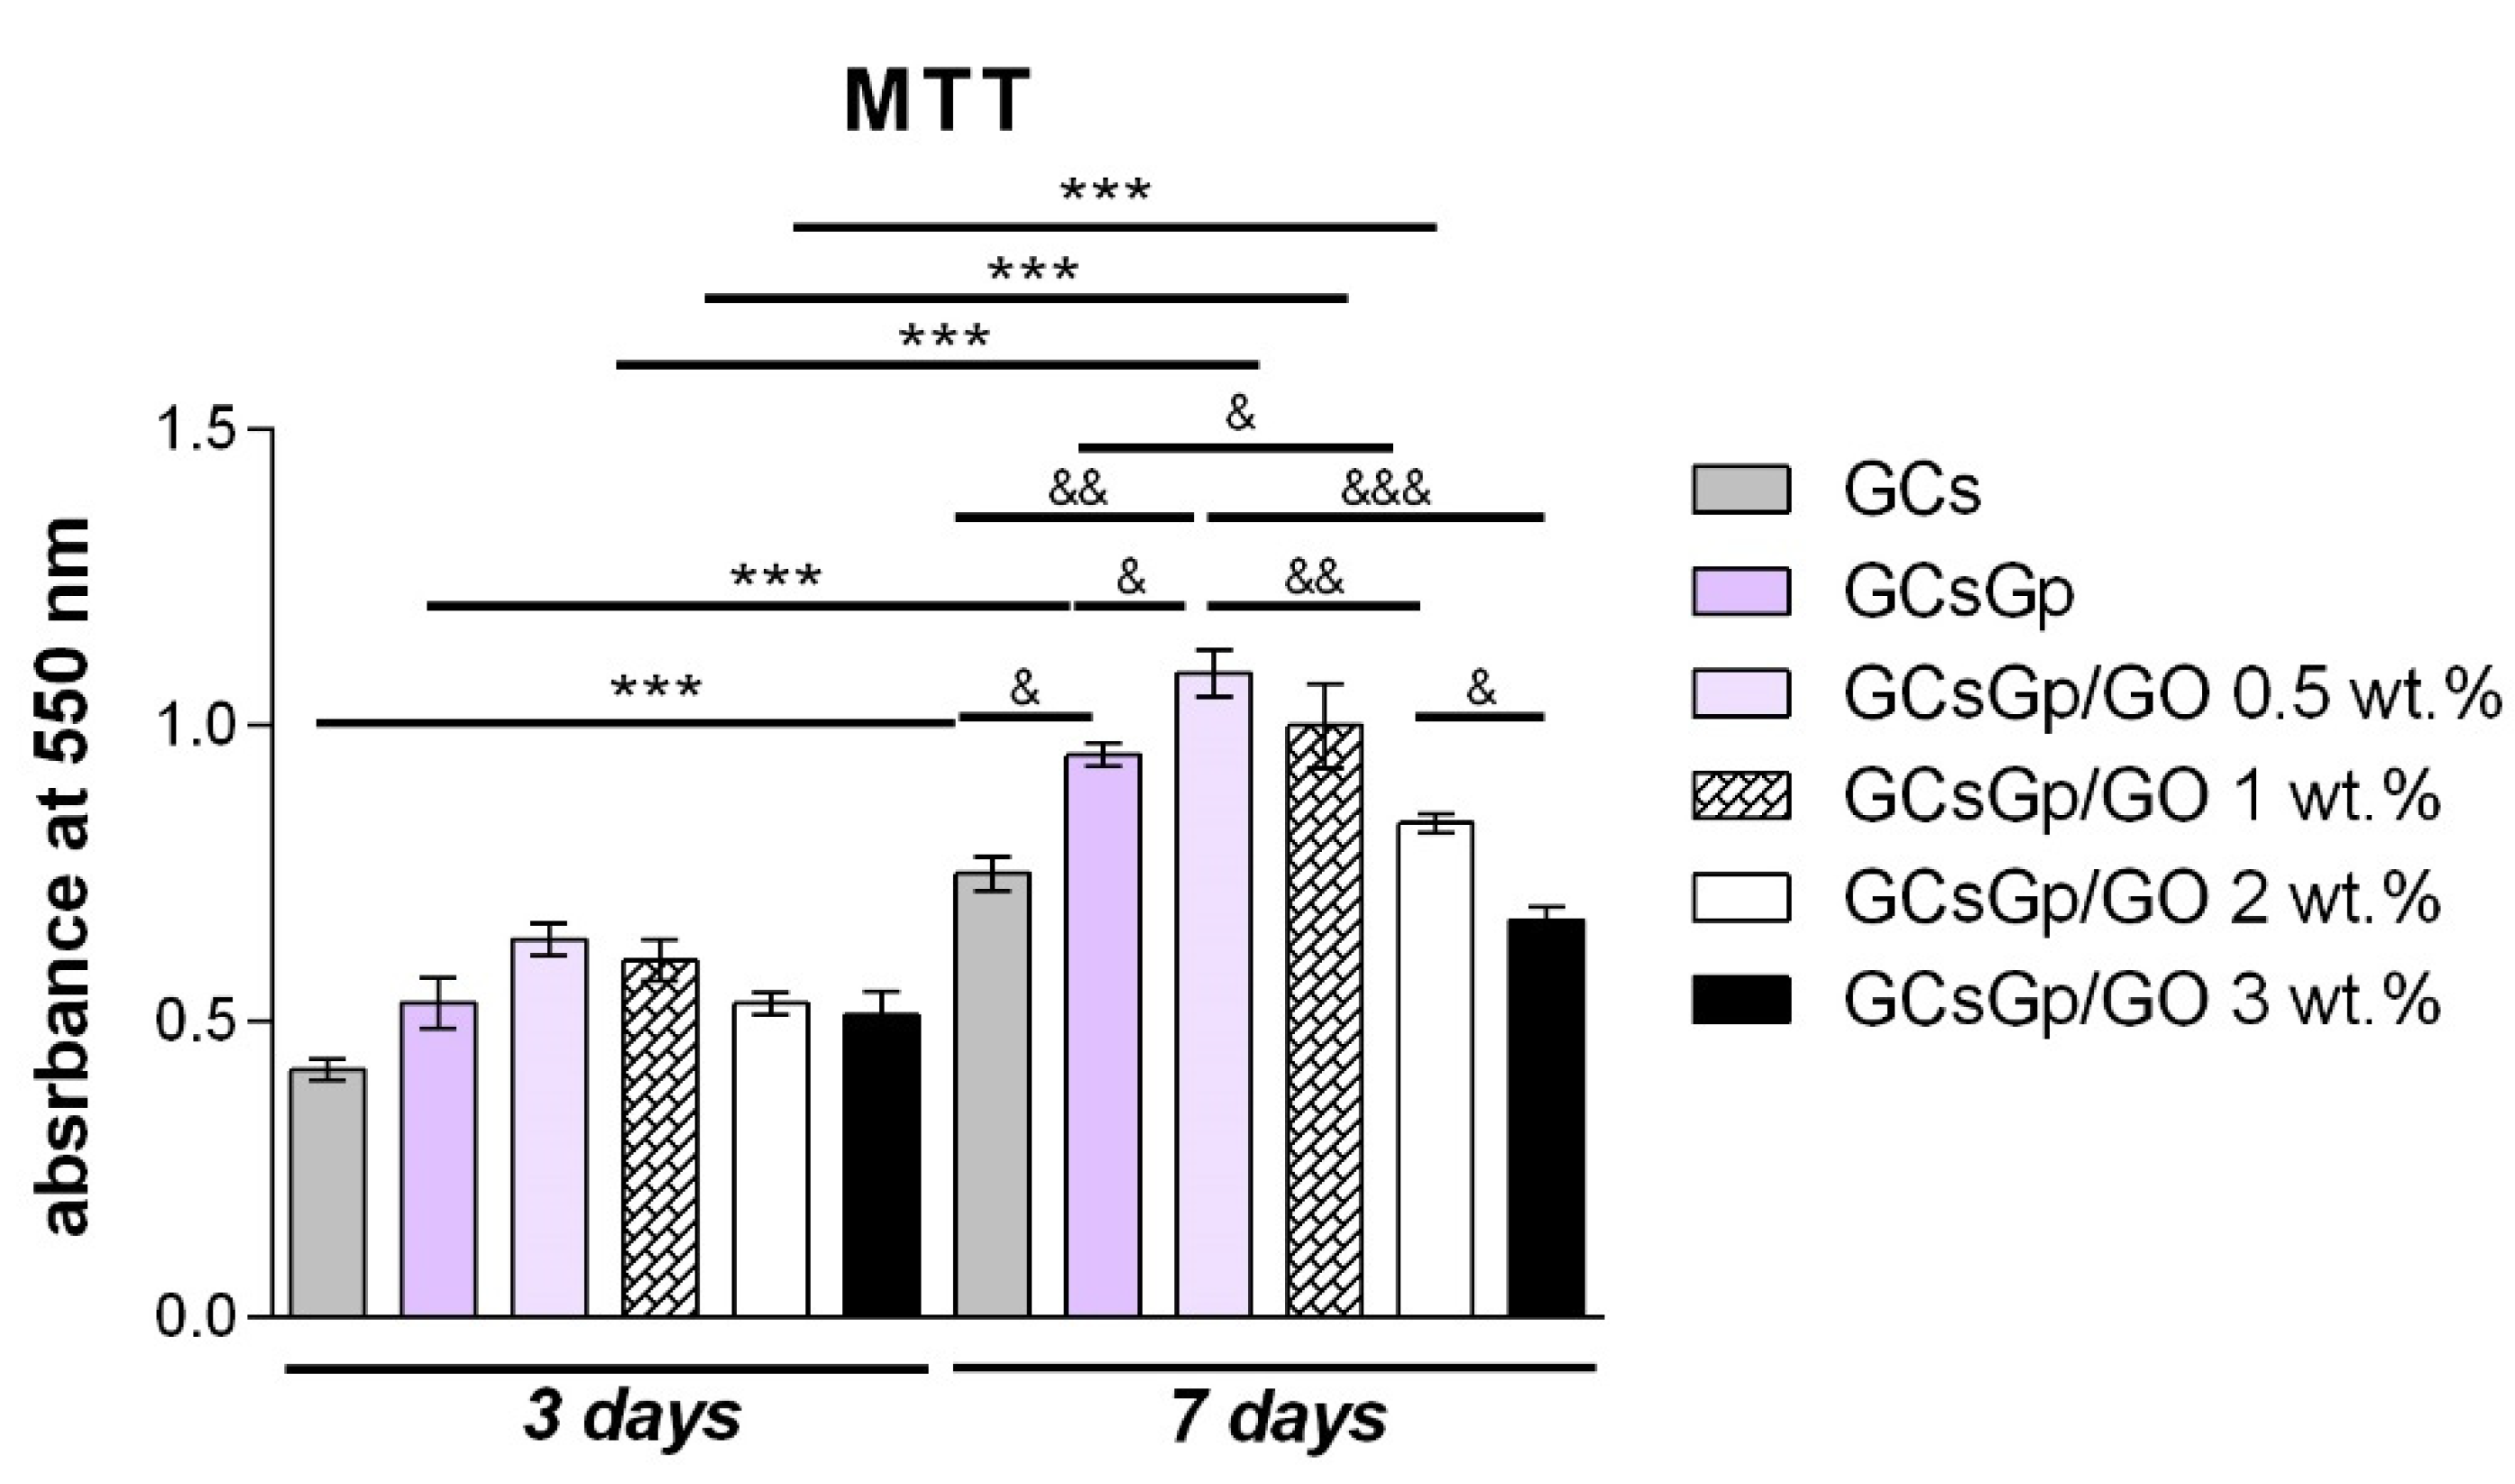
Cell viability and proliferation assessment via MTT assay (
Figure 5) indicated an overall good interaction between murine preosteoblasts and GCsGp/GO scaffolds after 3 days. Even though some differences in cell behavior are visible among the composites, no significant differences were registered the first 3 days of culture. On the other hand, the MTT profile changed after 7 days of culture, firstly indicating a significantly (
p < 0.05) higher cell viability in contact with GCsGp than in contact with GCS control. Moreover, it can be observed how the amount of living cells was significantly (
p < 0.01) increased on the composite enriched with 0.5 wt.% GO as compared to neat GCs control. Between GCsGp/GO 2 and 3 wt.% and GCs, there were no significant cell viability differences found. When comparing GO-enriched scaffolds with GCs control, cell metabolic activity was found to be significantly (
p < 0.05) increased starting with the addition of 0.5 wt.% GO. In contrast, the addition of 2 wt.% GO led to a decrease in cell viability (
p < 0.05), suggesting that higher concentrations of GO could negatively affect cell metabolism and viability. Concerning the GO-enriched scaffolds, it can be observed that between GCsGp/GO 0.5 wt.% and GCsGp/GO 1 wt.% no significant change in cell viability was found. Contrarily, GCsGp/GO 2 wt.% and GCSGp/GO 3 wt.% exposed a significantly (
p < 0.01 and
p < 0.001, respectively) lower viability when compared to GCsGp/GO 0.5 wt.%. MTT assay results also indicated that murine preosteoblasts maintained their viability throughout one week of culture and that they started to proliferate from 3 to 7 days. Interestingly, all tested composites and controls, besides GCsGp/GO 3 wt.%, presented a significant (
p < 0.001) proliferation rate from 3 to 7 days post seeding.
3.5. GCS/GO Cytotoxicity Assessment
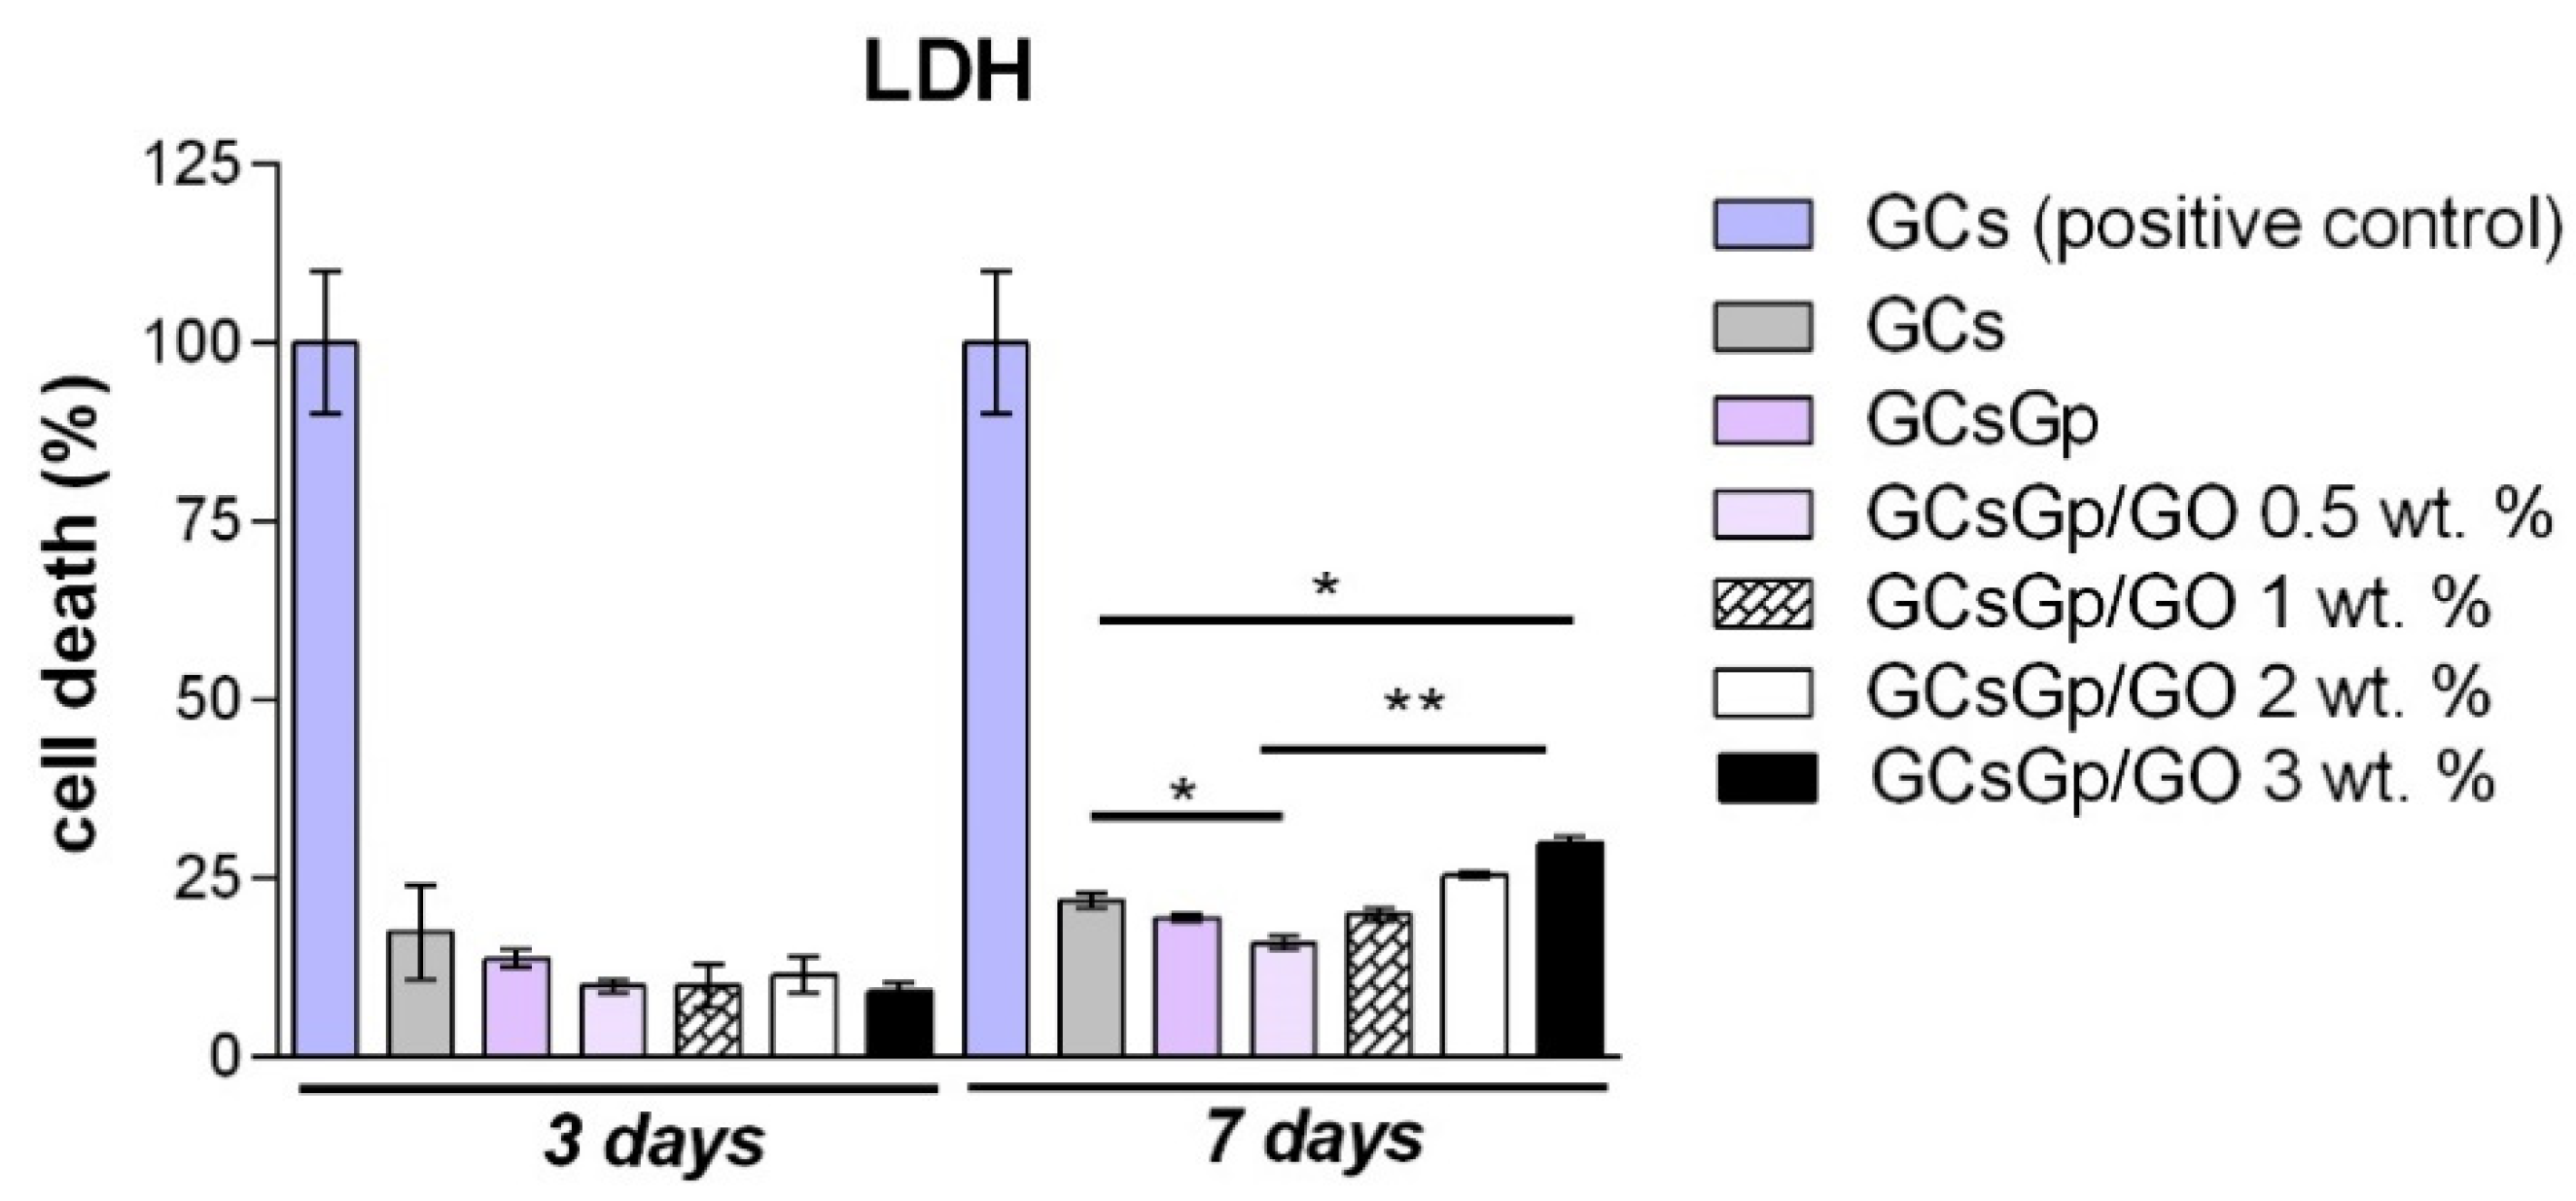
According to the LDH assay (
Figure 6), it was noticed that overall all GCsGp materials containing GO exhibited a certain level of cytotoxicity. When compared to the positive control 3 days post seeding, comparable levels of LDH were found on GCs, as well as on scaffolds enriched with GO. Between the two tested controls, GCs and GCsGp, no significant differences were found. GO-enriched composites exhibited low levels of cytotoxicity, with no significant differences between them. At 7 days of culture, higher levels were found, depending on the GO concentration. Similar levels of cytotoxicity were found for controls and GCsGp/GO 1 and 2 wt.%, while the lowest value was registered for GCsGp/GO 0.5 wt.% (
p < 0.05 as compared to GCS control). Moreover, significantly (
p < 0.05) high levels of toxicity were found for GCsGp/GO 3 wt.%, as compared to GCs control, showing that high levels of GO are able to exert different cell responses and release higher LDH levels. Overall, these materials exhibited a cytotoxicity of 25–30% as compared to the 100% toxic positive control, suggesting a significant difference, which demonstrates that these materials are not toxic and biocompatible with murine preosteoblast.
3.6. Live and Dead Cells Ratio as Response to GCsGp/GO Materials
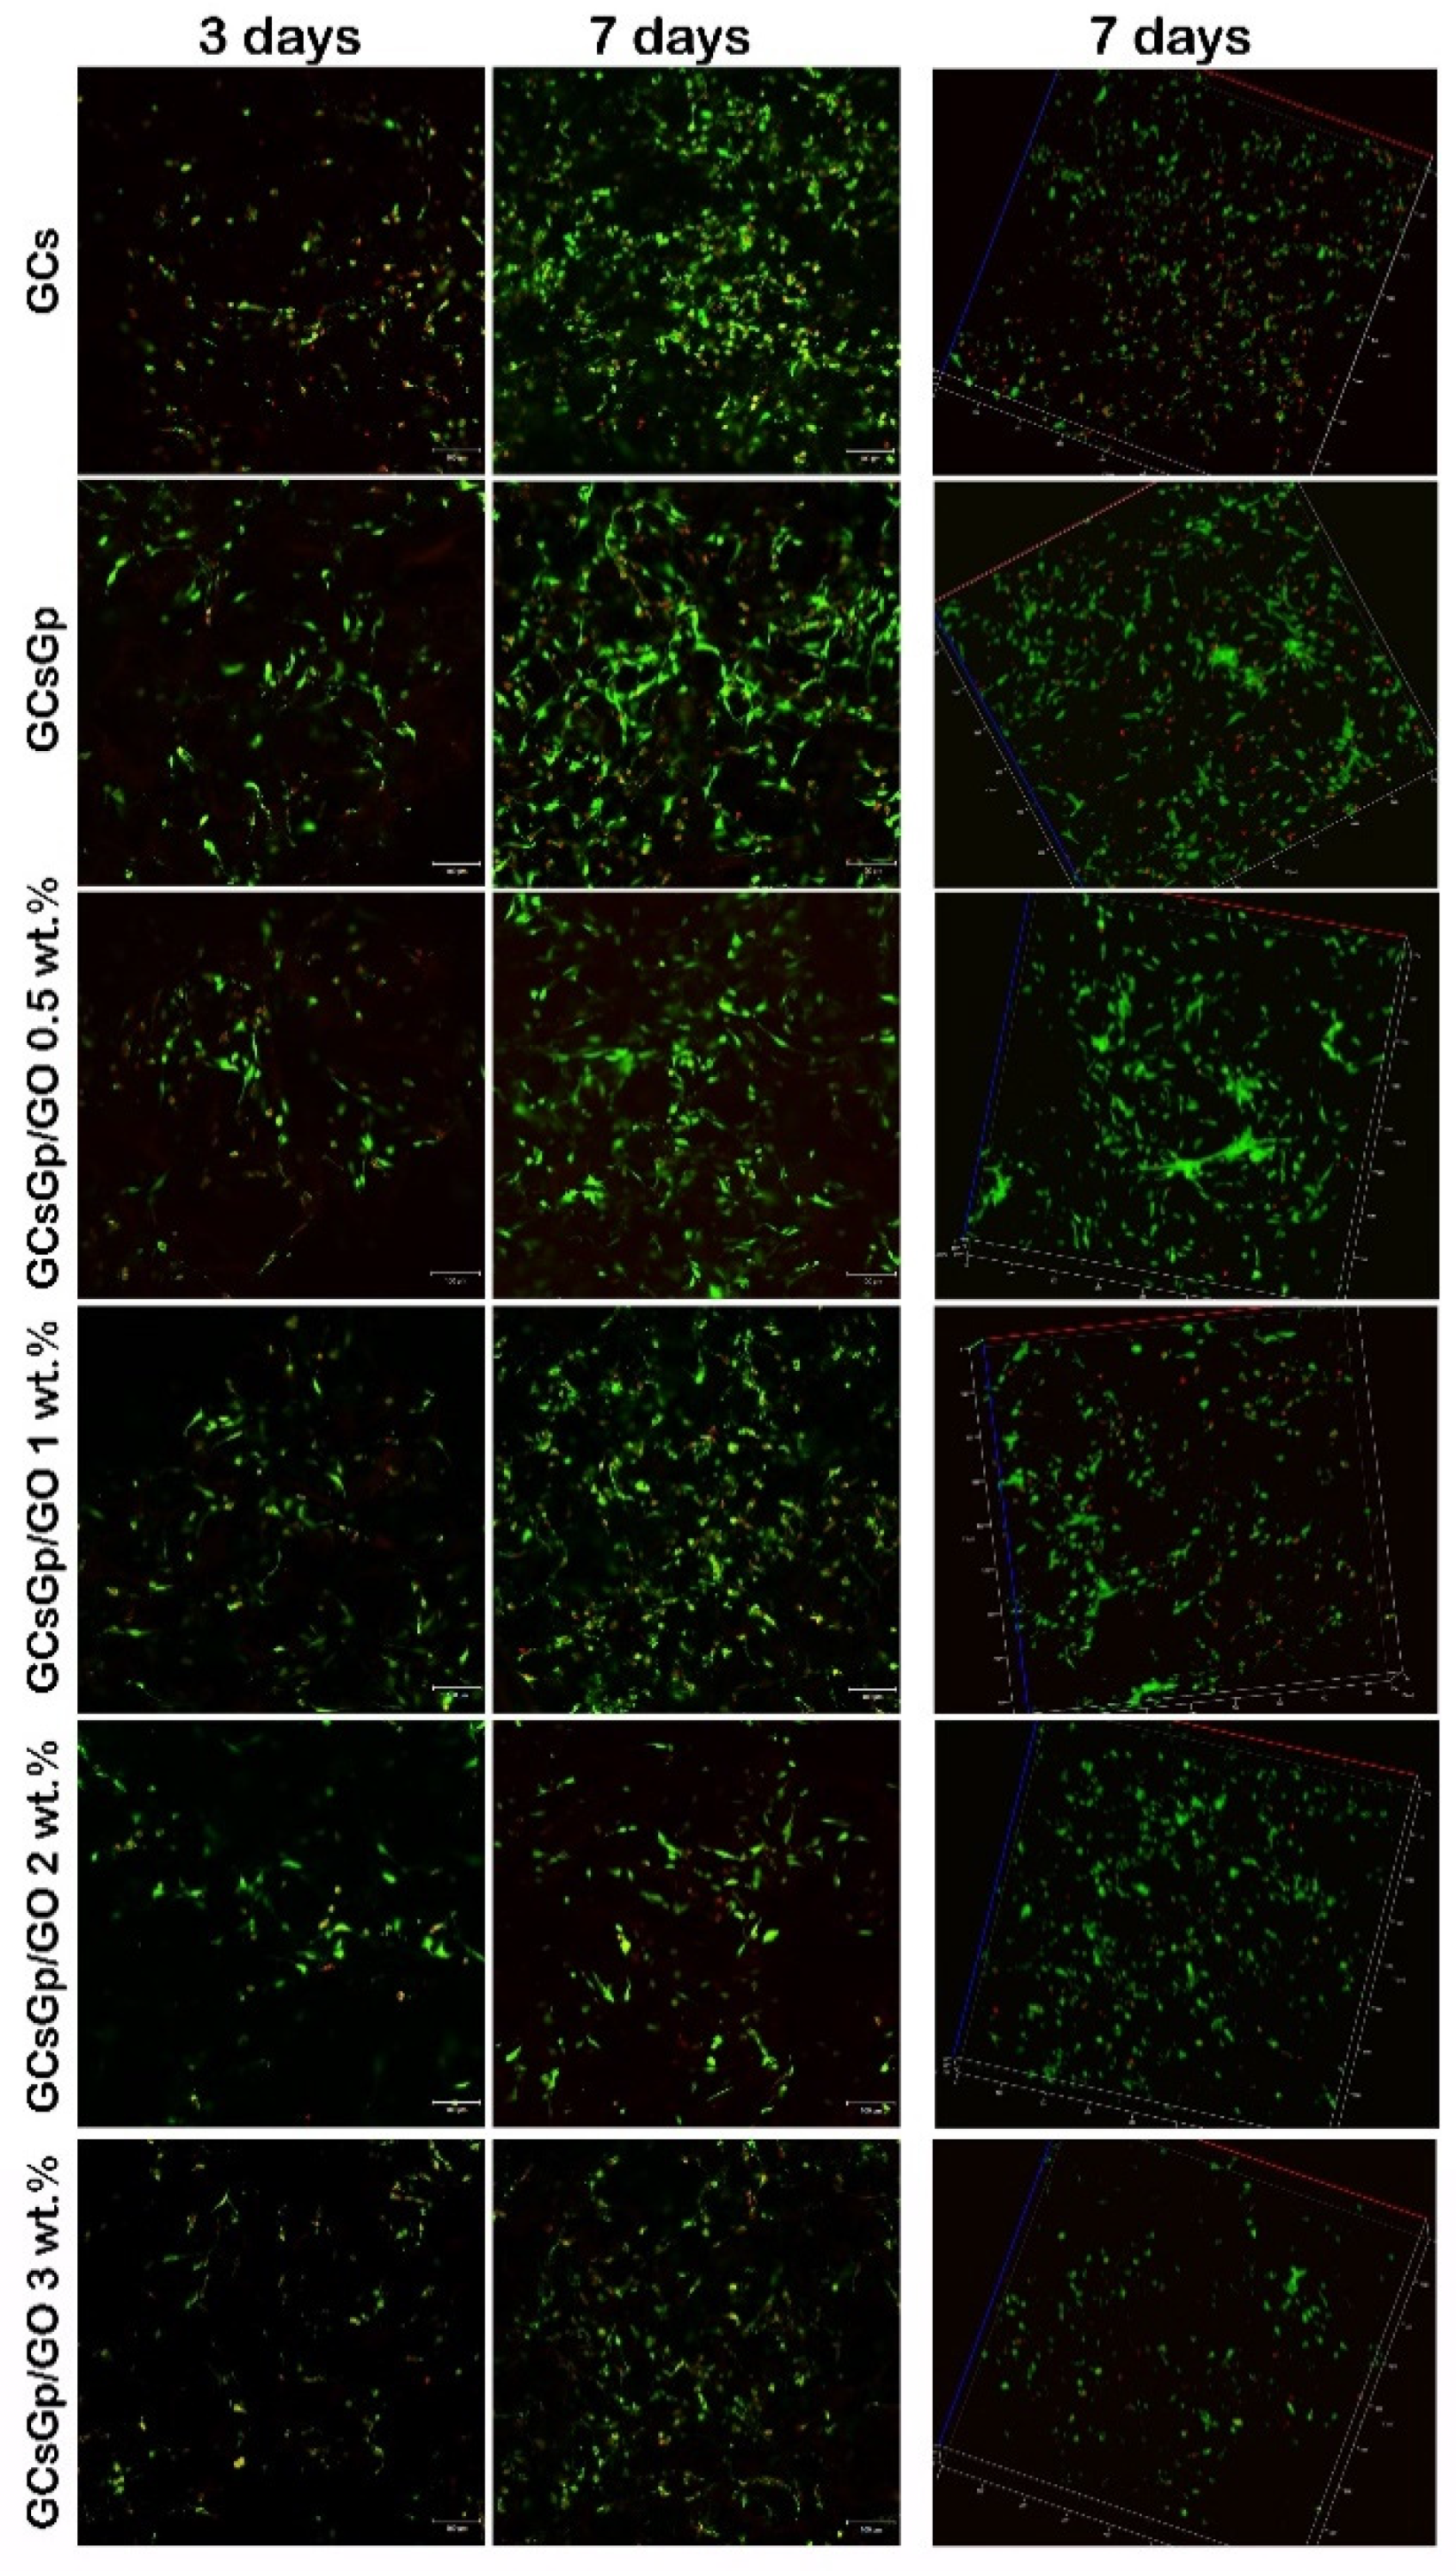
Qualitative evaluation of cell viability and proliferation in contact with GCsGp/GO scaffolds by Live/Dead assay (
Figure 7) confirmed the results obtained by MTT and LDH assays, indicating that murine preosteoblasts proliferated and maintained cell viability on almost all tested composites from 3 to 7 days of culture. 3 days post seeding, all scaffolds present approximately the same distribution and number of cells. However, on GCs and GCsGp controls, more red-labeled cell nuclei than on the other composites could be highlighted. On the other hand, when the number of dead cells is normalized to the total number of cells in culture, then the general cytotoxicity level resembles the profile found by LDH assay.
The fluorescent images have also shown that the amount of green-labeled cells decreases once the concentration of GO rises after 7 days of culture. The proliferation occurred on all materials except GCsGp/GO 3 wt.%, where no major change can be observed from 3 to 7 days of culture. Thus, increasing GO concentrations over a particular threshold can restrict cell proliferation. In conclusion, the lowest cytotoxicity levels correlated with high cell viability were found for GCsGp/GO 0.5 wt.%.
3.7. In Vivo Results
Clinical observation of the experimental animals
The mice showed no postsurgical complications. Furthermore, no animals died post implantation and no inflammation or infections in the injured areas were detected.
In vivo biocompatibility of GCSGp/GO scaffolds
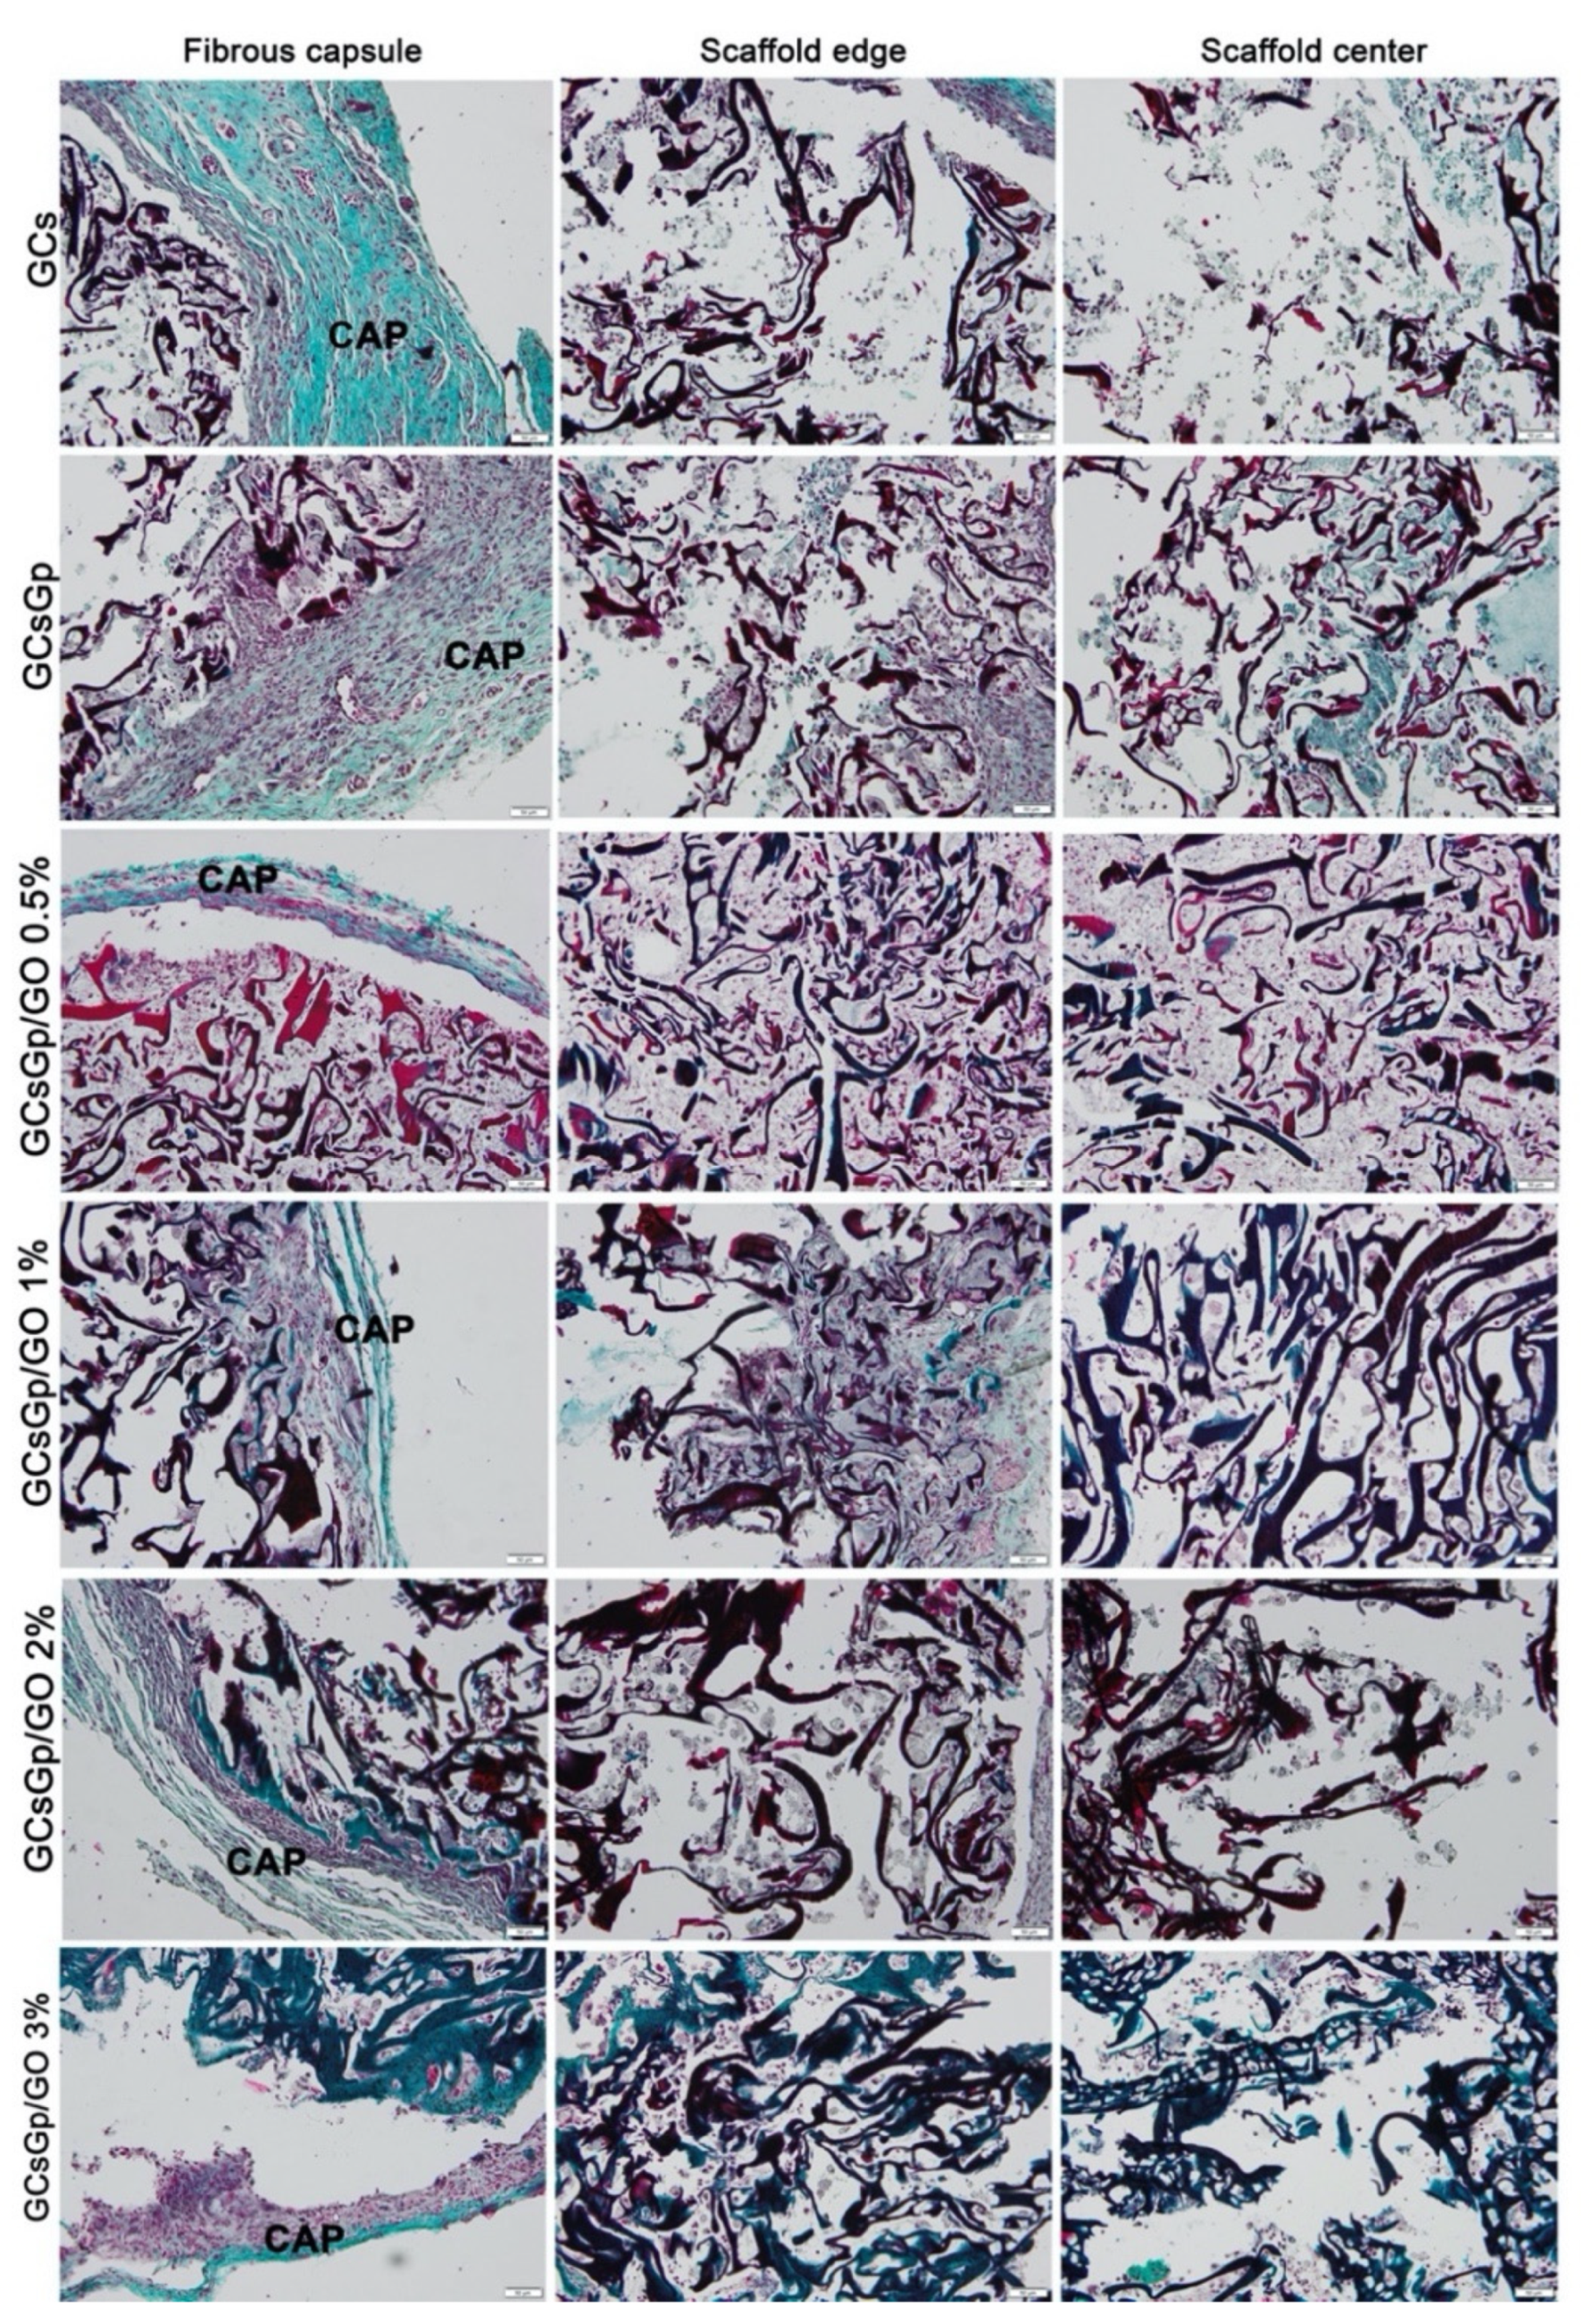
As indicated by Gomori’s trichrome staining in green, thicker collagen deposition was found surrounding the GCsGp/GO scaffolds, as compared to GCs and GCsGp ones (
Figure 8).
Cell infiltration into GCsGp/GO scaffolds occurred from the edge to the center, and the maximum deposition of the matrix was registered for GCsGp/GO 0.5% (
Figure 8).
Degradation of scaffolds was observed as a loss of the regular network appearance and its replacement by cells and matrix. Remnants of scaffold material could be observed mainly at the center, showing that the scaffolds degraded more at the periphery than at the core.
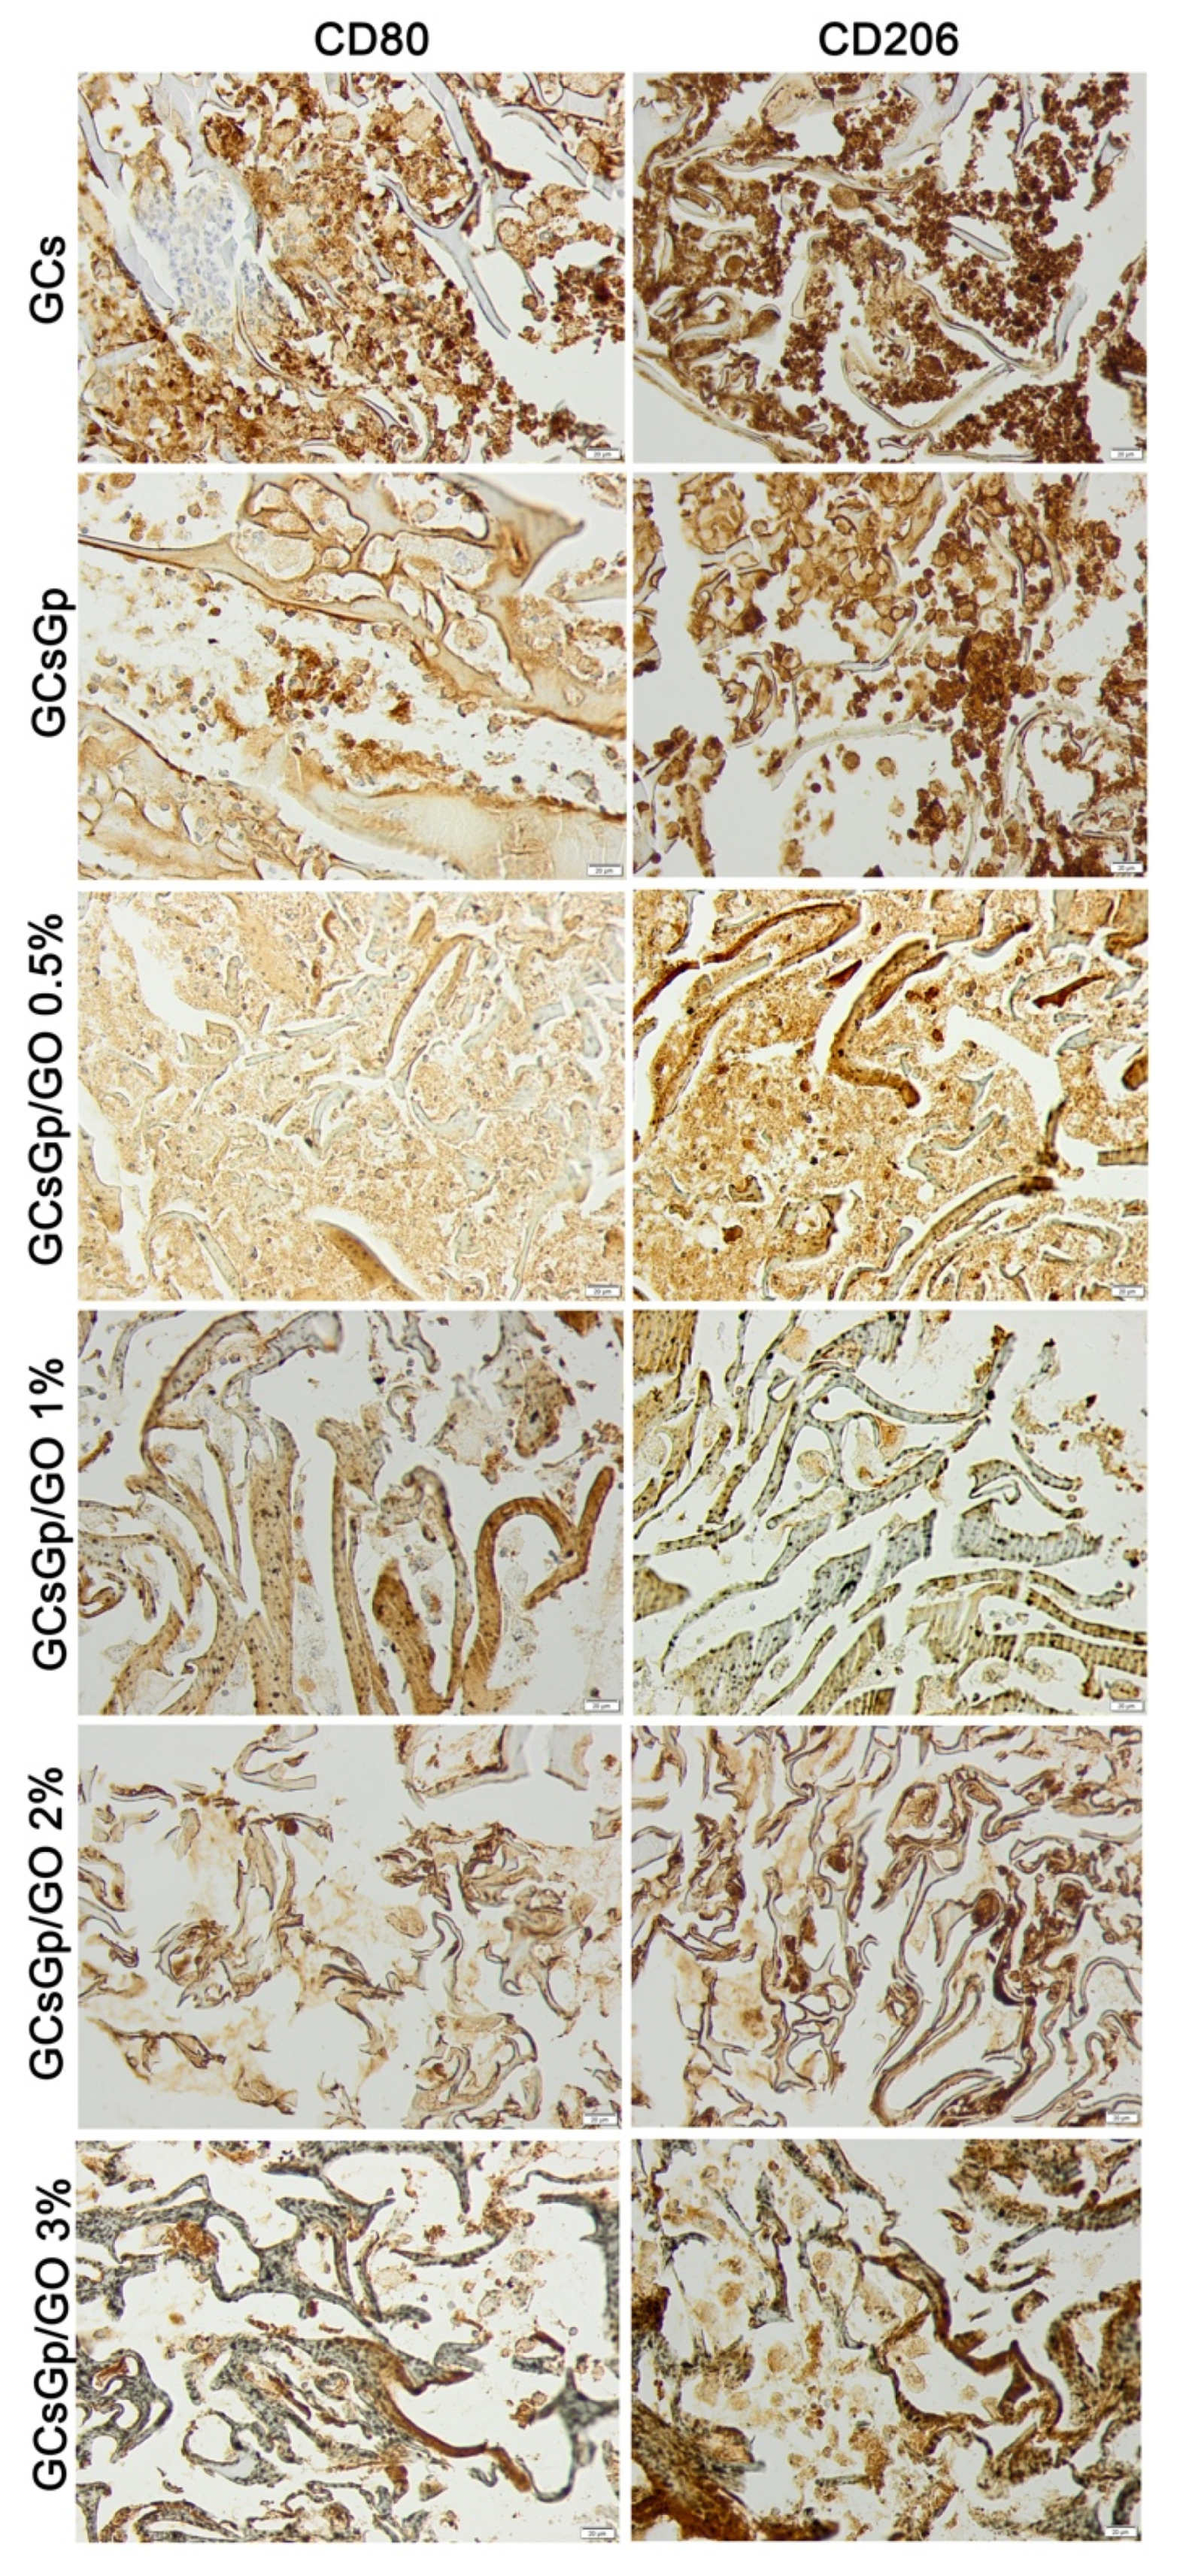
Foreign body giant cells (FBGC) were not seen at week 4 in any of the groups. Immunohistochemical analysis of CD80 (M1 marker) and CD206 (M2 marker) showed the highest expression for GCS and decreased for the GCsGp/GO batch, with a minimum reaction for GCsGp/GO 0.5% (
Figure 9). In general, the overall decrease of the inflammatory profile could be ranked as: GCs > GCsGp > GCsGp/GO 1% ~ GCsGp/GO 2% ~ GCsGp/GO 3% > GCsGp/GO 0.5%.
4. Discussion
The specific extent of water uptake of the biocomposites is one of the pivotal features that prescribe the in vivo course of the implants. The swelling degree was most constant in the case of GCsGp, whose profile remained almost at the same level after 1 h. On the other hand, we noticed fast and dynamic swelling kinetics in the case of GCs, favored by unconstricted chains with total degrees of freedom. Amongst the controls, GCsGp showed the lowest rehydration caliber (SD value of 2000%—
Figure 1), since genipin crosslinking induces polymer network stiffening and a certain degree of chain alignment. In addition to crosslinking, the compositing layout strongly impacts the mechanism of water assimilation as resulted from the mass gain of the specimens. Upon GO addition, it was expected that the bicomponent framework with hydrophobic domains would decrease the composite’s affinity to water. By increasing the amount of GO, the association between polymers and the carbon sheets leads to fluctuating rehydrating potential. The lowest amounts of GO (GCsGp/GO 0.5 and GCsGp/GO 1) affected the hydrophobicity the most due to better dispersibility and minor reaggregation of the GO sheets. Comparable values of 1470% and 1320%, respectively, were ascertained for the equilibrium SD of the two compositions. The highest degree of rehydration was logged in the case of the 2% supplemented composite (SD = 2050%), comparable to the crosslinked reference. Further addition of GO in GCsGp, nonetheless, decreases water retention (SD = 1560%).
This may be due to more hydrophobic slots exposed from within the surfaces of the highly porous dry network. Even though the decrease is not linear and inversely proportional with GO content, the swelling degree could be favored by the cloaking of GO sheet stacks at superior concentration and slightly influenced for the 3% GO ratio by crossing a threshold of polymer enveloping capacity.
A peculiar phenomenon was noticed in the case of GCsGp/GO 3 composition. The maximum SD was reached 2 h after immersion in PBS; henceforth, the network expelled part of the retained water, describing the so-called overshooting phenomena [
20], albeit to a minor extent. The gradual deswelling is a consequence of the polymer network densification, owing to a dynamic process of hydrogen-bond formation between unreacted carboxyl groups of the polymer blend and GO veiled sheets when swollen. This oscillation can be attributed to a synergistic effect of macromolecular relaxation in the network and a thorough penetration of the PBS solution within the gel framework before achieving the final equilibrium state.
Distinct water-retaining outlines can be due to inherent relations between scaffold anisotropy and the swelling of this composite. In general, prediction and theorization of penetrant-induced water uptake is based on free energy considerations. So, by mixing the polymer-based composite with the penetrant, enthalpy and entropy changes contribute to the free energy mediating the swelling extent and to elastic deformations of the systems in conjunction with the stiffness induced by GO additivation [
21].
Physicochemical properties, such as composition and pore template, play a major role in the unfolding of biodegradation within a given bioactive environment. Among the materials hereby investigated, GCsGp/GO 3 sponge exhibited the highest resistance to enzyme degradation while the uncrosslinked control degraded at the fastest rate. The GCsGp/GO 2 and GCsGp/GO 1 complete the top of the most COLase II retardant formulations. With respect to GCs, the high susceptibility to COLase II infers from two reasons related to structure and morphology: i. at molecular level, the polymer chains are loosely packed and less dense, since the network is not chemically crosslinked, and ii. at microscale level, whereby the total porosity and specific surface are the highest (
Table 1) enabling a thorough penetration of the bioaggresive solution. Structure thickness, a measure of the average wall thickness, was also both the tiniest and the narrowest (19.2 ± 0.4 µm) in the control case. The unconstricted structuration of GCs is one of the reasons it features the highest SD. The packing density of the materials increased by Gp crosslinking mirrors in the total porosity (5% ⭨), wall size (25% ⭧), and specific surface (20% ⭨). Originating in this conjuncture, we hypothesize that inhibition of COLase II is due to attenuated infiltration within the specimens’ bulk and its interference with denser terrains and less interfacial surfaces. In addition, the GO rich composites swell dramatically less than the references due to the rigidity induced within the walls by GO embedding. Congruously, GO can endow the enveloping matrix with superior stability in aqueous media by supplying carboxyl groups essential to ensuring additional scaffolding with newly formed H bonds.
Referring to the overall trend, for Gp crosslinked samples, a pregnant weight loss flare occurs shortly after the beginning of the degradation treatment (1 h). For the next intervals, up to 12–24 h, the weight loss values describe a rather linear plateau, as weight differences oscillate between 15–20% in Δ
t1 =
t24 h −
t1 h. Variations from 24 h to 90 days depict an escalating trend associated with 10–28% weight loss (Δ
t2 =
t90 d −
t24 h). Small differences between Δ
t1 (23 h) and Δ
t2 (89 days) testify that enzymatic attack occurs with more potency at the beginning of the treatment. In time, the crosslinked specimens exhibit prolonged resistance against degradative media. In addition, the GO-loaded samples are less prone to degradation (4–10% more stable than GCsGp). This GO effect we monitored is in opposition to Saravanah et al. who reported more pronounced degradation in the case of gelatin–chitosan GO composites. Nonetheless, their networks were not crosslinked, providing the circumstances for the structures to become more brittle and less consolidated after GO saturation [
13]. In our case, GCs’ reference catered the poorest stability against degradation due to the unassembled polymer networks.
From a morphological point of view, inner architecture of the biopolymer-GO composite scaffolds is fairly akin. GCs and GCsGp (
Figure 3A–B) display comparable morphological features, with irregular pore sizes and shapes. Nonetheless, upon crosslinking, the pore walls become less slender and transparent. This is an evidence of the GCs framework thickening, which coheres with the confining effect Gp has towards polysaccharide and protein chains [
22,
23]. Since the crosslinked polymer chains possessed limited mobility, the pore formation dynamics was attuned accordingly.
Structural pore patterning is a measure of composite blocks dynamics and kinetics at molecular level, but it is also directly accountable for the quotas of total porosity (T.Po), structure thickness (St.Th), and specific surface (Sp.S) (reported in
Table 1). T.Po assessed from µCT datasets is the volumetric ratio of all the pores in a given specimen. The values of T.Po are similar for all specimens, within the range of 86–90% of the total volume of a scanned object. On the other hand, important variations in St.Th appear. Gp generates a 25% increase in wall thickness compared to GCs reference, while GO increases with 5–30%. Sp.S influence is inversely proportional. The highest values for specific surface appear in the case of GCS and GCsGp/GO 0.5, which endorse them as highly promising for in vitro cell and in vivo tests. GCsGp/GO 2 and GCsGp/GO 3 could provide enhanced support due to more consolidated lateral sides, but their Sp.S is slightly lower, which could impair the kinetics of the multicomponent (cells and bioactive agents) native/simulated internal fluid.
Qualitatively, domains of comparable pore size are discernable for the GO-loaded formulations (
Figure 3C2–F2). In addition, aligned assemblies of parallel pore arrays emerge with GO reinforcing. Interestingly, depending on the GO amount, a maximum degree of pore structuring stands out at 1 wt.% GO (
Figure 3D1–D2). The incipient phase of regularized porosity is observed at 0.5 wt.% GO addition (
Figure 3C1–C2). At higher concentrations, while pore morphogenesis perpetuates, size distribution widens and the even pattern moderately disarrays. By governing the GCs pore network, GO-loading could upgrade the biophysical properties of the polymer blend in terms of morpho-functional characteristics that promote cell affinity.
Moving on to addressing the biological activity of the composites, the performed biocompatibility assays (MTT, LDH, and Live/Dead) in this particular experimental set up demonstrated that GCs and GCsGp/GO composites are compatible with murine preosteoblasts. As stated in the literature [
17], cell viability could be attenuated when cultured in GO-containing materials. The results indicated that increasing the content of GO over 3 wt.% did not have a beneficial effect on cells’ behavior. Even though cell proliferation was not promoted in higher GO load formulations, LDH assay revealed that during one week of culture, both controls, GCs, and GCsGp exhibited significantly higher cytotoxicity levels than GO-enriched materials. Therefore, it could be stated that higher GO amounts influenced cell response by inhibiting cell proliferation. Our results showed that the most optimal response of 3T3-E1 cells was found in contact with GCsGp/GO 0.5 wt.% in terms of viability and proliferation, thus proving that, for adequate cell responses, GO presence is required but in lower amounts. Our results are in accordance with other studies where the biocompatibility of GO with murine preosteoblasts was assessed. In this respect, Mehrali et al. demonstrated a positive interaction between preosteoblasts from the human fetal osteoblastic (hFOB) cell line and reduced GO up to a concentration of 1.5 wt.%, showing that the proprieties that GO brings to a scaffold have an important influence on cell behavior [
24]. Moreover, Saravanan et al. generated a scaffold containing chitosan, gelatin, and GO, which was tested for its in vitro cytocompatibility with rat osteoprogenitors, concluding that the presence of 0.25% GO in the scaffolds’ structure delivered a better cell viability than the polymer control [
25]. In conclusion, the most biocompatible composite in our study turned out to be GCsGp/GO 0.5 wt.% and could be validated for further applications in the field of BTE and regenerative medicine.
It is well known that chemical and mechanical properties of the material can affect biological response and modulate foreign body reaction. Biomaterials may induce significantly acute/chronic inflammatory responses, which can affect or delay tissue healing [
26]. In contrast, the histopathological analysis showed that the subcutaneous implantation of the GCsGp/GO scaffolds to mice produced a minimum foreign body reaction, as evidenced by the presence of a thin fibrous capsule around the biomaterials and the lack of FBGC. This pathway is in the range of normal standard resolution process for biomaterials, mediated by a foreign body reaction [
26].
It was likely that the degradation products of the GCsGp/GO scaffolds did not cause irritation of the surrounding tissue, allowing the tissue organization in the implantation area.
Incipient tissue formation at the periphery and the progression to the center in exchange with the degradation of the scaffold network was more balanced and advanced for GCsGp/GO 0.5% scaffold. We explain these results for GCS scaffolds versus those with GO through a biopolymer blend-genipin-GO synergistic effect. Regarding the difference between GCsGp/GO 0.5% and GCsGp/GO 1%, 2%, and 3%—probably the higher concentrations of GO on this new composition— encouraged an extended inflammatory response in the early post-implantation phase and degraded the scaffold network before cell migration and adhesion, consequently, unbalancing the healing process. These results and hypothesis also support the in vitro biocompatibility results, which showed GCsGp/GO 0.5%, ensuring the most optimal cellular response and lowest cytotoxicity. Moreover, Tenorio et al. (2019) determined that the biocompatibility of a graphene oxide and chitosan biocomposite—but without gelatin—implanted in Wistar rats’ critical size cranial bone defects for three months, finding less foreign body reaction for GO 0.5% than for GO 1%.
Degradable scaffolds, such as those tested here, are supposed to be phagocytized, a function attributed to M1 macrophages, followed by M2 phenotype activation, which attenuate acute/chronic inflammation and promote healing [
27]. At week 4, we found an intense CD80 and CD206 immunopositivity for GCs and GCsGp/GO-subcutaneous implanted biomaterials, then for gelatin-chitosan–genipin-reinforced with graphene oxide, which suggested that the inflammatory process is still very active in the graphene-free scaffolds. The most balanced immune reaction was obtained for GCsGp/GO 0.5%, correlated with the more advanced tissue formation for this scaffold.

 ,
, 


