
A Multifactorial Approach to Untangle Graphene Oxide (GO) Nanosheets Effects on Plants: Plant Growth-Promoting Bacteria Inoculation, Bacterial Survival, and Drought

 ,
,  and
and 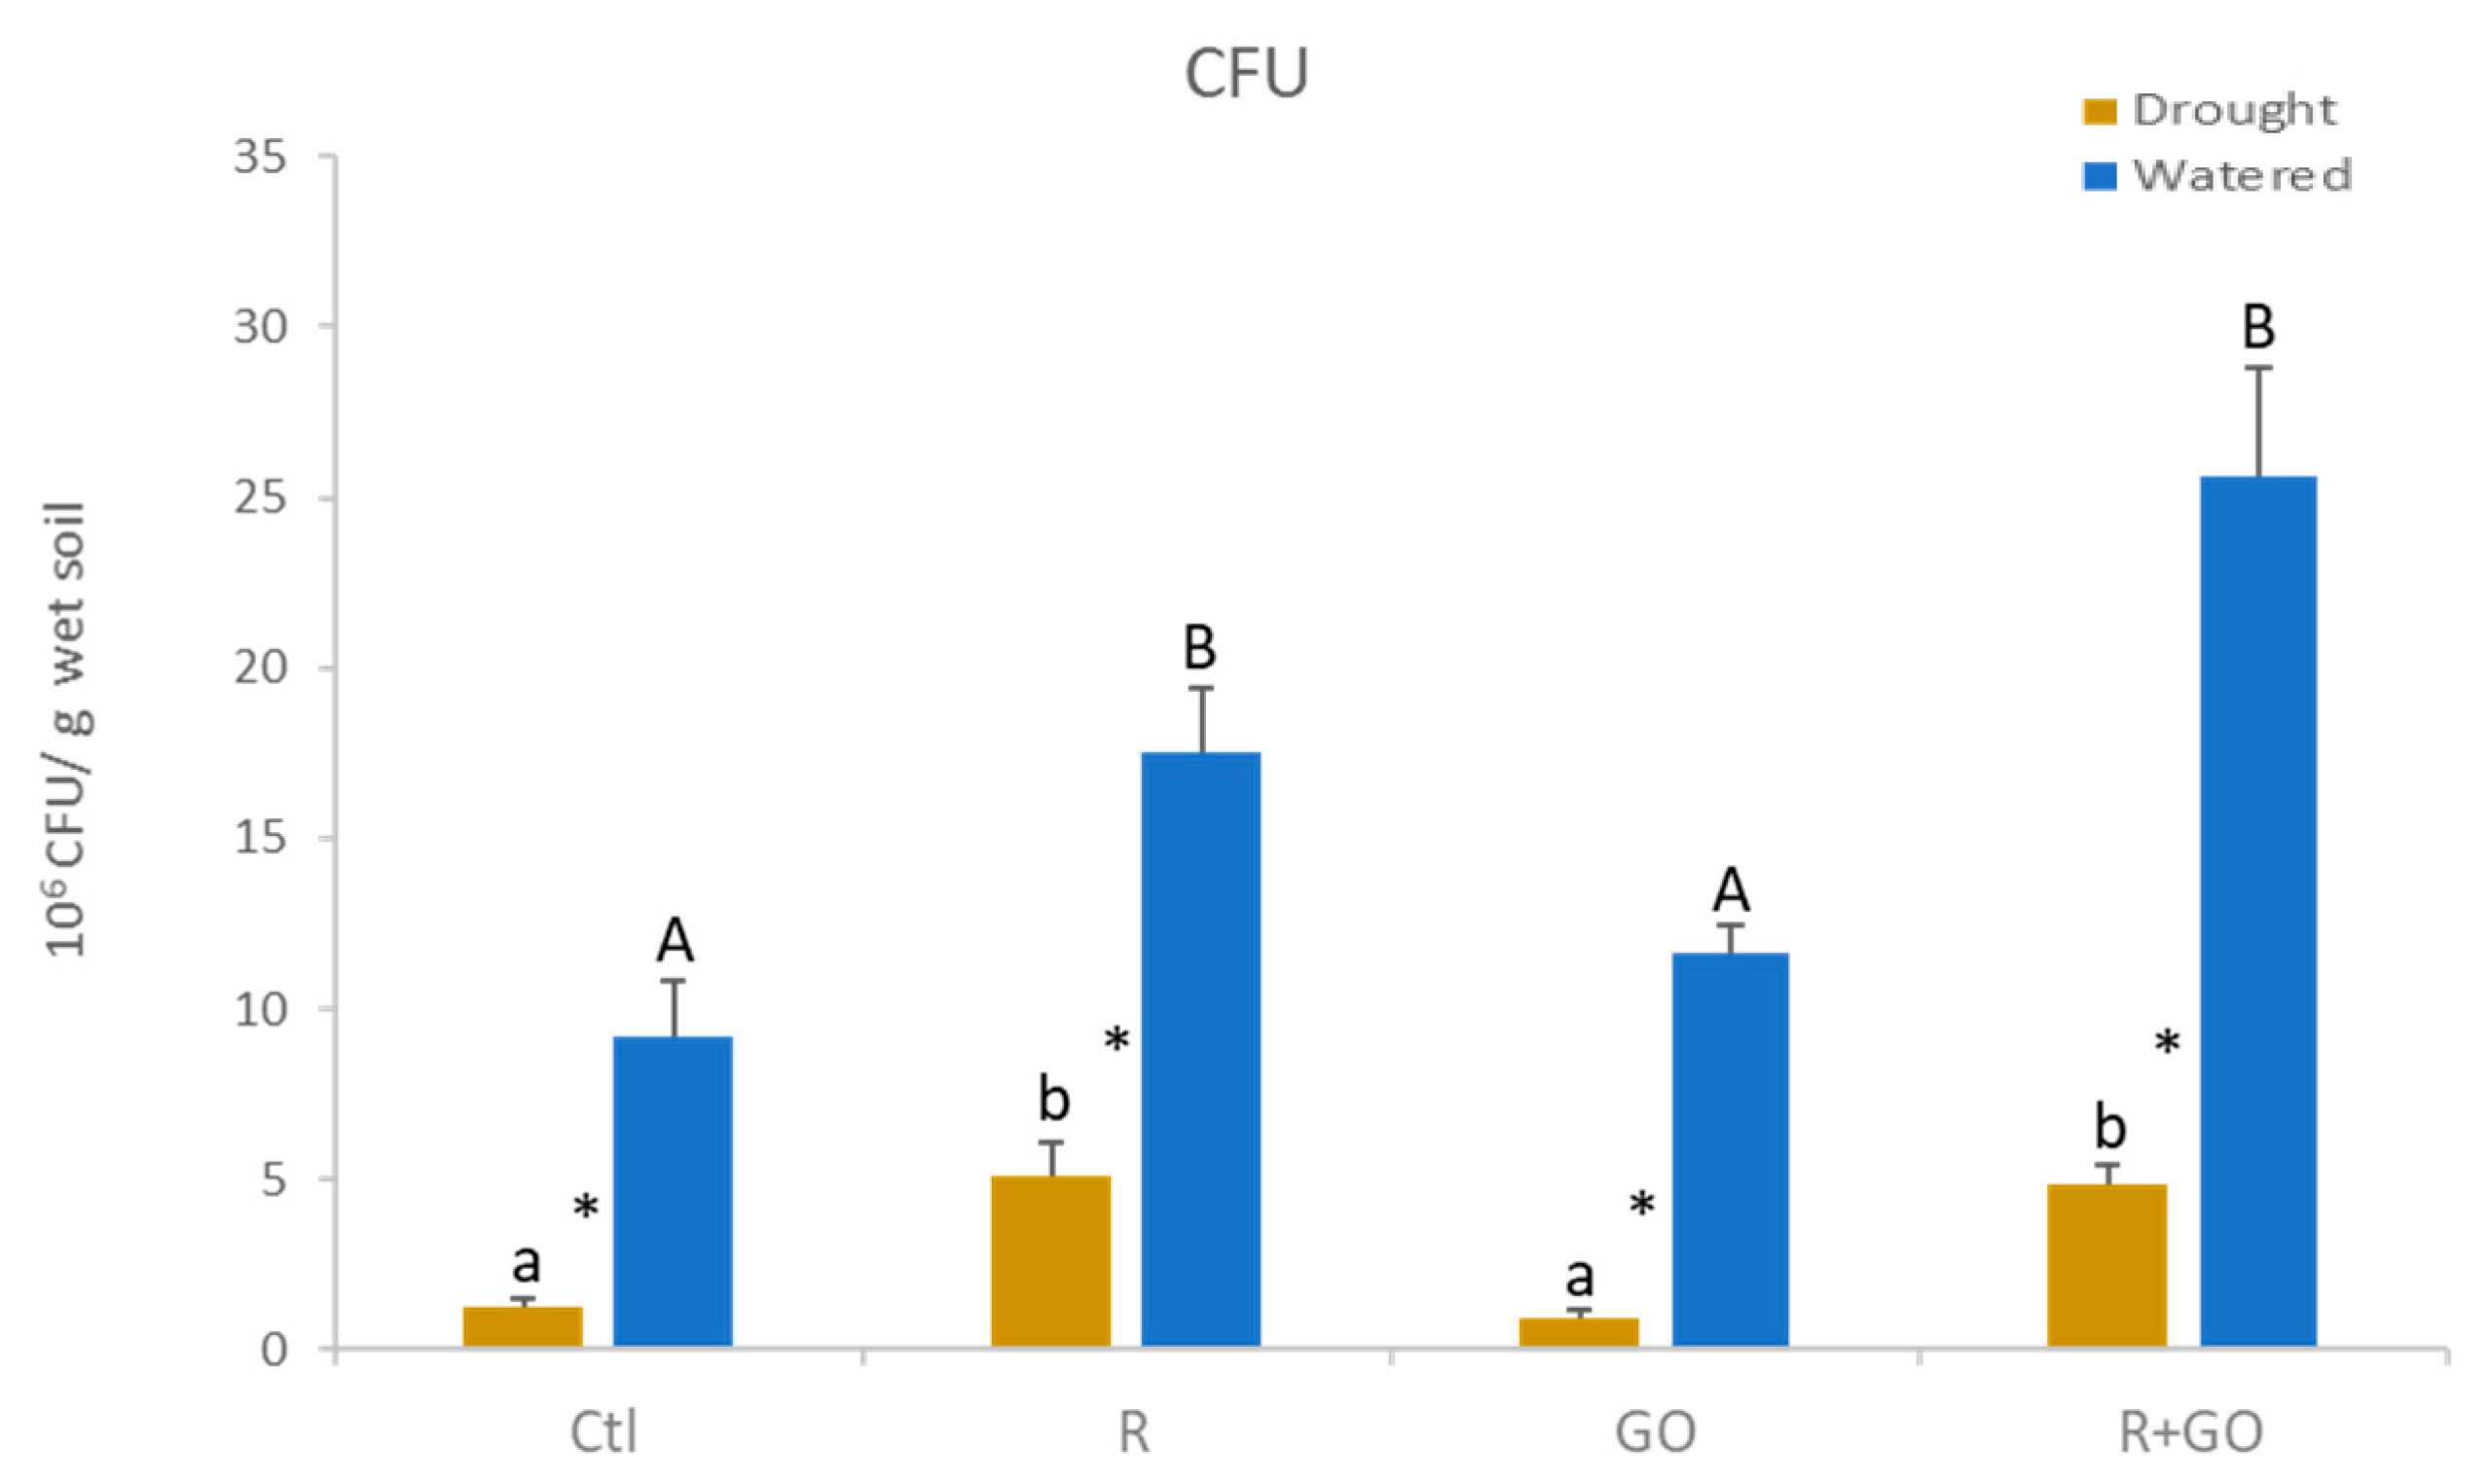
Abstract
:1. Introduction
2. Materials and Methods
2.1. Graphene Oxide Nanosheets and Other Reagents
2.2. Bacterial Strain
2.3. Experimental Conditions
2.4. Colony Forming Units
2.5. Water Activity
2.6. Dry Weight
2.7. Photosynthetic Pigments
2.8. Soluble and Insoluble Carbohydrates
2.9. Proline Content
2.10. Lipid Peroxidation
2.11. Protein Content, Electron Transport System Activity, and Superoxide Dismutase Activity
2.12. Statistical Analysis
3. Results
3.1. Water Activity of Substrates
3.2. Bacterial Survival
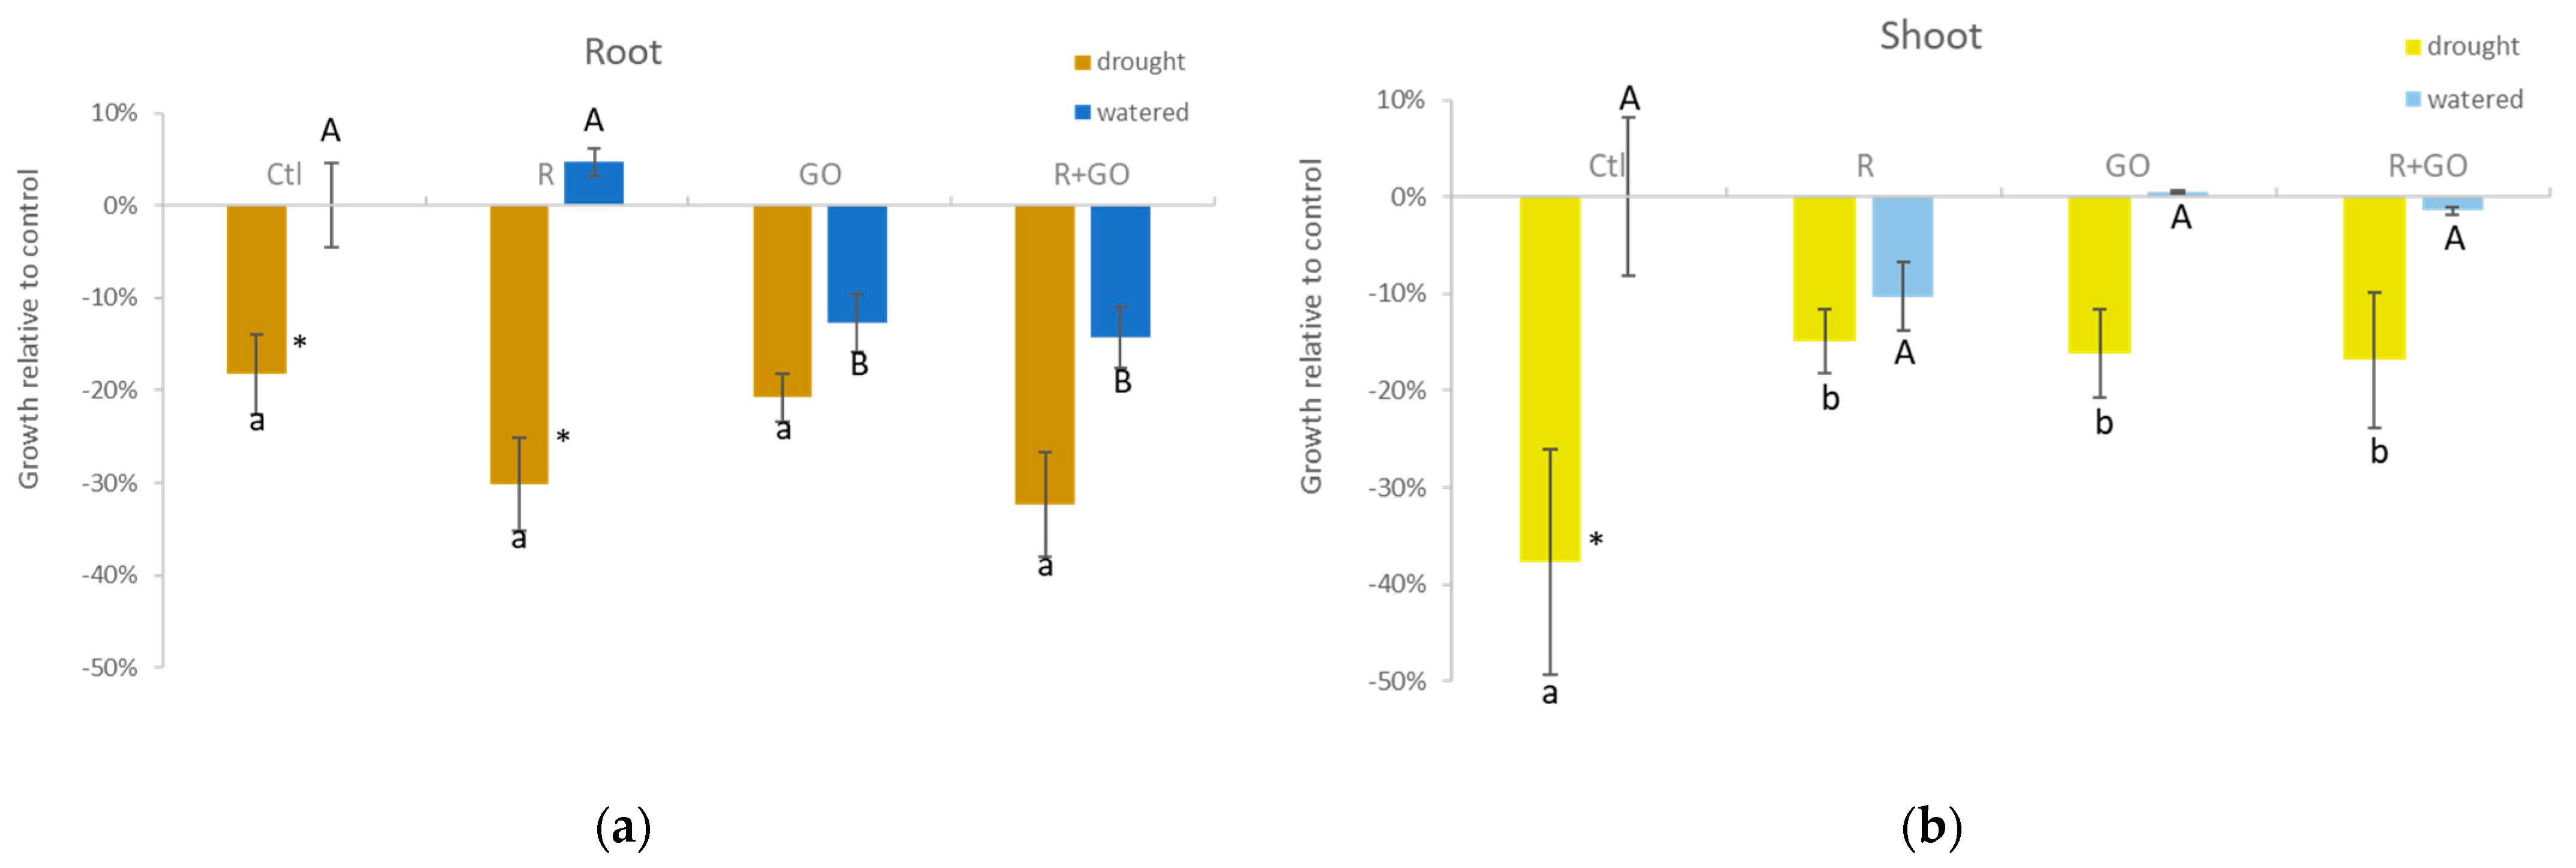
3.3. Plant Growth
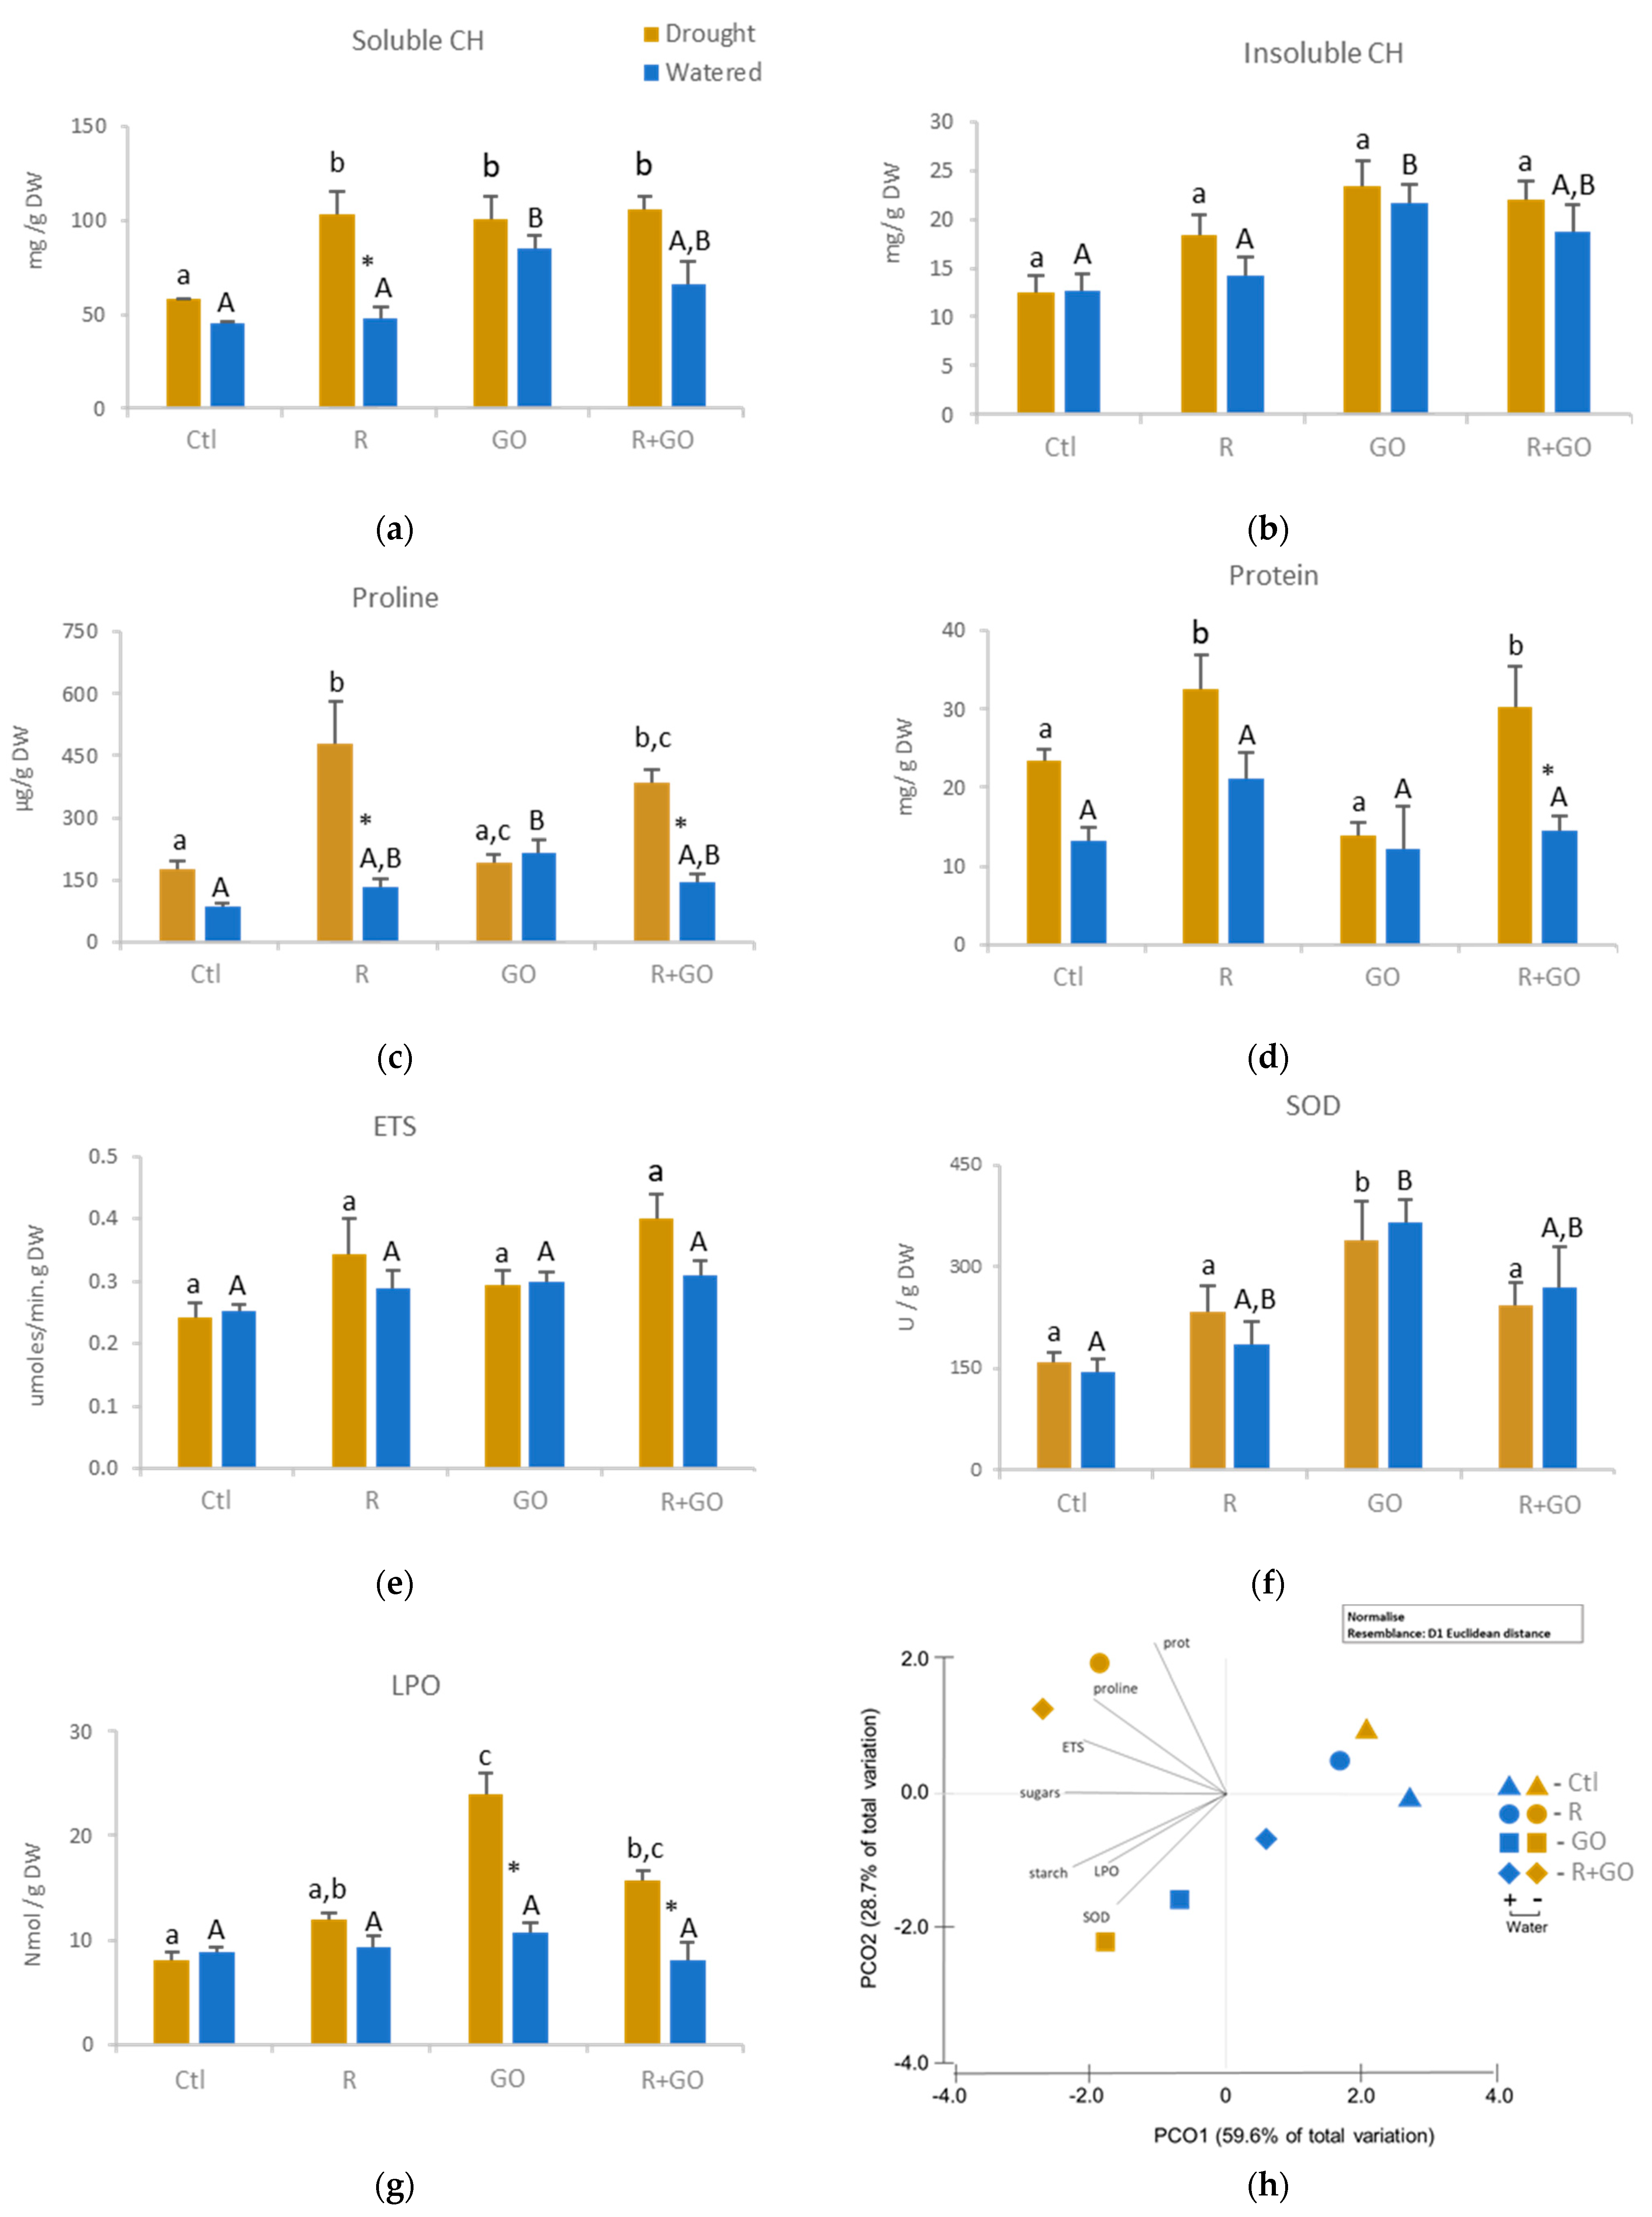
3.4. Biochemical Alterations in Roots
3.4.1. Soluble and Insoluble Carbohydrates
3.4.2. Proline
3.4.3. Protein Content
3.4.4. ETS
3.4.5. SOD
3.4.6. Lipid Peroxidation
3.4.7. Multivariate Analysis
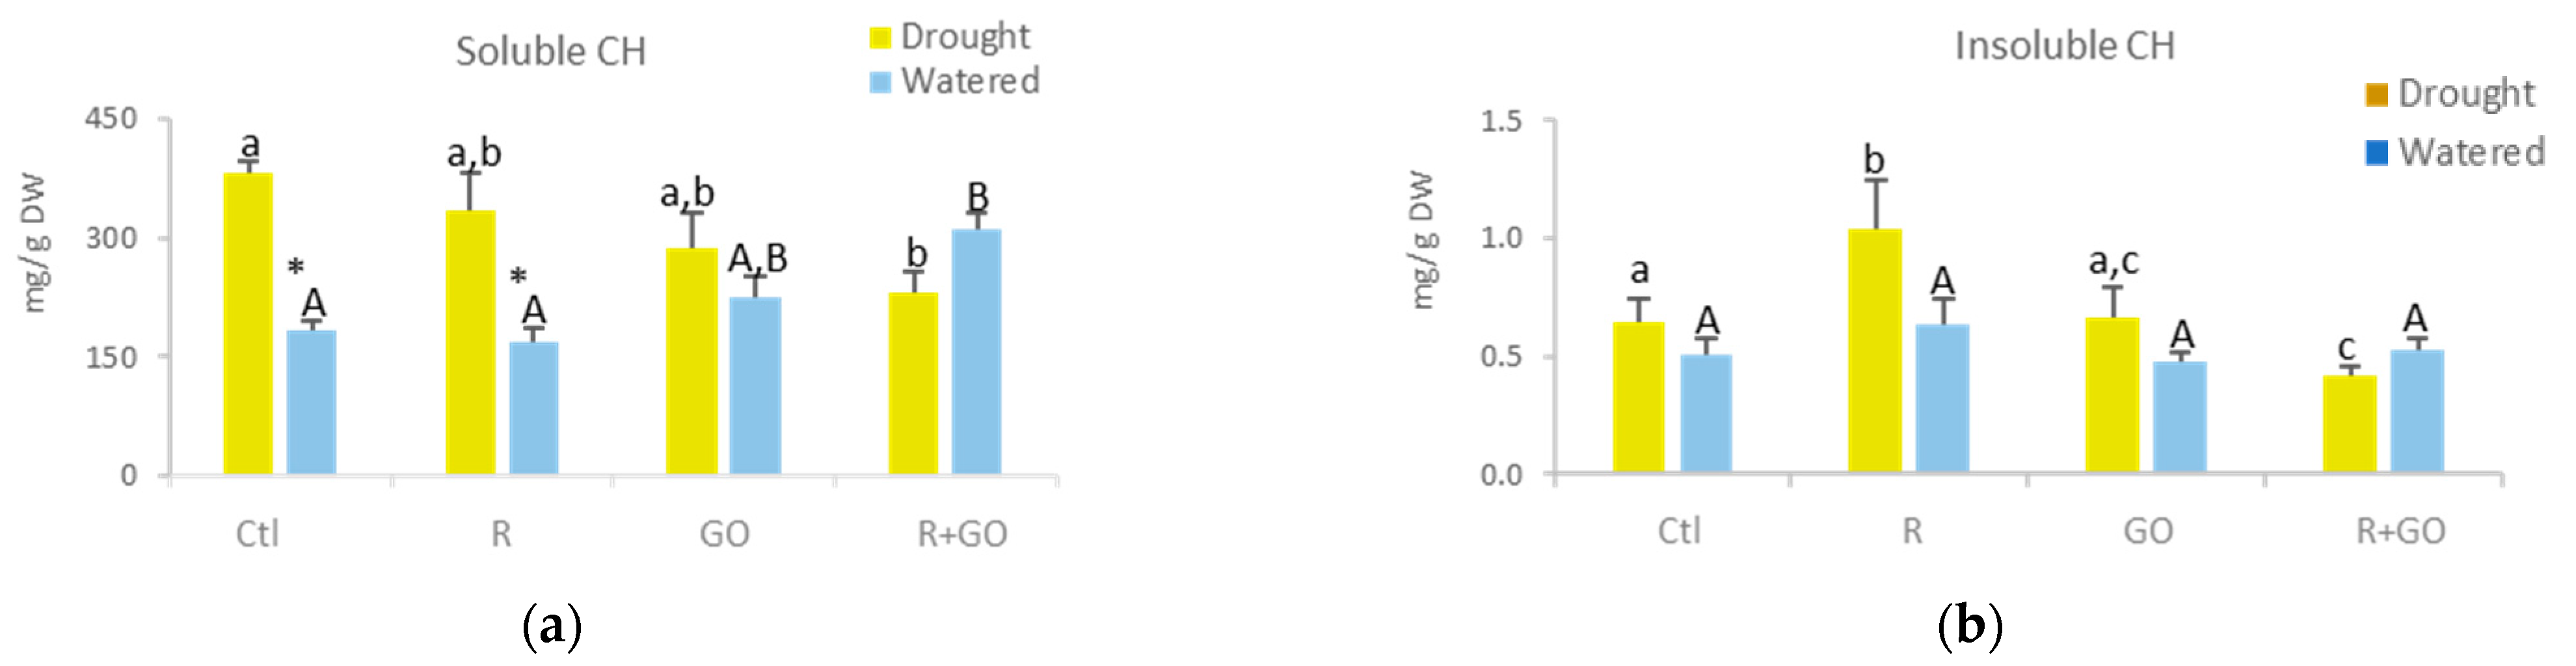
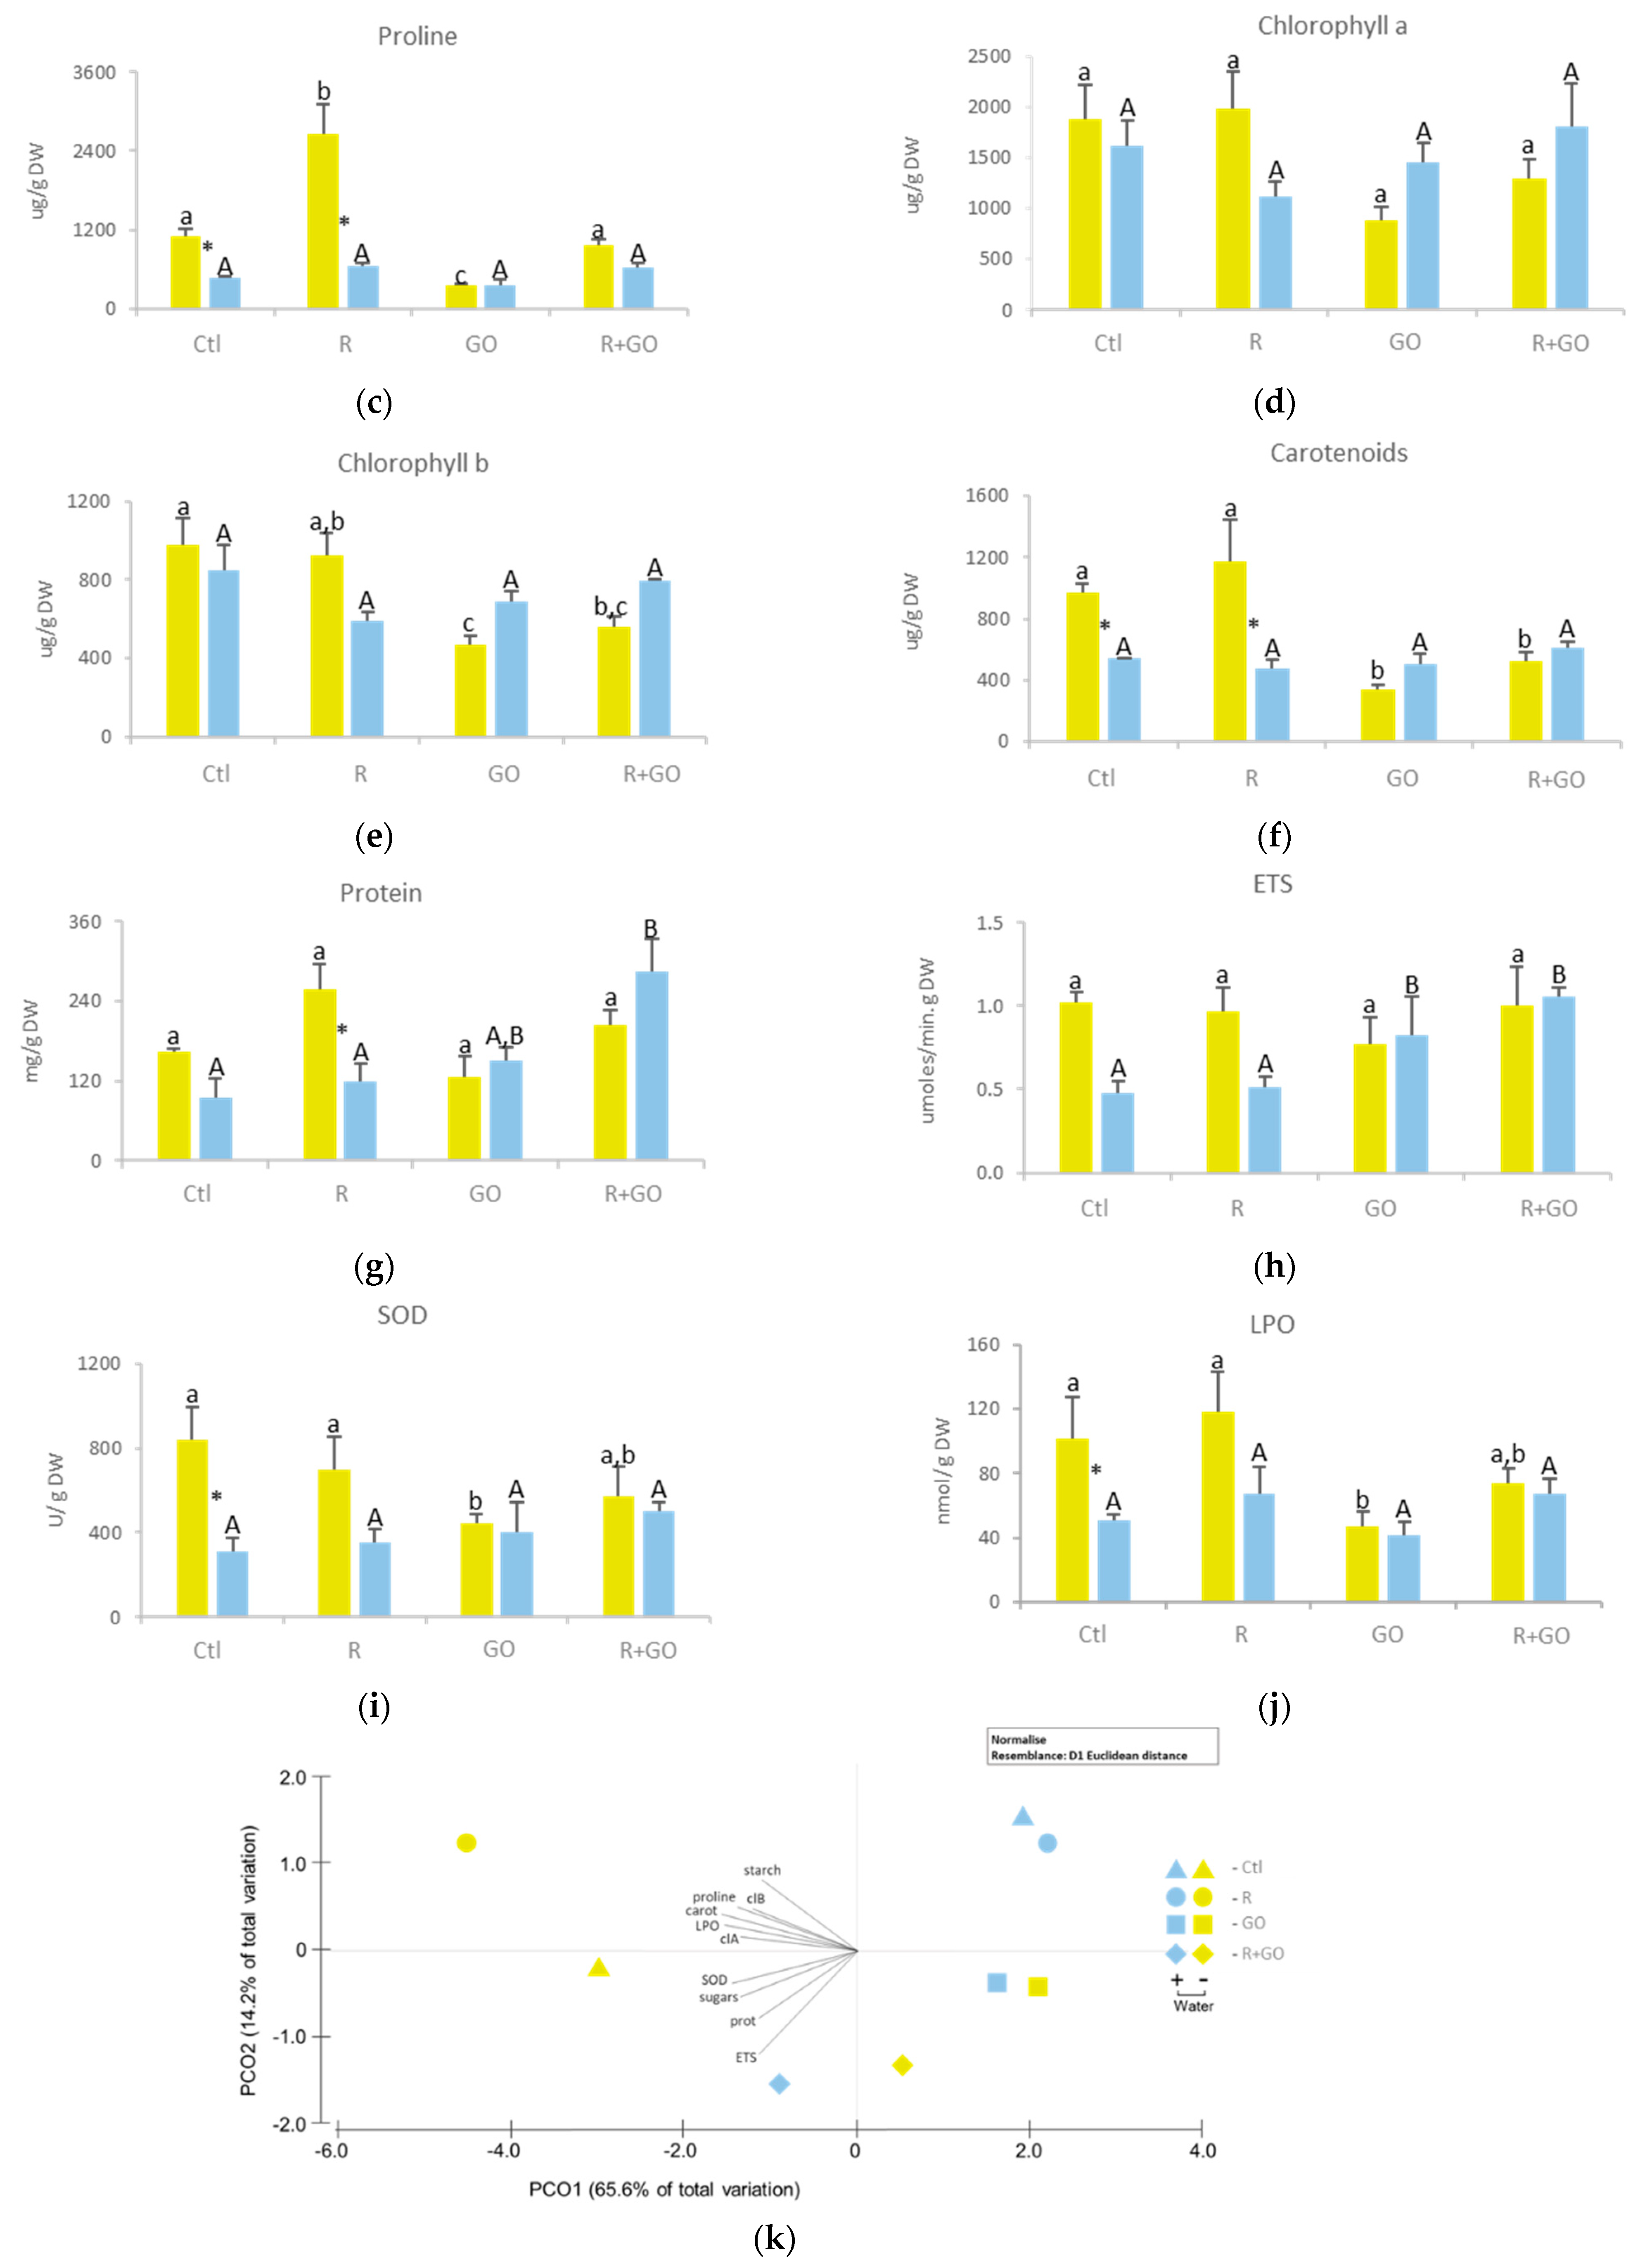
3.5. Biochemical Alterations in Shoots
3.5.1. Soluble and Insoluble Carbohydrates
3.5.2. Proline
3.5.3. Photosynthetic Pigments
3.5.4. Protein Content
3.5.5. ETS
3.5.6. SOD
3.5.7. Lipid Peroxidation
3.5.8. Multivariate Analysis
4. Discussion
5. Conclusions
Supplementary Materials
Author Contributions
Funding
Data Availability Statement
Conflicts of Interest
References
- Intergovernmental Panel on Climate Change 2014—Impacts, Adaptation and Vulnerability: Part A: Global and Sectoral Aspects: Working Group II Contribution to the IPCC Fifth Assessment Report. Available online: https://sci-hub.se/https://www.cambridge.org/core/books/climate-change-2014-impacts-adaptation-and-vulnerability-part-a-global-and-sectoral-aspects/1BE4ED76F97CF3A75C64487E6274783A (accessed on 9 December 2020).
- Vurukonda, S.S.K.P.; Vardharajula, S.; Shrivastava, M.; SkZ, A. Enhancement of Drought Stress Tolerance in Crops by Plant Growth Promoting Rhizobacteria. Microbiol. Res. 2016, 184, 13–24. [Google Scholar] [CrossRef] [PubMed]
- Liu, H.; Carvalhais, L.C.; Crawford, M.; Singh, E.; Dennis, P.G.; Pieterse, C.M.J.; Schenk, P.M. Inner Plant Values: Diversity, Colonization and Benefits from Endophytic Bacteria. Front. Microbiol. 2017, 8, 2552. [Google Scholar] [CrossRef] [PubMed]
- Etesami, H.; Mirsyed Hosseini, H.; Alikhani, H.A. In Planta Selection of Plant Growth Promoting Endophytic Bacteria for Rice (Oryza sativa L.). J. Soil Sci. Plant Nutr. 2014, 14, 491–503. [Google Scholar] [CrossRef]
- Feng, Y.; Shen, D.; Song, W. Rice Endophyte Pantoea agglomerans YS19 Promotes Host Plant Growth and Affects Allocations of Host Photosynthates. J. Appl. Microbiol. 2006, 100, 938–945. [Google Scholar] [CrossRef] [PubMed]
- Dunham, T.; Dunham, W.; Trimmer, M. Biological Products Around the World, Bioproducts Industry Alliance Spring Meeting & International Symposium. Available online: www.bpia.org (accessed on 13 January 2021).
- Shoham, J. The Rise of Biological Products in the Crop Protection and Plant Nutrition Markets. Outlooks Pest Manag. 2020, 31, 129–131. [Google Scholar] [CrossRef]
- Perreault, F.; de Faria, A.F.; Elimelech, M. Environmental Applications of Graphene-Based Nanomaterials. Chem. Soc. Rev. 2015, 44, 5861–5896. [Google Scholar] [CrossRef] [PubMed]
- Marrone, P.G. Pesticidal Natural Products—Status and Future Potential. Pest Manag. Sci. 2019, 75, 2325–2340. [Google Scholar] [CrossRef] [PubMed]
- Dittmar, H.; Kiiski, H.; Drach, M.; Vosskamp, R.; Trenkel, M.E.; Gutser, R.; Steffens, G. Fertilizers, 2. Types. In Ullmann’s Encyclopedia of Industrial Chemistry; American Cancer Society: Atlanta, GA, USA, 2016; pp. 1–53. ISBN 978-3-527-30673-2. [Google Scholar]
- Geim, A.K. Graphene: Status and Prospects. Science 2009, 324, 1530–1534. [Google Scholar] [CrossRef] [Green Version]
- Bandyopadhyay, S.; Peralta-Videa, J.R.; Gardea-Torresdey, J.L. Advanced Analytical Techniques for the Measurement of Nanomaterials in Food and Agricultural Samples: A Review. Environ. Eng. Sci. 2013, 30, 118–125. [Google Scholar] [CrossRef]
- Begum, P.; Ikhtiari, R.; Fugetsu, B. Potential Impact of Multi-Walled Carbon Nanotubes Exposure to the Seedling Stage of Selected Plant Species. Nanomaterials 2014, 4, 203–221. [Google Scholar] [CrossRef] [PubMed] [Green Version]
- Service, R.F. Materials Science. Carbon Sheets an Atom Thick Give Rise to Graphene Dreams. Science 2009, 324, 875–877. [Google Scholar] [CrossRef] [PubMed]
- Lee, J.H.; Han, J.H.; Kim, J.H.; Kim, B.; Bello, D.; Kim, J.K.; Lee, G.H.; Sohn, E.K.; Lee, K.; Ahn, K.; et al. Exposure Monitoring of Graphene Nanoplatelets Manufacturing Workplaces. Inhal. Toxicol. 2016, 28, 281–291. [Google Scholar] [CrossRef] [PubMed]
- Cheng, F.; Liu, Y.-F.; Lu, G.-Y.; Zhang, X.-K.; Xie, L.-L.; Yuan, C.-F.; Xu, B.-B. Graphene Oxide Modulates Root Growth of Brassica napus L. and Regulates ABA and IAA Concentration. J. Plant Physiol. 2016, 193, 57–63. [Google Scholar] [CrossRef] [PubMed]
- Siddiqi, K.S.; Husen, A. Plant Response to Engineered Metal Oxide Nanoparticles. Nanoscale Res. Lett. 2017, 12, 92. [Google Scholar] [CrossRef] [PubMed] [Green Version]
- Juárez-Maldonado, A.; Ortega-Ortíz, H.; Morales-Díaz, A.B.; González-Morales, S.; Morelos-Moreno, Á.; Cabrera-De la Fuente, M.; Sandoval-Rangel, A.; Cadenas-Pliego, G.; Benavides-Mendoza, A. Nanoparticles and Nanomaterials as Plant Biostimulants. Int. J. Mol. Sci. 2019, 20, 162. [Google Scholar] [CrossRef] [PubMed] [Green Version]
- Chen, J.; Peng, H.; Wang, X.; Shao, F.; Yuan, Z.; Han, H. Graphene Oxide Exhibits Broad-Spectrum Antimicrobial Activity against Bacterial Phytopathogens and Fungal Conidia by Intertwining and Membrane Perturbation. Nanoscale 2014, 6, 1879–1889. [Google Scholar] [CrossRef] [PubMed]
- Musico, Y.L.F.; Santos, C.M.; Dalida, M.L.P.; Rodrigues, D.F. Surface Modification of Membrane Filters Using Graphene and Graphene Oxide-Based Nanomaterials for Bacterial Inactivation and Removal. ACS Sustain. Chem. Eng. 2014, 2, 1559–1565. [Google Scholar] [CrossRef]
- Gurunathan, S.; Han, J.W.; Dayem, A.A.; Eppakayala, V.; Kim, J.-H. Oxidative Stress-Mediated Antibacterial Activity of Graphene Oxide and Reduced Graphene Oxide in Pseudomonas aeruginosa. Int. J. Nanomed. 2012, 7, 5901–5914. [Google Scholar] [CrossRef] [PubMed] [Green Version]
- Gurunathan, S.; Han, J.W.; Dayem, A.A.; Eppakayala, V.; Park, M.-R.; Kwon, D.-N.; Kim, J.-H. Antibacterial activity of dithiothreitol reduced graphene oxide. J. Ind. Eng. Chem. 2013, 19, 1280–1288. [Google Scholar] [CrossRef]
- Kang, S.; Mauter, M.S.; Elimelech, M. Physicochemical Determinants of Multiwalled Carbon Nanotube Bacterial Cytotoxicity. Environ. Sci. Technol. 2008, 42, 7528–7534. [Google Scholar] [CrossRef] [PubMed]
- Pasquini, L.M.; Hashmi, S.M.; Sommer, T.J.; Elimelech, M.; Zimmerman, J.B. Impact of Surface Functionalization on Bacterial Cytotoxicity of Single-Walled Carbon Nanotubes. Environ. Sci. Technol. 2012, 46, 6297–6305. [Google Scholar] [CrossRef]
- Liu, X.; Sen, S.; Liu, J.; Kulaots, I.; Geohegan, D.; Kane, A.; Puretzky, A.A.; Rouleau, C.M.; More, K.L.; Palmore, G.T.R.; et al. Antioxidant Deactivation on Graphenic Nanocarbon Surfaces. Small Weinh. Bergstr. Ger. 2011, 7, 2775–2785. [Google Scholar] [CrossRef] [Green Version]
- Yilihamu, A.; Ouyang, B.; Ouyang, P.; Bai, Y.; Zhang, Q.; Shi, M.; Guan, X.; Yang, S.-T. Interaction between Graphene Oxide and Nitrogen-Fixing Bacterium Azotobacter chroococcum: Transformation, Toxicity and Nitrogen Fixation. Carbon 2020, 160, 5–13. [Google Scholar] [CrossRef]
- Zhao, G.; Li, J.; Ren, X.; Chen, C.; Wang, X. Few-Layered Graphene Oxide Nanosheets As Superior Sorbents for Heavy Metal Ion Pollution Management. Environ. Sci. Technol. 2011, 45, 10454–10462. [Google Scholar] [CrossRef] [PubMed]
- Sitko, R.; Turek, E.; Zawisza, B.; Malicka, E.; Talik, E.; Heimann, J.; Gagor, A.; Feist, B.; Wrzalik, R. Adsorption of Divalent Metal Ions from Aqueous Solutions Using Graphene Oxide. Dalton Trans. 2013, 42, 5682–5689. [Google Scholar] [CrossRef] [PubMed]
- Zhao, G.; Ren, X.; Gao, X.; Tan, X.; Li, J.; Chen, C.; Huang, Y.; Wang, X. Removal of Pb (Ii) Ions from Aqueous Solutions on Few-Layered Graphene Oxide Nanosheets. Dalton Trans. 2011, 40, 10945. [Google Scholar] [CrossRef]
- Wang, H.; Yuan, X.; Wu, Y.; Huang, H.; Zeng, G.; Liu, Y.; Wang, X.; Lin, N.; Qi, Y. Adsorption Characteristics and Behaviors of Graphene Oxide for Zn(II) Removal from Aqueous Solution. Appl. Surf. Sci. 2013, 279, 432–440. [Google Scholar] [CrossRef]
- Figueira, E.M.A.P. Aspectos da Tolerância Salina em Pisum sativum L.: Influência da Nutrição Azotada. Ph.D. Thesis, Universidade de Aveiro, Aveiro, Portugal, 2000. [Google Scholar]
- Cardoso, P.; Alves, A.; Silveira, P.; Sá, C.; Fidalgo, C.; Freitas, R.; Figueira, E. Bacteria from Nodules of Wild Legume Species: Phylogenetic Diversity, Plant Growth Promotion Abilities and Osmotolerance. Sci. Total Environ. 2018, 645, 1094–1102. [Google Scholar] [CrossRef]
- Cardoso, P.; Freitas, R.; Figueira, E. Salt Tolerance of Rhizobial Populations from Contrasting Environmental Conditions: Understanding the Implications of Climate Change. Ecotoxicology 2015, 24, 143–152. [Google Scholar] [CrossRef]
- Gee, G.W.; Campbell, M.D.; Campbell, G.S.; Campbell, J.H. Rapid Measurement of Low Soil Water Potentials Using a Water Activity Meter. Soil Sci. Soc. Am. J. 1992, 56, 1068–1070. [Google Scholar] [CrossRef]
- Wellburn, A.R.; Lichtenthaler, H. Formulae and Program to Determine Total Carotenoids and Chlorophylls A and B of Leaf Extracts in Different Solvents. In Advances in Photosynthesis Research, Proceedings of the VIth International Congress on Photosynthesis, Brussels, Belgium, 1–6 August 1983; Sybesma, C., Ed.; Advances in Agricultural Biotechnology; Springer Netherlands: Dordrecht, The Netherlands, 1984; Volume 2, pp. 9–12. ISBN 978-94-017-6368-4. [Google Scholar]
- Chow, P.S.; Landhäusser, S.M. A Method for Routine Measurements of Total Sugar and Starch Content in Woody Plant Tissues. Tree Physiol. 2004, 24, 1129–1136. [Google Scholar] [CrossRef]
- Dubois, M.; Gilles, K.A.; Hamilton, J.K.; Rebers, P.A.; Smith, F. Colorimetric Method for Determination of Sugars and Related Substances. Anal. Chem. 1956, 28, 350–356. [Google Scholar] [CrossRef]
- Bates, L.S.; Waldren, R.P.; Teare, I.D. Rapid Determination of Free Proline for Water-Stress Studies. Plant Soil 1973, 39, 205–207. [Google Scholar] [CrossRef]
- Buege, J.A.; Aust, S.D. Microsomal lipid peroxidation. In Methods in Enzymology; Fleischer, S., Packer, L., Eds.; Biomembranes—Part C: Biological Oxidations; Academic Press: Cambridge, MA, USA, 1978; Volume 52, pp. 302–310. [Google Scholar]
- Robinson, H.W.; Hogden, C.G. The Biuret Reaction in the Determination of Serum Proteins I. A Study of the Conditions Necessary for the Production of a Stable Color Which Bears a Quantitative Relationship to the Protein Concentration. Biol. Chem. 1940, 135, 707–725. [Google Scholar] [CrossRef]
- King, F.D.; Packard, T.T. Respiration and the Activity of the Respiratory Electron Transport System in Marine Zooplankton1. Limnol. Oceanogr. 1975, 20, 849–854. [Google Scholar] [CrossRef]
- De Coen, W.M.; Janssen, C.R. The use of biomarkers in Daphnia magna toxicity testing. IV. Cellular Energy Allocation: A new methodology to assess the energy budget of toxicant-stressed Daphnia populations. J. Aquat. Ecosyst. Stress Recovery 1997, 6, 43–55. [Google Scholar] [CrossRef]
- Beauchamp, C.; Fridovich, I. Superoxide Dismutase: Improved Assays and an Assay Applicable to Acrylamide Gels. Anal. Biochem. 1971, 44, 276–287. [Google Scholar] [CrossRef]
- Park, S.; Choi, K.S.; Kim, S.; Gwon, Y.; Kim, J. Graphene Oxide-Assisted Promotion of Plant Growth and Stability. Nanomaterials 2020, 10, 758. [Google Scholar] [CrossRef] [Green Version]
- Du, J.; Wang, T.; Zhou, Q.; Hu, X.; Wu, J.; Li, G.; Li, G.; Hou, F.; Wu, Y. Graphene Oxide Enters the Rice Roots and Disturbs the Endophytic Bacterial Communities. Ecotoxicol. Environ. Saf. 2020, 192, 110304. [Google Scholar] [CrossRef]
- Liu, S.; Hu, M.; Zeng, T.H.; Wu, R.; Jiang, R.; Wei, J.; Wang, L.; Kong, J.; Chen, Y. Lateral Dimension-Dependent Antibacterial Activity of Graphene Oxide Sheets. Langmuir ACS J. Surf. Colloids 2012, 28, 12364–12372. [Google Scholar] [CrossRef]
- Neklyudov, V.V.; Khafizov, N.R.; Sedov, I.A.; Dimiev, A.M. New Insights into the Solubility of Graphene Oxide in Water and Alcohols. Phys. Chem. Chem. Phys. 2017, 19, 17000–17008. [Google Scholar] [CrossRef] [Green Version]
- Zhao, S.; Wang, Q.; Zhao, Y.; Rui, Q.; Wang, D. Toxicity and Translocation of Graphene Oxide in Arabidopsis thaliana. Environ. Toxicol. Pharmacol. 2015, 39, 145–156. [Google Scholar] [CrossRef]
- Jarzyniak, K.; Jasinski, M. Membrane Transporters and Drought Resistance—A Complex Issue. Front. Plant Sci. 2014, 5. [Google Scholar] [CrossRef] [Green Version]
- Taiz, L.; Zeiger, E. Plant Physiology, 5th ed.; Sinauer Associates., Inc. (23 Plum Tree Road): Sunderland, MA, USA, 2010. [Google Scholar]
- Cho, S.M.; Kang, B.R.; Han, S.H.; Anderson, A.J.; Park, J.-Y.; Lee, Y.-H.; Cho, B.H.; Yang, K.-Y.; Ryu, C.-M.; Kim, Y.C. 2R,3R-Butanediol, a Bacterial Volatile Produced by Pseudomonas chlororaphis O6, Is Involved in Induction of Systemic Tolerance to Drought in Arabidopsis thaliana. Mol. Plant-Microbe Interact. MPMI 2008, 21, 1067–1075. [Google Scholar] [CrossRef] [Green Version]
- Hu, X.; Lu, K.; Mu, L.; Kang, J.; Zhou, Q. Interactions between Graphene Oxide and Plant Cells: Regulation of Cell Morphology, Uptake, Organelle Damage, Oxidative Effects and Metabolic Disorders. Carbon 2014, 80, 665–676. [Google Scholar] [CrossRef]
- Liu, Q.; Zhao, Y.; Wan, Y.; Zheng, J.; Zhang, X.; Wang, C.; Fang, X.; Lin, J. Study of the Inhibitory Effect of Water-Soluble Fullerenes on Plant Growth at the Cellular Level. ACS Nano 2010, 4, 5743–5748. [Google Scholar] [CrossRef]
- Liu, Q.; Zhang, X.; Zhao, Y.; Lin, J.; Shu, C.; Wang, C.; Fang, X. Fullerene-Induced Increase of Glycosyl Residue on Living Plant Cell Wall. Environ. Sci. Technol. 2013, 47, 7490–7498. [Google Scholar] [CrossRef]
- Zhou, Q.; Hu, X. Systemic Stress and Recovery Patterns of Rice Roots in Response to Graphene Oxide Nanosheets. Environ. Sci. Technol. 2017, 51, 2022–2030. [Google Scholar] [CrossRef] [PubMed]
- Hu, X.; Mu, L.; Kang, J.; Lu, K.; Zhou, R.; Zhou, Q. Humic Acid Acts as a Natural Antidote of Graphene by Regulating Nanomaterial Translocation and Metabolic Fluxes In Vivo. Environ. Sci. Technol. 2014, 48, 6919–6927. [Google Scholar] [CrossRef]
- Zhang, P.; Zhang, R.; Fang, X.; Song, T.; Cai, X.; Liu, H.; Du, S. Toxic Effects of Graphene on the Growth and Nutritional Levels of Wheat (Triticum aestivum L.): Short- and Long-Term Exposure Studies. J. Hazard. Mater. 2016, 317, 543–551. [Google Scholar] [CrossRef] [PubMed]
- Zhao, J.; Wang, Z.; White, J.C.; Xing, B. Graphene in the Aquatic Environment: Adsorption, Dispersion, Toxicity and Transformation. Environ. Sci. Technol. 2014, 48, 9995–10009. [Google Scholar] [CrossRef] [PubMed]
- Munné-Bosch, S. The Role of α-Tocopherol in Plant Stress Tolerance. J. Plant Physiol. 2005, 162, 743–748. [Google Scholar] [CrossRef] [PubMed]
- Foyer, C.H.; Noctor, G. Redox Sensing and Signalling Associated with Reactive Oxygen in Chloroplasts, Peroxisomes and Mitochondria. Physiol. Plant. 2003, 119, 355–364. [Google Scholar] [CrossRef] [Green Version]


Publisher’s Note: MDPI stays neutral with regard to jurisdictional claims in published maps and institutional affiliations. |
© 2021 by the authors. Licensee MDPI, Basel, Switzerland. This article is an open access article distributed under the terms and conditions of the Creative Commons Attribution (CC BY) license (http://creativecommons.org/licenses/by/4.0/).
Share and Cite
Lopes, T.; Cruz, C.; Cardoso, P.; Pinto, R.; Marques, P.A.A.P.; Figueira, E. A Multifactorial Approach to Untangle Graphene Oxide (GO) Nanosheets Effects on Plants: Plant Growth-Promoting Bacteria Inoculation, Bacterial Survival, and Drought. Nanomaterials 2021, 11, 771. https://0-doi-org.brum.beds.ac.uk/10.3390/nano11030771
Lopes T, Cruz C, Cardoso P, Pinto R, Marques PAAP, Figueira E. A Multifactorial Approach to Untangle Graphene Oxide (GO) Nanosheets Effects on Plants: Plant Growth-Promoting Bacteria Inoculation, Bacterial Survival, and Drought. Nanomaterials. 2021; 11(3):771. https://0-doi-org.brum.beds.ac.uk/10.3390/nano11030771
Chicago/Turabian StyleLopes, Tiago, Catarina Cruz, Paulo Cardoso, Ricardo Pinto, Paula A. A. P. Marques, and Etelvina Figueira. 2021. "A Multifactorial Approach to Untangle Graphene Oxide (GO) Nanosheets Effects on Plants: Plant Growth-Promoting Bacteria Inoculation, Bacterial Survival, and Drought" Nanomaterials 11, no. 3: 771. https://0-doi-org.brum.beds.ac.uk/10.3390/nano11030771