Article

Preparation of Fe3O4-Ag Nanocomposites with Silver Petals for SERS Application

1
Vietnam Academy of Science and Technology, Graduate University of Science and Technology, 18 Hoang Quoc Viet, Cau Giay, Hanoi 10000, Vietnam
2
Institute of Physics, Vietnam Academy of Science and Technology, 18 Hoang Quoc Viet, Cau Giay, Hanoi 10000, Vietnam
3
ITODYS, Université de Paris, CNRS, UMR 7086, 15 rue J-A de Baïf, 75013 Paris, France
4
Institute of Materials Science, Vietnam Academy of Science and Technology, 18 Hoang Quoc Viet, Cau Giay, Hanoi 10000, Vietnam
5
Faculty of Engineering Physics and Nanotechnology, VNU University of Engineering and Technology, 144 Xuan Thuy, Cau Giay, Hanoi 10000, Vietnam
*
Author to whom correspondence should be addressed.
Submission received: 25 March 2021 / Revised: 20 April 2021 / Accepted: 10 May 2021 / Published: 13 May 2021

Abstract

:
The formation of silver nanopetal-Fe3O4 poly-nanocrystals assemblies and the use of the resulting hetero-nanostructures as active substrates for Surface Enhanced Raman Spectroscopy (SERS) application are here reported. In practice, about 180 nm sized polyol-made Fe3O4 spheres, constituted by 10 nm sized crystals, were functionalized by (3-aminopropyl)triethoxysilane (APTES) to become positively charged, which can then electrostatically interact with negatively charged silver seeds. Silver petals were formed by seed-mediated growth in presence of Ag+ cations and self-assembly, using L-ascorbic acid (L-AA) and polyvinyl pyrrolidone (PVP) as mid-reducing and stabilizing agents, respectively. The resulting plasmonic structure provides a rough surface with plenty of hot spots able to locally enhance significantly any applied electrical field. Additionally, they exhibited a high enough saturation magnetization with Ms = 9.7 emu g−1 to be reversibly collected by an external magnetic field, which shortened the detection time. The plasmonic property makes the engineered Fe3O4-Ag architectures particularly valuable for magnetically assisted ultra-sensitive SERS sensing. This was unambiguously established through the successful detection, in water, of traces, (down to 10−10 M) of Rhodamine 6G (R6G), at room temperature.

Graphical Abstract

1. Introduction

Surface-Enhanced Raman Spectroscopy (SERS) is one of the most popular optical-based analytical techniques for the detection of chemical and biological molecular traces [1,2,3,4,5]. SERS performed using sensitive substrates can provide specific fingerprint information for molecular recognition at the single molecule level. According to the SERS mechanism, rough surfaces including tips, vertex regions of plasmonic nanostructures, possessing more free electrons, can generate stronger localized surface plasmonic resonance (SPR) compared to smooth ones. The oscillation of free electrons in such regions are excited by an electromagnetic field such laser light, leading to a significant enhancement of the localized electromagnetic field for high SERS activity. Thus, many approaches have been developed to synthesize such anisotropic structures as nanostars, nanorods, nanotriangles, nanoplates, or nanosheets of gold [6,7,8], silver [9,10,11,12], or a mix of them [13,14]. For SERS applications, the integration of iron oxide component to these plasmonic structures is receiving great attention [15,16,17] since they offer the opportunity to selectively enrich the target molecules and to separate magnetically the desired substrate from the whole matrix. The detection procedure becomes simple and facilitates the cyclical use of the resulting SERS substrate.
Many approaches have been proposed focusing on the growth of an anisotropic plasmonic metal shell on an iron oxide core. One of them consists of a pre-coating of the iron oxide cores by a non-magnetic thin shell, like silica [18], graphite [19], graphene oxide [20], or titania [21] among others, before the attachment of noble metal seeds attachment and the further continuous noble metal shell growth. Despite this method is chemically effective, it leads to a net decrease of the whole magnetization due to the strong diamagnetic inter-shell contribution. This may be avoided by attaching directly, covalently, or electrostatically, preformed Ag or Au nanocrystals, which are then subsequently used to promote anisotropic metal seed-mediated growth. In this case, weak reducing agents such as L-ascorbic acid or hydroquinone were often required [22]. Polymer dispersing agents like polyvinyl pyrrolidone (PVP) introduced during the metal growth may also act as a structure-directing agent to control the final metal morphology [22]. The role of halides, in promoting a strongly crystal-facet dependent metal growth, was also highlighted, particularly when the reduction proceeds in presence of cationic surfactants such as cetyltrimethylammonium cation (CTA+) [23]. Halides may direct surfactant molecules adsorption and consequently metal nanocrystal anisotropic growth. Alternatively, an isotropic metal seed-mediated growth may be achieved and followed by a controlled etching step to reach the desired anisotropic metal morphology [24].
This non-exhaustive list of previous research papers is representative of the main existing material processing protocols in the relevant literature. So, in this study, we chose to focus on the Fe3O4-Ag system instead of the Fe3O4-Au, for which much more studies were already dedicated [22,25,26]. Some Fe3O4-Ag structures have been developed, consisting of core-satellites [27], Janus [28], microflowers [29], etc. These anisotropic structures were expected to present excellent SERS activities because rough surface and to be suitable for magnetic separation. However, the strategies for the fabrication of anisotropic silver on Fe3O4 surface are still a challenge, such types of structures have been uncommonly reported.
We prepared highly magnetized poly- and nano-crystalline magnetic oxide cores surrounded by an anisotropic in-shape plasmonic shell, rough enough to provide a great number of hot spots able to be used as smart substrates for magnetically assisted ultra-sensitive SERS detection. As a case study, we report here the SERS results we obtained on Rhodamine 6G (R6G) trace detection in water at room temperature (down to 10−10 M). In brief, our magneto-plasmonic architectures were provided by a facile synthesis of submicrometer-sized Fe3O4 particles in polyol, followed by grafting ammonium groups on their surface, through silane chemistry, to make them positively charged, and promoting thus electrostatic bonding to negatively charged ultra-small silver nanocrystals. The formation of the Ag petals in a 3D-dimensional plane onto the iron oxide cores was carried out through seed-mediated and self-assembly processes by reducing the dissolved AgNO3 salt with L-ascorbic acid in the presence of PVP. The achieved microstructural characteristics of these engineered Fe3O4-Ag nanocomposites were found to be suitable for the desired application: (a) They possess a strong magnetic responsiveness, allowing their magnetic collection by a lab magnet when contacted in a solution with a given analyte, allowing their use as SERS platforms; (b) They possess a multi-hot spots surface allowing a significant improvement of the Raman signature of the adsorbed analyte.

2. Materials and Methods

2.1. Materials

Silver nitrate (AgNO3, 99%), sodium borohydride (NaBH4, 98%), and rhodamine 6G (C28H31N2O3Cl, 99%) were purchased from Sigma-Aldrich. L-ascorbic acid (Vitamin C, 99.7%), polyvinyl pyrrolidone (PVP, Mw~10,000 g mol−1), and absolute ethanol (98%) were purchased from Merck. Deionized water was used all preparations.

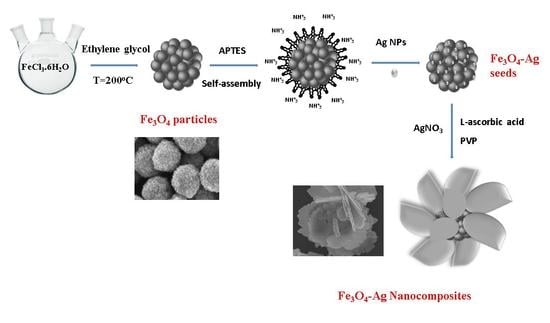
2.2. Synthesis of Fe3O4-Ag Seeds

Poly- and nanocrystalline Fe3O4 particles were prepared using the so-called polyol process (Figure 1) [30]. The resulting particles, of 180 nm in size, are composed of regular shaped tiny primary crystals of ~10 nm in size each (Figure S1). From zeta potentiometry measurements, we can conclude that their functionalization with APTES was successfully achieved using the protocol described by Nguyen et al. [30]. Indeed, zeta potential values of as prepared Fe3O4 particles and those functionalized with APTES were found to be +1.81 mV and +21.7 mV, respectively, in water (Figure S2).
Alongside the preparation of magnetic cores, ultra-small citrate coated Ag nanocrystals were prepared by reducing Ag+ by NaBH4 in water. In practice, 3 mL of trisodium citrate solution (1%) were added to 80 mL of silver nitrate solution (0.01 M). 0.1 mL of NaBH4 solution (2 M) was then dropped under stirring for 10 min. The silver seeds form yellow colloid, which was stored at 4 °C prior to use. The combination of citate-functionalized Ag nanoparticles and amine-functionalized Fe3O4 cores was based on a simple assembly process through electrostatic interactions (Figure 2). In the detail, 0.2 g of amine functionalized Fe3O4 particles were dispersed, by sonication, into 10 mL of deionized water and the resulting suspension was added into the formerly prepared silver colloid, and mechanically stirred for 1 h. The resulting Fe3O4-Ag seeds were then separated by magnetic decantation, washed several times with deionized water and dispersed in deionized water for a subsequent use.
The successful attachment of the negatively charged Ag nanoparticles to the positively charged Fe3O4 ones was corroborated by UV spectroscopy: one could notice the appearance of a shoulder at 400 nm, characteristic of the Ag SPR band in the free Ag spectrum (Figure 2). The silver nanocrystals attachment was underlined by the change in the surface charge of +21.7 mV and −17.7 mV for Fe3O4 coated with APTES and Fe3O4-Ag seeds, respectively (Figure S2).

2.3. Synthesis of Fe3O4-Ag Nanocomposites

Fe3O4-Ag nanocomposites were prepared by the reduction of a fresh AgNO3 aqueous solution in the presence of as-prepared Fe3O4-Ag seeds, PVP, and L-ascorbic acid. The concentrations of PVP, AgNO3, and L-ascorbic acid remain unchanged, while the amount of Fe3O4-Ag seeds was varied. AgNO3/Fe3O4-Ag seeds weight ratio, quoted r, was varied from 10 to 2, maintaining the reaction time constant whatever the value of r.
Then, 1 to 5 mg of Fe3O4-Ag seeds and 0.5 mg of PVP were added to 2 mL of deionized water. The mixture was sonicated and stirred to ensure the dispersion of the particles, and 3.5 mg of L-ascorbic acid was then dissolved into the mixture. Finally, 0.6 mL of an aqueous solution of AgNO3 (0.1 M) was added. The suspension was mechanically stirred continuously for 10 min to ensure the completion of the reaction. The resulting nanocomposites were recovered by magnetic decantation, washed several times with deionized water and dried in air. The same experiments were repeated without adding PVP to the reaction medium and the recovered powders were used as references.

2.4. Preparation of SERS Substrates

About 50 µL (0.5 mg) of as-prepared nanocomposites, prepared with or without PVP, were dispersed in 2 mL of analyte solution for 5 h to ensure the adsorption of the analyte molecules on their surface. The analyte solution consisted of R6G diluted in deionized water at different concentrations equal to 10−5, 10−6, 10−7, 10−8, 10−9, and 10−10 M. Finally, the magnetic nanocomposites were collected by a magnet and transferred to a clean glass surface; they were washed with deionized water while maintained by the magnet on the glass, then dried at 60 °C for 10 min prior to their analysis by SERS.

2.5. Characterizations

SEM was performed on a S-4800 microscope (Hitachi, Kyoto, Japan) applying a voltage of 5 kV. A drop of the sample solution was deposited on the silicon wafer and drying at room temperature. XRD was carried out using a EQUINOX 5000 (Thermo Scientific, Illkirch-Graffenstaden, France) in a θ–θ Bragg–Brentano reflection configuration in the 20–80° 2θ angular range. UV–Vis absorption spectroscopy was achieved using a UV2600 spectrophotometer (Shimadzu, Kyoto, Japan). Absorbance spectra were recorded for wavelengths from 300 nm to 800 nm. DC magnetometry was performed at room temperature on a 7404-VSM vibrating sample magnetometer (Lake Shore, Westerville, OH, USA). In practice, a given mass of each sample is compacted in a diamagnetic sampling tube and introduced into the magnetometer. SERS measurements were conducted on a Raman spectrometer using a 30 mW laser source with an excitation wavelength of 633 nm and light spot diameter of 10 µm. All spectra were taken with an exposure time of 1 s and 10 accumulations, and recorded within the 300–2000 cm−1 spectral range. For each sample, an average of three SERS spectra of the substrate was carried out.

3. Results

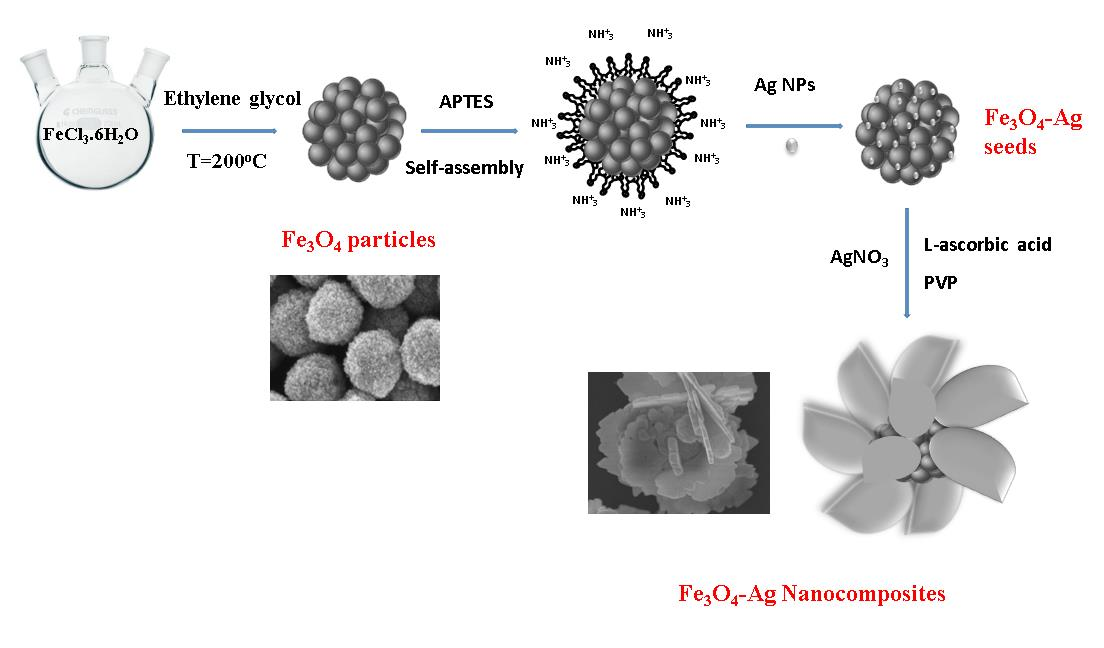
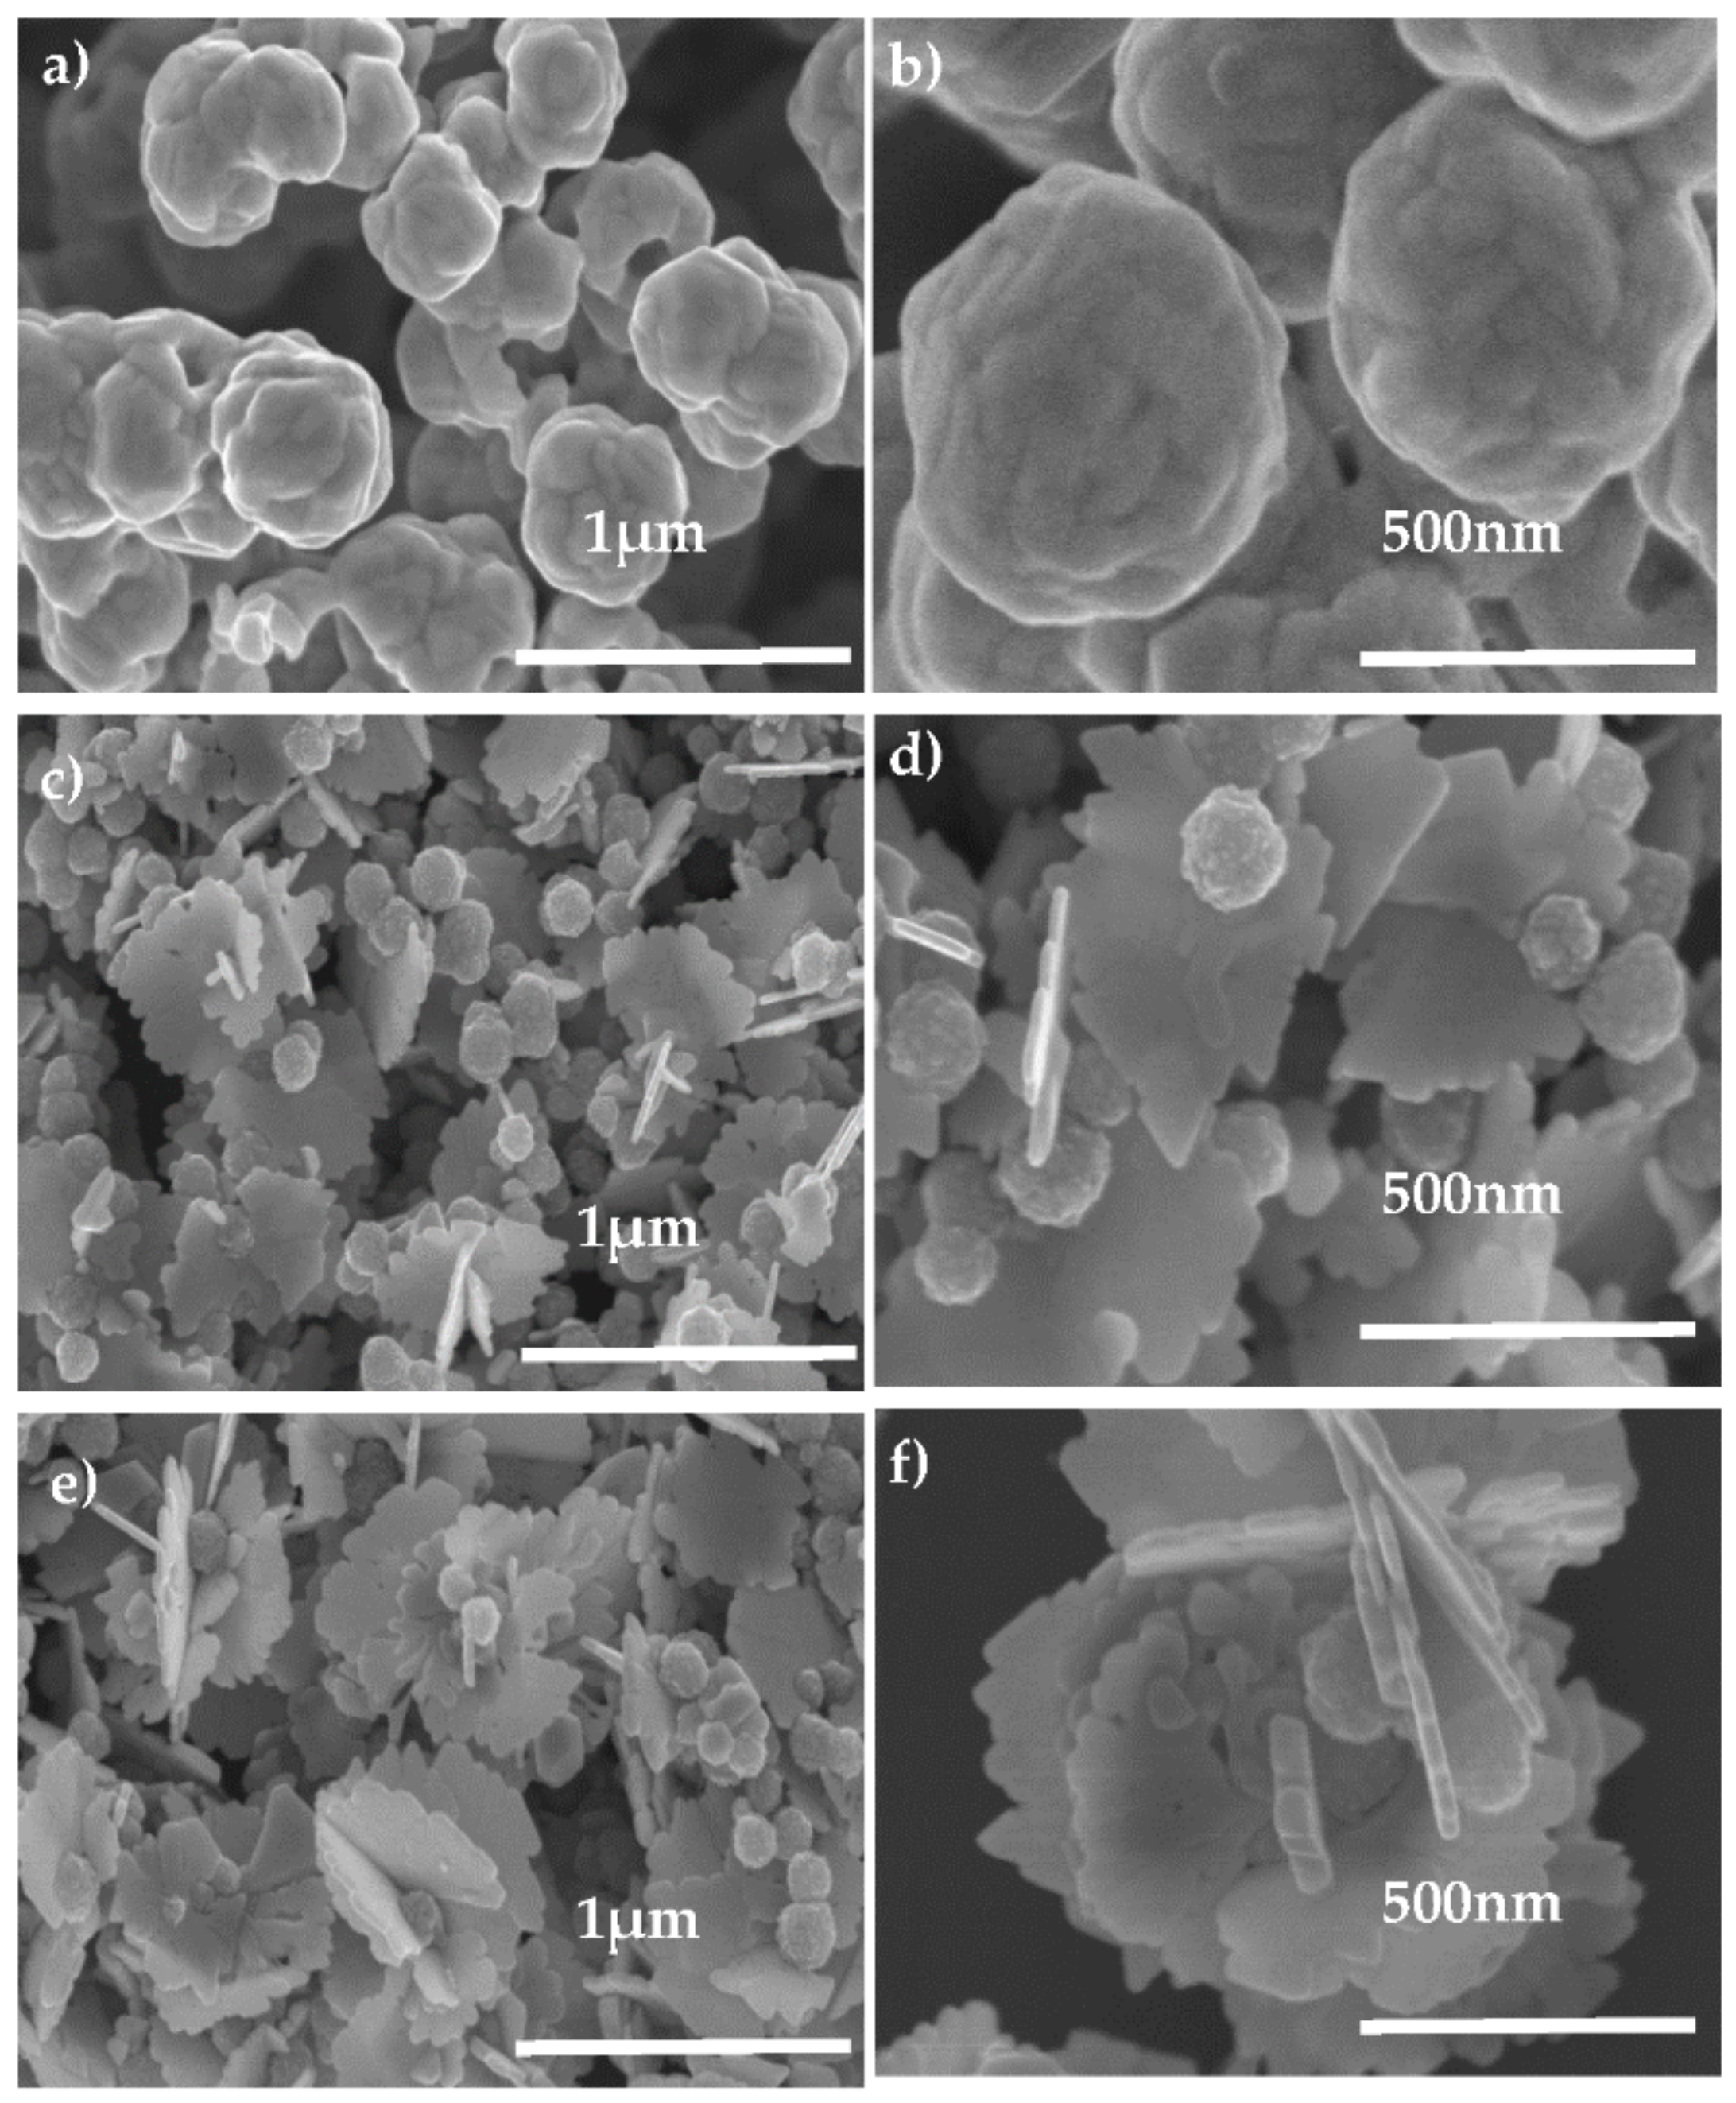
3.1. Phase and Microstructure Analysis of the Engineered Fe3O4-Ag Nanocomposites

The crystal structures of the produced composite particles were checked by XRD. Whatever the r value, using or not PVP during the synthesis, the recorded patterns exhibit two sets of diffraction peaks: a first set with highly intense peaks at 2ϴ positions of 38.31, 44.41, 64.32, and 77.12°, corresponding to the (111), (200), (220), (311), and (222) planes of the cubic face-centered Ag phase, and a second set of peaks with a very weak intensity (Figure 3), particularly at 2ϴ positions of 35.23°, attributed to the (331) planes of the spinel Fe3O4 phase. This peak intensity difference is attributed to the large electronic density of the metallic phase compared to the oxide one. Note that varying the r value does not significantly change the appearance of the patterns: only the intensity of the spinel diffraction line decreases when r increases.
The morphology of the nanocomposites was imaged by SEM. Representative micrographs are given hereafter to illustrate the general shape of the silver shell (Figure 4). Interestingly, the particles produced without PVP appear to be almost isotropic. Rather spherical sub-micrometer-sized particles exhibiting a smooth surface seem to constitute the powders obtained in these conditions: the growth of a continuous Ag shell was achieved by combining molecular self–assembly technique and seed-mediated growth, which took place around Ag seeds present on the surface of Fe3O4 cores. By increasing the r value, a continuous shell progressively covers the surface of all magnetic cores (Figure 4a,b). Reversely, in presence of PVP, the morphology completely changed. A more and more irregular silver structure grows around the spherical magnetic iron oxide cores, as the r value increases, leading to the development of 3D-petals (Figure 4c,d). The size of Ag petals increases from around 300 to 500 nm when the r value increases from 2 to 10, without any change in their petal-like shape. These significant morphological differences between the two-sample series may be explained by the role played by PVP during the fast reduction of a great amount of AgNO3 by L-ascorbic acid, leading to seed-mediated growth of silver on Fe3O4-Ag seed surface rather than silver-nucleation. We suggest that PVP, preferentially adsorbed to the high index silver primary particle faces, mainly the {111} ones, drove oriented self-assembly of these particles, leading to percolating Ag petals on Fe3O4-Ag seed surface. Without PVP, this aggregation was completely random, leading to an isotropic silver growth. EDX was performed on the samples to quantify their Fe and Ag contents. All the recorded spectra evidenced the characteristic peaks of not only Fe and Ag elements, but also of Si from APTES and silicon grid, and C from PVP residue. As expected, the Fe content increased when the ratio r decreased (Table S1 and Figure S3).
UV–Visible absorption spectra of the aqueous suspensions of Fe3O4-Ag nanocomposites confirmed this microstructural difference between the samples prepared with and without PVP. Indeed, all the spectra exhibit a strong and broad absorption related to the plasmonic properties of the silver component (Figure 5); however, in the presence of PVP, absorption was observed for a wavelength of 433 nm while it was observed at 455 nm without using PVP. Moreover, an additional sharp peak appeared at about 343 nm for this last sample series, in good agreement with a plate silver structure [31].
The magnetic properties of all the produced Fe3O4 particles and their related nanocomposites were investigated using VSM magnetometer. The variation of their magnetization as a function of the magnetic field M(H) was measured at room temperature (RT) (Figure 6). The two hysteresis loops were found to be similar, presenting a non-zero but low remanence (<2 emu g−1) and coercivity (<21 Oe) typical of soft ferrimagnets. The magnetization appeared to follow quite reversibly the magnetic field, meaning that they can be easily attracted by applying an external, and even small in magnitude, dc-magnetic field. The saturation magnetization of Fe3O4-Ag seeds was found to be 70.9 emu g−1, a value close to that reported for bare Fe3O4, and it decreased down to 8.9, 36.8, and 9.7 emu g−1 in the Fe3O4-Ag nanocomposites produced without PVP for a r value of 10, with PVP for the different r values of 2 and 10, respectively, due to the diamagnetic silver shell contribution.
Obviously, the higher the amount of silver contained in the nanocomposites, the lower the saturation magnetization; however, it remains satisfactory with regard to the use of samples in magnetic assisted SERS application.

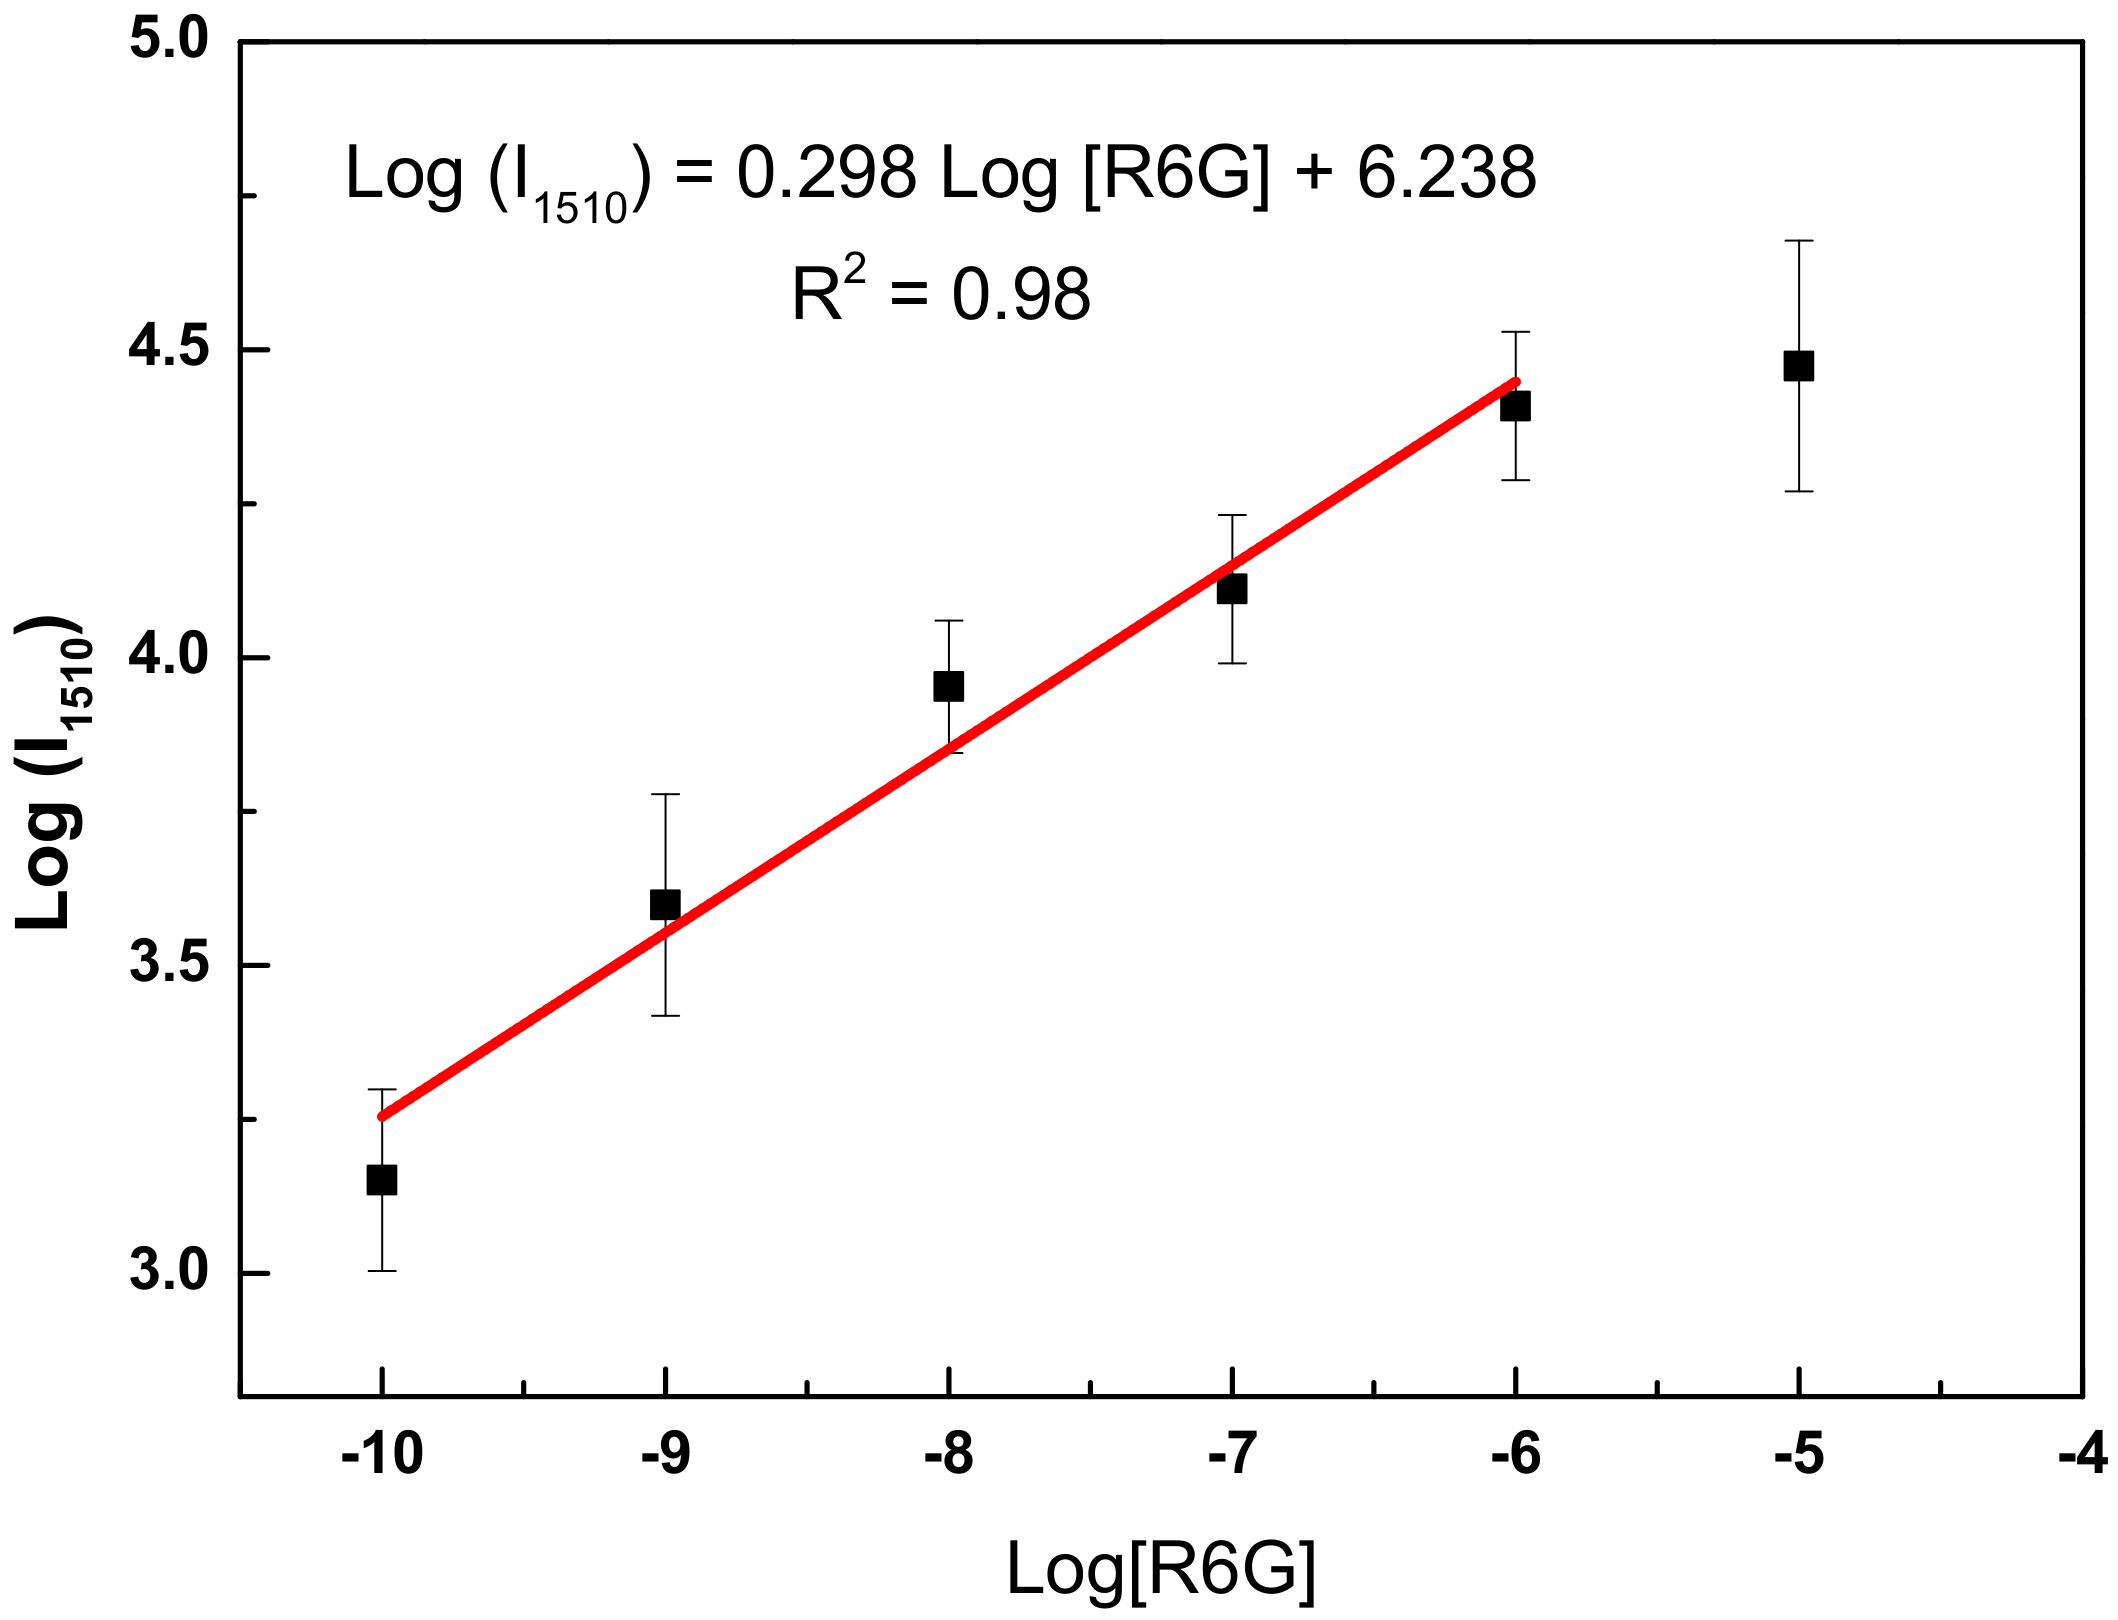
3.2. Application in SERS

Fe3O4-Ag nanocomposites produced using PVP and presenting Ag petal-like shell with a rough surface, are expected to induce a high SERS effect. First, the assisted SERS detection assays were performed with all nanocomposites to determine the best SERS response. In practice, analyte aqueous solutions containing a given contaminant, R6G, at a concentration of 10−6 M, were prepared, in which Fe3O4, Fe3O4-seeds, and Fe3O4-Ag particles were dispersed to get stable suspensions (at least during the contacting to analyte time). They were then collected onto SERS substrates by applying an external magnetic field. Homogeneously distributed aggregates were formed spontaneously on the substrate wafer after water washing and drying. The SERS measurements were subsequently carried out on the as-prepared SERS substrates (Figure S4). Note that Raman spectra were carried out by the average of several collections, for each starting analyte solution, on different positions randomly selected on the surface of Fe3O4-Ag based SERS substrates. Characteristics R6G peaks positioned at 612, 774, and 1185 cm−1 corresponding to the C-C-C ring in-plane bending, C-H out-of-plane bending, C-H in-plane bending, and at 1313, 1363, 1510, and 1654 cm−1 corresponding to aromatic C-C stretching, are clearly evidenced in the collected spectra. Raman spectra performed on Fe3O4-Ag nanocomposites, produced using PVP for a r value of 10, presented the best SERS signal compared to the particles produced using PVP for a r value of 2, or without PVP. Indeed, the highest the r value, the highest the SERS activity, due the more anisotropic morphology that was developed using a higher amount of Ag in presence of PVP.
The concentration of R6G was changed to test Fe3O4-Ag nanocomposites produced with PVP for values of 10 (Figure 7a). Characteristics R6G peaks were also clearly evidenced in the collected Raman spectra; whatever the R6G concentration in the starting analyte solution, traces down to 10−10 M of R6G could be detected. The reproducibility of the SERS substrate is presented in Figure 7b. SERS signals were investigated on a large area, collected randomly 11 times on the substrate. The relative standard deviations (RSD) of SERS intensities at 1510 cm−1 was found to be 16% (Figure S5), which led us to conclude to the uniformity and reproducibility of these measurements.
Focusing on the most intense R6G peak, centered at 1510 cm−1, the plot of the log of its intensity as a function of the log of R6G concentration (Figure 8) shows a quantification region down to 10−10 M with a linear relationship, which can be expressed by Equation (1) and an analytical enhancement factor (AEF) can be deduced using Equation (2):
log(I1510) = 0.298 × log[R6G] + 6.238
AEF = (ISERS/CSERS)/(IRS/CRS)
where ISERS is the SERS signal at CSERS concentration of R6G and IRS is the Raman signal under non-SERS conditions at CRS concentration of R6G. By applying Equations (1) and (2), an AEF of 3 × 10⁷ was found for the engineered magnetic SERS substrates developed in this study. The resulting value is a fairly good compared to SERS substrates fabricated by spherical silver nanoparticles [32,33]. However, the whole SERS community assumed that it is a good qualitative indication of the opportunity to routinely use such a system for rapid trace detection [34]. As a consequence, the engineered Fe3O4-Ag nanocomposites we developed there are clearly good candidates for a sensitive and rapid organic pollutant (e.g., pesticides, and antibiotics) SERS detection.

4. Conclusions

We developed a strategy to prepare Fe3O4-Ag nanocomposites for SERS application. Polyol-made submicrometer-sized poly and nanocrystalline Fe3O4 particles were synthesized through a simple and one-step method. A subsequent Ag petal-like shell growth onto Fe3O4 platforms was carried out through seed-mediated and self-assembly growth by using L-ascorbic acid as mid-reducing agent in a presence of PVP. The resulting hetero-nanostructures exhibited a high enough saturation magnetization (Ms = 9.7 emu g−1), allowing their reversible collection by an external magnetic field, even small in magnitude, at room temperature, as well as a quite rough plasmonic surface with a dense and homogeneous hot spot distribution to serve as magnetically assisted SERS sensors. Indeed, contacted with a R6G analyte solution of different concentrations and then separated by a magnet and deposited on a glass wafer, on which R6G Raman spectra were collected, they evidenced a net R6G SERS detection capability even when starting from a very diluted analyte solution (down to 10−10 M).

Supplementary Materials

The following are available online at https://0-www-mdpi-com.brum.beds.ac.uk/article/10.3390/nano11051288/s1, Figure S1: Representative TEM (a) and SEM (b) images of Fe3O4 particles, Figure S2: Zeta potential distribution of the Fe3O4-Ag seeds compared to that of Fe3O4 particles coated with APTES and when dispersed in deionized water, Figure S3: EDX analysis of: (a) Fe3O4 particles; (b) Fe3O4-Ag seeds; (ce) Fe3O4-Ag nanocomposites produced with PVP for a r value of 10 and 2 and without PVP for a r value of 10, respectively, Figure S4: SERS spectra of R6G at 10−6 adsorbed on (a) Fe3O4-Ag nanocomposites with PVP (r = 10), (b) Fe3O4-Ag nanocomposites with PVP (r = 2), (c) Fe3O4-Ag nanocomposites without PVP (r = 10), (d) Fe3O4-Ag seeds, (e) Fe3O4 particles, Figure S5: SERS intensity of R6G at 10−9 adsorbed on Fe3O4-Ag nanocomposites with PVP (r = 10). Table S1: EDX elemental analysis of Fe3O4 particles, Fe3O4-Ag seeds, Fe3O4-Ag nanocomposites produced with PVP for a r value of 10 and 2, and without PVP for a r value of 10, Table S2: Assignment of Raman bands in spectra of R6G.

Author Contributions

This work is written by T.T.N., F.M., and S.A. The structural and microstructural characterization were carried out by T.T.N. and N.T.T. SERS experiments were performed by T.H.L.N., T.N.N., and T.B.N.N. Magnetic measurements were performed by T.A.H. All authors have read and agreed to the published version of the manuscript.

Funding

This research is funded by Graduate University of Science and Technology under grant number GUST.STS.ĐT2018-VL01. The authors are grateful for the finance supports for this work from the project ĐTĐLCN.05/17 and project under contract number 44/HDD-VHL.

Data Availability Statement

The data presented in this article are available on request from the corresponding authors.

Conflicts of Interest

The authors declare no conflict of interest.

References

  1. Pilot, R.; Signorini, R.; Durante, C.; Orian, L.; Bhamidipati, M.; Fabris, L. A review on surface-enhanced Raman scattering. Biosensors 2019, 9, 57. [Google Scholar] [CrossRef] [Green Version]
  2. Bodelon, G.; Pastoriza-Santos, I. Recent progress in surface-enhanced Raman scattering for the detection of chemical contaminants in water. Front. Chem. 2020, 8, 478. [Google Scholar] [CrossRef] [PubMed]
  3. Gaidi, M.; Daoudi, K.; Tlili, A.; Columbus, S.; Leblanc-Lavoie, J.; Ramachandran, K.; Suleiman, B.; Alhazaa, A.; El Khakani, M. Fast, highly sensitive and label free detection of small genetic sequence difference of DNA using novel Surface-Enhanced Raman Spectroscopy nanostructured sensor. Sens. Bio-Sens. Res. 2021, 32, 100406. [Google Scholar]
  4. Guselnikova, O.; Postnikova, P.; Marque, S.R.A.; Švorčík, V.; Lyutakov, O. Beyond common analytical limits of radicals detection using the functional SERS substrates. Sens. Actuators B Chem. 2019, 300, 127015. [Google Scholar] [CrossRef]
  5. Bruzas, I.; Lum, W.; Gorunmez, Z.; Sagle, L. Advances in surface-enhanced Raman spectroscopy (SERS) substrates for lipid and protein characterization: Sensing and beyond. Analyst 2018, 143, 3990–4008. [Google Scholar] [CrossRef] [PubMed]
  6. Reguera, J.; Langer, J.; Jiménez de Aberasturia, D.; Liz-Marzán, L.M. Anisotropic metal nanoparticles for surface enhanced Raman scattering. Chem. Soc. Rev. 2017, 46, 3866–3885. [Google Scholar] [CrossRef]
  7. Tian, F.; Bonnier, F.; Casey, A.; Shanahana, A.E.; Byrne, H.J. Surface Enhanced Raman Scattering with gold nanoparticles: Effect of particle shape. Anal. Methods 2014, 6, 9116–9123. [Google Scholar] [CrossRef] [Green Version]
  8. Onaciu, A.; Braicu, C.; Zimta, A.-A.; Moldovan, A.; Stiufiuc, R.; Buse, M.; Ciocan, C.; Buduru, S.; Berindan-Neagoe, I. Gold nanorods: From anisotropy to opportunity. An evolution update. Nanomedicine 2019, 14. [Google Scholar] [CrossRef]
  9. Fales, A.M.; Vo-Dinh, T. Silver embedded nanostars for SERS with internal reference (SENSIR). J. Mater. Chem. C 2015, 3, 7319–7324. [Google Scholar] [CrossRef]
  10. Chen, S.; Carroll, D.L. Synthesis and characterization of truncated triangular silver nanoplates. Nano Lett. 2002, 2, 1003–1007. [Google Scholar] [CrossRef]
  11. Chandran, S.P.; Chaudhary, M.; Pasricha, R.; Ahmad, A.; Sastry, M. Synthesis of gold nanotriangles and silver nanoparticles using Aloevera plant extract. Biotechnol. Prog. 2006, 22, 577–583. [Google Scholar] [CrossRef]
  12. Kumar, G.; Soni, R. Silver nanocube-and nanowire-based SERS substrates for ultra-low detection of PATP and thiram molecules. Plasmonics 2020, 15, 1577–1589. [Google Scholar] [CrossRef]
  13. Aliyah, K.; Lyu, J.; Goldmann, C.; Bizien, T.; Hamon, C.; Alloyeau, D.; Constantin, D. Real-time in situ observations reveal a double role for ascorbic acid in the anisotropic growth of silver on gold. J. Phys. Chem. Lett. 2020, 11, 2830–2837. [Google Scholar] [CrossRef]
  14. Maturi, M.; Locatelli, E.; Sambri, L.; Tortorella, S.; Šturm, S.; Kostevšek, N.; Comes Franchini, M. Synthesis of ultrasmall single-crystal gold–silver alloy nanotriangles and their application in photothermal therapy. Nanomaterials 2021, 11, 912. [Google Scholar] [CrossRef]
  15. Qiu, Y.; Deng, D.; Deng, Q.; Wu, P.; Zhang, H.; Cai, C. Synthesis of magnetic Fe3O4-Au hybrids for sensitive SERS detection of cancer cells at low abundance. J. Mater. Chem. B 2015, 3, 4487–4495. [Google Scholar] [CrossRef]
  16. Pang, Y.; Wang, C.; Wang, J.; Sun, Z.; Xiao, R.; Wang, S. Fe3O4@Ag magnetic nanoparticles for microRNA capture and duplex-specific nuclease signal amplification based SERS detection in cancer cells. Biosens. Bioelectron. 2016, 79, 574–580. [Google Scholar] [CrossRef]
  17. Wang, C.; Xu, S.; Zhang, K.; Li, M.; Li, Q.; Xiao, R.; Wang, S. Streptomycin-modified Fe3O4-Au@Ag core-satellite magnetic nanoparticles as an effective antibacterial agent. J. Mater. Sci. 2016, 52, 1357–1368. [Google Scholar] [CrossRef]
  18. Wang, Y.; Wang, K.; Zou, B.; Gao, T.; Zhang, X.; Du, Z.; Zhou, S. Magnetic-based silver composite microspheres with nanosheet-assembled shell for effective SERS substrate. J. Mater. Chem. C 2013, 1, 2441–2447. [Google Scholar] [CrossRef]
  19. Ye, Y.; Chen, J.; Ding, Q.; Lin, D.; Dong, R.; Yang, L.; Liu, J. Sea-urchin-like Fe3O4@C@Ag particles: An efficient SERS substrate for detection of organic pollutants. Nanoscale 2013, 5, 5887–5895. [Google Scholar] [CrossRef]
  20. Kavyani, S.; Baharfar, R. Design and characterization of Fe3O4/GO/Au-Ag nanocomposite as an efficient catalyst for the green synthesis of spirooxindole-dihydropyridines. Appl. Organomet. Chem. 2020, 34, e5560. [Google Scholar] [CrossRef]
  21. Zhao, Y.; Tao, C.; Xiao, G.; Wei, G.; Li, L.; Liu, C.; Su, H. Controlled synthesis and photocatalysis of sea urchin-like Fe3O4@TiO2@Ag nanocomposites. Nanoscale 2016, 8, 5313–5326. [Google Scholar] [CrossRef] [PubMed]
  22. Nguyen, T.T.; Mammeri, F.; Ammar, S. Iron oxide and gold based magneto-plasmonic nanostructures for medical applications: A review. Nanomaterials 2018, 8, 149. [Google Scholar] [CrossRef] [PubMed] [Green Version]
  23. Lohse, S.E.; Burrows, N.D.; Scarabelli, L.; Liz-Marzán, L.M.; Murphy, C.J. Anisotropic noble metal nanocrystal growth: The role of halides. Chem. Mater. 2014, 26, 34–43. [Google Scholar] [CrossRef] [Green Version]
  24. Mulvihill, M.J.; Ling, X.Y.; Henzie, J.; Yang, P. Anisotropic etching of silver nanoparticles for plasmonic structures capable of single-particle SERS. J. Am. Chem. Soc. 2010, 132, 268–274. [Google Scholar] [CrossRef]
  25. Wang, W.; Luo, J.; Fan, Q.; Suzuki, M.; Suzuki, I.S.; Engelhard, M.H.; Lin, Y.; Kim, N.; Wang, J.Q.; Zhong, C.-J. Monodispersed Core–Shell Fe3O4@Au nanoparticles. J. Phys. Chem. B 2005, 109, 21593–21601. [Google Scholar] [CrossRef]
  26. Wheeler, D.A.; Adams, S.A.; López-Luke, T.; Torres-Castro, A.; Zhang, J.Z. Magnetic Fe3O4-Au core-shell nanostructures for surface enhanced Raman scattering. Ann. Phys. 2012, 524, 670–679. [Google Scholar] [CrossRef]
  27. Zheng, H.; Zou, B.; Chen, L.; Wang, Y.; Zhang, X.; Zhou, S. Gel-assisted synthesis of oleate-modified Fe3O4@Ag composite microspheres as magnetic SERS probe for thiram detection. CrystEngComm 2015, 17, 6393–6398. [Google Scholar] [CrossRef]
  28. Li, Y.; Yang, S.; Lu, X.; Duan, W.; Moriga, T. Synthesis and evaluation of the SERS effect of Fe3O4-Ag Janus composite materials for separable, highly sensitive substrates. RSC Adv. 2019, 9, 2877–2884. [Google Scholar] [CrossRef] [Green Version]
  29. Zhang, K.; Wang, C.; Rong, Z.; Xiao, R.; Zhou, Z.; Wang, S. Silver coated magnetic microflowers as efficient and recyclable catalysts for catalytic reduction. New J. Chem. 2017, 41, 14199–14208. [Google Scholar] [CrossRef]
  30. Nguyen, T.T.; Lau-Truong, S.; Mammeri, F.; Ammar, S. Star-shaped Fe3-xO4-Au core-shell nanoparticles: From synthesis to SERS application. Nanomaterials 2020, 10, 294. [Google Scholar] [CrossRef] [Green Version]
  31. Zhong, Y.; Liang, G.; Jin, W.; Jian, Z.; Wu, Z.; Chen, Q.; Cai, Y.; Zhang, W. Preparation of triangular silver nanoplates by silver seeds capped with citrate-CTA+. RSC Adv. 2018, 8, 28934–28943. [Google Scholar] [CrossRef] [Green Version]
  32. Zhu, J.; Sun, L.; Shan, Y.; Zhi, Y.; Chen, J.; Dou, B.; Su, W. Green preparation of silver nanofilms as SERS-active substrates for Rhodamine 6G detection. Vacuum 2021, 187, 110096. [Google Scholar] [CrossRef]
  33. Flores-Romero, E.; Rodriguez-Sevilla, E.; Cheang-Wong, J.C. Silver films over silica microsphere (AgFOSM) as SERS substrates. Photonics Nanostruct. 2018, 28, 81–87. [Google Scholar] [CrossRef]
  34. Le Ru, E.C.; Blackie, E.; Meyer, M.; Etchegoin, P.G. Surface enhanced Raman scattering enhancement factors: A comprehensive study. J. Phys. Chem. C 2007, 111, 13794–13803. [Google Scholar] [CrossRef]
Figure 1. (a) Scanning electron microscopy (SEM) image of an assembly of Fe3O4 particles and (b) X-ray diffraction (XRD) pattern. It must be noticed that Fe3O4 particles exhibit an average size of 180 ± 20 nm and they are composed of regular shaped tiny primary crystals of 10 nm in size. The XRD pattern matches very well with the spinel structure, with a Rietveld refined cell parameter of 8.390 ± 0.005 Å, very close to that of pure magnetite (ICDD n°98-002-6410).
Nanomaterials 11 01288 g001
Figure 2. Normalized UV–Visible absorption spectra, in a transmission mode, of as-prepared Ag seeds (dotted line), Fe3O4 cores (dashed line) and Fe3O4-Ag seeds (continuous line) aqueous suspensions.
Nanomaterials 11 01288 g002
Figure 3. XRD pattern of a representative Fe3O4-Ag nanocomposite sample (r = 10), indexed as a mix of the metallic silver and the iron oxide phases.
Nanomaterials 11 01288 g003
Figure 4. SEM images of Fe3O4-Ag nanocomposites produced (a) without PVP for a r value of 10, (c,e) with PVP for a r value of 2 and 10, respectively. To highlight the isotropic and anisotropic silver shell morphology, a zoom is given in (b,d,f), respectively.
Nanomaterials 11 01288 g004
Figure 5. UV–Vis spectra of Fe3O4-Ag nanocomposites produced without PVP with a r value of 10 (green line) compared to those prepared in presence of PVP for different r values, r = 2 (red line) and r = 10 (orange line).
Nanomaterials 11 01288 g005
Figure 6. Magnetization curves measured at 300 K on bare Fe3O4 particles (black line), Fe3O4-Ag seeds (green line) and their Fe3O4-Ag related nanocomposites produced in presence of PVP for a different r value of 10 (red line) and 2 (purple line); without PVP (r = 10) (blue line). In the inset, a photograph of Fe3O4-Ag nanocomposite (with PVP, r = 10) suspension in deionized water (a) before and (b) after magnet separation.
Nanomaterials 11 01288 g006
Figure 7. (a) SERS spectra collected on the engineered substrates after exposition to R6G aqueous solutions of different concentrations. (b) Series of SERS spectra collected on a single substrate after exposition to a R6G 10−9 M aqueous solution. The measurements were performed on different areas on the wafer. All spectra were taken with an exposure time of 1 s and 10 accumulations.
Nanomaterials 11 01288 g007
Figure 8. The functional relationship between log of Raman intensity at 1510 cm−1 and log of R6G concentration. The error bars are standard deviations from a total of three measurements.
Nanomaterials 11 01288 g008
Publisher’s Note: MDPI stays neutral with regard to jurisdictional claims in published maps and institutional affiliations.

