
Reduced Graphene Oxide UWB Array Sensor: High Performance for Brain Tumor Imaging and Detection

 , , and
Abstract
:1. Introduction
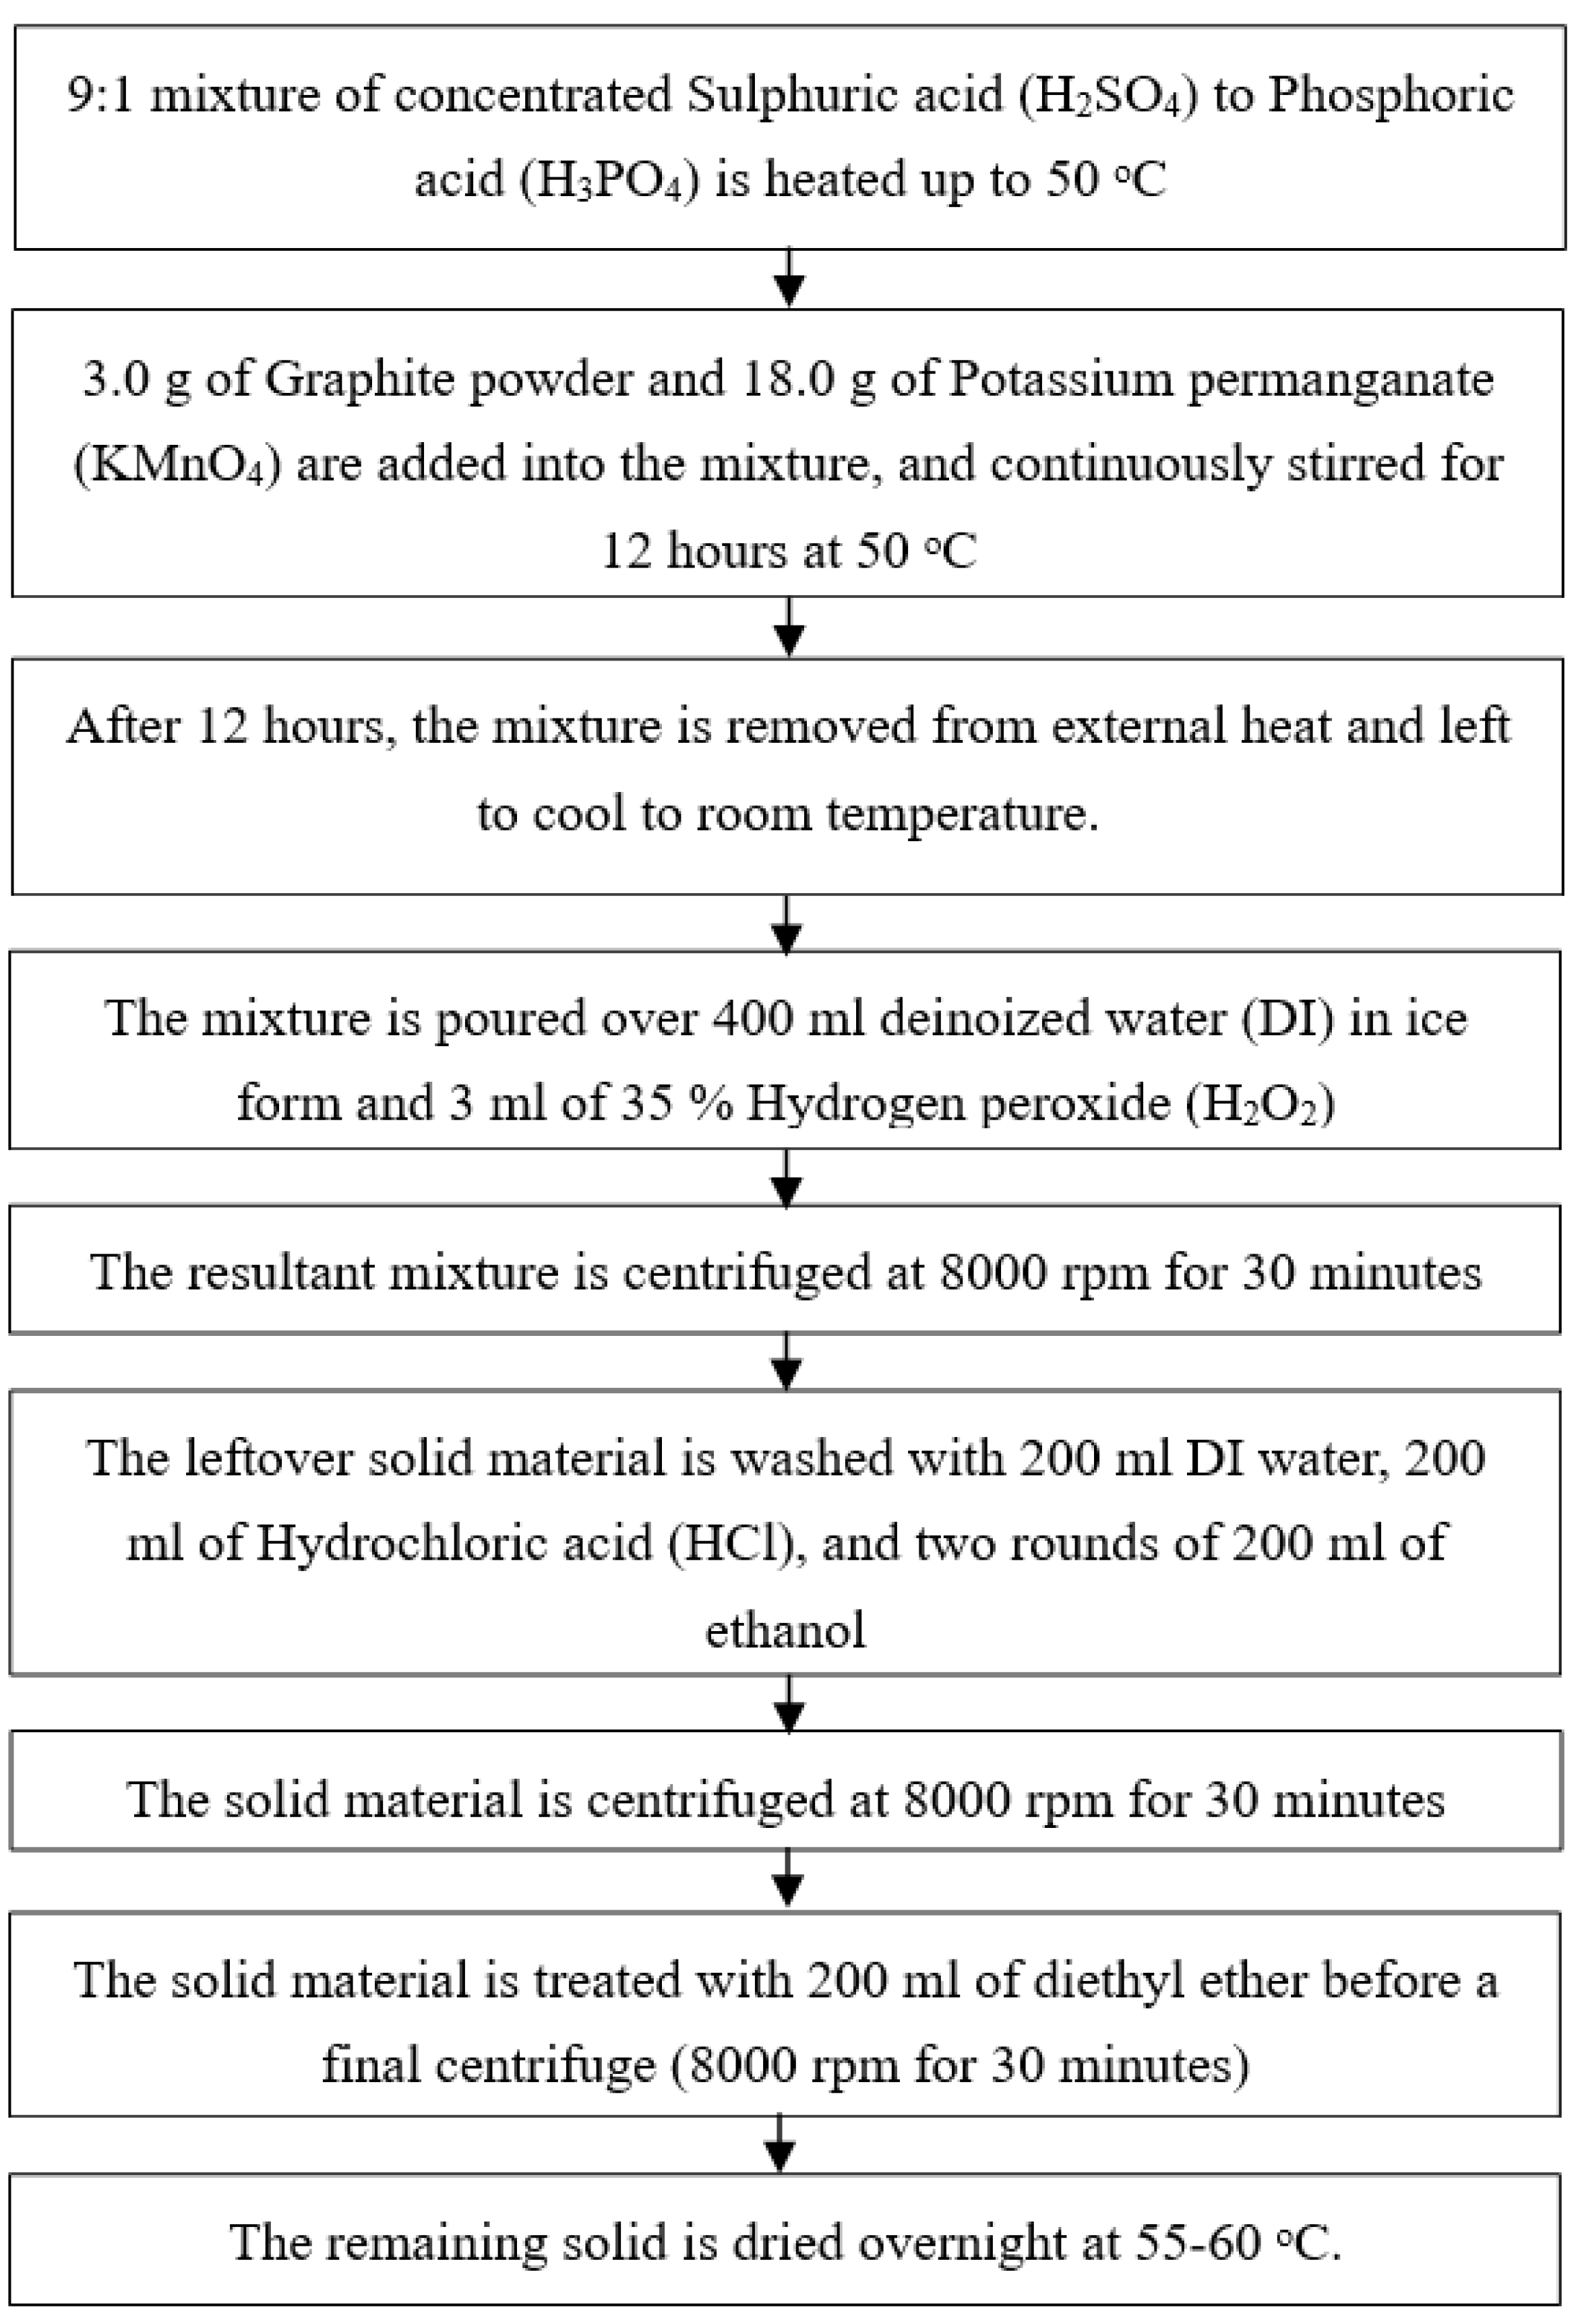
2. Experimental
Electrochemistry
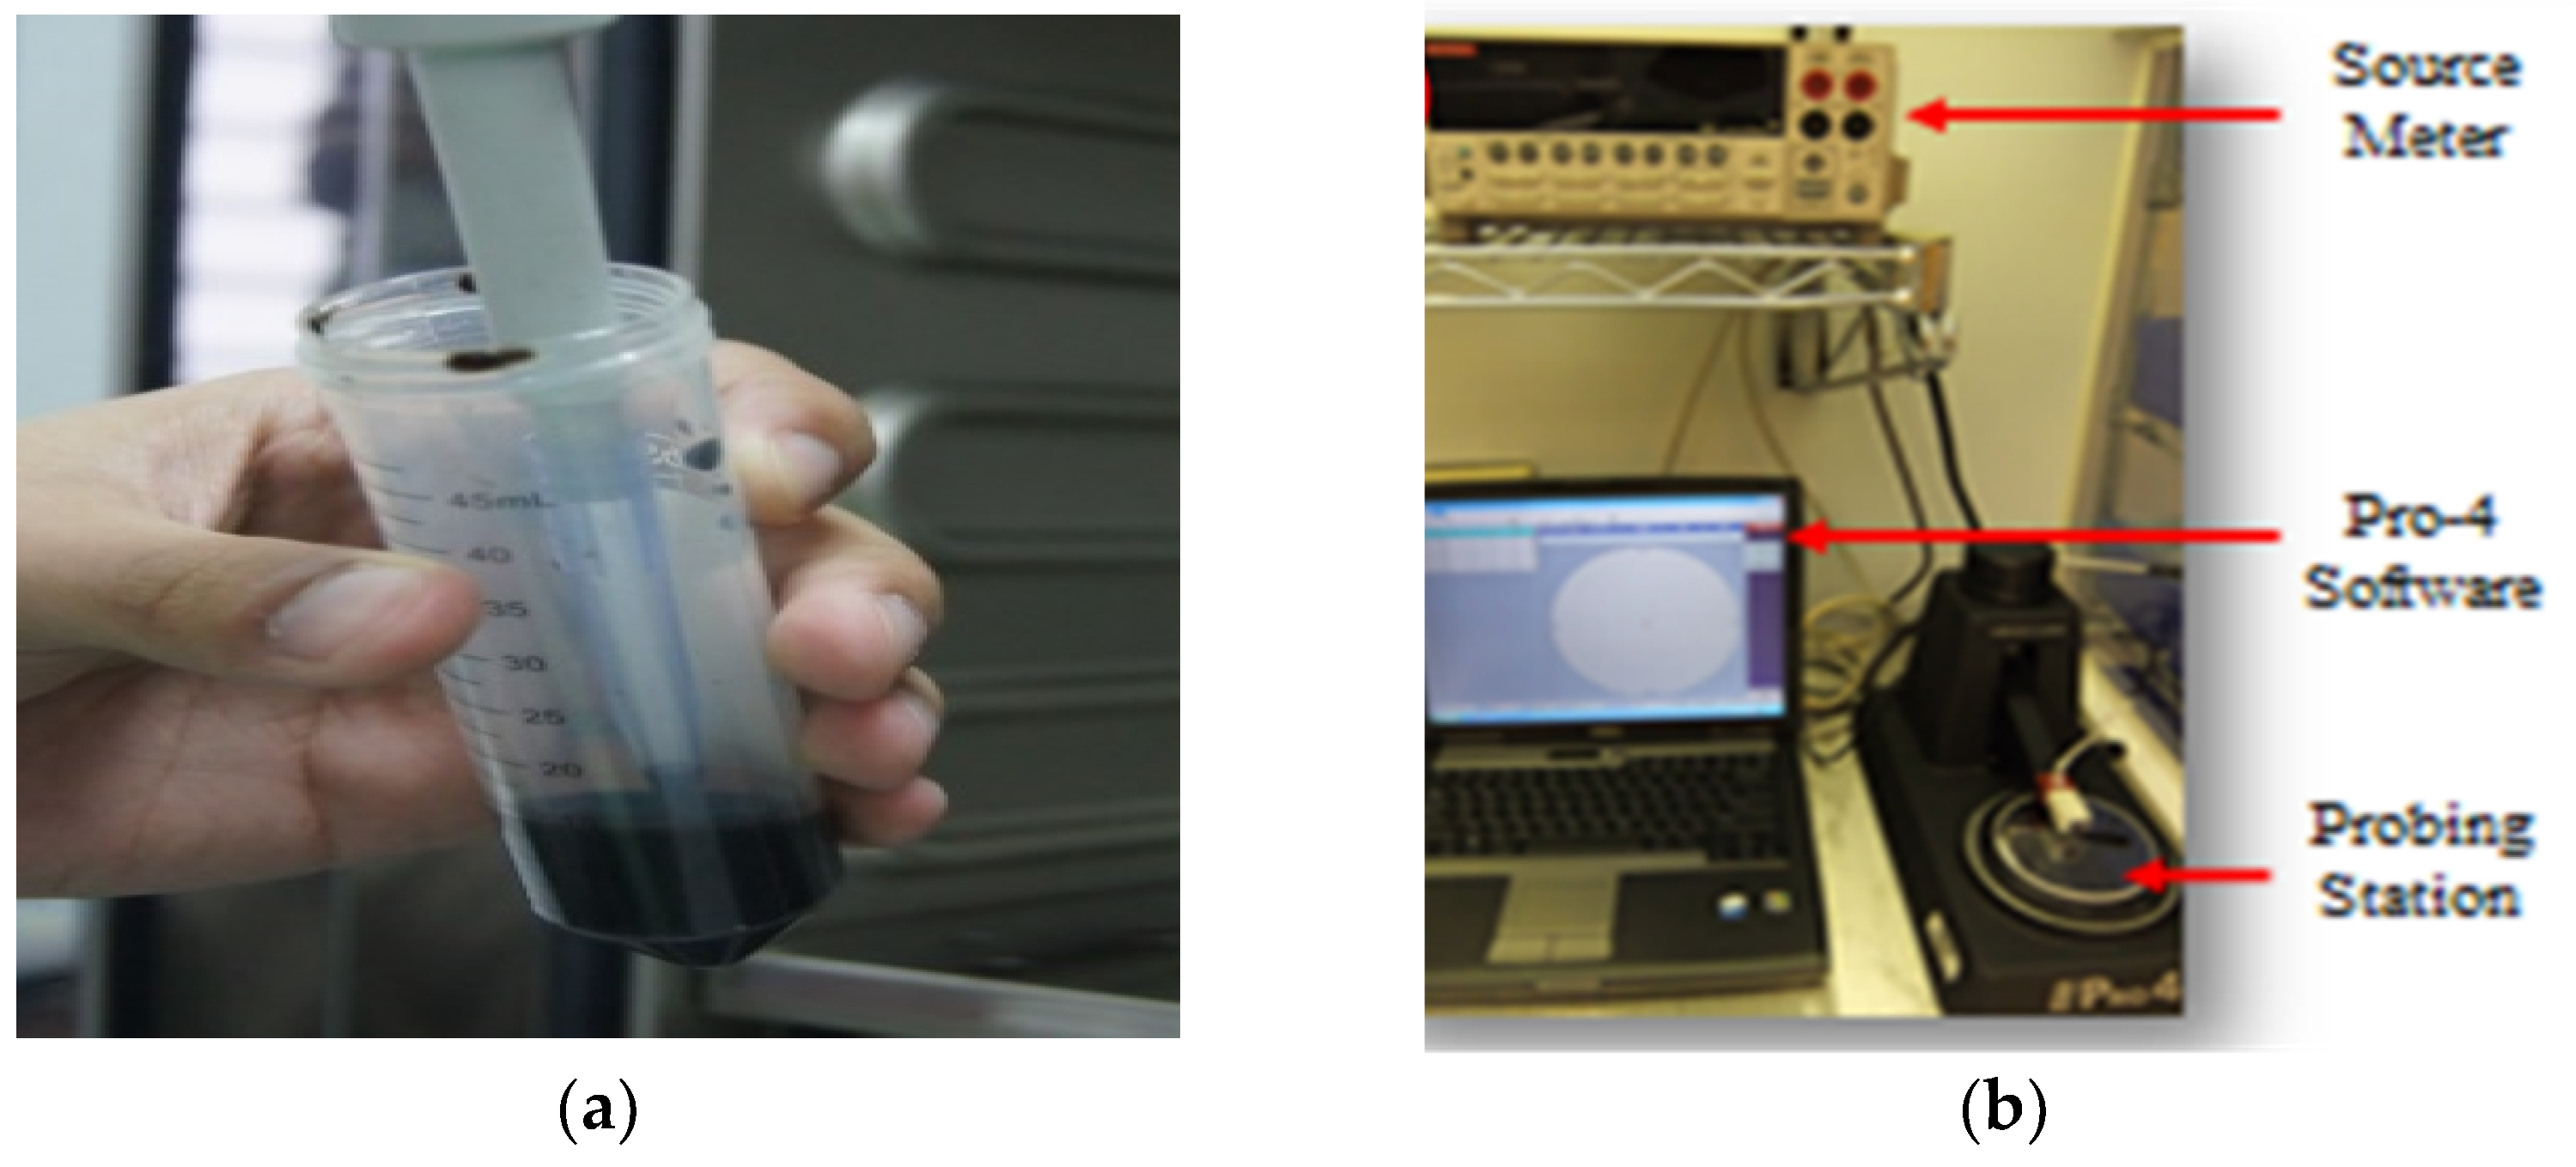
3. Methodology and Experimental Set Up
3.1. Morphological Analysis from FESEM
3.2. Structure Study from XRD
3.3. Electrical Study of Four-Point Probe
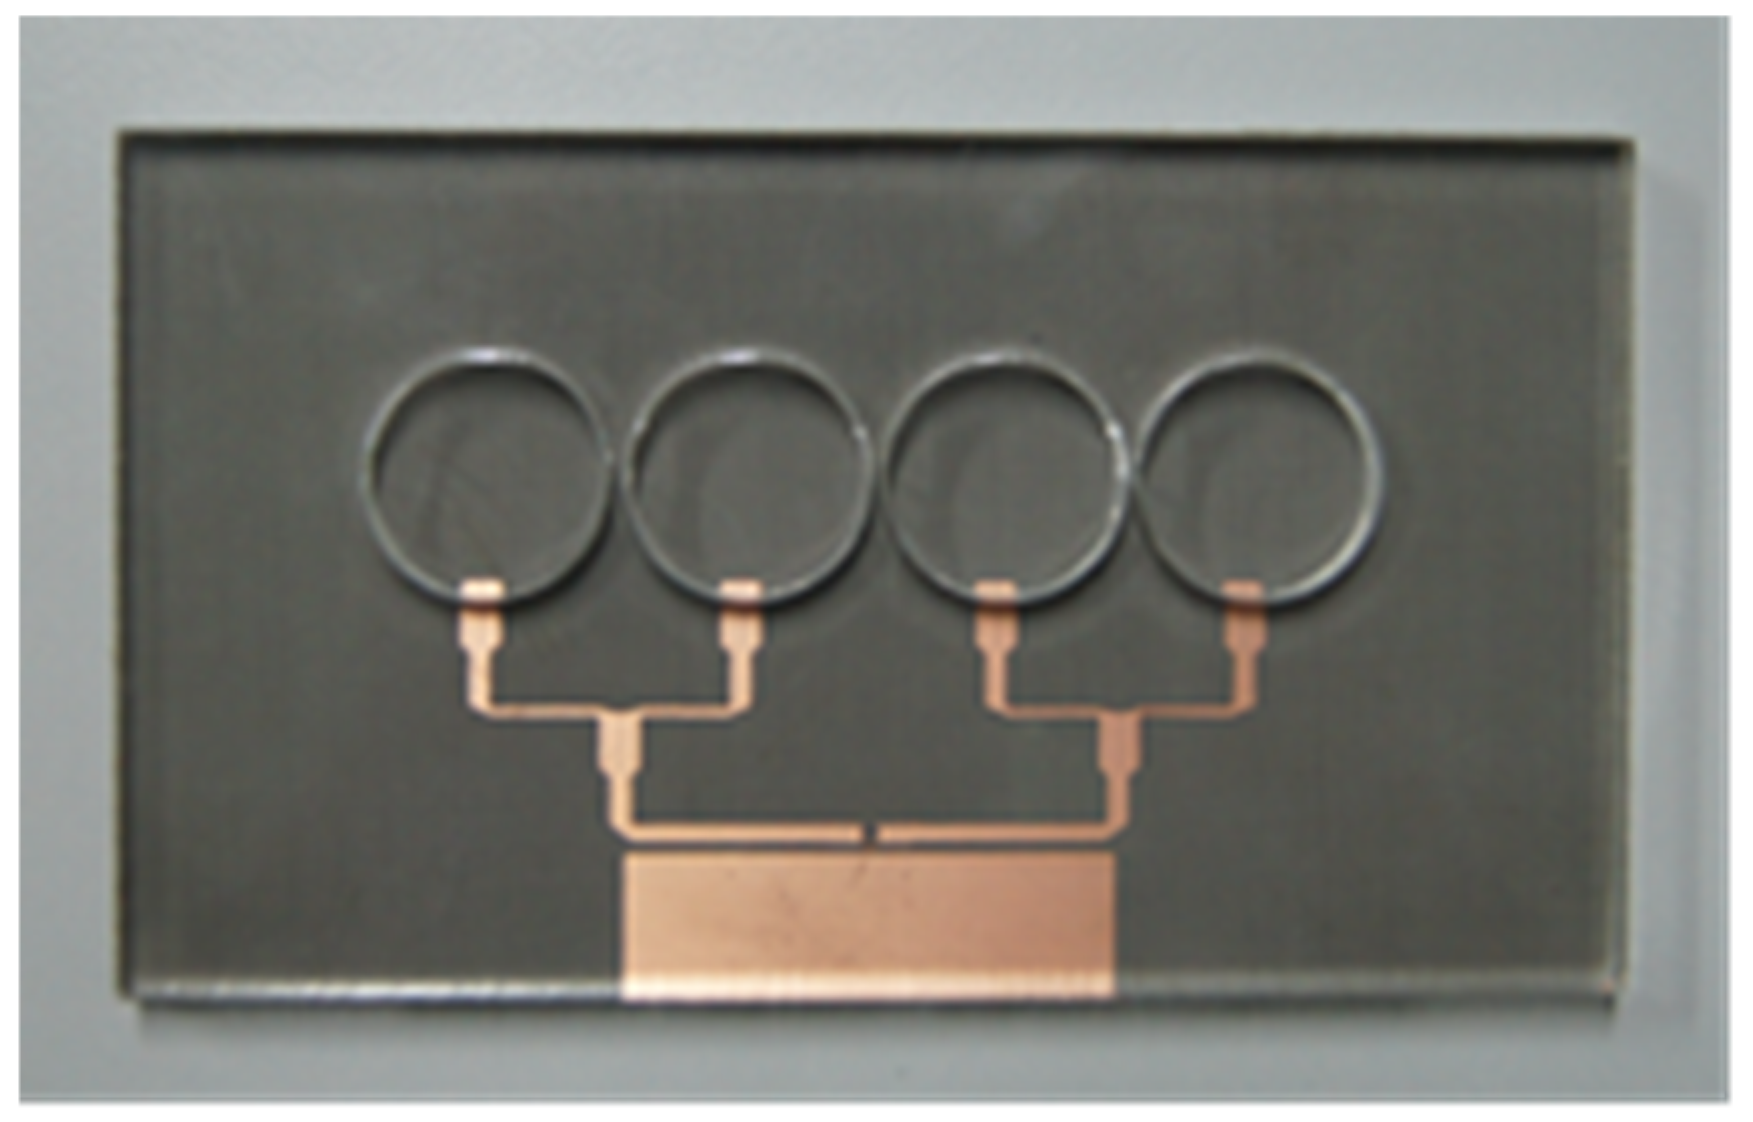
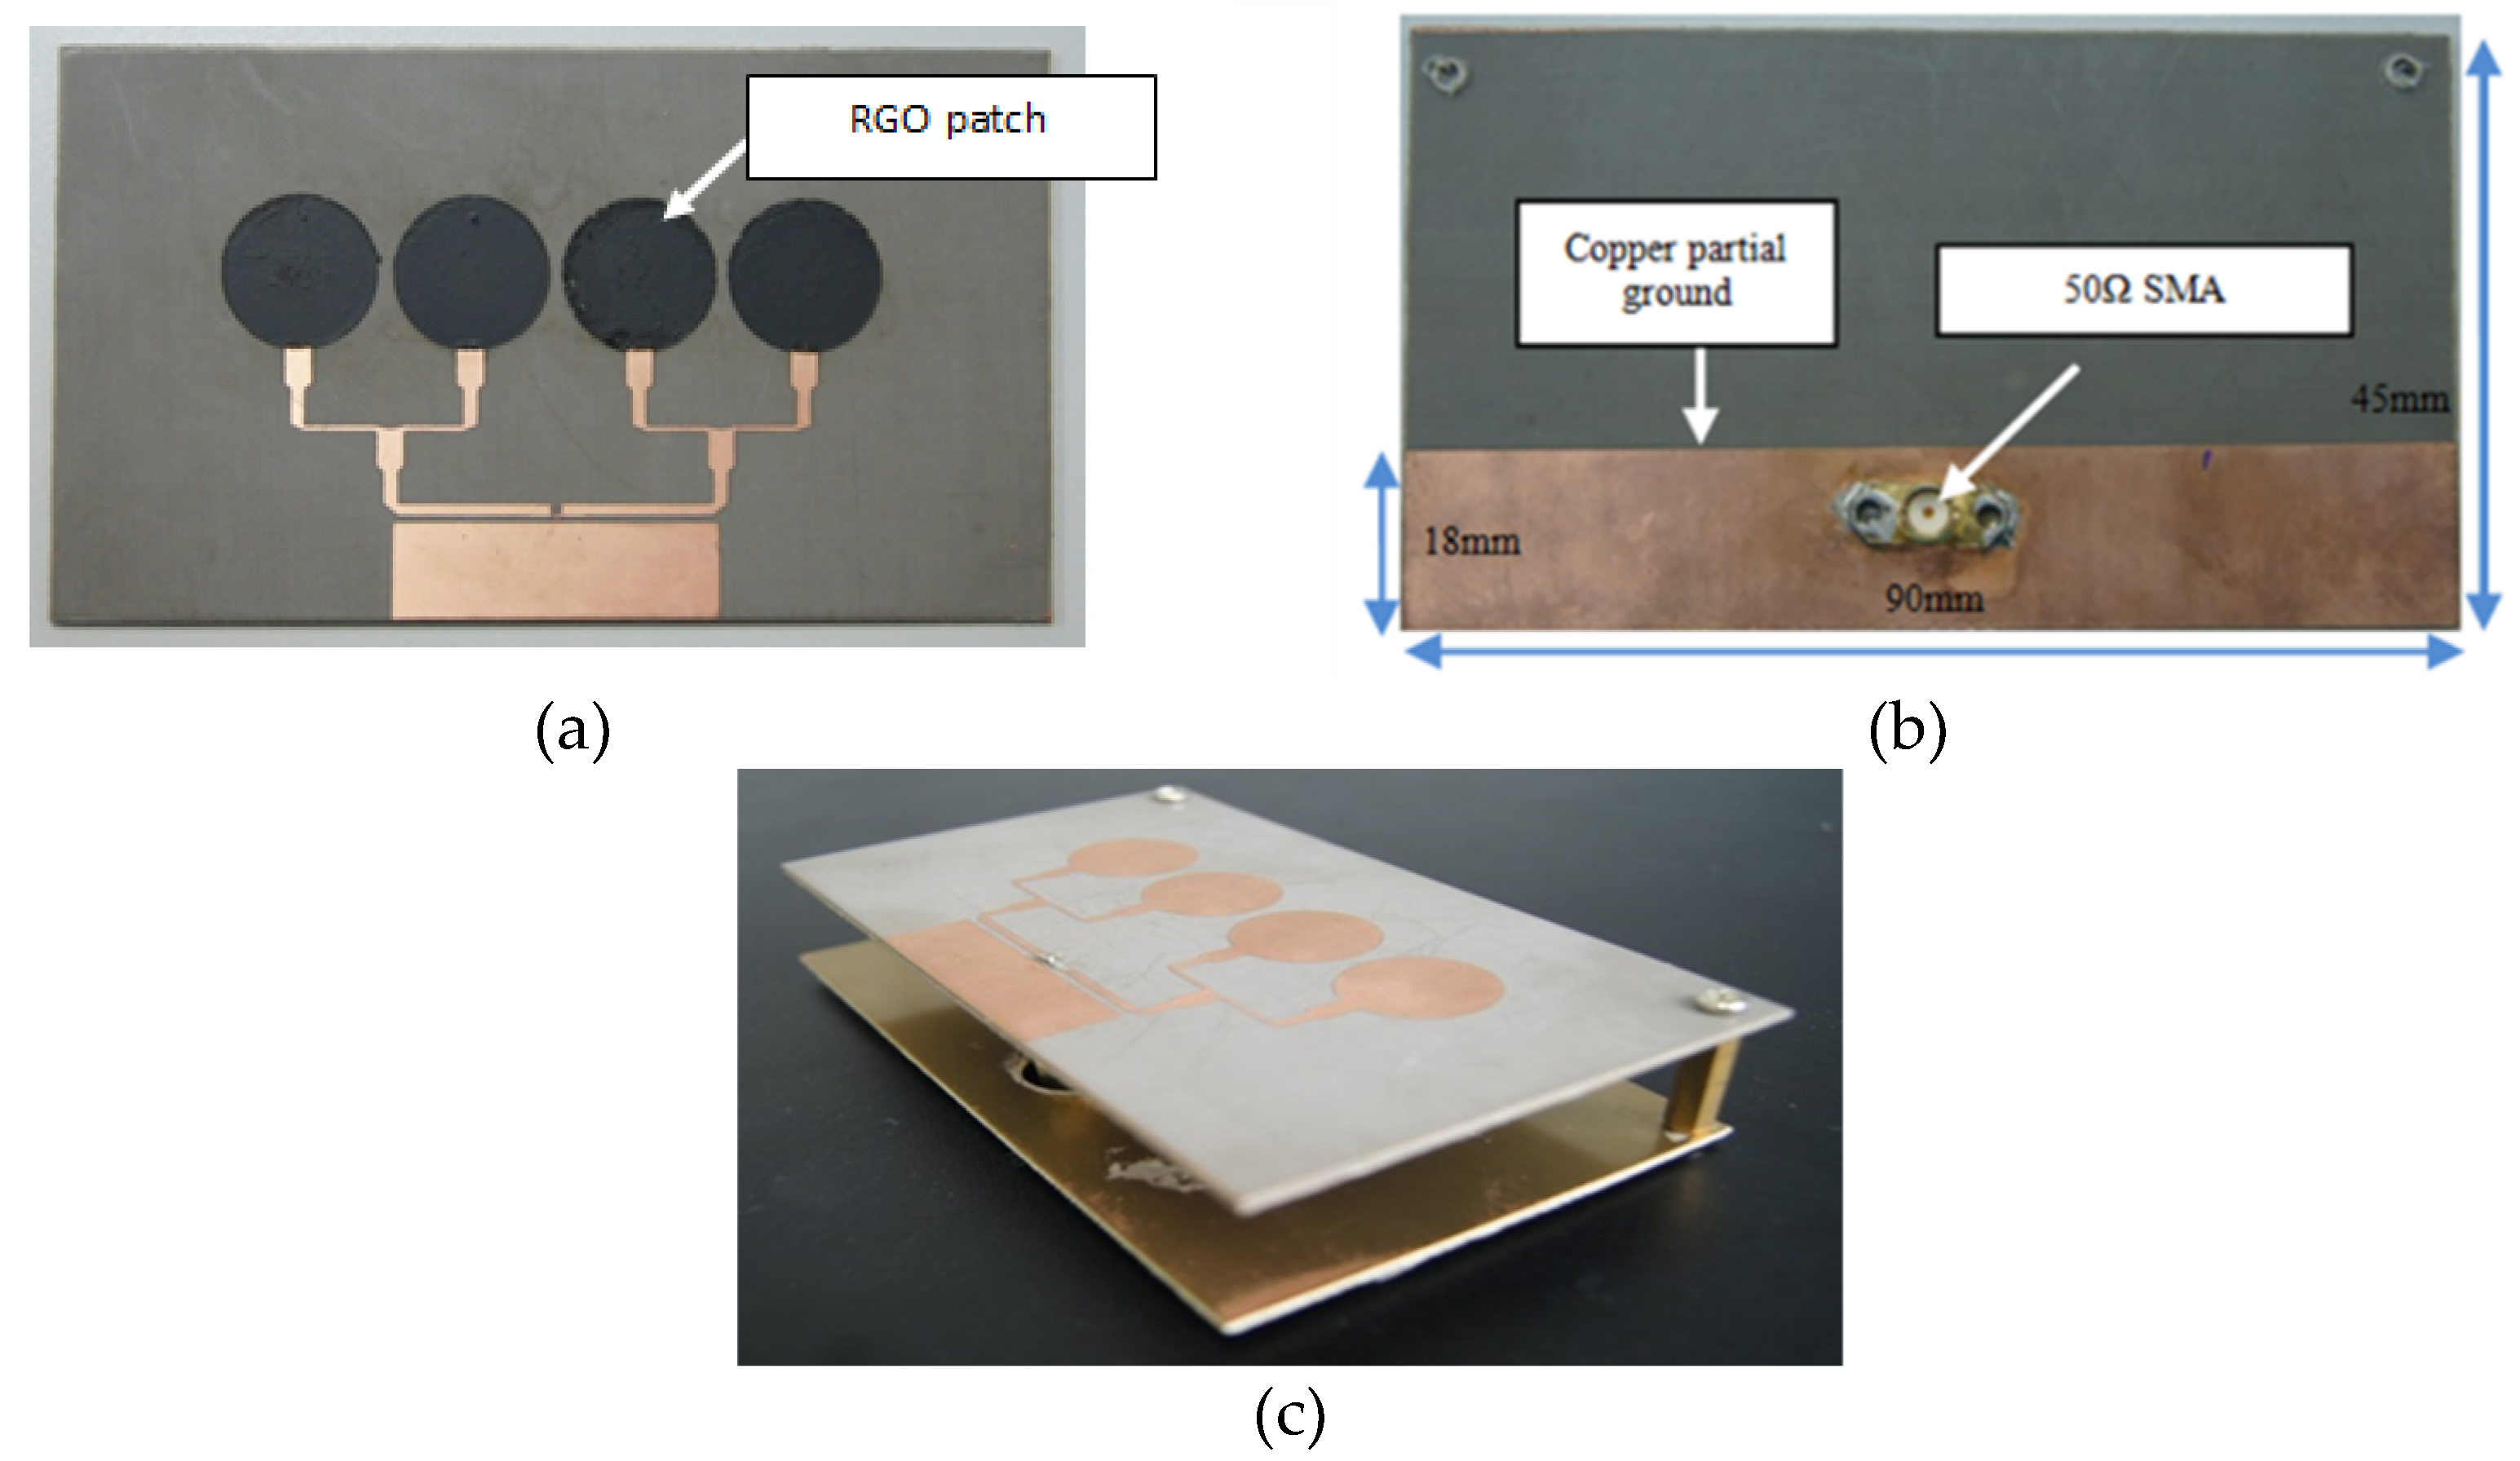
3.4. Sensor Design and Development
3.5. Sensor Principle of Operation
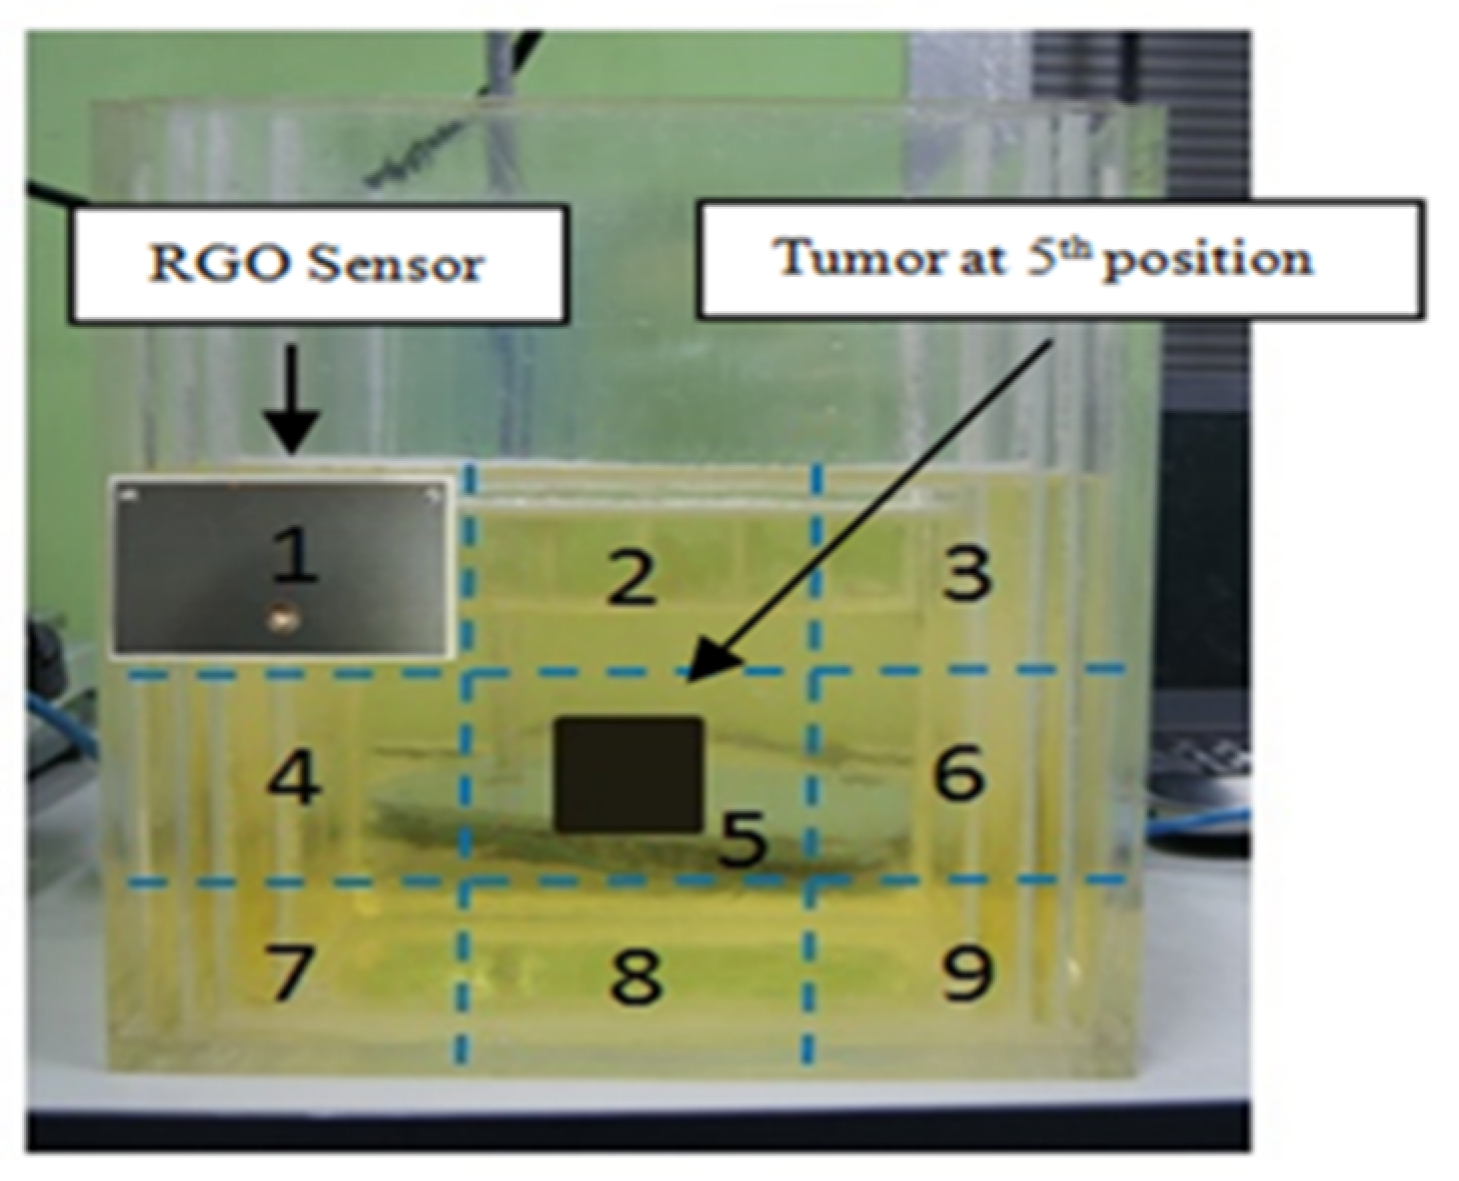
3.6. Sensor Integration and Experimental Test
4. Result and Discussion
5. Conclusions
Author Contributions
Funding
Data Availability Statement
Acknowledgments
Conflicts of Interest
References
- Mohammed, B.J.; Abbosh, A.; Ireland, D.; Bialkowski, M.E. Compact wideband antenna for microwave imaging of brain. Prog. Electromagn. Res. C 2012, 27, 27–39. [Google Scholar] [CrossRef] [Green Version]
- Meaney, P.M.; Fanning, M.W.; Li, D.; Poplack, S.P.; Paulsen, K.D. A clinical prototype for active microwave imaging of the breast. IEEE Trans. Microw. Theory Tech. 2000, 48, 1841–1853. [Google Scholar]
- Lalitha, K.; Manjula, J. Non-invasive microwave head imaging to detect tumors and to estimate their size and location. Phys. Med. 2022, 13, 100047. [Google Scholar] [CrossRef]
- Polk, C.; Postow, E. CRC Handbook of Biological Effects of Electromagnetic Fields; CRC Press: Boca Rotan, FL, USA, 2019; Available online: https://www.routledge.com/CRC-Handbook-of-Biological-Effects-of-Electromagnetic-Fields/Polk/p/book/9781315891910 (accessed on 1 January 2021).
- Shashni, B.; Nishikawa, Y.; Nagasaki, Y. Management of tumor growth and angiogenesis in triple-negative breast cancer by using redox nanoparticles. Biomaterials 2021, 269, 120645. [Google Scholar] [CrossRef]
- Sudirman, R.; Chew, K.M.; Mahmood, N.H.; Seman, N.; Yong, C.Y. Human brain microwave imaging signal processing: Frequency domain (s-parameters) to time domain conversion. Engineering 2013, 5, 31–36. [Google Scholar]
- Fear, E.C.; Meaney, P.M.; Stuchly, M.A. Microwaves for breast cancer detection? IEEE Potentials 2003, 22, 12–18. [Google Scholar] [CrossRef]
- Hagness, S.C.; Taflove, A.; Bridges, J.E. Two-dimensional FDTD analysis of a pulsed microwave confocal system for breast cancer detection: Fixed-focus and antenna-array sensors. IEEE Trans. Biomed. Eng. 1998, 45, 1470–1479. [Google Scholar] [CrossRef] [Green Version]
- Ireland, D.; Bialkowski, M. Microwave head imaging for stroke detection. Prog. Electromagn. Res. M 2012, 21, 163–175. [Google Scholar] [CrossRef] [Green Version]
- Camacho, L.M.; Tjuatja, S. FDTD simulation of microwave scattering from a lung tumor. In Proceedings of the IEEE Antennas and Propagation Society, AP-S International Symposium (Digest), Washington, DC, USA, 3–8 July 2005; pp. 815–818. [Google Scholar]
- Babarinde, O.J.; Jamlos, M.F.; Soh, P.J.; Schreurs, D.M.M.P.; Beyer, A. Microwave imaging technique for lung tumour detection. In Proceedings of the GeMiC 2016—2016 German Microwave Conference, Bochum, Germany, 14–16 March 2016; pp. 100–103. [Google Scholar]
- Ojaroudi, M.; Bila, S.; Salimi, M. A novel approach of brain tumor detection using miniaturized high-fidelity UWB slot antenna array. In Proceedings of the 2019 13th European Conference on Antennas and Propagation (EuCAP), Krakow, Poland, 31 March–5 April 2019; pp. 1–5. [Google Scholar]
- Wang, A.; Wang, C.; Fu, L.; Wong-Ng, W.; Lan, Y. Recent Advances of Graphitic Carbon Nitride-Based Structures and Applications in Catalyst, Sensing, Imaging, and LEDs. Nano-Micro Lett. 2017, 9, 47. [Google Scholar] [CrossRef]
- Schwierz, F. Graphene transistors. Nat. Nanotech. 2010, 5, 487–496. [Google Scholar] [CrossRef]
- Moon, J.S.; Gaskill, D.K. Graphene: Its fundamentals to future applications. IEEE Trans. Microw. Theory Tech. 2011, 59, 2702–2708. [Google Scholar] [CrossRef]
- Jamlos, M.A.; Jamlos, M.F.; Ismail, A.H. High performance novel UWB array antenna for brain tumor detection via scattering parameters in microwave imaging simulation system. In Proceedings of the 2015 9th European Conference on Antennas and Propagation, EuCAP, Lisbon, Portugal, 13–17 April 2015; pp. 1–10. [Google Scholar]
- Liu, Q.; Shen, J.; Yang, X.; Zhang, T.; Tang, H. 3D reduced graphene oxide aerogel-mediated z-scheme photocatalytic system for highly efficient solar-driven water oxidation and removal of antibiotics. Appl. Catal. B Environ. 2018, 232, 562–573. [Google Scholar] [CrossRef]
- Vashist, S.K.; Luong, J.H.T. Recent advances in electrochemical biosensing schemes using graphene and graphene-based nanocomposites. Carbon 2015, 84, 519–550. [Google Scholar] [CrossRef]
- Marcano, D.C.; Kosynkin, D.V.; Berlin, J.M. Improved synthesis of graphene oxide. ACS Nano 2010, 4, 4806–4814. [Google Scholar] [CrossRef]
- Jamlos, M.A.; Jamlos, M.F.; Ismail, A.H. Two-stepped synthesis of high performance reduced graphene oxide antenna. In Solid State Phenomena; Trans Tech Publications Ltd.: Wollerau, Switzerland, 2018; pp. 134–141. [Google Scholar]
- Oikonomou, A.; Karanasiou, I.S.; Uzunoglu, N.K. Phased-array near field radiometry for brain intracranial applications. Prog. Electromagn. Res. 2010, 109, 345–360. [Google Scholar] [CrossRef] [Green Version]
- Manickam, S.; Muthoosamy, K.; Bai, R.G.; Abubakar, I.B.; Sudheer, S.M.; Hongngee, L.; Hwei-San, L.; Nayming, H.; Ch, C. Exceedingly biocompatible and thin-layered reduced graphene oxide nanosheets using an eco-friendly mushroom extract strategy. Int. J. Nanomed. 2015, 10, 1505–1519. [Google Scholar] [CrossRef] [Green Version]
- Viana, M.M.; Lima, M.C.F.S.; Forsythe, J.C.; Gangoli, V.S.; Cho, M.; Cheng, Y.; Silva, G.G.; Wong, M.S.; Caliman, V. Facile graphene oxide preparation by microwave-assisted acid method. J. Braz. Chem. Soc. 2015, 26, 978–984. [Google Scholar] [CrossRef]
- Murugan, A.V.; Muraliganth, T.; Manthiram, A. Rapid, facile microwave-solvothermal synthesis of graphene nanosheets and their polyaniline nanocomposites for energy strorage. Chem. Mater. 2009, 21, 5004–5006. [Google Scholar] [CrossRef]
- Wang, Y.; Chen, Y.; Lacey, S.D.; Xu, L.; Xie, H.; Li, T.; Danner, V.A.; Hu, L. Reduced graphene oxide film with record-high conductivity and mobility. Mater. Today 2018, 21, 186–192. [Google Scholar] [CrossRef]
- Chen, W.; Yan, L.; Bangal, P.R. Preparation of graphene by the rapid and mild thermal reduction of graphene oxide induced by microwaves. Carbon 2010, 48, 1146–1152. [Google Scholar] [CrossRef]
- Rao, S.; Upadhyay, J.; Polychronopoulou, K.; Umer, R.; Das, R. Reduced graphene oxide: Effect of reduction on electrical conductivity. J. Compos. Sci. 2018, 2, 25. [Google Scholar]
- Nikkhah, M.R.; Rashed-Mohassel, J.; Kishk, A.A. High-gain aperture coupled rectangular dielectric resonator antenna array using parasitic elements. IEEE Trans. Antennas Propag. 2013, 61, 3905–3908. [Google Scholar] [CrossRef]
- Ojaroudi, N.; Ojaroudi, Y.; Ojaroudi, S. Omnidirectional monopole antenna for use in circular cylindrical microwave imaging systems. Wirel. Pers. Commun. 2015, 80, 1035–1047. [Google Scholar] [CrossRef]
- Rybin, O.; Shulga, V.; Shulga, S. The given surface current distribution model of a rectangular patch antenna with metamaterial-like substrate. Results Phys. 2019, 15, 102573. [Google Scholar] [CrossRef]
- Naik, K.K.; Teja, S.C.S.; Sailaja, B.V.; Sri, P.A. Design of flexible parasitic element patch antenna for biomedical application. Prog. Electromagn. Res. M 2020, 94, 143–153. [Google Scholar] [CrossRef]
- Jamlos, M.A.; Jamlos, M.F.; Khatun, S.; Ismail, A.H. An optimum quarter-wave impedance matching feedline for circular uwb array antenna with high gain performance. In Proceedings of the IEEE Symposium on Wireless Technology and Applications, ISWTA, Kota Kinabalu, Malaysia, 28 September–1 October 2014; pp. 165–169. [Google Scholar]
- Jamlos, M.A.; Mustafa, W.A.; Husna, N.; Idrus, S.S.; Khairunizam, W.; Zunaidi, I.; Razlan, Z.M.; Shahriman, A.B. Ultra-wideband confocal microwave imaging for brain tumor detection. In Proceedings of the The 1st International Conference on Mechanical Electronic and Biosystem Engineering (MEBSE 2018), Bogor, Indonesia, 15–16 December 2008; Volume 557. [Google Scholar]
- Guoming, L.; Sabirova, F.M.; Morozov, A.V. Simulation and experimental measurement of digital multi-beamforming phased antenna array in the frequency range C. Results Phys. 2019, 13, 102310. [Google Scholar]
- Faktorová, D.; Isteníková, K. Modelling of scattering parameters in biological tissues. Electr. Rev. 2011, 87, 34–36. [Google Scholar]
- Joachimowicz, N.; Duchêne, B.; Conessa, C.; Meyer, O. Reference phantoms for microwave imaging. In Proceedings of the 2017 11th European Conference on Antennas and Propagation (EUCAP), Paris, France, 19–24 March 2017; pp. 2719–2722. [Google Scholar] [CrossRef]
- Paulson, C.N.; Chang, J.T.; Romero, C.E.; Watson, J.; Pearce, F.J.; Levin, N. Ultra-wideband radar methods and techniques of medical sensing and imaging. In Smart Medical and Biomedical Sensor Technology III; SPIE: Bellingham, DC, USA, 2005; p. 6007. [Google Scholar]
- Taylor, J.D. Ultrawideband Radar: Applications and Design; CRC Press: Boca Rotan, FL, USA, 2019; Available online: https://www.routledge.com/Ultrawideband-Radar-Applications-and-Design/Taylor/p/book/9781420089868 (accessed on 10 February 2021).
- Jamlos, M.A.; Ismail, A.H.; Jamlos, M.F.; Narbudowicz, A. Hybrid graphene–copper uwb array sensor for brain tumor detection via scattering parameters in microwave detection system. Appl. Phys. A Mater. Sci. Process. 2017, 123, 112. [Google Scholar] [CrossRef] [Green Version]
- Aragao, A.D.; de Carvalho, D.; Sanches, B.; van Noije, W.A.M. An improved confocal algorithm for breast cancer detection using uwb signals. In Proceedings of the 2020 IEEE 11th Latin American Symposium on Circuits & Systems (LASCAS), San Jose, Costa Rica, 25–28 February 2020; pp. 1–4. [Google Scholar]
- Wang, Z.; Lim, E.G.; Tang, Y.; Leach, M. Medical applications of microwave imaging. Sci. World J. 2014, 2014, 147016. [Google Scholar]
- Zubaida, A.Z. Experimental Analysis on Effectiveness of Confocal Algorithm For radar Based Breast Cancer Detection. Ph.D. Thesis, Durham University, Durham, UK, 2012. [Google Scholar]
- Cavagnaro, M.; Pittella, E.; Pisa, S. UWB pulse propagation into human tissues. Phys. Med. Biol. 2013, 58, 8689–8707. [Google Scholar] [CrossRef]


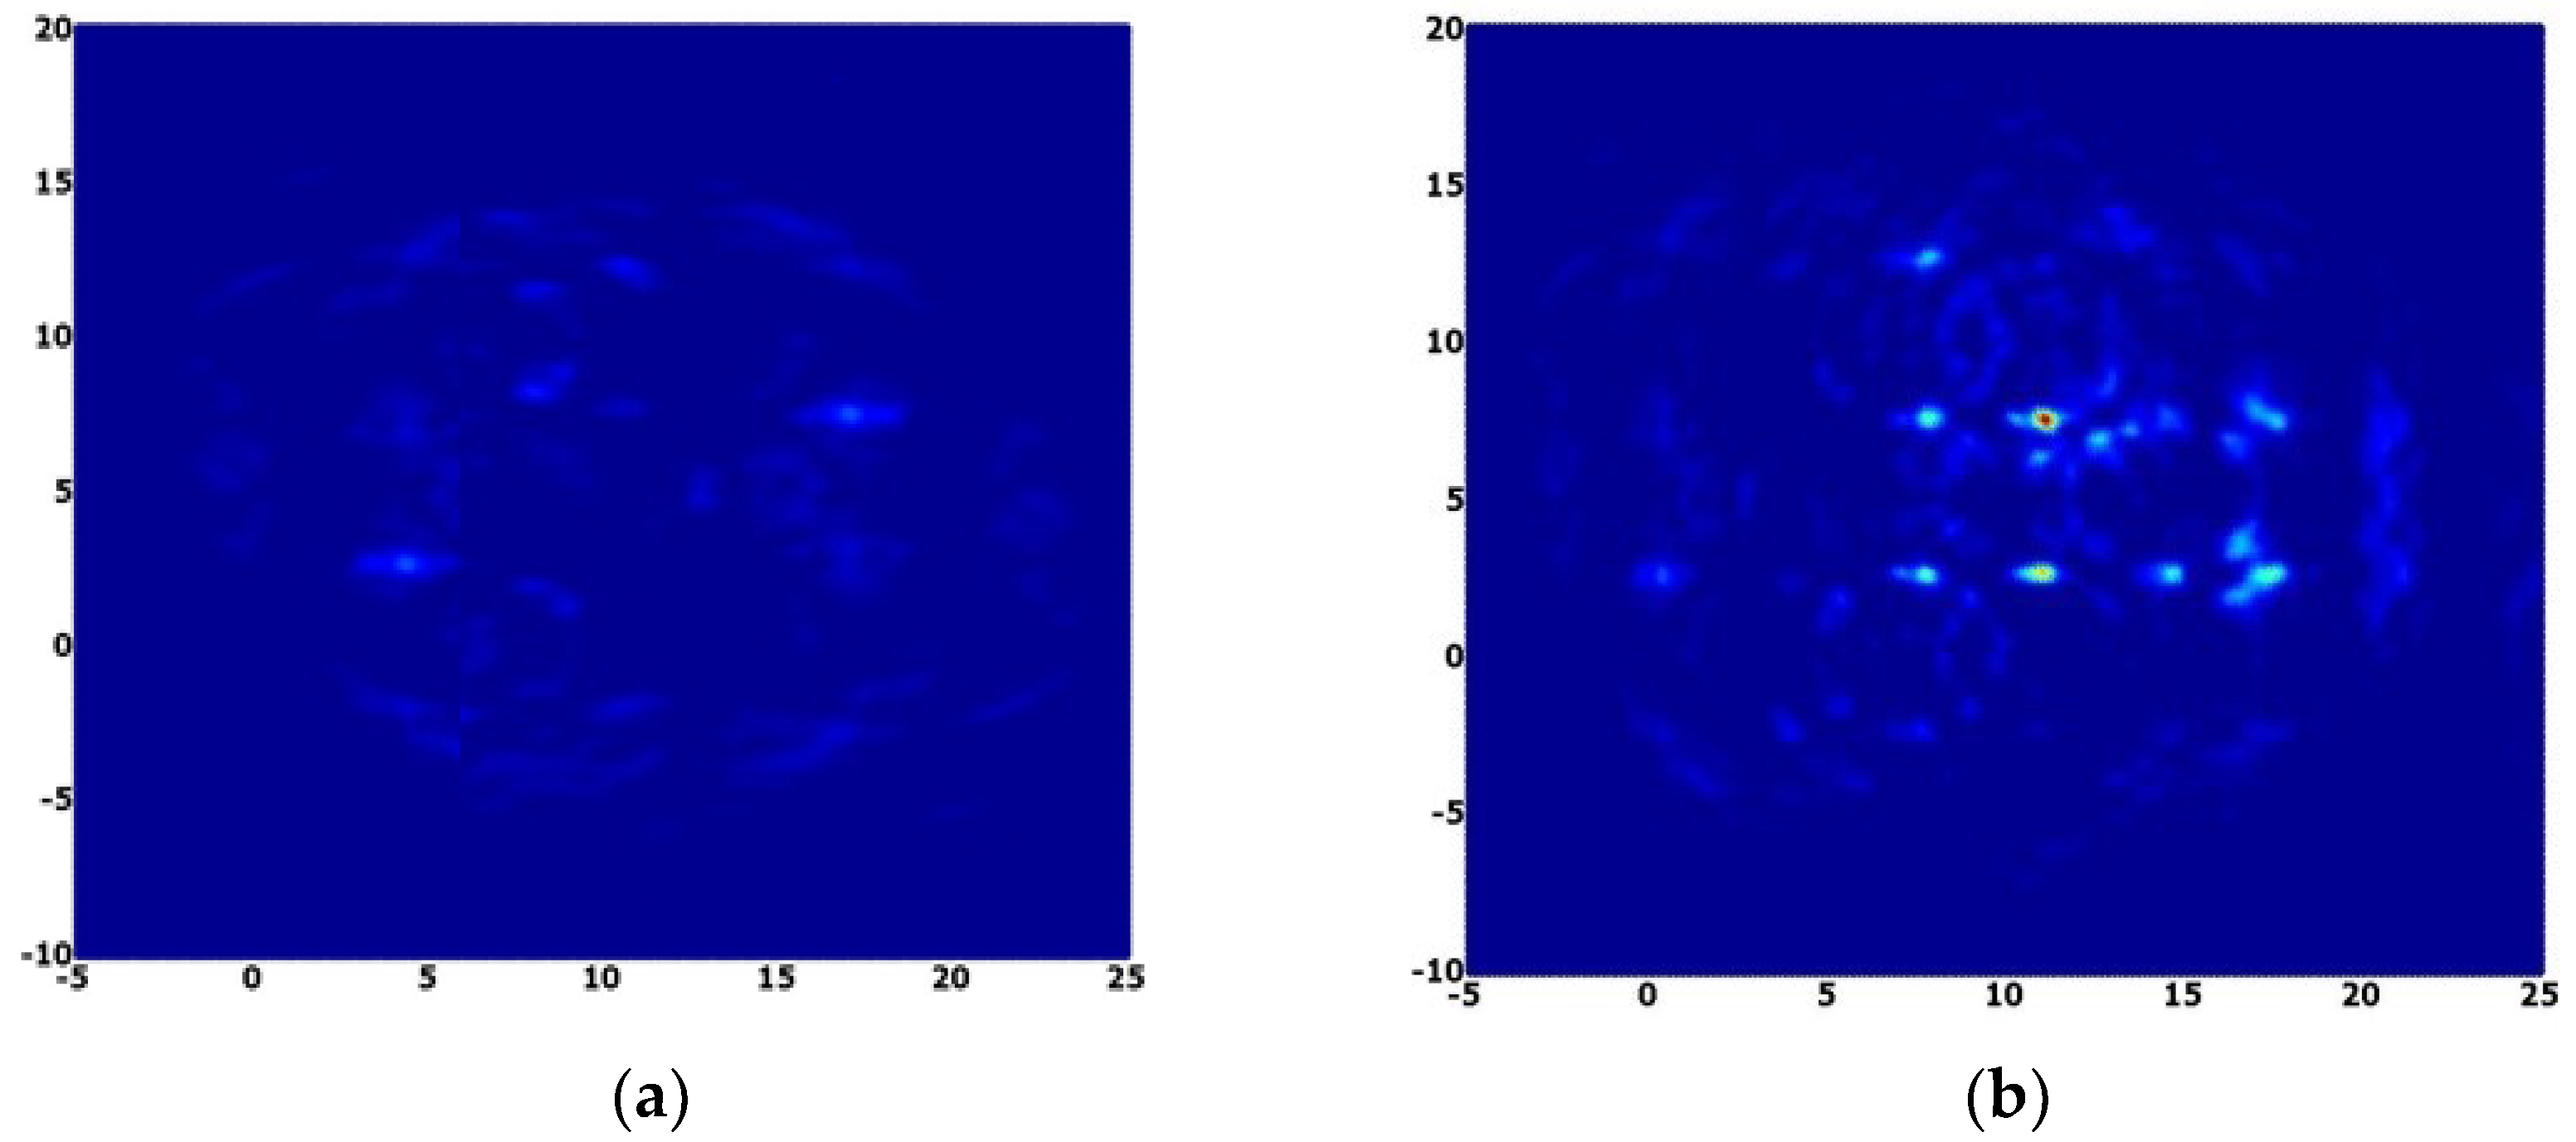
| Actual Position | Position in Image | ||||
|---|---|---|---|---|---|
| X (cm) | Y (cm) | X′ (cm) | Y′ (cm) | Localization Error (cm) | |
| UWB sensor | 10.0 | 5.0 | 10.2 | 5.2 | 0.2 |
Disclaimer/Publisher’s Note: The statements, opinions and data contained in all publications are solely those of the individual author(s) and contributor(s) and not of MDPI and/or the editor(s). MDPI and/or the editor(s) disclaim responsibility for any injury to people or property resulting from any ideas, methods, instructions or products referred to in the content. |
© 2022 by the authors. Licensee MDPI, Basel, Switzerland. This article is an open access article distributed under the terms and conditions of the Creative Commons Attribution (CC BY) license (https://creativecommons.org/licenses/by/4.0/).
Share and Cite
Jamlos, M.A.; Jamlos, M.F.; Mustafa, W.A.; Othman, N.A.; Rohani, M.N.K.H.; Saidi, S.A.; Sarip, M.S.M.; Mohd Nawi, M.A.H. Reduced Graphene Oxide UWB Array Sensor: High Performance for Brain Tumor Imaging and Detection. Nanomaterials 2023, 13, 27. https://0-doi-org.brum.beds.ac.uk/10.3390/nano13010027
Jamlos MA, Jamlos MF, Mustafa WA, Othman NA, Rohani MNKH, Saidi SA, Sarip MSM, Mohd Nawi MAH. Reduced Graphene Oxide UWB Array Sensor: High Performance for Brain Tumor Imaging and Detection. Nanomaterials. 2023; 13(1):27. https://0-doi-org.brum.beds.ac.uk/10.3390/nano13010027
Chicago/Turabian StyleJamlos, Mohd Aminudin, Mohd Faizal Jamlos, Wan Azani Mustafa, Nur Amirah Othman, Mohamad Nur Khairul Hafizi Rohani, Syahrul Affandi Saidi, Mohd Sharizan Md Sarip, and Mohd Al Hafiz Mohd Nawi. 2023. "Reduced Graphene Oxide UWB Array Sensor: High Performance for Brain Tumor Imaging and Detection" Nanomaterials 13, no. 1: 27. https://0-doi-org.brum.beds.ac.uk/10.3390/nano13010027