
Metal Scrap to Hydrogen: Manufacture of Hydroreactive Solid Shapes via Combination of Ball Milling, Cold Pressing, and Spark Plasma Sintering

Abstract
:1. Introduction
2. Materials and Methods
2.1. Original Materials and Samples Manufacturing
2.2. Samples Characterization
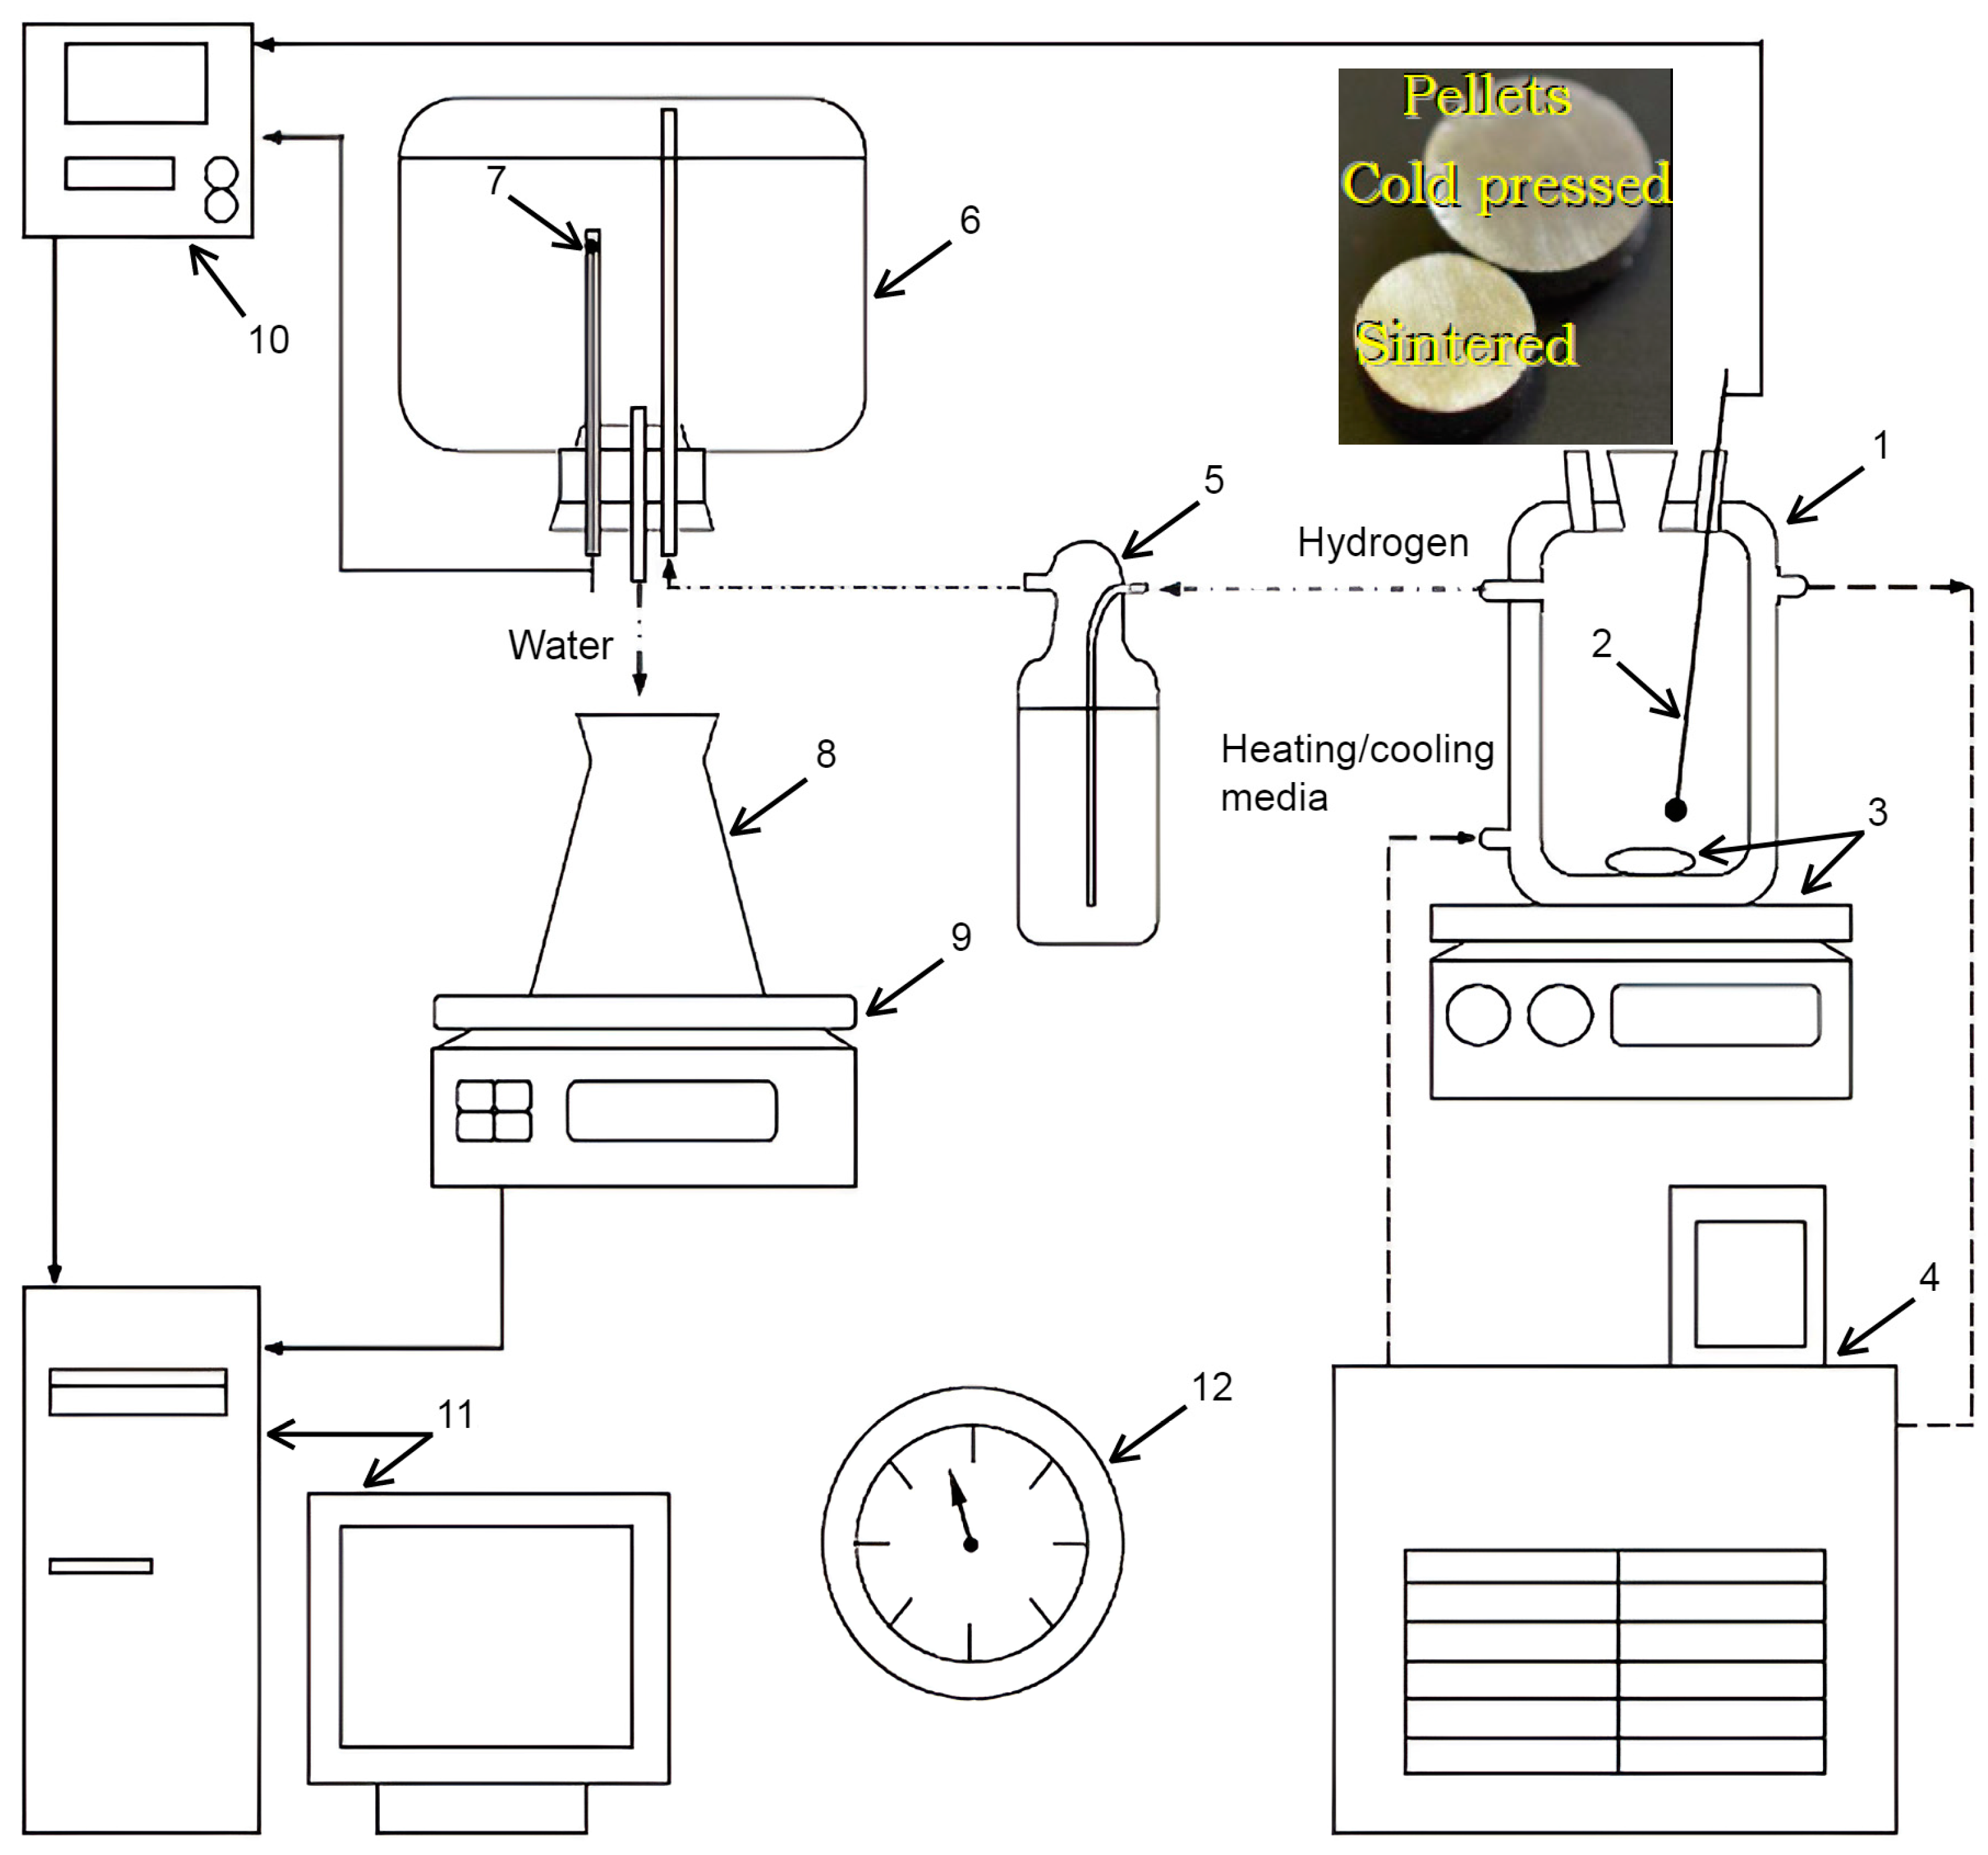
2.3. Test Facility and Experimental Procedure
2.4. Experimental Data Processing
3. Results and Discussion
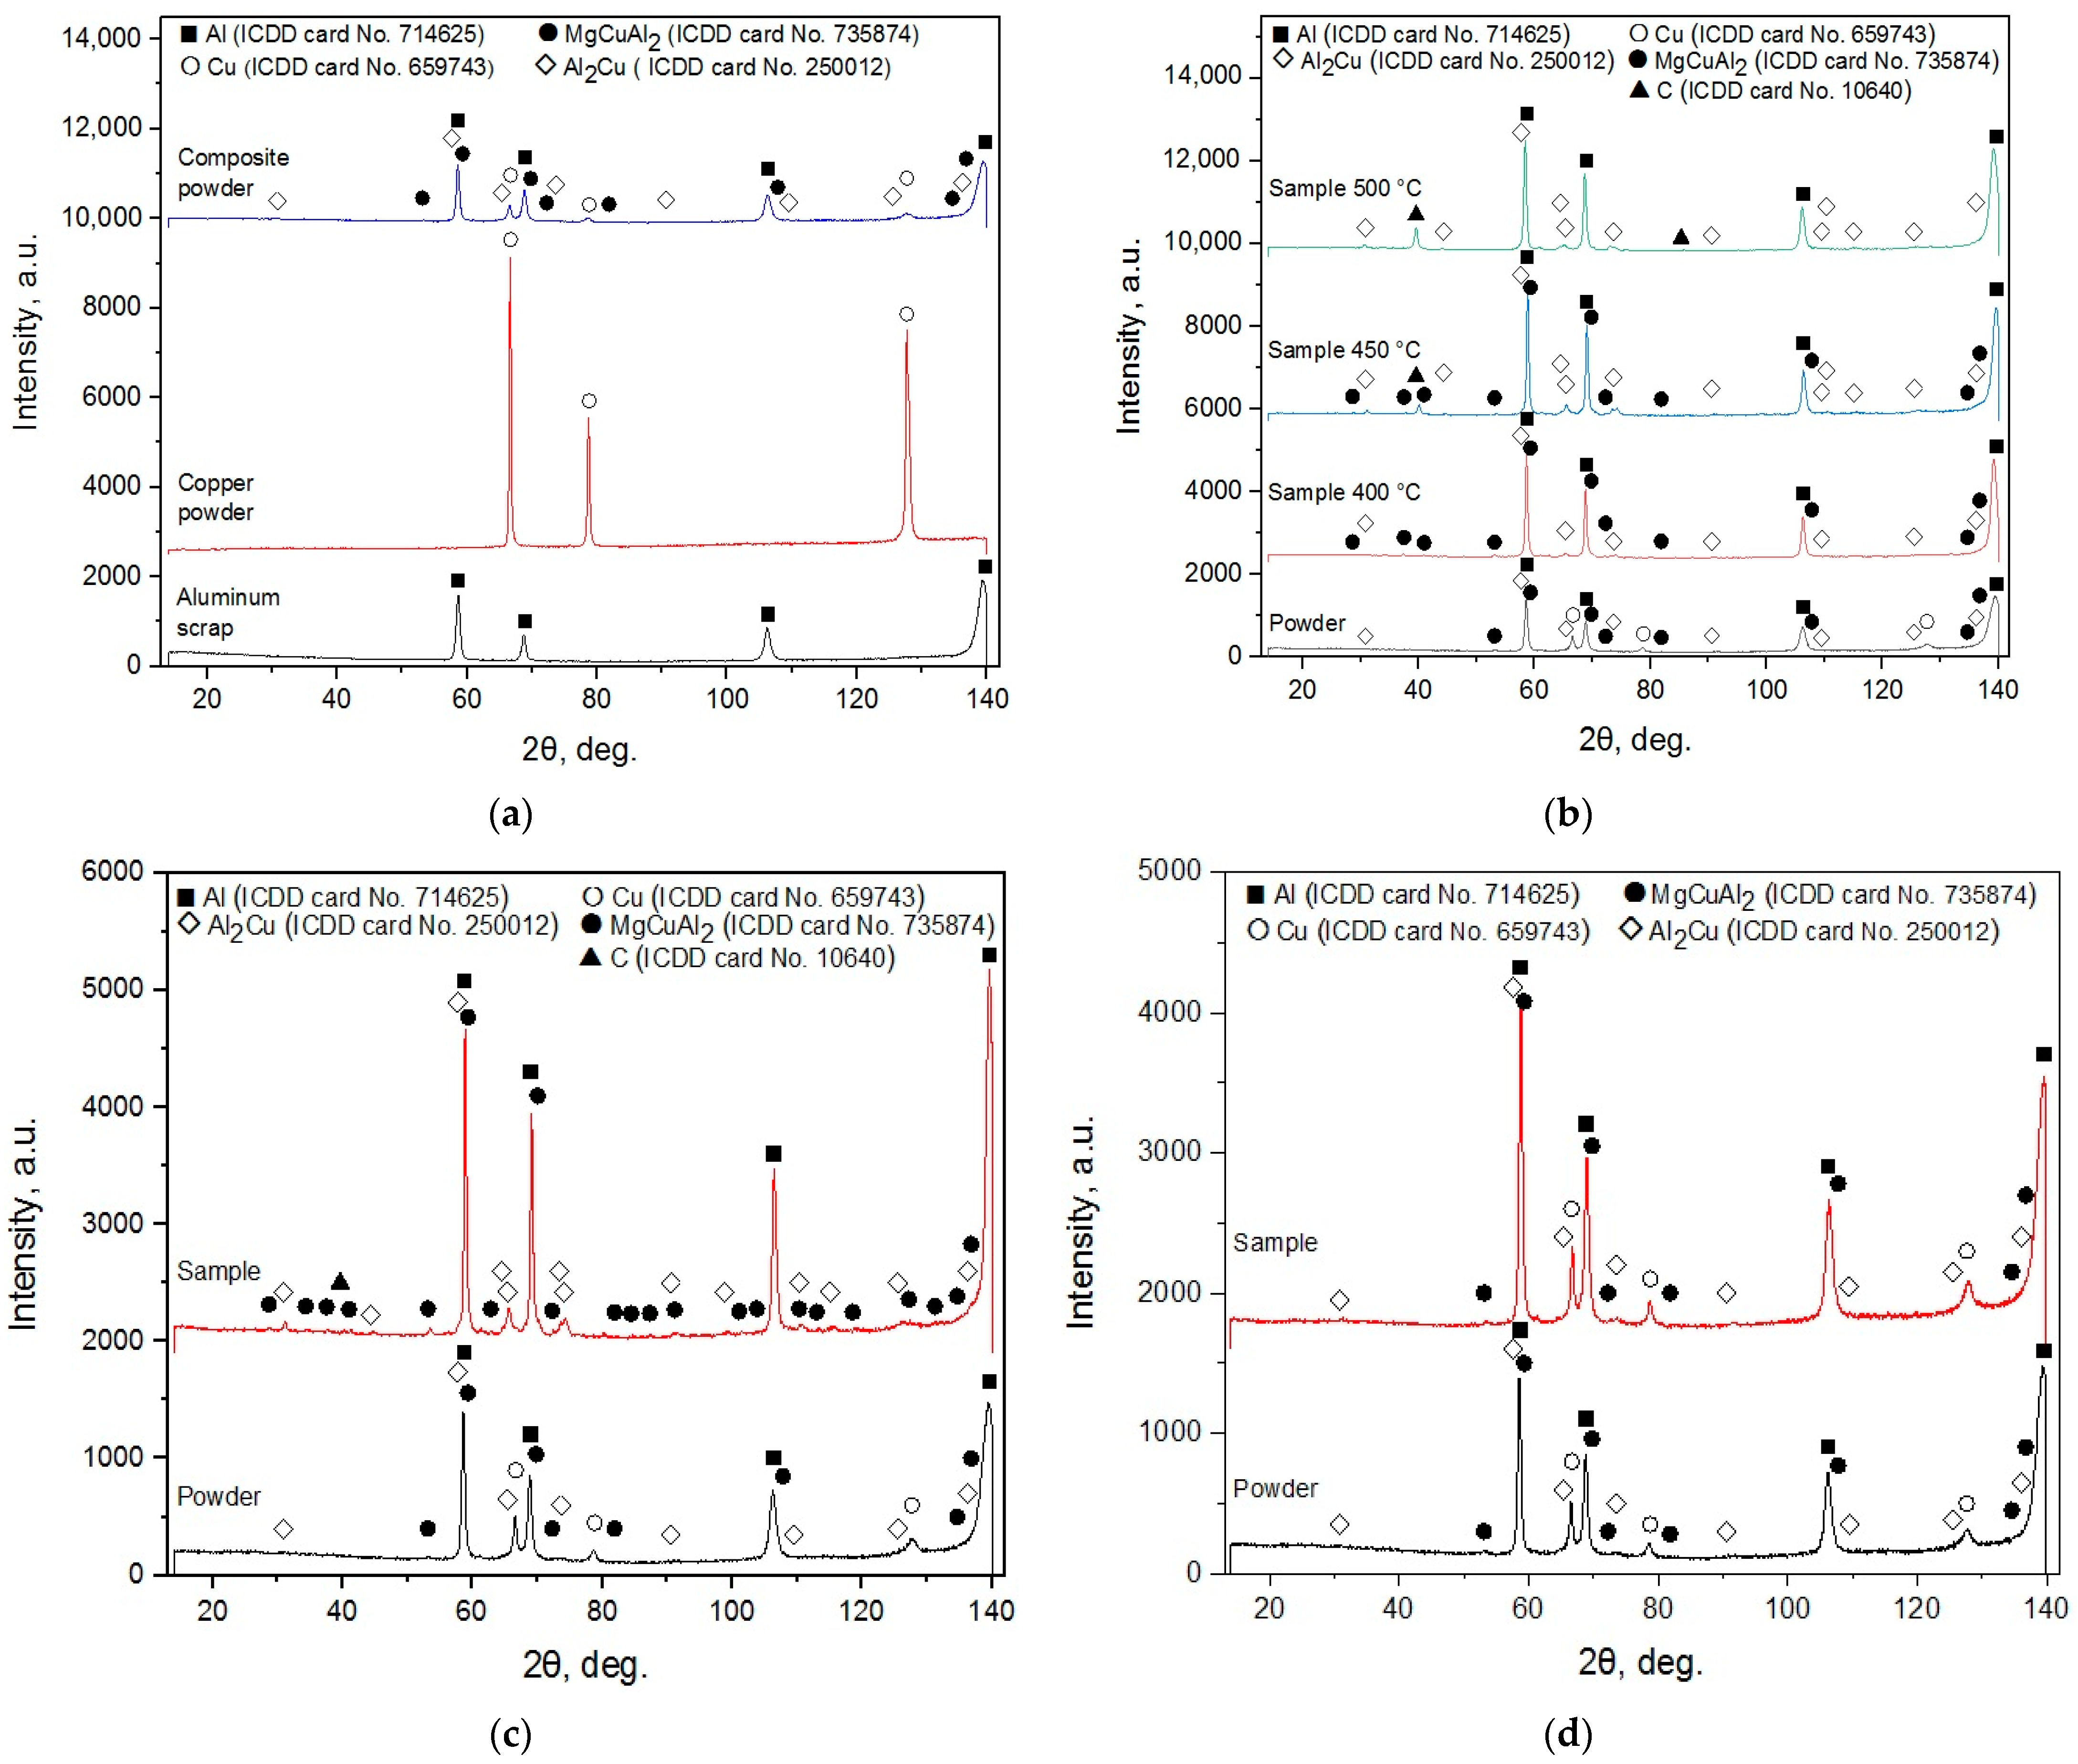
3.1. Phase Composition
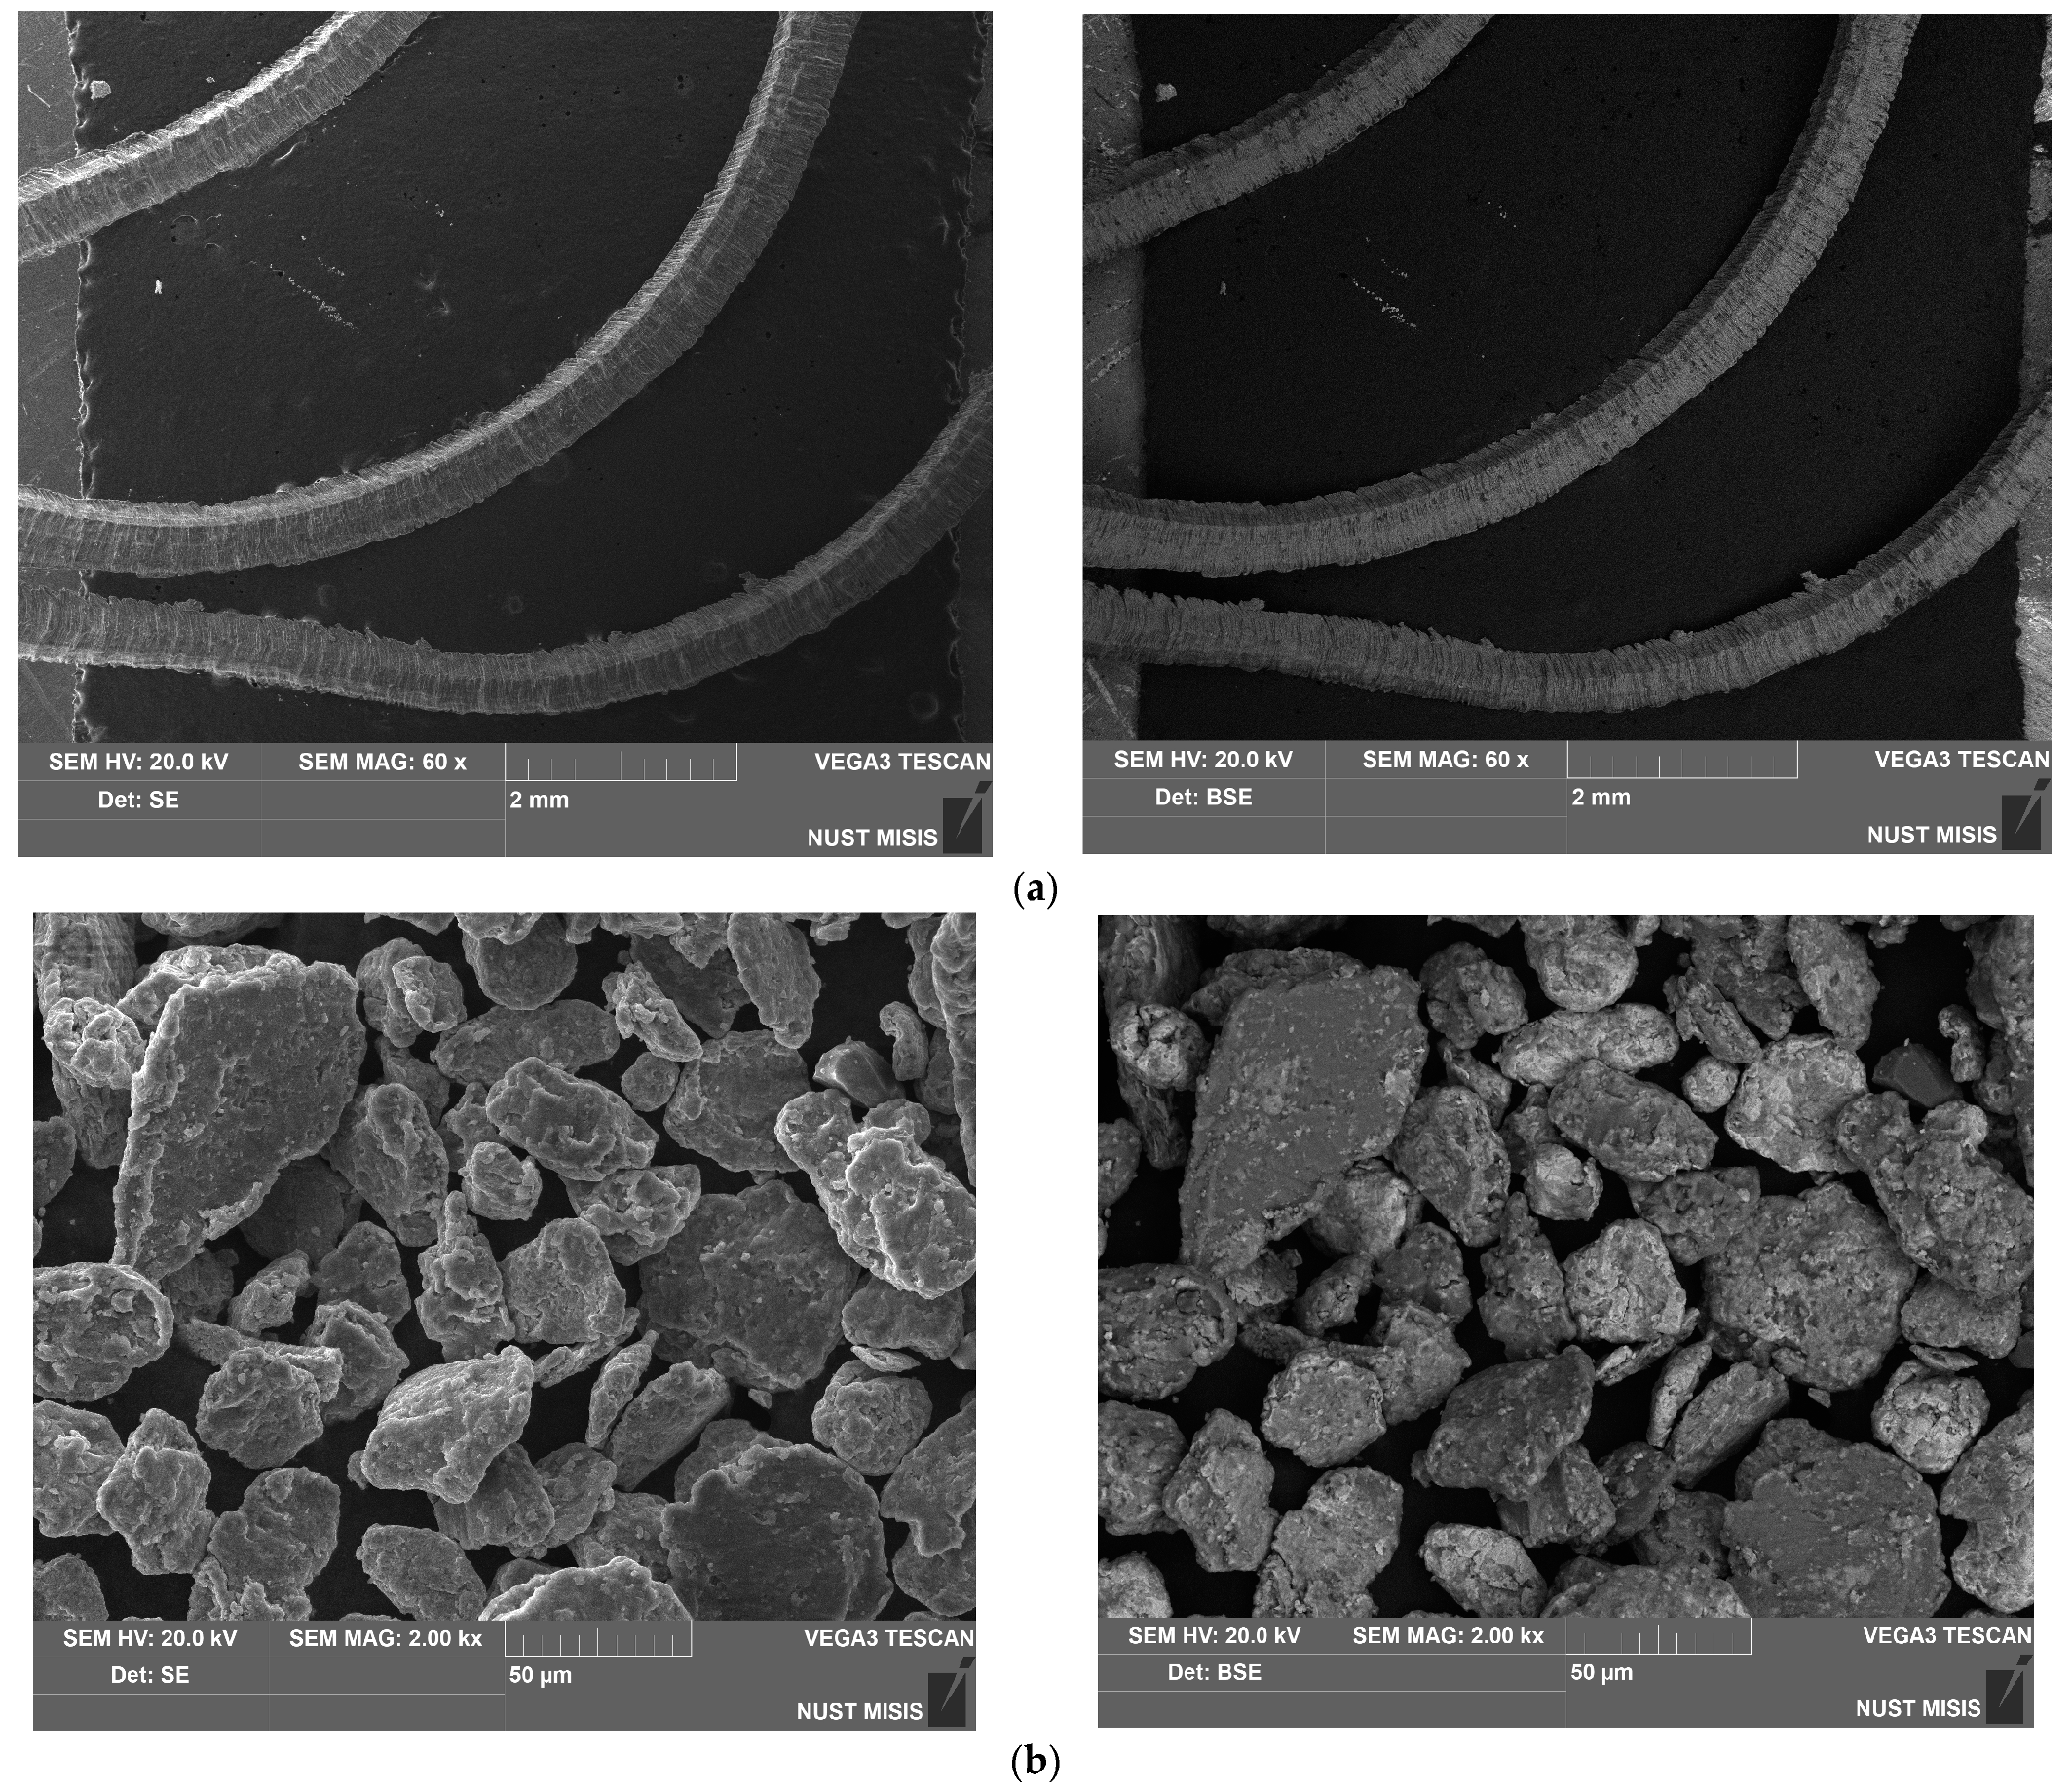
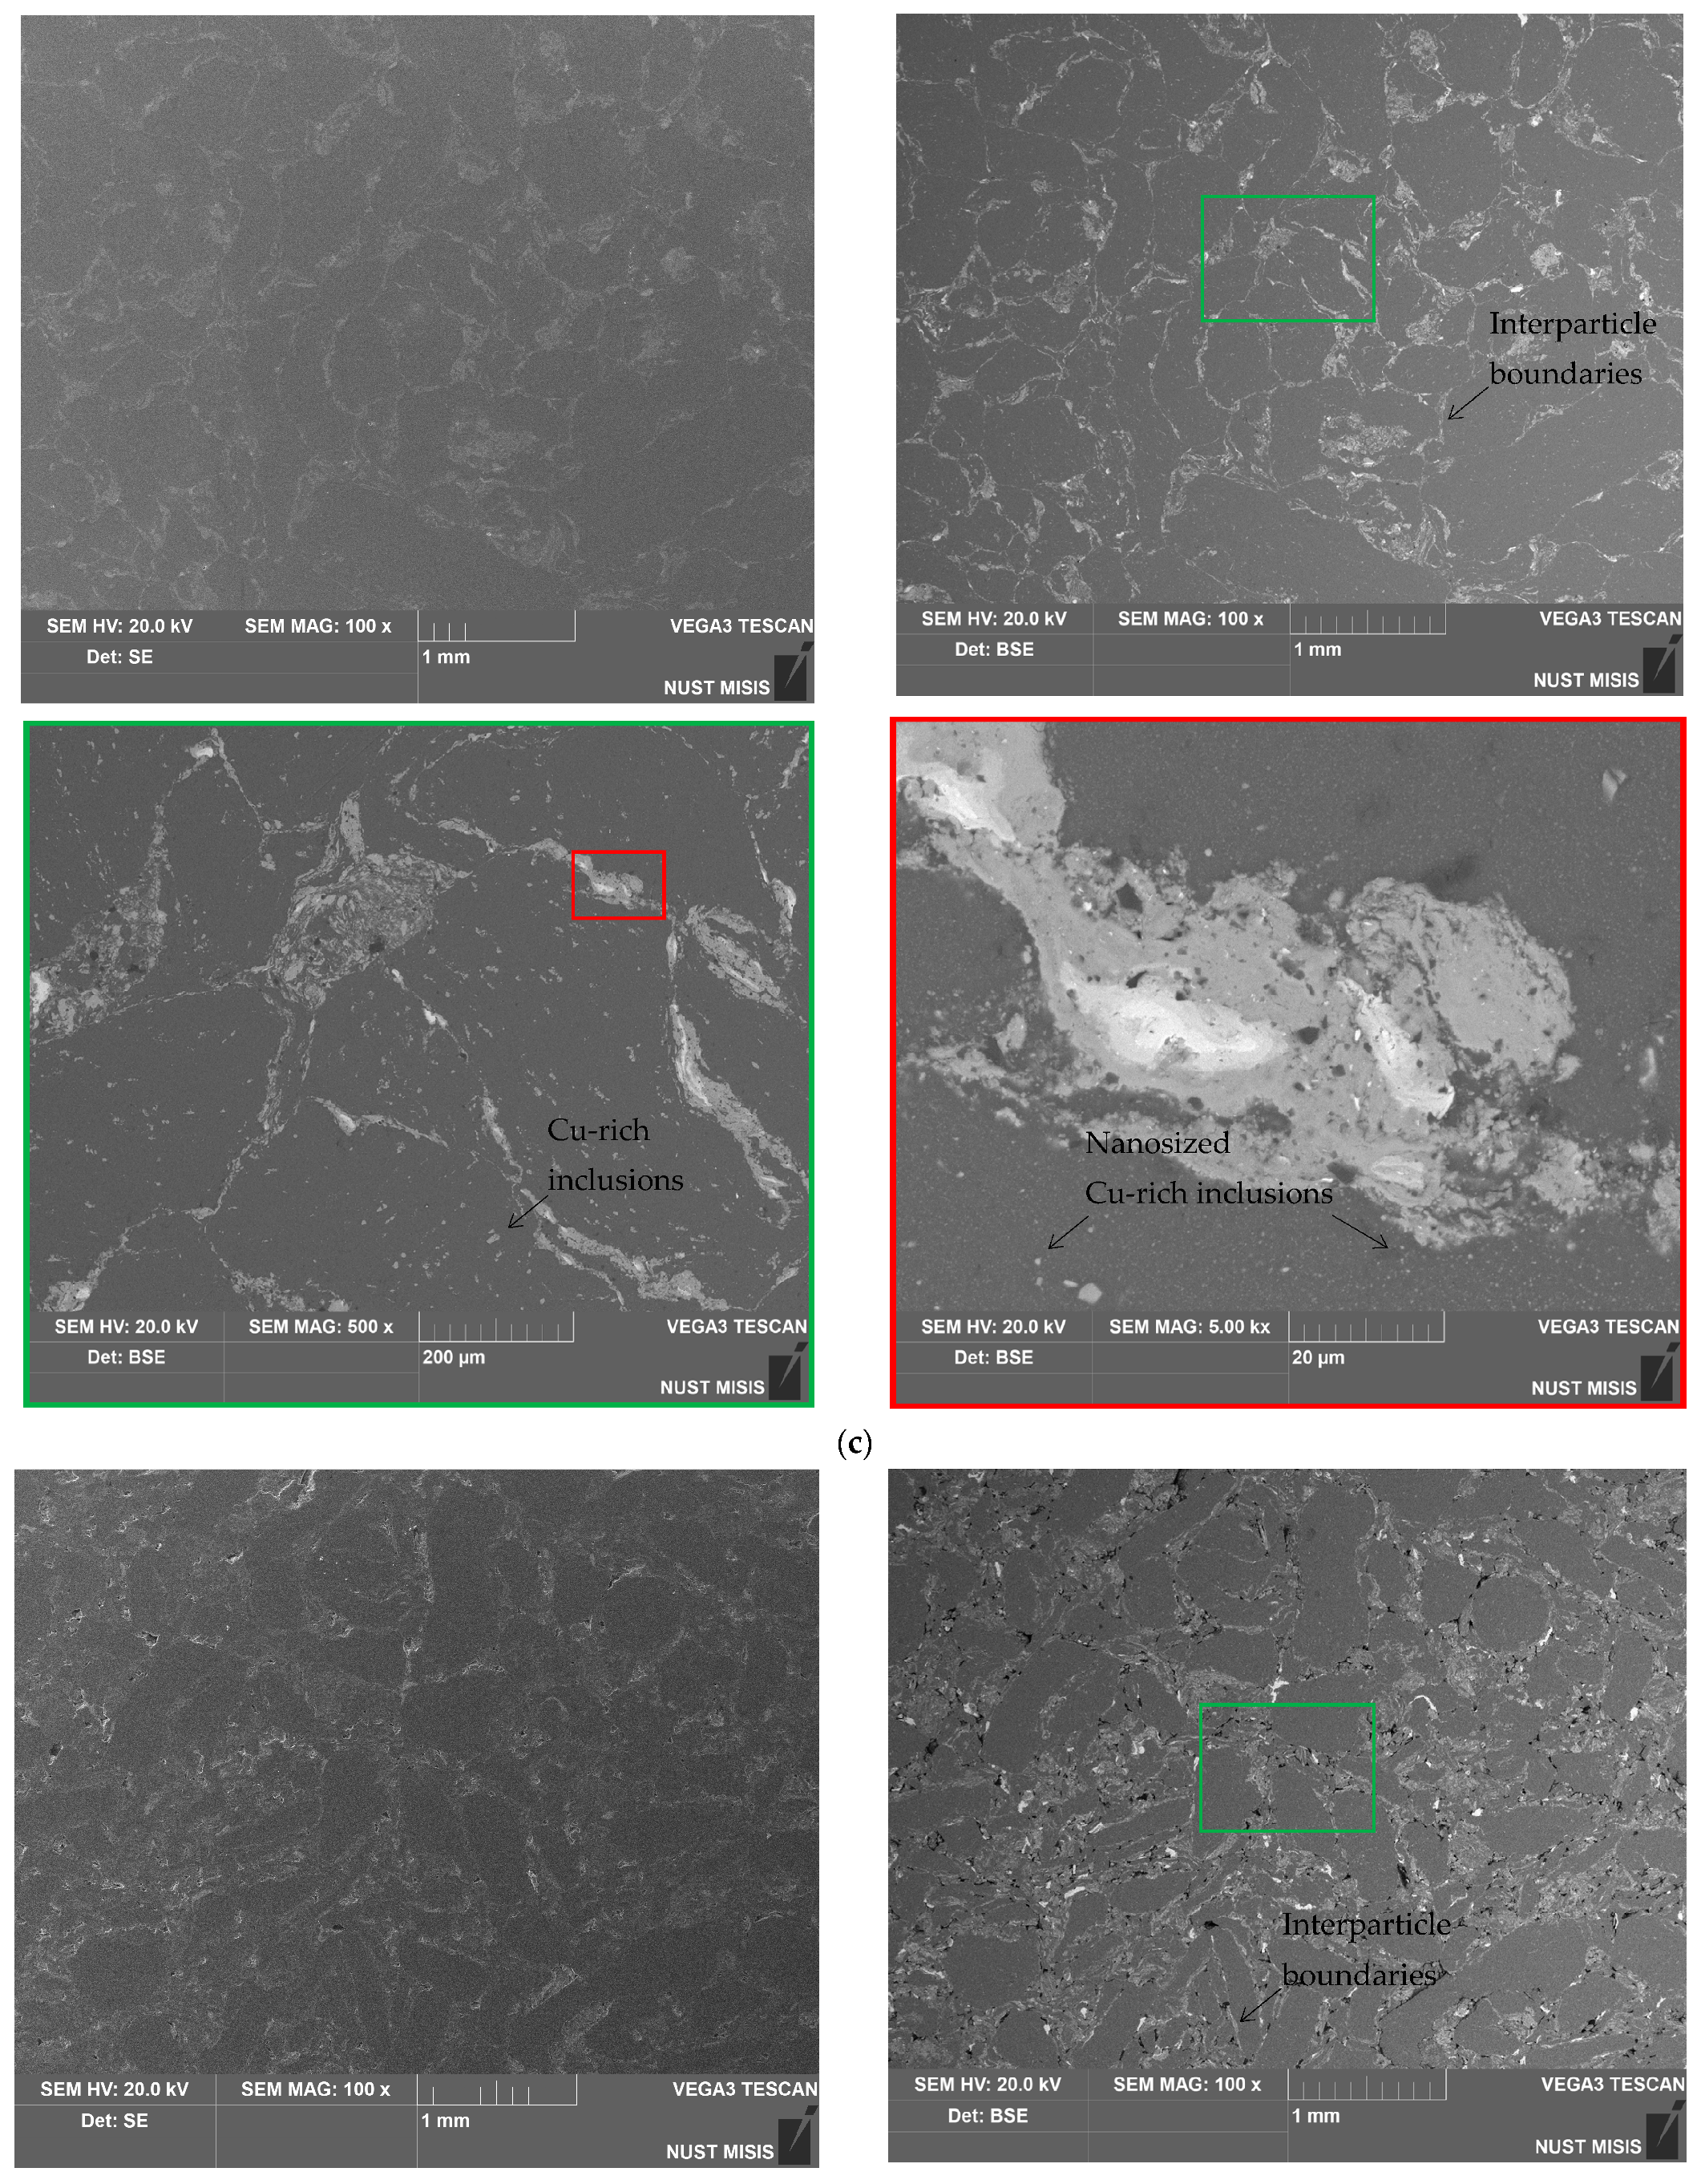
3.2. Microstructure
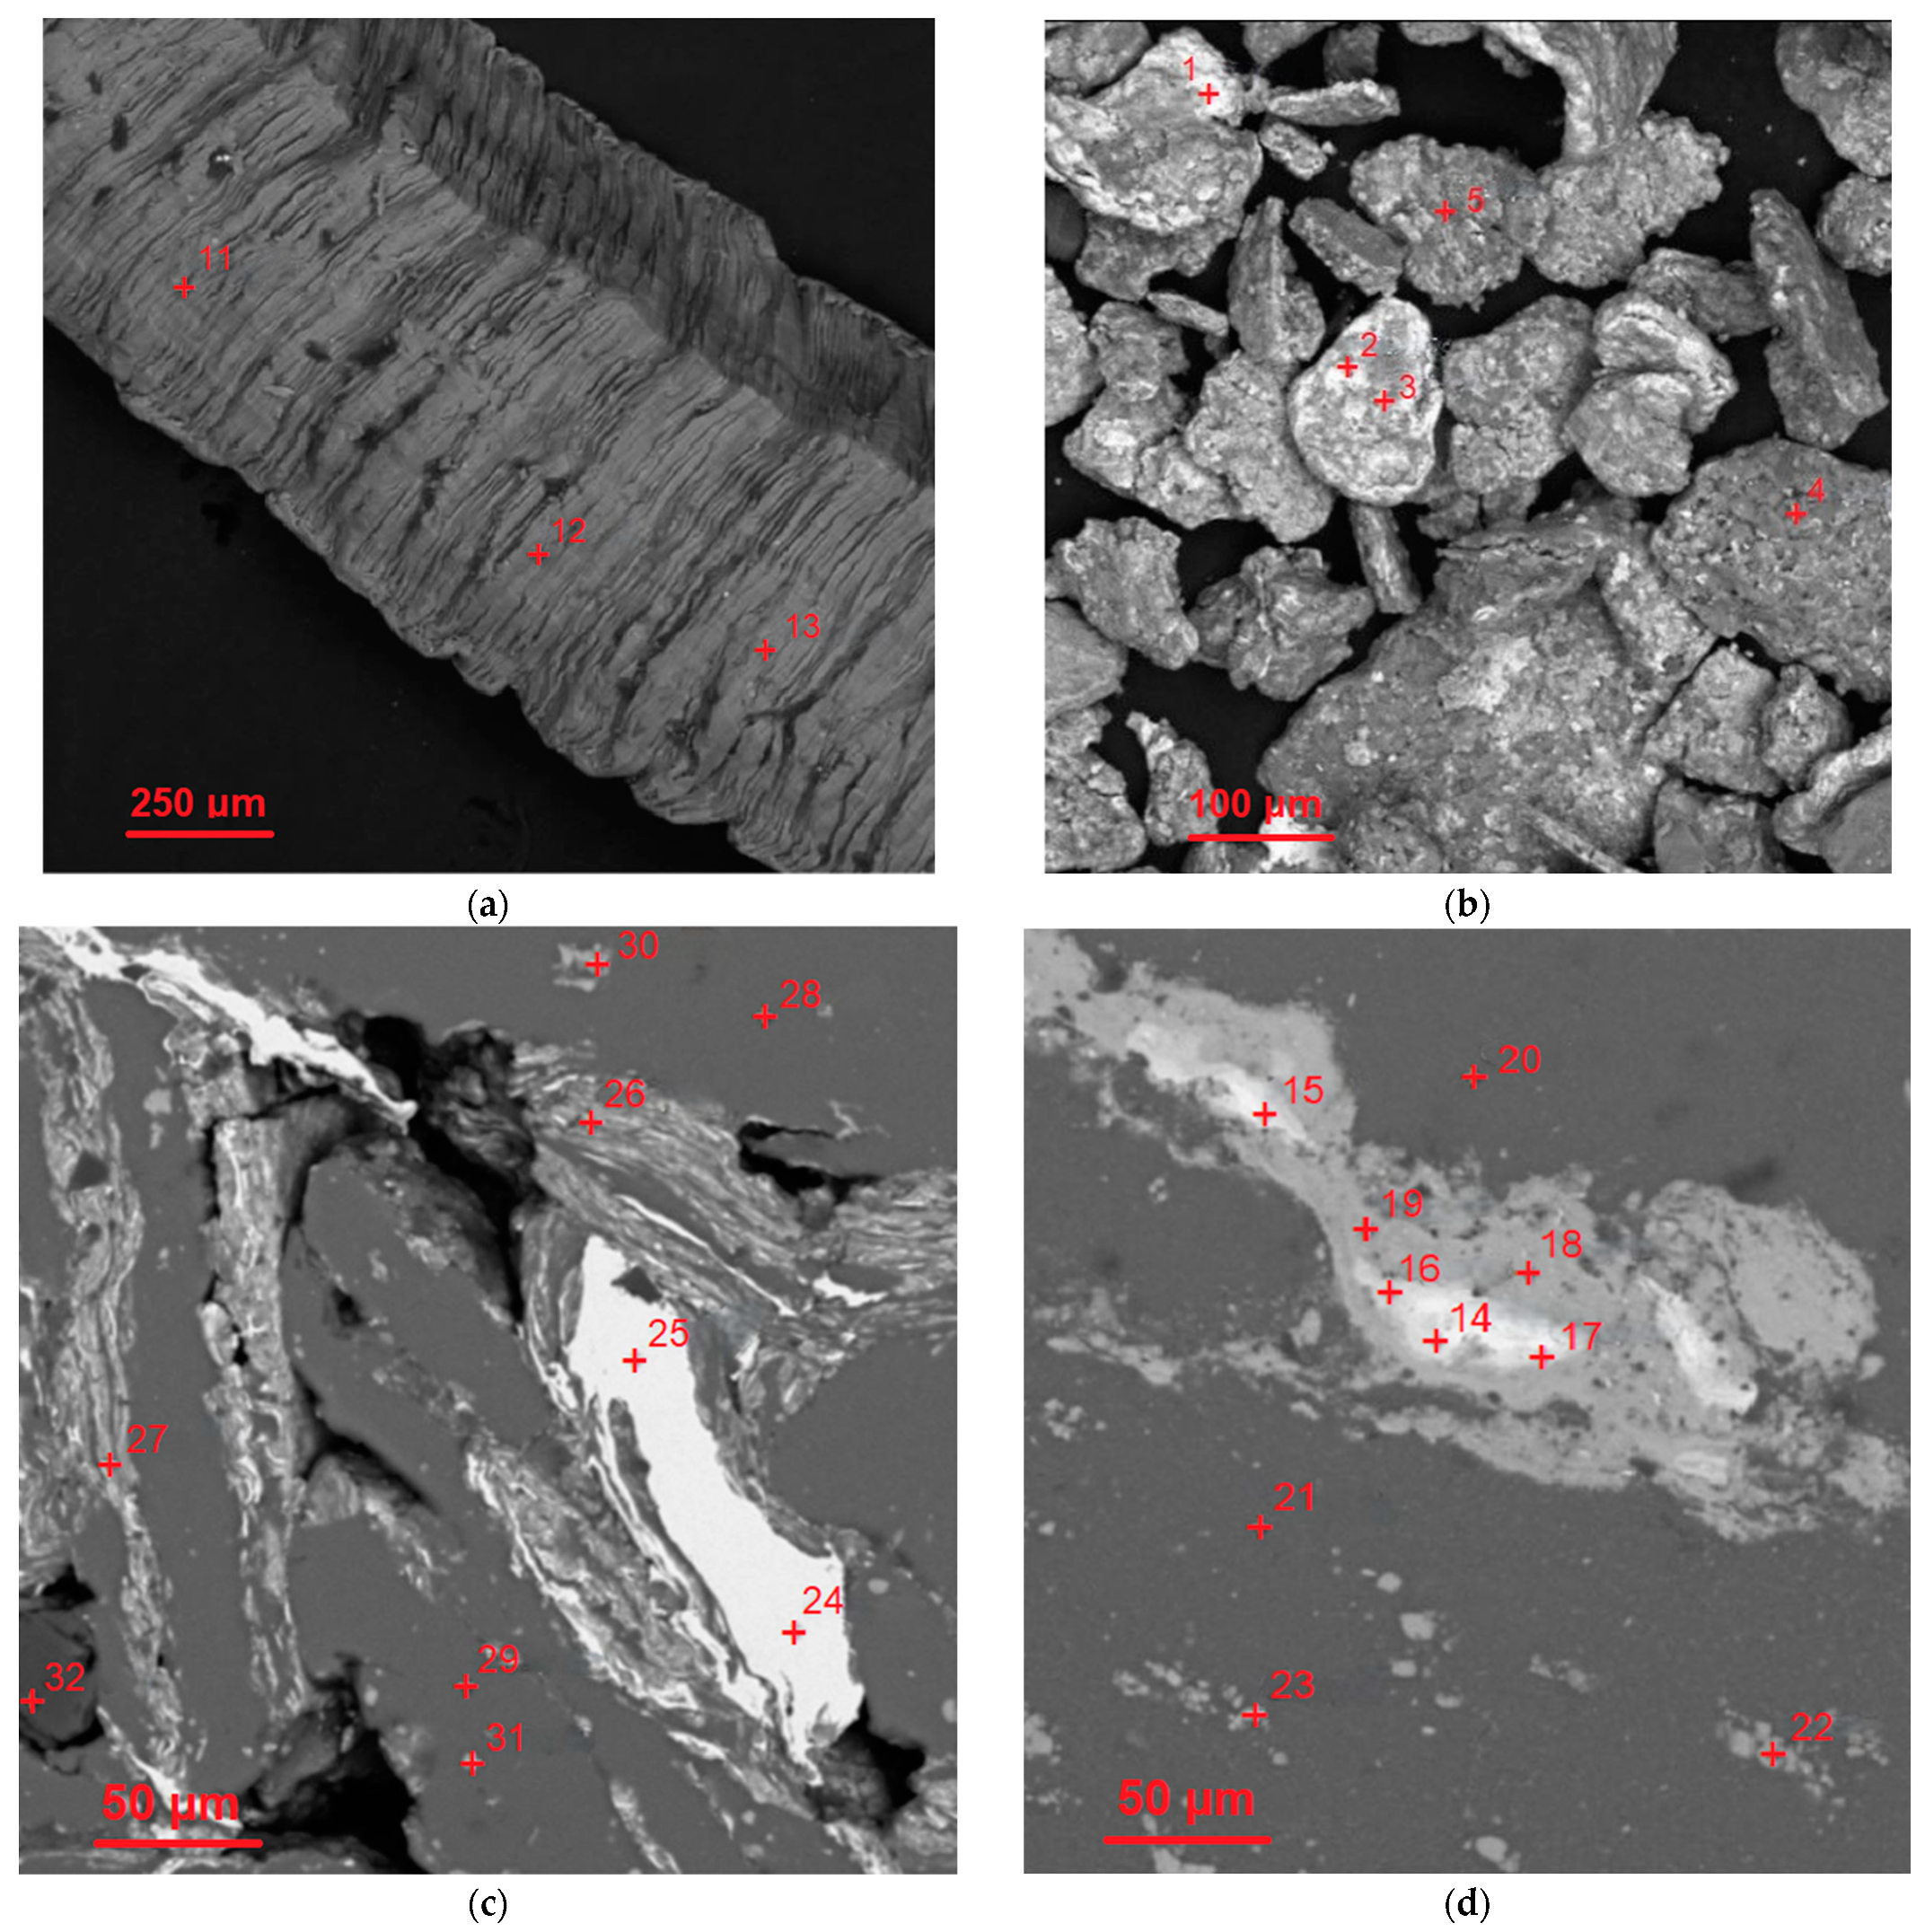
3.3. Elemental Analysis
3.4. Reaction Kinetics
3.5. Potential for Practical Application: Challenges, and Possible Remedies
4. Conclusions
- -
- In addition to Al and Cu, the composite powder contained minor amounts of new phases, CuAl2 and MgCuAl2, and the same set of compounds was detected in the case of the cold-pressed samples, while for the sintered ones, no Cu was identified;
- -
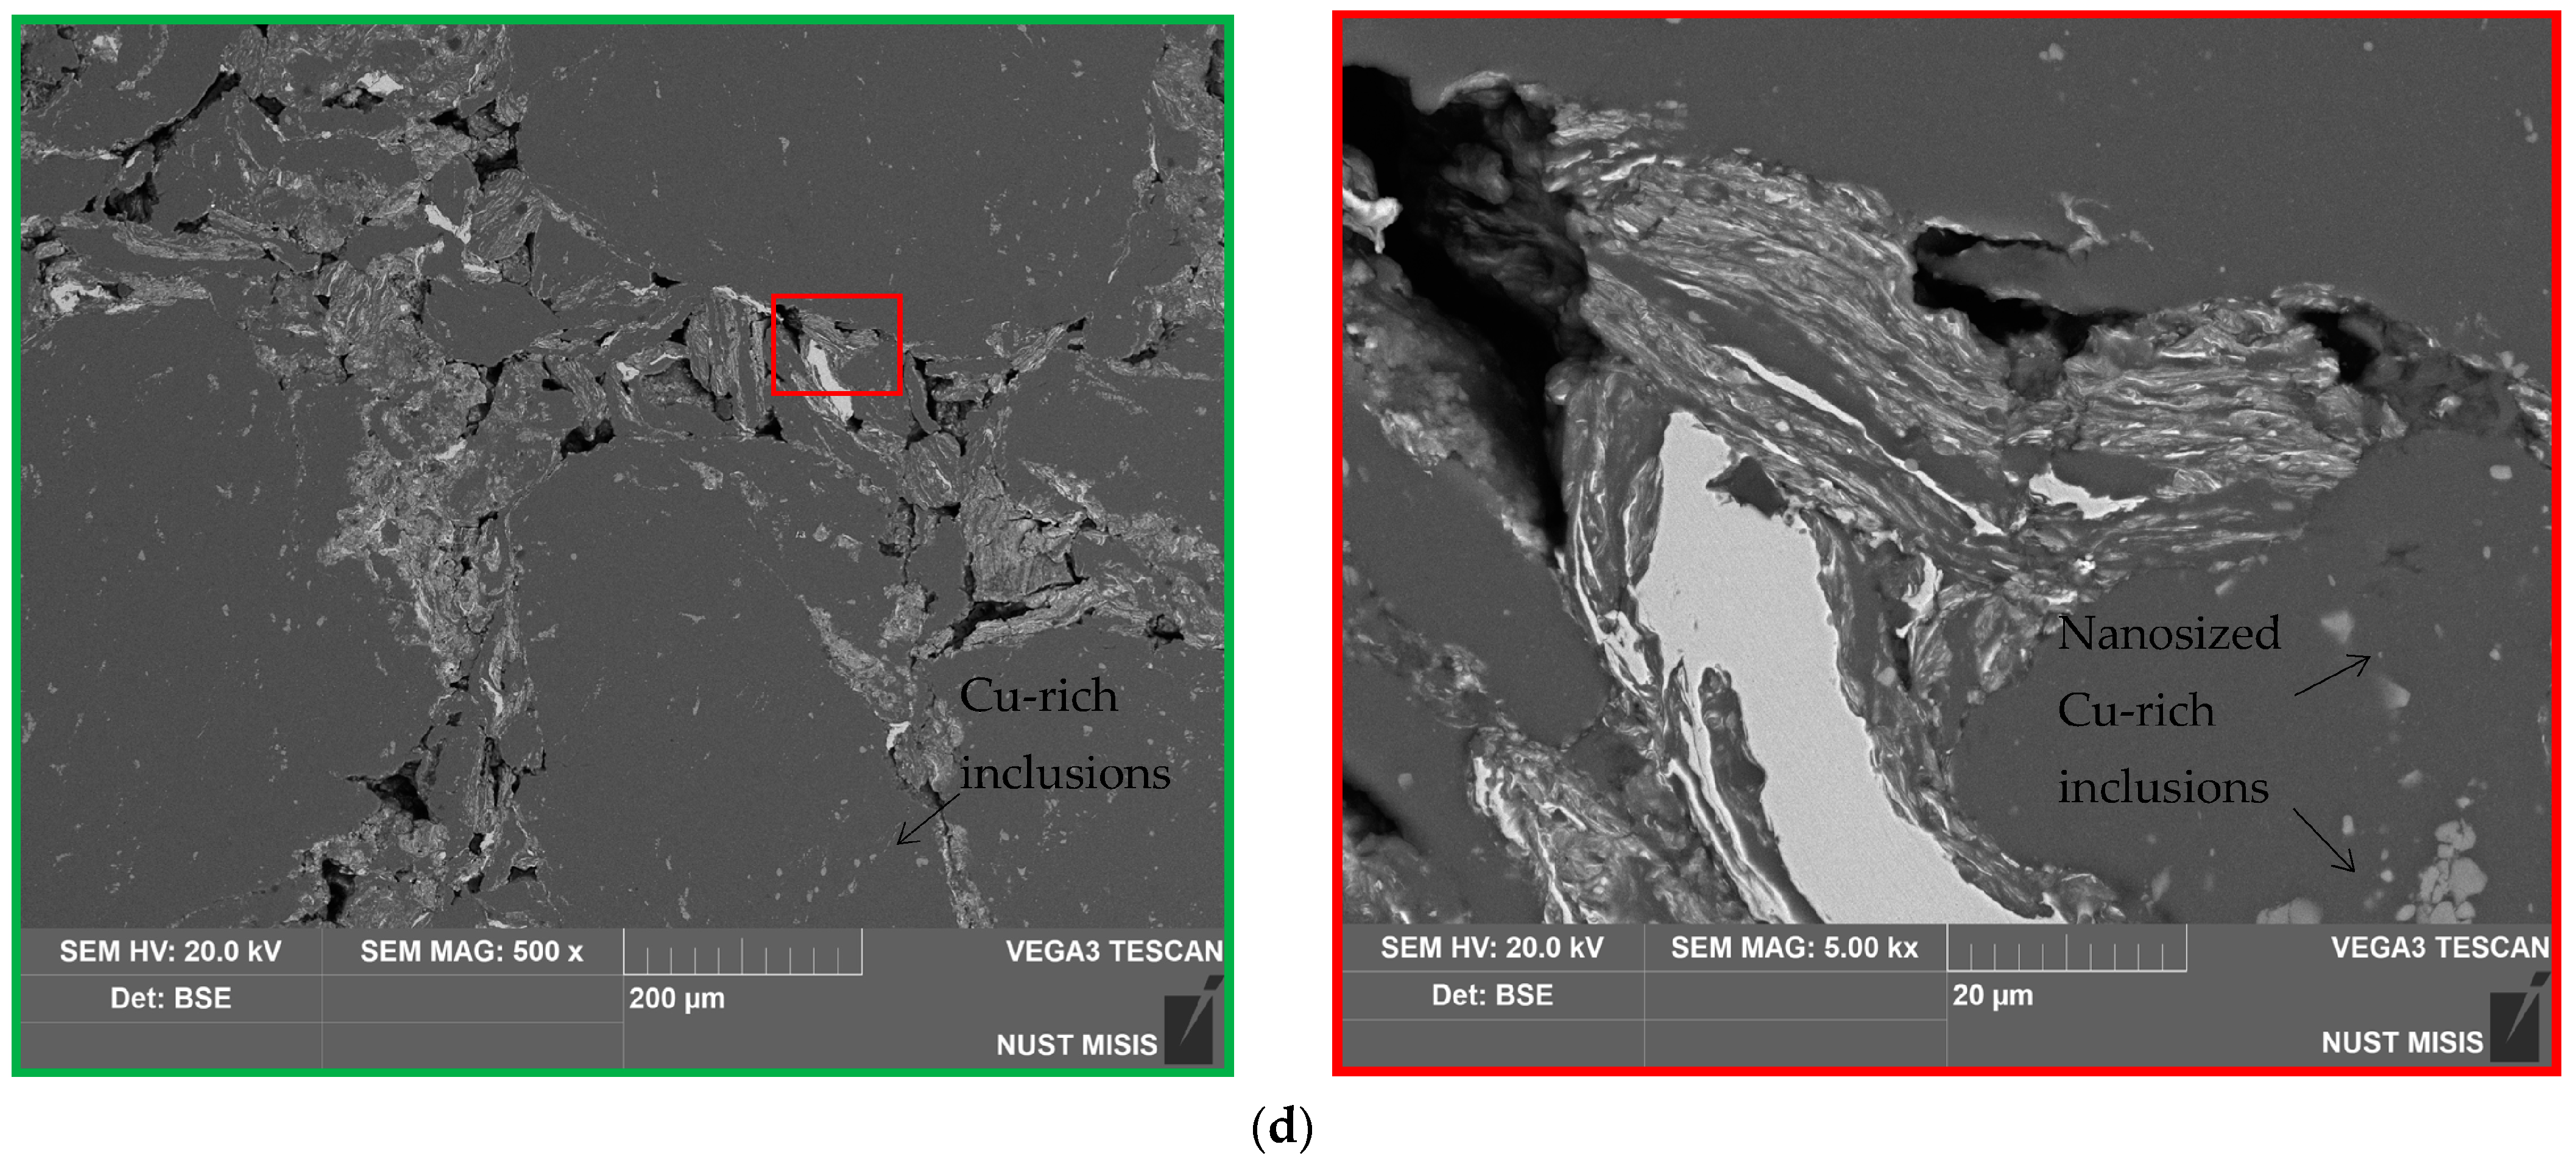
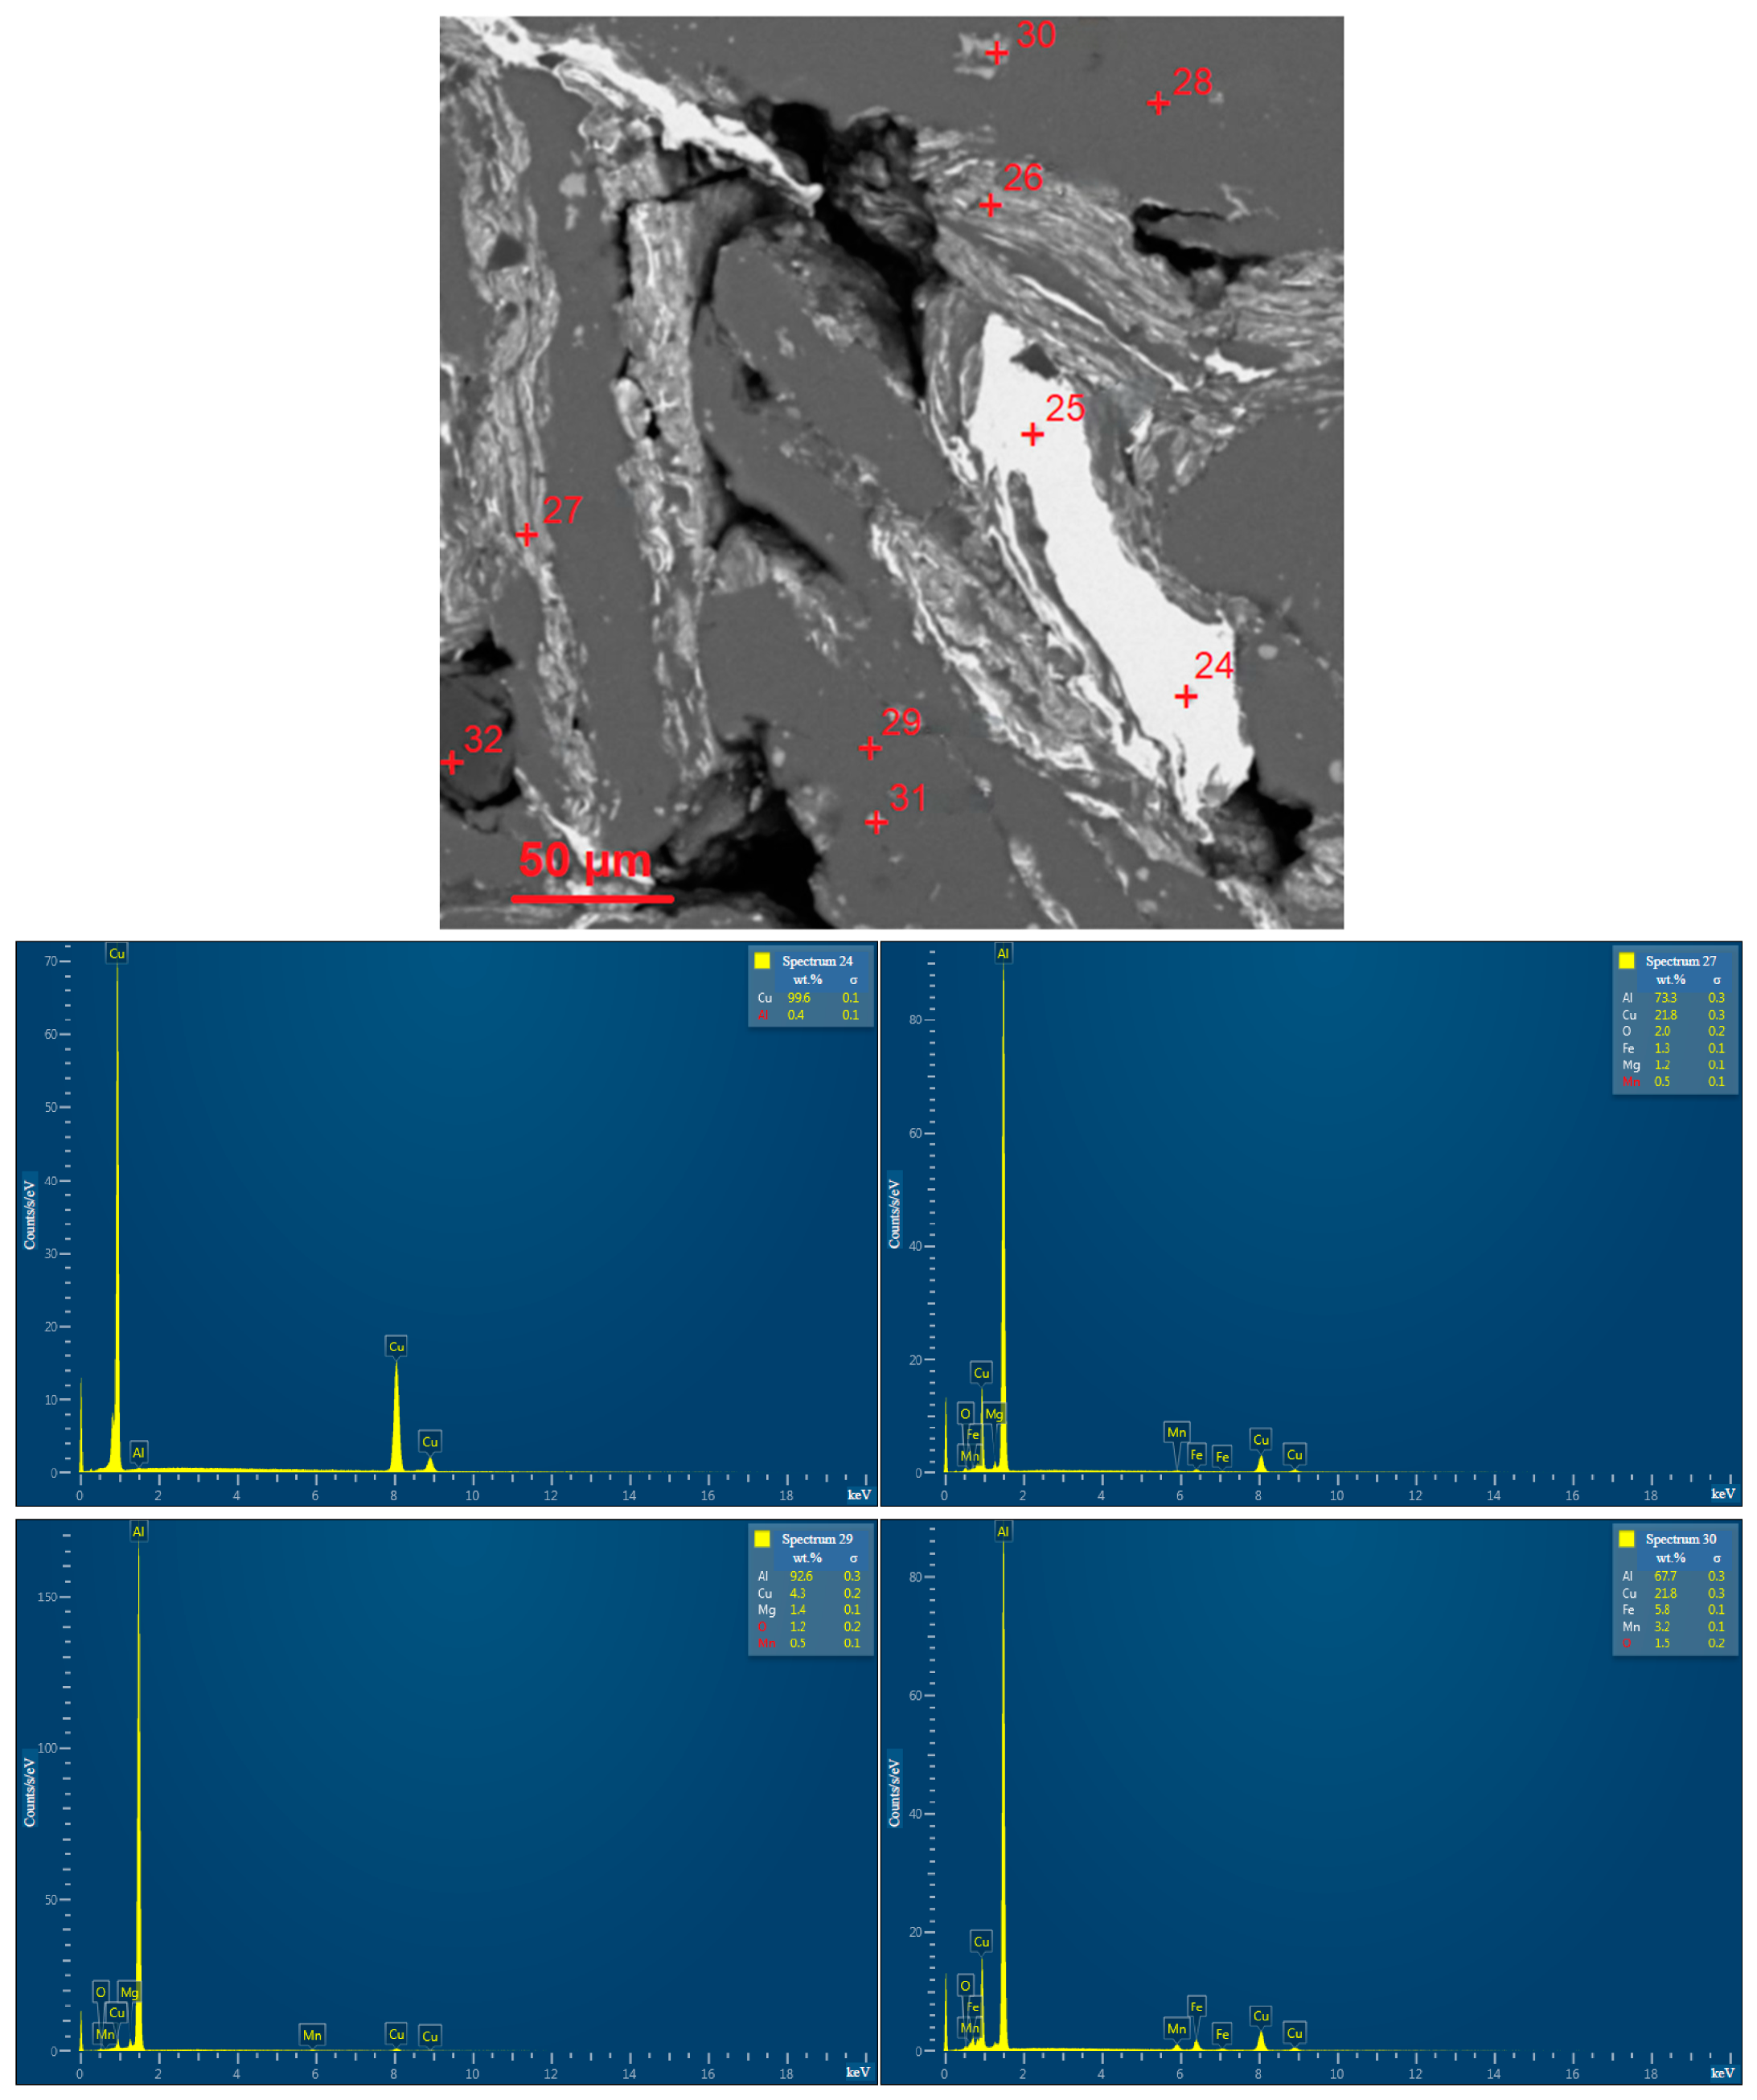
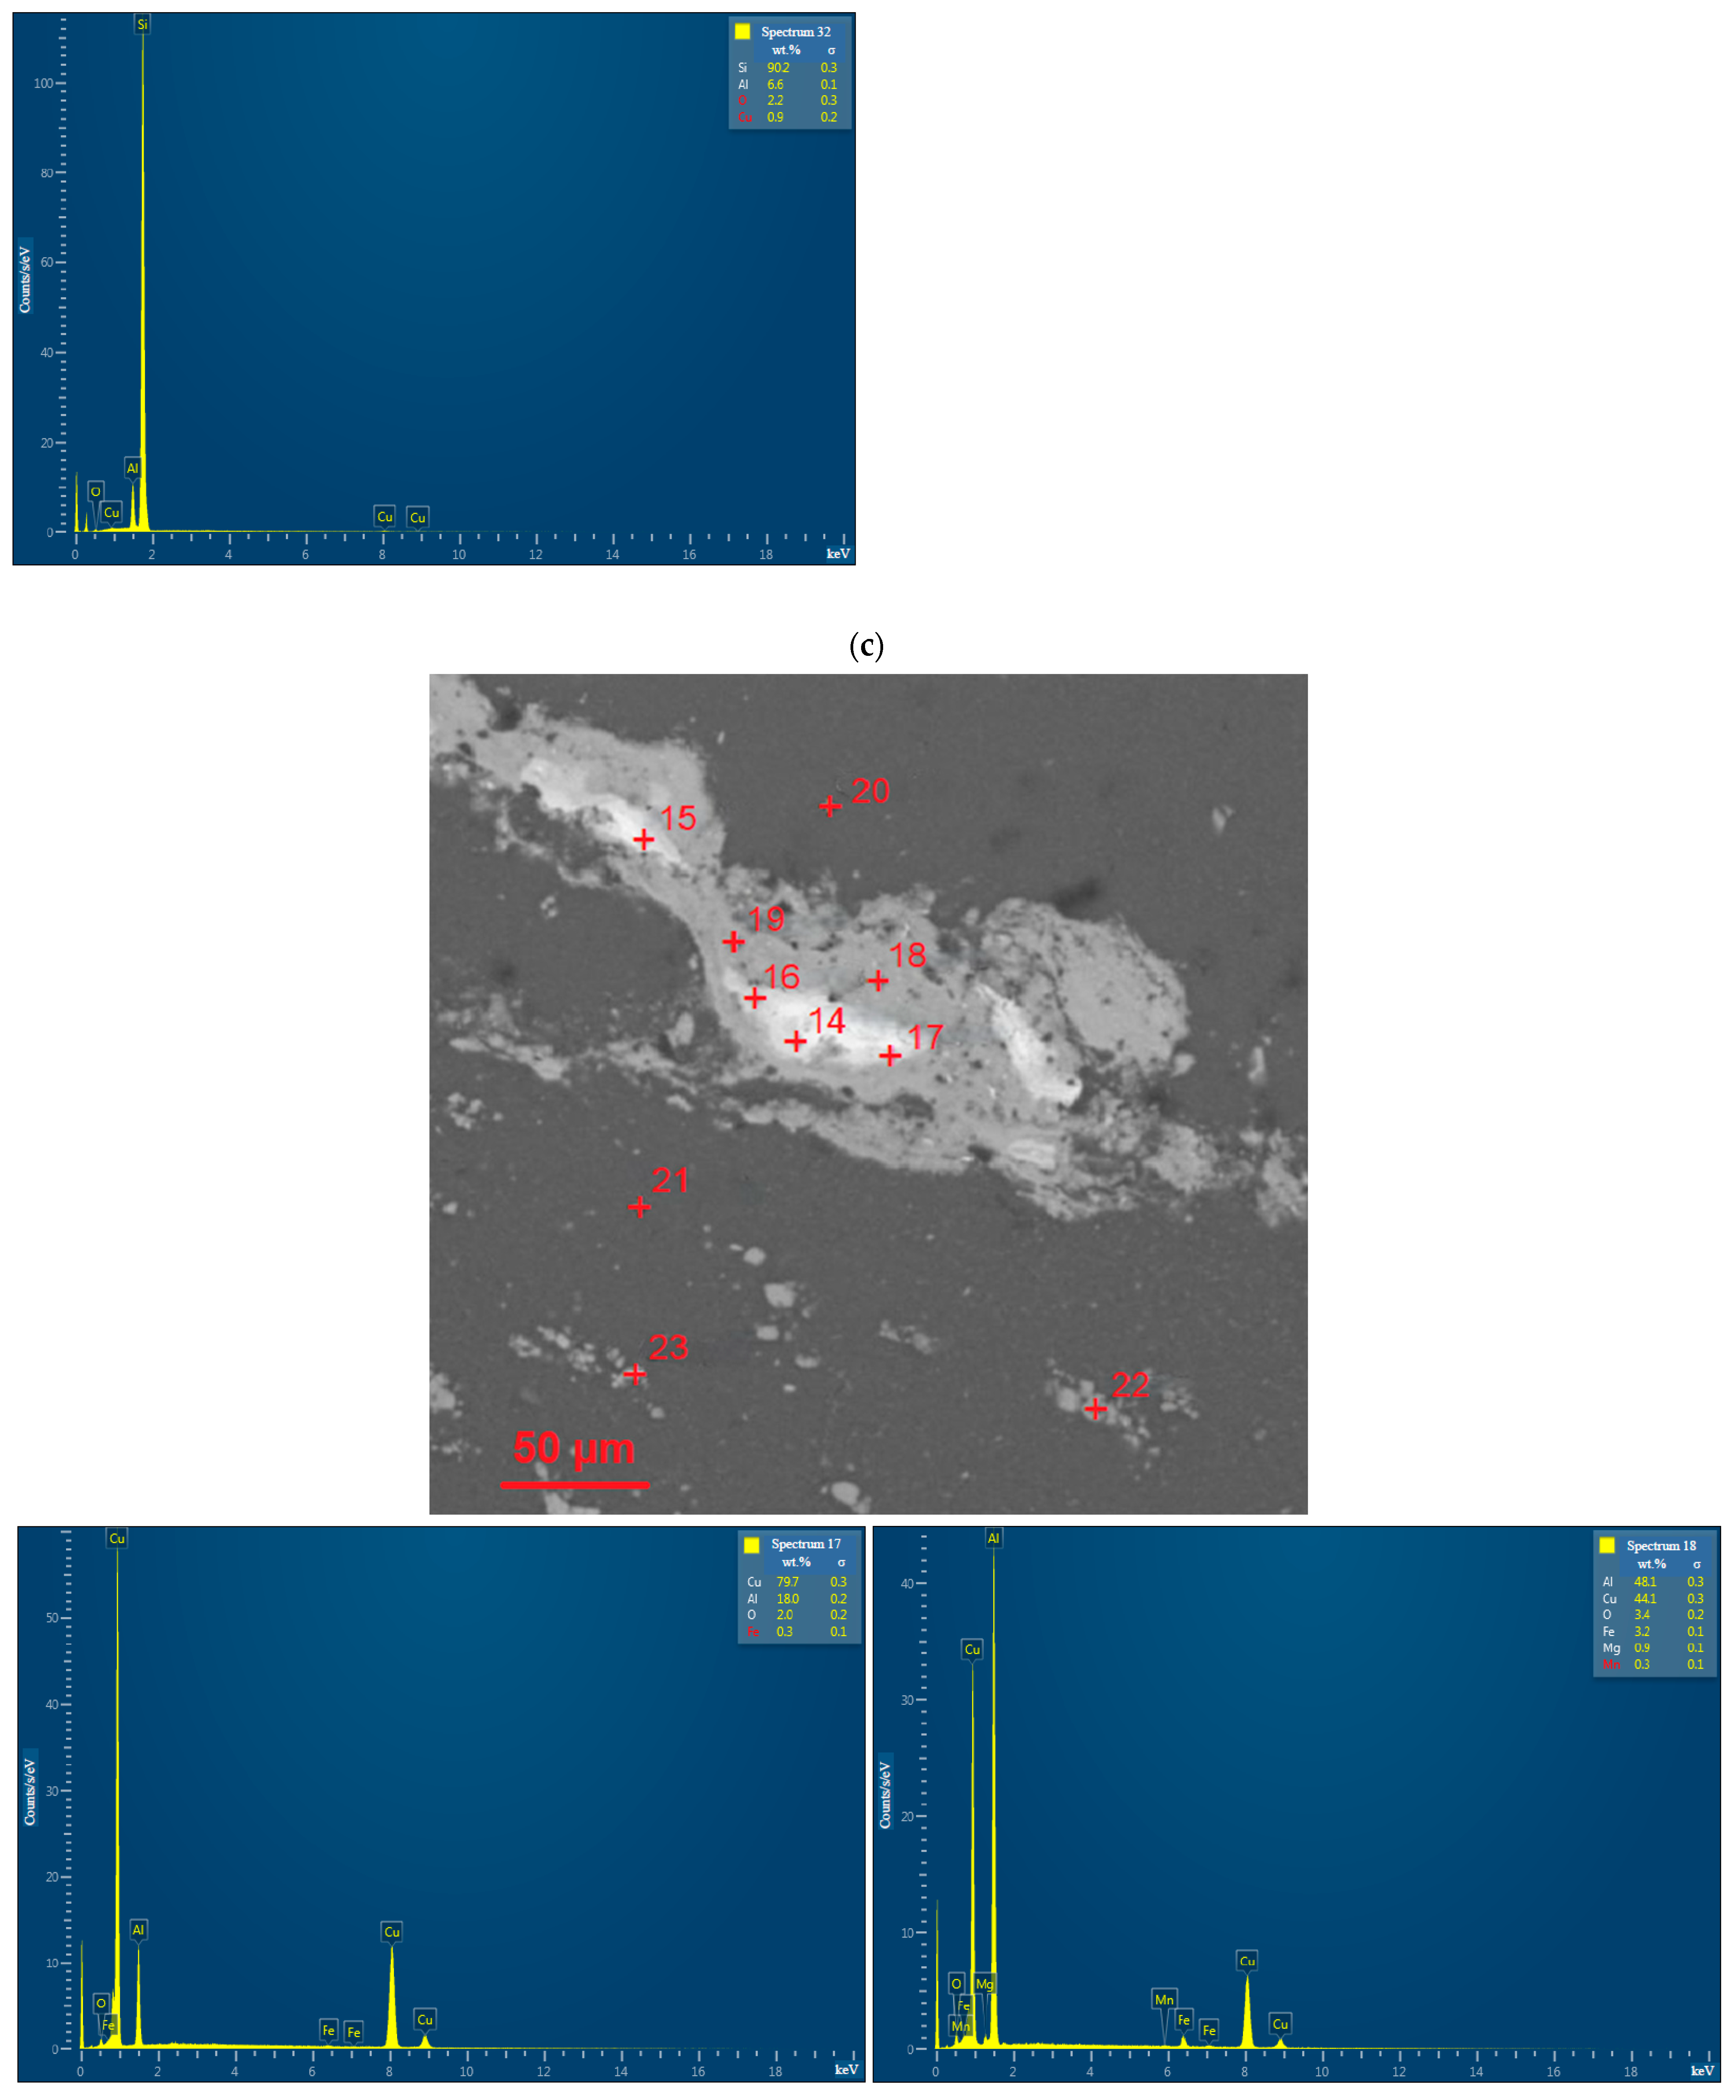
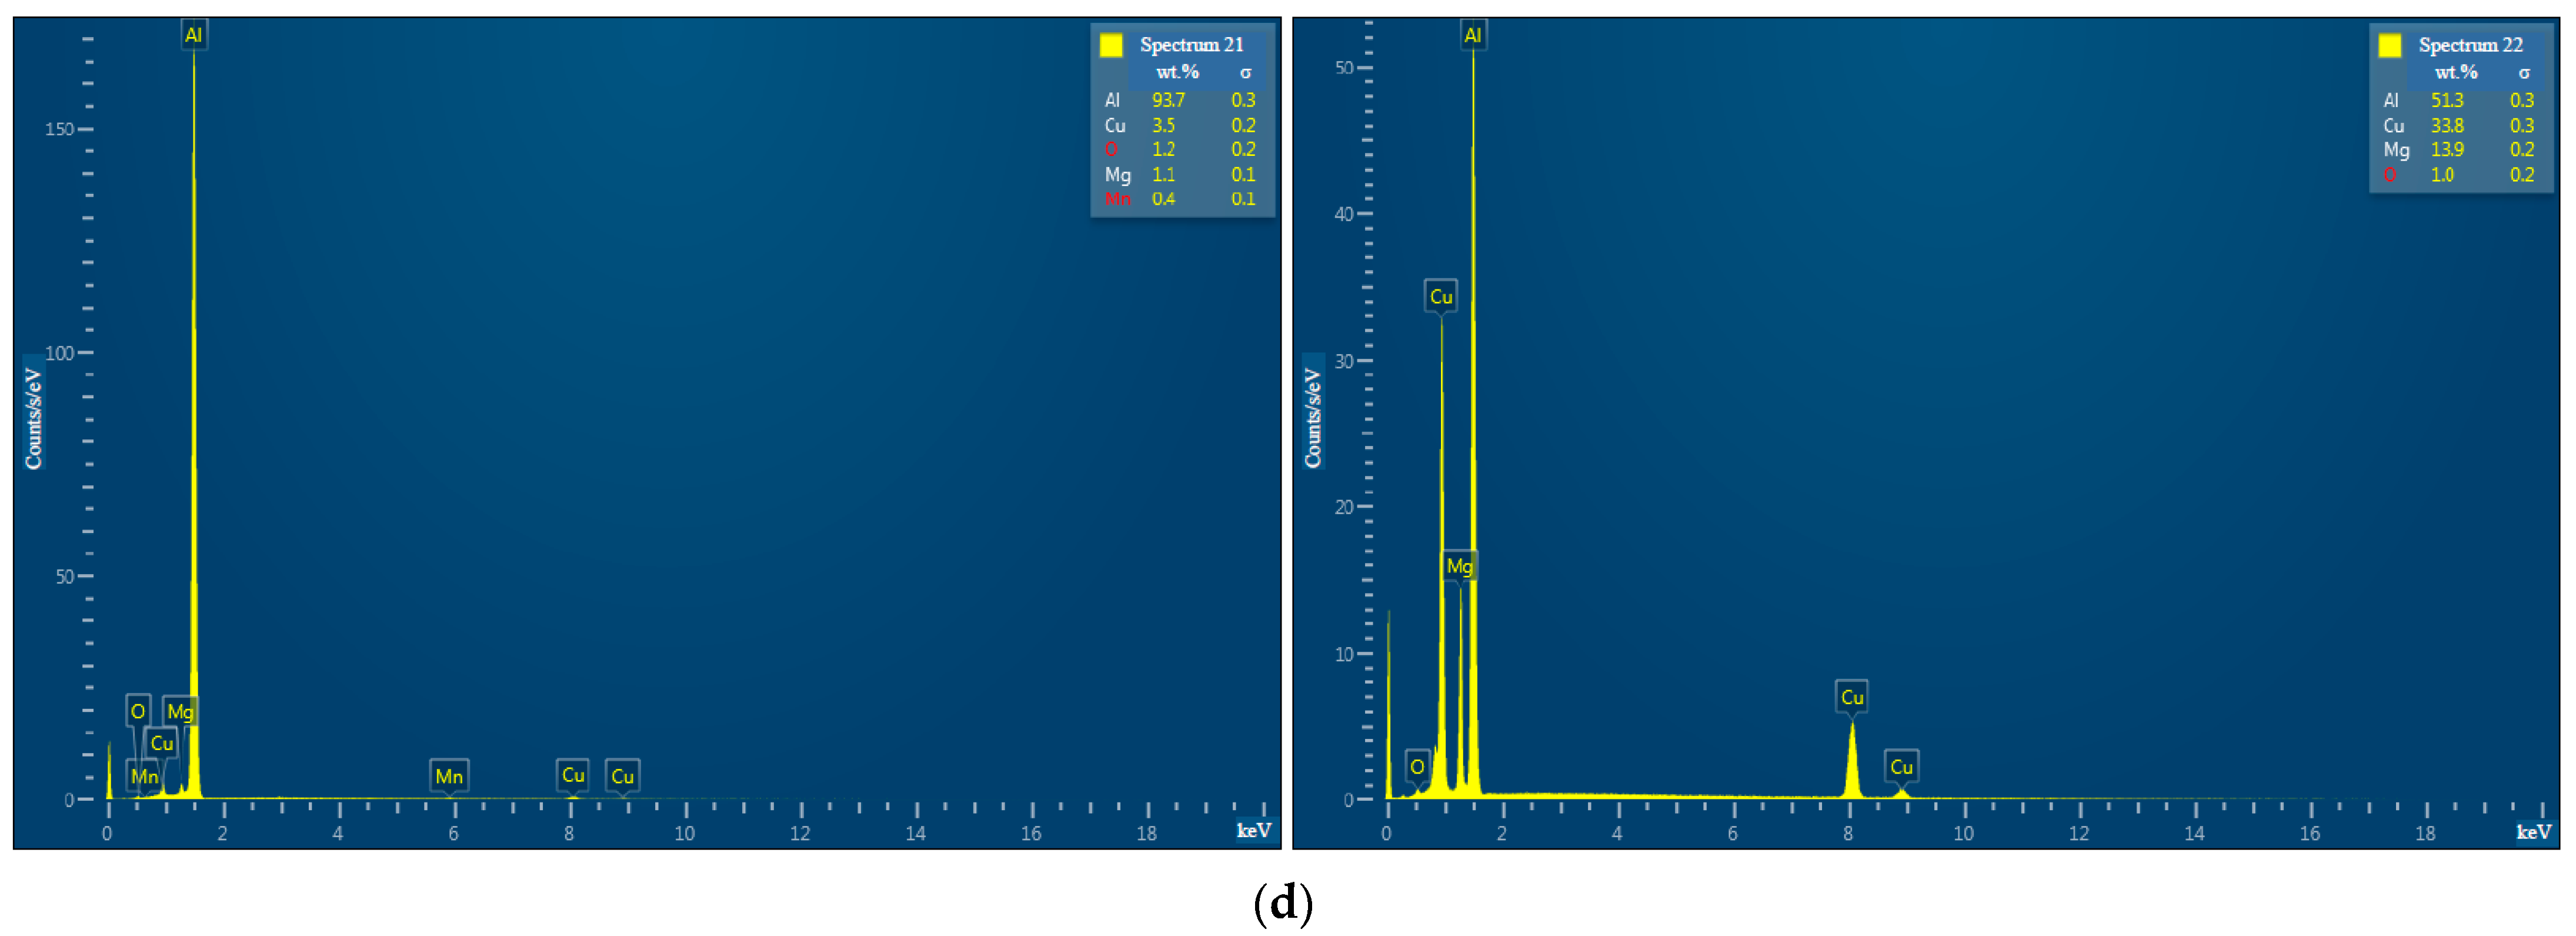
- The microstructure of the sintered and cold-pressed samples was represented by particles of the original scrap with ‘interparticle’ boundaries and micro- and nanosized ‘intraparticle’ inclusions, which were identified as intermetallic CuAl2 and MgCuAl2 compounds and Cu-rich sites. The zones enriched with Cu promoted galvanic corrosion of the Al matrix in the tested chlorine aqueous solution and thus intensified hydrogen generation;
- -
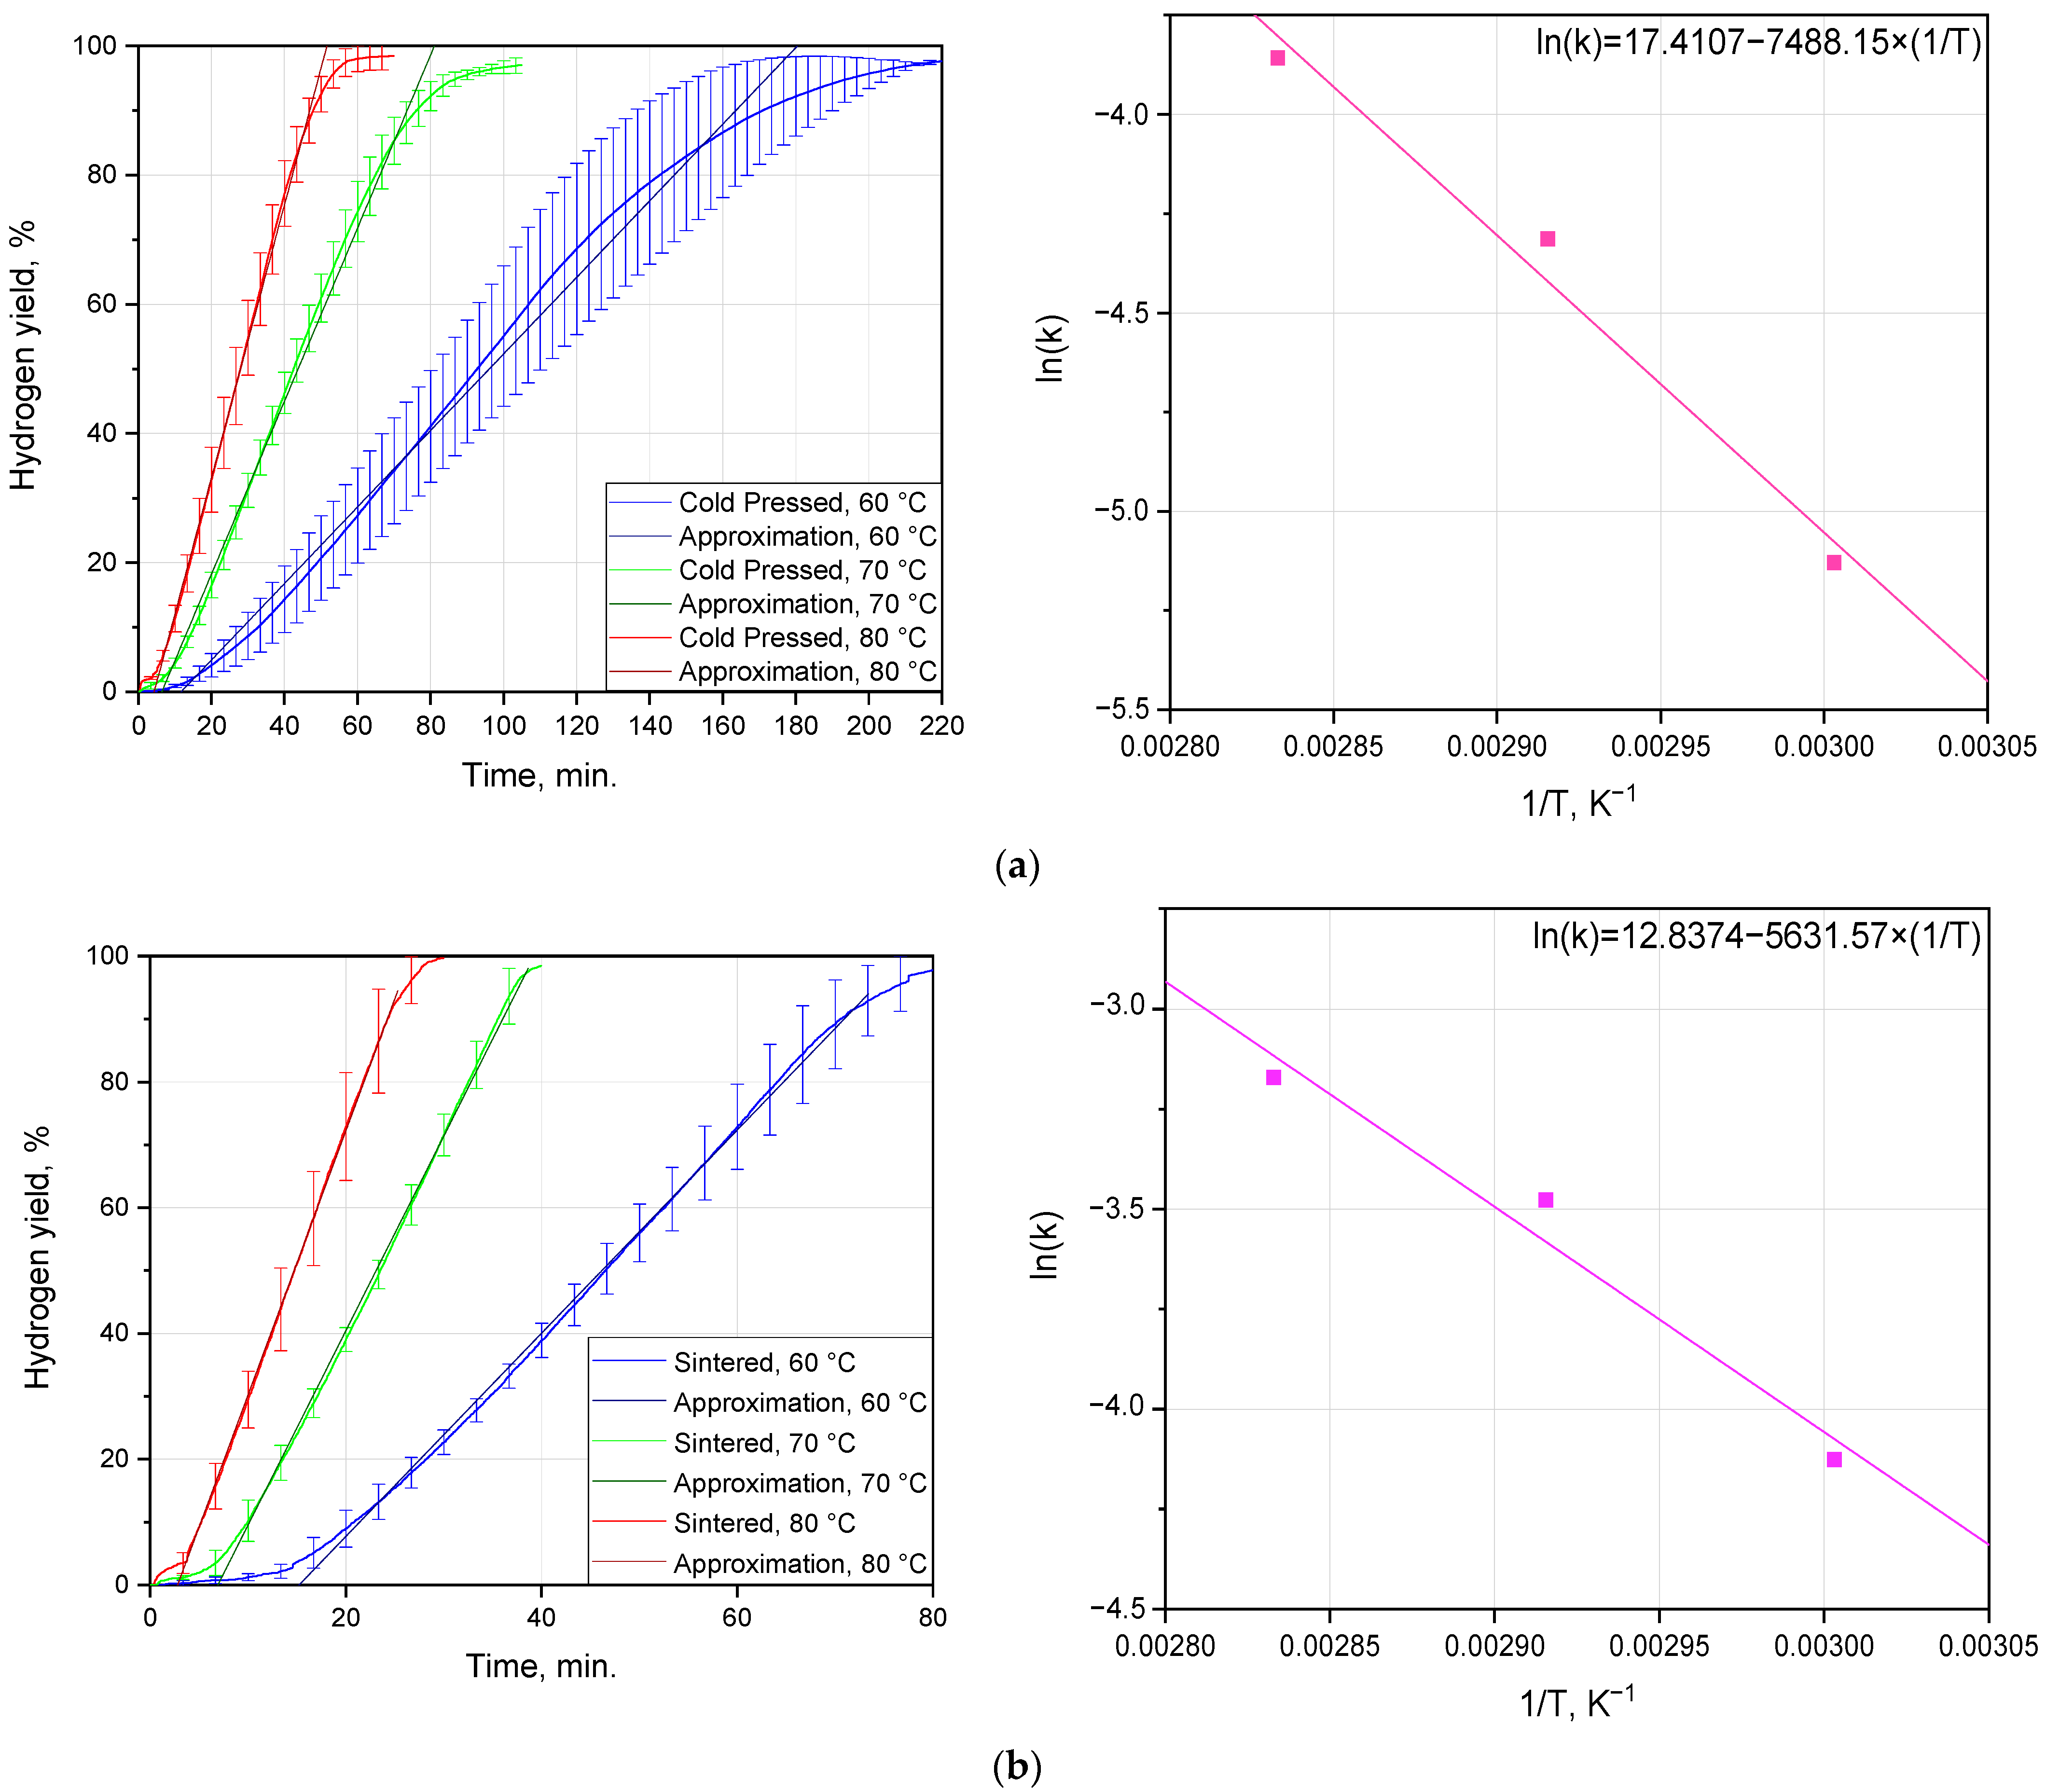
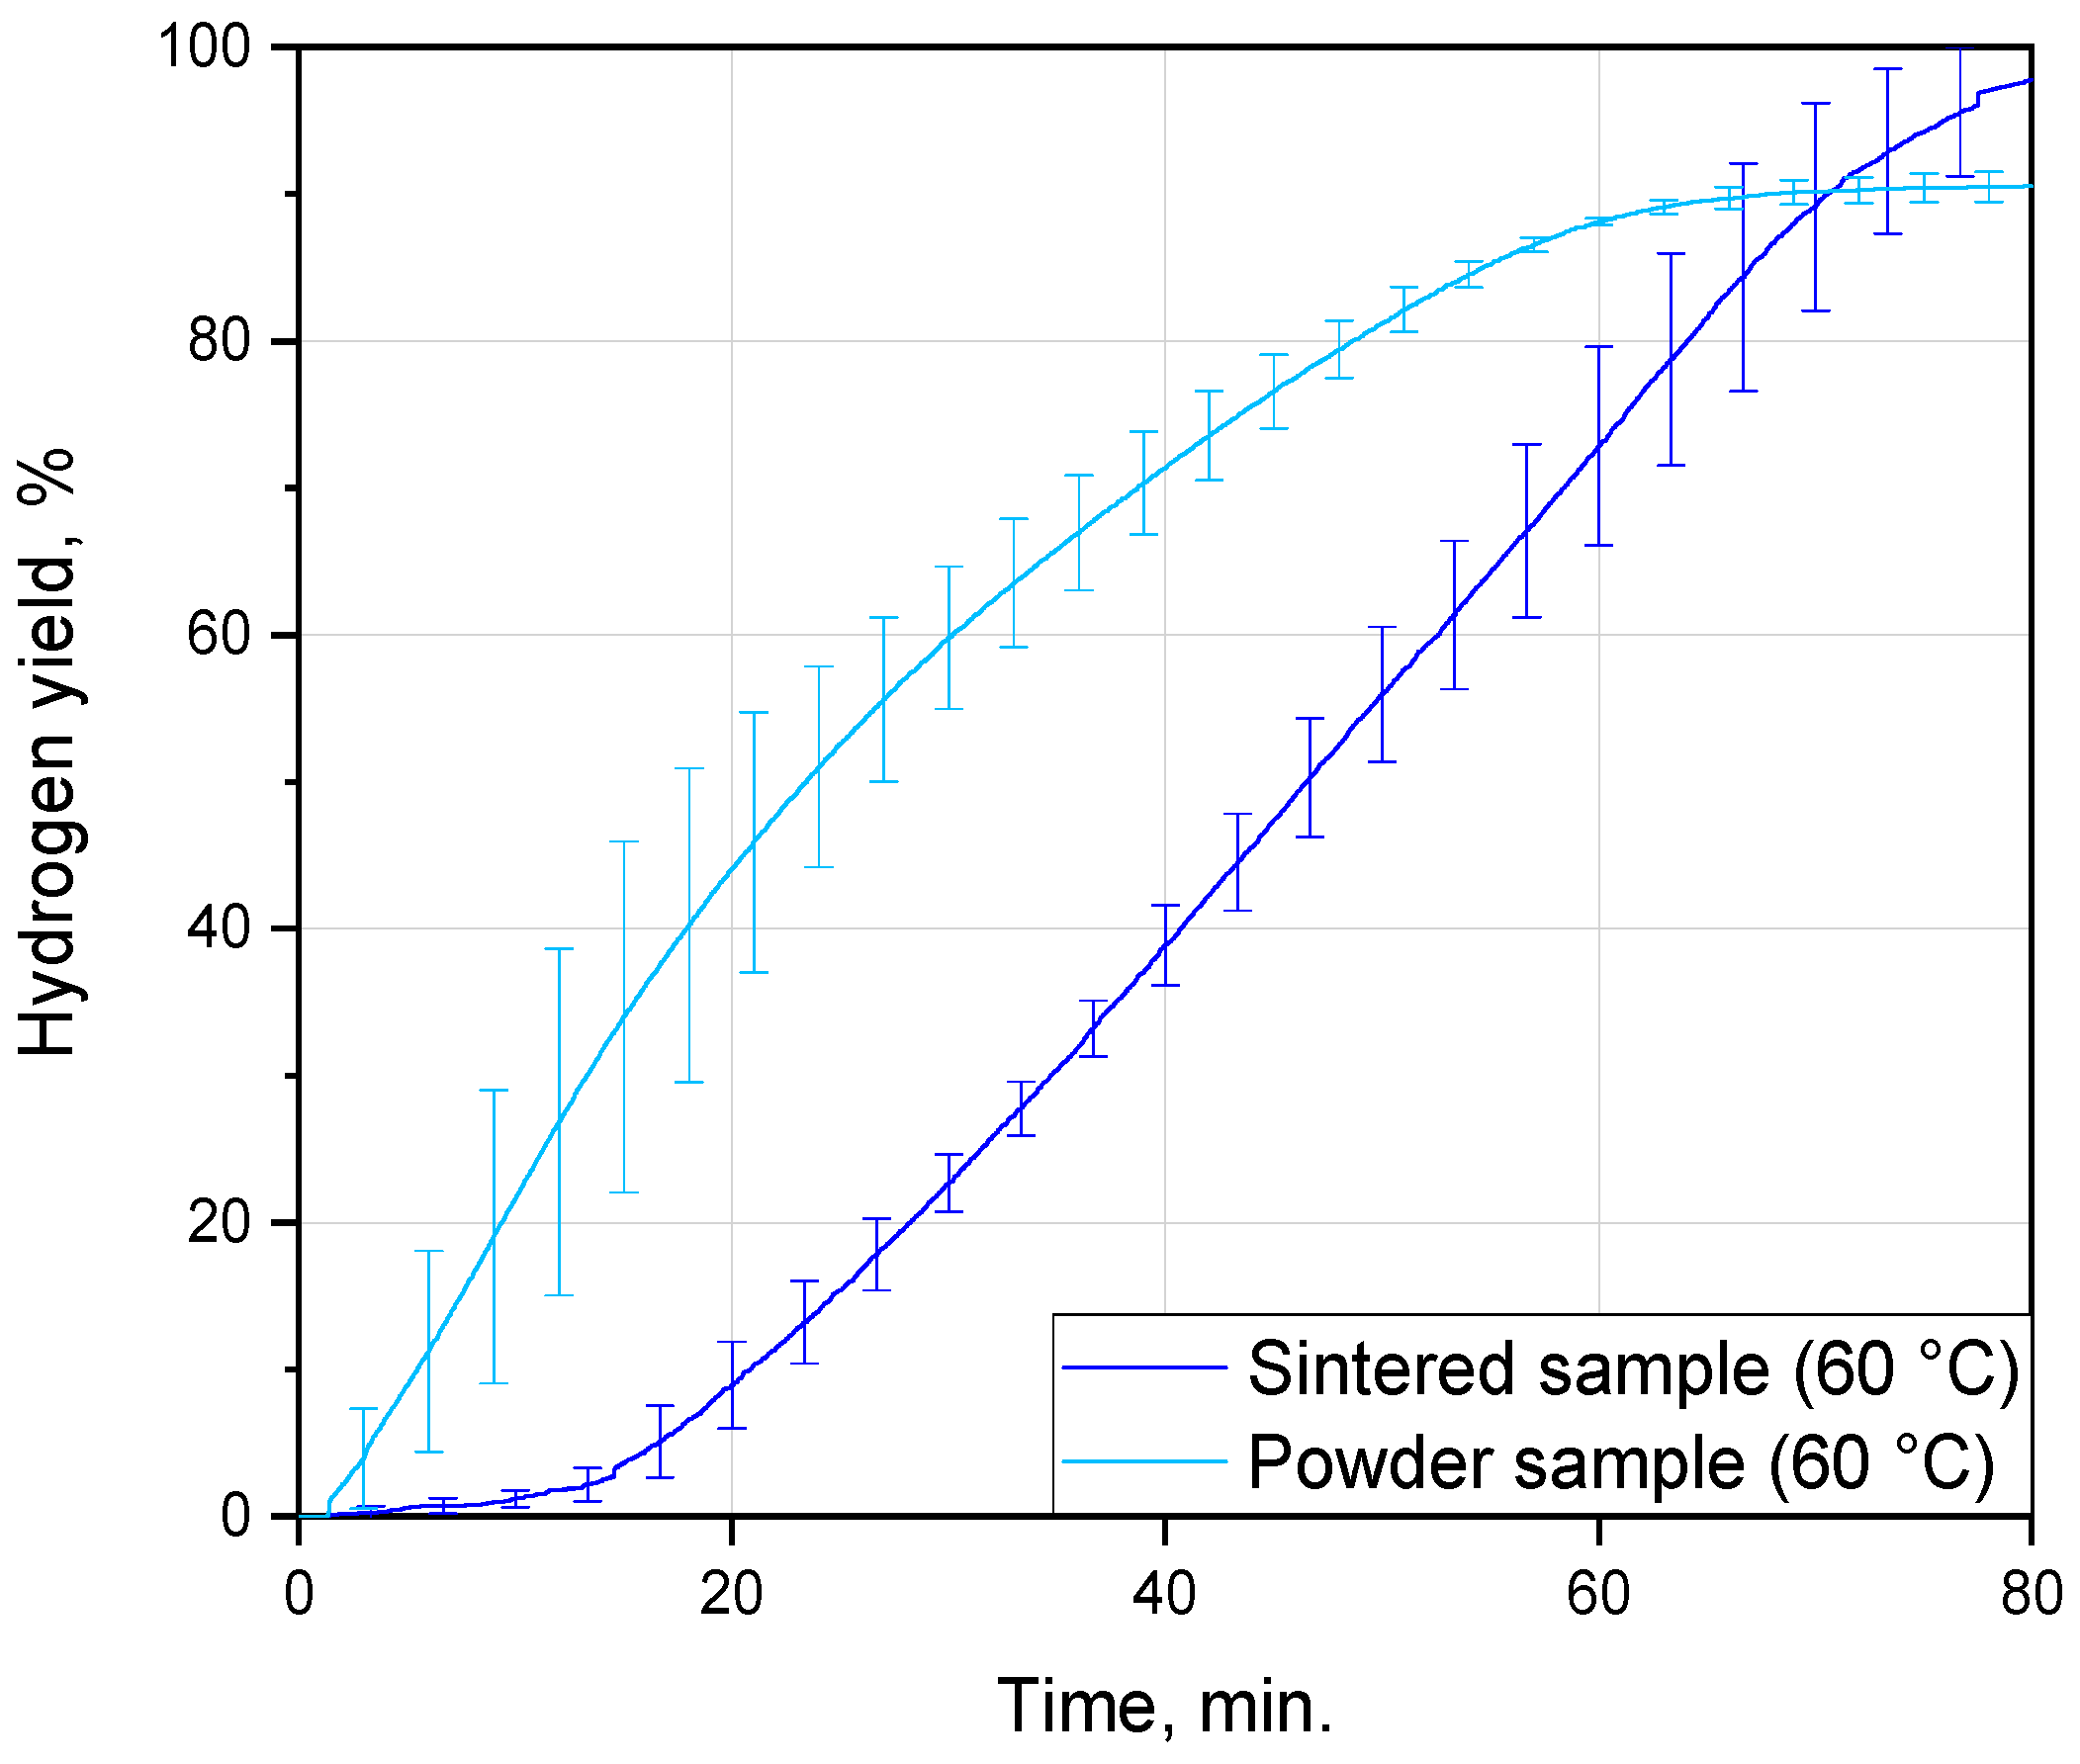
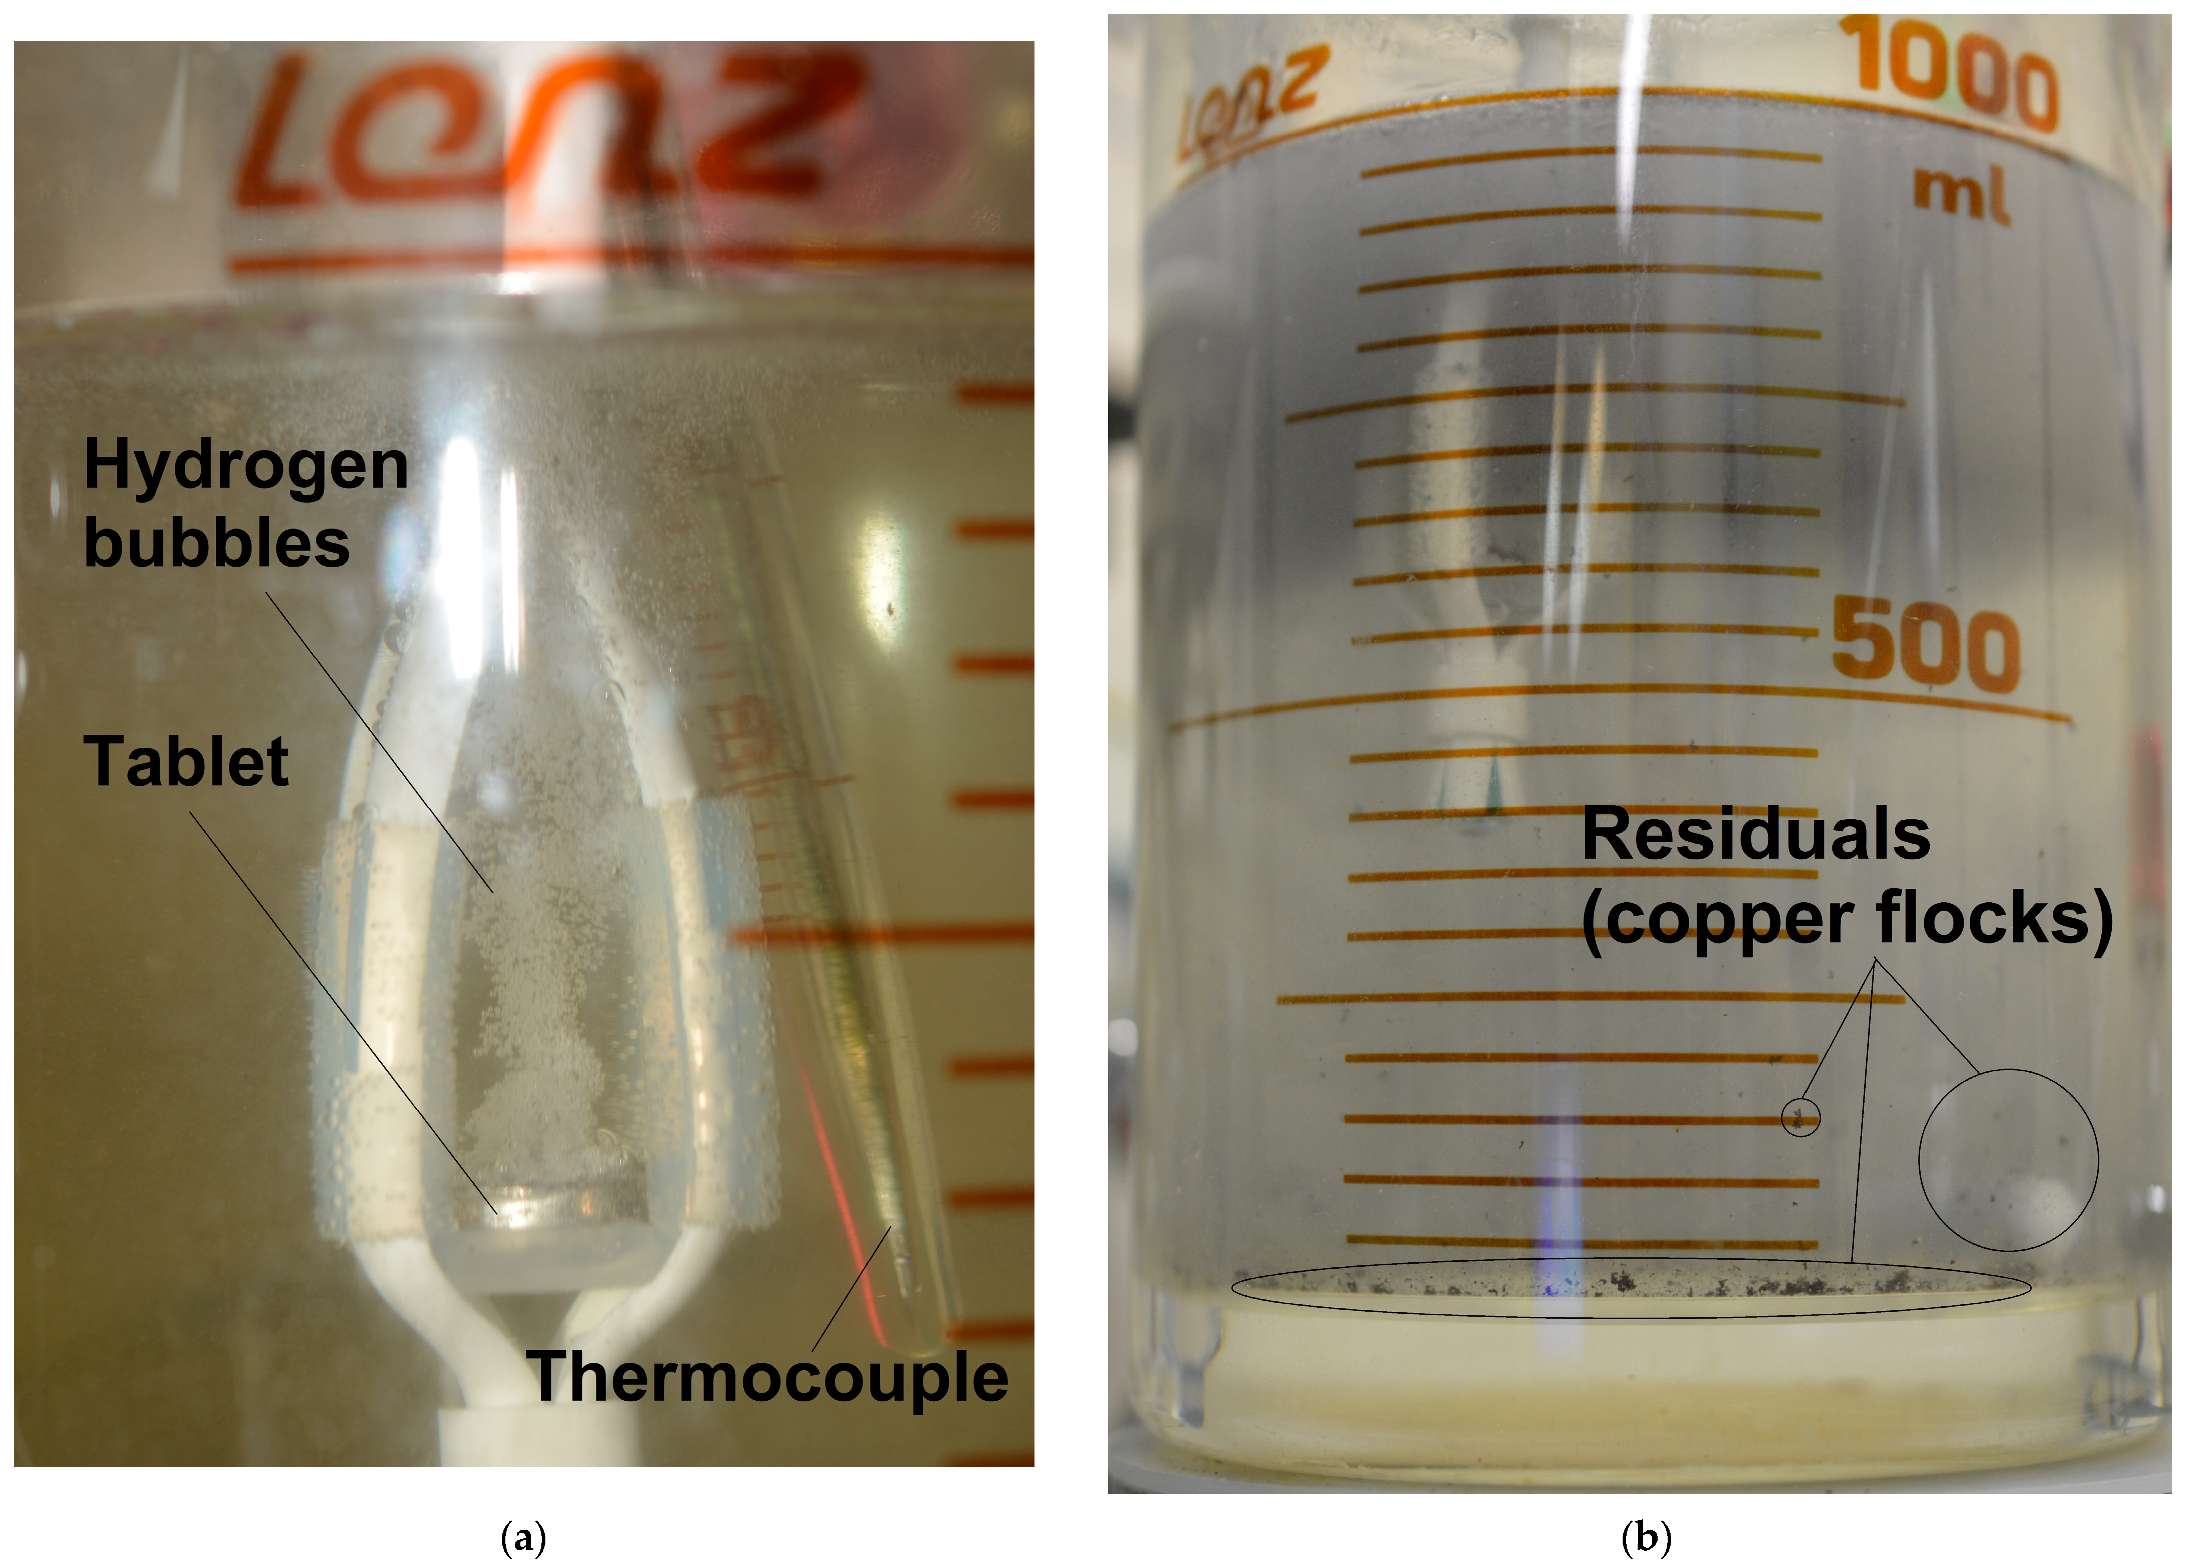
- Despite the relatively small surface areas of the tablets exposed to the solution and carrying the reaction (as compared to that of the composite powder), their hydrogen yields and evolution rates happened to be quite impressive;
- -
- The kinetic curves for the sintered pellets were approximated with higher precision than those for the cold-pressed ones. The possible reasons for that are a larger size of the latter that resulted in a higher temperature deviation from the isotherms and a large number of substantial voids, which could cause variations in their specific surface area during the reaction.
Author Contributions
Funding
Institutional Review Board Statement
Informed Consent Statement
Data Availability Statement
Acknowledgments
Conflicts of Interest
Appendix A


References
- Min, H. Exploring the Commercialization of Smart Rural Energy in Times of Energy Supply Chain Disruptions. Energies 2023, 16, 5364. [Google Scholar] [CrossRef]
- Gabric, A.J. The Climate Change Crisis: A Review of Its Causes and Possible Responses. Atmosphere 2023, 14, 1081. [Google Scholar] [CrossRef]
- Amin, M.; Shah, H.H.; Bashir, B.; Iqbal, M.A.; Shah, U.H.; Ali, M.U. Environmental Assessment of Hydrogen Utilization in Various Applications and Alternative Renewable Sources for Hydrogen Production: A Review. Energies 2023, 16, 4348. [Google Scholar] [CrossRef]
- Shin, H.K.; Ha, S.K. A Review on the Cost Analysis of Hydrogen Gas Storage Tanks for Fuel Cell Vehicles. Energies 2023, 16, 5233. [Google Scholar] [CrossRef]
- Matveev, K.I.; Leachman, J.W. The Effect of Liquid Hydrogen Tank Size on Self-Pressurization and Constant-Pressure Venting. Hydrogen 2023, 4, 444–455. [Google Scholar] [CrossRef]
- Tarasov, B.; Arbuzov, A.; Mozhzhukhin, S.; Volodin, A.; Fursikov, P.; Davids, M.W.; Adeniran, J.; Lototskyy, M. Metal Hydride Hydrogen Storage (Compression) Units Operating at Near-Atmospheric Pressure of the Feed H2. Inorganics 2023, 11, 290. [Google Scholar] [CrossRef]
- Jin, Z.; Su, Y.; Lv, H.; Liu, M.; Li, W.; Zhang, C. Review of Decompression Damage of the Polymer Liner of the Type IV Hydrogen Storage Tank. Polymers 2023, 15, 2258. [Google Scholar] [CrossRef]
- Zhou, Z.; Wu, J.; Zhang, S.; Gong, M.; Liu, X. Experimental Investigation on Pressure-Control Characteristics of Liquid Hydrogen Tank Based on Active and Passive Thermodynamic Venting System Technology. Processes 2023, 11, 1831. [Google Scholar] [CrossRef]
- Klopčič, N.; Grimmer, I.; Winkler, F.; Sartory, M.; Trattner, A. A review on metal hydride materials for hydrogen storage. J. Energy Storage 2023, 72, 108456. [Google Scholar] [CrossRef]
- Ouyang, L.; Liu, M.; Chen, K.; Liu, J.; Wang, H.; Zhu, M.; Yartys, V. Recent progress on hydrogen generation from the hydrolysis of light metals and hydrides. J. Alloys Compd. 2022, 910, 164831. [Google Scholar] [CrossRef]
- Buryakovskaya, O.A.; Vlaskin, M.S.; Grigorenko, A.V. Effect of Thermal Treatment of Aluminum Core-Shell Particles on Their Oxidation Kinetics in Water for Hydrogen Production. Materials 2021, 14, 6493. [Google Scholar] [CrossRef] [PubMed]
- Yavor, Y.; Goroshin, S.; Bergthorson, J.M.; Frost, D.L.; Stowe, R.; Ringuette, S. Enhanced hydrogen generation from aluminum–water reactions. Int. J. Hydrogen Energy 2013, 38, 14992–15002. [Google Scholar] [CrossRef]
- Buryakovskaya, O.A.; Kurbatova, A.I.; Vlaskin, M.S.; Valyano, G.E.; Grigorenko, A.V.; Ambaryan, G.N.; Dudoladov, A.O. Waste to Hydrogen: Elaboration of Hydroreactive Materials from Magnesium-Aluminum Scrap. Sustainability 2022, 14, 4496. [Google Scholar] [CrossRef]
- Bersh, A.V.; Lisitsyn, A.V.; Sorokovikov, A.I.; Vlaskin, M.S.; Mazalov, Y.A.; Shkol’nikov, E.I. Study of the processes of steam-hydrogen mixture generation in a reactor for hydrothermal aluminum oxidation for power units. High Temp. 2010, 48, 866–873. [Google Scholar] [CrossRef]
- Volkov, E.P.; Shkol’nikov, E.I. Integrated Aluminum-Water Technology for Hydrogen Production. Therm. Eng. 2022, 69, 858–863. [Google Scholar] [CrossRef]
- Setiani, P.; Watanabe, N.; Sondari, R.R.; Tsuchiya, N. Mechanisms and kinetic model of hydrogen production in the hydrothermal treatment of waste aluminum. Mater. Renew. Sustain. Energy 2018, 7, 10. [Google Scholar] [CrossRef]
- Vlaskin, M.S.; Valyano, G.E.; Zhuk, A.Z.; Shkolnikov, E.I. Oxidation of coarse aluminum in pressured water steam for energy applications. Int. J. Energy Res. 2020, 44, 8689–8715. [Google Scholar] [CrossRef]
- Ambaryan, G.N.; Buryakovskaya, O.A.; Kumar, V.; Valyano, G.E.; Kiseleva, E.A.; Grigorenko, A.V.; Vlaskin, M.S. Hydrothermal Oxidation of Coarse Aluminum Granules with Hydrogen and Aluminum Hydroxide Production: The Influence of Aluminum Purity. Appl. Sci. 2023, 13, 7793. [Google Scholar] [CrossRef]
- Rosenband, V.; Gany, A. Application of activated aluminum powder for generation of hydrogen from water. Int. J. Hydrogen Energy 2010, 35, 10898–10904. [Google Scholar] [CrossRef]
- Alviani, V.N.; Setiani, P.; Uno, M.; Oba, M.; Hirano, N.; Watanabe, N.; Tsuchiya, N.; Saishu, H. Mechanisms and possible applications of the Al–H2O reaction under extreme pH and low hydrothermal temperatures. Int. J. Hydrogen Energy 2019, 44, 29903–29921. [Google Scholar] [CrossRef]
- Alviani, V.N.; Hirano, N.; Watanabe, N.; Oba, M.; Uno, M.; Tsuchiya, N. Local initiative hydrogen production by utilization of aluminum waste materials and natural acidic hot-spring water. Appl. Energy 2021, 293, 116909. [Google Scholar] [CrossRef]
- Ambaryan, G.N.; Vlaskin, M.S.; Dudoladov, A.O.; Meshkov, E.A.; Zhuk, A.Z.; Shkolnikov, E.I. Hydrogen generation by oxidation of coarse aluminum in low content alkali aqueous solution under intensive mixing. Int. J. Hydrogen Energy 2016, 41, 17216–17224. [Google Scholar] [CrossRef]
- Al Bacha, S.; Thienpont, A.; Zakhour, M.; Nakhl, M.; Bobet, J.L. Clean hydrogen production by the hydrolysis of magnesium-based material: Effect of the hydrolysis solution. J. Clean. Prod. 2021, 282, 124498. [Google Scholar] [CrossRef]
- Buryakovskaya, O.A.; Meshkov, E.A.; Vlaskin, M.S.; Shkolnokov, E.I.; Zhuk, A.Z. Utilization of Aluminum Waste with Hydrogen and Heat Generation. IOP Conf. Ser. Mater. Sci. Eng. 2017, 250, 012007. [Google Scholar] [CrossRef]
- Buryakovskaya, O.A.; Vlaskin, M.S. Hydrogen Recovery from Waste Aluminum–Plastic Composites Treated with Alkaline Solution. Materials 2022, 15, 8699. [Google Scholar] [CrossRef] [PubMed]
- Razavi-Tousi, S.S.; Szpunar, J.A. Effect of structural evolution of aluminum powder during ball milling on hydrogen generation in aluminum–water reaction. Int. J. Hydrogen Energy 2013, 38, 795–806. [Google Scholar] [CrossRef]
- Grosjean, M.H.; Zidoune, M.; Roué, L. Hydrogen production from highly corroding Mg-based materials elaborated by ball milling. J. Alloys Compd. 2005, 404–406, 712–715. [Google Scholar] [CrossRef]
- Razavi-Tousi, S.S.; Szpunar, J.A. Effect of addition of water-soluble salts on the hydrogen generation of aluminum in reaction with hot water. J. Alloys Compd. 2016, 679, 364–374. [Google Scholar] [CrossRef]
- Liu, Y.; Wang, X.; Dong, Z.; Liu, H.; Li, S.; Ge, H.; Yan, M. Hydrogen generation from the hydrolysis of Mg powder ball-milled with AlCl3. Energy 2013, 53, 147–152. [Google Scholar] [CrossRef]
- Al Bacha, S.; Zakhour, M.; Nakhl, M.; Bobet, J.L. Effect of ball milling in presence of additives (Graphite, AlCl3, MgCl2 and NaCl) on the hydrolysis performances of Mg17Al12. Int. J. Hydrogen Energy 2020, 45, 6102–6109. [Google Scholar] [CrossRef]
- Al Bacha, S.; Aubert, I.; Zakhour, M.; Nakhl, M.; Bobet, J.L. Valorization of AZ91 by the hydrolysis reaction for hydrogen production (Electrochemical approach). J. Magnes. Alloys 2021, 9, 1942–1953. [Google Scholar] [CrossRef]
- Awad, A.S.; El-Asmar, E.; Tayeh, T.; Mauvy, F.; Nakhl, M.; Zakhour, M.; Bobet, J.L. Effect of carbons (G and CFs), TM (Ni, Fe and Al) and oxides (Nb2O5 and V2O5) on hydrogen generation from ball milled Mg-based hydrolysis reaction for fuel cell. Energy 2016, 95, 175–186. [Google Scholar] [CrossRef]
- Niu, F.; Huang, X.; Gao, T.; Wang, J.; Qin, L.; Huang, Y. Hydrogen Generation from Hydrolysis of Ball-Milled Al/C Composite Materials: Effects of Processing Parameters. Energy Technol. 2014, 2, 593–597. [Google Scholar] [CrossRef]
- Chen, C.; Guan, X.; Wang, H.; Dong, S.; Luo, P. Hydrogen generation from splitting water with Al–Bi(OH)3 composite promoted by NaCl. Int. J. Hydrogen Energy 2020, 45, 13139–13148. [Google Scholar] [CrossRef]
- Dupiano, P.; Stamatis, D.; Dreizin, E.L. Hydrogen production by reacting water with mechanically milled composite aluminum-metal oxide powders. Int. J. Hydrogen Energy 2011, 36, 4781–4791. [Google Scholar] [CrossRef]
- Fan, M.-Q.; Xu, F.; Sun, L.-X. Studies on hydrogen generation characteristics of hydrolysis of the ball milling Al-based materials in pure water. Int. J. Hydrogen Energy 2007, 32, 2809–2815. [Google Scholar] [CrossRef]
- Zhao, Z.; Chen, X.; Hao, M. Hydrogen generation by splitting water with Al–Ca alloy. Energy 2011, 36, 2782–2787. [Google Scholar] [CrossRef]
- Davies, J.; du Preez, S.P.; Bessarabov, D.G. On-Demand Hydrogen Generation by the Hydrolysis of Ball-Milled Aluminum–Bismuth–Zinc Composites. Materials 2022, 15, 1197. [Google Scholar] [CrossRef]
- Ilyukhina, A.V.; Kravchenko, O.V.; Bulychev, B.M.; Shkolnikov, E.I. Mechanochemical activation of aluminum with gallams for hydrogen evolution from water. Int. J. Hydrogen Energy 2010, 35, 1905–1910. [Google Scholar] [CrossRef]
- Davies, J.; Du Preez, S.P.; Bessarabov, D.G. The Hydrolysis of Ball-Milled Aluminum–Bismuth–Nickel Composites for On-Demand Hydrogen Generation. Energies 2022, 15, 2356. [Google Scholar] [CrossRef]
- Buryakovskaya, O.A.; Ambaryan, G.N.; Suleimanov, M.Z.; Tarasenko, A.B.; Vlaskin, M.S. Enhanced Hydrogen Generation from Magnesium–Aluminum Scrap Ball Milled with Low Melting Point Solder Alloy. Materials 2023, 16, 4450. [Google Scholar] [CrossRef] [PubMed]
- Al Bacha, S.; Pighin, S.A.; Urretavizcaya, G.; Zakhour, M.; Castro, F.J.; Nakhl, M.; Bobet, J.L. Hydrogen generation from ball milled Mg alloy waste by hydrolysis reaction. J. Power Source 2020, 479, 228711. [Google Scholar] [CrossRef]
- Buryakovskaya, O.A.; Vlaskin, M.S. Microstructural Transformation and Hydrogen Generation Performance of Magnesium Scrap Ball Milled with Devarda’s Alloy. Materials 2022, 15, 8058. [Google Scholar] [CrossRef]
- Al Bacha, S.; Awad, A.S.; El Asmar, E.; Tayeh, T.; Bobet, J.L.; Nakhl, M.; Zakhour, M. Hydrogen generation via hydrolysis of ball milled WE43 magnesium waste. Int. J. Hydrogen Energy 2019, 44, 17515–17524. [Google Scholar] [CrossRef]
- Tikhov, S.F.; Sadykov, V.A.; Ratko, A.I.; Kouznetsova, T.F.; Romanenkov, V.E.; Eremenko, S.I. Kinetics of aluminum powder oxidation by water at 100°C. React. Kinet. Catal. Lett. 2007, 92, 83–88. [Google Scholar] [CrossRef]
- Soler, L.; Candela, A.M.; Macanás, J.; Muñoz, M.; Casado, J. Hydrogen generation from water and aluminum promoted by sodium stannate. Int. J. Hydrogen Energy 2010, 35, 1038–1048. [Google Scholar] [CrossRef]
- Wang, X.; Li, G.; Eckhoff, R.K. Kinetics study of hydration reaction between aluminum powder and water based on an improved multi-stage shrinking core model. Int. J. Hydrogen Energy 2021, 46, 33635–33655. [Google Scholar] [CrossRef]
- Nie, H.; Zhang, S.; Schoenitz, M.; Dreizin, E.L. Reaction interface between aluminum and water. Int. J. Hydrogen Energy 2013, 38, 11222–11232. [Google Scholar] [CrossRef]
- Razavi-Tousi, S.S.; Szpunar, J.A. Modification of the shrinking core model for hydrogen generation by reaction of aluminum particles with water. Int. J. Hydrogen Energy 2016, 41, 87–93. [Google Scholar] [CrossRef]
- Ho, C.-Y. Hydrolytic reaction of waste aluminum foils for high efficiency of hydrogen generation. Int. J. Hydrogen Energy 2017, 42, 19622–19628. [Google Scholar] [CrossRef]
- Mezulis, A.; Richter, C.; Lesnicenoks, P.; Knoks, A.; Varnagiris, S.; Urbonavicius, M.; Milcius, D.; Kleperis, J. Studies on Water–Aluminum Scrap Reaction Kinetics in Two Steps and the Efficiency of Green Hydrogen Production. Energies 2023, 16, 5554. [Google Scholar] [CrossRef]
- Martínez-Salazar, A.L.; Melo-Banda, J.A.; Coronel-García, M.A.; González-Barbosa, J.J.; Domínguez-Esquivel, J.M. Hydrogen generation by aluminum alloy corrosion in aqueous acid solutions promoted by nanometal: Kinetics study. Renew. Energy 2020, 146, 2517–2523. [Google Scholar] [CrossRef]
- Salueña Berna, X.; Marín-Genescà, M.; Dagà-Monmany, J.M. Analysis of Valorization Process of Aluminum Breakage Scraps to Obtain Green Hydrogen. Metals 2021, 11, 598. [Google Scholar] [CrossRef]
- Gouty, Q.; Castro, F.J.; Urretavizcaya, G.; Sabatier, J.; Bobet, J.L. Experimental and theoretical approach of the hydrolysis of pelleted magnesium alloys scraps. J. Alloys Compd. 2022, 919, 165784. [Google Scholar] [CrossRef]
- Tan, W.; Yang, Y.-e.; Fang, Y.-x. Isothermal hydrogen production behavior and kinetics of bulk eutectic Mg–Ni-based alloys in NaCl solution. J. Alloys Compd. 2020, 826, 152363. [Google Scholar] [CrossRef]
- Kahveci, O.; Kaya, M.F. Hydrogen production from Al–Cu alloy using electric vehicle’s waste DC motor coils. Int. J. Hydrogen Energy 2022, 47, 12179–12188. [Google Scholar] [CrossRef]
- Kim, M.; Eom, K.; Kwon, J.; Cho, E.; Kwon, H. On-board hydrogen production by hydrolysis from designed Al–Cu alloys and the application of this technology to polymer electrolyte membrane fuel cells. J. Power Source 2012, 217, 345–350. [Google Scholar] [CrossRef]
- Li, S.-L.; Song, J.-M.; Uan, J.-Y. Mg-Mg2X (X=Cu, Sn) eutectic alloy for the Mg2X nano-lamellar compounds to catalyze hydrolysis reaction for H2 generation and the recycling of pure X metals from the reaction wastes. J. Alloys Compd. 2019, 772, 489–498. [Google Scholar] [CrossRef]
- Eom, K.; Cho, E.; Kwon, H. Feasibility of on-board hydrogen production from hydrolysis of Al–Fe alloy for PEMFCs. Int. J. Hydrogen Energy 2011, 36, 12338–12342. [Google Scholar] [CrossRef]
- Eom, K.S.; Kwon, J.Y.; Kim, M.J.; Kwon, H.S. Design of Al–Fe alloys for fast on-board hydrogen production from hydrolysis. J. Mater. Chem. 2011, 21, 13047–13051. [Google Scholar] [CrossRef]
- Al Bacha, S.; Farias, E.D.; Garrigue, P.; Zakhour, M.; Nakhl, M.; Bobet, J.L.; Zigah, D. Local enhancement of hydrogen production by the hydrolysis of Mg17Al12 with Mg “model” material. J. Alloys Compd. 2022, 895, 162560. [Google Scholar] [CrossRef]
- Al Bacha, S.; Aubert, I.; Zakhour, M.; Nakhl, M.; Bobet, J.L. Hydrolysis properties, corrosion behavior and microhardness of AZ91 “model” alloys. J. Alloys Compd. 2020, 845, 156283. [Google Scholar] [CrossRef]
- Rudskoy, A.I.; Tsemenko, V.N.; Ganin, S.V. A Study of Compaction and Deformation of a Powder Composite Material of the ‘Aluminum–Rare Earth Elements’ System. Met. Sci. Heat Treat. 2015, 56, 542–547. [Google Scholar] [CrossRef]
- Jafari, M.; Abbasi, M.H.; Enayati, M.H.; Karimzadeh, F. Mechanical properties of nanostructured Al2024–MWCNT composite prepared by optimized mechanical milling and hot pressing methods. Adv. Powder Technol. 2012, 23, 205–210. [Google Scholar] [CrossRef]
- Gudlur, P.; Forness, A.; Lentz, J.; Radovic, M.; Muliana, A. Thermal and mechanical properties of Al/Al2O3 composites at elevated temperatures. Mater. Sci. Eng. A 2012, 531, 18–27. [Google Scholar] [CrossRef]
- Ogel, B.; Gurbuz, R. Microstructural characterization and tensile properties of hot pressed Al–SiC composites prepared from pure Al and Cu powders. Mater. Sci. Eng. A 2001, 301, 213–220. [Google Scholar] [CrossRef]
- Eksi, A.K.; Yuzbasioglu, A.H. Effect of sintering and pressing parameters on the densification of cold isostatically pressed Al and Fe powders. Mater. Des. 2007, 28, 1364–1368. [Google Scholar] [CrossRef]
- Boland, C.D.; Hexemer, R.L.; Donaldson, I.W.; Bishop, D.P. Industrial processing of a novel Al–Cu–Mg powder metallurgy alloy. Mater. Sci. Eng. A 2013, 559, 902–908. [Google Scholar] [CrossRef]
- Gökçe, A.; Fındık, F.; Kurt, A.O. Microstructural examination and properties of premixed Al–Cu–Mg powder metallurgy alloy. Mater. Charact. 2011, 62, 730–735. [Google Scholar] [CrossRef]
- Cooke, R.W.; Kraus, N.P.; Bishop, D.P. Spark plasma sintering of aluminum powders prealloyed with scandium additions. Mater. Sci. Eng. A 2016, 657, 71–81. [Google Scholar] [CrossRef]
- Khalil, A.; Hakeem, A.; Saheb, N. Optimization of Process Parameters in Spark Plasma Sintering Al6061 and Al2124 Aluminum Alloys. Adv. Mater. Res. 2011, 328–330, 1517–1522. [Google Scholar] [CrossRef]
- Kwon, H.; Park, D.H.; Park, Y.; Silvain, J.F.; Kawasaki, A.; Park, Y. Spark plasma sintering behavior of pure aluminum depending on various sintering temperatures. Met. Mater. Int. 2010, 16, 71–75. [Google Scholar] [CrossRef]
- Sweet, G.A.; Brochu, M.; Hexemer, R.L.; Donaldson, I.W.; Bishop, D.P. Microstructure and mechanical properties of air atomized aluminum powder consolidated via spark plasma sintering. Mater. Sci. Eng. A 2014, 608, 273–282. [Google Scholar] [CrossRef]
- Matvienko, Y.I.; Rud, A.; Polishchuk, S.; Rud, N.; Demchenkov, S.; Klepko, O.Y. Phase Transformations during Mechanical Alloying of Powders with eutectic composition of the Al-Cu and Al-Cu/C systems and their effect on the structure and mechanical properties of the composites. Met. Adv. Technol. 2019, 41, 1519. [Google Scholar] [CrossRef]
- Buryakovskaya, O.A.; Suleimanov, M.Z.; Vlaskin, M.S.; Kumar, V.; Ambaryan, G.N. Aluminum Scrap to Hydrogen: Complex Effects of Oxidation Medium, Ball Milling Parameters, and Copper Additive Dispersity. Metals 2023, 13, 185. [Google Scholar] [CrossRef]
- GOST 4784-97; Aluminium and Wrought Aluminium Alloys. Grades. FGUP ‘Standartinform’: Moscow, Russia, 2009.
- Sha, G.; Marceau, R.K.W.; Gao, X.; Muddle, B.C.; Ringer, S.P. Nanostructure of aluminium alloy 2024: Segregation, clustering and precipitation processes. Acta Mater. 2011, 59, 1659–1670. [Google Scholar] [CrossRef]
- Staszczyk, A.; Sawicki, J.; Adamczyk-Cieslak, B. A Study of Second-Phase Precipitates and Dispersoid Particles in 2024 Aluminum Alloy after Different Aging Treatments. Materials 2019, 12, 4168. [Google Scholar] [CrossRef] [PubMed]
- GOST 4960-2009; Electrolytic Copper Powder. Specifications. FGUP ‘Standartinform’: Moscow, Russia, 2009.
- GOST 10157-79; Gaseous and Liquid Argon. Specifications. IPK Standards Publishing House: Moscow, Russia, 1980.
- DIN 1343-1990; Reference Conditions, Normal Conditions, Normal Volume. Concepts and Values. Deutsche Institut für Normung: Berlin, Germany, 1990.
- Gallagher, P.K.; Brown, M.E. Handbook of Thermal Analysis and Calorimetry; Elsevier Science B.V.: Amsterdam, The Netherlands, 2003; Volume 1. [Google Scholar]
- Chumaevskii, A.V.; Zykova, A.P.; Gusarova, A.V.; Guryanov, D.A.; Rubtsov, V.E.; Kolubaev, E.A. Regularities of Structure Formation in AA2024 Alloy During High-Intensity Plastic Deformation Under Conditions of Adhesion-Diffusion Friction Interaction. Russ. Phys. J. 2022, 65, 303–311. [Google Scholar] [CrossRef]
- Kovarik, L.; Court, S.A.; Fraser, H.L.; Mills, M.J. GPB zones and composite GPB/GPBII zones in Al–Cu–Mg alloys. Acta Mater. 2008, 56, 4804–4815. [Google Scholar] [CrossRef]
- Cochard, A.; Zhu, K.; Joulié, S.; Douin, J.; Huez, J.; Robbiola, L.; Sciau, P.; Brunet, M. Natural aging on Al-Cu-Mg structural hardening alloys–Investigation of two historical duralumins for aeronautics. Mater. Sci. Eng. A 2017, 690, 259–269. [Google Scholar] [CrossRef]
- Siddesh Kumar, N.M.; Dhruthi; Pramod, G.K.; Samrat, P.; Sadashiva, M. A Critical Review on Heat Treatment of Aluminium Alloys. Mater. Today Proc. 2022, 58, 71–79. [Google Scholar] [CrossRef]
- Brunet, M.; Malard, B.; Ratel-Ramond, N.; Deshayes, C.; Joulié, S.; Warot-Fonrose, B.; Sciau, P.; Douin, J.; De Geuser, F.; Deschamps, A. Precipitation in original Duralumin A-U4G versus modern 2017A alloy. Materialia 2019, 8, 100429. [Google Scholar] [CrossRef]
- Hu, X.; Gao, Y.; Zhang, B.; Shi, L.; Li, Q. Superior cycle performance of Li metal electrode with surface texturing. EcoMat 2022, 4, e12264. [Google Scholar] [CrossRef]
- Durdziński, P.T.; Dunant, C.F.; Haha, M.B.; Scrivener, K.L. A new quantification method based on SEM-EDS to assess fly ash composition and study the reaction of its individual components in hydrating cement paste. Cem. Concr. Res. 2015, 73, 111–122. [Google Scholar] [CrossRef]
- Ohfuji, H.; Yamamoto, M. EDS quantification of light elements using osmium surface coating. J. Mineral. Petrol. Sci. 2015, 110, 189–195. [Google Scholar] [CrossRef]
- Shi, H.; Yu, M.; Liu, J.; Wang, J.; Yang, H.; Li, S. Role of grain boundary on the growth behavior of anodic film on spark plasma sintered AA6061. Appl. Surf. Sci. 2021, 553, 149473. [Google Scholar] [CrossRef]
- X-ray Mass Attenuation Coefficients. Aluminum Z = 13. Available online: https://physics.nist.gov/PhysRefData/XrayMassCoef/ElemTab/z13.html (accessed on 17 February 2022).
- Paraskevas, D.; Vanmeensel, K.; Vleugels, J.; Dewulf, W.; Deng, Y.; Duflou, J.R. Spark Plasma Sintering As a Solid-State Recycling Technique: The Case of Aluminum Alloy Scrap Consolidation. Materials 2014, 7, 5664–5687. [Google Scholar] [CrossRef]
- Meng, Y.; Li, S.; Liu, J.; Yu, M.; Tian, W.; Chen, M. Pitting of 2024 alloys prepared by spark plasma sintering using powders with different sizes. Corros. Sci. 2020, 170, 108525. [Google Scholar] [CrossRef]
- Yang, H.C.; Lee, J.W.; Kim, K.T. Rubber isostatic pressing of metal powder under warm temperatures. Powder Technol. 2004, 139, 240–251. [Google Scholar] [CrossRef]
- Razavi Hesabi, Z.; Hafizpour, H.R.; Simchi, A. An investigation on the compressibility of aluminum/nano-alumina composite powder prepared by blending and mechanical milling. Mater. Sci. Eng. A 2007, 454–455, 89–98. [Google Scholar] [CrossRef]
- Iwaoka, T.; Nakamura, M. Effect of Compaction Temperature on Sinterability of Magnesium and Aluminum Powder Mixtures by Warm Compaction Method. Mater. Trans. 2011, 52, 943–947. [Google Scholar] [CrossRef]
- Grosjean, M.H.; Zidoune, M.; Roué, L.; Huot, J.Y. Hydrogen production via hydrolysis reaction from ball-milled Mg-based materials. Int. J. Hydrogen Energy 2006, 31, 109–119. [Google Scholar] [CrossRef]
- Xiao, F.; Yang, R.; Li, J. Aluminum composites with bismuth nanoparticles and graphene oxide and their application to hydrogen generation in water. Int. J. Hydrogen Energy 2020, 45, 6082–6089. [Google Scholar] [CrossRef]
- Buryakovskaya, O.A.; Vlaskin, M.S.; Ryzhkova, S.S. Hydrogen production properties of magnesium and magnesium-based materials at low temperatures in reaction with aqueous solutions. J. Alloys Compd. 2019, 785, 136–145. [Google Scholar] [CrossRef]
- Wan, S.; Song, X.; Wang, X.; Yuan, C.; Wang, B.; Chen, H.; Li, Y.; Ouyang, K.; Chen, R. Enhanced removal thallium from rinsing wastewater by poly aluminum chloride: Experimental and theoretical studies. Sep. Purif. Technol. 2022, 302, 122158. [Google Scholar] [CrossRef]
- Zhang, W.-M.; Zhuang, J.-X.; Chen, Q.; Wang, S.; Song, W.-G.; Wan, L.-J. Cost-Effective Production of Pure Al13 from AlCl3 by Electrolysis. Ind. Eng. Chem. Res. 2012, 51, 11201–11206. [Google Scholar] [CrossRef]
- Morris, C.E.; Welch, C.M. Use of Aluminum or Titanium Compounds to Bind Antibacterial Agents to Cotton Fabric. Text. Res. J. 1983, 53, 143–147. [Google Scholar] [CrossRef]
- Ivanov, V.V.; Kirik, S.D.; Shubin, A.A.; Blokhina, I.A.; Denisov, V.M.; Irtugo, L.A. Thermolysis of acidic aluminum chloride solution and its products. Ceram. Int. 2013, 39, 3843–3848. [Google Scholar] [CrossRef]
- Andò, S. Gravimetric Separation of Heavy Minerals in Sediments and Rocks. Minerals 2020, 10, 273. [Google Scholar] [CrossRef]
- Dutta, D.; Kumari, A.; Panda, R.; Jha, S.; Gupta, D.; Goel, S.; Jha, M.K. Close loop separation process for the recovery of Co, Cu, Mn, Fe and Li from spent lithium-ion batteries. Sep. Purif. Technol. 2018, 200, 327–334. [Google Scholar] [CrossRef]
- Campanari, S.; Guandalini, G.; Coolegem, J.; ten Have, J.; Hayes, P.; Pichel, A.H. Modeling, Development and Preliminary Testing of a 2 MW PEM Fuel Cell Plant Fueled With Hydrogen From a Chlor-Alkali Industry. In Proceedings of the ASME 2018 12th International Conference on Energy Sustainability Collocated with the ASME 2018 Power Conference and the ASME 2018 Nuclear Forum, Lake Buena Vista, FL, USA, 24–28 June 2018. [Google Scholar]
- Pei, P.; Wang, M.; Chen, D.; Ren, P.; Zhang, L. Key technologies for polymer electrolyte membrane fuel cell systems fueled impure hydrogen. Prog. Nat. Sci. Mater. Int. 2020, 30, 751–763. [Google Scholar] [CrossRef]
- Verhage, A.J.L.; Coolegem, J.F.; Mulder, M.J.J.; Yildirim, M.H.; de Bruijn, F.A. 30,000 h operation of a 70 kW stationary PEM fuel cell system using hydrogen from a chlorine factory. Int. J. Hydrogen Energy 2013, 38, 4714–4724. [Google Scholar] [CrossRef]
- Li, H.; Wang, H.; Qian, W.; Zhang, S.; Wessel, S.; Cheng, T.T.H.; Shen, J.; Wu, S. Chloride contamination effects on proton exchange membrane fuel cell performance and durability. J. Power Source 2011, 196, 6249–6255. [Google Scholar] [CrossRef]
- Li, H.; Zhang, S.; Qian, W.; Yu, Y.; Yuan, X.-Z.; Wang, H.; Jiang, M.; Wessel, S.; Cheng, T.T.H. Impacts of operating conditions on the effects of chloride contamination on PEM fuel cell performance and durability. J. Power Source 2012, 218, 375–382. [Google Scholar] [CrossRef]
- Unnikrishnan, A.; Janardhanan, V.M.; Rajalakshmi, N.; Dhathathreyan, K.S. Chlorine-contaminated anode and cathode PEMFC-recovery perspective. J. Solid State Electrochem. 2018, 22, 2107–2113. [Google Scholar] [CrossRef]
- Uddin, M.A.; Wang, X.; Qi, J.; Ozdemir, M.O.; Pasaogullari, U.; Bonville, L.; Molter, T. Effect of Chloride on PEFCs in Presence of Various Cations. J. Electrochem. Soc. 2015, 162, F373. [Google Scholar] [CrossRef]
- Mass Concentration of Chlorine in Atmospheric Air Samples. Procedure for Measurements by a Spectrophotometric Method Based on Methyl Orange Solution Color Fading; Guideline Document RD 52.04.798-2014; Ministry of Natural Resources and Environment (Russia): Moscow, Russia, 2015. [Google Scholar]


| Size, μm | Mass, g | Fraction, % |
|---|---|---|
| >1000 | 0.20 | 0.4 |
| 500–1000 | 2.44 | 5.0 |
| 100–500 | 37.07 | 76.5 |
| <100 | 8.75 | 18.1 |
| Sample | Spectra No. | Cu | Al | O | Mg | Fe | Mn | Si | Ni |
|---|---|---|---|---|---|---|---|---|---|
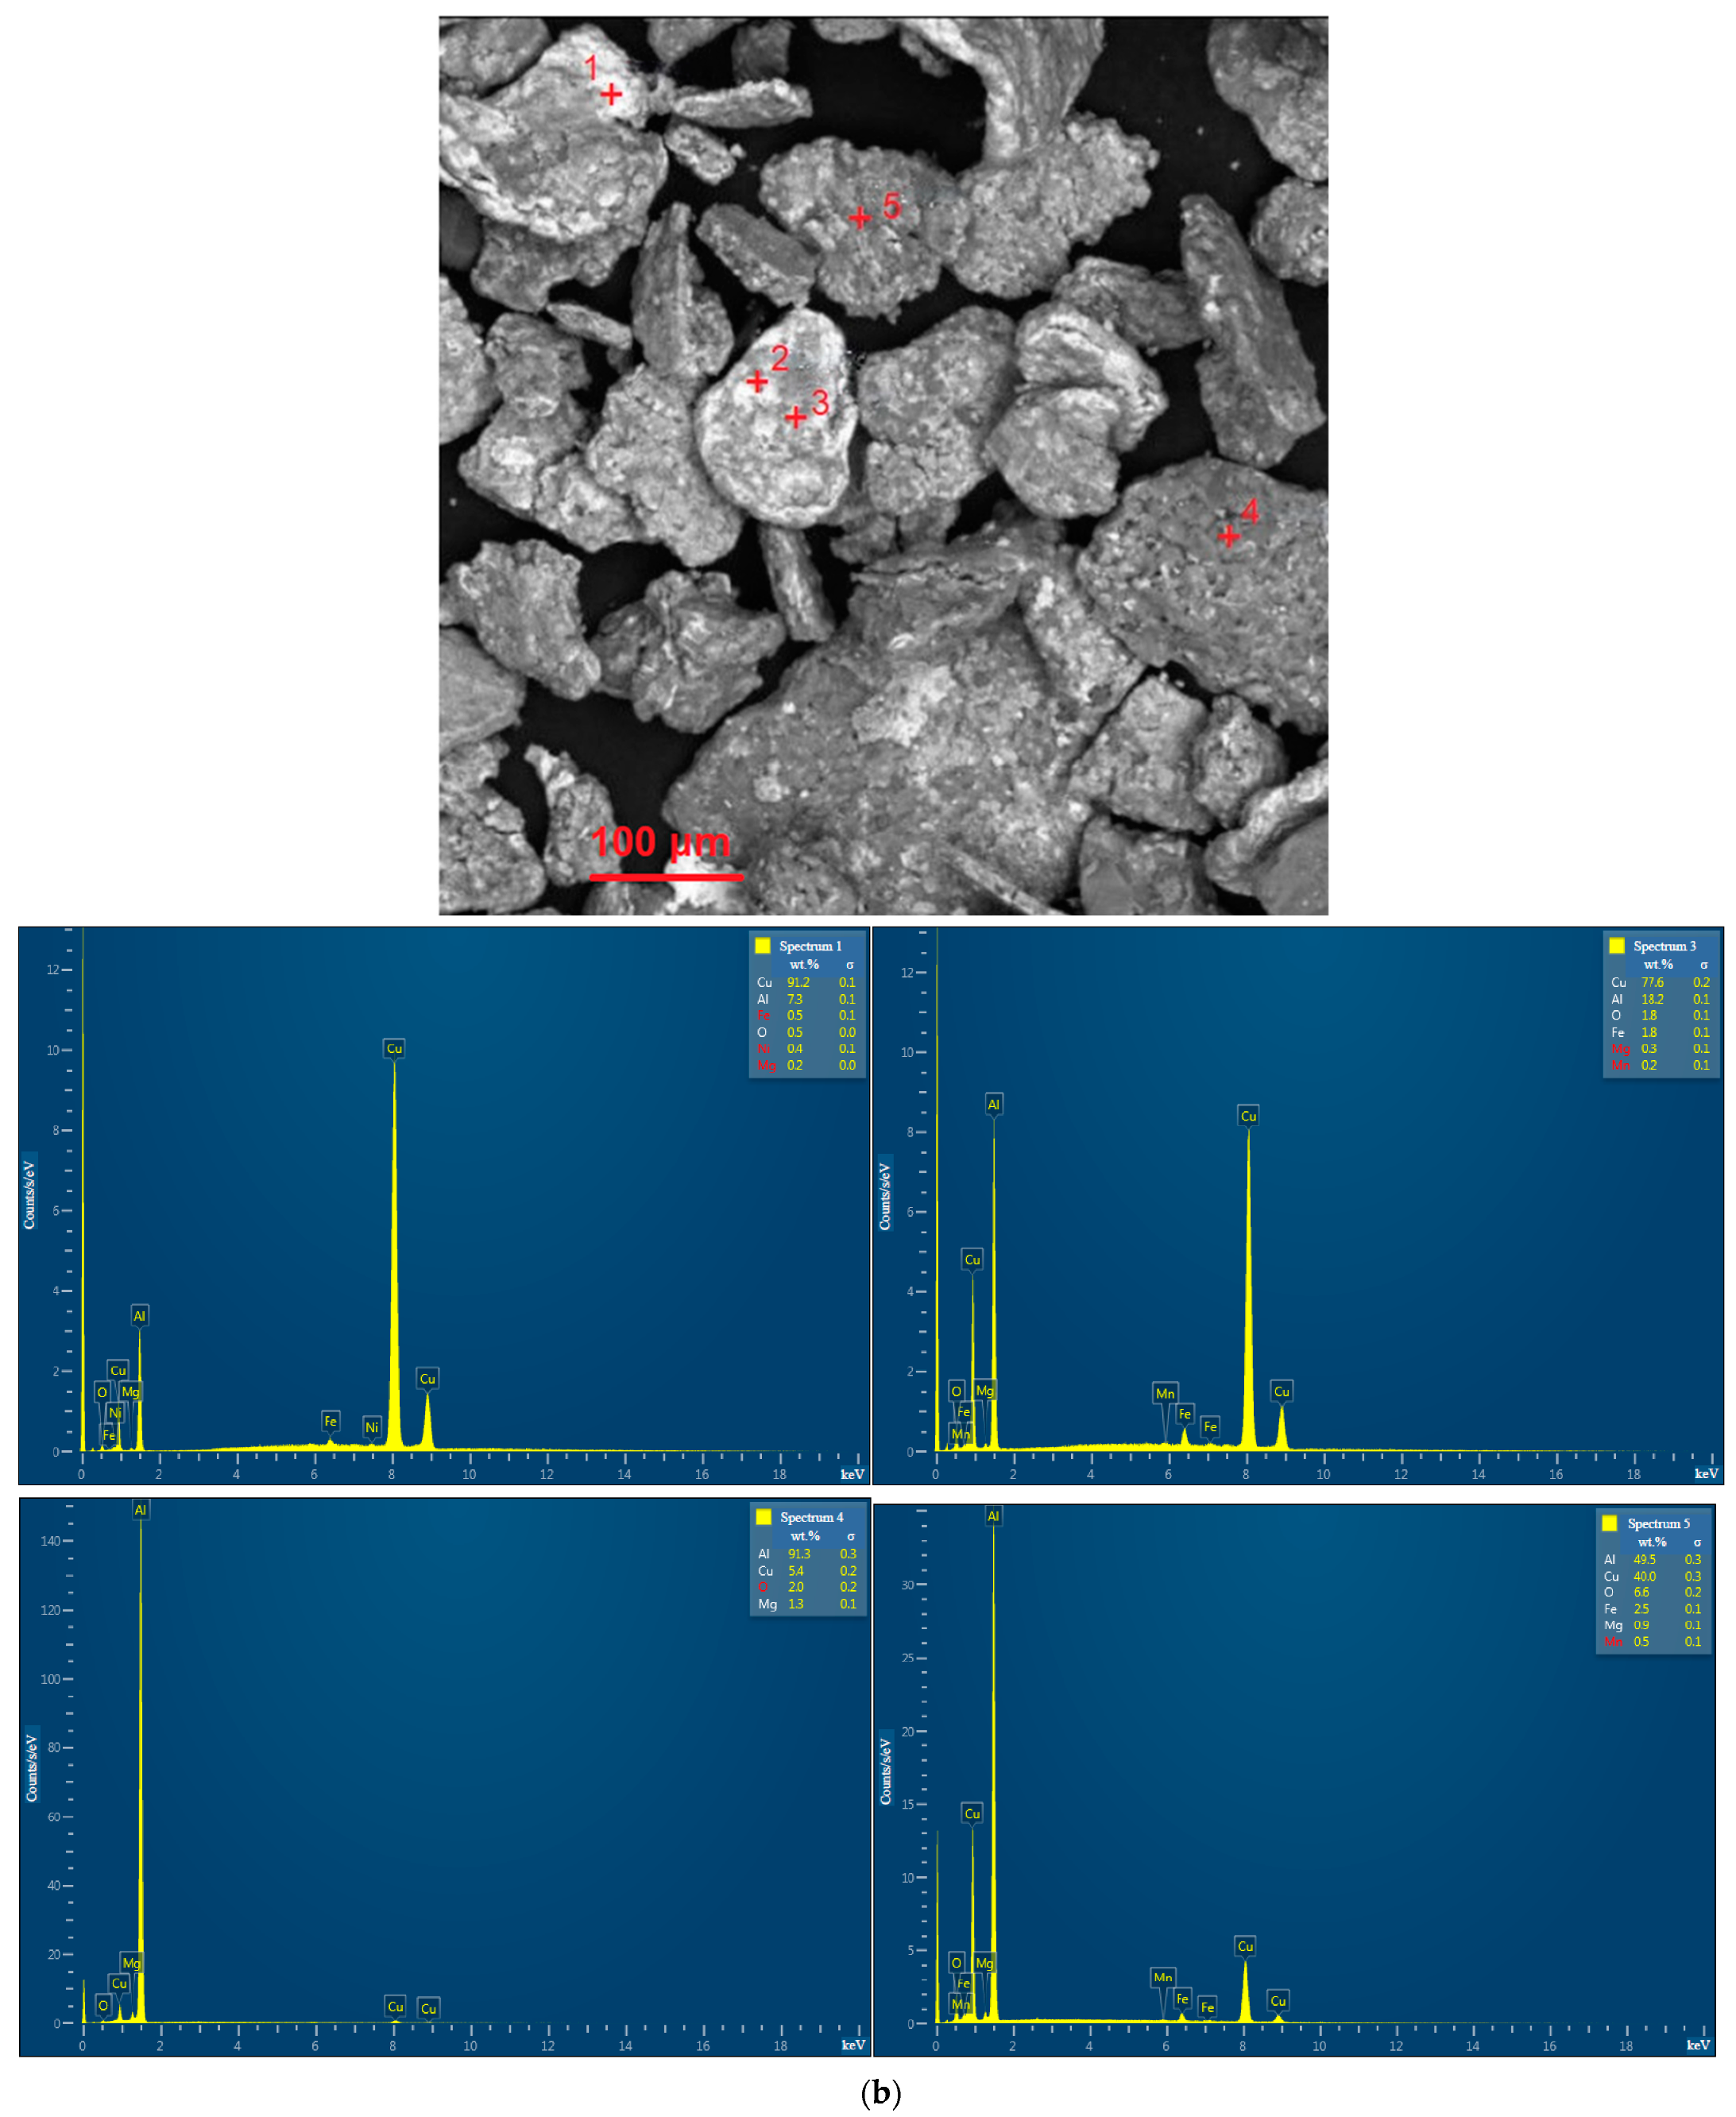
| Powder | 1 | 91.2 ± 0.1 | 7. 3 ± 0.1 | 0.5 | 0.2 | 0.5 ± 0.1 | - | - | 0.4 ± 0.1 |
| 3 | 77.6 ± 0.2 | 18.2 ± 0.1 | 1.8 ± 0.1 | 0.3 ± 0.1 | 1.8 ± 0.1 | 0.2 ± 0.1 | - | - | |
| 4 | 5.4 ± 0.2 | 91.3 ± 0.3 | 2.0 ± 0.2 | 1.3 ± 0.1 | - | - | - | - | |
| 5 | 40.0 ± 0.3 | 49.5 ±0.3 | 6.6 ± 0.2 | 0.9 ± 0.1 | 2.5 ± 0.1 | 0.5 ± 0.1 | - | - | |
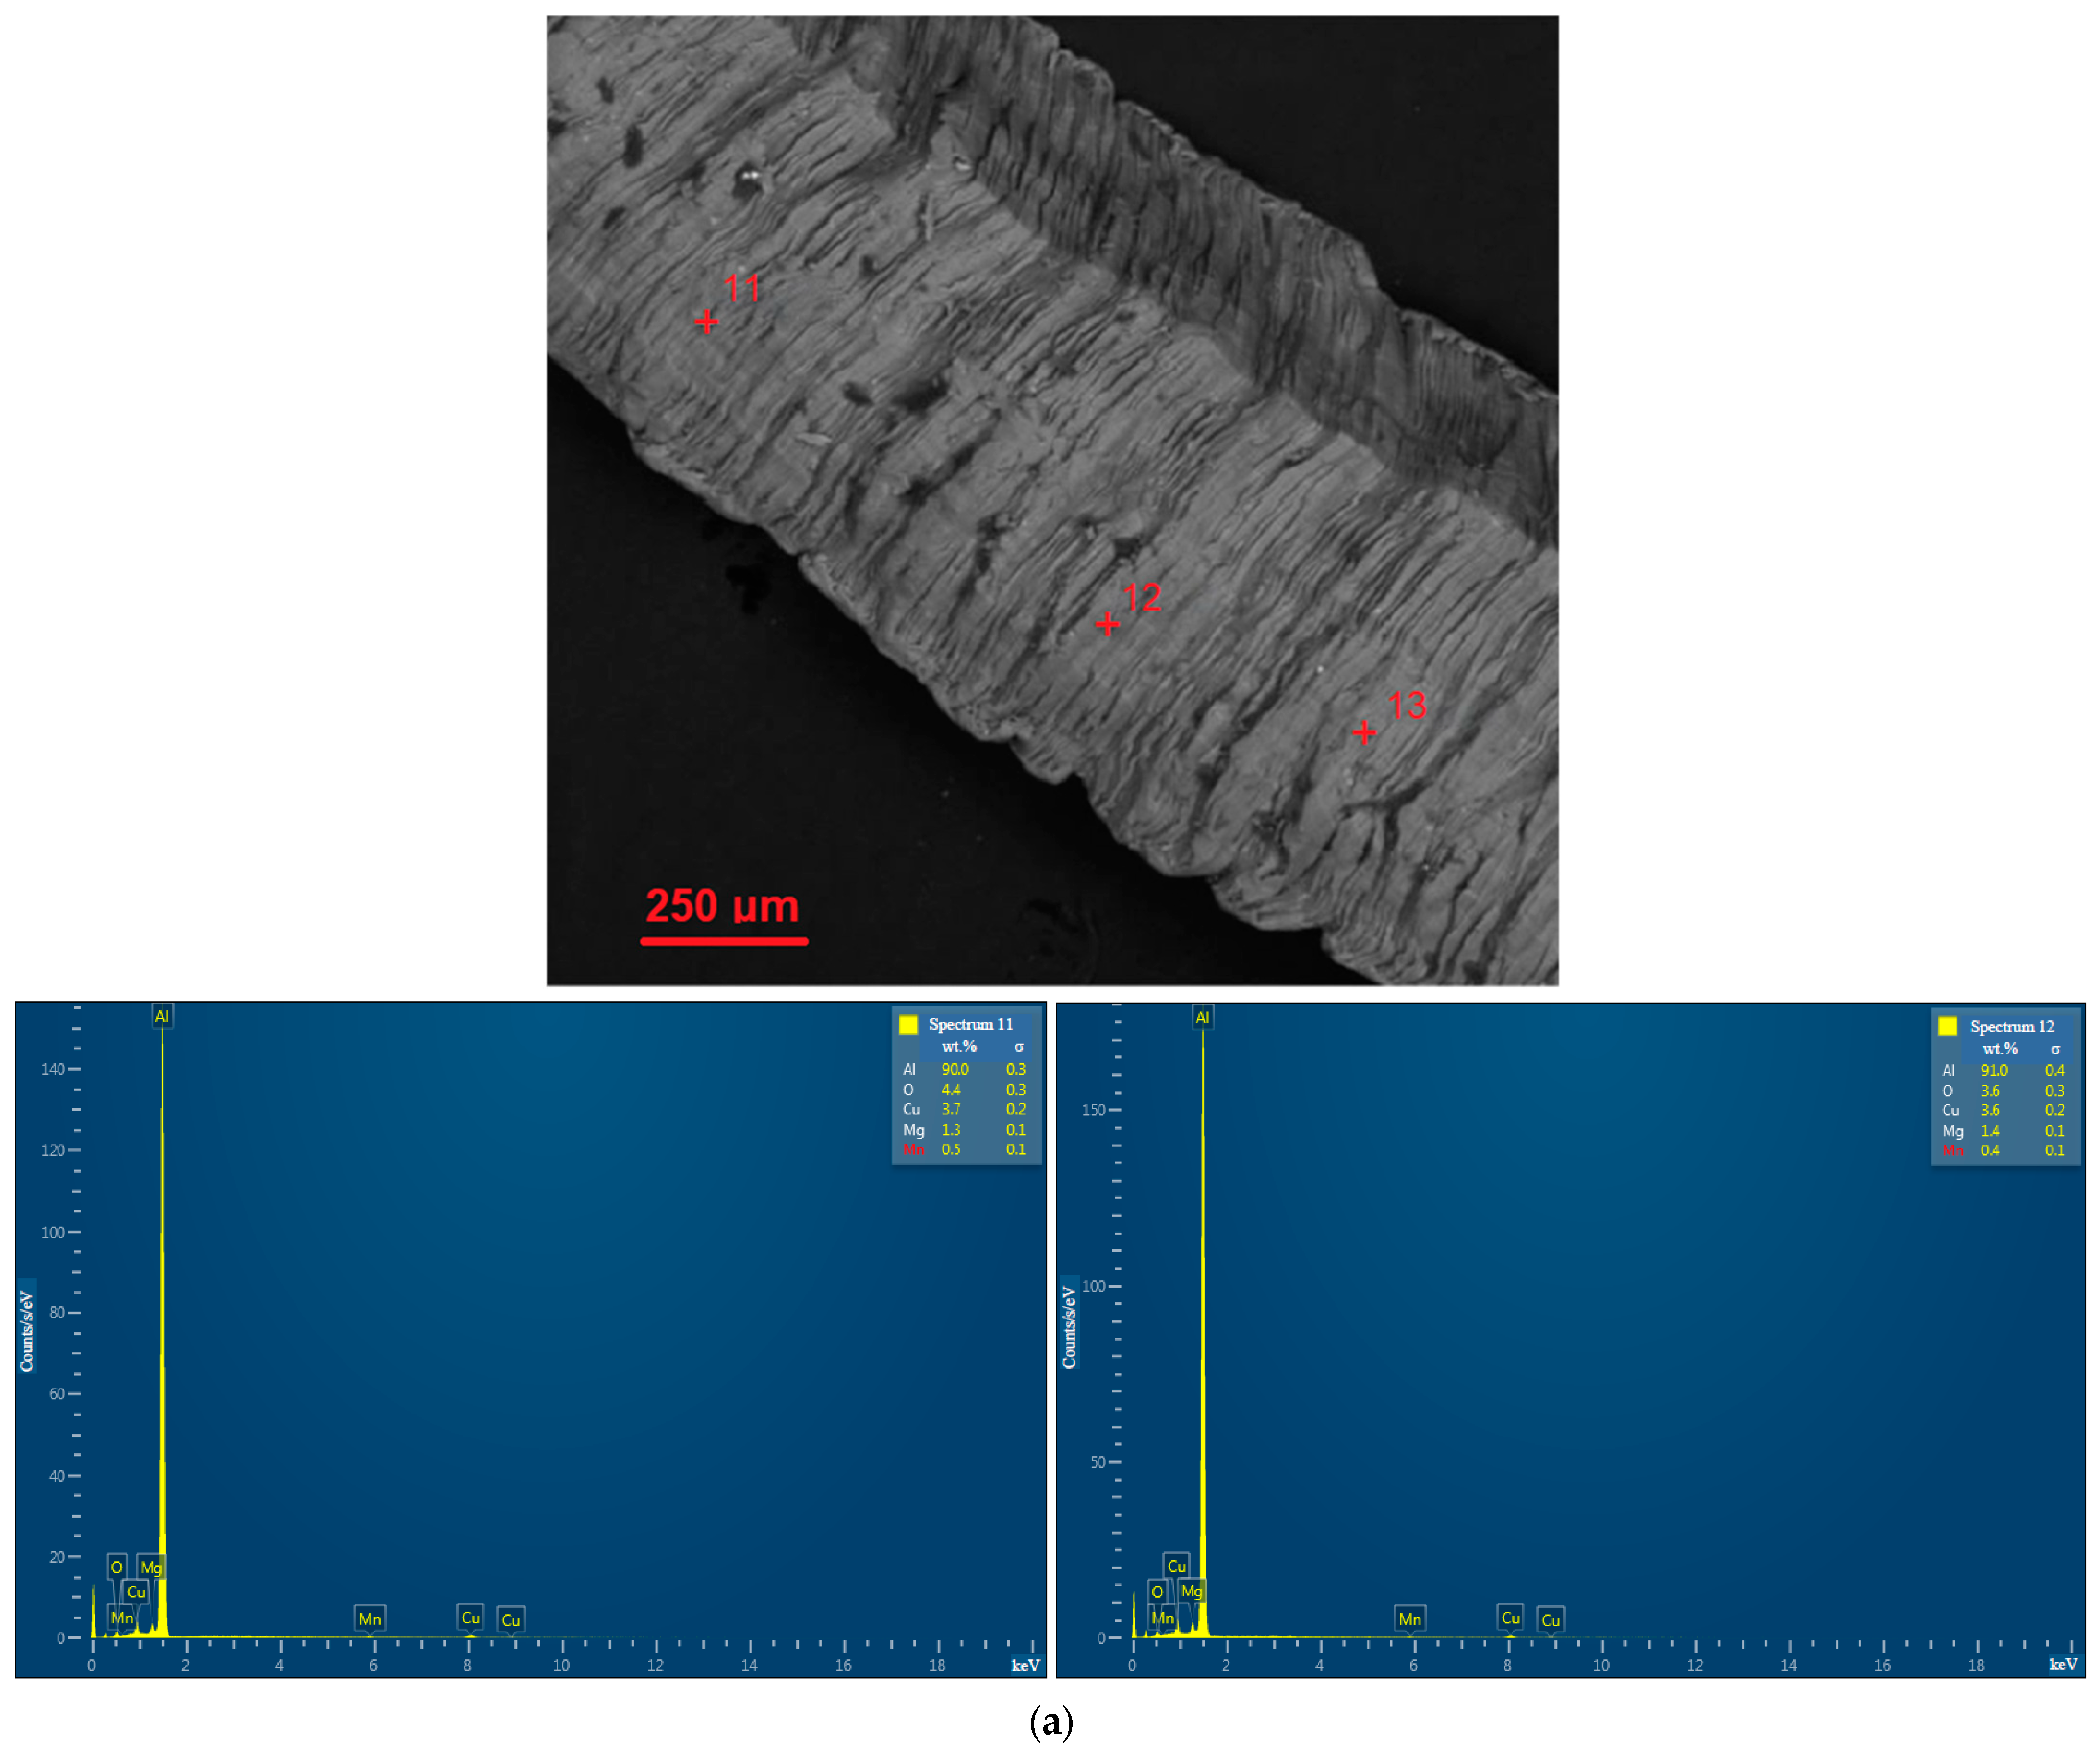
| Scrap | 11 | 3.7 0.2 | 90.0 ± 0.3 | 4.4 ± 0.3 | 1.3 ± 0.1 | - | 0.5 ± 0.1 | - | - |
| 12 | 3.6 ± 0.2 | 91.0 ± 0.4 | 3.6 ± 0.3 | 1.4 ± 0.1 | 0.4 ± 0.1 | - | - | - | |
| Cold-pressed | 24 | 99.6 ± 0.1 | 0.4 ± 0.1 | - | - | - | - | - | - |
| 27 | 21.8 ± 0.3 | 73.3 ± 0.3 | 2.0 ± 0.2 | 1.2 ± 0.1 | 1.3 ± 0.1 | 0.5 ± 0.1 | - | - | |
| 29 | 4.3 ± 0.2 | 92.6 ± 0.3 | 1.2 ± 0.2 | 1.4 ± 0.1 | - | 0.5 ± 0.1 | - | - | |
| 30 | 21.8 ± 0.3 | 67.7 ± 0.3 | 1.5 ± 0.2 | - | 5.8 ± 0.1 | 3.2 ± 0.1 | - | - | |
| 32 | 0.9 ± 0.2 | 6.6 ± 0.1 | 2.2± 0.3 | - | - | - | 90.2 ± 0.3 | - | |
| Sintered | 17 | 79.7 ± 0.3 | 18.0 ± 0.2 | 2.0 ± 0.2 | - | 0.3 ± 0.1 | - | - | - |
| 18 | 44.1 ± 0.3 | 48.1 ± 0.3 | 3.4 ± 0.2 | 0.9 ± 0.1 | 3.2 ± 0.1 | 0.3 ± 0.1 | - | - | |
| 21 | 3.5 ± 0.2 | 93.7 ± 0.3 | 1.2 ± 0.2 | 1.1 ± 0.1 | - | - | - | 0.4 ± 0.1 | |
| 22 | 33.8 ± 0.3 | 51.3 ± 0.3 | 1.0 ± 0.2 | 13.3 ± 0.2 | - | - | - | - |
| Sample | Temperature, °C | Hydrogen Yield *, % | Reaction Rate Constant, s−1 | R2 | Collision Frequency Factor, s−1 | Activation Energy, kJ/mol |
|---|---|---|---|---|---|---|
| Cold-pressed Tablet | 60 | 97.66 ± 0.70 | 5.93 × 10⁻³ | 0.9885 | 36.42 × 10⁶ | 62.23 ± 9.11 |
| 70 | 97.00 ± 1.27 | 13.39 × 10⁻³ | 0.9937 | |||
| 80 | 98.45 ± 2.14 | 21.12 × 10⁻³ | 0.9982 | |||
| Sintered Tablet | 60 | 97.79 ± 3.62 | 16.16 × 10⁻³ | 0.9981 | 37.60 × 10⁴ | 46.80 ± 8.87 |
| 70 | 98.50 ± 2.60 | 30.92 × 10⁻³ | 0.9978 | |||
| 80 | 99.71 ± 0.27 | 42.00 × 10⁻³ | 0.9991 |
Disclaimer/Publisher’s Note: The statements, opinions and data contained in all publications are solely those of the individual author(s) and contributor(s) and not of MDPI and/or the editor(s). MDPI and/or the editor(s) disclaim responsibility for any injury to people or property resulting from any ideas, methods, instructions or products referred to in the content. |
© 2023 by the authors. Licensee MDPI, Basel, Switzerland. This article is an open access article distributed under the terms and conditions of the Creative Commons Attribution (CC BY) license (https://creativecommons.org/licenses/by/4.0/).
Share and Cite
Buryakovskaya, O.A.; Vlaskin, M.S.; Butyrin, A.V. Metal Scrap to Hydrogen: Manufacture of Hydroreactive Solid Shapes via Combination of Ball Milling, Cold Pressing, and Spark Plasma Sintering. Nanomaterials 2023, 13, 3118. https://0-doi-org.brum.beds.ac.uk/10.3390/nano13243118
Buryakovskaya OA, Vlaskin MS, Butyrin AV. Metal Scrap to Hydrogen: Manufacture of Hydroreactive Solid Shapes via Combination of Ball Milling, Cold Pressing, and Spark Plasma Sintering. Nanomaterials. 2023; 13(24):3118. https://0-doi-org.brum.beds.ac.uk/10.3390/nano13243118
Chicago/Turabian StyleBuryakovskaya, Olesya A., Mikhail S. Vlaskin, and Aleksey V. Butyrin. 2023. "Metal Scrap to Hydrogen: Manufacture of Hydroreactive Solid Shapes via Combination of Ball Milling, Cold Pressing, and Spark Plasma Sintering" Nanomaterials 13, no. 24: 3118. https://0-doi-org.brum.beds.ac.uk/10.3390/nano13243118