A HepG2 Cell-Based Biosensor That Uses Stainless Steel Electrodes for Hepatotoxin Detection

 , , and
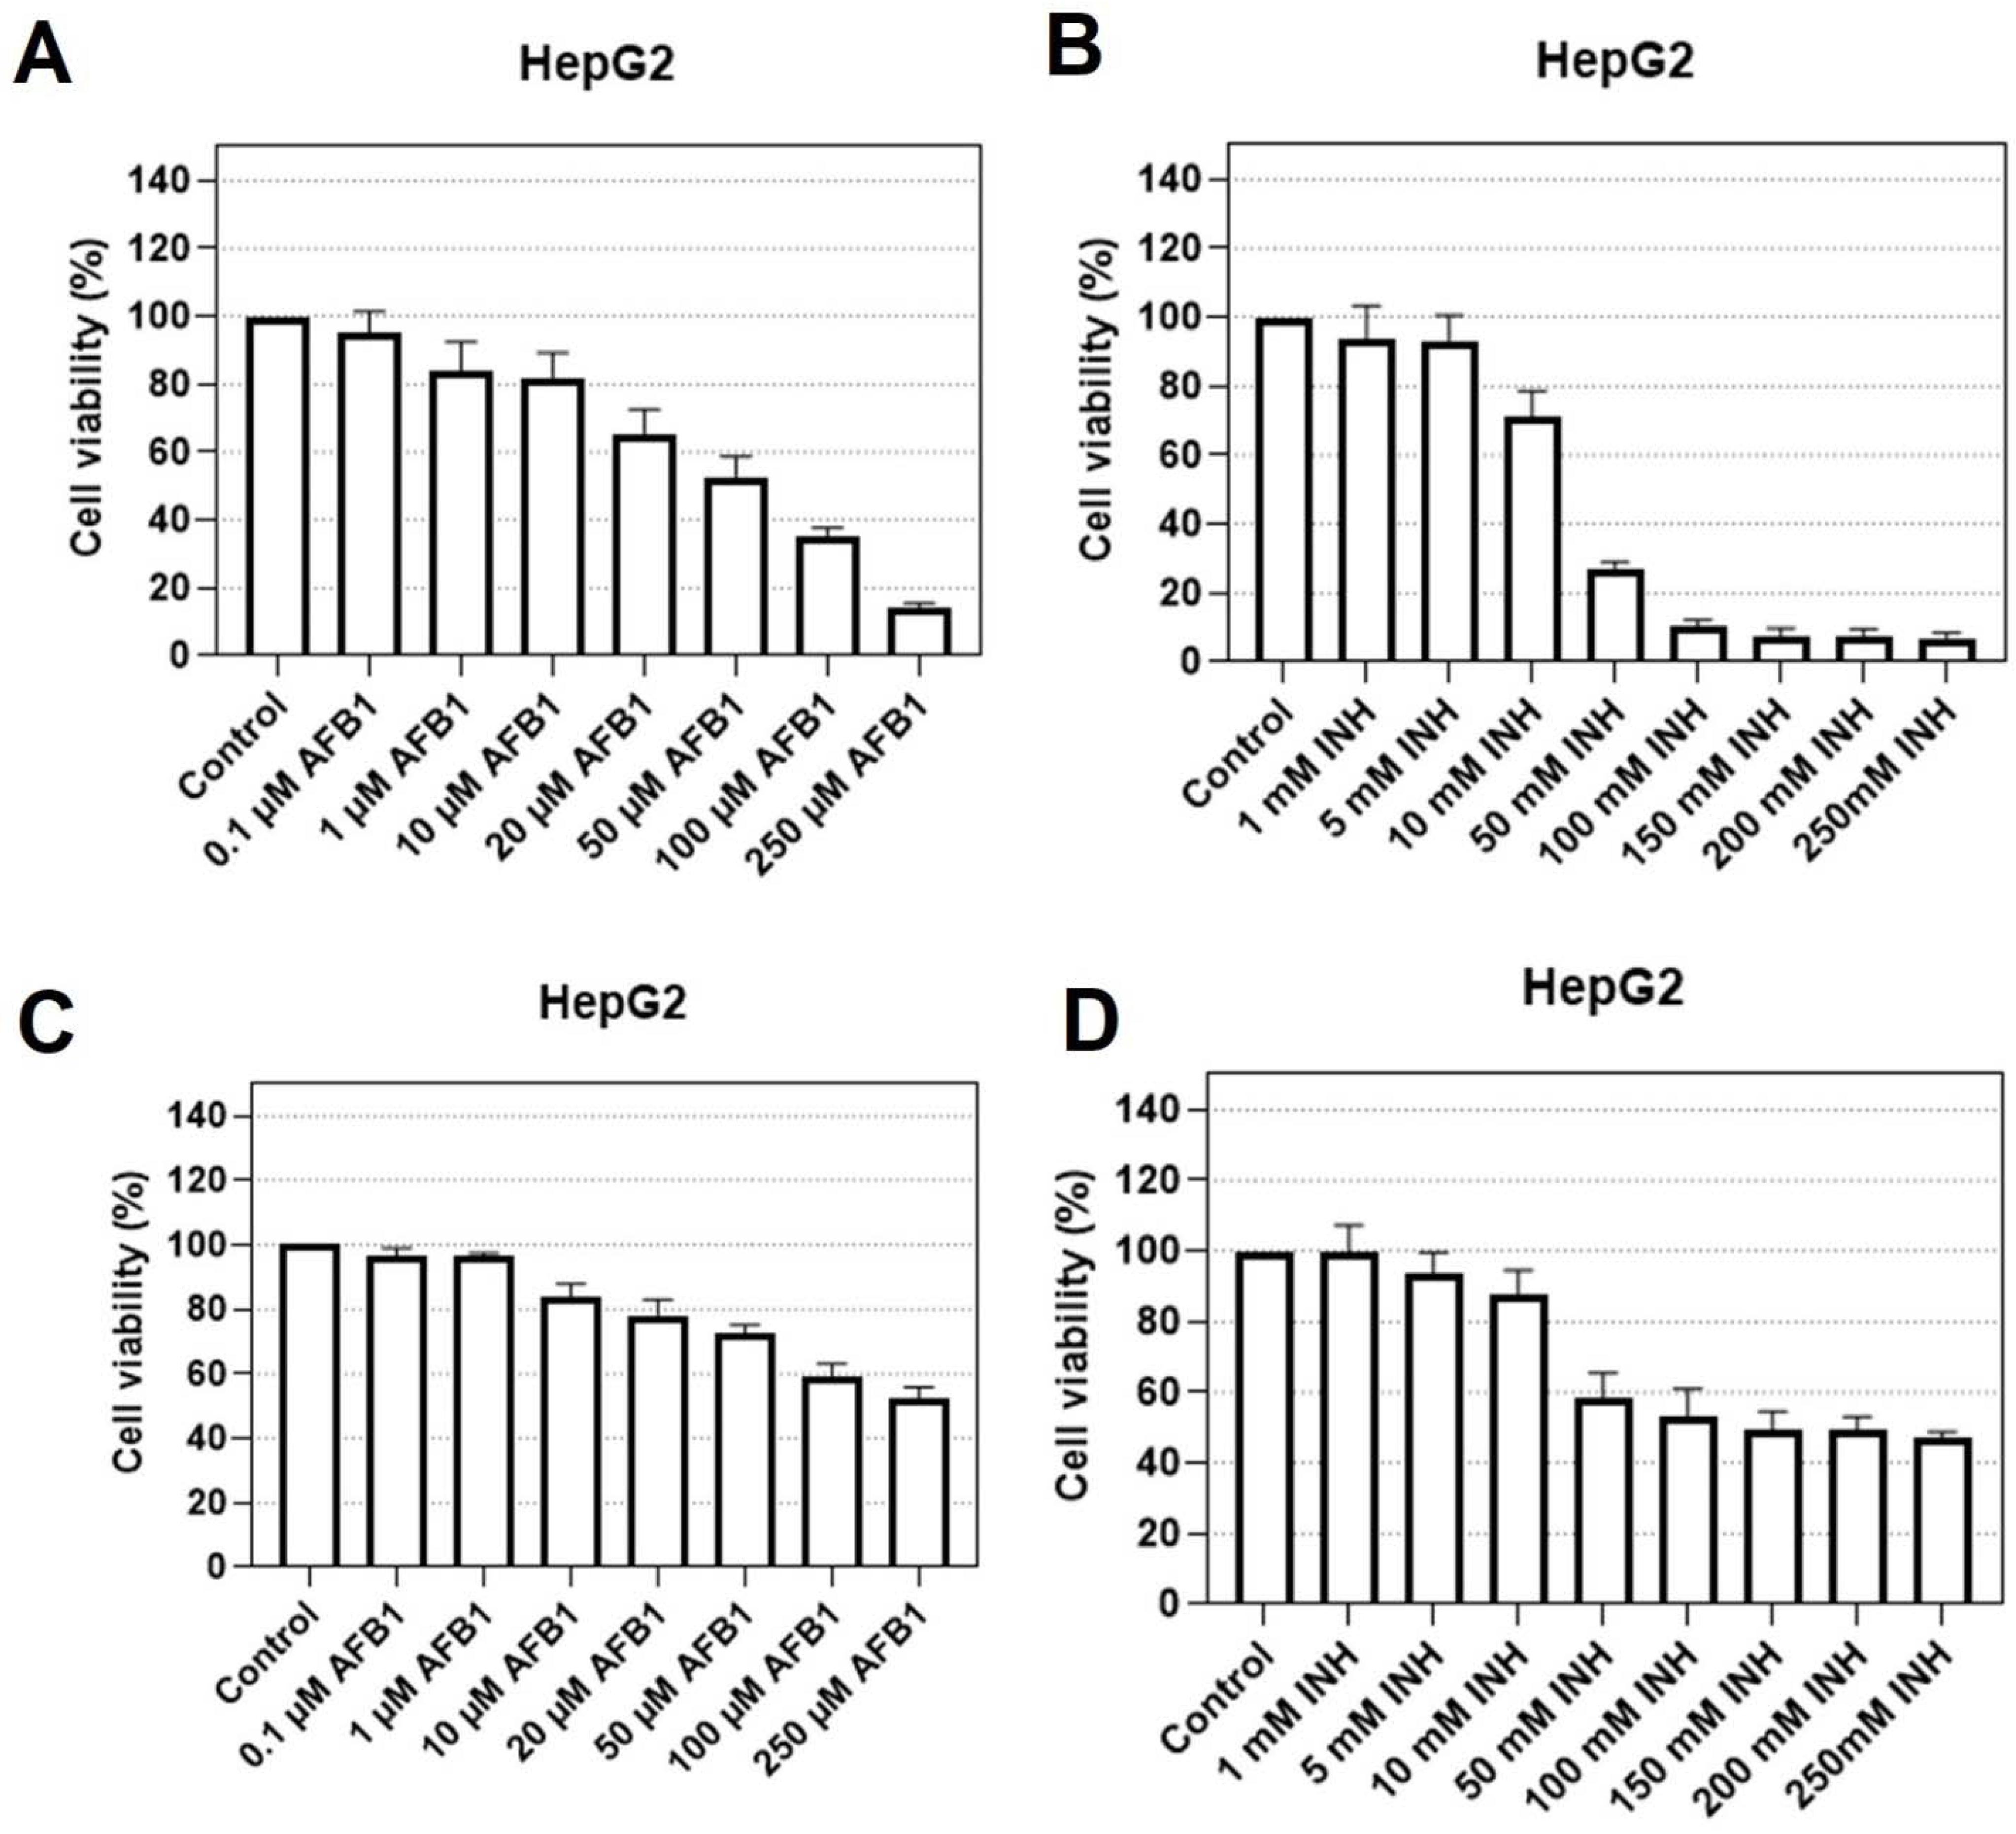
Abstract
:1. Introduction
2. Materials and Methods
2.1. Cytotoxic Tests
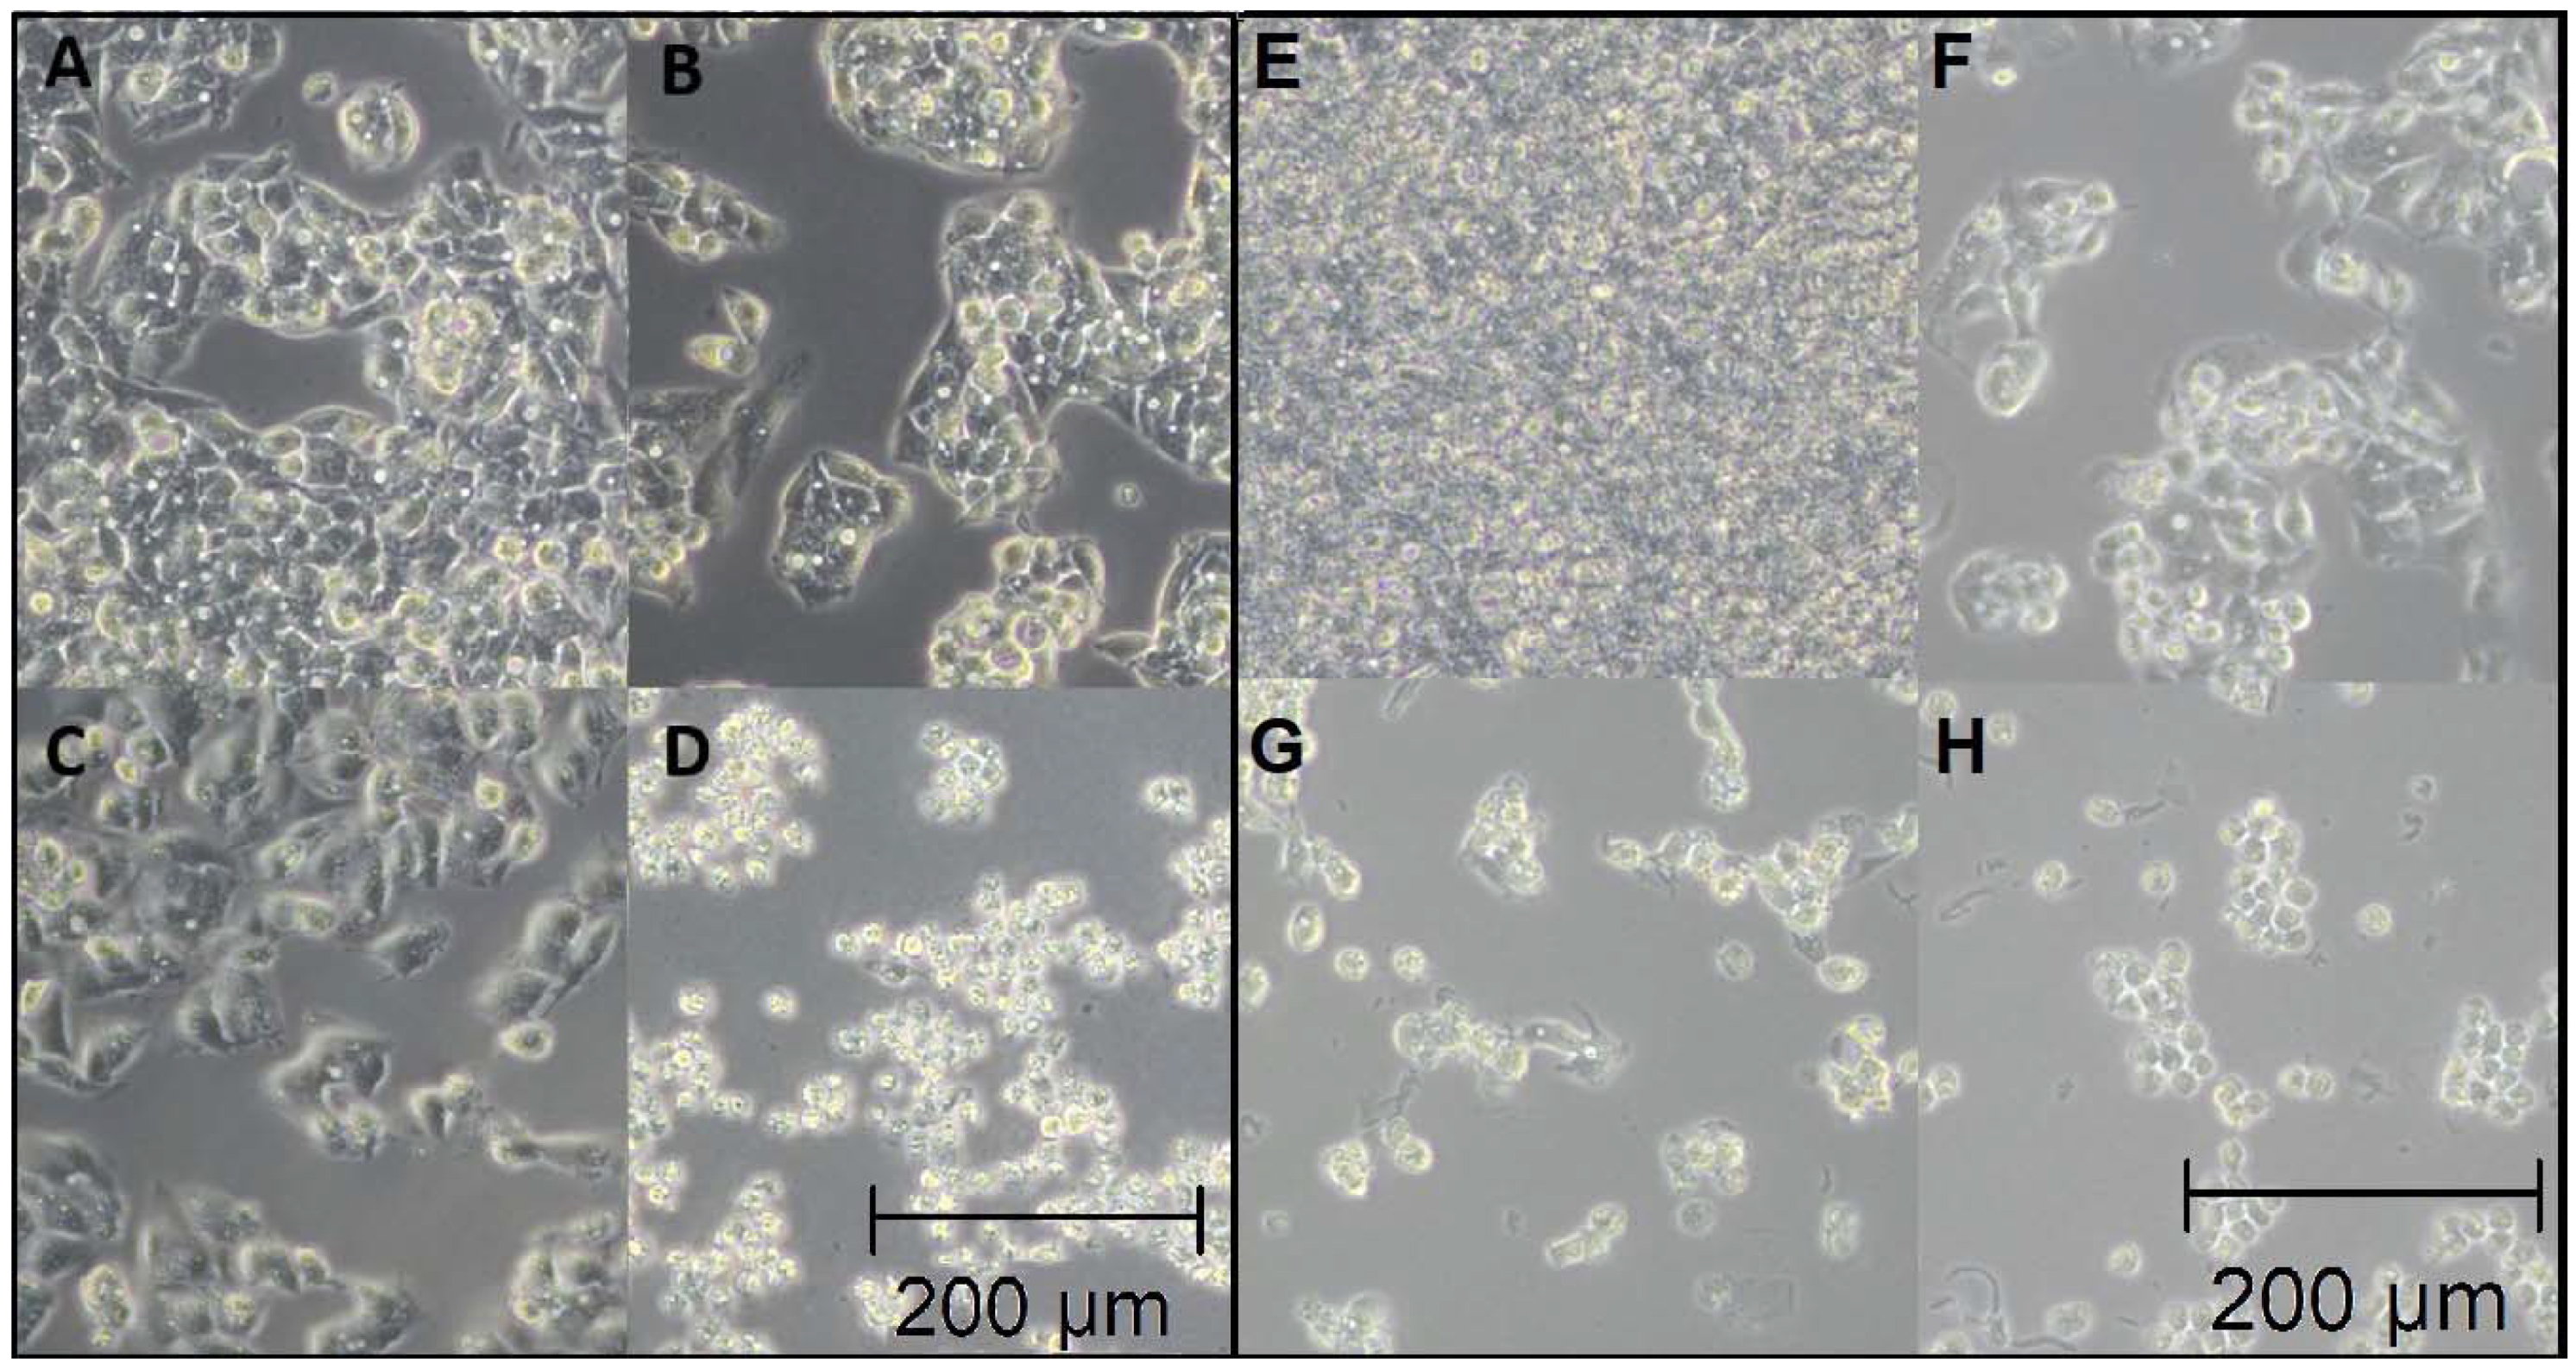
2.2. Optical Microscopy
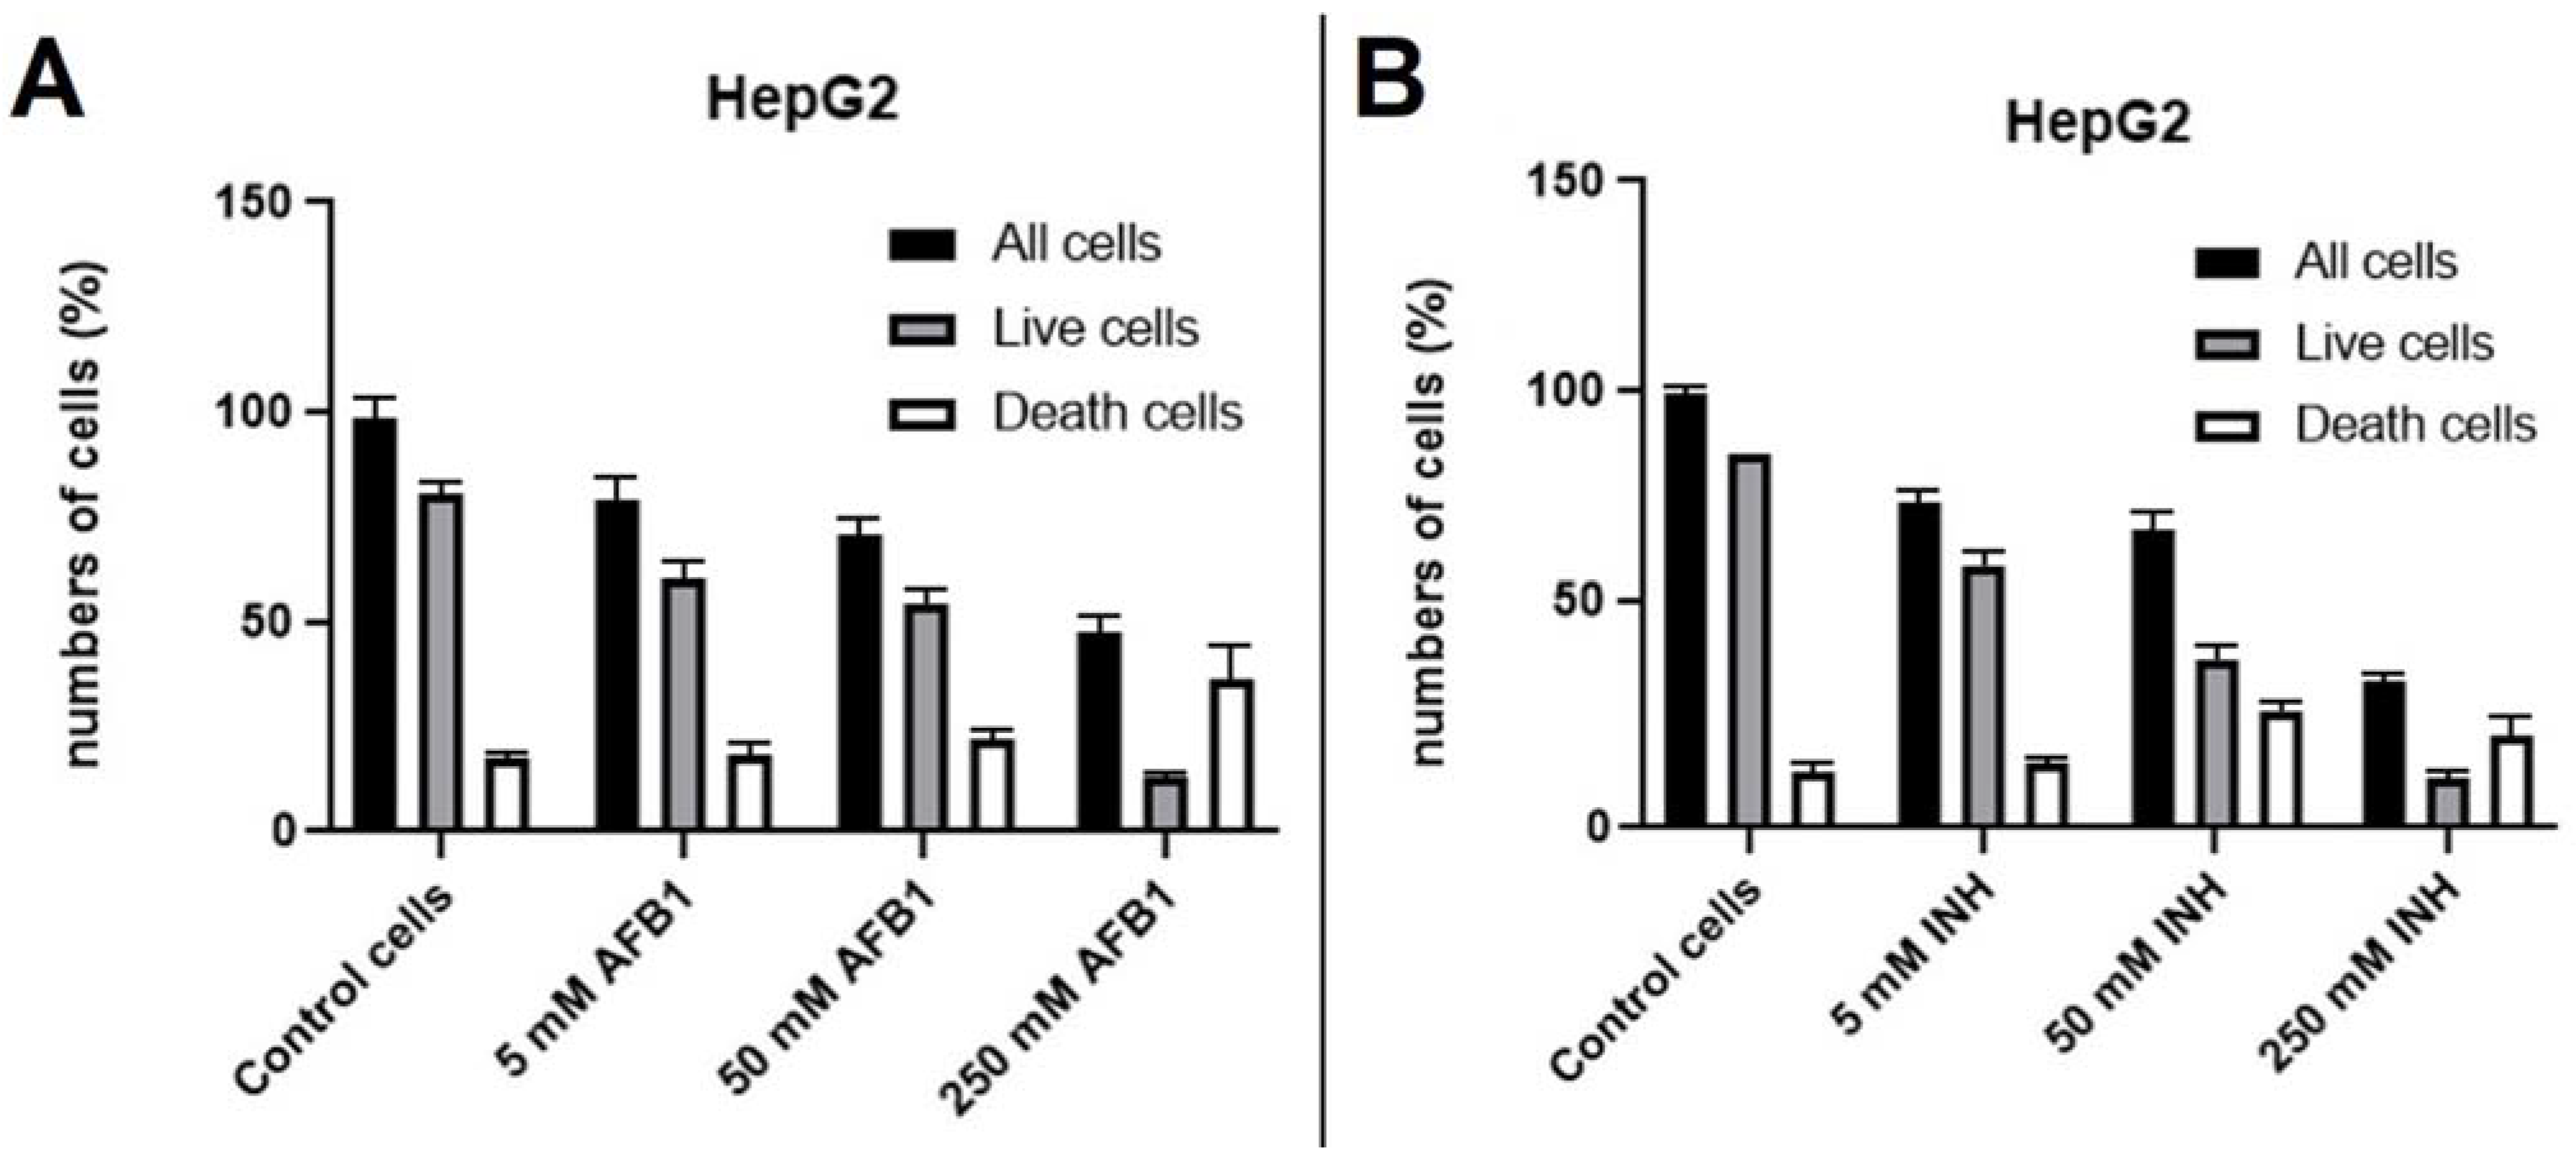
2.3. Fluorescence Microscopy
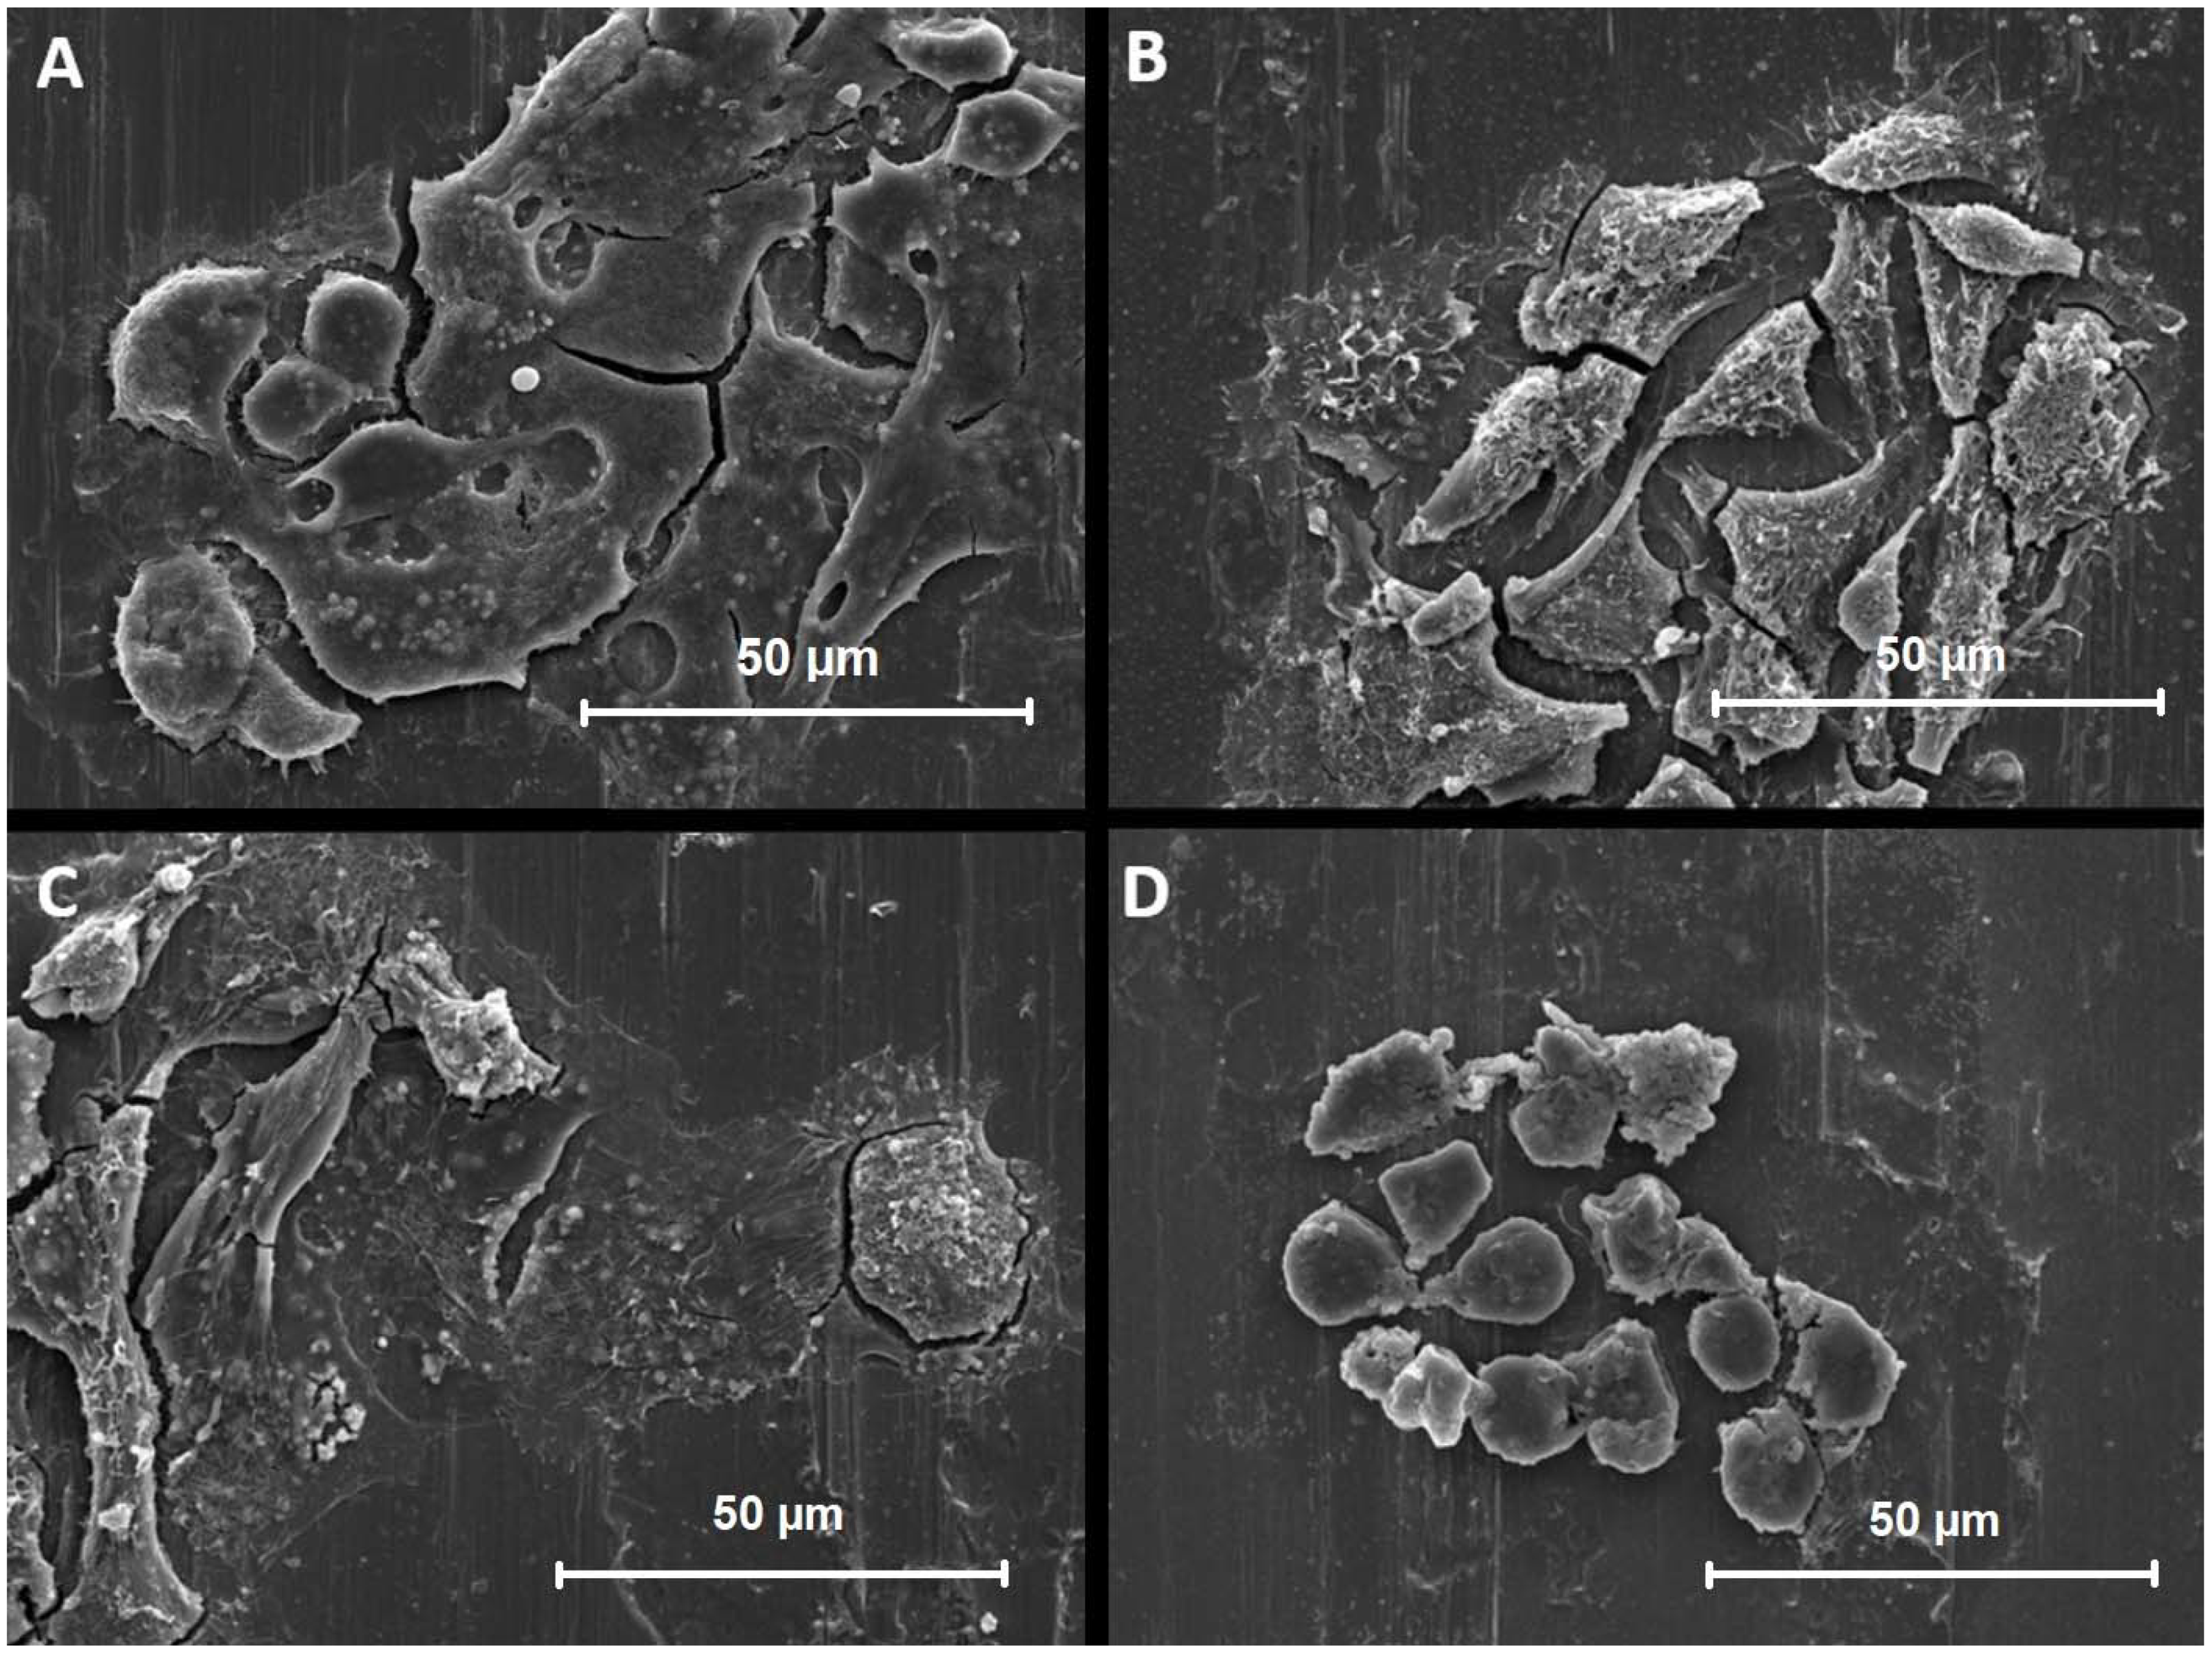
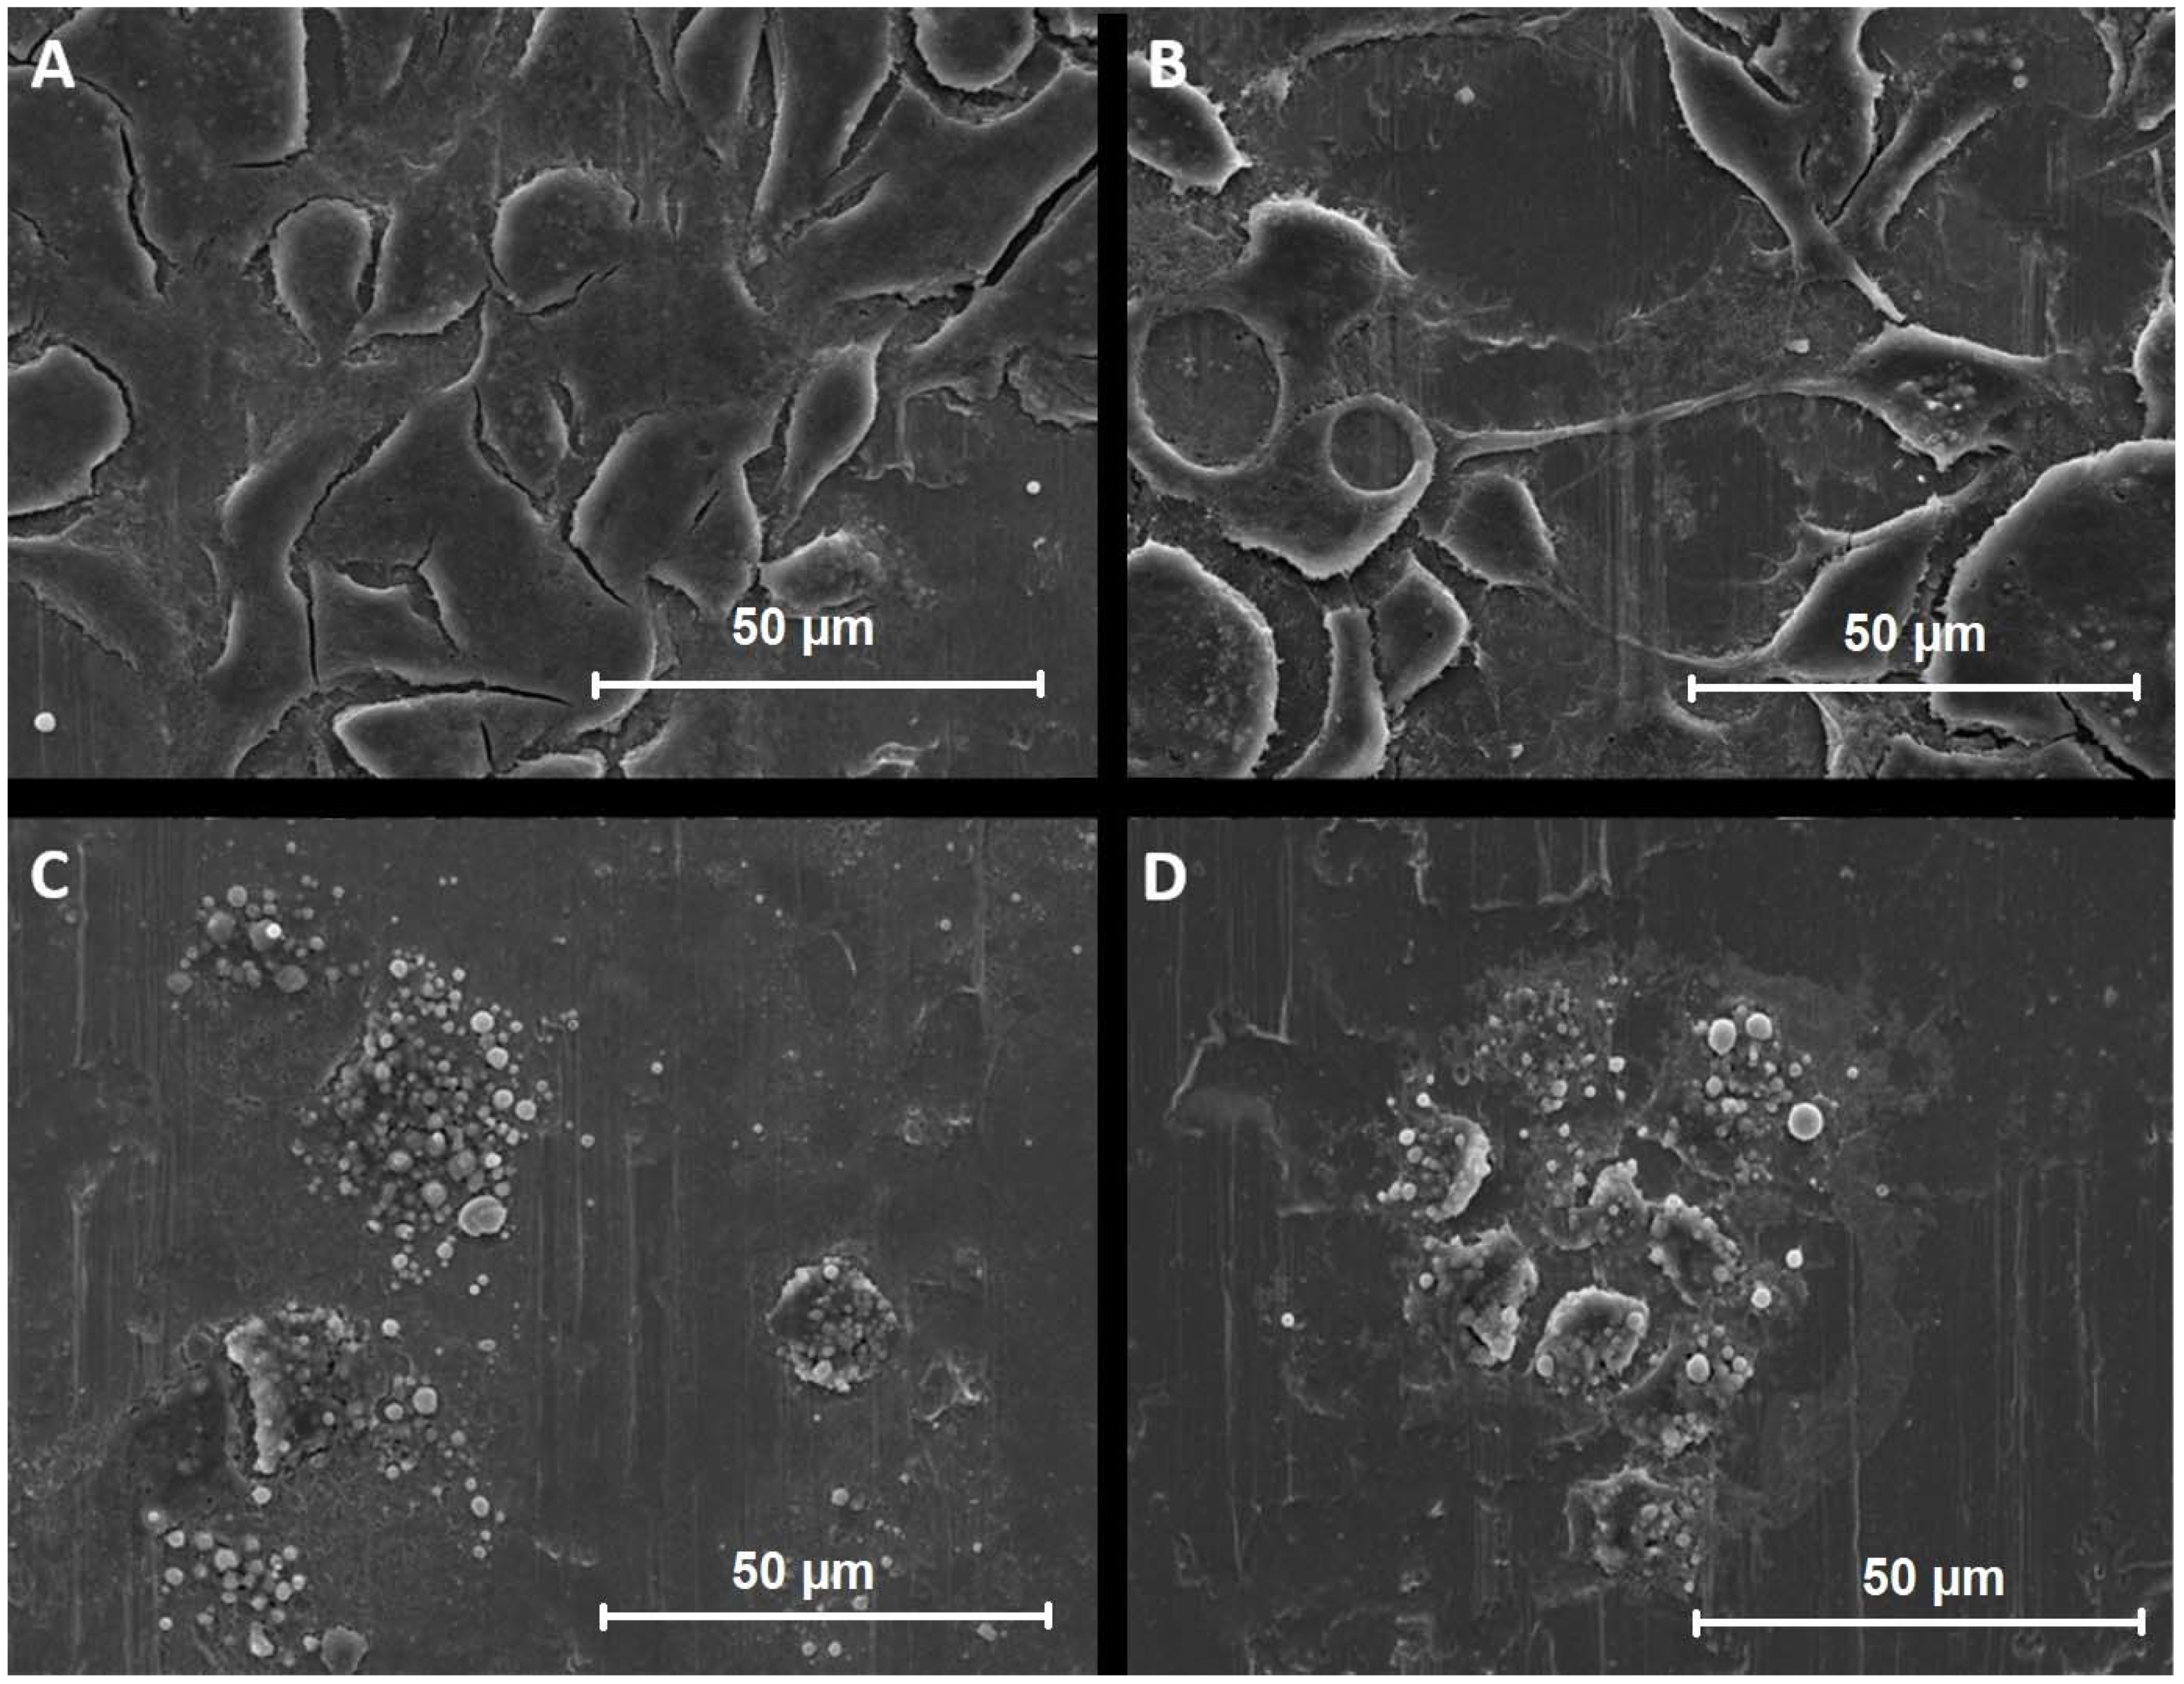
2.4. Scanning Electron Microscopy
2.5. Biosensor Assembly and Electrochemical Impedance Spectroscopy (EIS)
3. Results
3.1. Cytotoxic Tests
3.2. Optical Microscopy
3.3. Fluorescence Microscopy
3.4. Fluorescence Microscopy
3.4.1. Aflatoxin B1
3.4.2. Isoniazid
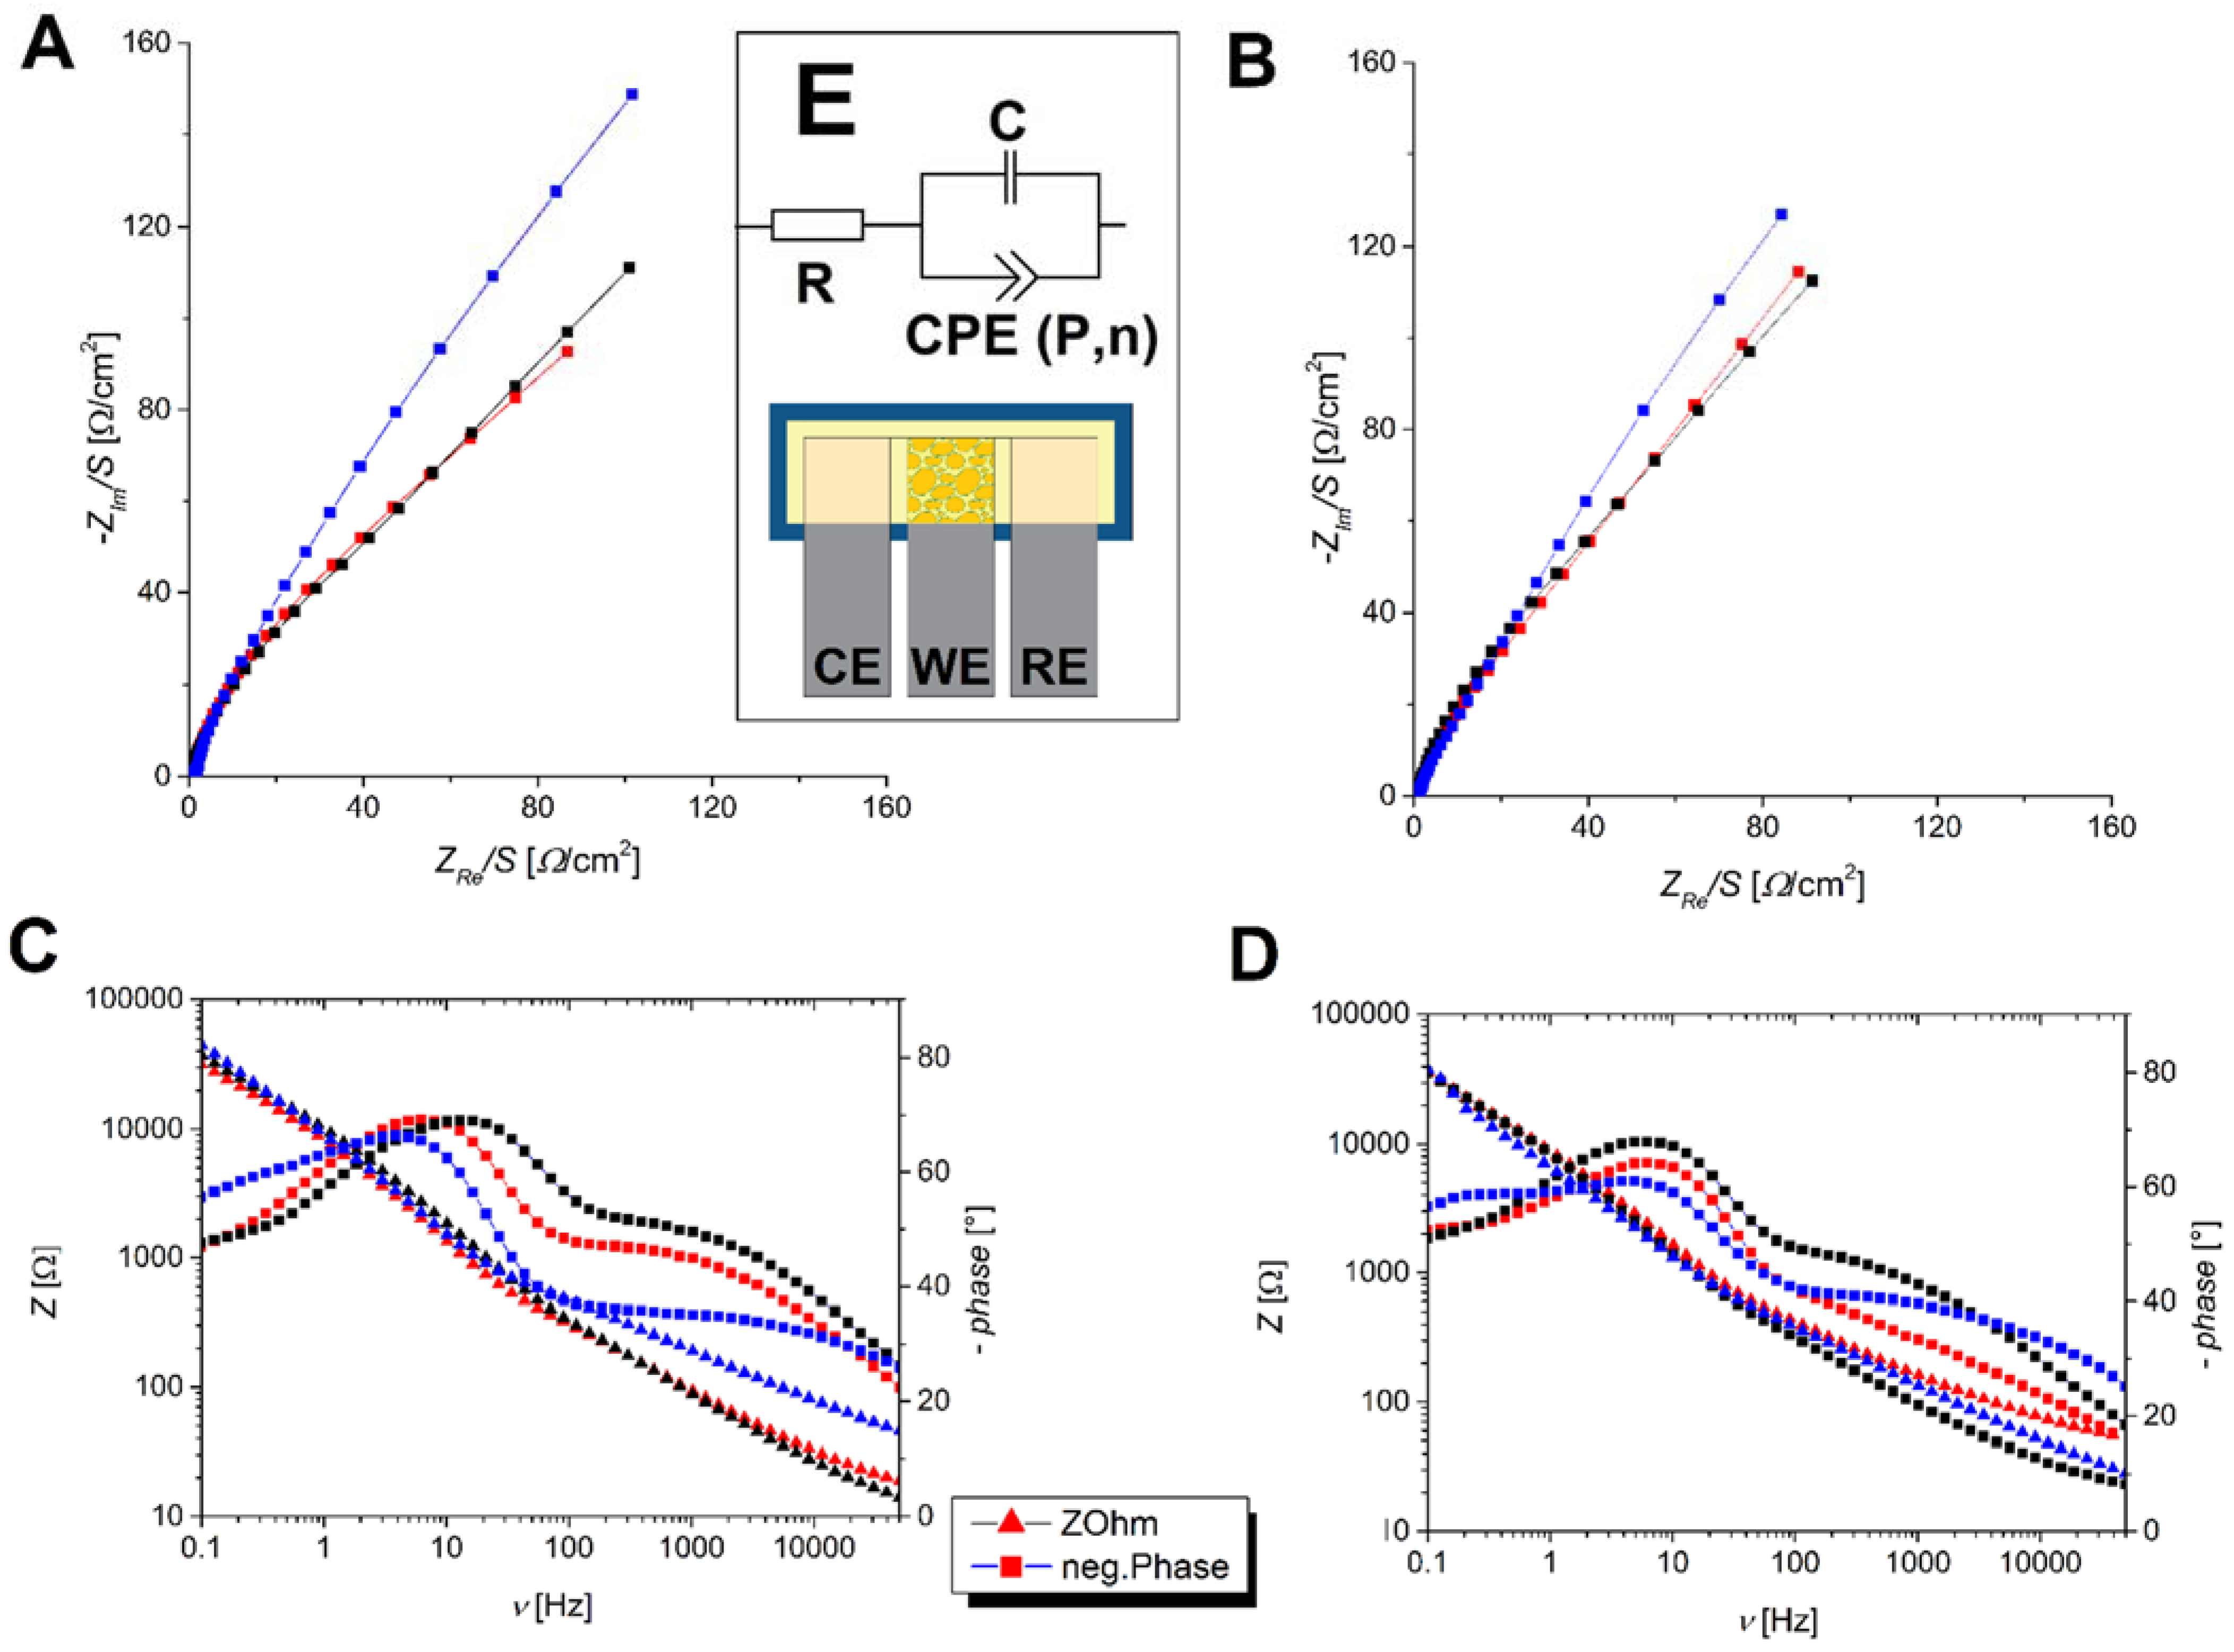
3.5. Electrochemical Impedance Spectroscopy
4. Discussion
5. Conclusions
Supplementary Materials
Author Contributions
Funding
Institutional Review Board Statement
Informed Consent Statement
Data Availability Statement
Acknowledgments
Conflicts of Interest
References
- Duan, L.; Akakpo, J.Y.; Ramachandran, A.; Jaeschke, H. Environmental liver toxins. In Encyclopedia of Environmental, 2nd ed.; Elsevier: Oxford, UK, 2019; pp. 578–584. [Google Scholar]
- Zhu, L.; Huang, C.; Yang, X.; Zhang, B.; He, X.; Xu, W.; Huang, K. Proteomics reveals the alleviation of zinc towards aflatoxin b1-induced cytotoxicity in human hepatocyes (hepg2 cells). Ecotoxicol. Environ. Saf. 2020, 198, 110596. [Google Scholar] [CrossRef] [PubMed]
- Štern, A.; Furlan, V.; Novak, M.; Štampar, M.; Kolenc, Z.; Kores, K.; Filipič, M.; Bren, U.; Žegura, B. Chemoprotective effects of xanthohumol against the carcinogenic mycotoxin aflatoxin b1. Foods 2021, 10, 1331. [Google Scholar] [CrossRef] [PubMed]
- Tabata, S. Mycotoxins: Aflatoxins and related compounds. In Encyclopedia of Dairy Sciences, 3rd ed.; Elsevier: Amsterdam, The Netherlands, 2022; pp. 575–585. [Google Scholar]
- Flament, E.; Guitton, J.; Gaulier, J.; Gaillard, Y. Human poisoning from poisonous higher fungi: Focus on analytical toxicology and case reports in forensic toxicology. Pharmaceuticals 2020, 13, 454. [Google Scholar] [CrossRef] [PubMed]
- Wilson, C.R.; Butz, J.K.; Mengel, M.C. Methods for analysis of gastrointestinal toxicants. In Reference Module in Biomedical Sciences; Elsevier: Amsterdam, The Netherlands, 2014. [Google Scholar]
- Wong, A.; Graudins, A. Risk prediction of hepatotoxicity in paracetamol poisoning. Clin. Toxicol. 2017, 55, 879–892. [Google Scholar] [CrossRef]
- YEW, W.W.; LEUNG, C.C. Antituberculosis drugs and hepatotoxicity. Respirology 2006, 11, 699–707. [Google Scholar] [CrossRef]
- Hassan, H.M.; Guo, H.-l.; Yousef, B.A.; Luyong, Z.; Zhenzhou, J. Hepatotoxicity mechanisms of isoniazid: A mini-review. J. Appl. Toxicol. 2015, 35, 1427–1432. [Google Scholar] [CrossRef]
- Combrink, M.; Loots, D.T.; du Preez, I. Metabolomics describes previously unknown toxicity mechanisms of isoniazid and rifampicin. Toxicol. Lett. 2020, 322, 104–110. [Google Scholar] [CrossRef]
- McElhiney, J.; Lawton, L.A. Detection of the cyanobacterial hepatotoxins microcystins. Toxicol. Appl. Pharmacol. 2005, 203, 219–230. [Google Scholar] [CrossRef]
- Ye, W.; Liu, T.; Zhang, W.; Zhu, M.; Liu, Z.; Kong, Y.; Liu, S. Marine toxins detection by biosensors based on aptamers. Toxins 2019, 12, 1. [Google Scholar] [CrossRef] [Green Version]
- Tothill, I.E.; Turner, A.P.F. Biosensors. In Encyclopedia of Food Sciences and Nutrition, 2nd ed.; Academic Press: Oxford, UK, 2003; pp. 489–499. [Google Scholar]
- Caballero, B.; Trugo, L.C.; Finglas, P.M. Encyclopedia of Food Sciences and Nutrition; Elsevier: Amsterdam, The Netherlands, 2003. [Google Scholar]
- Bhalla, N.; Jolly, P.; Formisano, N.; Estrela, P. Introduction to biosensors. Essays Biochem. 2016, 60, 1–8. [Google Scholar] [CrossRef] [Green Version]
- Malhotra, S.; Verma, A.; Tyagi, N.K.; Kumar, V. Biosensors: Principle, types and applications. Int. J. Adv. Res. Innov. Ideas Educ. 2017, 3, 3639–3644. [Google Scholar]
- Karim, F.; Fakhruddin, A.N.M. Recent advances in the development of biosensor for phenol: A review. Rev. Environ. Sci. Biotechnol. 2012, 11, 261–274. [Google Scholar] [CrossRef]
- Amaro, F.; Turkewitz, A.P.; MartĂ n-GonzĂĄlez, A.; GutiĂŠrrez, J.C. Functional gfp-metallothionein fusion protein from tetrahymena thermophila: A potential whole-cell biosensor for monitoring heavy metal pollution and a cell model to study metallothionein overproduction effects. BioMetals 2014, 27, 195–205. [Google Scholar] [CrossRef] [PubMed]
- Courbet, A.; Endy, D.; Renard, E.; Molina, F.; Bonnet, J. Detection of pathological biomarkers in human clinical samples via amplifying genetic switches and logic gates. Sci. Transl. Med. 2015, 7, 283–289. [Google Scholar] [CrossRef]
- Goers, L.; Ainsworth, C.; Goey, C.H.; Kontoravdi, C.; Freemont, P.S.; Polizzi, K.M. Whole-cell escherichia coli lactate biosensor for monitoring mammalian cell cultures during biopharmaceutical production. Biotechnol. Bioeng. 2017, 114, 1290–1300. [Google Scholar] [CrossRef] [Green Version]
- Wang, N.; Wang, H.; Zhang, J.; Ji, X.; Su, H.; Liu, J.; Wang, J.; Zhao, W. Diketopyrrolopyrrole-based sensor for over-expressed peroxynitrite in drug-induced hepatotoxicity via ratiometric fluorescence imaging. Sens. Actuators B Chem. 2022, 352, 130992. [Google Scholar] [CrossRef]
- Lu, W.; Huang, B.; He, Y.; Yang, J.; Li, Y. A facile cell-involved microfluidic platform for assessing risk of hepatotoxic chemicals via on-line monitoring of multi-indexes. Sens. Actuators B Chem. 2021, 341, 129938. [Google Scholar] [CrossRef]
- Zhang, X.; Hatamie, A.; Ewing, A.G. Nanoelectrochemical analysis inside a single living cell. Curr. Opin. Electrochem. 2020, 22, 94–101. [Google Scholar] [CrossRef]
- Zhou, W.; Graham, K.; Lucendo-Villarin, B.; Flint, O.; Hay, D.C.; Bagnaninchi, P. Combining stem cell-derived hepatocytes with impedance sensing to better predict human drug toxicity. Expert Opin. Investig. Drugs 2019, 15, 77–83. [Google Scholar] [CrossRef]
- Gupta, N.; Renugopalakrishnan, V.; Liepmann, D.; Paulmurugan, R.; Malhotra, B.D. Cell-based biosensors: Recent trends, challenges and future perspectives. Biosens. Bioelectron. 2019, 141, 111435. [Google Scholar] [CrossRef]
- Javitt, N.B. Hep g2 cells as a resource for metabolic studies: Lipoprotein, cholesterol, and bile acids. FASEB J. 1990, 4, 161–168. [Google Scholar] [CrossRef] [PubMed]
- Westerink, W.M.A.; Schoonen, W.G.E.J. Cytochrome p450 enzyme levels in hepg2 cells and cryopreserved primary human hepatocytes and their induction in hepg2 cells. Toxicol. In Vitro 2007, 21, 1581–1591. [Google Scholar] [CrossRef] [PubMed]
- Guo, L.; Dial, S.; Shi, L.; Branham, W.; Liu, J.; Fang, J.-L.; Green, B.; Deng, H.; Kaput, J.; Ning, B. Similarities and differences in the expression of drug-metabolizing enzymes between human hepatic cell lines and primary human hepatocytes. Drug Metab. Dispos. 2011, 39, 528–538. [Google Scholar] [CrossRef] [PubMed] [Green Version]
- Zanchetta, G.; Lanfranco, R.; Giavazzi, F.; Bellini, T.; Buscaglia, M. Emerging applications of label-free optical biosensors. J. Nanophotonics 2017, 6, 627–645. [Google Scholar] [CrossRef]
- Chen, N.H.; Tomita, U.; Kasagi, N.; Nagamune, T.; Suzuki, Y. Label-free adhesion-based cell sorter using optimized oblique grooves for early cancer detection. In Proceedings of the 2011 IEEE 24th International Conference on Micro Electro Mechanical Systems, Cancun, Mexico, 23–27 January 2011; pp. 904–907. [Google Scholar]
- Fang, Y. Label-free biosensors for cell biology. Int. J. Electrochem. 2011, 2011, 460850. [Google Scholar] [CrossRef] [Green Version]
- Yáñez-Sedeño, P.; Agüí, L.; Campuzano, S.; Pingarrón, J.M. What electrochemical biosensors can do for forensic science? Unique features and applications. Biosensors 2019, 9, 127. [Google Scholar] [CrossRef] [Green Version]
- Zhang, J.; Lu, L.; Zhang, Z.; Zang, L. Electrochemical cell-based sensor for detection of food hazards. Micromachines 2021, 12, 837. [Google Scholar] [CrossRef]
- Reshetilov, A.; Arlyapov, V.; Alferov, V.; Reshetilova, T. Bod biosensors: Application of novel technologies and prospects for the development. In State of the Art in Biosensors—Environmental and Medical Applications; Rinken, T., Ed.; Intech: Rijeka, Croatia, 2013; pp. 57–77. [Google Scholar]
- Săndulescu, R.; Tertiş, M.; Cristea, C.; Bodoki, E. New materials for the construction of electrochemical biosensors. In Biosensors-Micro and Nanoscale Applications; Rinken, T., Ed.; Intech: Rijeka, Croatia, 2015; pp. 1–36. [Google Scholar]
- Brett, C. Electrochemical impedance spectroscopy for characterization of electrochemical sensors and biosensors. ECS Trans. 2019, 13, 67–80. [Google Scholar] [CrossRef]
- Jaffrezic-Renault, N. Impedimetric measurements and the biomatrix. In Encyclopedia of Interfacial Chemistry; Wandelt, K., Ed.; Elsevier: Oxford, UK, 2018; pp. 241–247. [Google Scholar]
- Trentin, A.; Harb, S.V.; Uvida, M.C.; Marcoen, K.; Pulcinelli, S.H.; Santilli, C.V.; Terryn, H.; Hauffman, T.; Hammer, P. Effect of ce(iii) and ce(iv) ions on the structure and active protection of pmma-silica coatings on aa7075 alloy. Corros Sci. 2021, 189, 109581. [Google Scholar] [CrossRef]
- Meddings, N.; Heinrich, M.; Overney, F.; Lee, J.-S.; Ruiz, V.; Napolitano, E.; Seitz, S.; Hinds, G.; Raccichini, R.; Gaberscek, M.; et al. Application of electrochemical impedance spectroscopy to commercial li-ion cells: A review. J. Power Sources 2020, 480, 228742. [Google Scholar] [CrossRef]
- Kivirand, K.; Min, M.; Rinken, T. Challenges and applications of impedance-based biosensors in water analysis. In Biosensors for Environmental Monitoring; Rinken, T., Kivirand, K., Eds.; Intech: Rijeka, Croatia, 2019; pp. 2–4. [Google Scholar]
- Xia, S.; Zhu, P.; Pi, F.; Zhang, Y.; Li, Y.; Wang, J.; Sun, X. Development of a simple and convenient cell-based electrochemical biosensor for evaluating the individual and combined toxicity of don, zen, and afb1. Biosens. Bioelectron. 2017, 97, 345–351. [Google Scholar] [CrossRef] [PubMed]
- Repetto, G.; del Peso, A.; Zurita, J.L. Neutral red uptake assay for the estimation of cell viability/cytotoxicity. Nat. Protoc. 2008, 3, 1125–1131. [Google Scholar] [CrossRef]
- Rodger, A.; Sanders, K. Uv-visible absorption spectroscopy, biomacromolecular applications. In Encyclopedia of Spectroscopy and Spectrometry, 3rd ed.; Lindon, J.C., Tranter, G.E., Koppenaal, D.W., Eds.; Academic Press: Oxford, UK, 2017; pp. 495–502. [Google Scholar]
- O’Brien, J.; Wilson, I.; Orton, T.; Pognan, F. Investigation of the alamar blue (resazurin) fluorescent dye for the assessment of mammalian cell cytotoxicity. Eur. J. Biochem. 2000, 267, 5421–5426. [Google Scholar] [CrossRef] [PubMed]
- Rost, F. Fluorescence microscopy, applications. In Encyclopedia of Spectroscopy and Spectrometry; Elsevier: Amsterdam, The Netherlands, 2017; pp. 627–631. [Google Scholar]
- Stolwijk, J.A.; Wegener, J. Impedance-based assays along the life span of adherent mammalian cells in vitro: From initial adhesion to cell death. In Label-Free Monitoring of Cells In Vitro; Wegener, J., Ed.; Springer International Publishing: Cham, Switzerland, 2019; pp. 1–75. [Google Scholar]
- Steinbrecht, S.; Pfeifer, N.; Herzog, N.; Katzenberger, N.; Schulz, C.; Kammerer, S.; Küpper, J.-H. Hepg2-1a2 c2 and c7: Lentivirus vector-mediated stable and functional overexpression of cytochrome p450 1a2 in human hepatoblastoma cells. Toxicol. Lett. 2020, 319, 155–159. [Google Scholar] [CrossRef] [PubMed]
- Lukic, S.; Wegener, J. Impedimetric monitoring of cell-based assays. eLS 2015. [Google Scholar] [CrossRef]
- Asphahani, F.; Thein, M.; Wang, K.; Wood, D.; Wong, S.S.; Xu, J.; Zhang, M. Real-time characterization of cytotoxicity using single-cell impedance monitoring. Analyst 2012, 137, 3011–3019. [Google Scholar] [CrossRef] [PubMed]
- Lee, R.M.; Choi, H.; Shin, J.-S.; Kim, K.; Yoo, K.-H. Distinguishing between apoptosis and necrosis using a capacitance sensor. Biosens. Bioelectron. 2009, 24, 2586–2591. [Google Scholar] [CrossRef] [PubMed]
- Nguyen, B.T.T.; Peh, A.E.K.; Chee, C.Y.L.; Fink, K.; Chow, V.T.K.; Ng, M.M.L.; Toh, C.-S. Electrochemical impedance spectroscopy characterization of nanoporous alumina dengue virus biosensor. Bioelectrochemistry 2012, 88, 15–21. [Google Scholar] [CrossRef]
- Chen, X.; Wang, Y.; Zhou, J.; Yan, W.; Li, X.; Zhu, J.-J. Electrochemical impedance immunosensor based on three-dimensionally ordered macroporous gold film. Anal. Chem. 2008, 80, 2133–2140. [Google Scholar] [CrossRef]
- Maalouf, R.; Fournier-Wirth, C.; Coste, J.; Chebib, H.; Saïkali, Y.; Vittori, O.; Errachid, A.; Cloarec, J.-P.; Martelet, C.; Jaffrezic-Renault, N. Label-free detection of bacteria by electrochemical impedance spectroscopy: Comparison to surface plasmon resonance. Anal. Chem. 2007, 79, 4879–4886. [Google Scholar] [CrossRef]
- Bouafsoun, A.; Othmane, A.; Jaffrézic-Renault, N.; Kerkeni, A.; Thoumire, O.; Prigent, A.F.; Ponsonnet, L. Impedance endothelial cell biosensor for lipopolysaccharide detection. Mater. Sci. Eng. C 2008, 28, 653–661. [Google Scholar] [CrossRef]
- Daza, P.; Olmo, A.; Cañete, D.; Yúfera, A. Monitoring living cell assays with bio-impedance sensors. Sens. Actuators B Chem. 2013, 176, 605–610. [Google Scholar] [CrossRef]


Publisher’s Note: MDPI stays neutral with regard to jurisdictional claims in published maps and institutional affiliations. |
© 2022 by the authors. Licensee MDPI, Basel, Switzerland. This article is an open access article distributed under the terms and conditions of the Creative Commons Attribution (CC BY) license (https://creativecommons.org/licenses/by/4.0/).
Share and Cite
Rozman, M.; Štukovnik, Z.; Sušnik, A.; Pakseresht, A.; Hočevar, M.; Drobne, D.; Bren, U. A HepG2 Cell-Based Biosensor That Uses Stainless Steel Electrodes for Hepatotoxin Detection. Biosensors 2022, 12, 160. https://0-doi-org.brum.beds.ac.uk/10.3390/bios12030160
Rozman M, Štukovnik Z, Sušnik A, Pakseresht A, Hočevar M, Drobne D, Bren U. A HepG2 Cell-Based Biosensor That Uses Stainless Steel Electrodes for Hepatotoxin Detection. Biosensors. 2022; 12(3):160. https://0-doi-org.brum.beds.ac.uk/10.3390/bios12030160
Chicago/Turabian StyleRozman, Martin, Zala Štukovnik, Ajda Sušnik, Amirhossein Pakseresht, Matej Hočevar, Damjana Drobne, and Urban Bren. 2022. "A HepG2 Cell-Based Biosensor That Uses Stainless Steel Electrodes for Hepatotoxin Detection" Biosensors 12, no. 3: 160. https://0-doi-org.brum.beds.ac.uk/10.3390/bios12030160