Trends in Antimicrobial Resistance Patterns in Neisseria Gonorrhoeae in Australia and New Zealand: A Meta-analysis and Systematic Review

 , and
, and
Abstract
: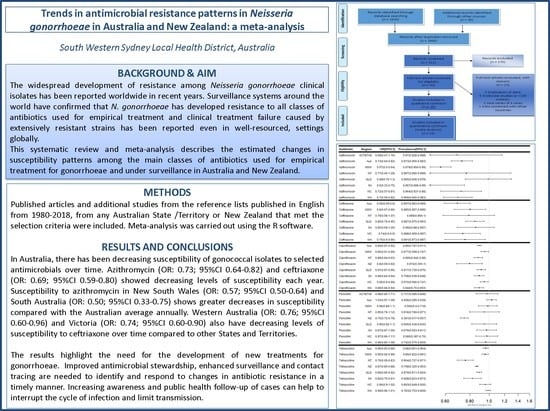
1. Introduction
1.1. Antimicrobial Resistance(AMR) and the Environment
1.2. Surveillance for Antimicrobial Resistance in Neisseria Gonorrhoeae
1.3. The World Health Organization Global Gonococcal Antimicrobial Surveillance Programme (WHO GASP)
1.4. Australian Gonococcal Surveillance Programme (AGSP)
2. Results
2.1. Study Characteristics
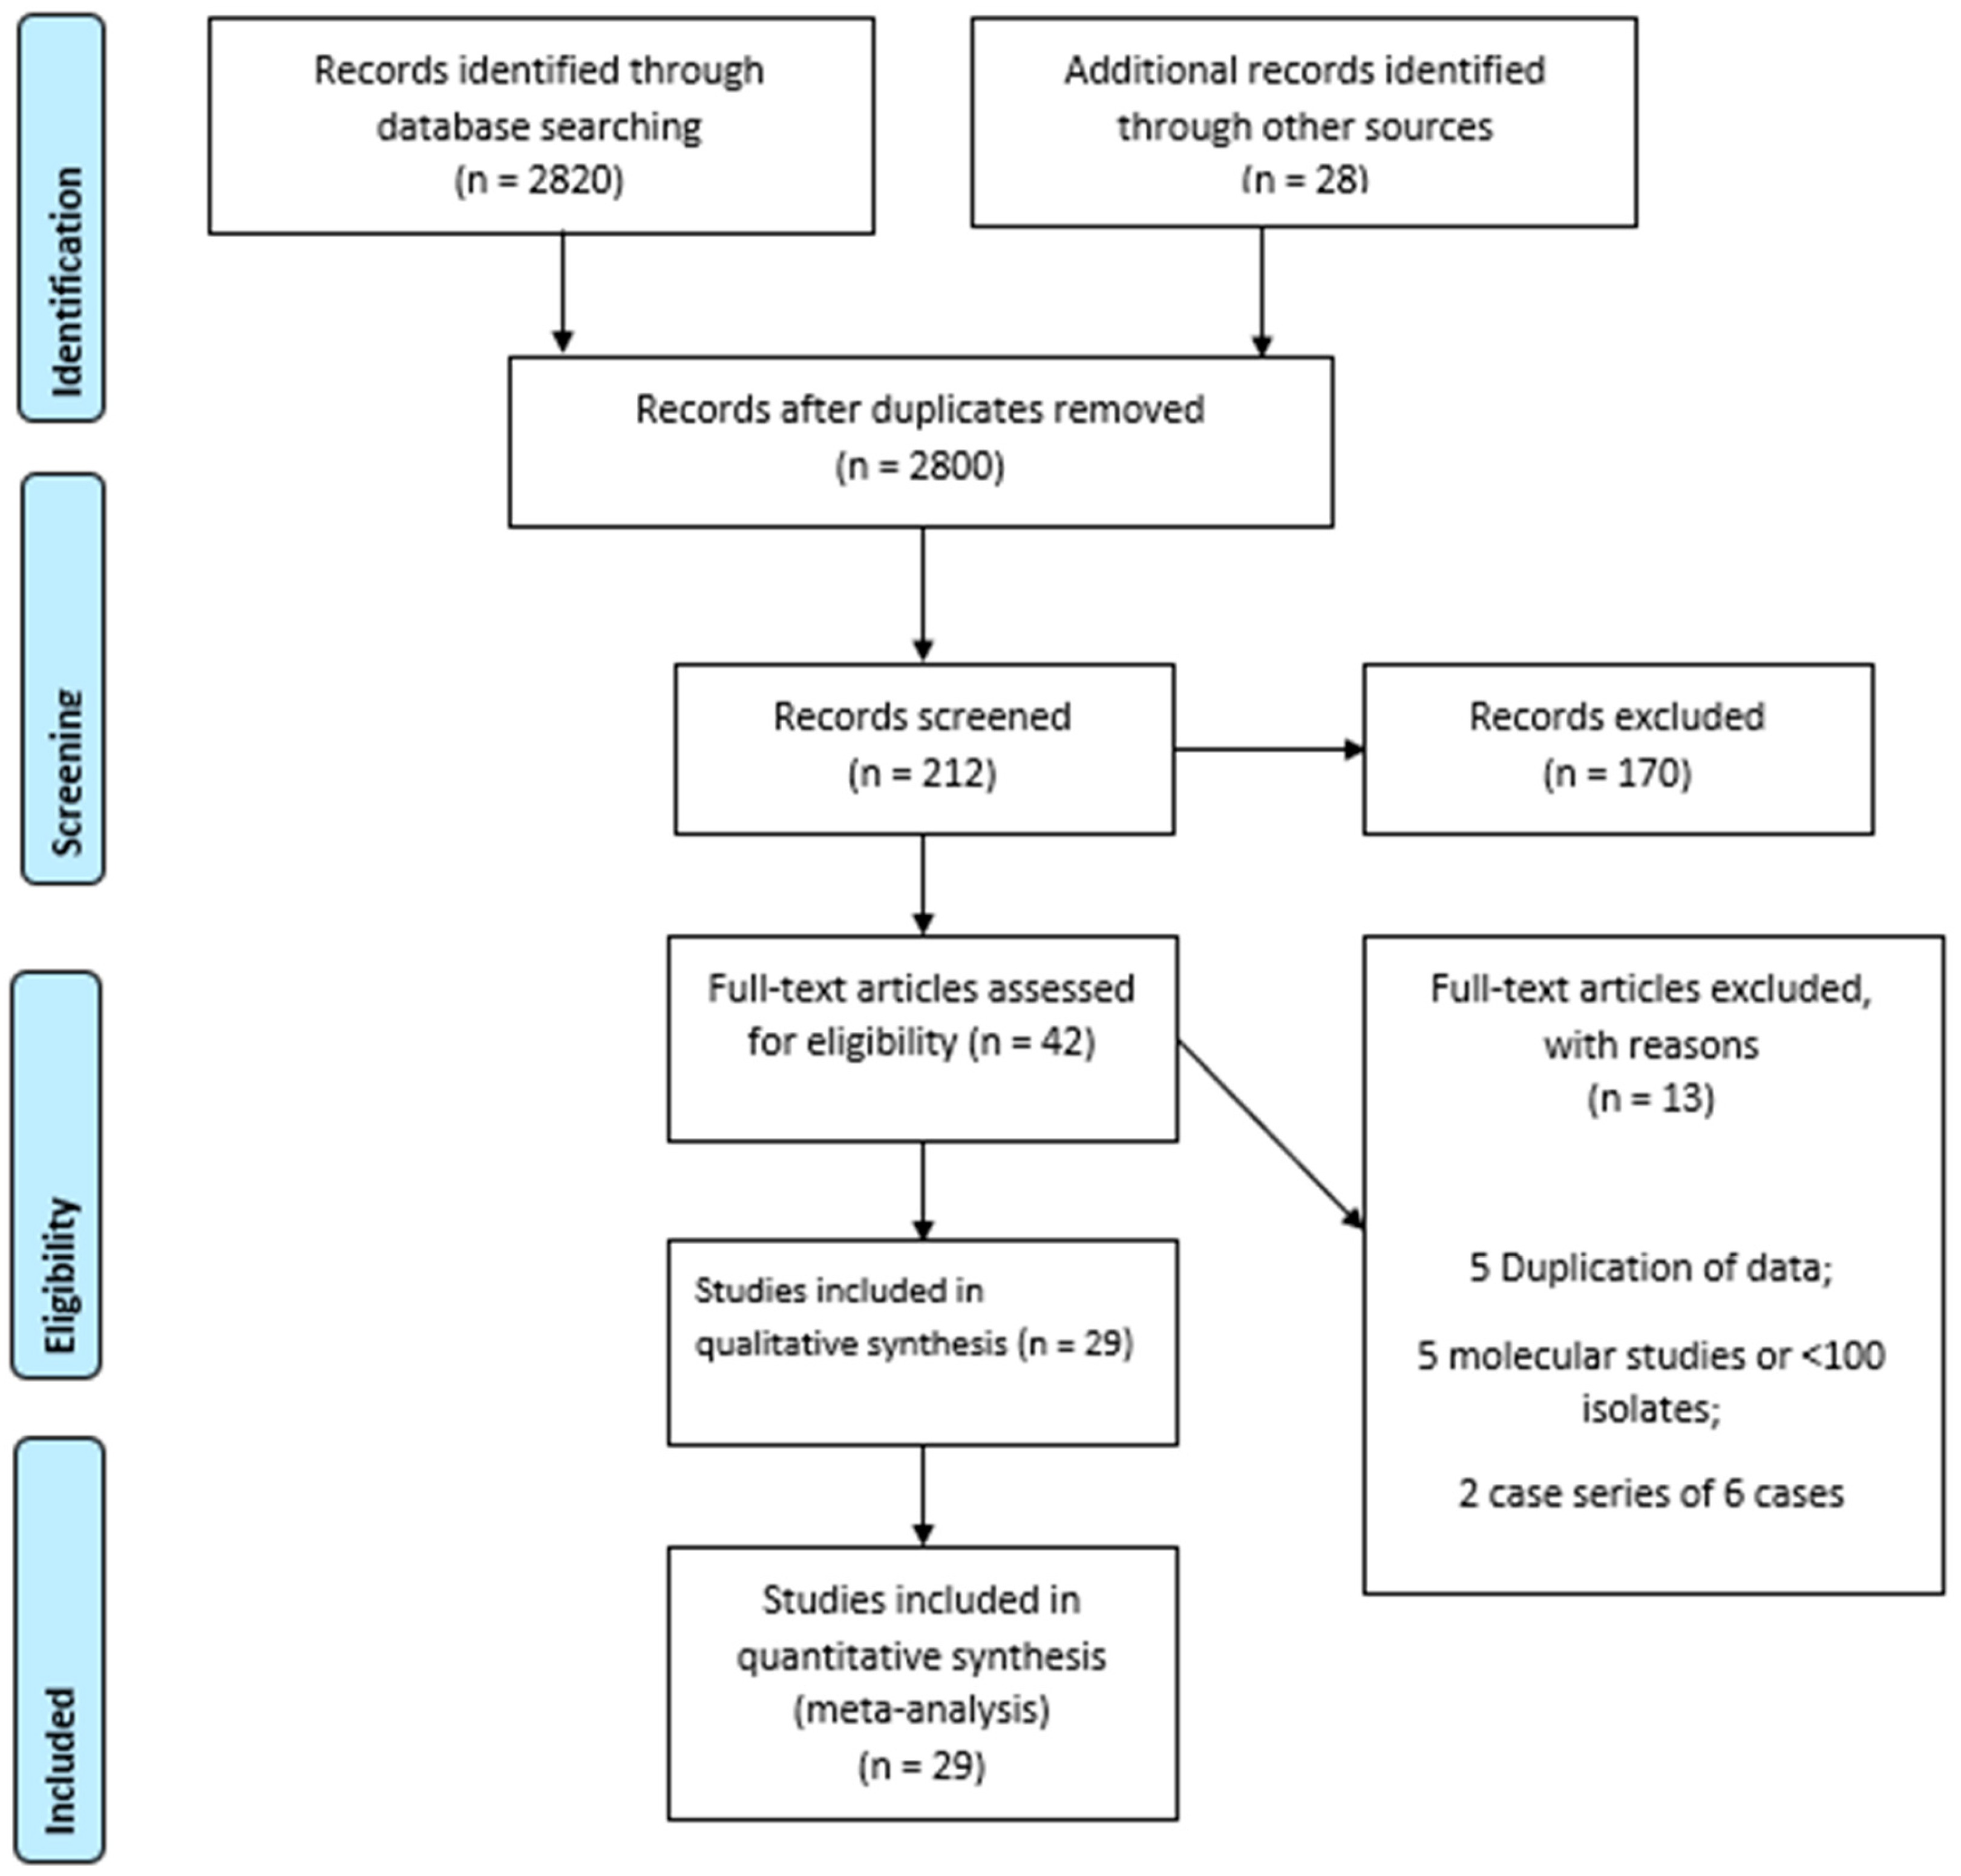
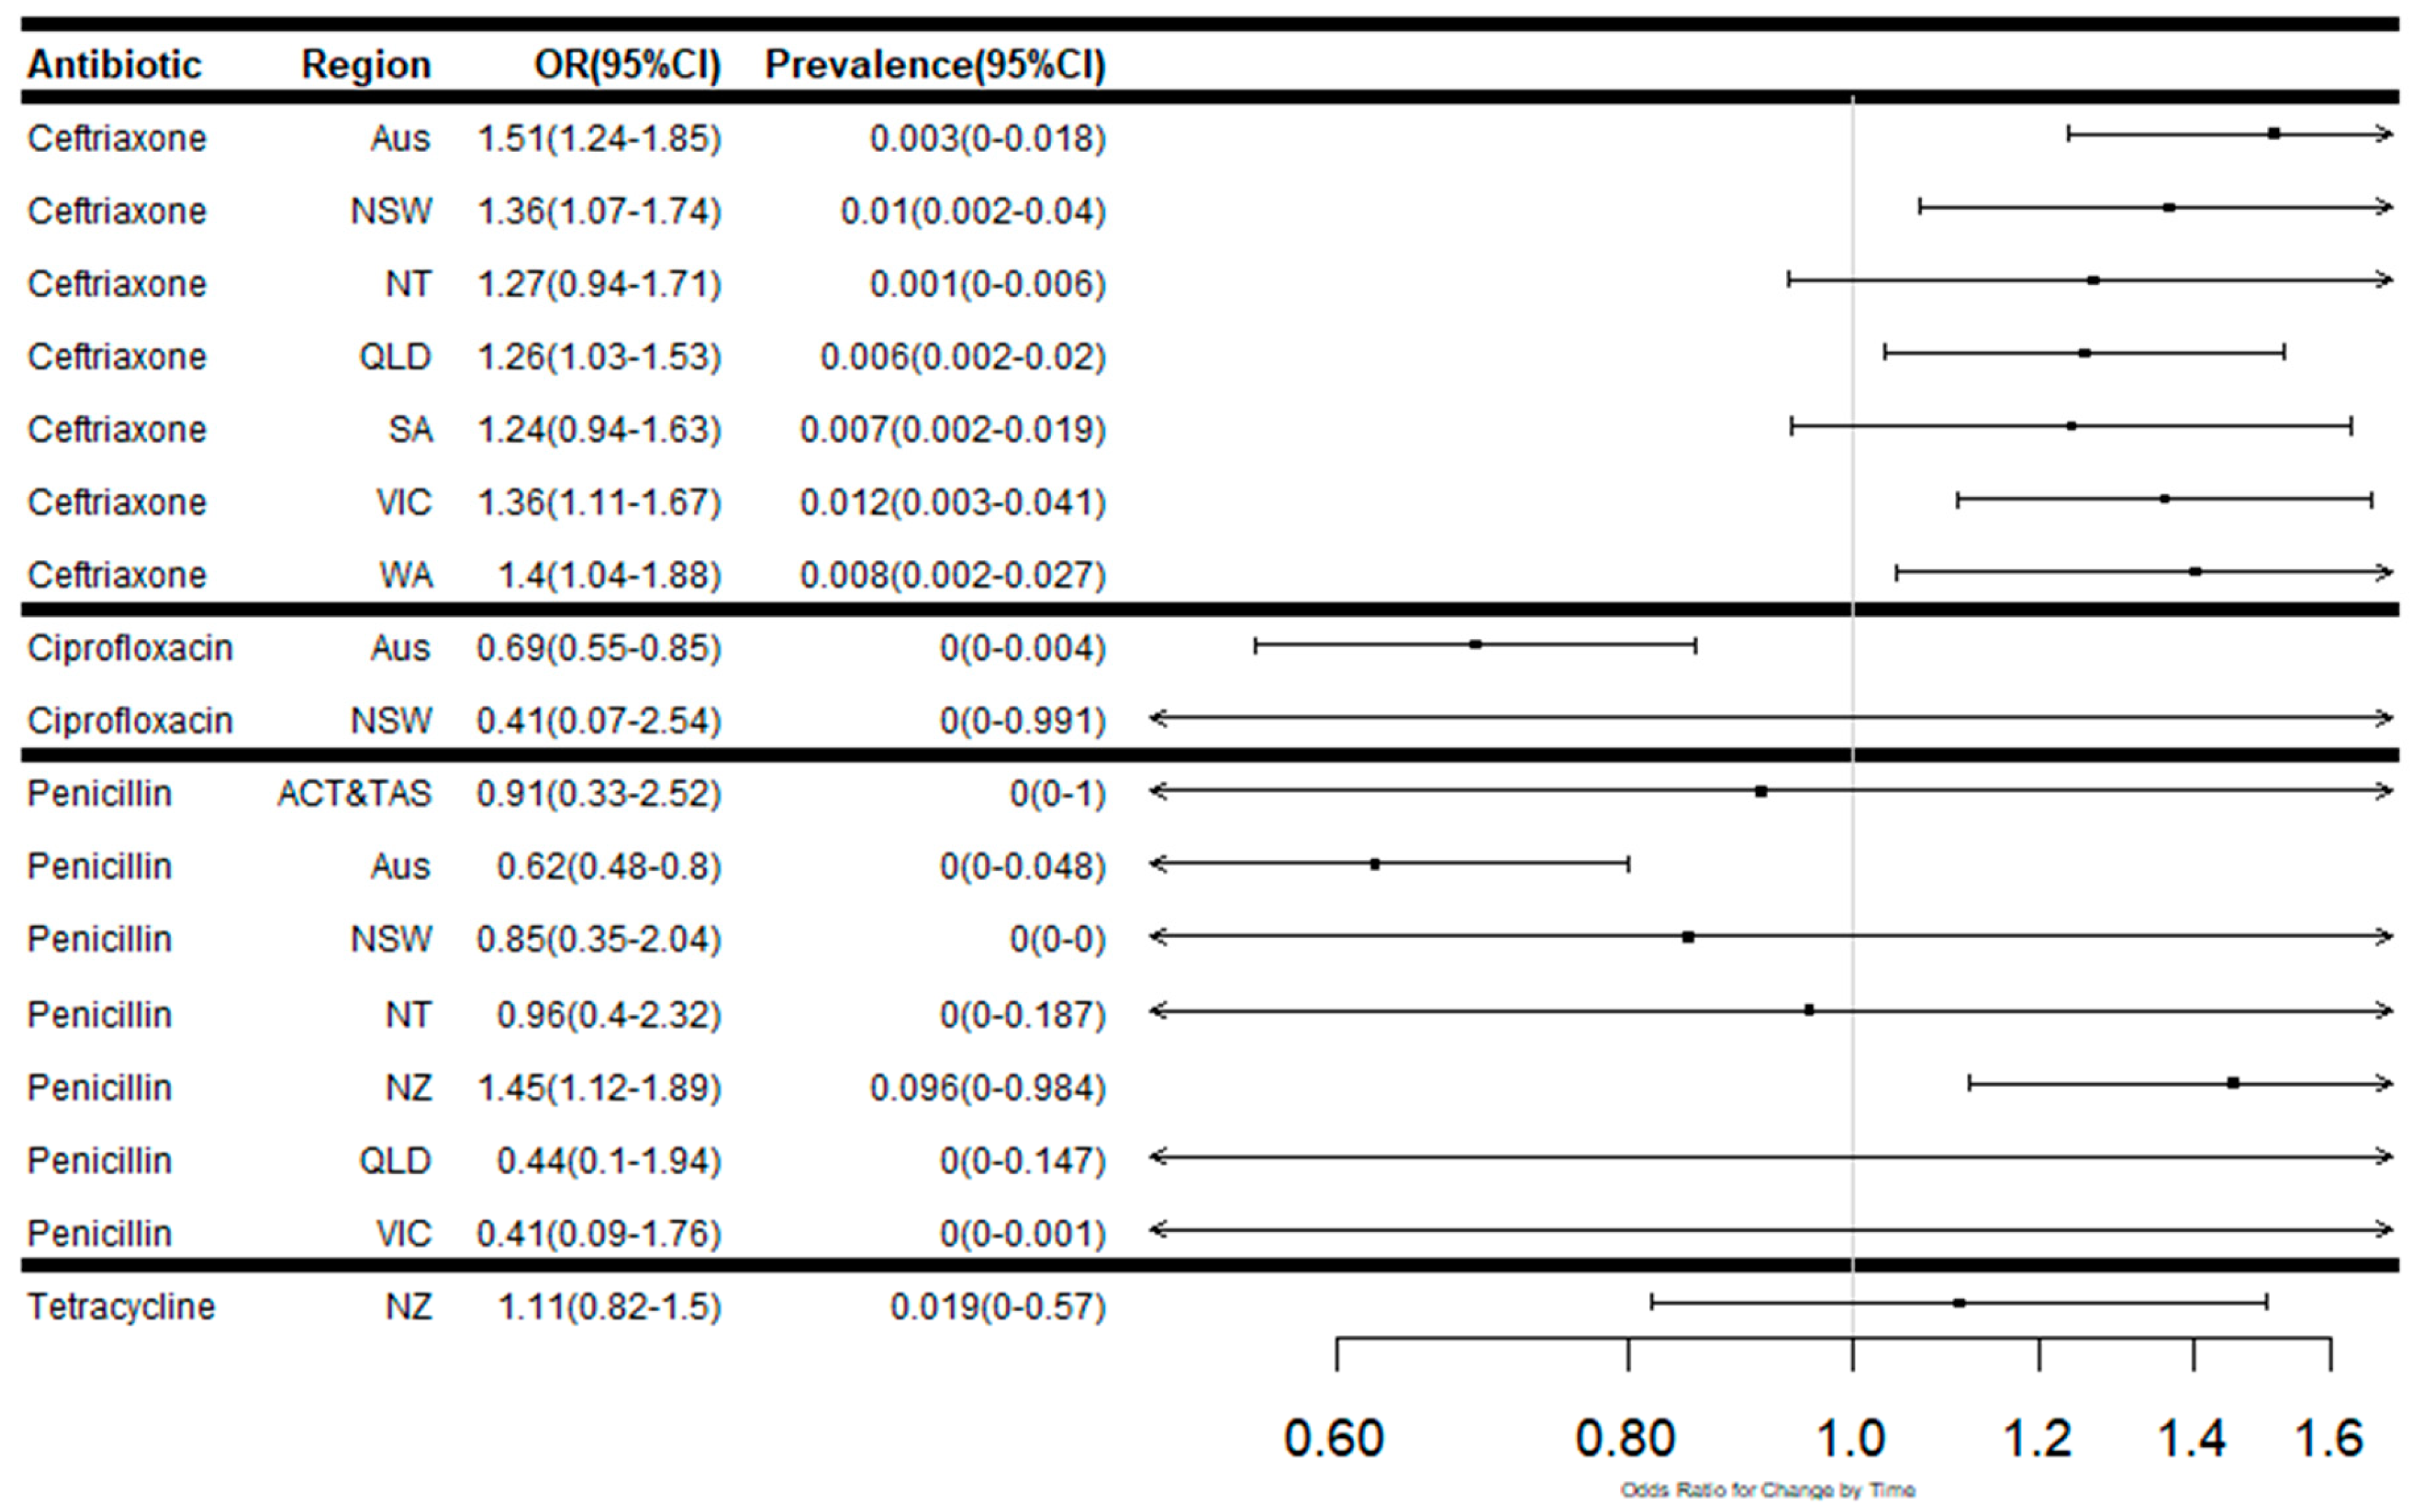
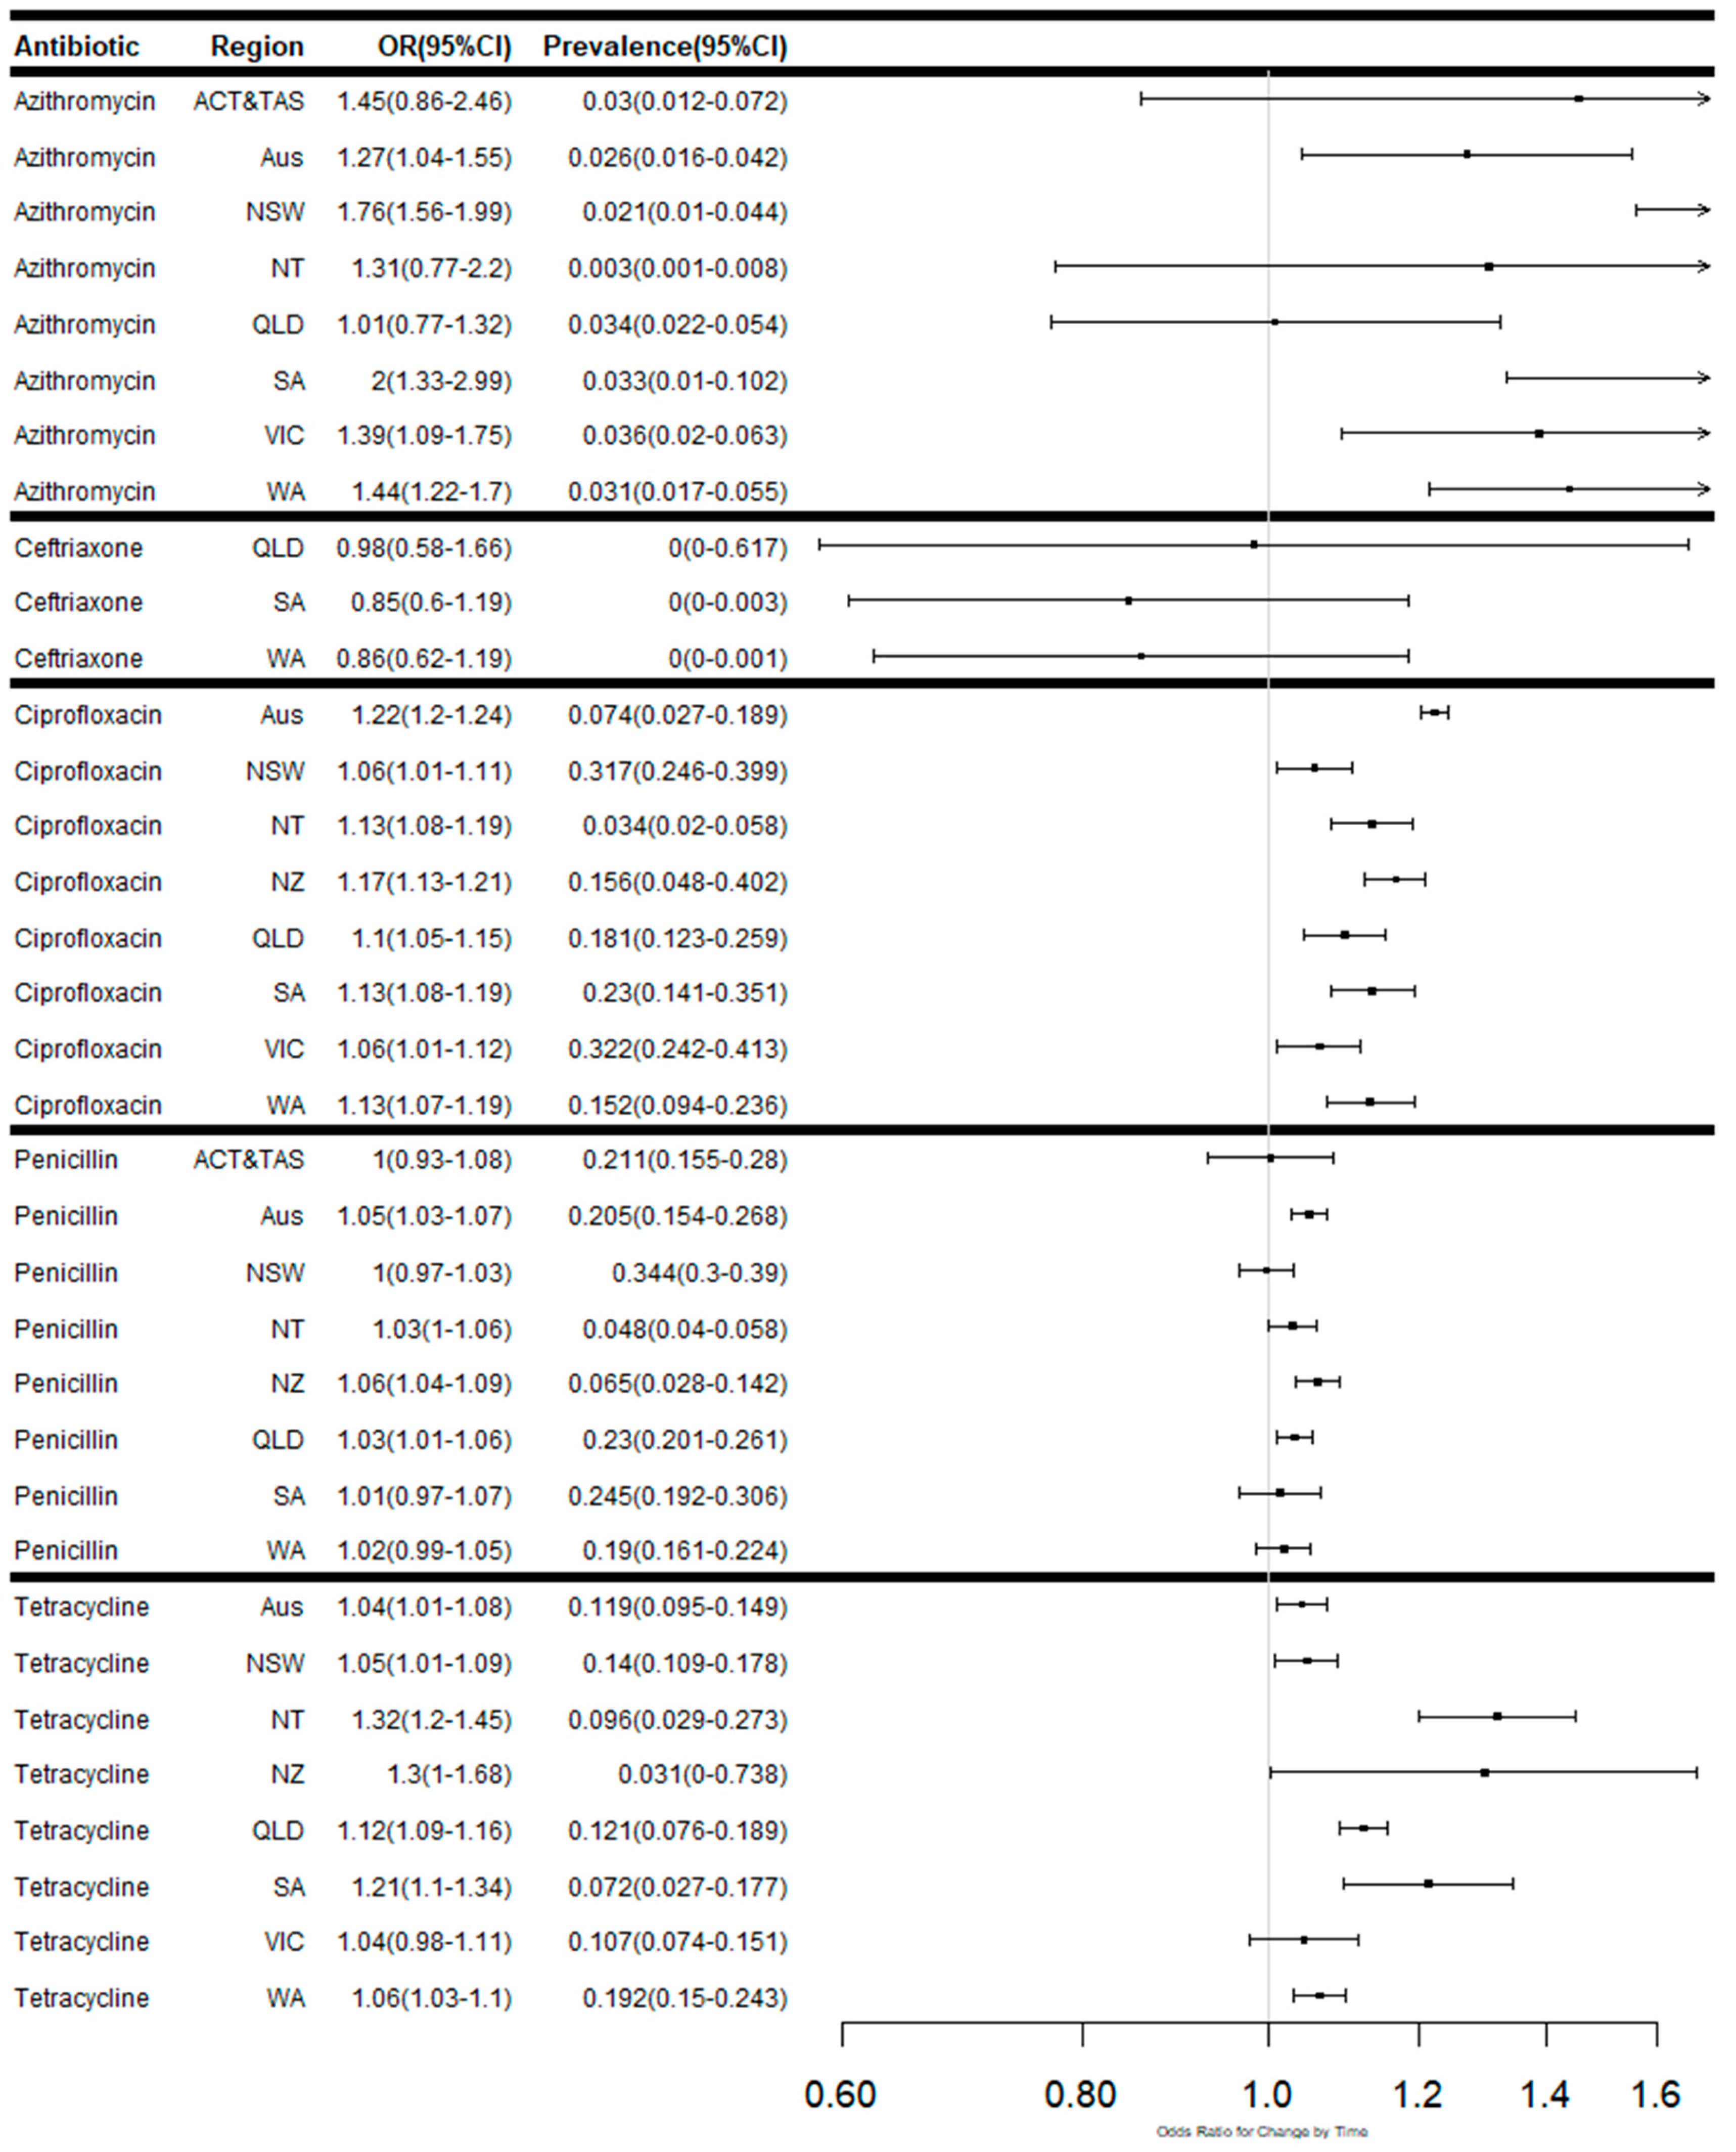
2.2. N. gonorrhoeae Resistance to Antimicrobials
2.2.1. Susceptibility to Penicillin
2.2.2. Susceptibility to Ceftriaxone
2.2.3. Susceptibility to Ciprofloxacin
2.2.4. Susceptibility to Tetracycline
2.2.5. Susceptibility to Azithromycin
2.2.6. Susceptibility to spectinomycin
3. Discussion
4. Materials and Methods
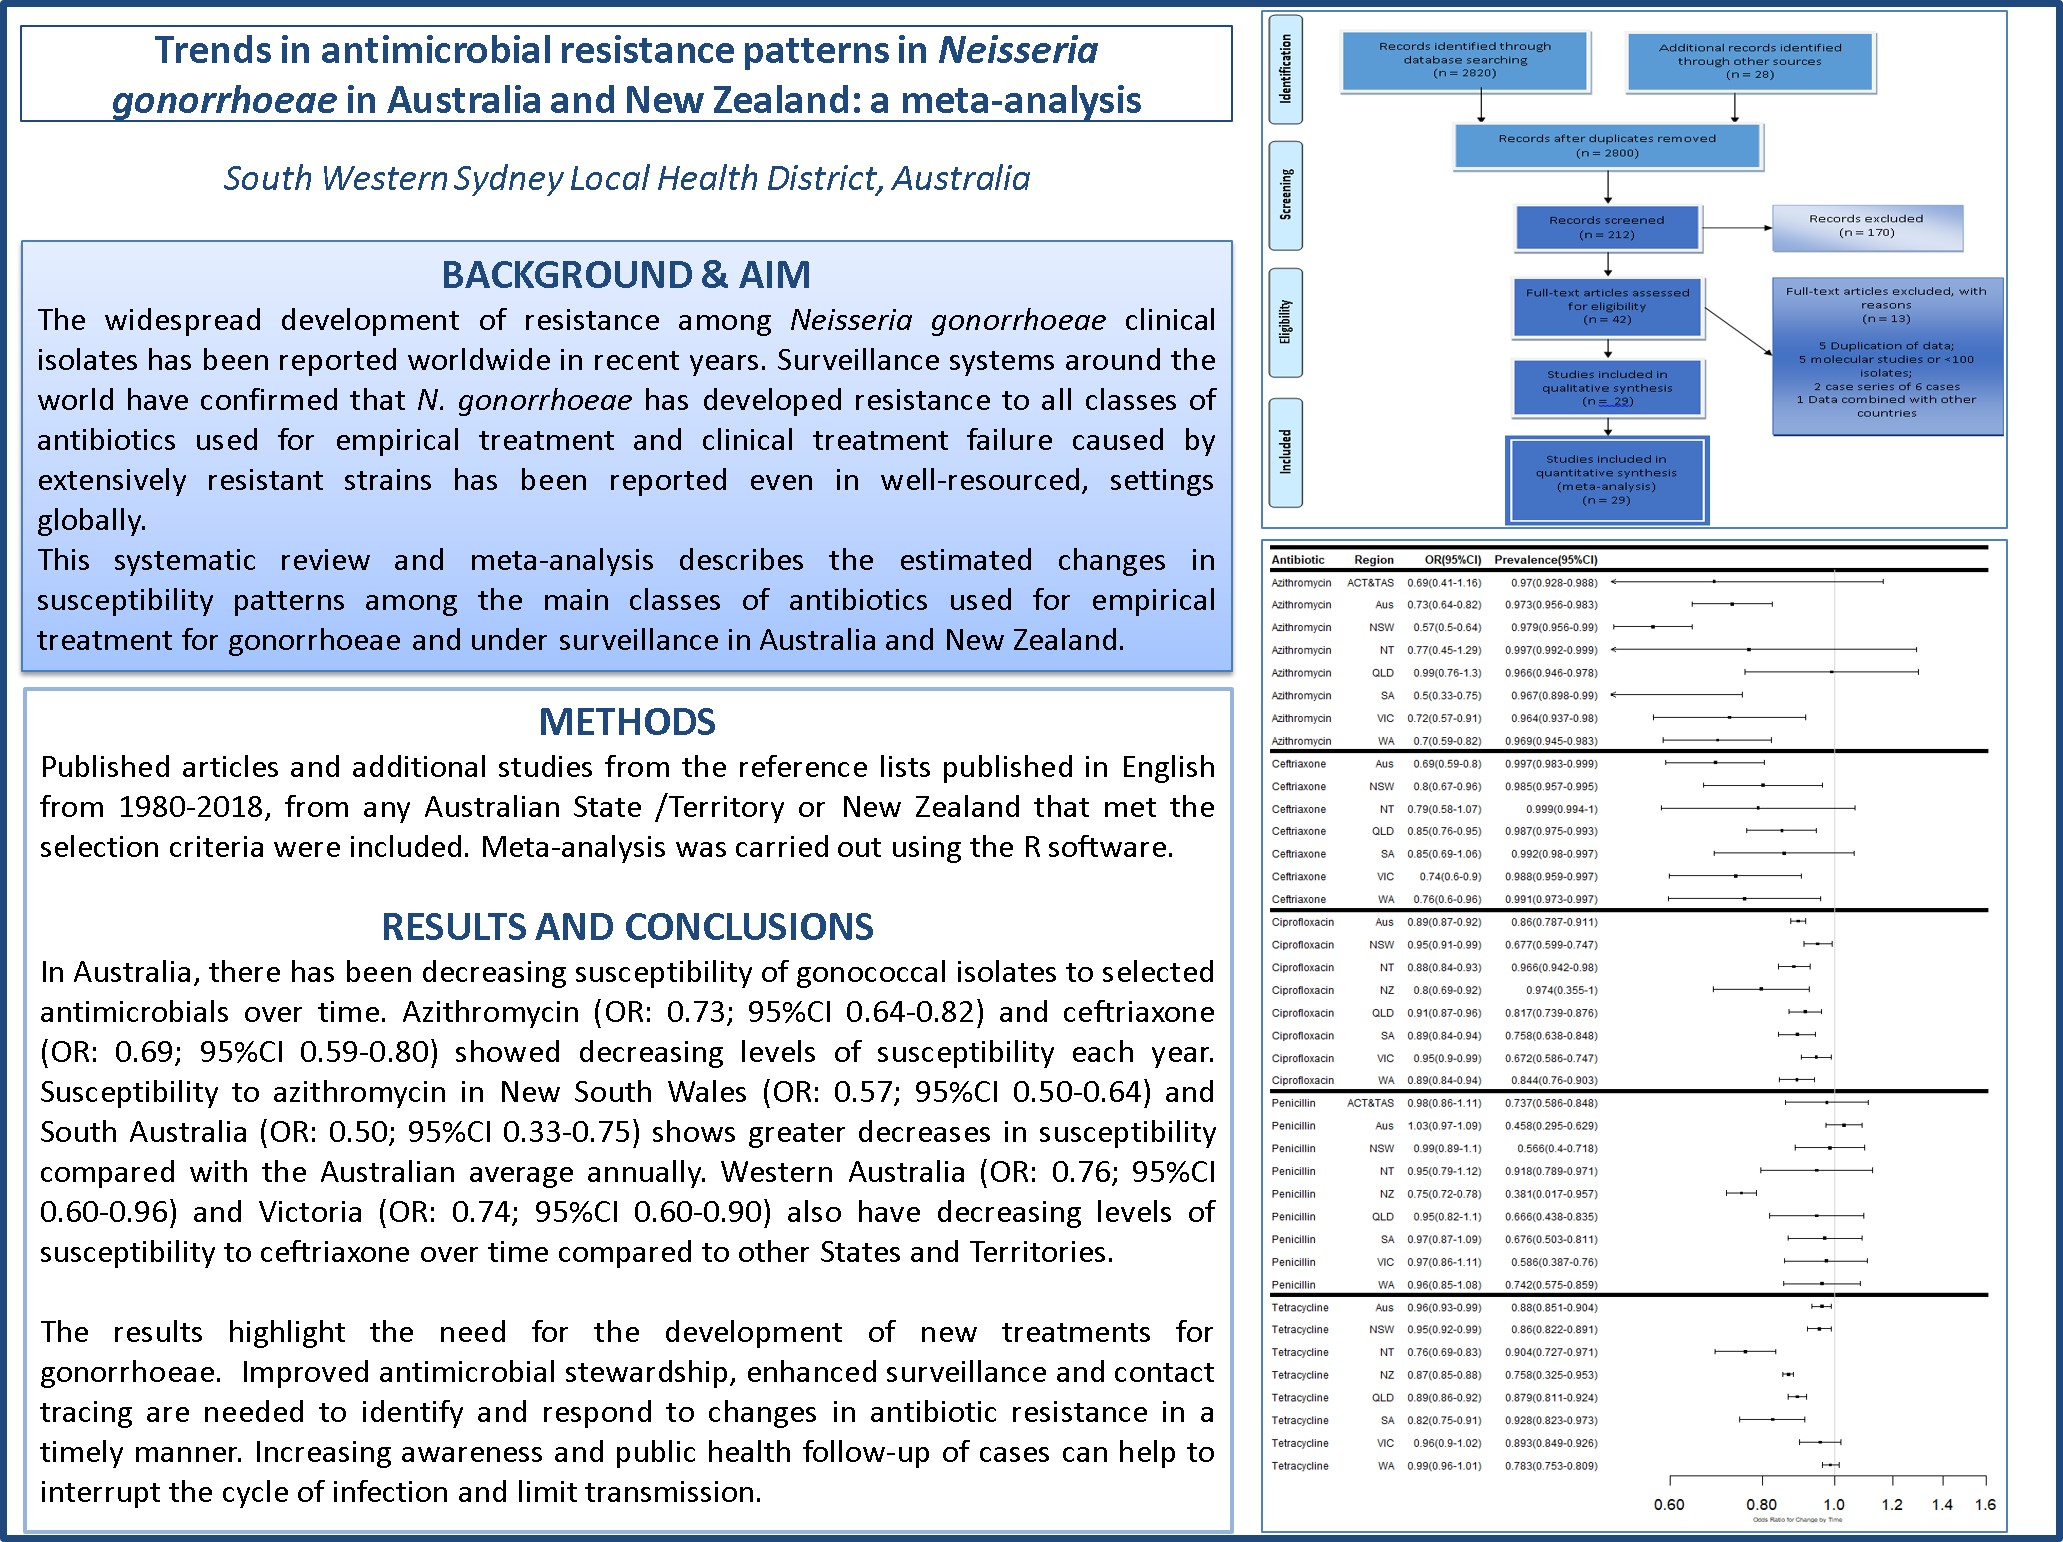
4.1. Literature Search
4.1.1. Inclusion Criteria
- A study or report published in English from January 1980 to February 2019 presenting results for 1981–2017;
- Included data from Australia or any state or territory in Australia or New Zealand;
- Described the method for determining the antimicrobial susceptibility of isolates or the MIC values for susceptibility, reduced susceptibility and resistant isolates (following the criteria by WHO Western Pacific Region (WPR) Resistance Surveillance Programme guidelines [79] or Clinical and Laboratory Standards Institute (CLSI) standards);
- Specified the total number of tested N. gonorrhoeae isolates;
- Reported the antimicrobial susceptibility rate or proportion in N. gonorrhoeae isolates or implied it by indicating their minimum inhibitory concentrations (MICs) value or the number or proportion of non-susceptible NG isolates;
- Tested 100 or more N. gonorrhoeae isolates, and
- Isolated N. gonorrhoeae strains from human clinical samples.
4.1.2. Exclusion Criteria
4.2. Quality Assessment
- Whether the study specified the location where N. gonorrhoeae isolates were collected;
- Whether the study specified the collection period of the isolates;
- Whether the study described the method of identifying N. gonorrhoeae isolates;
- Whether the study described the population from which N. gonorrhoeae isolates were obtained;
- Whether the study included at least 100 tested N. gonorrhoeae isolates;
- Whether the study utilised control strains recommended by WHO in determining MICs or implied it;
- Whether the study described the method for determining the antimicrobial susceptibility of isolates or the MICs values for susceptibility, reduced susceptibility and resistant isolates.
4.3. Data Extraction
4.4. Data Analysis
5. Conclusions
Supplementary Materials
Author Contributions
Funding
Acknowledgments
Conflicts of Interest
References
- Bala, M.; Kakran, M.; Singh, V.; Sood, S.; Ramesh, V. Monitoring antimicrobial resistance in Neisseria gonorrhoeae in selected countries of the WHO South-East Asia Region between 2009 and 2012: A retrospective analysis. Sex. Transm. Infect. 2013, 89, iv28–iv35. [Google Scholar] [CrossRef] [PubMed]
- Kirkcaldy, R.D.; Kidd, S.; Weinstock, H.S.; Papp, J.R.; Bolan, G.A. Trends in antimicrobial resistance in Neisseria gonorrhoeae in the USA: The Gonococcal Isolate Surveillance Project (GISP), January 2006–June 2012. Sex. Transm. Infect. 2013, 89, iv5–iv10. [Google Scholar] [CrossRef] [PubMed]
- Lahra, M.M.; Limnios, A.E.; Whiley, D.M.; Goire, N.; Donovan, B.; Nissen, M.D.; Sloots, T.P. The ticking time bomb: Escalating antibiotic resistance in Neisseria gonorrhoeae is a public health disaster in waiting. J. Antimicrob. Chemother. 2012, 67, 2059–2061. [Google Scholar]
- Wi, T.; Lahra, M.M.; Ndowa, F.; Bala, M.; Dillon, J.-A.R.; Ramon-Pardo, P.; Eremin, S.R.; Bolan, G.; Unemo, M. Antimicrobial resistance in Neisseria gonorrhoeae: Global surveillance and a call for international collaborative action. PLoS Med. 2017, 14, 1002344. [Google Scholar] [CrossRef] [PubMed]
- Centers for Disease Control and Prevention. Update to CDC’s sexually transmitted diseases treatment guidelines, 2006: Fluoroquinolones no longer recommended for treatment of gonococcal infections. Mmwr Morb. Mortal. Wkly. Rep. 2007, 56, 332. [Google Scholar]
- World Health Organization. WHO Guidelines for the Treatment of Neisseria Gonorrhoeae; World Health Organization: Geneva, Switzerland, 2016. [Google Scholar]
- Fifer, H.; Natarajan, U.; Jones, L.; Alexander, S.; Hughes, G.; Golparian, D.; Unemo, M. Failure of Dual Antimicrobial Therapy in Treatment of Gonorrhea. N. Engl. J. Med. 2016, 374, 2504–2506. [Google Scholar] [CrossRef]
- Abraha, M.; Egli-Gany, D.; Low, N. Epidemiological, behavioural, and clinical factors associated with antimicrobial-resistant gonorrhoea: A review. F1000Research 2018, 7, 400. [Google Scholar] [CrossRef]
- World Health Organization. Antimicrobial Resistance Global Report on Surveillance; World Health Organization: Geneva, Switzerland, 2014. [Google Scholar]
- Levy, S.B. Microbial resistance to antibiotics. An evolving and persistent problem. Lancet 1982, 2, 83–88. [Google Scholar] [CrossRef]
- Barber, M.; Rozwadowska-Dowzenko, M. Infection by penicillin-resistant staphylococci. Lancet 1948, 252, 641–644. [Google Scholar] [CrossRef]
- Crofton, J.; Mitchison, D.A. Streptomycin Resistance in Pulmonary Tuberculosis. BMJ 1948, 2, 1009–1015. [Google Scholar] [CrossRef] [Green Version]
- Watanabe, T. Infective heredity of multiple drug resistance in bacteria. Bacteriol. Rev. 1963, 27, 87–115. [Google Scholar] [PubMed]
- Leaves, N.I.; Dimopoulou, I.; Hayes, I.; Kerridge, S.; Falla, T.; Secka, O.; Adegbola, R.A.; Slack, M.P.E.; Peto, T.E.A.; Crook, D.W.M. Epidemiological studies of large resistance plasmids in Haemophilus. J. Antimicrob. Chemother. 2000, 45, 599–604. [Google Scholar] [CrossRef] [PubMed] [Green Version]
- Levy, S.B.; Buu-Hoi, A.; Marshall, B. Transposon Tn10-like tetracycline resistance determinants in Haemophilus parainfluenzae. J. Bacteriol. 1984, 160, 87–94. [Google Scholar] [PubMed]
- Chopra, I.; Roberts, M. Tetracycline Antibiotics: Mode of Action, Applications, Molecular Biology, and Epidemiology of Bacterial Resistance. Microbiol. Mol. Boil. Rev. 2001, 65, 232–260. [Google Scholar] [CrossRef] [Green Version]
- Elwell, L.P.; Roberts, M.; Mayer, L.W.; Falkow, S. Plasmid-Mediated Beta-Lactamase Production in Neisseria gonorrhoeae. Antimicrob. Agents Chemother. 1977, 11, 528–533. [Google Scholar] [CrossRef]
- Levy, S.B.; Marshall, B. Antibacterial resistance worldwide: Causes, challenges and responses. Nat. Med. 2004, 10, S122–S129. [Google Scholar] [CrossRef]
- Fletcher, S. Understanding the contribution of environmental factors in the spread of antimicrobial resistance. Environ. Health Prev. Med. 2015, 20, 243–252. [Google Scholar] [CrossRef] [Green Version]
- Perilla, M.J. Manual for the Laboratory Identification and Antimicrobial Susceptibility Testing of Bacterial Pathogens of Public Health Importance in the Developing World; Haemophilus Influenzae, Neisseria Meningitidis, Streptococcus Pneumoniae, Neisseria Gonorrhoeae, Salmonella Serotype Typhi, Shigella, and Vibrio Cholerae; World Health Organization: Geneva, Switzerland, 2003. [Google Scholar]
- Tapsall, J.W. Antibiotic Resistance in Neisseria Gonorrhoeae; WHO: Geneva, Switzerland, 2001; p. 65. [Google Scholar]
- Bell, S.M.; Pham, J.N.; Rafferty, D.L.; Allerton, J. Antibiotic Susceptibility Testing by the CDS Method: A manual for Medical and Veterinary Laboratories, 8th ed.; South Eastern Area Laboratory Services: Kogarah, Australia, 2016; p. 112. [Google Scholar]
- Unemo, M.; Fasth, O.; Fredlund, H.; Limnios, A.; Tapsall, J. Phenotypic and genetic characterization of the 2008 WHO Neisseria gonorrhoeae reference strain panel intended for global quality assurance and quality control of gonococcal antimicrobial resistance surveillance for public health purposes. J. Antimicrob. Chemother. 2009, 63, 1142–1151. [Google Scholar] [CrossRef]
- Unemo, M.; Ison, C.A.; Cole, M.; Spiteri, G.; Van De Laar, M.; Khotenashvili, L. Gonorrhoea and gonococcal antimicrobial resistance surveillance networks in the WHO European Region, including the independent countries of the former Soviet Union. Sex. Transm. Infect. 2013, 89, iv42–iv46. [Google Scholar] [CrossRef]
- Cole, M.J.; Spiteri, G.; Jacobsson, S.; Pitt, R.; Grigorjev, V.; Unemo, M.; Network, E.-G.; Network, T.E.-G. Is the tide turning again for cephalosporin resistance in Neisseria gonorrhoeae in Europe? Results from the 2013 European surveillance. BMC Infect. Dis. 2015, 15, 321. [Google Scholar] [CrossRef]
- Kirkcaldy, R.D. Neisseria gonorrhoeae antimicrobial susceptibility surveillance—the gonococcal isolate surveillance project, 27 sites, United States, 2014. MMWR Surveill. Summ. 2016, 65, 1–19. [Google Scholar] [CrossRef] [PubMed]
- Martin, I.; Sawatzky, P.; Liu, G.; Allen, V.; Lefebvre, B.; Hoang, L.; Drews, S.; Horsman, G.; Wylie, J.; Haldane, D.; et al. Decline in Decreased Cephalosporin Susceptibility and Increase in Azithromycin Resistance in Neisseria gonorrhoeae, Canada. Emerg. Infect. Dis. 2016, 22, 65–67. [Google Scholar] [CrossRef] [PubMed]
- Lahra, M.M.; Enriquez, R.; George, C.R. Australian Gonococcal Surveillance Programme Annual Report, 2017. Commun. Dis. Intell. 2019, 43, 1–14. [Google Scholar] [CrossRef] [PubMed]
- Ison, C.A.; Alexander, S. Antimicrobial resistance in Neisseria gonorrhoeae in the UK: Surveillance and management. Expert Rev. Anti-Infect. Ther. 2011, 9, 867–876. [Google Scholar] [CrossRef]
- George, C.R.R.; Enriquez, R.P.; Gatus, B.J.; Whiley, D.M.; Lo, Y.-R.; Ishikawa, N.; Wi, T.; Lahra, M.M. Systematic review and survey of neisseria gonorrhoeae antimicrobial resistance data in the Asia Pacific, 2011 to 2016. Pathology 2019, 51, S136. [Google Scholar] [CrossRef]
- Lahra, M.M. Australian Gonococcal Surveillance Programme Annual Report, 2014. Commun. Dis. Intell. 2015, 39, E347–E354. [Google Scholar]
- Australian Gonococcal Surveillance Programme. Penicillin sensitivity of gonococci in Australia: Development of Australian gonococcal surveillance programme. Members of the Australian Gonococcal Surveillance Programme. Br. J. Vener. Dis. 1984, 60, 226–230. [Google Scholar] [CrossRef]
- Tapsall, J.W. Use of a quality assurance scheme in a long-term multicentric study of antibiotic susceptibility of Neisseria gonorrhoeae. Sex. Transm. Infect. 1990, 66, 8–13. [Google Scholar] [CrossRef]
- Tapsall, J. Annual report of the Australian Gonococcal Surveillance Programme 1996. Commun. Dis. Intell. 1997, 21, 189–192. [Google Scholar]
- Australian Gonococcal Surveillance Programme. Penicillin sensitivity of gonococci isolated in Australia, 1981–1986. Australian Gonococcal Surveillance Programme. Genitourin. Med. 1988, 64, 147–151. [Google Scholar] [CrossRef]
- Brett, M.S.; Davies, H.G.; Blockley, J.R.; Heffernan, H.M. Antibiotic susceptibilities, serotypes and auxotypes of Neisseria gonorrhoeae isolated in New Zealand. Sex. Transm. Infect. 1992, 68, 321–324. [Google Scholar] [CrossRef] [PubMed]
- Goire, N.; Kundu, R.; Trembizki, E.; Buckley, C.; Hogan, T.R.; Lewis, D.A.; Branley, J.M.; Whiley, D.M.; Lahra, M.M. Mixed gonococcal infections in a high-risk population, Sydney, Australia 2015: Implications for antimicrobial resistance surveillance? J. Antimicrob. Chemother. 2017, 72, 407–409. [Google Scholar] [CrossRef] [PubMed]
- Heffernan, H.; Brokenshire, M.; Woodhouse, R.; MacCarthy, A.; Blackmore, T. Antimicrobial susceptibility among Neisseria gonorrhoeae in New Zealand in 2002. N. Z. Med. J. 2004, 117, U817. [Google Scholar] [PubMed]
- Lahra, M.M.; Enriquez, R. Australian Gonococcal Surveillance Programme Annual Report, 2010. Commun. Dis. Intell. 2011, 35, 230–236. [Google Scholar]
- Lahra, M.M.; Enriquez, R. Australian Gonococcal Surveillance Programme Annual Report, 2012. Commun. Dis. Intell. 2013, 37, 233–239. [Google Scholar]
- Lahra, M.M.; Enriquez, R. Australian Gonococcal Surveillance Programme Annual Report, 2016. Commun. Dis. Intell. 2018, 42, 1–13. [Google Scholar]
- Lahra, M.M.; Enriquez, R. Australian Gonococcal Surveillance Programme Annual Report, 2015. Commun. Dis. Intell. 2017, 41, e60–e67. [Google Scholar] [CrossRef]
- Lahra, M.M. Australian Gonococcal Surveillance Programme Annual Report, 2011. Commun. Dis. Intell. 2012, 36, E166–E173. [Google Scholar]
- Lahra, M.M. Australian Gonococcal Surveillance Programme annual report, 2013. Commun. Dis. Intell. Q. Rep. 2015, 39, 137–145. [Google Scholar]
- Lahra, M.M.; Ward, A.; Trembizki, E.; Hermanson, J.; Clements, E.; Whiley, D.; Lawrence, A. Treatment guidelines after an outbreak of azithromycin-resistant Neisseria gonorrhoeae in South Australia. Lancet Infect. Dis. 2017, 17, 133–134. [Google Scholar] [CrossRef] [Green Version]
- Lee, R.S.; Seemann, T.; Heffernan, H.; Kwong, J.C.; Gonçalves Da Silva, A.; Carter, G.P.; Woodhouse, R.; Dyet, K.H.; Bulach, D.M.; Stinear, T.P.; et al. Genomic epidemiology and antimicrobial resistance of Neisseria gonorrhoeae in New Zealand. J. Antimicrob. Chemother. 2018, 73, 353–364. [Google Scholar] [CrossRef] [PubMed]
- Stevens, K.; Zaia, A.; Tawil, S.; Bates, J.; Hicks, V.; Whiley, D.; Limnios, A.; Lahra, M.M.; Howden, B.P. Neisseria gonorrhoeae isolates with high-level resistance to azithromycin in Australia. J. Antimicrob. Chemother. 2014, 70, 1267–1268. [Google Scholar] [CrossRef] [PubMed]
- Tapsall, J.W.; Limnios, E.A.; Shultz, T.R. Continuing Evolution of the Pattern of Quinolone Resistance inneisseria gonorrhoeae isolated in Sydney, Australia. Sex. Transm. Dis. 1998, 25, 415–417. [Google Scholar] [CrossRef] [PubMed]
- Tapsall, J.W.; Phillips, E.A. The sensitivity of 173 sydney isolates of Neisseria gonorrhoeae to cefpodoxime and other antibiotics used to treat gonorrhea. Pathology 1995, 27, 64–66. [Google Scholar] [CrossRef] [PubMed]
- Tapsall, J.W.; Phillips, E.A.; Shultz, T.R.; Thacker, C. Quinolone-ResistantNeisseria gonorrhoeaeIsolated in Sydney, Australia, 1991 to 1995. Sex. Transm. Dis. 1996, 23, 425–428. [Google Scholar] [CrossRef] [PubMed]
- Tapsall, J.W. The incidence of gonorrhoea and the antibiotic sensitivity of gonococci in Australia, 1981–1991. The Australian Gonococcal Surveillance Programme. Genitourin. Med. 1993, 69, 364–369. [Google Scholar] [CrossRef]
- Tapsall, J.W. Annual report of the Australian Gonococcal Surveillance Programme, 1999. Commun. Dis. Intell. 2000, 24, 24. [Google Scholar]
- Tapsall, J.W. Annual report of the Australian Gonococcal Surveillance Programme, 2000. Commun. Dis. Intell. 2001, 24, 1–5. [Google Scholar]
- Tapsall, J.W. Annual report of the Australian Gonococcal Surveillance Programme, 2001. Commun. Dis. Intell. 2002, 26, 242–247. [Google Scholar]
- Tapsall, J.W. Annual report of the Australian Gonococcal Surveillance Programme, 2002. Commun. Dis. Intell. 2003, 27, 189–195. [Google Scholar]
- Tapsall, J.W. Annual report of the Australian Gonococcal Surveillance Programme, 2003. Commun. Dis. Intell. 2004, 28, 187–193. [Google Scholar]
- Tapsall, J.W. Annual report of the Australian Gonococcal Surveillance Programme, 2004. Commun. Dis. Intell. 2005, 29, 136–141. [Google Scholar]
- Tapsall, J.W. Annual report of the Australian Gonococcal Surveillance Programme, 2005. Commun. Dis. Intell. 2006, 30, 205–210. [Google Scholar]
- Tapsall, J.W. Annual report of the Australian Gonococcal Surveillance Programme, 2006. Commun. Dis. Intell. 2007, 31, 180–184. [Google Scholar]
- Tapsall, J.W. Annual report of the Australian Gonococcal Surveillance Programme, 2007. Commun. Dis. Intell. 2008, 32, 227–231. [Google Scholar]
- Tapsall, J.W. Annual report of the Australian Gonococcal Surveillance Programme, 2008. Commun. Dis. Intell. 2009, 33, 268–274. [Google Scholar]
- Tapsall, J.W. Annual report of the Australian Gonococcal Surveillance Programme, 2009. Commun. Dis. Intell. 2010, 34, 89–95. [Google Scholar]
- Tapsall, J.W.; Shultz, T.R.; Limnios, E.A.; Donovan, B.; Lum, G.; Mulhall, B.P. Failure of Azithromycin Therapy in Gonorrhea and Discorrelation With Laboratory Test Parameters. Sex. Transm. Dis. 1998, 25, 505–508. [Google Scholar] [CrossRef]
- Buckley, C.; Forde, B.M.; Trembizki, E.; Lahra, M.M.; Beatson, S.A.; Whiley, D.M. Use of whole genome sequencing to investigate an increase in Neisseria gonorrhoeae infection among women in urban areas of Australia. Sci. Rep. 2018, 8, 1503. [Google Scholar] [CrossRef] [Green Version]
- McDonagh, P.; Ryder, N.; McNulty, A.M.; Freedman, E. Neisseria gonorrhoeae infection in urban Sydney women: Prevalence and predictors. Sex. Health 2009, 6, 241–244. [Google Scholar] [CrossRef]
- Trembizki, E.; Buckley, C.; Lawrence, A.; Lahra, M.; Whiley, D. Characterization of a Novel Neisseria gonorrhoeae Penicillinase-Producing Plasmid Isolated in Australia in 2012. Antimicrob. Agents Chemother. 2014, 58, 4984–4985. [Google Scholar] [CrossRef] [Green Version]
- Whiley, D.M.; Limnios, E.A.; Ray, S.; Sloots, T.P.; Tapsall, J.W. Diversity of penA Alterations and Subtypes in Neisseria gonorrhoeae Strains from Sydney, Australia, That Are Less Susceptible to Ceftriaxone. Antimicrob. Agents Chemother. 2007, 51, 3111–3116. [Google Scholar] [CrossRef] [PubMed] [Green Version]
- Tapsall, J.W.; Limnios, E.A.; Tapsall, J.W.; Murphy, D. Analysis of trends in antimicrobial resistance in Neisseria gonorrhoeae isolated in Australia, 1997–2006. J. Antimicrob. Chemother. 2008, 61, 150–155. [Google Scholar] [CrossRef] [PubMed]
- World Health Organization. Guidelines for the Management of Sexually Transmitted Infections; World Health Organization: Geneva, Switzerland, 2003; p. 98. [Google Scholar]
- Speers, D.J.; Fisk, R.E.; Goire, N.; Mak, D.B. Non-culture Neisseria gonorrhoeae molecular penicillinase production surveillance demonstrates the long-term success of empirical dual therapy and informs gonorrhoea management guidelines in a highly endemic setting. J. Antimicrob. Chemother. 2013, 69, 1243–1247. [Google Scholar] [CrossRef] [PubMed] [Green Version]
- Zheng, H.; Wu, X.; Huang, J.; Qin, X.; Xue, Y.; Zeng, W.; Lan, Y.; Ou, J.; Tang, S.; Fang, M. The prevalence and epidemiology of plasmid-mediated penicillin and tetracycline resistance among Neisseria gonorrhoeae isolates in Guangzhou, China, 2002–2012. BMC Infect. Dis. 2015, 15, 412. [Google Scholar] [CrossRef]
- Chen, Y.; Gong, Y.; Yang, T.; Song, X.; Li, J.; Gan, Y.; Yin, X.; Lu, Z. Antimicrobial resistance in Neisseria gonorrhoeae in China: A meta-analysis. BMC Infect. Dis. 2016, 16, 108. [Google Scholar] [CrossRef]
- Unemo, M. Current and future antimicrobial treatment of gonorrhoea—The rapidly evolving Neisseria gonorrhoeae continues to challenge. BMC Infect. Dis. 2015, 15, 364. [Google Scholar] [CrossRef]
- World Health Organization. Global Action Plan to Control the Spread and Impact of Antimicrobial Resistance in Neisseria Gonorrhoeae; World Health Organization (WHO): Geneva, Switzerland, 2012. [Google Scholar]
- Cheng, A.C.; Turnidge, J.; Collignon, P.; Looke, D.; Barton, M.; Gottlieb, T. Control of Fluoroquinolone Resistance through Successful Regulation, Australia. Emerg. Infect. Dis. 2012, 18, 1453–1460. [Google Scholar] [CrossRef]
- Peterman, T.A.; Carter, M.W. Effective Interventions to Reduce Sexually Transmitted Disease: Introduction to the Special Issue. Sex. Transm. Dis. 2016, 43, S1–S2. [Google Scholar] [CrossRef]
- Natoli, L.; Maher, L.; Shephard, M.; Hengel, B.; Tangey, A.; Badman, S.G.; Ward, J.; Guy, R.J. Point-of-Care Testing for Chlamydia and Gonorrhoea: Implications for Clinical Practice. PLoS ONE 2014, 9, e100518. [Google Scholar] [CrossRef]
- Stroup, D.F.; Berlin, J.A.; Morton, S.C.; Olkin, I.; Williamson, G.D.; Rennie, D.; Moher, D.; Becker, B.J.; Sipe, T.A.; Thacker, S.B.; et al. Meta-analysis of Observational Studies in Epidemiology A Proposal for Reporting. JAMA 2000, 283, 2008–2012. [Google Scholar] [CrossRef] [PubMed]
- World Health Organization. Sensitivity testing of Neisseria gonorrhoeae: Methodologies for use by participants in the WHO western Pacific regional surveillance programme. In WHO/WPR Regional Antimicrobial Surveillance Working Group Meeting Proceedings; World Health Organization: Geneva, Switzerland, 1992; p. 22. [Google Scholar]
- The Joanna Briggs Institute. Critical Appraisal Checklist for Analytical Cross-Sectional Studies; The Joanna Briggs Institute: Adelaide, Australia, 2017. [Google Scholar]
- Schwarzer, G. Meta: An R package for meta-analysis. R News 2007, 7, 40–45. [Google Scholar]
- Viechtbauer, W. Conducting Meta-Analyses in R with the Metafor Package. J. Stat. Softw. 2010, 36, 1–48. [Google Scholar] [CrossRef]
- Gordon, M.; Lumley, T. Advanced Forest Plot Using ‘grid’ Graphics. Available online: http://gforge.se/packages/ (accessed on 18 June 2018).
- R Core Team. A Language and Environment for Statistical Computing; R Foundation for Statistical Computing: Vienna, Austria, 2018. [Google Scholar]


| Author Name (Ref #) | Location | Period of Isolate Collection | Source of Isolates | Subject Sex Identified | Isolation Detection Method | MIC Breakpoints | NG Isolates > = 100 | Reference/Control Strains Utilised | Total Number of Samples | Quality Score |
|---|---|---|---|---|---|---|---|---|---|---|
| Australian Gonococcal Surveillance Programme, 1988 [35] | Australia | 1981–1986 | Public sector Sexually Transmitted Disease (STD) clinics. | Male and female | Standardised agar plate dilution technique.♦ | Standard MIC values for included antimicrobial agents♣ | Yes | Australian Gonococcal Surveillance Programme (AGSP) own quality assurance programme used prior to 1993 | 25,000 | 6 |
| Tapsall, 1993 [51] | Australia | 1981–1991 | Mixed population | Male and female | Standardised agar plate dilution technique of AGSP.♦ | Standard MIC values for included antimicrobial agents♣ | Yes | World Health Organisation (WHO) quality controlled method since 1993. | 32,000 | 7 |
| Tapsall, 1995 [49] | Sydney, Australia | 1993 | Mixed population | Male and female | Standardised agar plate dilution technique.♦ | Standard MIC values for included antimicrobial agents♣ | Yes | WHO quality controlled method since 1993. | 173 | 6 |
| Tapsall, 1996 [50] | Sydney, Australia | 1991–1995 (+1984–1990) | Mixed population | Male and female | Standardised agar plate dilution technique.♦ | Standard MIC values for included antimicrobial agents♣ | Yes | WHO quality controlled method since 1993. | 2670 | 6 |
| Tapsall, 1998 [48] | Sydney, Australia | 1995–1997 | Public and private sector sources | Male and female | Standardised agar plate dilution technique.♦ | Standard MIC values for included antimicrobial agents♣ | Yes | WHO quality controlled method since 1993. | 2236 | 6 |
| Tapsall, 1997 [34] | Australia | 1996 | Public and private sector sources | Male and female | Standardised agar plate dilution technique.♦ | Standard MIC values for included antimicrobial agents♣ | Yes | WHO quality controlled method since 1993. | 2753 | 7 |
| Tapsall, 2000 [52] | Australia | 1999 | Public and private sector sources | Male and female | Standardised agar plate dilution technique.♦ | Standard MIC values for included antimicrobial agents♣ | Yes | WHO quality controlled method since 1993. | 3658 | 7 |
| Tapsall, 2001 [53] | Australia | 2000 | Public and private sector sources | Male and female | Standardised agar plate dilution technique.♦ | Standard MIC values for included antimicrobial agents♣ | Yes | WHO quality controlled method since 1993. | 3468 | 7 |
| Tapsall, 2002 [54] | Australia | 2001 | Public and private sector sources | Male and female | Standardised agar plate dilution technique.♦ | Standard MIC values for included antimicrobial agents♣ | Yes | WHO quality controlled method since 1993. | 3725 | 7 |
| Tapsall, 2003 [55] | Australia | 2002 | Public and private sector sources | Male and female | Standardised agar plate dilution technique.♦ | Standard MIC values for included antimicrobial agents♣ | Yes | WHO quality controlled method since 1993. | 3861 | 7 |
| Tapsall, 2004 [56] | Australia | 2003 | Public and private sector sources | Male and female | Standardised agar plate dilution technique.♦ | Standard MIC values for included antimicrobial agents♣ | Yes | WHO quality controlled method since 1993. | 3677 | 7 |
| Tapsall, 2005 [57] | Australia | 2004 | Public and private sector sources | Male and female | Standardised agar plate dilution technique.♦ | Standard MIC values for included antimicrobial agents♣ | Yes | WHO quality controlled method since 1993. | 3664 | 7 |
| Tapsall, 2006 [58] | Australia | 2005 | Public and private sector sources | Male and female | Standardised agar plate dilution technique.♦ | Standard MIC values for included antimicrobial agents♣ | Yes | WHO quality controlled method since 1993. | 3886 | 7 |
| Tapsall, 2007 [59] | Australia | 2006 | Public and private sector sources | Male and female | Standardised agar plate dilution technique.♦ | Standard MIC values for included antimicrobial agents♣ | Yes | WHO quality controlled method since 1993. | 3850 | 7 |
| Tapsall, 2008 [60] | Australia | 2007 | Public and private sector sources | Male and female | Standardised agar plate dilution technique.♦ | Standard MIC values for included antimicrobial agents♣ | Yes | WHO quality controlled method since 1993. | 3142 | 7 |
| Tapsall, 2009 [61] | Australia | 2008 | Public and private sector sources | Male and female | Standardised agar plate dilution technique.♦ | Standard MIC values for included antimicrobial agents♣ | Yes | WHO quality controlled method since 1993. | 3110 | 7 |
| Tapsall, 2010 [62] | Australia | 2009 | Public and private sector sources | Male and female | Standardised agar plate dilution technique.♦ | Standard MIC values for included antimicrobial agents♣ | Yes | WHO quality controlled method since 1993. | 3157 | 7 |
| Lahra, 2011 [39] | Australia | 2010 | Public and private sector sources | Male and female | Standardised agar plate dilution technique.♦ | Standard MIC values for included antimicrobial agents♣ | Yes | WHO quality controlled method since 1993. | 3997 | 7 |
| Lahra, 2012 [43] | Australia | 2011 | Public and private sector sources | Male and female | Standardised agar plate dilution technique.♦ | Standard MIC values for included antimicrobial agents♣ | Yes | WHO quality controlled method since 1993. | 4230 | 7 |
| Lahra, 2013 [40] | Australia | 2012 | Public and private sector sources | Male and female | Standardised agar plate dilution technique.♦ | Standard MIC values for included antimicrobial agents♣ | Yes | WHO quality controlled method since 1993. | 4718 | 7 |
| Lahra, 2015 [44] | Australia | 2013 | Public and private sector sources | Male and female | Standardised agar plate dilution technique.♦ | Standard MIC values for included antimicrobial agents♣ | Yes | WHO quality controlled method since 1993. | 4897 | 7 |
| Lahra, 2015 [31] | Australia | 2014 | Public and private sector sources | Male and female | Standardised agar plate dilution technique.♦ | Standard MIC values for included antimicrobial agents♣ | Yes | WHO quality controlled method since 1993. | 4808 | 7 |
| Lahra, 2017 [42] | Australia | 2015 | Public and private sector sources | Male and female | Standardised agar plate dilution technique.♦ | Standard MIC values for included antimicrobial agents♣ | Yes | WHO quality controlled method since 1993. | 5411 | 7 |
| Lahra, 2018 [41] | Australia | 2016 | Public and private sector sources | Male and female | Standardised agar plate dilution technique.♦ | Standard MIC values for included antimicrobial agents♣ | Yes | WHO quality controlled method since 1993. | 6378 | 7 |
| Lahra, 2019 [28] | Australia | 2017 | Public and private sector sources | Male and female | Standardised agar plate dilution technique.♦ | Standard MIC values for included antimicrobial agents♣ | Yes | WHO quality controlled method since 1993. | 7835 | 7 |
| Heffernan, 2004 [38] | New Zealand | April–August 2002 | Community and hospital laboratories | Males and females | Standardised agar plate dilution technique.♦ | Standard MIC values for included antimicrobial agents♣ | Yes | Not stated but used the AGSP method based on WHO quality control method. | 615 | 7 |
| Lee, 2018 [46] | New Zealand | 2014-2015 | Public and private sector sources | Males and females | Agar dilution method according to Clinical and Laboratory Standards Institute (CLSI ) Gonorrhoea guidelines. | Standard MIC values for included antimicrobial agents♣ | Yes | N. gonorrhoea drug-susceptible strain ATCC 49226 and strain NCTC 13479 (WHO K) | 398 | 7 |
| Goire, 2017 [37] | Sydney, Australia | March–June 2015 | PublicSector STD clinics. | Male and female | Etest method - MALDI-TOF MS (Bruker Daltonics, Bremen, Germany) | Standard MIC values for included antimicrobial agents♣ | Yes | WHO quality controlled method since 1993. | 615 | 7 |
| Brett, 1992 [36] | New Zealand | 1988 | Public and private sector | Male and female | Standardised agar plate dilution technique.♦ | Standard MIC values for included antimicrobial agents♣ | Yes | Not indicated | 486 | 6 |
© 2019 by the authors. Licensee MDPI, Basel, Switzerland. This article is an open access article distributed under the terms and conditions of the Creative Commons Attribution (CC BY) license (http://creativecommons.org/licenses/by/4.0/).
Share and Cite
Fletcher-Lartey, S.; Dronavalli, M.; Alexander, K.; Ghosh, S.; Boonwaat, L.; Thomas, J.; Robinson, A.; Patel, Z.; Forssman, B.; Pal, N. Trends in Antimicrobial Resistance Patterns in Neisseria Gonorrhoeae in Australia and New Zealand: A Meta-analysis and Systematic Review. Antibiotics 2019, 8, 191. https://0-doi-org.brum.beds.ac.uk/10.3390/antibiotics8040191
Fletcher-Lartey S, Dronavalli M, Alexander K, Ghosh S, Boonwaat L, Thomas J, Robinson A, Patel Z, Forssman B, Pal N. Trends in Antimicrobial Resistance Patterns in Neisseria Gonorrhoeae in Australia and New Zealand: A Meta-analysis and Systematic Review. Antibiotics. 2019; 8(4):191. https://0-doi-org.brum.beds.ac.uk/10.3390/antibiotics8040191
Chicago/Turabian StyleFletcher-Lartey, Stephanie, Mithilesh Dronavalli, Kate Alexander, Sayontonee Ghosh, Leng Boonwaat, Jane Thomas, Amanda Robinson, Zeel Patel, Bradley Forssman, and Naru Pal. 2019. "Trends in Antimicrobial Resistance Patterns in Neisseria Gonorrhoeae in Australia and New Zealand: A Meta-analysis and Systematic Review" Antibiotics 8, no. 4: 191. https://0-doi-org.brum.beds.ac.uk/10.3390/antibiotics8040191