Article

Development of Resistance in Escherichia coli ATCC25922 under Exposure of Sub-Inhibitory Concentration of Olaquindox

1
College of Veterinary Medicine, Huazhong Agricultural University, Wuhan 430070, China
2
MOA Laboratory for Risk Assessment of Quality and Safety of Livestock and Poultry Products, Huazhong Agricultural University, Wuhan 430070, China
*
Author to whom correspondence should be addressed.
Submission received: 2 September 2020 / Revised: 7 October 2020 / Accepted: 8 October 2020 / Published: 10 November 2020
(This article belongs to the Special Issue Antimicrobial Resistance: The Final Frontier)

Abstract

:
Quinoxaline1,4-di-N-oxides (QdNOs) are a class of important antibacterial drugs of veterinary use, of which the drug resistance mechanism has not yet been clearly explained. This study investigated the molecular mechanism of development of resistance in Escherichia coli (E. coli) under the pressure of sub-inhibitory concentration (sub-MIC) of olaquindox (OLA), a representative QdNOs drug. In vitro challenge of E. coli with 1/100× MIC to 1/2× MIC of OLA showed that the bacteria needed a longer time to develop resistance and could only achieve low to moderate levels of resistance as well as form weak biofilms. The transcriptomic and genomic profiles of the resistant E. coli induced by sub-MIC of OLA demonstrated that genes involved in tricarboxylic acid cycle, oxidation-reduction process, biofilm formation, and efflux pumps were up-regulated, while genes involved in DNA repair and outer membrane porin were down-regulated. Mutation rates were significantly increased in the sub-MIC OLA-treated bacteria and the mutated genes were mainly involved in the oxidation-reduction process, DNA repair, and replication. The SNPs were found in degQ, ks71A, vgrG, bigA, cusA, and DR76-4702 genes, which were covered in both transcriptomic and genomic profiles. This study provides new insights into the resistance mechanism of QdNOs and increases the current data pertaining to the development of bacterial resistance under the stress of antibacterials at sub-MIC concentrations.

1. Introduction

In recent years, resistant bacteria infection is one of the most pressing concerns of global societies, which has substantially contributed to the clinic and economic burden of the healthcare system [1]. During the use of antibacterials, microorganisms are frequently exposed to drug concentrations below the minimal inhibitory concentration (MIC), which is called sub-inhibitory concentration (sub-MIC) [2]. The origins of sub-MIC concentration of the antibacterial environment are versatile. For example, the concentration of natural antibacterials produced by bacteria and fungi in the environment is often lower than the MIC of pathogens [3]. Furthermore, carcasses and excreta of animals that have used antibacterial drugs generate antibacterial gradients in the body and in the surrounding environment [4]. The poor therapeutic schedule of antibacterials treatment and preventive use of antibacterials, as well as the application of antibacterials as growth-promoters in livestock production are also important sources of sub-MIC concentrations [5]. These reservoirs of sub-MIC concentration of antibacterials involve humans, livestocks, crops, and aquaculture, as well as the related environment, which are intimately connected and provide favorable conditions for bacteria to develop antibacterial resistance.
Studies have shown that sub-MIC concentrations of antibacterial drugs can cause genetic and phenotypic changes in bacteria, including enrichment of the original drug-resistant bacteria, induction of new drug-resistant bacteria, formation of persisters, affecting bacterial biofilm formation, etc. [4]. Sub-MIC levels of certain types of antibacterials are known to trigger bacterial SOS response, resulting in the increase of mutation rates and lateral gene transfer [6]. It has also been suggested that sub-MIC levels of antibacterials may be more relevant to the problem of bacterial resistance than lethal concentrations of antibacterials [7,8,9]. One study evolved multiple independent lineages of wild-type Escherichia coli (E. coli) and Salmonella typhimurium strains under constant exposure of 1/10× MIC levels of ciprofloxacin and streptomycin, respectively, to assess the emergence of de novo resistance [10]. However, only a few studies address the development of bacterial resistance under long-term exposure of wide range of sub-MIC concentrations [11]. In addition, most of the researches on the mechanism of bacterial resistance induced by sub-MIC concentrations of antibacterials are on human drugs, while few studies are on veterinary drugs.
Quinoxaline1,4-di-N-oxides (QdNOs) have been widely used at sub-therapeutic levels to promote growth and improve effificiency of feed conversion in animal feeding for more than half a century [12]. Previous investigations have demonstrated that QdNOs can inhibit DNA synthesis and cause DNA damage [4,5]. It was suggested that bacterial reductase(s) are involved in the metabolic activation of QdNOs and some unstable intermediate products, likely free radicals that may attack DNA and induce DNA damage [4]. Olaquindox (OLA) is a classical member of QdNO family, which has a broad antimicrobial spectrum and can improve animal production performance [13,14]. However, it was demonstrated that the usage of OLA on pig farms increased the emergence of QdNOs resistance in fecal E. coli [15]. The OLA-resistant bacteria are often co-resistant to ampicillins, tetracyclines, and/or chloramphenicols [16]. The only known mechanism of QdNOs resistance is OqxAB efflux pump, a novel transmissible resistance-nodulation-division (RND) efflux pump, whose encoding genes, oqxA and oqxB, are generally located on chromosome or plasmid, conferring resistance to ampicillin, chloramphenicol, ciprofloxacin, and OLA in E. coli [17]. The oqxAB-located plasmid has a high frequency of transfer among enterobacterial pathogens, such as S. Typhimurium, Klebsiella pneumoniae, Kluyvera spp, Enterobacter aerogenes, etc. [18]. However, previous studies have found that there is no unique relationship between oqxAB gene and QdNOs resistance. OLA-resistant E. coli induced by OLA in vitro does not carry oqxAB gene, and one out of 21 OLA-resistant E. coli isolated from pigs did not contain the oqxAB gene [13]. From the human intestinal flora treated with another member of QdNOs, cyadox, only 26% (12 in 46) of QdNOs resistant E. coli contained oqxAB gene, and all resistant enterococci did not contain the oqxAB gene [19]. These data indicate that bacteria can obtain QdNOs resistance through other novel mechanism except the OqxAB-mediated QdNOs resistance. Previous studies have found that the reductive metabolic activity of quindoxin-induced E. coli mutants was reduced compared to the maternal bacteria [20]. Using suppression subtractive hybridization polymerase chain reaction (SSH PCR) subtraction, differentially expressed genes (DEGs) were selected in the QdNOs-resistant E. coli strains by OLA in vitro, and most of these genes were involved in the tolerance to oxidative stress [13]. However, the drawback of SSH PCR is that it can only select the up-regulated genes. Besides oqxAB genes, there is an urgent need to explore the novel mechanisms involved in the emergence of QdNOs resistance in bacteria.
This study aims to elucidate the dynamic phenotype changes and regulatory patterns of the development of bacterial resistance under the pressure of sub-MIC concentration of OLA, and to explore the new mechanism of the de novo QdNOs resistance, using whole genome and transcriptome sequencings. Clarifying the substantial effect of sub-MIC concentrations of QdNOs on the bacterial resistance will provide new insights for assessing the risk of antibacterial resistance caused by the low concentration of antibacterial agents.

2. Results

2.1. Phenotypic Changes of E. coli ATCC25922 Induced by Sub-MIC Of OLA In Vitro

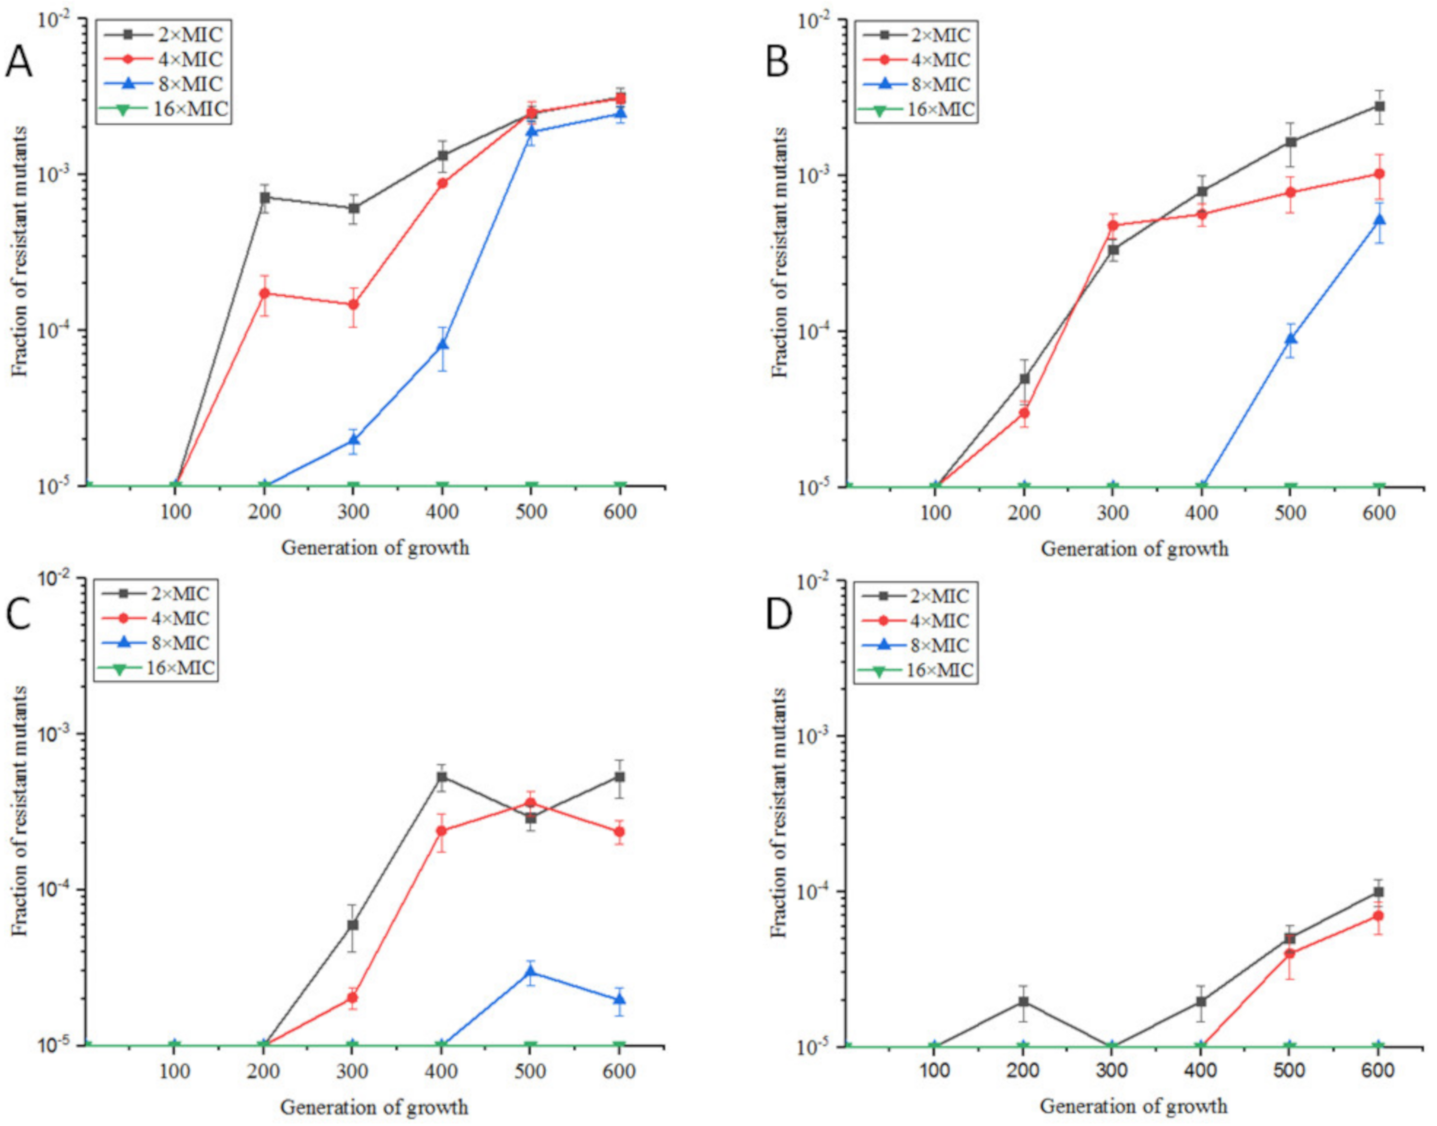
2.1.1. Resistance Development of E. coli ATCC25922 Exposed to Sub-MIC of OLA

Under aerobic conditions, the MIC value of OLA against E. coli ATCC25922 was 8 μg/mL. E. coli ATCC25922 was induced by sub-MIC of OLA in four dosage groups, 1/2× MIC(4 μg/mL), 1/4× MIC(2 μg/mL), 1/10× MIC(0.8 μg/mL), and 1/100× MIC(0.08 μg/mL). As shown in Figure 1, with the number of passages increased, the resistance rates gradually increased. From the 200th generation, 1/2× MIC and 1/4× MIC OLA-induced bacteria appeared colonies on plates containing 2, 4, and 8 times MIC of OLA, and the highest resistance rate was above 3‰ in the 600th generation. Bacteria induced by 1/10× MIC and 1/100× MIC OLA survived against 2× MIC and 4× MIC of OLA from the 300th and 500th generations, respectively, and the highest resistance rate was below 1‰ in the 600th generation. There were almost no drug-resistant colonies on the 16× MIC OLA plate for all the four groups, and 1/100× MIC OLA-induced group even had no resistant-colonies to 8× MIC OLA.
Differently, 1/2× MIC and 1/4× MIC Enrofloxacin (ENR)-induced E. coli appeared colonies on 2× MIC and 4× MIC ENR plates from 100 generations, and the resistance rates for 2× MIC ENR exceeded 20% by the 600th generation (Figure S1). Bacteria induced by 1/10× MIC and 1/100× MIC ENR survived against 2× MIC and 4× MIC of ENR from the 200th and 400th generations, respectively, and the resistance rate of the 1/10× MIC ENR-induced group to 2× MIC was more than 1% at the 500th generation, and the resistance rate of the 1/100× MIC ENR-induced group against 2× MIC reached 0.1% at the 600th generation. The resistance rates of the four groups in plates containing 8× MIC ENR at the 600th passage were 1.9%, 0.9%, 0.02%, and 0.003%, respectively. Except 1/100× MIC ENR group, the other three groups could induce resistant colonies against 16× MIC ENR at the 600th passage eventually.

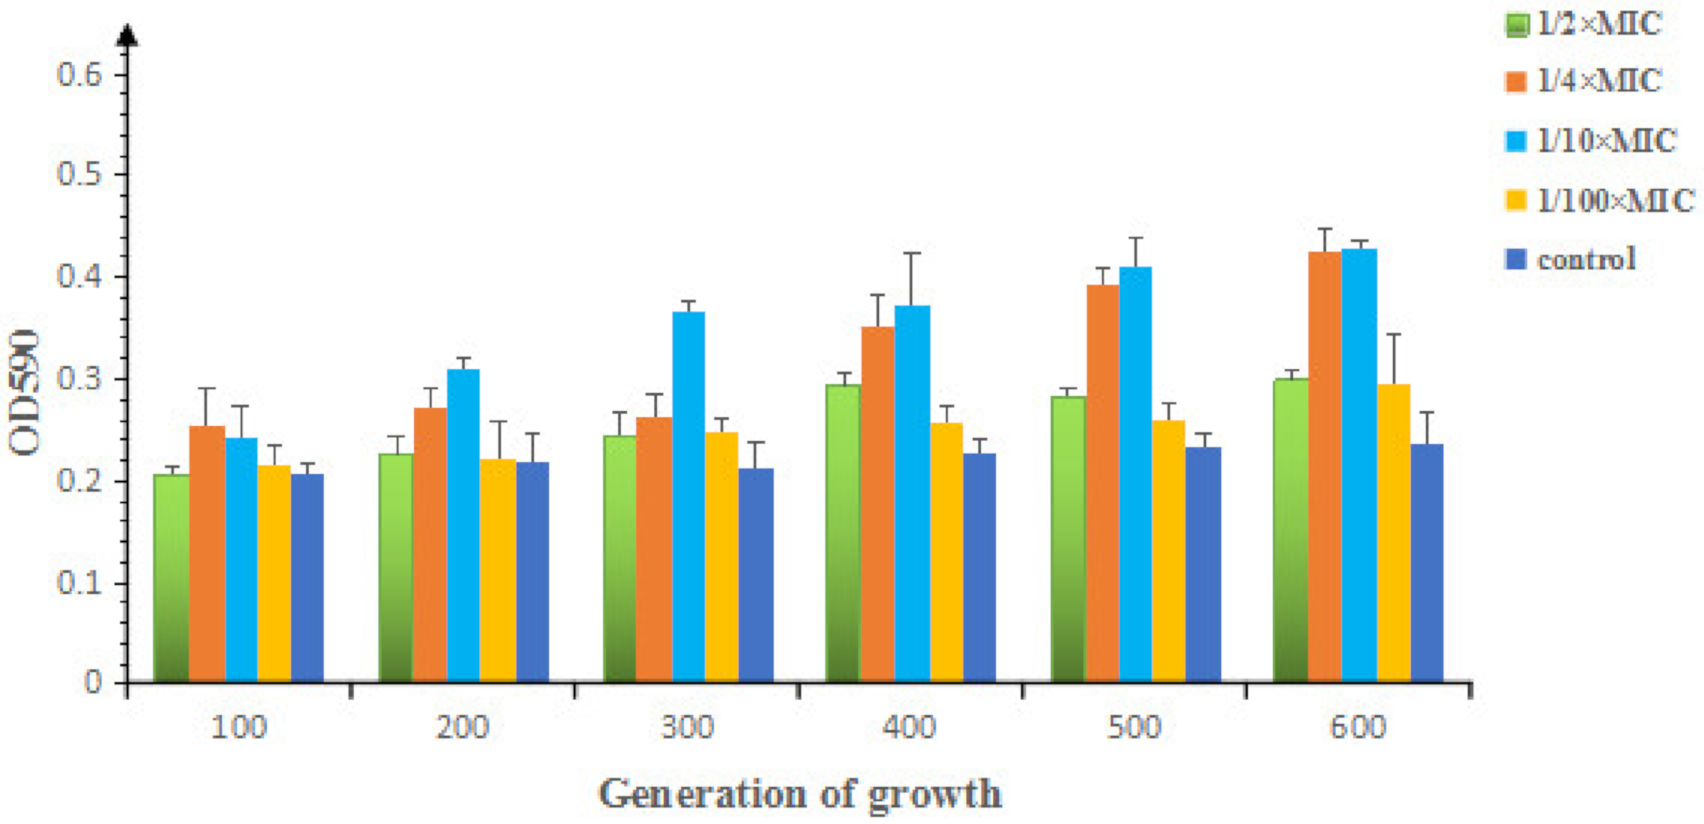
2.1.2. Effects of Sub-MIC of OLA on the Morphology and Biofilm Formation of E. coli ATCC25922

Scanning electron microscopy of 1/2× MIC OLA or ENR-induced bacteria showed that the sub-MIC of antibacterials had little effect on the growth or morphology of E. coli ATCC25922 (Figure S2). As shown in Figure 2, the biofilm formation ability of E. coli increased slightly with the increase of number of passages. Compared with control group, most of them belong to weak biofilm formation strains (OD value was 1 to 2 times that of the control group), and strong biofilm formation strains (OD value was 2 times larger than that of the control group) are 500th and 600th bacteria induced by 1/10× MIC and 600th bacteria induced by 1/4× MIC OLA.

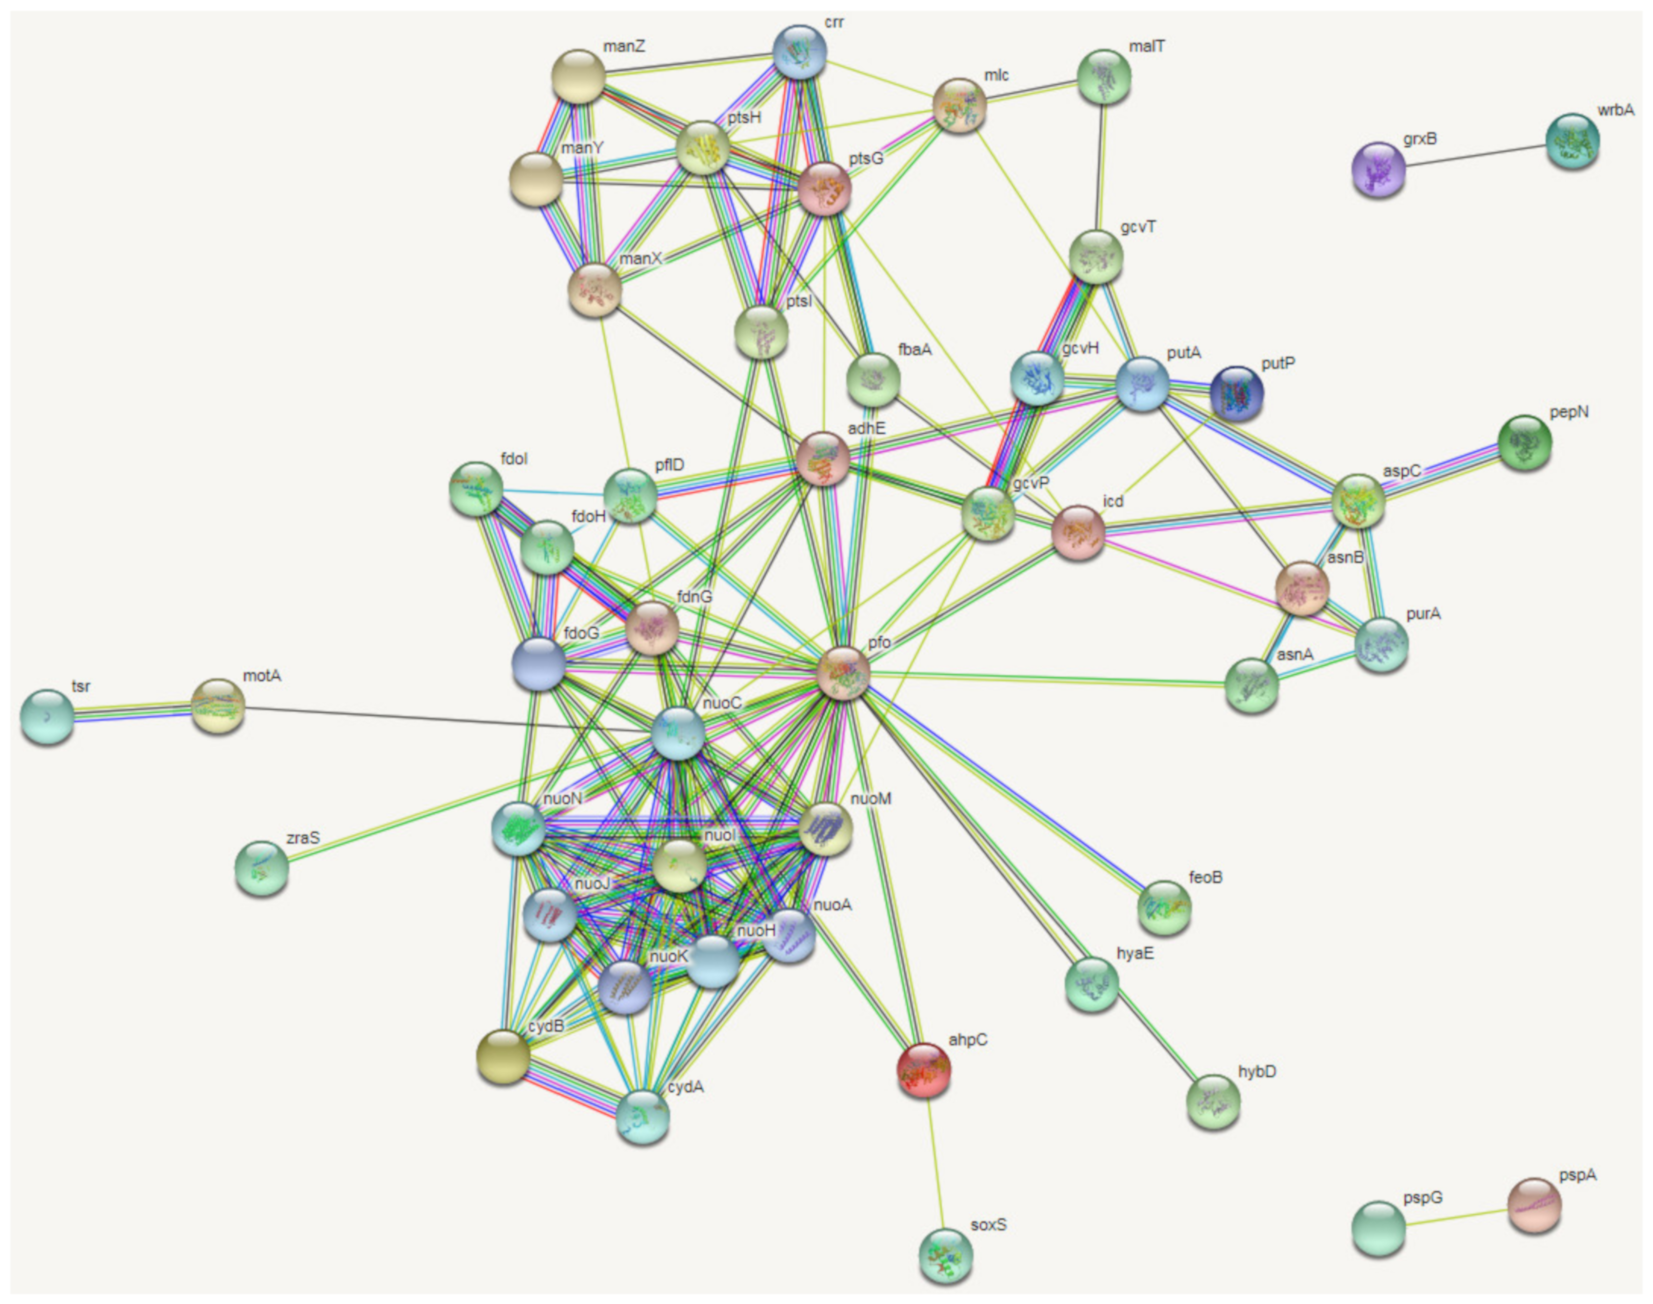
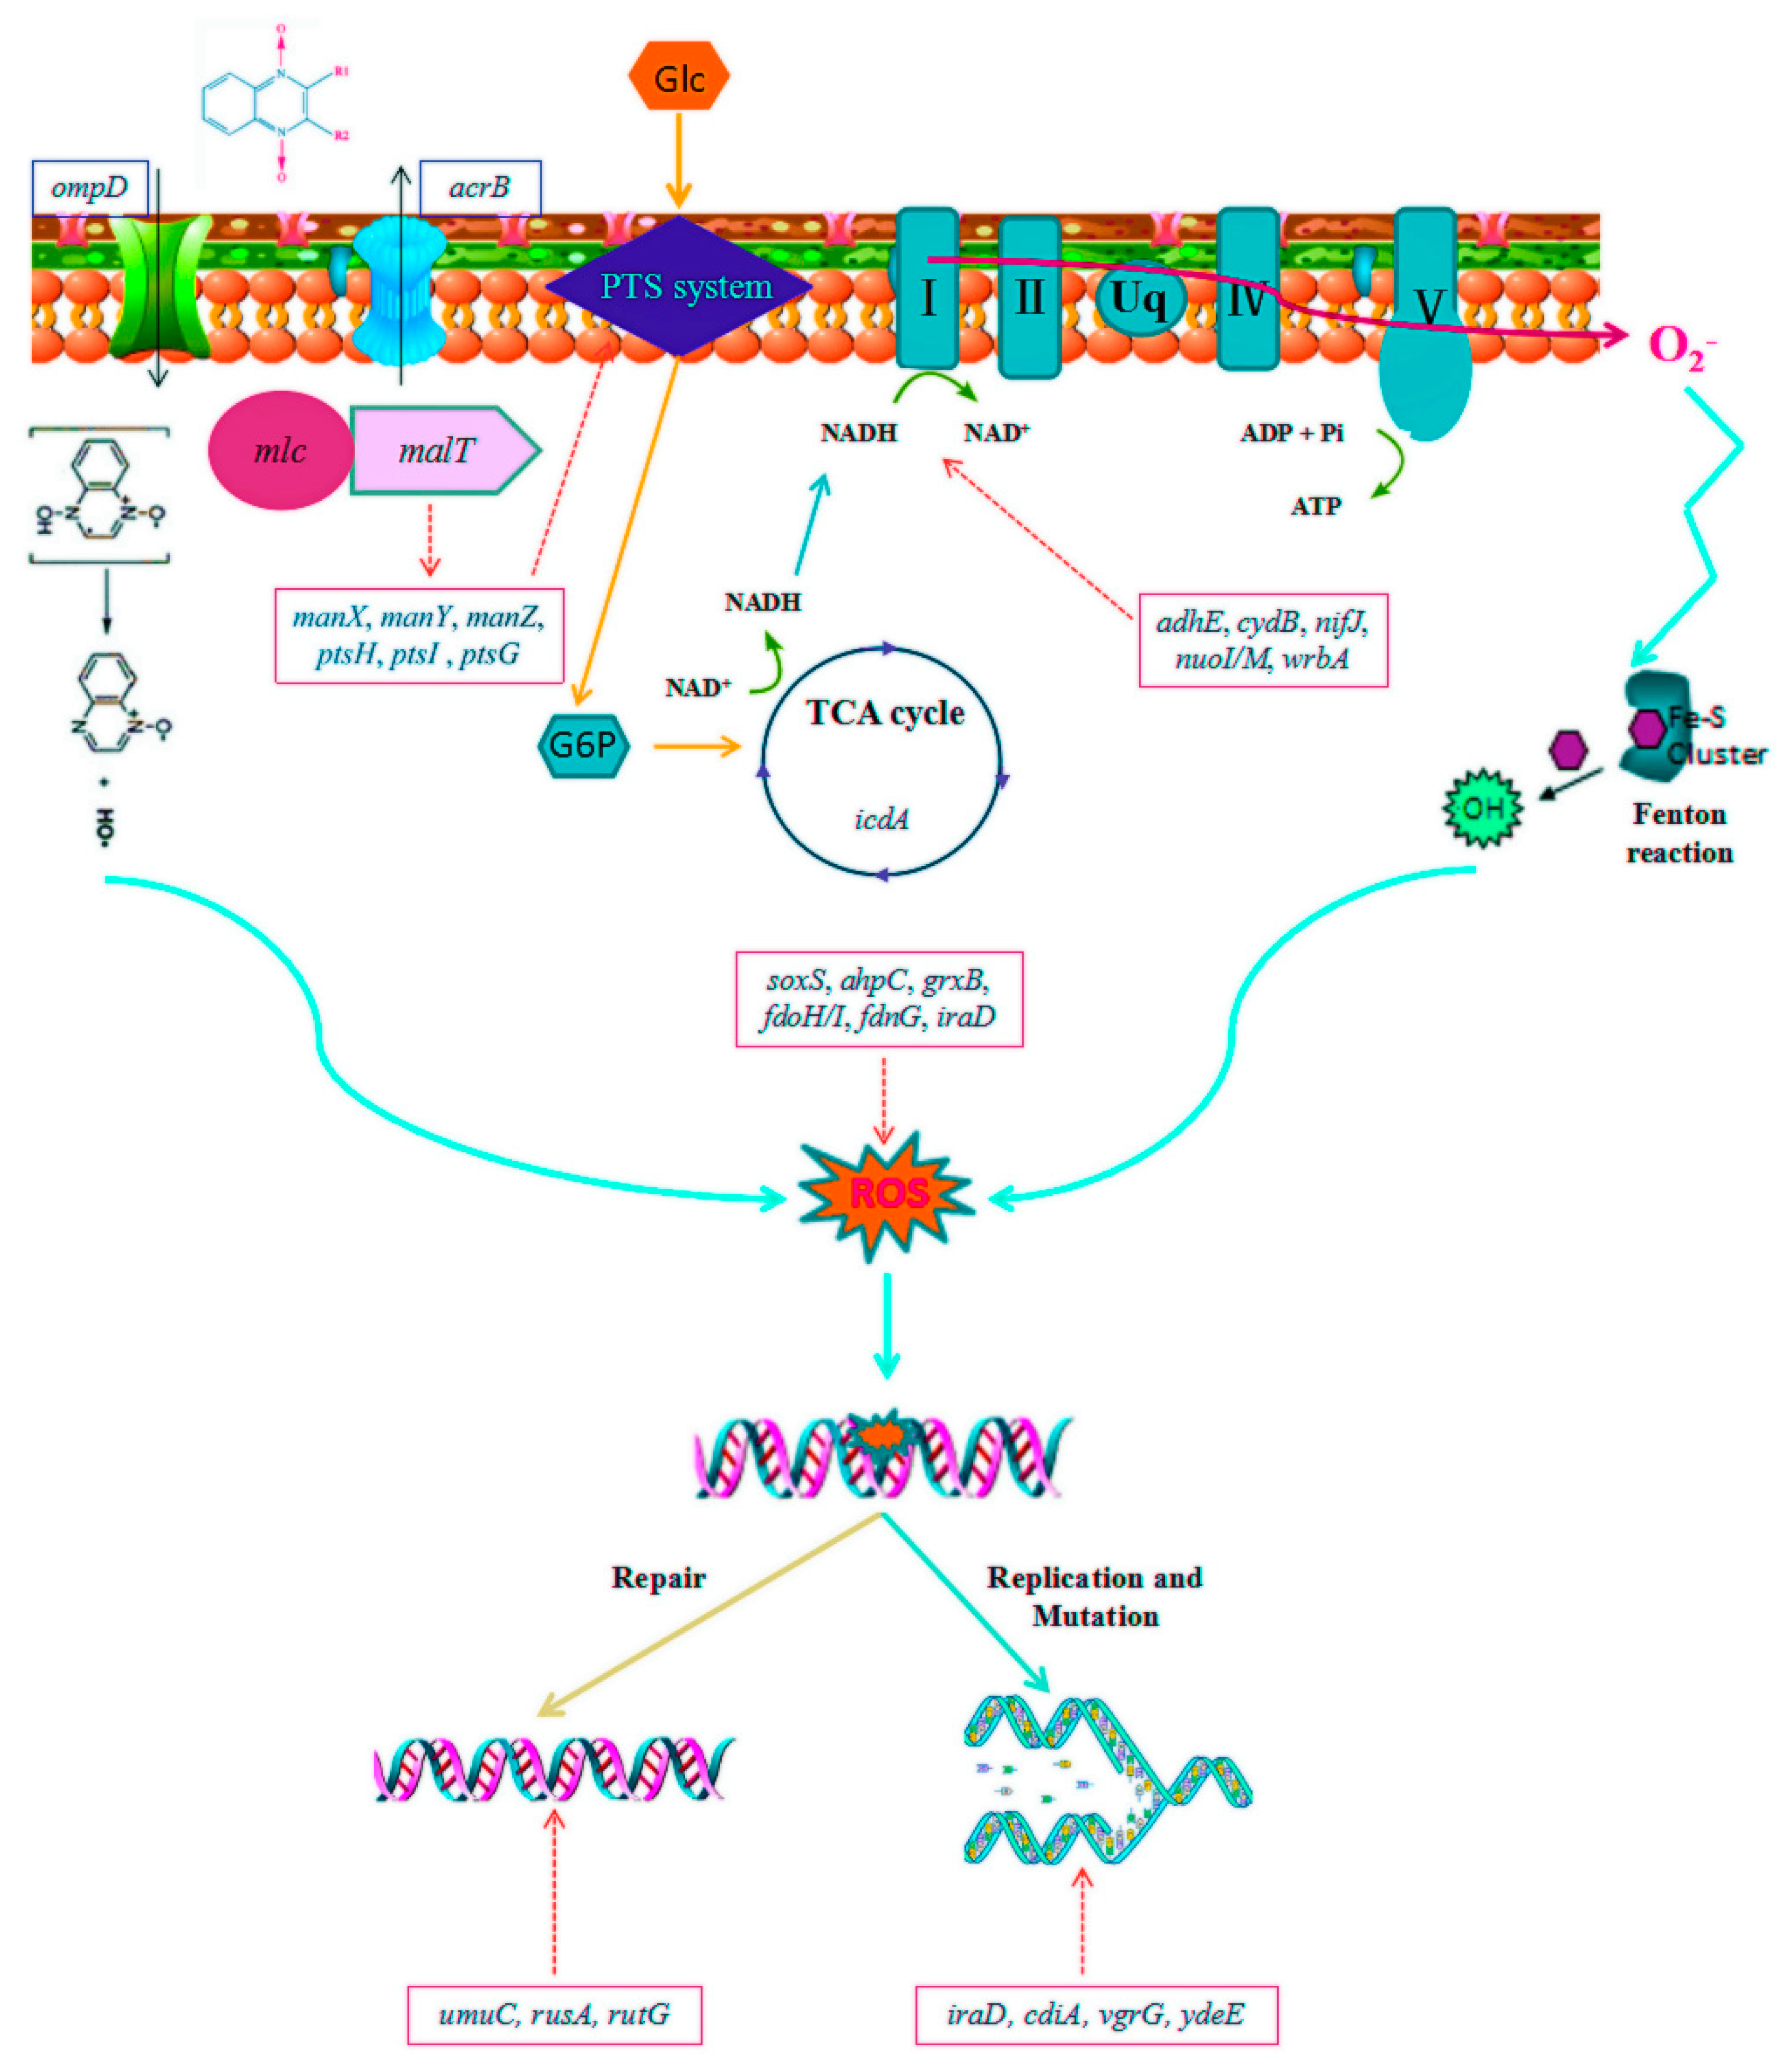
2.2. Transcriptomic Profiles of E. coli ATCC25922 Induced by Sub-MIC of OLA

1/2× MIC and 1/10× MIC OLA-induced E. coli ATCC25922 which were resistant to 8× MIC OLA and the wild-type E. coli ATCC25922 were subjected to RNA sequencing respectively. Number of 20,857,965, 22,396,241 and 20,487,346 trimmed reads were obtained for the untreated, 1/2× MIC and 1/10× MIC OLA-treated bacteria, respectively (Table S1). The reads were mapped on the reference genome of E. coli ATCC25922 (NCBI accession No. GCF_000743255.1) (Supplementary Table S2). The closer the value of the correlation coefficient between samples is to 1, the more similar the expression patterns indicated. The correlation coefficients for gene expression pattern between biological triplicates of untreated, 1/10× MIC and 1/2× MIC OLA-treated bacteria were all ≥0.90, indicating that the correlation between triplicate samples in the same group is good. The square of the Pearson correlation coefficient (R2) varied from 0.80 to 0.97 in 1/2× MIC OLA-treated group and from 0.85 to 0.94 in 1/10× MIC OLA-treated samples, indicating good operational stability and reliability of sequencing library (Supplementary Figure S3). The functional annotation was performed based on the KEGG, NOG, GO, and NR databases. The annotation of unigenes in the Swiss-Prot, KO, eggNOG, GO, and NR databases accounted for 86.73%, 63.22%, 13.09%, 49.43%, and 99.76% of the total unigenes, respectively (Supplementary Table S3), indicating that the quality of transcriptome sequencing was good and the function of most genes was annotated. The RNAseq data were deposited in the NCBI Sequence Read Archive (SRA) database under the accession number of PRJNA525186.
DEGs between OLA-treated and untreated groups were analyzed to better understand the mechanism of bacterial resistance development against OLA (Supplementary Tables S4 and S5). Compared to the untreated group (group B), 156 genes were up-regulated and 130 were down-regulated in 1/2× MIC OLA treated group (group C). A comparison of gene expression between group B and 1/10× MIC treated group (group D) showed that 255 genes were differentially expressed, of which 101 genes were up-regulated and 154 genes were down-regulated. A total of 269 differentially expressed genes between the group C and group D with 85 genes up-regulated and 184 genes down-regulated. An investigation of the lists of DEGs by Venn diagram found that a number of the same genes were up-regulated or down-regulated in the OLA-treated groups compared with the untreated group (Supplementary Figure S4). There were 121 co-differentially expressed genes in the OLA-treated groups, 38 genes were up-regulated and 83 genes were down-regulated. Co-differentially expressed genes which have been annotated in the GO and KEGG databases, are shown in Table 1. Among them, three of the up-regulated genes are related to transcriptional regulators, fourteen genes are involved in the redox process of bacterial metabolism, six genes encode phosphoglucose transferase system (PTS) proteins, six genes are involved in sugar and amino acid metabolism, and six genes are associated with biofilm formation, ferrous iron transport, anti-adapter protein, formate C-acetyltransferase, sensor histidine kinase, and one uncharacterized protein, respectively. Only 21 down-regulated genes were annotated in the GO and KEGG databases. Nine genes are involved in DNA binding and repair, four genes encode the membrane component proteins, two genes encode chemotactic proteins, and two genes encode phage shock proteins. Other five genes encode pyrimidine utilization transport protein, putative electron transport protein, aminopeptidase N, toxin HigB-1 and a hypothetical protein, respectively.
The proteins corresponding to the 121 co-differentially expressed genes were matched with the proteins of Escherichia coli K12 MG1655, and then a cluster analysis of protein interactions was performed with 15 significant KEGG metabolic pathways obtained in the STRING database (Figure 3). They are phosphotransferase system (PTS), metabolic pathways, alanine, aspartate and glutamate metabolism, carbon metabolism, biosynthesis of antibiotics, microbial metabolism in diverse environments, biosynthesis of secondary metabolites, glyoxylate and dicarboxylate metabolism, amino sugar and nucleotide sugar metabolism, fructose and mannose metabolism, glycolysis/gluconeogenesis, methane metabolism, tyrosine metabolism, butanoate metabolism, oxidative phosphorylation. In this network, oxidoreductases, such as Pfo, AdhE, and NuoM were shown to play a role in the important processes of pyruvate-ferredoxin/flavodoxin redox, DNA replication, and NADH-quinone redox. Because these proteins interact with more proteins, they are the key nodes of the protein interaction network.
Compared with the reference genome sequence of E. coli ATCC25922 (NCBI accession number GCF_000743255.1), RNA-seq results showed that the number of SNPs in the genome were 193, 120, and 122 from the three duplicates of 1/10× MIC OLA treated group, 128, 146, and 129 from the three duplicates of 1/2× MIC OLA treated group, and 86, 92, and 85 from the three duplicates of untreated group, respectively. RNA-seq results also showed that the number of indel sites in the genome was 30, 21, and 22 from the three duplicates of 1/10× MIC OLA treated group, 19, 24, and 18 from the three duplicates of 1/2× MIC OLA treated group, and 13, 18, and 12 from the three duplicates of untreated group, respectively. This result demonstrated that the number of mutations and insertion/deletion sites in the OLA treated groups was significantly increased. Among these SNPs, 23 SNP sites would result in a protein sequence change, 15 non-synonymous mutations, and eight single-point deletions (Table 2). Genes with these mutations encode regulatory proteins of transcription, nucleotide pyrophosphatase family proteins, efflux system membrane proteins, etc. The SNPs were compared with the CARD resistance database, and the results showed that there were no mutations of the known drug resistance genes.

2.3. Genomic Profiles of E. coli ATCC25922 Induced by Sub-MIC Of OLA

The genome of E. coli ATCC25922 induced by 1/2× MIC OLA and resistant to 8× MIC OLA showed a total bases of 529,982,985 bp and a number of subreads of 64,908, with average subreads length of 8165 bp. Using the Canu software, the genome was assembled and showed a 5,158,951 bp length (Supplementary Figure S5), which contained 5384 predicted genes with an average G+C content of 50.49%. The protein sequences predicted by Glimmer software were extracted, and the length of the protein sequences were statistically plotted (Supplementary Figure S6). There were 4045 and 3626 predicted genes annotated in COG (Supplementary Figure S7) and GO database, respectively (Supplementary Figure S8). Also, 3181 predicted genes were involved in 29 KEGG pathways which were classified into “Metabolism” (12 out of 29), “Genetic Information Processing” (four out of 29), “Cellular Processes” (four out of 29), “Environmental Information Processing” (two out of 29), and “Organismal Systems”(seven out of 29) (Supplementary Figure S9). The genomic sequencing data were deposited in the NCBI Sequence Read Archive (SRA) database under the accession number of PRJNA525188. Using the genomic multiple alignment tool Mauve, the genome of the OLA resistant E. coli was compared with the reference genome of E. coli ATCC25922 (NCBI accession No. GCF_000743255.1). There are two gene fragments of shifting and one gene fragment of deletion (Figure 4).
Using MUMmer (v3.23), the genome of the OLA-resistant bacteria was compared with the reference genome (NCBI accession No. GCF_000743255.1), and 715 SNP sites were obtained, among which 270 SNP sites involving 41 genes existed in the exon region, causing non-synonymous mutations or codon termination. In the meantime, 82 indel sites were obtained, among which 27 indel sites existed in the exon region (Table 3). There were 113 SNP sites and 19 indel sites associated with the DNA replication fork binding protein CrfC, which plays important functions such as cell replication, recombination, and repair. Only three SNP sites and one indel locus were involved in DNA binding, transcriptional regulation, and recombination genes. There was an SNP site observed in drug/metabolite transporter gene yddG and a SNP site efflux gene acrB. There were four SNP sites and one non-frameshift deletion found in NAD+ oxidoreductase gene. These results indicated that the bacterial resistance to QdNO drugs could be related to NAD+ redox and efflux pump. Comparing the SNPs between the transcriptomic sequencing (Table 2) and genomic sequencing (Table 3), six identical SNP sites, degQ, ks71A, vgrG, bigA, cusA, and DR76-4702, were found. vgrG and bigA have different mutation sites, and the other 4 genes have only one mutation site in both of the sequencing profiles. Other SNPs included amino acid metabolism, integral component of membrane, ion transport, and nucleic acid metabolism.

2.4. The Susceptibilities of Sub-MIC OLA-Induced Resistants against Other Antimicrobial Agents

The MICs for the wildtype, 1/2× MIC and 1/10× MIC OLA induced 8× MIC OLA resistant E. coli ATCC25922, against other antimicrobial agents were determined using the broth micro-dilution method [17]. As shown in Table 4, 1/2× MIC OLA treated group and1/10× MIC OLA treated group had reduced sensitivity to ampicillin, florfenicol, compound sulfamethoxazole (Sulfamethoxazole +Trimethoprim), and acetylquine. There was no change in the sensitivity of resistant bacteria to augmentin (Amoxicillin + Clavulanic acid), tetracycline, spectinomycin, ceftiofur, ceftazidime, enrofloxacin, ofloxacin, meropenem, and apramycin. However, the sensitivity of resistant bacteria to colistin has increased.

3. Discussion

3.1. Phenotype Characteristics of Sub-MIC Antimicrobial-Induced Bacterial Resistance

The previous study has demonstrated that two-fold ascended concentrations of OLA(from 1/2× MIC to 4× MIC) can contribute to the selection and maintenance of OLA-resistant bacteria against 16× MIC OLA in 20 days [13]. However, in this study, under sub-MIC concentrations of OLA (from 1/100× MIC to 1/2× MIC), bacteria took a longer time (60 days) to enrich resistants, with maximum resistant level of only 8× MIC (Figure 1). The step-wise selection by an antibacterial at concentration above MIC will enrich the existing resistant sub-population that acquire resistance by mutation or horizontal gene transfer, while sub-MIC selection can also drive the emergence of de novo resistant mutants [21], by increasing the mutation rate or stimulating the horizontal gene transfer in susceptive bacteria which do not die in sub-MIC concentrations [22]. Moreover, for the resistant mutants that already exist in the population, the sub-MIC concentration would enrich those with less fitness cost than the susceptive counterpart [10]. So, the exposure level of drug in clinical settings will influence the speed and the level of bacterial resistance development.
It has been demonstrated that stress responses gene soxS and type I fimbriae gene (fimG), metabolism gene (metK) were differentially expressed in all E. coli biofilm studies [23]. bssR, encoding a biofilm regulator, was discovered for the induction of biofilms in E. coli [24]. In this study, soxS and bssR as well as many carbon catabolism related genes were up-regulated in the OLA induced resistant bacteria (Table 1). Especially, the bssR gene was up-regulated by 2 times in the 1/2× MIC treated group and five times in the 1/10× MIC group, which was consistent with the amount of biofilm formation (Figure 2).
A phenomenon termed collateral sensitivity, whereby resistance to one antimicrobial simultaneously increases the susceptibility to another, was reported [25]. Collateral susceptibilities of mutants resistant to relevant antimicrobials against 16 antibiotics have been demonstrated, and it was shown that resistance mechanisms, in particular efflux-related mutations, as well as the relative fitness of resistant strains, are principal contributors to collateral responses [26]. Csaba et al also reported that various mechanisms of resistance, including target mutations and those mutations affecting drug uptake and efflux, are prone to induce collateral sensitivity [27]. Our data showed that resistance to OLA resulted in collateral responses to mequindox, ampicillin, compound sulfamethoxazole, florfenicol. However, the susceptibility to colistin of the OLA resistants decreased. The mechanism of action of mequindox is targeted to DNA and compound sulfamethoxazole affect the synthesis of folate. Florfenicol acts on the 50S ribosome of bacteria and amoxicillin inhibits the formation of bacterial cell walls. These results suggest that collateral susceptibility may be associated with antimicrobial resistance mechanism. The above results show that evolution of resistance towards a given antimicrobial agent frequently increases resistance to several other drugs. but it has remained unclear how frequently evolution of resistance increases sensitivity to other drugs. Cross-resistance profiles may be strongly correlated with drug resistance trajectories and the antibacterial mechanism of antibiotics. In addition, fitness costs may slow the evolution of the collateral responses.

3.2. Molecular Mechanism of Sub-MIC of QdNO-Induced Resistance

The PTS system located in the inner membrane is a multiprotein phosphorylation system that couples the transport of carbohydrates across the cytoplasmic membrane with their simultaneous phosphorylation. The global repressor Mlc regulates the expression of phosphoenolpyruvate: sugar phosphotransferase system (PTS) operon which is related to the uptake and utilization of sugars. It has been reported that mlc inhibits manXYZ, malT, ptsG, and pts operon, encoding enzyme II of the mannose PTS, the activator of maltose operon [28], enzyme IICB of the glucose PTS, and other PTS proteins, respectively. Our results showed that mutation appears among the mlc sequence, so the mlc may lose the ability of inhibiting manXYZ, malT, ptsG, and pts operon. MalT is a transcriptional regulator of the maltose regulon, which is involved in regulating the transport of maltose [29]. Under sub-MIC of OLA, it was shown that the expression of PTS system genes including mlc, manX, manY, manZ, ptsG, ptsH, ptsI, and non-PTS system gene malT were up-regulated. It can be speculated that the expression of the mannose phosphate transfer system is up-regulated, and the maltose transport system in the non-PTS is also more active. This indicates an increase in the uptake of carbon sources in resistant bacteria. Compared to the wild-type E. coli ATCC25922, some genes involved in glycolysis were up-regulated in the resistant bacteria induced by 1/2× MIC OLA, including fbaA (fructose-bisphosphate aldolase), fbaB (fructose-bisphosphate aldolase), and gap(glyceraldehyde 3-phosphate dehydrogenase). In 1/10× MIC OLA induced bacteria, there are also some genes involved in glycolysis up-regulated, including pgk (phosphoglycerate kinase), fbaA, pfkB (6-phosphofructokinase), ppsA (pyruvate, water dikinase), and gldA (glycerol dehydrogenase). Genes involved in pyruvate metabolic pathways, such as pfo (nifJ), were up-regulated. So, the pyruvate metabolism was up-regulated and produces more acetyl-CoA for the energy system. Moreover, many other metabolic pathways, such as glycine, histidine, and aspartate metabolism, were involved in the response to OLA as well. Genes involved in amino acid metabolism were also up-regulated, such as gcvP, zraS, and asnB. The metabolism of the major carbon and nitrogen substrates are afforded by multiple specific uptake systems and pathways. The genes involved in these pathways are controlled by both global and specific transcriptional regulators that may directly or indirectly sense key metabolites that are generated in the central carbon and nitrogen metabolic pathways [30]. Our study indicates that the metabolism of sugars and amino acids is enhanced in E. coli resistant to OLA, probably to remove oxidative damage and accelerate the synthesis of new substances to maintain the normal physiological function of the cells.
The adhE (aldehyde dehydrogenase) and icdA (isocitrate dehydrogenase) were up-regulated in this study, so the yield of NADPH increased. In the meantime, the over-expression of adhE increased the yield of acetaldehyde, thus reducing the amount of acetyl-CoA in the TCA cycle, resulting in the decrease of NADH/NAD ratio [31], playing a protective role against oxidative stress [32]. NifJ, a pyruvate ferredoxin (flavodoxin) oxidoreductase, catalyzes the oxidation of pyruvate to acetyl-coenzyme A and carbon dioxide in bacteria. It was revealed that NifJ can balance NADH-mediated process by regulating the NADH/NAD ratio [33], so the overexpressed of the nifJ gene also cause the reduction of NADH/NAD ratio. wrbA is a tryptophan repressor-binding protein that binds one molecule of flavin mononucleotide, which is involved in oxidative defense [34]. It appears to be a big electron acceptor pool to accommodate the electron of the electron donor, NADH or benzoquinone [35]. The CydAB quinol oxidases catalyze the reduction of oxygen by ubiquinol. cydB gene encodes a subunit of CydAB quinol oxidases, and the accumulation of NADH was prevented when the cydB mutated [36]. CydAB also play an important role in protection against oxidative stress by reducing H2O2 content [37]. nuoM and nuoI encode NADH:ubiquinone oxidoreductase, whose hydrophilic domain catalyzes transferring two electrons from NADH to quinone [38]. In the resistant bacteria induced by the sub-MIC of OLA in our study, adhE, nifJ, wrbA, cydB, nuoM, and nuoI were significantly up-regulated (Table 1). It was reported that QdNOs was metabolized by a reductase to produce free radicals in bacteria and this process also involved electron transfer [39]. Therefore, reducing the accumulation of NADH by decreasing the NADH/NAD ratio and increasing the NADPH/NADP ratio might be one of the mechanisms of QdNO resistance.
MarA, SoxS and Rob are three homologous transcriptional regulators of E. coli. These homologous regulators are part of multiple regulatory mechanisms necessary for the adaptive response, including changing pH, the presence of antibiotics, oxidative stressors, and organic solvents, all of which threaten survival [40]. The soxRS regulon is involved in oxidative stress response and also responsible for the resistance of E. coli to antibacterials [41,42]. Only the upregulation of SoxS was found in our study, but not MarA and Rob. The possible reason for this is that cross talk between the mar and sox systems is limited under physiological conditions. Previous study showed that the expression of SoxS is not expected to activate marRAB transcription in the absence of salicylate, when MarR still represses the promoter [42]. A previous study also showed that SoxR is regulated by NADPH-dependent reductases, an increased NADPH demand of the cell counteracts SoxR reduction and increases soxS expression [43]. Several genes encoding NADPH-dependent reductases were up-regulated, such as nuoG, nuoH, and nuoI. So, the up-regulation of these genes may cause the up-regulation of soxS. Previous study showed that the alkyl hydroperoxide reductase (AhpC) has the function of scavenging ROS and peroxides in variety of aerobic and anaerobic bacteria [44,45]. Previous research has suggested that the knockout of grxB gene, which encodes glutaredoxins ubiquitous protein, cause lower levels of oxidoreductase activity, resulting in the increased sensitivity to oxidative stress in E. coli [46]. Overproduction of the electron transfer subunits of formate dehydrogenases, encoded by the fdoH, fdoI, and fdnG, can enhance oxidative stress tolerance [47,48]. In our study, soxS, ahpC, grxB, fdoH, fdoI, and fdnG gene were up-regulated. Our previous study shows that QdNO-induced DNA damage is related to the yield of free radicals, and free radical scavengers can alleviate the bactericidal activity of cyadox [49]. Therefore, free radical scavenging and oxidative stress tolerance may be one of the mechanisms of QdNOs resistance.
umuC encodes polymerase V, a low-fidelity DNA polymerase, which has the ability to trigger a repair pathway during the SOS response to DNA damage [50]. The RusA protein is a DNA structure-specific endonuclease that resolves holliday junction intermediates formed during DNA repair [51]. RutG, a broad-specificity pyrimidine permease, is predicted to be a pyrimidine transporter [52]. Previous study demonstrated that the genes involved in DNA metabolic process and SOS response were downregulated, including dinB, umuC, recA, etc. [53]. In this study, DNA damage repair genes, umuC, rusA, and rutG were down-regulated. The resistant bacteria may resist DNA damage, but the susceptive bacteria can be damaged by antibiotics. Therefore, the expression of genes related to DNA repair in drug-resistant bacteria is down-regulated.
A total of 50 non-synonymous SNPs and indels were observed between the genomes of 8× MIC OLA resistant bacteria and the reference strain (NCBI accession No. GCF_000743255.1). IraD is a factor aiding the survival of proliferating E. coli cells against multiple forms of DNA damage, including oxidative stress [54]. CdiA secretion protein provides immunity and inhibits the bacterial growth by a significant down-regulation of metabolic parameters, such as aerobic respiration, steady-state ATP levels, etc. [55]. A previous study suggests that the Type VI Secretion System core component VgrG contributes to the antimicrobial resistance in A. baumannii ATCC19606 [56]. The gene ydeE encodes a multidrug-efflux transporter of E. coli which confers resistance to dipeptides [57]. Previous studies reported that the cytotoxicity of bactericidal antibacterials predominantly results from lethal double-strand DNA breaks caused by incomplete repair of 8-oxo-deoxyguanosine (8-oxo-dGTPase), which is encoded by mutT gene to prevent incorporation of base analogs into DNA [58]. iraD, cdiA, vgrG, ydeE, and mutT genes involved in DNA damage, bacteria growth and antimicrobial resistance were mutated in our study, which may be related to the resistance of QdNOs. Previous study demonstrates that CrfC protein, distributed in the nucleoid poles, helps sustain the colocalization of nascent DNA regions of sister replisomes and promote chromosome equipartitioning [59]. So, the CrfC might be involved in reactions necessary for chromosome stability and protect DNA damage.
Comparing the SNPs in the transcriptomic data (Table 2) with those in the genomic data (Table 3), six identical SNP genes were found. They are degQ, ks71A, vgrG, bigA, cusA, and DR76-4702. DegQ, a HtrA protease of the E. coli, is involved in the biosynthesis of outer membrane proteins [60,61]. ks71A encodes the fimbrial subunits of E. coli Ks71A, which is a hypothetical protein [62]. vgrG is a valine–glycine repeat G gene, previous study showed that the deletion of the vgrG gene, increased antimicrobial resistance to ampicillin/sulbactam, but reduced resistance to chloramphenicol [56]. The vgrG gene was mutated in the genome profiles. So, the vgrG gene might be related to OLA resistance. bigA encodes a putative surface-exposed virulence proteinin E. coli, and it also has been reported that the BigA protein acted as an adhesin protein of Brucella that mediates adhesion to epithelial cells [63]. CusA is an inner membrane proton-substrate carrier, responsible for transferring Cu(I) and Ag(I) ions [64]. The DR76-4702 gene has not been named, encoding a putative integral component of membrane. The outer membrane (OM) of Gram-negative bacteria performs the crucial role of providing an extra layer of protection to the organism, so the mutation of these genes provided a formidable barrier for bacteria to sustaining life.
A previous study has showed that the mechanism of an oxidative damage cellular death pathway involving the tricarboxylic acid cycle, a transient depletion of NADH, destabilization of iron-sulfur clusters, and stimulation of the Fenton reaction [65]. It was demonstrated that QdNOs genes and proteins involved in the bacterial metabolism, cellular structure maintenance, resistance and virulence were found to be changed, accompanying the SOS response and oxidative stress induced [49]. A previous study revealed that E. coli adapt the stress generated by QdNOs or develop specific QdNOs-resistance by the activation of antioxidative agent biosynthesis, protein biosynthesis, glycolysis, and oxidative phosphorylation [13]. Based on the mechanism of cell death induced by QdNOs and oxidative stress-mediated mode of action proposed for QdNOs in the above literature, it is supposed that the QdNOs resistance mechanism involved in outer membrane porin, efflux pump, the tricarboxylic acid (TCA) cycle, the oxidation of NADH, damage DNA repair and DNA replication and mutation of E.coli (Figure 5). The study only elaborated the resistance mechanism of E. coli to OLA at sub-inhibitory concentrations of OLA, and could not fully cover all the resistance mechanisms of OLA under concentrations above MIC. This study only studied the OLA resistance mechanism of QdNOs, which may not represent the resistance mechanism of all QdNOs. Therefore, it is necessary to study the resistance mechanism of other QdNOs.

4. Materials and Methods

4.1. Drugs, Bacteria and Growth Conditions

OLA (purity of 99.8%) was purchased from National Institutes for Food and Drug Control (Beijing, China). Enrofloxacin (ENR) was bought from China Institute of Pharmaceutical and Biological Products Inspection (Beijing, China). The standard solutions of drugs were prepared according to the manufacturer’s instruction at concentration of 1280 mg/L. E. coli ATCC25922 was purchased from China Center for Type Culture Collection (CCTCC). Mueller–Hinton broth, Mueller–Hinton agar (Mueller–Hinton broth supplemented with 1.5% agar) and Luria–Bertani (LB) agar was bought from HOPEBIO (Tsingtao, China). All other chemical reagents were of analytical grade.

4.2. Antimicrobial Susceptibility Testing

The MICs of antibacterials for wild-type and OLA-resistant E. coli ATCC25922 were determined using the broth micro-dilution method, according to the guidelines of the Clinical and Laboratory Standards Institute (CLSI) [66]. Specifically, 0.1 mL of two-fold serial dilutions of drugs were prepared and inoculated with 0.1 mL of bacterial overnight culture diluted into 5×10⁵ CFU/mL. The tubes were incubated at 37 °C with shaking for 16–18 hours, the OLA cultures protected from light to avoid degradation of the antibiotic. The MIC was defined as the lowest concentration of an antimicrobial able to completely inhibit the microbial growth, as described in the CLSI protocols.

4.3. In Vitro Selection of Resistant Bacteria under Sub-Inhibitory Concentrations of OLA

To select for de novo generated resistant mutants at sub-MICs of OLA, a single colony of E. coli ATCC25922 was transferred into 5 mL of Mueller–Hinton broth and incubated at 37 °C overnight. Fresh cultures of bacteria were serially passaged by 1000-fold dilution in 5 mL batch cultures every 24 hours for 600 generations (60 passages, 10 generations per passage) in Mueller-Hinton medium containing OLA at concentrations of 1/2× MIC (4 μg/mL), 1/4× MIC (2 μg/mL), 1/10× MIC (0.8 μg/mL), and 1/100× MIC (0.08 μg/mL) or ENR at concentrations of 1/2× MIC (0.0075 μg/mL), 1/4× MIC (0.00375 μg/mL), 1/10× MIC (0.0015 μg/mL), and 1/100× MIC (0.00015 μg/mL) respectively, and the untreated E. coli culture was used as control. The liquid cultures were grown at 37 °C under aerobic conditions without shaking [10]. For every 100 generations of the bacteria culture, the number of colonies was counted, and the percentage of resistant cells in each culture was monitored by plating approximately 105 cells onto LB agar containing different concentrations of OLA or ENR as control (2× MIC, 4× MIC, 8× MIC, and 16× MIC). A subset of these cells was restreaked on the same antibiotic concentration to confirm that they were resistants.

4.4. Bacterial Morphology Observation and Biofilm Detection

To investigate the morphological changes of bacteria under sub-MIC of antimicrobial drugs, E. coli ATCC25922 induced by 1/2× MIC OLA and 1/2× MIC ENR as well as untreated group were observed by scanning electron microscopy. Immobilization, embedding, sectioning, staining and observation of bacterial samples were carried out as previously described [67]. Bacteria (about 106 CFU/mL) were harvested by centrifugation, washed twice with 0.1 M PBS (pH 7.4), and fixed in 0.2% glutaraldehyde in 0.1 M cacodylate buffer at 4 °C for 4 h, and then fixed in the perfluorocarbon containing 1% osmium tetroxide for 1 h. After three rinses in pure perfluorocarbon, the samples were dehydrated, embedded, sectioned, stained, and imaged with a TEM (H-7650, Japan) as previously described [68].
The method of biofilm formation detection of bacteria at various stages induced by 1/2× MIC, 1/4× MIC, 1/10× MIC, and 1/100× MIC of OLA was as follows [69]. After overnight incubation to logarithmic growth phase, the cultures were diluted to 0.5 McFarland standards in broth medium, respectively. A volume of 200 μL bacterial cultures was transferred to each well of a 96-well plate, and bacterial biofilms were formed followed by incubation at 37°C for 24 h with no movement. After discarding the medium and rinsing the wells of the 96-well plate 3 times with sterile PBS solution, the biofilms were placed in a 0.1% (wt/vol) crystal violet solution for 15 min, rinsed again, and dried for several hours. To solubilize the adsorbed crystal violet, wells with stained biofilms were incubated in 30% acetic acid for 15 min. The absorbance was read at 590 nm on a microplate reader (Thermo Fisher Scientific, Shanghai, China).

4.5. RNA Sequencing Analysis

4.5.1. RNA Extraction, Cdna Library Construction and Sequencing

The total RNA of resistant E. coli ATCC 25922 induced by 1/2× MIC and 1/10× MIC OLA and exhibiting a MIC of 64 μg/mL (equal to 8× MIC of wild-type susceptive strain) was extracted using a bacterial RNAprep Pure Plant Kit (Tiangen, Beijing, China), following the manufacturer’s instructions. The concentration and purity of total RNA were measured on an Agilent 2100 Bioanalyzer (Agilent Technologies, Santa Clara, USA). Equal amounts of the total RNA from three replicates of untreated group (Group B), 1/2× MIC OLA-treated group (Group C) and 1/10× MIC OLA-treated group (Group D) were pooled for RNA-Seq library construction. The mRNA was enriched from qualified total RNA using Oligo(dT) magnetic beads and fragmented chemically into small pieces at high temperature. Then, the first cDNA strand was synthesized by using random hexamers for reverse transcription with cleaved RNA fragments serving as templates, followed by second-strand cDNA synthesis using DNA polymerase I and RNase H. The double-strand cDNA then went through purification, end repair process, the addition of a single “A” base and ligation of the adapters, and was finally enriched by PCR implication to be ready for sequencing via Illumina HiSeq™ 2000 (Personalbio technology Co. Ltd., Shanghai, China).

4.5.2. Transcriptome Assembly and Gene Functions Annotation

A total of 39.0 GB raw data was obtained from nine samples via Illumina system. Clean reads were obtained after removing adapter sequences, filtering low-quality reads, and removing reads with an N ratio of greater than 5% from the raw reads. Each sample had more than 89.67% of clean data, with Q30 values greater than 90.03%. After adaptor sequences, ambiguous reads, and low-quality reads were removed, the sequence data were assembled with Trinity software [70]. RNA sequence reads were independently aligned with the genome sequence of E. coli ATCC 25922 (NCBI accession number GCF_000743255.1). Gene function was annotated based on the following databases: Nr (NCBI non-redundant protein sequences); Nt (NCBI non-redundant nucleotide sequences); Pfam (Protein family); COG (Clusters of Orthologous Groups of proteins); Swiss-Prot (A manually annotated and reviewed protein sequence database); KO (KEGG Ortholog database); and GO (Gene Ontology). Principal component analysis was performed using the R statistical computing package [71]. Gene ontology analysis was performed by Blast2GO through searching the above databases [72]. The GO terms assign biological process, molecular function, and cellular component to the query sequences. KEGG analysis was performed using the online KEGG Automatic Annotation Server (KAAS; http://www.genome.jp/kegg/kaas) to obtain an overview of gene pathways networks.

4.5.3. Detection of DEGs

Gene expression was analyzed by DESeq (version 1.18.0). The screening conditions for DEGs included expression fold difference of log2|fold change| > 1 and significance of p-value <0.05.

4.5.4. Identification of Antimicrobial Resistant Genes

The set of resistance-associated genes was downloaded from the Antibiotic Resistance Genes Database (http://ardb.cbcb.umd.edu/). DEGs were annotated using the tool retrieved from the same web site, which was performed based on a homology search by BLASTp. The cutoff parameters used in this study were E-value <1e−5 and nucleotide sequence identity >50 %.

4.6. Genomic Sequencing Analysis

4.6.1. DNA Preparation, DNA Library Construction and Sequencing

Genomic DNA of resistant E. coli ATCC 25922 induced by 1/2× MIC of OLA and exhibiting a MIC of 64 μg/mL(equal to 8× MIC for wild-type susceptive strain) was extracted using a bacterial genomic DNA purification kit (Tiangen Biotech Co., Ltd., Beijing, China) according to the manufacturer’s instructions. DNA was quantified using a NanoDrop ND-1000 spectrophotometer (NanoDrop Technologies, Wilmington, DE, USA). The isolated DNA was stored at –80 °C until use. Whole-genome sequencing was carried out using the PacBio Sequel platform (Frasergen Co. Ltd., Wuhan, China). A quantity of 5 μg input genomic DNA was used for 10 kb fragment library preparation. DNA was sheared with g-TUBE1 microcentrifuge tubes (Covaris, Woburn, MA) and SMRTbell libraries prepared with DNA Template Kit 2.0 (Pacific Biosciences, Menlo Park, CA). Sequencing primers were annealed to the SMRTbell template and samples were sequenced using C3 chemistry, Polymerase (version 5), SMRTAnalysis software (version 2.3.0), and a single SMRT cell (Pacific Biosciences, Menlo Park, CA). Raw read quality and average reference consensus were determined using SMRT Analysis software (version 2.3.0).

4.6.2. Genome Assembly and Annotation

Filtered reads were obtained from PacBio raw data using SMRT Analysis and were assembled by applying the Canu protocol [73]. The assembled genome sequence was annotated by the Institute for Genomic Research database, using the programs Glimmer (version 3.02) for the identification of protein-coding genes [74], tRNAscan-SE for the identification of tRNA genes [75], and RNAmmer for the identification of rRNA genes [76]. The non-coding RNA were identified using the Rfam (version 12.0) and Infernal [77]. Short tandem repeat and simple sequence repeats were identified by trf407b.linux [78], and clustered regularly interspaced short palindromic repeats (CRISPRs) were identified using CRISPRs in Environmental Datasets [79].

4.7. Statistical Analysis

All statistical analyses were performed using GraphPadPrism software (GraphPad Software Inc., LaJolla, CA, USA) with all data represented as the mean ± standard deviation (SD) from at least three independent experiments. Data analyses were performed using the t-test or one-way analysis of variance (ANOVA), and a p-value less than 0.05 was considered statistically significant.

5. Conclusions

Our data show the evolution of resistance of E. coli de novo selected by sub-MIC concentrations of OLA, and provide a reference predicting collateral sensitivity informed therapy. QdNOs are redox-activated, hypoxia-selective DNA-cleaving agents [80]. The oxidative DNA-damaging effects of QdNOs will stimulate the SOS response, oxidative stress, and other protection strategies in bacteria. Combined with the previous study of the QdNOs resistance mechanisms [20], we further elaborated the molecular mechanism of QdNOs resistance under sub-MIC. The intake of QdNOs was first reduced by adjusting the expression of membrane porin and efflux pumps and mutations in efflux pump genes, mainly including ompD and acrB. When the QdNOs enters the bacterial cell, it stimulates the bacteria to feedback by regulating the electron transport chains, resulting in the production and consumption of NADH to reduce the production of free radicals. The main genes involved in this process are soxS, malT, nouM, nouN, and icdA. When an oxidative stress reaction occurs, the free radicals were cleared by regulating the expression of certain redox genes and genes involved in DNA repair, involving genes of soxS, umuC, iraD, ahpC, wrbA, and rusA. The bacteria cell division was halted when exposed to CYA [25], so the mutations in the crfC gene, which is involved in bacterial replication, may be another key gene of QdNOs resistance. The deeper molecular mechanism involved in the origin of resistance development selected by QdNOs should be explored. Further studies are required to investigate the signaling pathway of the origin of the QdNOs resistance. Targeting the key molecular actors involved in the gene expression and inhibiting the mutagenic pathways of the emergence of resistance could be a key strategy to slow down the emergence of antibacterial resistance.

Supplementary Materials

The following are available online at https://0-www-mdpi-com.brum.beds.ac.uk/2079-6382/9/11/791/s1, Figure S1: Resistance rates of E. coli ATCC25922 exposed to ENR at sub-MIC concentrations of 1/2× MIC (A), 1/4× MIC (B), 1/10× MIC (C) and 1/100× MIC (D), Figure S2. Scanning electron micrograph of E. coli ATCC25922 induced by none (A), 1/2× MIC ENR (B) and 1/2× MIC OLA(C)., Figure S3. Correlation tests for 9 samples (triplicates in each group) of the untreated (group B), 1/2× MIC (group C) and 1/10× MIC OLA (group D) -treated E. coli ATCC25922. The abscissa and ordinate in the figure are sample numbers. The closer the block value is to 1, the higher the similarity is., Figure S4. Venn diagrams of DEGs. The numbers in each circle represents the total number of DEGs in the comparison combination, and the overlapping part of the circles represents the DEGs shared between the comparison groups. B, untreated group; C, 1/2× MIC OLA-treated group; D, 1/10× MIC OLA-treated group., Figure S5. The genome of 1/2× MIC OLA induced E. coli ATCC25922 resistant to 8× MIC OLA. The circles from outermost to innermost indicated the scale, GC content (red: > average value, blue: < average value), GC skew (purple: >0, orange: <0), noncoding RNA (tRNA in black, rRNA in red), minus-stranded CDS maps, plus-stranded CDS maps, minus-stranded base-modified map (full red circle), plus-stranded base-modified map (full blue circle), gene map of the restriction modification system, respectively., Figure S6. Protein length distribution of the genome of OLA resistant E. coli ATCC25922., Figure S7. COG function classification of OLA resistant E. coli ATCC25922. The abscissa is the group of the COG, and the ordinate is the number of genes annotated to the group., Figure S8. GO function annotation of OLA resistant E. coli ATCC25922. The ordinate is the three major classes of the GO term including biological processes, cellular components, and molecular functions, the abscissa is the number of genes annotated to the term (including the term of the term)., Figure S9. KEGG functions annotation of OLA resistant E. coli ATCC25922. The ordinate is the name of the KEGG metabolic pathway, and the abscissa is the number of genes annotated to the pathway. The genes are divided into five branches according to the involved KEGG metabolic pathway including Cellular Processes, Environmental Information Processing, Genetic Information Processing, Metabolism, and Organic Systems., Table S1: Table S1. Data Filtering Statistics, Table S2. RNASeq Map Statistics., Table S3. Reference genome annotation information statistics., Table S4. Number of differentially expressed genes between groups B and C., Table S5. Differentially expressed genes between groups B and D.

Author Contributions

Conceived and designed the experiments: Y.G. and G.C. Performed the experiments: Y.G., S.W., W.S., J.H., and L.H. Analyzed the data: Y.G., S.W., G.C., and J.L. Contributed reagents/materials/analysis tools: M.D. and G.C. Wrote the paper: Y.G., S.W., L.H., and G.C. All authors have read and agreed to the published version of the manuscript.

Funding

This work was supported by the National Natural Science Foundation of China (32072921; 31502115) and the National Key R&D Program of China (2018YFD0500300).

Conflicts of Interest

The authors declare that the research was conducted in the absence of any commercial or financial relationships that could be construed as a potential conflict of interest.

Abbreviations

CFUColony-Forming Units
DEGsDifferentially expressed genes
E. coliEscherichia coli
ENREnrofloxacin
MICMinimum inhibitory concentration
NADHNicotinamide adenine dinucleotide
OLAOlaquindox
PEPphosphoenolpyruvate
PTSPhosphoenolpyruvate-sugar phosphotransferase system
QdNOsQuinoxaline1,4-di-N-oxides
SNPSingle Nucleotide Polymorphisms
SSH PCRSuppression subtractive hybridization polymerase chain reaction
Sub-MICSub-inhibitory concentration
TCAtricarboxylic acid cycle

References

  1. Woolhouse, M.E.J.; Waugh, C.; Perry, M.R.; Nair, H. Global disease burden due to antibiotic resistance—State of the evidence. J. Glob. Health 2016, 6, 010306. [Google Scholar] [CrossRef] [PubMed]
  2. Julian, D.; Spiegelman, G.B.; Grace, Y. The world of subinhibitory antibiotic concentrations. Curr. Opin. Microbiol. 2006, 9, 445–453. [Google Scholar]
  3. D’Costa, V.M.; King, C.E.; Lindsay, K.; Mariya, M.; Sung, W.W.L.; Carsten, S.; Duane, F.; Grant, Z.; Fabrice, C.; Regis, D. Antibiotic resistance is ancient. Nature 2011, 477, 457–461. [Google Scholar] [CrossRef]
  4. Dan, I.A.; Diarmaid, H. Microbiological effects of sublethal levels of antibiotics. Nat. Rev. Microbiol. 2014, 12, 465. [Google Scholar]
  5. Hao, H.H.; Cheng, G.Y.; Iqbal, Z.; Ai, X.H.; Hussain, H.I.; Huang, L.L.; Dai, M.H.; Wang, Y.L.; Liu, Z.L.; Yuan, Z.H. Benefits and risks of antimicrobial use in food-producing animals. Front. Microbiol. 2014, 5, 288. [Google Scholar] [CrossRef] [PubMed] [Green Version]
  6. Zeynep, B.; Didier, M. SOS, the formidable strategy of bacteria against aggressions. FEMS Microbiol. Rev. 2015, 38, 1126–1145. [Google Scholar]
  7. Dan, I.A.; Hughes, D. Evolution of antibiotic resistance at non-lethal drug concentrations. Drug Resist. Updat. 2012, 15, 162–172. [Google Scholar]
  8. Diarmaid, H.; Dan, I.; Andersson, J. Selection of resistance at lethal and non-lethal antibiotic concentrations. Curr. Opin. Microbiol. 2012, 15, 555–560. [Google Scholar]
  9. Laureti, L.; Matic, I.; Gutierrez, A.J.A. Bacterial Responses and Genome Instability Induced by Subinhibitory Concentrations of Antibiotics. Antibiotics 2013, 2, 100–114. [Google Scholar] [CrossRef] [Green Version]
  10. Erik, G.; Sha, C.; Berg, O.G.; Carolina, I.C.; Linus, S.; Diarmaid, H.; Dan, I.A. Selection of resistant bacteria at very low antibiotic concentrations. PLoS Pathog. 2011, 7, e1002158. [Google Scholar]
  11. Cairns, J.; Becks, L.; Jalasvuori, M.; Hiltunen, T. Sublethal streptomycin concentrations and lytic bacteriophage together promote resistance evolution. Philos. Trans. R Soc. Lond. B Biol. Sci. 2016, 372, 20160040. [Google Scholar] [CrossRef] [Green Version]
  12. Carta, A.; Corona, P.; Loriga, M. Quinoxaline 1,4-Dioxide: A Versatile Scaffold Endowed With Manifold Activities. Curr. Med. Chem. 2005, 12, 2259–2272. [Google Scholar] [CrossRef] [PubMed]
  13. Guo, W.; Hao, H.; Dai, M.; Wang, Y.; Huang, L.; Peng, D.; Wang, X.; Wang, H.; Yao, M.; Sun, Y.J.P.O. Development of quinoxaline 1, 4-dioxides resistance in Escherichia coli and molecular change under resistance selection. PLoS ONE 2012, 7, e43322. [Google Scholar] [CrossRef] [PubMed]
  14. Duan, Z.; Yi, J.; Fang, G.; Fan, L.; Wang, S.J.F.C. A sensitive and selective imprinted solid phase extraction coupled to HPLC for simultaneous detection of trace quinoxaline-2-carboxylic acid and methyl-3-quinoxaline-2-carboxylic acid in animal muscles. Food Chem. 2013, 139, 274–280. [Google Scholar] [CrossRef] [PubMed]
  15. Prevalence and patterns of antimicrobial resistance of fecal Escherichia coli among pigs on 47 farrow-to-finish farms with different in-feed medication policies in Ontario and British Columbia. Can. J. Vet. Res. Rev. Can. Rech. Vet. 2008, 72, 195–201.
  16. Sørensen, A.H.; Hansen, L.H.; Johannesen, E.; Sørensen, S.J. Conjugative plasmid conferring resistance to olaquindox. Antimicrob. Agents Chemother. 2003, 47, 798–799. [Google Scholar] [CrossRef] [Green Version]
  17. Hansen, L.H.; Johannesen, E.; Burmolle, M.; Sorensen, A.H.; Sorensen, S.J. Plasmid-Encoded Multidrug Efflux Pump Conferring Resistance to Olaquindox in Escherichia coli. Antimicrob. Agents chemother. 2004, 48, 3332–3337. [Google Scholar] [CrossRef] [Green Version]
  18. Hansen, L.H.; Jensen, L.B.; Sørensen, H.I.; Sørensen, S.J. Substrate specificity of the OqxAB multidrug resistance pump in Escherichia coli and selected enteric bacteria. J. Antimicrob. Chemother. 2007, 60, 145–147. [Google Scholar] [CrossRef] [PubMed]
  19. Haihong, H.; Weige, G.; Zahid, I.; Guyue, C.; Xu, W.; Menghong, D.; Lingli, H.; Yulian, W.; Dapeng, P.; Zhenli, L.; et al. Impact of cyadox on human colonic microflora in chemostat models. Regul. Toxicol. Pharmacol. 2013. [Google Scholar] [CrossRef]
  20. Suter, W.; Rosselet, A.; Knüsel, F. Chemotherapy. Mode of action of quindoxin and substituted quinoxaline-di-N-oxides on Escherichia coli. J. Antimicrob. Agents 1978, 13, 770. [Google Scholar]
  21. Lindgren, P.K.; Karlsson, A.; Hughes, D. Mutation Rate and Evolution of Fluoroquinolone Resistance in Escherichia coli Isolates from Patients with Urinary Tract Infections. Antimicrob. Agents Chemother. 2003, 47, 3222–3232. [Google Scholar] [CrossRef] [PubMed] [Green Version]
  22. Kohanski, M.A.; Depristo, M.A.; Collins, J.J. Sublethal Antibiotic Treatment Leads to Multidrug Resistance via Radical-Induced MutagPenesis. Mol Cell 2010, 37, 311–320. [Google Scholar] [CrossRef] [PubMed] [Green Version]
  23. Ren, D.; Bedzyk, L.A.; Thomas, S.M.; Ye, R.W.; Wood, T.K. Biotechnology. Gene expression in Escherichia coli biofilms. J. Appl. Microbiol. 2004, 64, 515–524. [Google Scholar]
  24. Joanna, D.; Jintae, L.; Wood, T.K.E. YliH (BssR) and YceP (BssS) regulate Escherichia coli K-12 biofilm formation by influencing cell signaling. J. Appl. Microbiol. 2006, 72, 2449. [Google Scholar]
  25. Szybalski, W.; Bryson, V. Genetic studies on microbial cross resistance to toxic agents. I. Cross resistance of Escherichia coli to fifteen antibiotics. J. Bacteriol. 1952, 64, 489. [Google Scholar] [CrossRef] [Green Version]
  26. Nicole, L.P.; Elizabeth, G.A.F.; Julia, K.; Sørum, V.; Primicerio, R.; Roberts, A.P.; Rozen, D.E.; Samuelsen, Ø.; Johnsen, P.J. Conserved collateral antibiotic susceptibility networks in diverse clinical strains of Escherichia coli. Nat. Commun. 2018, 1, 1–11. [Google Scholar]
  27. Pál, C.; Papp, B.; Lázár, V. Collateral sensitivity of antibiotic-resistant microbes. Trends Microbiol. 2015, 23, 401–407. [Google Scholar] [CrossRef] [Green Version]
  28. Plumbridge, J. Regulation of gene expression in the PTS in Escherichia coli: The role and interactions of Mlc. Curr. Opin. Microbiol. 2002, 5, 187–193. [Google Scholar] [CrossRef]
  29. Larquet, E.; Schreiber, V.; Boisset, N.; Richet, E.J.J.O.M.B. Oligomeric Assemblies of the Escherichia coli MalT Transcriptional Activator Revealed by Cryo-electron Microscopy and Image Processing. J. Mol. Biol. 2004, 343, 1159–1169. [Google Scholar] [CrossRef]
  30. Eisenreich, W.; Dandekar, T.; Heesemann, J.; Goebel, W.J.N.R.M. Carbon metabolism of intracellular bacterial pathogens and possible links to virulence. Nat. Rev. Microbiol. 2010, 8, 401–412. [Google Scholar] [CrossRef]
  31. Leonardo, M.R.; Dailly, Y.; Clark, D.P. Role of NAD in Regulating the adhE Gene of Escherichia coli. J. Bacteriol. 1996, 178, 6013–6018. [Google Scholar] [CrossRef] [PubMed] [Green Version]
  32. Echave Lozano, P.; Tamarit Sumalla, J.; Cabiscol Català, E.; Ros Salvador, J. Novel Antioxidant Role of Alcohol Dehydrogenase E from Escherichia coli. J. Biol. Chem. 2003, 278, 30193–30198. [Google Scholar] [CrossRef] [PubMed] [Green Version]
  33. McNeely, K.; Yu, X.; Ananyev, G.; Bennette, N.; Bryant, D.A.; Dismukes, G.C. Synechococcus sp. strain PCC 7002 nifJ mutant lacking pyruvate: Ferredoxin oxidoreductase. Appl. Environ. Microbiol. 2011, 77, 2435–2444. [Google Scholar] [CrossRef] [PubMed] [Green Version]
  34. Patridge, E.V.; Ferry, J.G. WrbA from Escherichia coli and Archaeoglobus fulgidus is an NAD(P)H:quinone oxidoreductase. J. Bacteriol. 2006, 188, 3498–3506. [Google Scholar] [CrossRef] [Green Version]
  35. Wolfova, J.; Smatanova, I.J.; Mesters, J.R.; Lapkouski, M.; Kuty, M.; Natalello, A.; Chatterjee, N.; Chern, S.Y.; Ebbel, E.; Ricci, A. Structural organization of WrbA in apo- and holoprotein crystals. Biochim. Et Biophys. Acta Proteins Proteom. 2009, 1794, 1288–1298. [Google Scholar] [CrossRef]
  36. Mark, S.; Guido, S.; Cook, G.M.; Poole, R.K. Compensations for diminished terminal oxidase activity in Escherichia coli: Cytochrome bd-II-mediated respiration and glutamate metabolism. J. Biol. Chem. 2010, 285, 18464–18472. [Google Scholar]
  37. Alessandro, G.; Borisov, V.B.; Marzia, A.; Paolo, S.; Elena, F. Cytochrome bd oxidase and bacterial tolerance to oxidative and nitrosative stress. Biochim. Biophys. Acta 2014, 1837, 1178–1187. [Google Scholar]
  38. Friedrich, T.; Dekovic, D.K.; Burschel, S. Assembly of the Escherichia coli NADH: Ubiquinone oxidoreductase (respiratory complex I). Bba Bioenerg. 2016, 1857, 214–223. [Google Scholar] [CrossRef]
  39. Chen, C.; Cheng, G.; Hao, H.; Dai, M.; Wang, X.; Huang, L.; Liu, Z.; Yuan, Z. Mechanism of Porcine Liver Xanthine Oxidoreductase Mediated N-Oxide Reduction of Cyadox as Revealed by Docking and Mutagenesis Studies. PloS ONE 2013, 8, e73912. [Google Scholar] [CrossRef] [Green Version]
  40. Semchyshyn, H.; Bagnyukova, T.; Lushchak, V. Involvement of soxRS regulon in response of Escherichia coli to oxidative stress induced by hydrogen peroxide. Biochem. Biokhimiia 2005, 70, 1238–1244. [Google Scholar] [CrossRef]
  41. Chubiz, A.; Glekas, G.D.; Rao, C.V. Transcriptional Cross Talk within the mar-sox-rob Regulon in Escherichia coli Is Limited to the rob and rnarRAB Operons. J. Bacteriol. 2012, 194, 4867–4875. [Google Scholar] [CrossRef] [PubMed] [Green Version]
  42. Valérie Duval, I.M.L. MarA, SoxS and Rob of Escherichia coliGlobal regulators of multidrug resistance, virulence and stress response. Int. J. Biotechnol. Wellness Ind. 2013, 2, 101. [Google Scholar]
  43. Siedler, S.; Schendzielorz, G.; Binder, S.; Eggeling, L.; Bringer, S.; Bott, M. SoxR as a Single-Cell Biosensor for NADPH-Consuming Enzymes in Escherichia coli. ACS Synthetic Biol. 2014, 3, 41–47. [Google Scholar] [CrossRef] [PubMed]
  44. Michael, R.; Jacques, M.; Poole, L.B. An NADH-dependent bacterial thioredoxin reductase-like protein in conjunction with a glutaredoxin homologue form a unique peroxiredoxin (AhpC) reducing system in Clostridium pasteurianum. Biochemistry 2002, 41, 1990–2001. [Google Scholar]
  45. Guimar, B.G.; Hélène, S.; Nadine, H.; Brigitte, S.J.; Roland, B.; William, S.; Cole, S.T.; Alzari, P.M. Structure and mechanism of the alkyl hydroperoxidase AhpC, a key element of the Mycobacterium tuberculosis defense system against oxidative stress. J. Biol. Chem. 2005, 280, 25735. [Google Scholar]
  46. Alexios, V.G.; Aristi, P.; Raz, Z.; Ayala, H.; Arne, H. Characterization of Escherichia coli null mutants for glutaredoxin 2. J. Biol. Chem. 2002, 277, 10861–10868. [Google Scholar]
  47. Iwadate, Y.; Funabasama, N.; Kato, J.I. Involvement of formate dehydrogenases in stationary phase oxidative stress tolerance in Escherichia coli. FEMS Microbiol. Lett. 2017, 364, fnx193. [Google Scholar] [CrossRef]
  48. Thomas, S.C.; Alhasawi, A.; Auger, C.; Omri, A.; Appanna, V.D. The role of formate in combatting oxidative stress. Antonie Van Leeuwenhoek 2016, 109, 263–271. [Google Scholar] [CrossRef]
  49. Cheng, G.; Li, B.; Wang, C.; Zhang, H.; Liang, G.; Weng, Z.; Wang, X.; Liu, Z.; Dai, M. Systematic and Molecular Basis of the Antibacterial Action of Quinoxaline 1,4-Di-N-Oxides against Escherichia coli. PloS ONE 2015, 10, e0136450. [Google Scholar]
  50. Kuban, W.; Vaisman, A.; Mcdonald, J.P.; Karata, K.; Yang, W.; Goodman, M.F.; Woodgate, R. Escherichia coli UmuC active site mutants: Effects on translesion DNA synthesis, mutagenesis and cell survival. DNA Repair 2012, 11, 726–732. [Google Scholar] [CrossRef] [Green Version]
  51. Lilley, D.M.; White, M.F. Resolving the relationships of resolving enzymes. J. Proc. Natl. Acad. Sci. USA 2000, 97, 9351–9353. [Google Scholar] [CrossRef] [PubMed] [Green Version]
  52. Botou, M.; Lazou, P.; Papakostas, K.; Lambrinidis, G.; Evangelidis, T.; Mikros, E.; Frillingos, S. Insight on specificity of uracil permeases of the NAT/NCS2 family from analysis of the transporter encoded in the pyrimidine utilization operon of Escherichia coli. Mol. Microbiol. 2018, 108, 204–219. [Google Scholar] [CrossRef] [PubMed] [Green Version]
  53. Nadine, H.N.; J Merijn, S.; Stanley, B.; Kuile, B.H. Chemotherapy. Compensation of the metabolic costs of antibiotic resistance by physiological adaptation in Escherichia coli. J. Antimicrob. Agents 2013, 57, 3752–3762. [Google Scholar]
  54. Zheng, M.; Wang, X.; Templeton, L.J.; Smulski, D.R.; Larossa, R.A.; Storz, G. DNA microarray-mediated transcriptional profiling of the Escherichia coli response to hydrogen peroxide. J. Bacteriol. 2001, 183, 4562–4570. [Google Scholar] [CrossRef] [Green Version]
  55. Aoki, S.K.; Webb, J.S.; Braaten, B.A.; Low, D.A. Contact-dependent growth inhibition causes reversible metabolic downregulation in Escherichia coli. J. Bacteriol. 2009, 191, 1777–1786. [Google Scholar] [CrossRef] [Green Version]
  56. Wang, J.; Zhou, Z.; He, F.; Ruan, Z.; Jiang, Y.; Hua, X.; Yu, Y. The role of the type VI secretion system vgrG gene in the virulence and antimicrobial resistance of Acinetobacter baumannii ATCC 19606. PLoS ONE 2018, 13, e0192288. [Google Scholar] [CrossRef] [PubMed] [Green Version]
  57. Mikiro, H.; Kazuhiko, T.; Makoto, Y.; Yoshiyuki, Y. Effect of multidrug-efflux transporter genes on dipeptide resistance and overproduction in Escherichia coli. FEMS Microbiol. Lett. 2010, 304, 12–19. [Google Scholar]
  58. Foti, J.J.; Babho, D.; Winkler, J.A.; Collins, J.J.; Walker, G.C. Oxidation of the guanine nucleotide pool underlies cell death by bactericidal antibiotics. Science 2012, 336, 315–319. [Google Scholar] [CrossRef] [PubMed] [Green Version]
  59. Ozaki, S.; Matsuda, Y.; Keyamura, K.; Kawakami, H.; Noguchi, Y.; Kasho, K.; Nagata, K.; Masuda, T.; Sakiyama, Y.; Katayama, T. A replicase clamp-binding dynamin-like protein promotes colocalization of nascent DNA strands and equipartitioning of chromosomes in E. coli. Cell Rep. 2013, 4, 985–995. [Google Scholar] [CrossRef] [Green Version]
  60. Volokhina, E.B.; Jan, G.; Michiel, S.; Ingrid, S.; Jan, T.; Bos, M.P. Role of the periplasmic chaperones Skp, SurA, and DegQ in outer membrane protein biogenesis in Neisseria meningitidis. J. Bacteriol. 2011, 193, 1612. [Google Scholar] [CrossRef] [Green Version]
  61. Justyna, S.; Hélène, M.; Tobias, K.; Flavia, C.; Michael, E.; Tim, C. Molecular adaptation of the DegQ protease to exert protein quality control in the bacterial cell envelope. J. Biol. Chem. 2011, 286, 30680–30690. [Google Scholar]
  62. Rhen, M.; Van Die, I.; Rhen, V.; Bergmans, H. Comparison of the nucleotide sequences of the genes encoding the KS71A and F7(1) fimbrial antigens of uropathogenic Escherichia coli. Eur. J. Biochem 2010, 151, 573–577. [Google Scholar] [CrossRef]
  63. Czibener, C.; Merwaiss, F.; Guaimas, F.; Del Giudice, M.G.; Serantes, D.A.; Spera, J.M.; Ugalde, J.E. BigA is a novel adhesin of Brucella that mediates adhesion to epithelial cells. Cell Microbiol. 2016, 18, 500–513. [Google Scholar] [CrossRef] [Green Version]
  64. Meir, A.; Abdelhai, A.; Moskovitz, Y.; Ruthstein, S. EPR Spectroscopy Targets Structural Changes in the E.coli Membrane Fusion CusB upon Cu(I) Binding. Biophys. J. 2017, 112, 2494–2502. [Google Scholar] [CrossRef] [Green Version]
  65. Kohanski, M.A.; Dwyer, D.J.; Hayete, B.; Lawrence, C.A.; Collins, J.J. A Common Mechanism of Cellular Death Induced by Bactericidal Antibiotics. Cell 2007, 130, 797. [Google Scholar] [CrossRef] [PubMed] [Green Version]
  66. Clinical and Laboratory Standards Institute. Method for Dilution Antimicrobial Susceptibility Test for bacteria that grow aerobically. In Approved Standard, 8th ed.; CLSI: Annapolis Junction, MD, USA, 2009. [Google Scholar]
  67. Xu, F.; Cheng, G.; Hao, H.; Wang, Y.; Wang, X.; Chen, D.; Peng, D.; Liu, Z.; Yuan, Z.; Dai, M. Mechanisms of Antibacterial Action of Quinoxaline 1,4-di-N-oxides against Clostridium perfringens and Brachyspira hyodysenteriae. Front. Microbiol. 2016, 7, 1948. [Google Scholar] [CrossRef] [PubMed] [Green Version]
  68. Amit, K.T.; Danka, B.; Davide, G.; Milan, V.; Maria Elisabetta, G.; Anushree, M.; Marin, P.D. Antimicrobial Potential and Chemical Characterization of Serbian Liverwort (Porella arboris-vitae): SEM and TEM Observations. Evid. Based Complement. Altern. Med. 2013, 2013, 382927. [Google Scholar]
  69. Moskowitz, S.M.; Foster, J.M.; Julia, E.; Burns, J.L. Clinically feasible biofilm susceptibility assay for isolates of Pseudomonas aeruginosa from patients with cystic fibrosis. J. Clin. Microbiol. 2004, 42, 1915. [Google Scholar] [CrossRef] [Green Version]
  70. Grabherr, M.G.; Haas, B.J.; Moran, Y.; Levin, J.Z.; Thompson, D.A.; Ido, A.; Xian, A.; Lin, F.; Raktima, R.; Qiandong, Z. Full-length transcriptome assembly from RNA-Seq data without a reference genome. Nat. Biotechnol. 2011, 29, 644. [Google Scholar] [CrossRef] [Green Version]
  71. Jombart, T. adegenet: A R package for the multivariate analysis of genetic markers. Bioinformatics 2008, 24, 1403. [Google Scholar] [CrossRef] [Green Version]
  72. Aparicio, G.; Götz, S.; Conesa, A.; Segrelles, D.; Blanquer, I.; García, J.M.; Hernandez, V.; Robles, M.; Talon, M. Blast2GO goes grid: Developing a grid-enabled prototype for functional genomics analysis. Stud. Health Technol. Inform. 2006, 120, 194. [Google Scholar]
  73. Koren, S.; Walenz, B.P.; Berlin, K.; Miller, J.R.; Bergman, N.H.; Phillippy, A.M. Canu: Scalable and accurate long-read assembly via adaptive k-mer weighting and repeat separation. Genome Res. 2017, 27, 722. [Google Scholar] [CrossRef] [PubMed] [Green Version]
  74. Delcher, A.L.; Harmon, D.; Kasif, S.; White, O.; Salzberg, S.L. Improved microbial gene identification with GLIMMER. Nucleic Acids Res. 1999, 27, 4636–4641. [Google Scholar] [CrossRef] [PubMed]
  75. Lowe, T.M.; Eddy, S.R. tRNAscan-SE: A program for improved detection of transfer RNA genes in genomic sequence. Nucleic Acids Res. 1997, 25, 955–964. [Google Scholar] [CrossRef]
  76. Lagesen, K.; Hallin, P.; Rodland, E.; Staerfeldt, H.; Rognes, T.; Ussery, D. RNAmmer: Consistent and rapid annotation of ribosomal RNA genes. Nucleic Acids Res. 2007, 35, 3100. [Google Scholar] [CrossRef]
  77. Sam, G.J.; Simon, M.; Mhairi, M.; Ajay, K.; Eddy, S.R.; Alex, B. Rfam: Annotating non-coding RNAs in complete genomes. Nucleic Acids Res. 2005, 33, 121–124. [Google Scholar]
  78. Benson, G. Tandem repeats finder: A program to analyze DNA sequences. Nucleic Acids Res. 1999, 27, 573–580. [Google Scholar] [CrossRef] [Green Version]
  79. Bland, C.; Ramsey, T.L.; Sabree, F.; Lowe, M.; Brown, K.; Kyrpides, N.C.; Hugenholtz, P. CRISPR Recognition Tool (CRT): A tool for automatic detection of clustered regularly interspaced palindromic repeats. BMC Bioinform. 2007, 8, 209. [Google Scholar] [CrossRef] [Green Version]
  80. Cheng, G.; Sa, W.; Cao, C.; Guo, L.; Hao, H.; Liu, Z.; Wang, X.; Yuan, Z. Quinoxaline 1,4-di-N-Oxides: Biological Activities and Mechanisms of Actions. Front. Pharmacol. 2016, 7, 64. [Google Scholar] [CrossRef] [Green Version]
Figure 1. Resistance rates of E. coli ATCC25922 exposed to OLA at sub-MIC concentrations of 1/2× MIC (A), 1/4× MIC (B), 1/10× MIC (C) and 1/100× MIC (D).
Antibiotics 09 00791 g001
Figure 2. Biofilm formation of E. coli ATCC25922 induced by sub-MICs of OLA.
Antibiotics 09 00791 g002
Figure 3. Protein–protein interactions of E. coli ATCC25922 induced by sub-MICs of OLA generated following analysis of significantly different peptides input into the STRING database. The figure shows the protein–protein interactions networks that resulted from co-differentially expressed genes. “ Antibiotics 09 00791 i001” represent known interactions from curated databases, “ Antibiotics 09 00791 i002” represent known interactions have been experimentally determined; “ Antibiotics 09 00791 i003” represent predicted interactions of gene neighborhood, “ Antibiotics 09 00791 i004” represent predicted interactions of gene fusions, “ Antibiotics 09 00791 i005” represent predicted interactions of protein homology. “ Antibiotics 09 00791 i006” represent interactions of gene textmining, “ Antibiotics 09 00791 i007” represent predicted interactions of gene co-expression, “ Antibiotics 09 00791 i008” represent interactions of gene co-occurrence.
Antibiotics 09 00791 g003
Figure 4. Genome comparisons of the selective E. coli genome. The alignment between OLA-treated E. coli ATCC25922 genome (above) and reference E. coli ATCC25922 (NCBI accession No. GCF_000743255.1) (below) is displayed as one horizontal panel per input genome sequence. Colored blocks in the first genome are connected by lines to similarly colored blocks in the second genomes. These lines indicate which regions in each genome are homologous. When a block lies above the center line the aligned region is in the forward orientation relative to the first genome sequence. Blocks below the center line indicate regions that align in the reverse complement orientation. Inside each block Mauve draws a similarity profile of the genome sequence. The height of the similarity profile corresponds to the average level of conservation in that region of the genome sequence.
Antibiotics 09 00791 g004
Figure 5. The hyperthetical resistance mechanism involved in the development of QdNOs resistance. The decrease in the expression of the outer membrane porin gene ompD leads to the loss of OmpD protein, which reduces the intake of olaquindox. The up-regulation of multidrug resistance efflux pump gene acrB increases olaquindox efflux. The PTS systerm initiate a metabolic feedback dependent on tricarboxylic acid (TCA) cycle, stimulate the oxidation of NADH through the electron transport chain, promote superoxide formation, damage the structure of Fe-S clusters, lead to the formation of hydroxyl radicals and finally damage DNA; The Changes in the expression of genes umuC, rusA, and rutG trigger DNA repair; Changes in the expression of genes such as iraD, cdtA, vgrG, and ydeE cause gene mutations and affect DNA replication.
Antibiotics 09 00791 g005
Table 1. Co-differentially expressed genes in E. coli ATCC25922 induced by 1/2× MIC and 1/10× MIC of OLA.
Gene NameFunctionFoldchange of Gene Expression
(CvB)(DvB)
Up-Regulated Genes
1 Transcription Factors
malTLuxR family transcriptional regulator, maltose regulon positive regulatory protein6.298.50
soxSAraC family transcriptional regulator, mar-sox-rob regulon activator4.164.65
mlctranscriptional regulator of PTS gene4.023.15
2 Oxidoreductases
wrbANAD(P)H dehydrogenase (quinone)2.605.15
ahpCalkyl hydroperoxide reductase2.124.85
cydBcytochrome bd ubiquinol oxidase subunit II2.144.37
DR76_76oxidation-reduction process; coenzyme binding; oxidoreductase activity; mannitol metabolic2.603.68
adhEacetaldehyde dehydrogenase/alcohol dehydrogenase2.023.32
icdAisocitrate dehydrogenase2.803.09
nuoMNADH-quinone oxidoreductase subunit M2.303.07
nuoINADH-quinone oxidoreductase subunit N2.342.95
pfopyruvate-ferredoxin/flavodoxin oxidoreductase3.442.86
grxBglutaredoxin 22.062.83
fdoIformate dehydrogenase subunit gamma2.242.29
fdnGformate dehydrogenase major subunit2.272.23
gcvPglycine dehydrogenase2.282.16
fdoHformate dehydrogenase iron-sulfur subunit2.142.11
3 PTS system
manXPTS system, mannose-specific IIAB component9.3915.64
manZPTS system, mannose-specific IID component8.8012.58
ptsGglucose-specific PTS enzyme IIBC component8.7312.52
manYPTS system, mannose-specific IIC component8.6010.25
ptsIphosphotransferase system, enzyme I, PtsI2.782.68
ptsHphosphocarrier protein HPr2.702.32
4 Sugar and amino acid metabolism
asnAaspartate-ammonia ligase2.396.20
asnBasparagine synthase (glutamine-hydrolysing)2.274.30
gcvTaminomethyl transferase2.163.39
aspCaspartate aminotransferase2.013.27
purAadenylosuccinate synthase2.092.61
fbaAfructose-bisphosphate aldolase, class II2.492.31
5 Others
bssRbiofilm regulator BssR2.465.36
feoBferrous iron transport protein B2.384.14
iraDanti-adapter protein iraD4.623.24
pflDformate C-acetyltransferase3.632.89
zraStwo-component system, NtrC family, sensor histidine kinase HydH2.602.05
DR76_3474uncharacterized protein2.372.02
Down-Regulated Genes
1 DNA Binding and Repair
pgaADNA binding; negative regulation of DNA-templated transcription, termination00
rusAcrossover junction endodeoxy ribonuclease RusA00.0066
hyaEDNA binding; DNA recombination00
putPDNA replication initiation0.00150.0033
hybDDNA recombination; DNA binding; DNA integration0.00200.0037
betDNA binding; DNA metabolic process0.00310.0017
putADNA replication0.00360.00071
exoDNA binding; nucleic acid phosphodiester bond hydrolysis; exonuclease activity0.00380.0024
umuCDNA polymerase V0.350.39
2 Membrane component
ompDouter membrane porin protein LC0.00130.0012
DR76_3645integral component of membrane0.00260
DR76_3655integral component of membrane0.00280.010
ceacytolysis, integral component of membrane0.280.47
3 Others
DR76_3678hypothetical protein00.0051
rutGpyrimidine utilization transport protein G0.00470.0043
yccMputative electron transport protein0.0140
pepNaminopeptidase N0.150.23
higAtoxin HigB-10.160.12
motAchemotaxis protein MotA0.390.48
tsrmethyl-accepting chemotaxis protein I, serine sensor receptor0.480.48
pspAphage shock protein A0.480.23
pspGphage shock protein G0.360.18
Note: CvB means 1/2× MIC OLA treated group compared with untreated group; DvB means 1/10× MIC OLA treated group compared with untreated group.
Table 2. Genes with non-synonymous mutation and/or single-point deletion in E. coli ATCC25922 both induced by 1/2× MIC and 1/10× MICof OLA.
Gene SymbolGene DescriptionMutationsConsequence
degQperiplasmic serine protease, S1-C subfamily, contain C-terminal PDZ domain1NS
ks71Ahypothetical protein, regulation of transcription, DNA-templated1NS
kduI4-deoxy-L-threo-5-hexosulose-uronate ketol-isomerase1SL
DR76_2530type I phosphodiesterase / nucleotide pyrophosphatase family protein4SL
gntPgluconate:H+ symporter, GntP family1NS
cmoAiron complex transport system permease protein1NS
vgrGtype VI secretion system secreted protein VgrG4NS
bigAputative surface-exposed virulence protein1NS
DR76_3990hypothetical protein1NS
pdxA4-hydroxythreonine-4-phosphate dehydrogenase PdxA1NS
DR76_4321hypothetical protein3SL
cusACu(I)/Ag(I) efflux system membrane protein CusA / SilA1NS
DR76_4582hypothetical protein1NS
DR76_4702integral component of membrane1NS
queCthreonine aldolase1NS
Note: NS, non-synonymous; SL, stop-loss, a mutation in the original termination codon (a stop was lost).
Table 3. Non-synonymous mutations in resistant E. coli ATCC25922 induced by sub-MIC of OLA.
Gene NameDescriptionMutationsConsequence
intAprophage integrase IntA1NS
murPPTS system, N-acetylmuramic acid-specific IIC component1NS
nudK8-oxo-dGTP pyrophosphatase MutT and related house-cleaning NTP2NS
yiaFuncharacterized protein YiaF1NS
fimDouter membrane usher protein FimD/PapC1NS
degQperiplasmic serine protease, S1-C subfamily, contain C-terminal PDZ domain1NS
ks71Ahypothetical protein; regulation of transcription, DNA-templated1NS
yagKuncharacterized protein YagK2NS
aasacyl-CoA synthetase (AMP-forming)/AMP-acid ligase II1NS
srlAPTS system glucitol/sorbitol-specific EIIB component1NS
ulaCdi- and tricarboxylate transporter1NS
pbμGxanthine/uracil/vitamin C permease, AzgA family 1NS
iraDDNA-binding transcriptional regulator, XRE-family HTH domain1NS
yjhFH+/gluconate symporter or related permease1NS
ydeEpredicted transcriptional regulator YdeE, contains AraC-type DNA-binding domain1NS
acnBaconitase B1NS
htrEouter membrane usher protein FimD/PapC1NS
rssApredicted acylesterase/phospholipase RssA, containd patatin domain75NS/SG
crfCreplication fork clamp-binding protein CrfC (dynamin-like GTPase family)122NS/SG/FSD/FSI/NFSI
yeePpredicted GTPase10NS
hmuUABC-type Fe3+-siderophore transport system, permease component1NS
yaiPglycosyltransferase, catalytic subunit of cellulose synthase and poly-beta-1,6-N-acetylglucosamine synthase1NS
fliCflagellin and related hook-associated protein FlgL1NS
yecMuncharacterized conserved protein YecM, predicted metalloenzyme1NS
rnfDNa+-translocating ferredoxin:NAD+ oxidoreductase1NS
rnfCNa+-translocating ferredoxin:NAD+ oxidoreductase RNF, RnfC subunit14NS/FSD/FSI
mlcsugar kinase of the NBD/HSP70 family, may contain an N-terminal HTH domain1NS
yddGermease of the drug/metabolite transporter (DMT) superfamily1NS
vgrGtype VI secretion system secreted protein VgrG2NS
bigAputative surface-exposed virulence protein10NS
yciIuncharacterized conserved protein YciI, contains a putative active-site phosphohistidine3NS/FSD/FSI
icdisocitrate dehydrogenase2NS
DR76_4080minor capsid protein E1NS
shphead decoration protein2NS
sppAperiplasmic serine protease, ClpP class7NS
msyBacidic protein MsyB1NS
yeeRinner membrane protein YeeR2NS
yciCGTPase, G3E family1NS
cdiAtRNA nuclease CdiA7NS/NFSD
ltaEthreonine aldolase1NS
cusACu(I)/Ag(I) efflux system membrane protein CusA / SilA1NS
acrBmultidrug efflux pump subunit AcrB1NS
yahDputative ankyrin repeat protein YahD1NS
ycjYuncharacterized protein1NS
DR76_4702integral component of membrane1NS
fhaBlarge exoprotein involved in heme utilization or adhesion4NS
yjcZuncharacterized protein YjcZ3NS
stfRphage tail fiber repeat family protein1NS
lrhAprobable HTH-type transcriptional regulator LrhA1FSD
rsxCelectron transport complex subunit RsxC1NFSD
Notes: NS, non-synonymous; SG, stop gain; FSD, frameshift deletion; NFSD, non-frameshift deletion; FSI, frameshift insertion; NFSI, non-frameshift insertion.
Table 4. The MICs of antimicrobial agents against the wildtype and OLA resistant E. coli ATCC25922. (μg/mL)
AntibioticsWildtype8× MIC OLA R (1/2)8× MIC OLA R (1/10)
Ampicillin41616
Augmentin (Amoxicillin+Clavulanic acid)4/28/48/4
Gentamicin10.51
Tetracycline122
Spectinomycin321616
Florfenicol41616
Sulfaisoxazole163232
Compound sulfamethoxazole (Sulfamethoxazole +Trimethoprim)0.06/1.20.25/4.80.25/4.8
Ceftiofur0.50.50.5
Ceftazidime122
Enrofloxacin0.0150.030.03
Ofloxacin0.060.1250.125
Meropenem0.030.030.03
Apramycin323232
Colistin20.50.5
Mequindox86464
Publisher’s Note: MDPI stays neutral with regard to jurisdictional claims in published maps and institutional affiliations.

