Article

Microstructure Control and Friction Behavior Prediction of Laser Cladding Ni35A+TiC Composite Coatings

1
School of Mechanical & Automotive Engineering, Fujian University of Technology, Fuzhou 350118, China
2
Fujian Innovation Center of Additive Manufacturing, Fuzhou 350118, China
3
Digital Fujian Industrial Manufacturing IoT Lab, Fuzhou 350118, China
*
Author to whom correspondence should be addressed.
Submission received: 8 July 2020 / Revised: 2 August 2020 / Accepted: 7 August 2020 / Published: 9 August 2020
(This article belongs to the Special Issue Additively Manufactured Coatings)

Abstract

:
The premise of surface strengthening and repair of high valued components is to identify the relationship between coating formulation, structure, and properties. Based on the full factorial design, the effects of process parameters (laser power, scanning speed, gas-powder flow rate, and weight fraction of TiC) on the phase composition, microstructure, and element distribution of Ni35A/TiC cladding layer were investigated, followed by the cause identification of wear behavior. Through ANOVA, the correlation was established with good prediction accuracy (R2 = 0.9719). The most important factors affecting the wear rate of the cladding layer were recognized as laser power and particle ratio with a p-value < 0.001. The cladding layer was mainly comprised of Ni3Fe and TiC0.957. The excessive laser power would enhance the process of convection-diffusion of the melt pool, increase dilution, and improve wear volume. High laser power facilitates renucleation and growth of the hard phase, especially the complete growth of secondary axis dendrite for the top region. Increased TiC significantly changes the microstructure of the hard phase into a non-direction preferable structure, which prevents stress concentration at tips and further improves the mechanical properties. The research results are a valuable support for the manipulation of microstructure and prediction of wear behavior of composite cladding layer.

1. Introduction

As an advanced material processing technology, laser cladding is a novel surface modification technique. Due to the unique characteristics of high energy density, rapid solidification rate, and high cooling rate, laser cladding has been widely used for obtaining better wear and corrosion-resistant coatings with minimal heat affected zone, reliable metallurgical bonding, and uniformly distributed fine microstructure [1,2,3,4,5].
In order to further improve the mechanical and physical and chemical properties of the coating, in recent years, the research on the performance of the composite coating has attracted much attention, and the reinforced phase ceramic powder has become a research hotspot. Among them, TiC is an attractive reinforced phase for improving coating properties for its excellent physical and mechanical properties, such as high melting point, high hardness, low density, and strong covalent bonding [6,7]. Ni-based self-fluxing alloy is also frequently applied for surface strengthening due to its good wear resistance, impact resistance, and excellent fatigue behavior at high temperatures [8,9,10]. Compounding the two and performing laser cladding is expected to obtain a new type of composite coating with more excellent physical and chemical properties. Some scholars have conducted related research and made some progress, but the raw material formulation of the multi-phase coating and the comprehensive mechanism of the effect of process selection on tissue performance are still in doubt. Therefore, this paper designed a full-factor experiment for Ni35A/TiC composite coating and attempted to elaborate on the influence of formula and process on the structure and the corresponding relationship between microstructure and friction performance.
At present, many scholars have studied the preparation and performance optimization of TiC-reinforced ceramic composite coatings, using different raw material forms and molding methods to optimize the hardness, tensile strength, wear resistance, corrosion resistance, and other properties of the composite coatings, and they have made some progress. Hong et al. [11] used laser metal deposition technology to prepare ultrafine TiC particle-reinforced Inconel 625 composite parts. It was found that adding an ultrafine TiC particle could obtain a better columnar dendrite structure and could significantly improve the parts’ tensile properties and wear resistance. Xu et al. [12] found that compared with pure Inconel 625 coating, the microhardness and tensile strength of TiC-reinforced Inconel 625 coating were significantly improved, and the addition of TiC-reinforced Inconel 625 coating also showed good corrosion resistance. Saroj et al. [13] used the TIG (Tungsten Inert Gas Welding) cladding process to prepare TiC-reinforced Inconel 825 composite coatings with different mass percentages (20%, 40%, 60%). The results showed that TiC had an important effect on the morphology of the composite coating. The SEM structure and friction and wear analysis showed that as the TiC content in the TiC/Inconel 825 coating increased, the friction coefficient of the composite coating decreased significantly. At the same time, through organization identification and performance analysis, scholars have further clarified the evolution and strengthening mechanism of the composite phase in the cladding layer. Sahoo et al. [14] adopted a pre-coating method and obtained a wear-resistant TiC/Ni composite coating using the TIG cladding process. It was found that the presence of TiC, Ni, and some intermetallic compounds in the coating affected the excellent interface bonding and coating. The main reason for the layer to obtain better wear resistance and TiC/Ni composite coating wear resistance is 70 times higher than the AlSl304 substrate.
Although a lot of research has been conducted on the performance of TiC composite coatings, there are few reports on the multi-factor coupling relationship between the laser cladding process parameters and the composite coating wear rate. After the pyrolysis of the hard phase in the cladding process, the directional growth of the hard phase in the molten pool with a significant gradient distribution of the temperature field brings the tip stress problem to be solved urgently. Therefore, in this work, a full factorial experimental design (L42) was proposed to investigate the effects of process parameters together with the weight fraction of TiC on the wear rate and microstructure evolution of composite coating.

2. Materials and Methods

The substrates were made of AISI 1045 steel with dimensions of 40 mm × 20 mm × 5 mm. The cladding powders, mix-up of Ni35A and TiC, were supplied with grain sizes of 48–106 μm. The microscopic profiles and chemical components are illustrated in Figure 1 and Table 1, respectively.
The laser cladding system used in work, as depicted in Figure 2, was comprised of an IPG laser generator YLS-3000 (Burbach, Germany), the wavelength is 1064 nm, continuous mode, a Lasermesh FDH0273 laser head (Novi, MI, USA) with a focal length of 300 mm, a FANUCM-710iC/50 industrial robot (Yamanashi, Japan), a TongfeiTFLW-4000WDR-01-3385 laser chiller (Sanhe, China), a Songxing CR-PGF-D-2 coaxial powder feeding machine (Fuzhou, China), a MitsubishiPLC controller, and SX14-012PLUSE laser pulse control system (Burbach, Germany). The laser was focused on the substrate with a spot diameter of 4 mm, and the cladding powder was supplied by the shielding gas argon at a pressure of 0.5 MPa.
Before cladding, the substrate was cleaned with acetone to remove surface impurities. The cladding powder was mixed up, according to the designated fraction, in a MITR-YXQM-2L planetary ball mill machine (MITR, Changsha, China) at a speed of 300 r/min for 30 min, followed by 30 min vacuum drying at a temperature of 120 °C. After laser cladding, the specimen was sectioned by wire-EDM (Electrical Discharge Machining), mounted, ground, polished, and etched in 4% nitric acid alcohol for 30 s. A series of observations was carried out, including microhardness test using MVA-402TS tester (HDNS, Shanghai, China) at a load of 500 gf and holding time of 30 s, macrographic measurement by a KH-1300 3D digital microscopy system (Hirox, Shanghai, China), metallurgical structure detection via a Hitachi TM3030 Plus scanning electron microscope (Hitachi, Tokyo, Japan), element quantification by A550I EDS (Austin, TX, USA), phase content analysis using XRD (Ultima IV, Rigaku Corporation, Tokyo, Japan) at a scanning speed of 4°/min and scanning angles range from 20° to 80°. The top surface of claddings was wear-tested using a Bruker UMT-2 universal tester (Bruker, Billerica, MA, USA) at conditions illustrated in Table 2, and the wear volume was calculated after the observation of scratch profiles. The wear rate was computed using Equation (1) after obtaining the wear volume from scratch profiles:
r = Δ V F × d
where ΔV is the wear volume of cladding, F is the applied load during the wear test, and d is the sliding distance.
Experimental runs were arranged according to the full factorial method using Design-expert 10.0. The experiment investigated the influences of four factors, including laser power, scanning speed, gas-powder flow rate, and particle ratio of TiC on the wear rate and microstructure evolution along the depth direction. The microstructure profile and element distribution in the cladding layer were also observed to reveal the correlation with macroscopic properties. The input variables and their levels are illustrated in Table 3. The experimental design matrix and observations are depicted in Table 4.

3. Results and Discussion

3.1. Subsection ANOVA of Wear Rate

Table 5 illustrates the result of ANOVA for wear rate. From the table, it can be seen that the linear correlation selected for wear rate had a p-value prob > F less than 0.0001, which denotes excellent goodness of fit. The influencing factors were selected to account for the response. The value of adequate precision was 22.514, much greater than 4, indicative of high resolution to input variations. The coefficient of determination R2 was 0.9719, showing that the model fitted the experimental results well. The value of adjusted R2 and predicted R2 is 0.0297 [10,15], meaning that the established model had a good prediction capacity toward the input domain.
From Table 5, it is apparent that the most significant factors influencing wear rate of the cladding layer were laser power and weight fraction of TiC (p-value < 0.001), followed by scanning speed. After ANOVA, the correlation between wear rate and process parameters was obtained, as depicted in Equation (2):
Wear   Rate = 289.923 208.70062 × L P + 14.03769 × S S 3.34365 × P R + 2.251141 × L P × P R 0.18893 × S S × P R

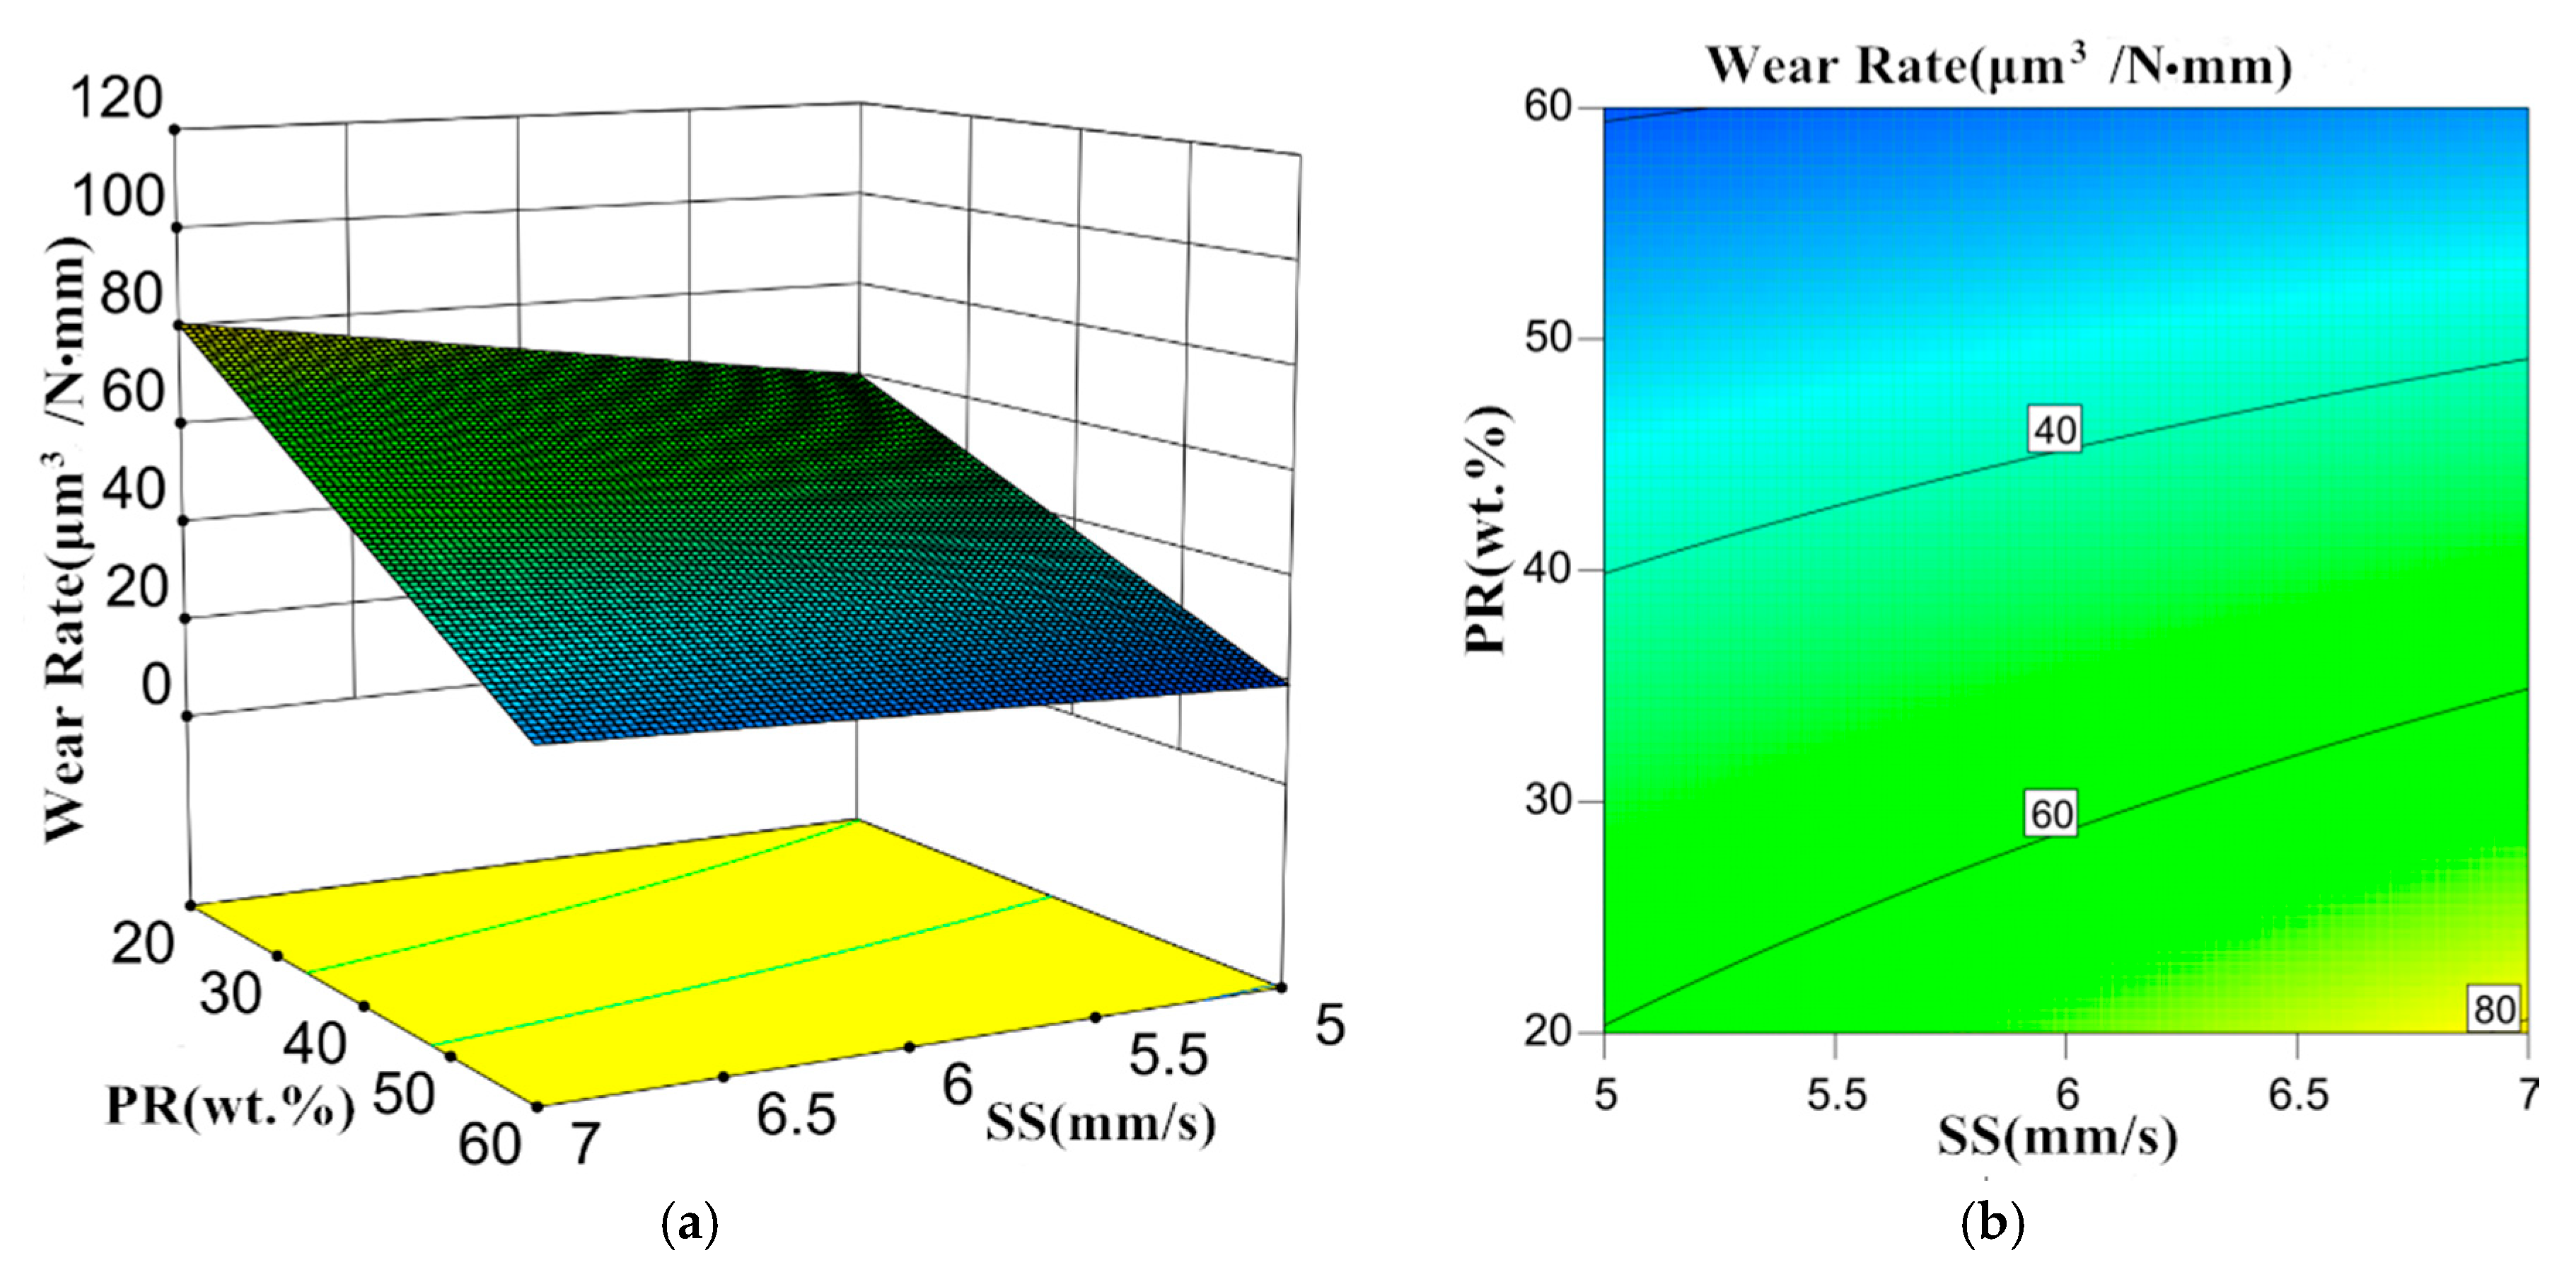
3.2. Wear Rate Model

Figure 3 illustrates the distribution of residuals and the comparison of model-predicted values to experimental results. From the figure, it can be seen that the residuals of 16 experimental runs were along a straight line, which indicated normal distribution and thus random error for lack of fit. The comparison data were approximate to the line y = x, showing the little divergence of model predictions from experimental results. Therefore, the model for wear rate was established with good prediction accuracy.
Figure 4 plots the 3D response surface and corresponding contour of wear rate with respect to laser power and particle ratio of TiC. From the figure, it is clear that the wear rate of the cladding layer decreased with an increase in laser power and weight fraction of TiC. Further investigation of phase composition, microstructure, and element distribution is required to understand the mechanism of how process parameters affect the wear rate. Hardness and wear resistance were positively correlated under the same friction situation.

3.3. Phase Analysis

Figure 5 shows the phase analysis of the wear test on the cladding surface by the XRD test. It was found that the cladding layer was mainly composed of TiC0.957(PDF#89-2716) and Ni3Fe(PDF#88-1715). The diffraction spectrum for different process conditions varied from each other only in the relative intensity of peaks. This was mainly due to the weight fraction of TiC in cladding powder, and the grain growth status occurred by process parameters. Specifically, for the 11# specimen, where TiC particles amount to 60% weight of deposited powder, the peak intensity of TiC0.957 was significantly strengthened as expected. It was also observed that the percentage of element C in TiC composition had decreased. This would be caused by the element loss during the heating process of laser-material interaction and replacement with Ni in the crystal structure of TiC at the molten pool [16].

3.4. Microstructure and Element Distribution

Figure 6 illustrates the element distribution of cladding layers at laser powers of 1.2 kW and 1.4 kW (Scanning speed of 7 mm/s, the gas-powder flow rate of 1000 L/h, and 60% of TiC). From the figure, it can be found the molten pool experienced strong convective flow during laser cladding. With higher laser input, the molten pool was prolonged, the element Fe was more diffused, by convection and diffusion, into the cladding layer from the substrate, especially to the boundary of three phases cladding layer-substrate-air and center of the molten pool. This, to a certain extent, diluted the cladding layer and decreased the fraction of the hard phase, thereby deteriorating the wear resistance.
Figure 7 compares the microstructure of cladding layers at different laser powers. It can be seen that a large amount of dendritic crystal existed in the top, center, and bottom of the cladding layer. Element analysis by EDS showed that the fraction of TiC at the dark area was obviously greater than that of light area, where the percentage of Ni overweighed. Considering the XRD result, the microstructures in the dark and light areas were probably TiC and Ni-based alloy, respectively. The dendritic microstructure is probably produced from the growth of renucleared TiC grain after decomposition due to heating at the laser cladding process [17].
As the laser power increased, more energy input was imposed onto the cladding powder. The more hard phase was thus decomposed, resulting in a decrease of hard phase retaining in the cladding layer. The microstructure of Ni-based alloy at different laser powers was a flatten crystal. At higher laser power (1.4 kW), the grain size was greater with more apparent crystal boundary. This was because increased laser power had prolonged the span of the molten pool, increased thermal gradient, and enhanced heat convection. Part of Fe elements and Ti elements left by the decomposition of TiC was concentrated in the grain boundaries, and this grain boundary structure with relatively weak mechanical properties will further reduce the inter-grain bonding strength and increase the wear rate [18].
According to the literature [5,19], the microstructure of the cladding layer is mainly determined by the solidification rate of the molten pool. At a certain scanning speed, the ratio of G to R (G is the temperature gradient, and R is the solidification rate) declined from the bottom of the molten pool to the top, while the growth rate of crystals at the same cross-section increased. As illustrated by the microstructure in the middle area in Figure 7a,b, due to the variation of G/R, the grain size of dendritic TiC was much greater than that of the bottom. The microstructure at the molten pool top manifested similar circumstances as the top and middle areas shown in Figure 7a,b. The dark grey hard phase at the top region of Figure 7a (2# sample) accounted for 16.84%, and the dark gray hard phase at the top of Figure 7b (4# sample) accounted for 15.29%. As shown in Table 4, the hardness of the 2# sample was 59.7 HRC, the hardness of the 4# sample was 52.6 HRC. The laser cladding hard particle-reinforced composite coating had high hardness, uniform structure, and excellent resistance to abrasive wear. When the laser power was 1.2 kW, it was found that some secondary dendrite axis was fully grown at the top area of the cladding layer, which facilitates anchoring in the Ni-based alloy and avoids hard phase being sloughed as abrasive grains [20]. Figure 8 shows the friction and wear diagram of the cladding layer with different laser powers. As shown in Table 6, the content of element Fe varied slightly through the top, middle, and bottom parts of the cladding layer.
The microstructure of the cladding layer obtained with 60% TiC indicated that the energy demand for decomposition and renuclearation of all the TiC particles grew increasingly with more TiC added in the cladding powder. The undecomposed TiC became nucleation sites and grew into the microstructure, as illustrated in Figure 9b. According to the distribution of thermal gradients along the cladding layer, TiC clustered more at the top and grew fully, while the TiC at the middle part grew with exceptional size, and at the bottom, more dendrite was obtained. The dark grey hard phase at the top region of Figure 9a (12# sample) accounted for 18.57%, and the dark gray hard phase at the top of Figure 9b (11# sample) accounted for 71.8%. As shown in Table 4, the hardness of the 12# sample was 55.4 HRC, and the hardness of the 11# sample was 70 HRC. From the energy spectrum by EDS, the percentage of TiC in the dark area increased obviously up to 70% as the weight fraction increased. Since TiC contained a more hard phase, the wear resistance was thus improved. With more TiC in the cladding powder, the effect of second phase enhancement became more apparent, which further strengthened the wear resistance. Figure 10 shows that the wear rate of the cladding layer decreased as the weight fraction of TiC increased in the cladding powder. This was due to the characteristic of high hardness and good wear resistance for the ceramic powder TiC. It was reported that the wear resistance of alloys was simply proportional to the area percentage of the hard phase. Increasing TiC percentage significantly improved the hardness and wear resistance of the cladding layer and declined the wear rate per unit time. As shown in Table 7, the content of element Fe varied slightly through the top, middle, and bottom parts of the cladding layer. This is owing to the fact that most of the imposed energy is absorbed by the TiC for decomposition and nucleation [21]. It also resulted from the decreased flowability of the melt pool as a more hard phase of the high melting point was mixed. Therefore, the diffusion of Fe was not widely observed, and the dilution effect was restrained.
Figure 11 reflects the interaction effect of scanning speed and the weight ratio of TiC on the wear rate of the cladding layer. It can be seen that the wear rate increased as the scanning speed increased. This was because scanning speed determined the time span of the melt pool affected by the laser beam. The larger the speed, the shorter the energy effect time, which was adverse to thorough decomposition and renucleation of TiC. Specifically, at a higher scanning speed of 7 mm/s, as shown in Figure 11a, a large amount of fine TiC grain was observed at the top region of the cladding layer due to the more laser energy input. Compared with a needle or dendritic microstructure, near sphere structure was much preferable as it mitigated the possibility of stress concentration. The contact area between the spherical particles and the substrate was small, and the degree of fit between them was low, so the spherical particles were more likely to fall off during the friction process, resulting in abrasive wear, which reduced the wear resistance and increased the wear rate per unit time. As the scanning speed was decreased, the effect time of laser beam on the cladding powder and substrate was increased, and the undercooling was thus enlarged. The dendritic TiC crystal structure was obtained with finer sizes at the bottom. Furthermore, the smaller the speed, the larger amount the secondary phase at the crystal boundary. From the results of EDS, as listed in Table 8, the content of element Fe in Figure 12a was much greater than that in Figure 12b. The increase in Fe content, to some extent, diluted the fraction of the hard phase, thereby deteriorating the wear resistance. However, this was comparably less influencing the effect of the profile and distribution of the hard phase. It was presumed that the above-mentioned two effects counteract with each other so that the influence of scanning speed on the wear resistance is weakened even though the microstructure had been significantly changed [22]. The dark grey hard phase at the top region of Figure 12a (6# sample) accounted for 15.89%, and the dark gray hard phase at the top of Figure 12b (8# sample) accounted for 16.52%. As shown in Table 4, the hardness of the 6# sample was 58.7 HRC, and the hardness of the 8# sample was 59.7 HRC. Figure 13 shows the friction and wear diagram of the cladding layer at different scanning speeds.

4. Conclusions

To investigate the influences of process parameters and powder formulation on microstructure, element distribution, and wear behavior, a series of laser cladding experimental runs was conducted on the AISI 1045 mild carbon steel with the cladding powder of Ni35A/TiC based on full factorial design. The correlation between process parameters and the wear resistance was then established after ANOVA of experimental results. Based on the results, the following conclusions can be obtained:
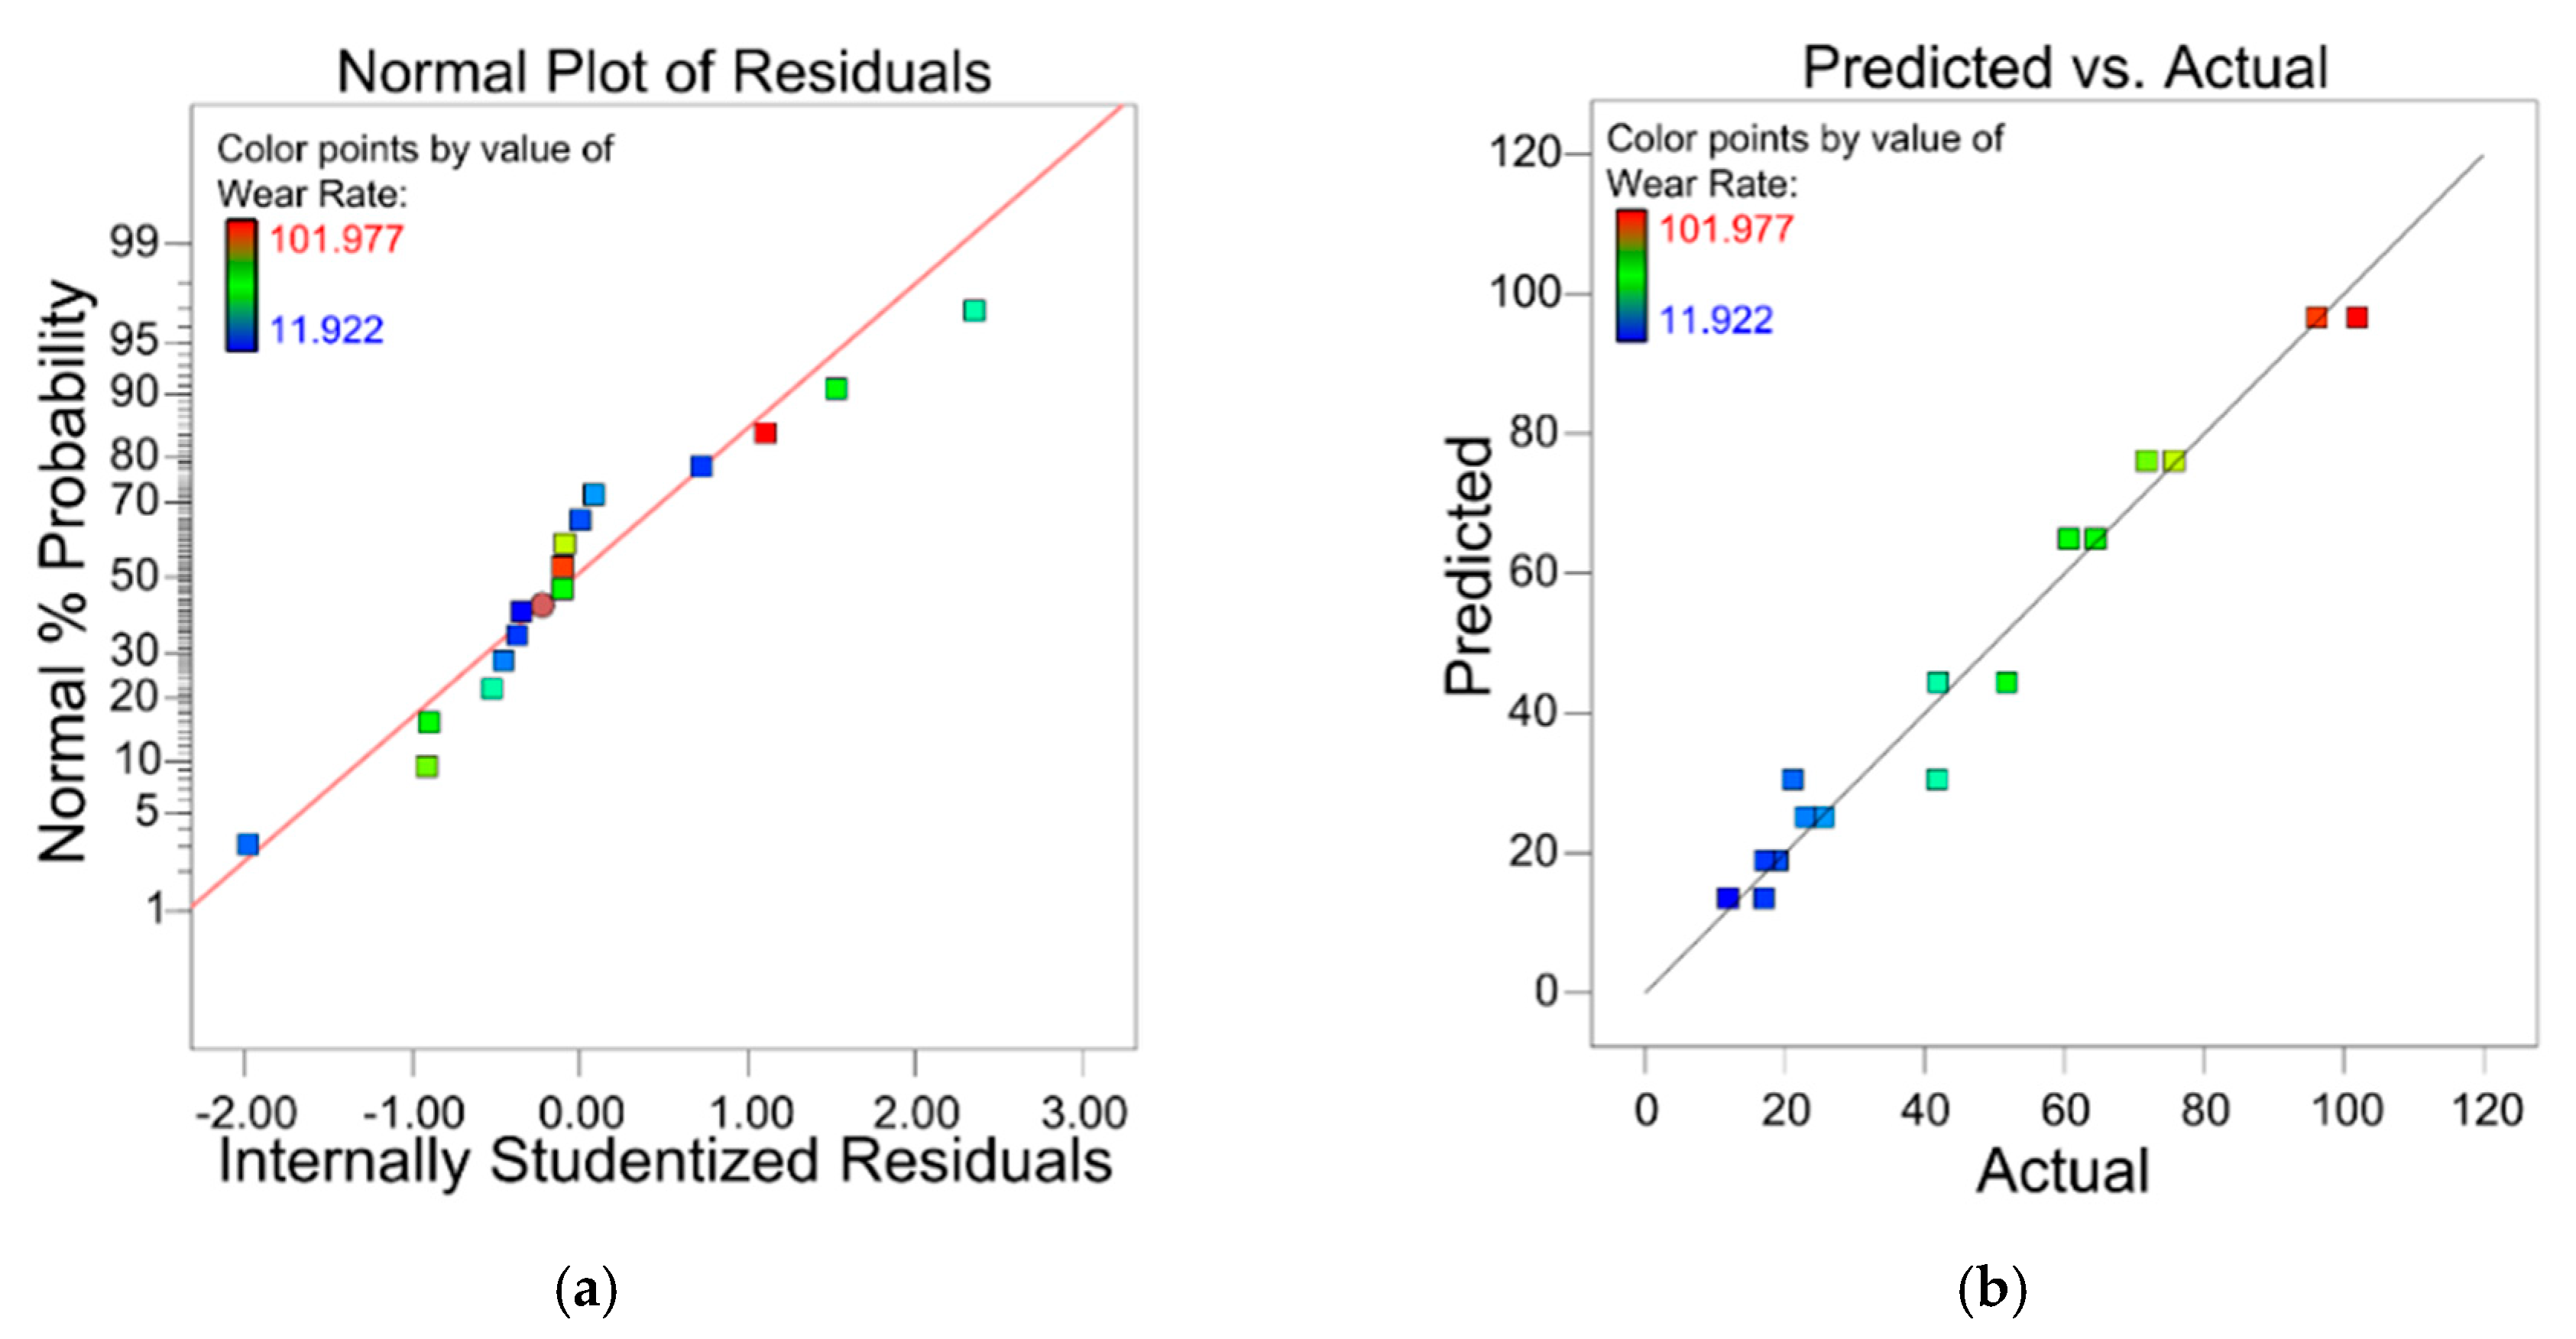
  • Based on ANOVA, the established response model for the wear rate of the cladding layer has good prediction accuracy with R2 of 0.9719. The most significant factors influencing the wear rate are laser power and powder formulation.
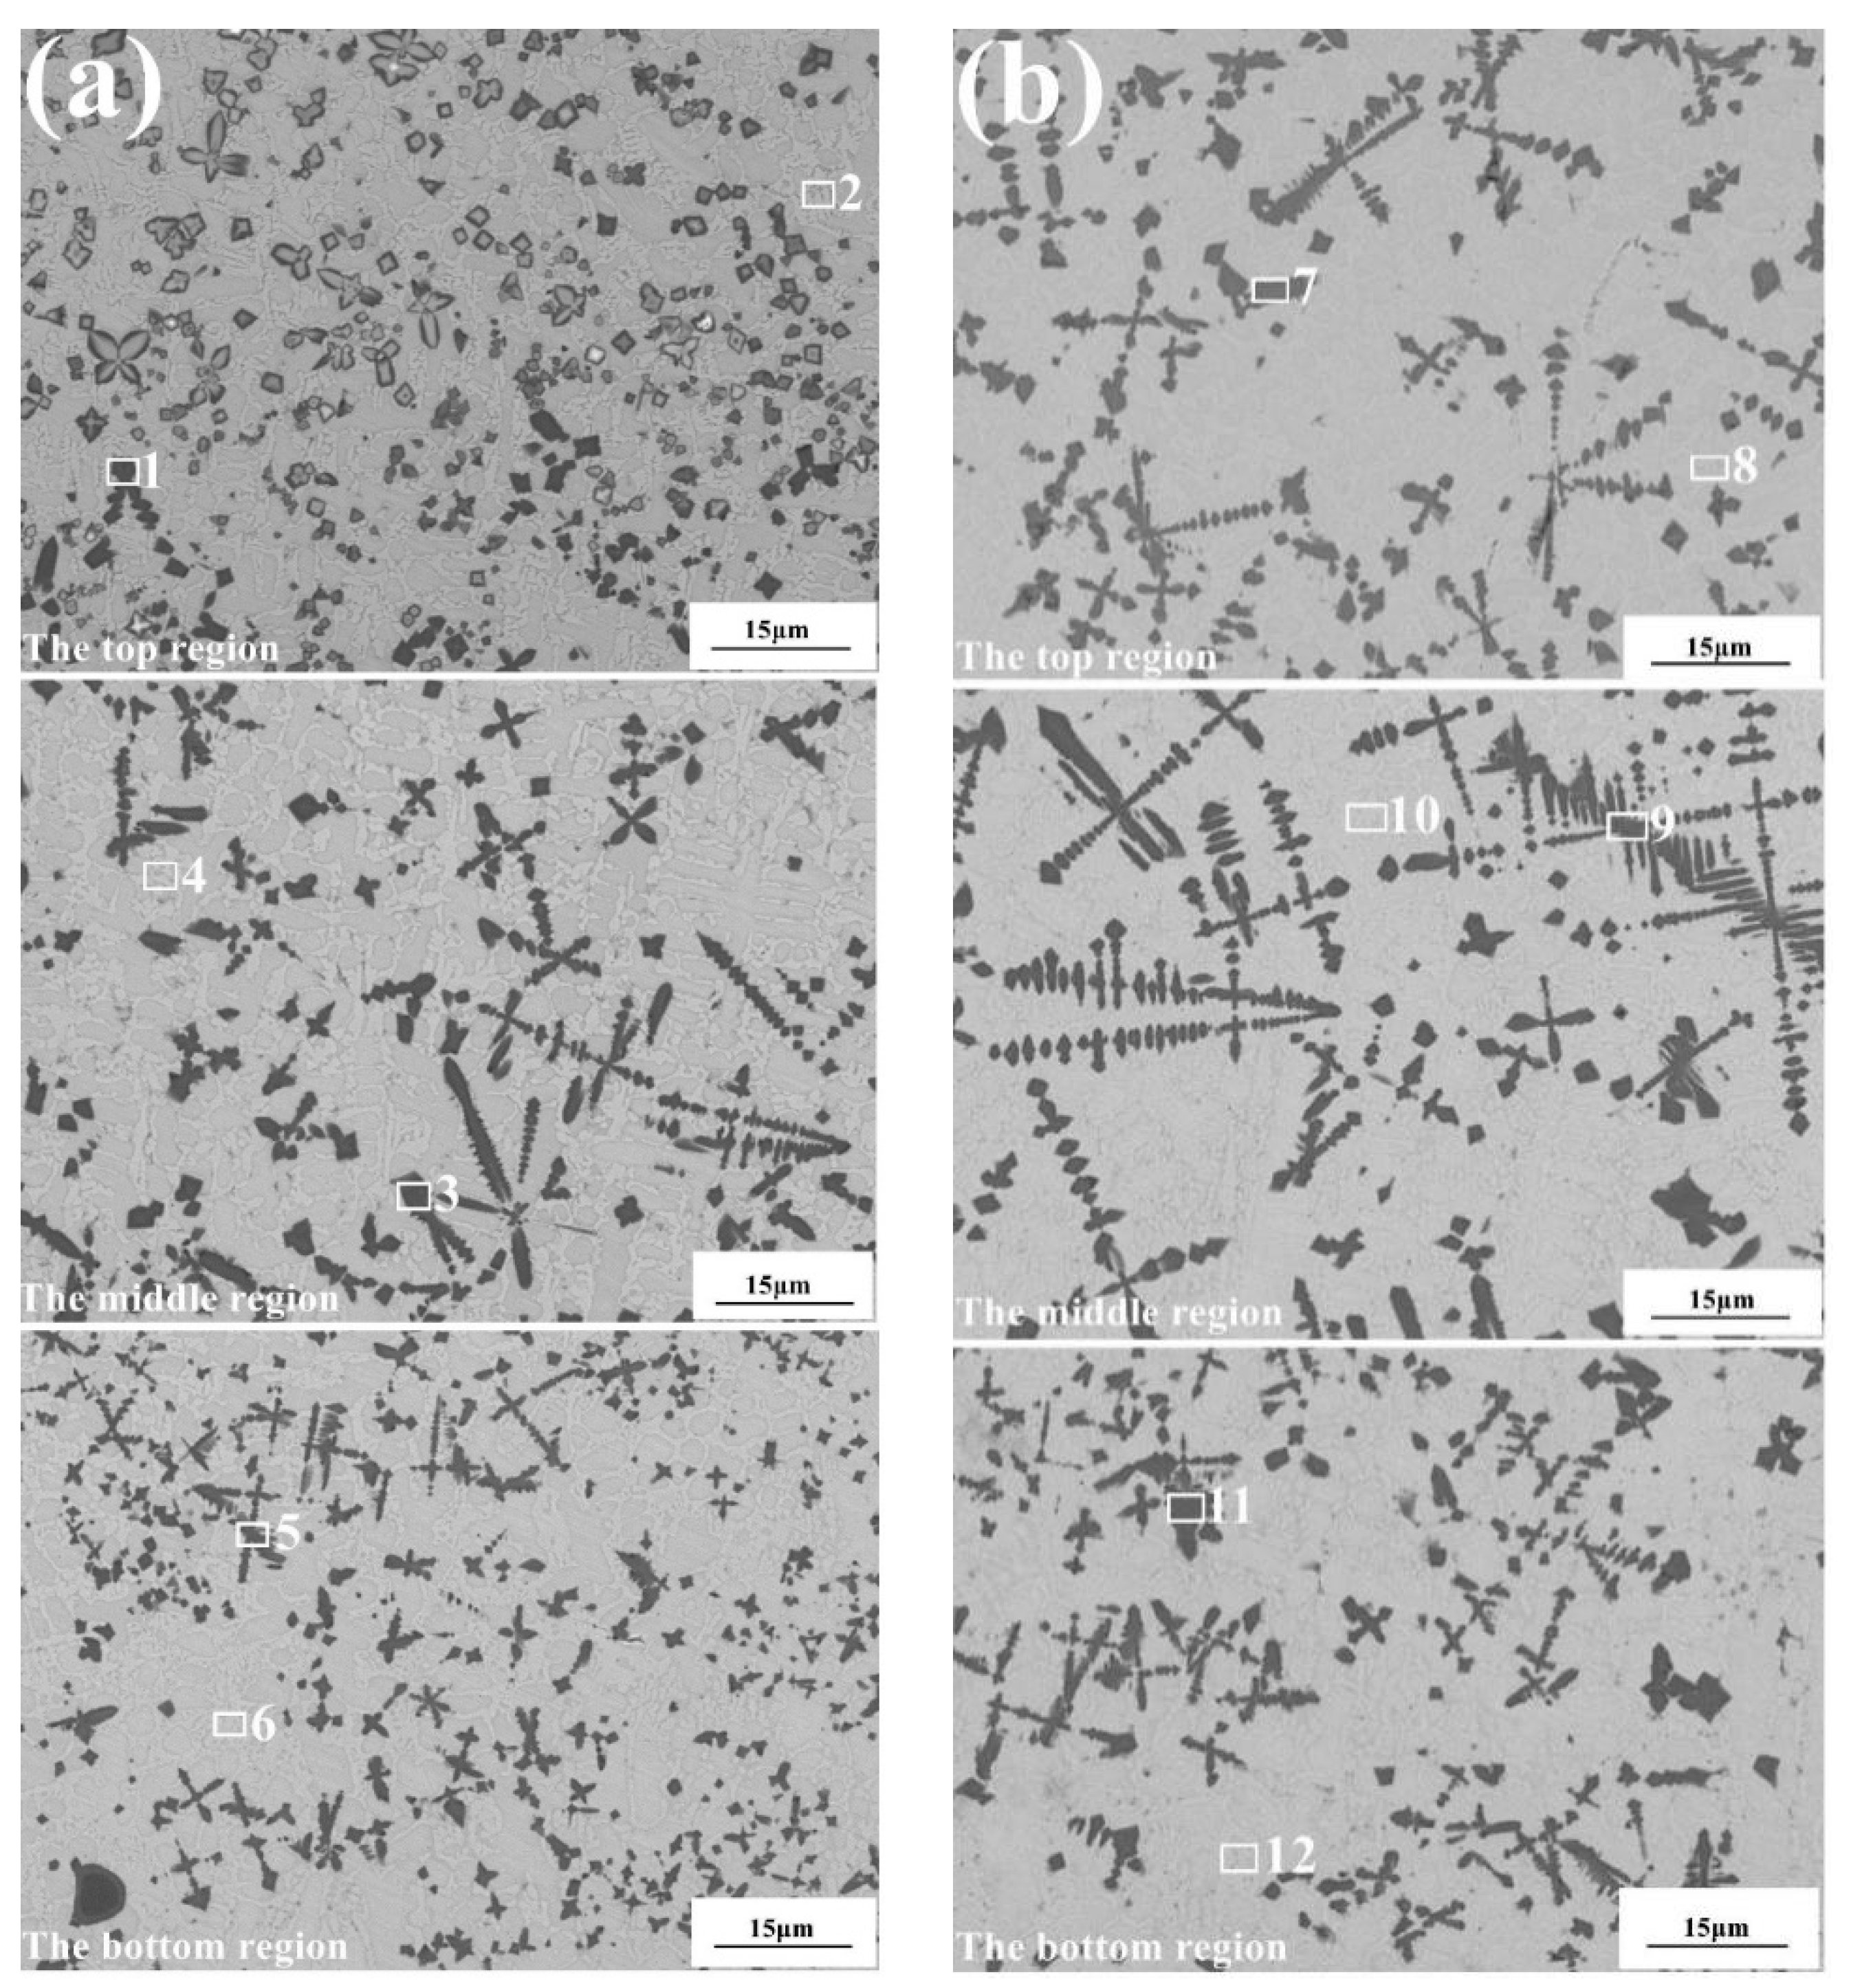
  • The main phases of the cladding layer are Ni3Fe and TiC0.957. A small amount of C overflows the melt pool of TiC after solidus solution or decomposition. For 20% TiC, the cladding layer is mainly composed of one axis dendrite, while for 60% TiC, the grain of hard phase grows up completely without preferable directions, avoiding stress concentration at sharp tips and improving the mechanical properties.
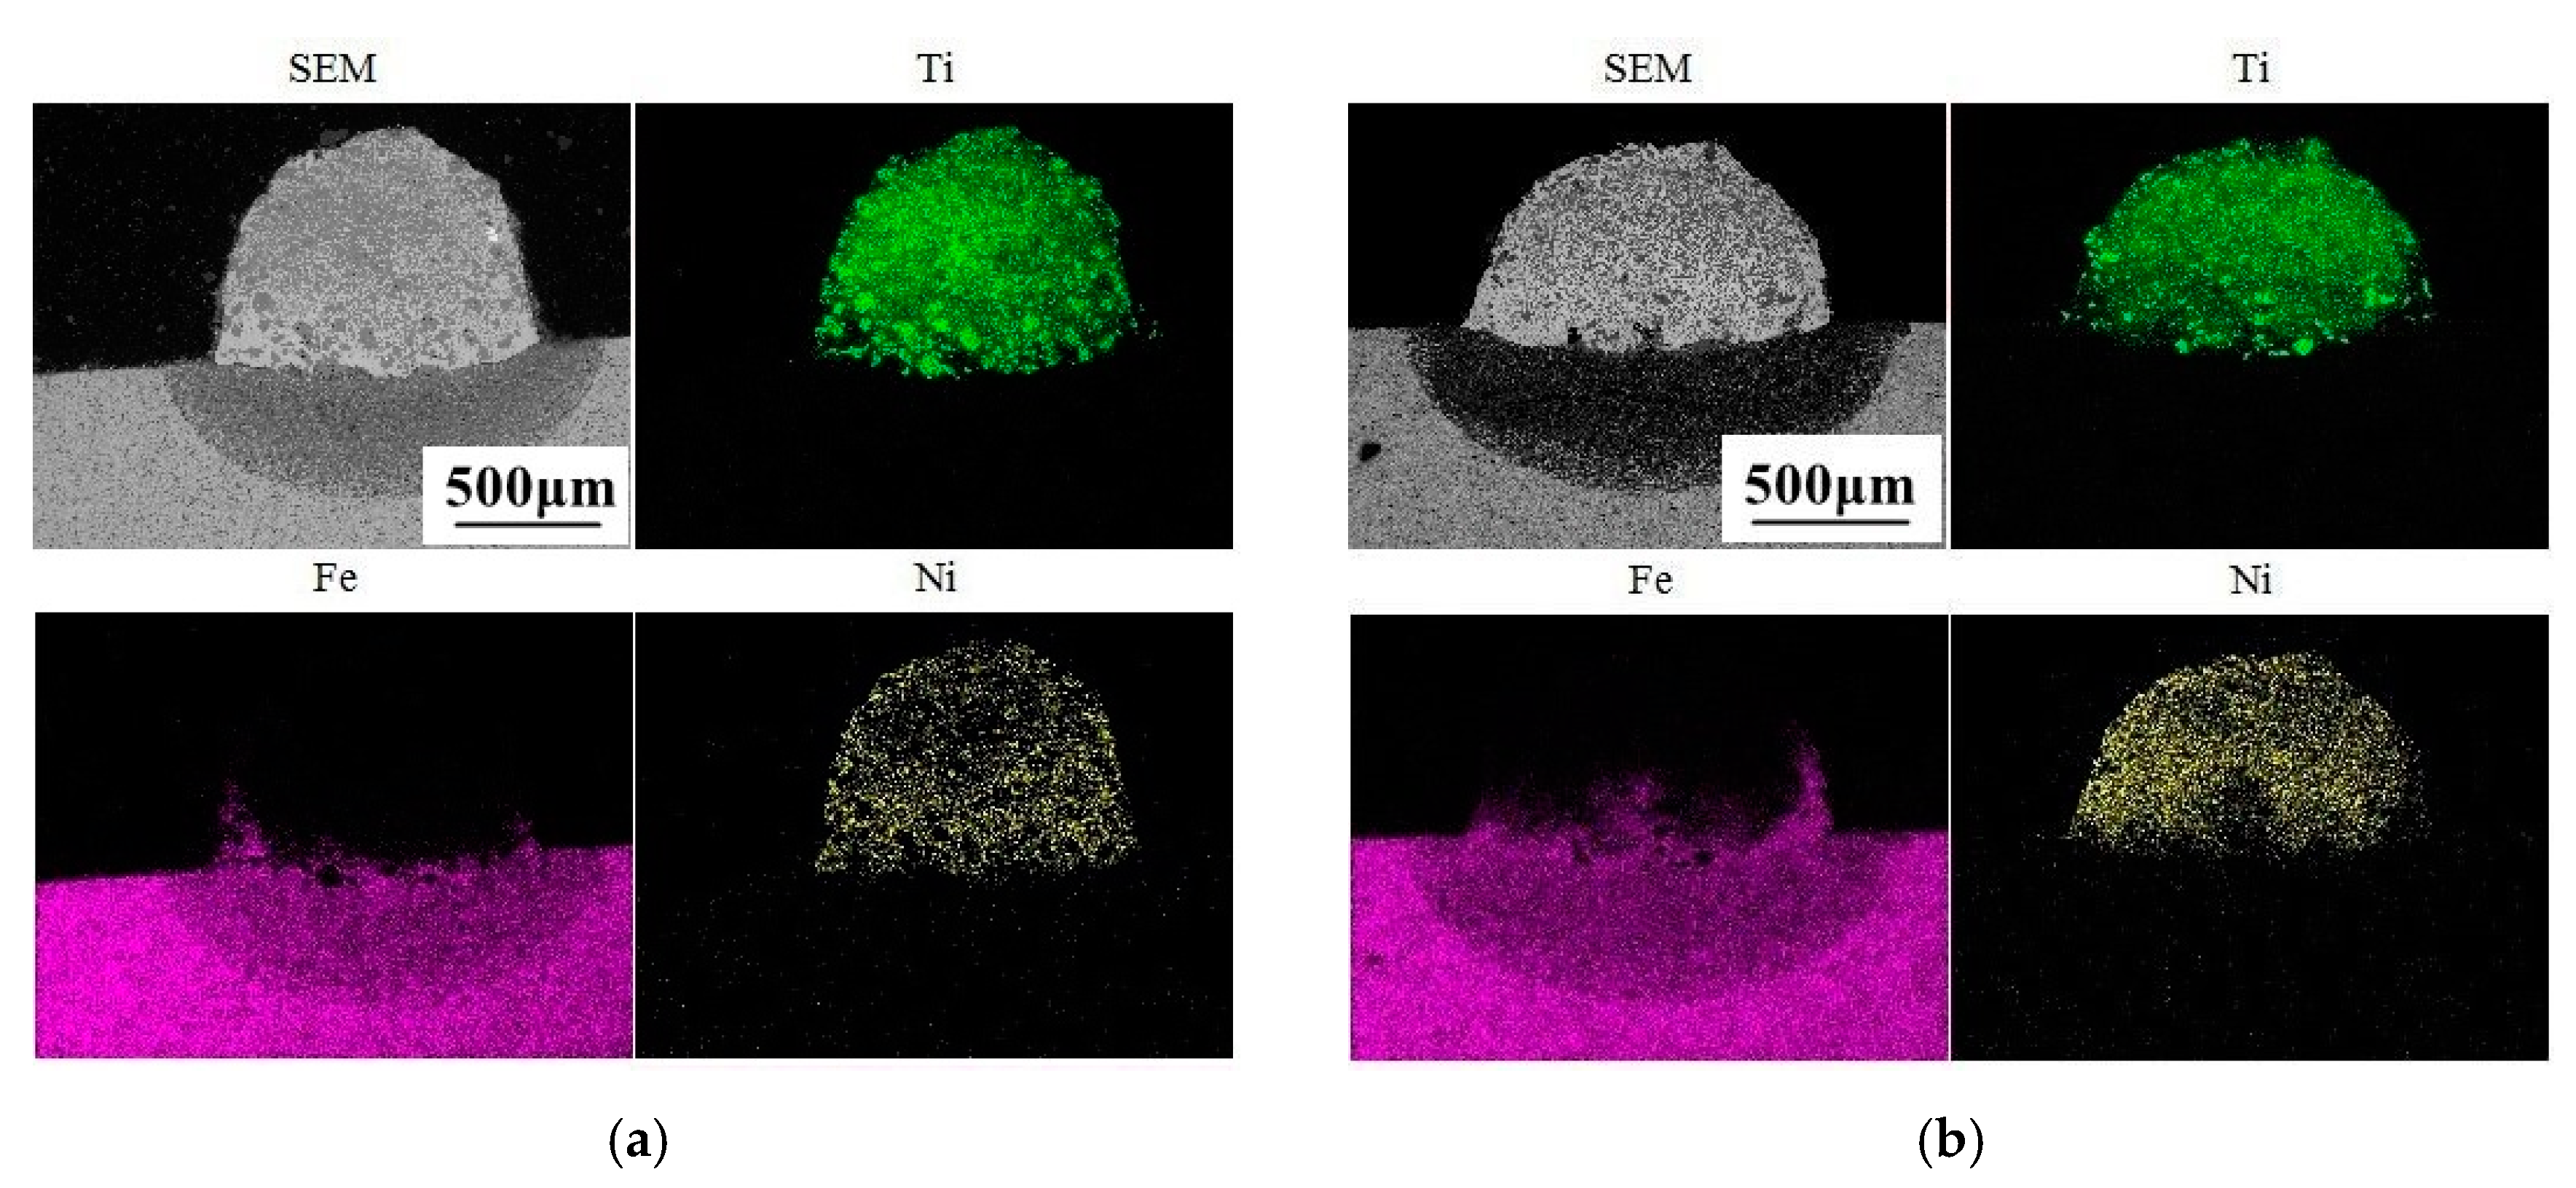
  • Higher laser power would augment the convection-diffusion of the melt pool. From the element distribution by EDS, the element Fe diffuses from the substrate to the cladding layer along the direction of convection, thus increasing the dilution of Fe to the cladding layer and wear volume.
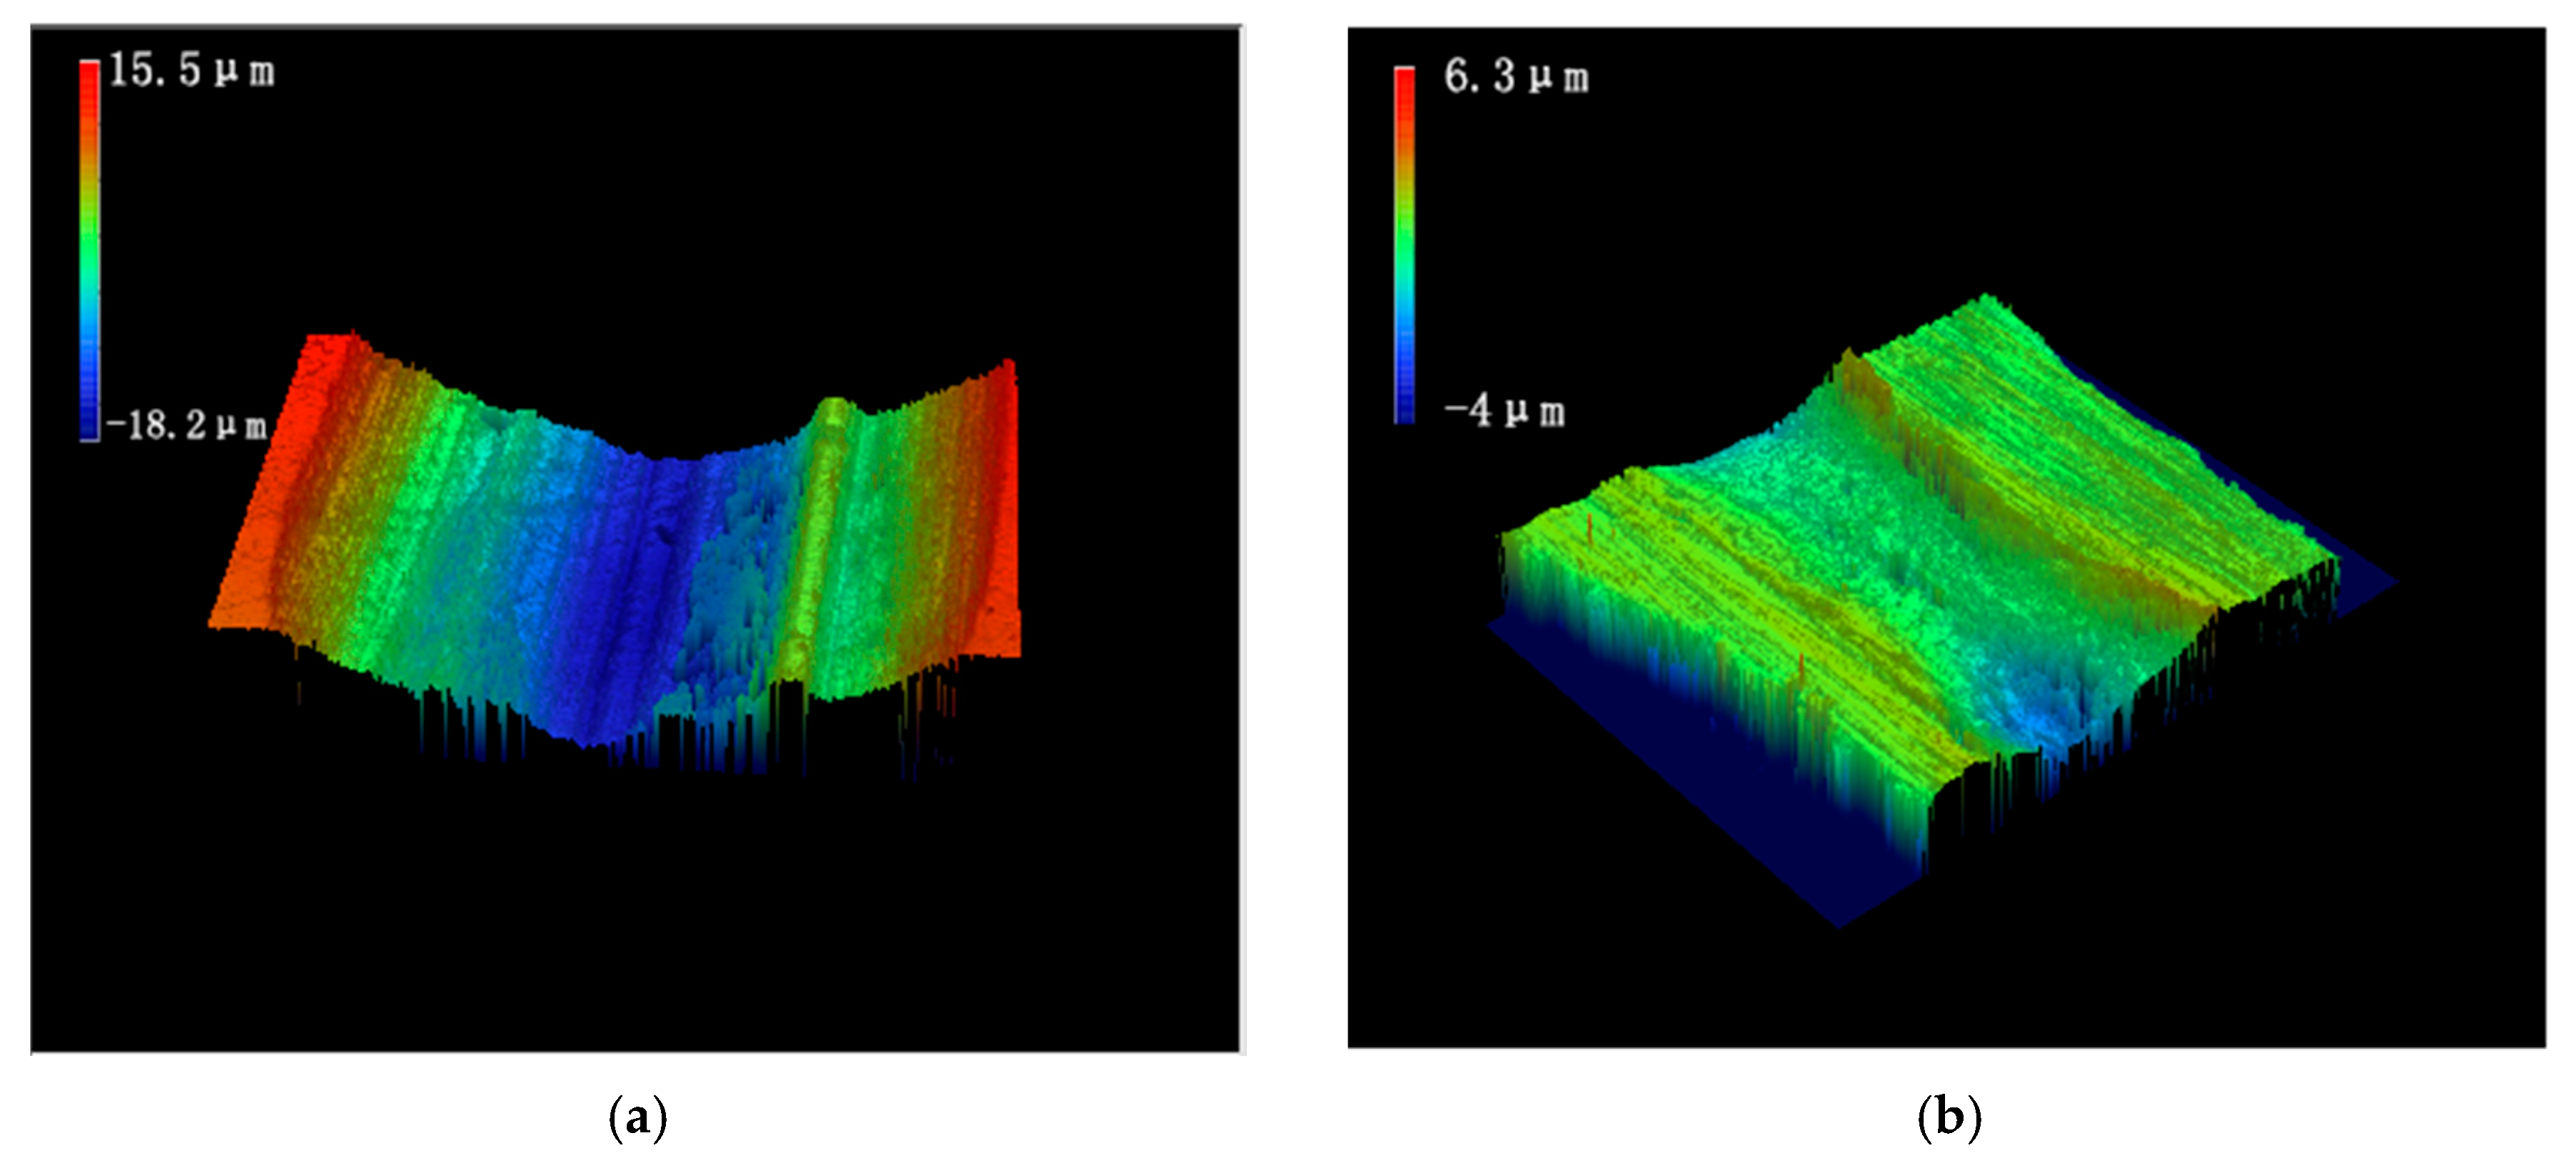
  • The microstructure at the top region of the cladding layer can be controlled by scanning speed. At lower speed (5 mm/s), the dendritic crystal of TiC transforms into near sphere fine grains for the top area. This refines the microstructure to reduce stress concentration at grain tips and improves the wear properties.

Author Contributions

Methodology, X.H. and C.L.; experiment, C.L.; analysis, X.H., C.L., H.Z., C.C., G.L., J.J., M.F., and M.Z.; writing—original draft preparation, X.H. and C.L.; writing—review and editing, C.C. and H.Z.; supervision, X.H. and C.C. All authors have read and agreed to the published version of the manuscript.

Funding

This research was funded by Fujian University of Technology, Grant No. GY-Z18163; Fujian Innovation Center of Additive Manufacturing, Grant No. ZCZZ20-04; and Fujian Provincial Department of Human Resources and Social Affairs, Grant No. GY-Z19045.

Acknowledgments

The authors gratefully acknowledge the support from the Public Service Platform for Technical Innovation of Machine Tool Industry in Fujian Province at the Fujian University of Technology.

Conflicts of Interest

The authors declare no conflict of interest.

References

  1. Wang, K.; Chang, B.; Chen, J.; Fu, H.; Lin, Y.; Lei, Y. Effect of molybdenum on the microstructures and properties of stainless steel coatings by laser cladding. Appl. Sci. 2017, 7, 1065. [Google Scholar] [CrossRef]
  2. Zhang, M.; Zhou, X.; Yu, X.; Li, J. Synthesis and characterization of refractory TiZrNbWMo high-entropy alloy coating by laser cladding. Surf. Coat. Technol. 2017, 311, 321–329. [Google Scholar] [CrossRef]
  3. Liu, J.; Yu, H.; Chen, C.; Weng, F.; Dai, J. Research and development status of laser cladding on magnesium alloys: A review. Opt. Laser Eng. 2017, 93, 195–210. [Google Scholar] [CrossRef]
  4. Lv, Y.H.; Li, J.; Tao, Y.F.; Hu, L.F. High-temperature wear and oxidation behaviors of TiNi/Ti2Ni matrix composite coatings with TaC addition prepared on Ti6Al4V by laser cladding. Appl. Surf. Sci. 2017, 402, 478–494. [Google Scholar] [CrossRef]
  5. Lian, G.; Zhang, H.; Zhang, Y.; Tanaka, M.L.; Chen, C.; Jiang, J. Optimizing processing parameters for multi-track laser cladding utilizing multi-response grey relational analysis. Coatings 2019, 9, 356. [Google Scholar] [CrossRef] [Green Version]
  6. Sabahi, N.A.; Ahmadi, Z.; Babapoor, A.; Shokouhimehr, M.; Shahedi Asl, M. Microstructure and thermomechanical characteristics of spark plasma sintered TiC ceramics doped with nano-sized WC. Ceram. Int. 2019, 45, 2153–2160. [Google Scholar] [CrossRef]
  7. AlMangour, B.; Grzesiak, D.; Yang, J. In situ formation of TiC-particle-reinforced stainless steel matrix nanocomposites during ball milling: Feedstock powder preparation for selective laser melting at various energy densities. Powder Technol. 2018, 326, 467–478. [Google Scholar] [CrossRef]
  8. Wang, C.; Gao, Y.; Zeng, Z.; Fu, Y. Effect of rare-earth on friction and wear properties of laser cladding Ni-based coatings on 6063Al. J. Alloys Compd. 2017, 727, 278–285. [Google Scholar] [CrossRef]
  9. Dudziak, T.; Boron, L.; Gupta, A.; Saraf, S.; Skierski, P.; Seal, S.; Sobczak, N.; Purgert, R. Steam oxidation resistance and performance of newly developed coatings for Haynes® 282® Ni-based alloy. Corros. Sci. 2018, 138, 326–339. [Google Scholar] [CrossRef]
  10. Lian, G.; Zhang, H.; Zhang, Y.; Yao, M.; Huang, X.; Chen, C. Computational and experimental investigation of micro-hardness and wear resistance of Ni-based alloy and TiC composite coating obtained by laser cladding. Materials 2019, 12, 793. [Google Scholar] [CrossRef] [Green Version]
  11. Hong, C.; Gu, D.; Dai, D.; Alkhayat, M.; Urban, W.; Yuan, P.; Cao, S.; Gasser, A.; Weisheit, A.; Kelbassa, I.; et al. Laser additive manufacturing of ultrafine TiC particle reinforced Inconel 625 based composite parts: Tailored microstructures and enhanced performance. Mater. Sci. Eng. A 2015, 635, 118–128. [Google Scholar] [CrossRef]
  12. Xu, X.; Mi, G.; Xiong, L.; Jiang, P.; Shao, X.; Wang, C. Morphologies, microstructures and properties of TiC particle reinforced Inconel 625 coatings obtained by laser cladding with wire. J. Alloy. Compd. 2018, 740, 16–27. [Google Scholar] [CrossRef]
  13. Saroj, S.; Sahoo, C.K.; Tijo, D.; Kumar, K.; Masanta, M. Sliding abrasive wear characteristic of TIG cladded TiC reinforced Inconel825 composite coating. Int. J. Refract. Met. Hard Mater. 2017, 69, 119–130. [Google Scholar] [CrossRef]
  14. Sahoo, C.K.; Masanta, M. Microstructure and mechanical properties of TiC-Ni coating on AISI304 steel produced by TIG cladding process. J. Mater. Process. Technol. 2017, 240, 126–137. [Google Scholar] [CrossRef]
  15. Olakanmi, E.O.; Nyadongo, S.T.; Malikongwa, K.; Lawal, S.A.; Botes, A.; Pityana, S.L. Multi-variable optimisation of the quality characteristics of fiber-laser cladded Inconel-625 composite coatings. Surf. Coatings Technol. 2019, 357, 289–303. [Google Scholar] [CrossRef]
  16. Zhao, Y.; Yu, T.; Sun, J.; Jiang, S. Microstructure and properties of laser cladded B4C/TiC/Ni-based composite coating. Int. J. Refract. Met. Hard Mater. 2020, 86, 105112. [Google Scholar] [CrossRef]
  17. He, X.; Song, R.G.; Kong, D.J. Effects of TiC on the microstructure and properties of TiC/TiAl composite coating prepared by laser cladding. Opt. Laser Technol. 2019, 112, 339–348. [Google Scholar] [CrossRef]
  18. Cao, Y.; Zhi, S.; Qi, H.; Zhang, Y.; Qin, C.; Yang, S. Evolution behavior of ex-situ NbC and properties of Fe-based laser clad coating. Opt. Laser Technol. 2020, 124, 105999. [Google Scholar] [CrossRef]
  19. Liu, C.; Li, C.; Zhang, Z.; Sun, S.; Zeng, M.; Wang, F.; Guo, Y.; Wang, J. Modeling of thermal behavior and microstructure evolution during laser cladding of AlSi10Mg alloys. Opt. Laser Technol. 2020, 123, 105926. [Google Scholar] [CrossRef]
  20. Liang, J.; Liu, Y.; Li, J.; Zhou, Y.; Sun, X. Epitaxial growth and oxidation behavior of an overlay coating on a Ni-base single-crystal superalloy by laser cladding. J. Mater. Sci. Technol. 2019, 35, 344–350. [Google Scholar] [CrossRef]
  21. Li, Y.; Dong, S.; Yan, S.; Li, E.; Liu, X.; He, P.; Xu, B. Deep pit repairing of nodular cast iron by laser cladding NiCu/Fe-36Ni low-expansion composite alloy. Mater. Charact. 2019, 151, 273–279. [Google Scholar] [CrossRef]
  22. Zhan, X.; Qi, C.; Gao, Z.; Tian, D.; Wang, Z. The influence of heat input on microstructure and porosity during laser cladding of Invar alloy. Opt. Laser Technol. 2019, 113, 453–461. [Google Scholar] [CrossRef]
Figure 1. SEM image of cladding powder. (a) Ni35A; (b) TiC.
Coatings 10 00774 g001
Figure 2. Laser cladding system. (a) Experimental setup; (b) Schematic diagram.
Coatings 10 00774 g002
Figure 3. (a) Distribution of residual wear rate, (b) Distribution of predicted and actual wear rate.
Coatings 10 00774 g003
Figure 4. The response of wear rate to significant factors LP and PR. (a) 3D response surface; (b) contour plot.
Coatings 10 00774 g004
Figure 5. XRD spectrum.
Coatings 10 00774 g005
Figure 6. Element distribution of cladding layers at different laser powers. (a) 13# sample: 1.2 kW, 7 mm/s, 1000 L/h, 60% TiC; (b) 3# sample: 1.4 kW, 7 mm/s, 1000 L/h, 60% TiC.
Coatings 10 00774 g006
Figure 7. Microstructure of cladding layers at different laser powers: (a) 2# sample: 1.4 kW, 7 mm/s, 1000 L/h, 20% TiC; (b) 4# sample: 1.2 kW, 7 mm/s, 1000 L/h, 20% TiC.
Coatings 10 00774 g007
Figure 8. Friction and wear diagram of cladding layer with different laser powers: (a) 2# sample: 1.4 kW, 7 mm/s, 1000 L/h, 20% TiC; (b) 4# sample: 1.2 kW, 7 mm/s, 1000 L/h, 20% TiC.
Coatings 10 00774 g008
Figure 9. Microstructure of the top, bottom, and middle of the cladding layer with different TiC powder ratios: (a) 12# sample, 1.2 kW, 5 mm/s, 1000 L/h, 20% TiC; (b) 11# sample, 1.2 kW, 5 mm/s, 1000 L/h, 60% TiC.
Coatings 10 00774 g009
Figure 10. Friction and wear diagram of cladding layer with different TiC powder ratios: (a) 12# sample: 1.2 kW, 5 mm/s, 1000 L/h, 20% TiC; (b) 11# sample: 1.2 kW, 5 mm/s, 1000 L/h, 60% TiC.
Coatings 10 00774 g010
Figure 11. (a) 3D response curve of the interaction between SS and PR against wear rate; (b) Contour map of the interaction between SS and PR against wear rate.
Coatings 10 00774 g011
Figure 12. Microstructure of the top, middle, and bottom of the cladding layer at different scanning speeds: (a) 6# sample: 1.4 kW, 7 mm/s, 1400 L/h, 20% TiC; (b) 8# sample: 1.4 kW, 5 mm/s, 1400 L/h, 20% TiC.
Coatings 10 00774 g012
Figure 13. Friction and wear diagram of cladding layer at different scanning speeds: (a) 6# sample: 1.4 kW, 7 mm/s, 1400 L/h, 20% TiC; (b) 8# sample: 1.4 kW, 5 mm/s, 1400 L/h, 20% TiC.
Coatings 10 00774 g013
Table 1. Chemical components of Ni35A and TiC particle (wt.%).
ElementCSiOFeCrBT.C (Total Carbon)F.C (Free Carbon)NNi
Ni35A0.323.35<0.052.757.751.65Rest
TiC0.020.50.08>18.8<0.50.5
Table 2. Friction and wear parameter table.
Wear ParametersUnitSpecification
Friction pair(mm)Tungsten steel-ϕ 6 mm
Loading force(N)35
Speed(mm/s)10
Sliding distance(mm)4
Wear time(min)60
ModeLinear reciprocating
Temperature°CRoom temperature
Table 3. Studied process variables and levels.
VariablesNotationUnitLevels of Input Variables
Code−11
Laser powerLPkWActual1.21.4
Scanning speedSSmm/s57
Gas flowGFL/h10001400
TiC powder ratioPRwt.%2060
Table 4. Full factorial design and results of wear rate.
RunLP (kW)SS (mm/s)GF (L/h)PR (wt.%)Wear Rate (μm3/N·mm) 1Micro-Hardness (HRC)
11.4510002041.98163.4
21.4710002060.70859.7
31.4710006018.99772.6
41.27100020101.97752.6
51.2714002096.20553.3
61.4714002064.50558.7
71.2714006021.15772.0
81.4514002051.77659.7
91.4714006017.20273.4
101.2514006023.01370.8
111.2510006025.58670.0
121.2510002075.74855.4
131.2710006041.82169.9
141.2514002071.81856.6
151.4510006011.92275.2
161.4514006017.04373.6
Table 5. Cladding efficiency variance analysis table.
SourceSum of
Squares
Degree of
Freedom
Mean
Square
F
Value
p-Value
Prob > F
Model12,586.6052517.3269.28<0.0001Significant
LP1874.7011874.7051.59<0.0001
SS671.911671.9118.490.0016
PR9407.8819407.88258.91<0.0001
LP × PR403.661403.6611.110.0076
SS × PR228.461228.466.290.0310
Residual363.361036.34
Cor total12,949.9715
R-squared0.9719Adj R-squared0.9579
Pred R-squared0.9282Adeq precision22.514
Table 6. The element content of cladding layers at different laser powers (Labels 1–6 belong to 2# sample, Labels 7–12 belong to 4# sample).
LabelCTiCrFeNi
113.26553.3295.0713.70924.626
28.3894.7425.9476.61674.296
314.10952.7135.9594.02123.198
49.6044.7634.5835.38875.662
512.30154.7285.1758.84219.224
66.9063.0845.86415.92968.216
712.05748.6355.7536.74026.816
88.0744.1145.48712.22070.106
911.72557.3886.5685.70518.614
107.5243.9935.02212.84470.617
1110.50758.4227.1868.44115.444
125.3033.2686.43015.95769.042
Table 7. Element content table of micro TiC cladding layer structure determination. (Labels 1–6 belong to 12# sample, Labels 7–12 belong to 11# sample).
LabelCTiCrFeNi
114.88944.9697.7952.34630.001
29.4374.9405.2953.14377.185
310.13554.2015.8132.50127.350
46.1025.5365.9313.22279.209
510.01758.4227.3726.25417.935
66.1633.8335.4626.43578.107
713.11475.2881.4101.4028.787
88.54613.8854.1142.60570.849
911.89972.9292.1852.19410.794
106.86713.3675.4603.96170.344
1111.24571.9781.3115.9979.740
126.2189.5645.8209.96468.433
Table 8. Element content table of cladding structure determination at different scanning speeds. (Labels 1–6 belong to 6# sample, Labels 7–12 belong to 8# sample.)
LabelCTiCrFeNi
112.05748.6355.7536.74026.816
28.0744.1145.48712.22070.106
311.72557.3886.5685.70518.614
47.5243.9935.02212.84470.617
510.50758.4227.1868.44115.444
65.3033.2686.43015.95769.042
713.26553.3295.0713.70924.626
88.3894.7425.9476.61674.296
914.10952.7135.9594.02123.198
109.6044.7634.5835.38875.662
1112.30154.7285.1758.84219.224
126.9063.0845.86415.92968.216

