
Modifying Precursor Solutions to Obtain Screen-Printable Inks for Tungsten Oxides Electrochromic Film Preparation

 , and
, and 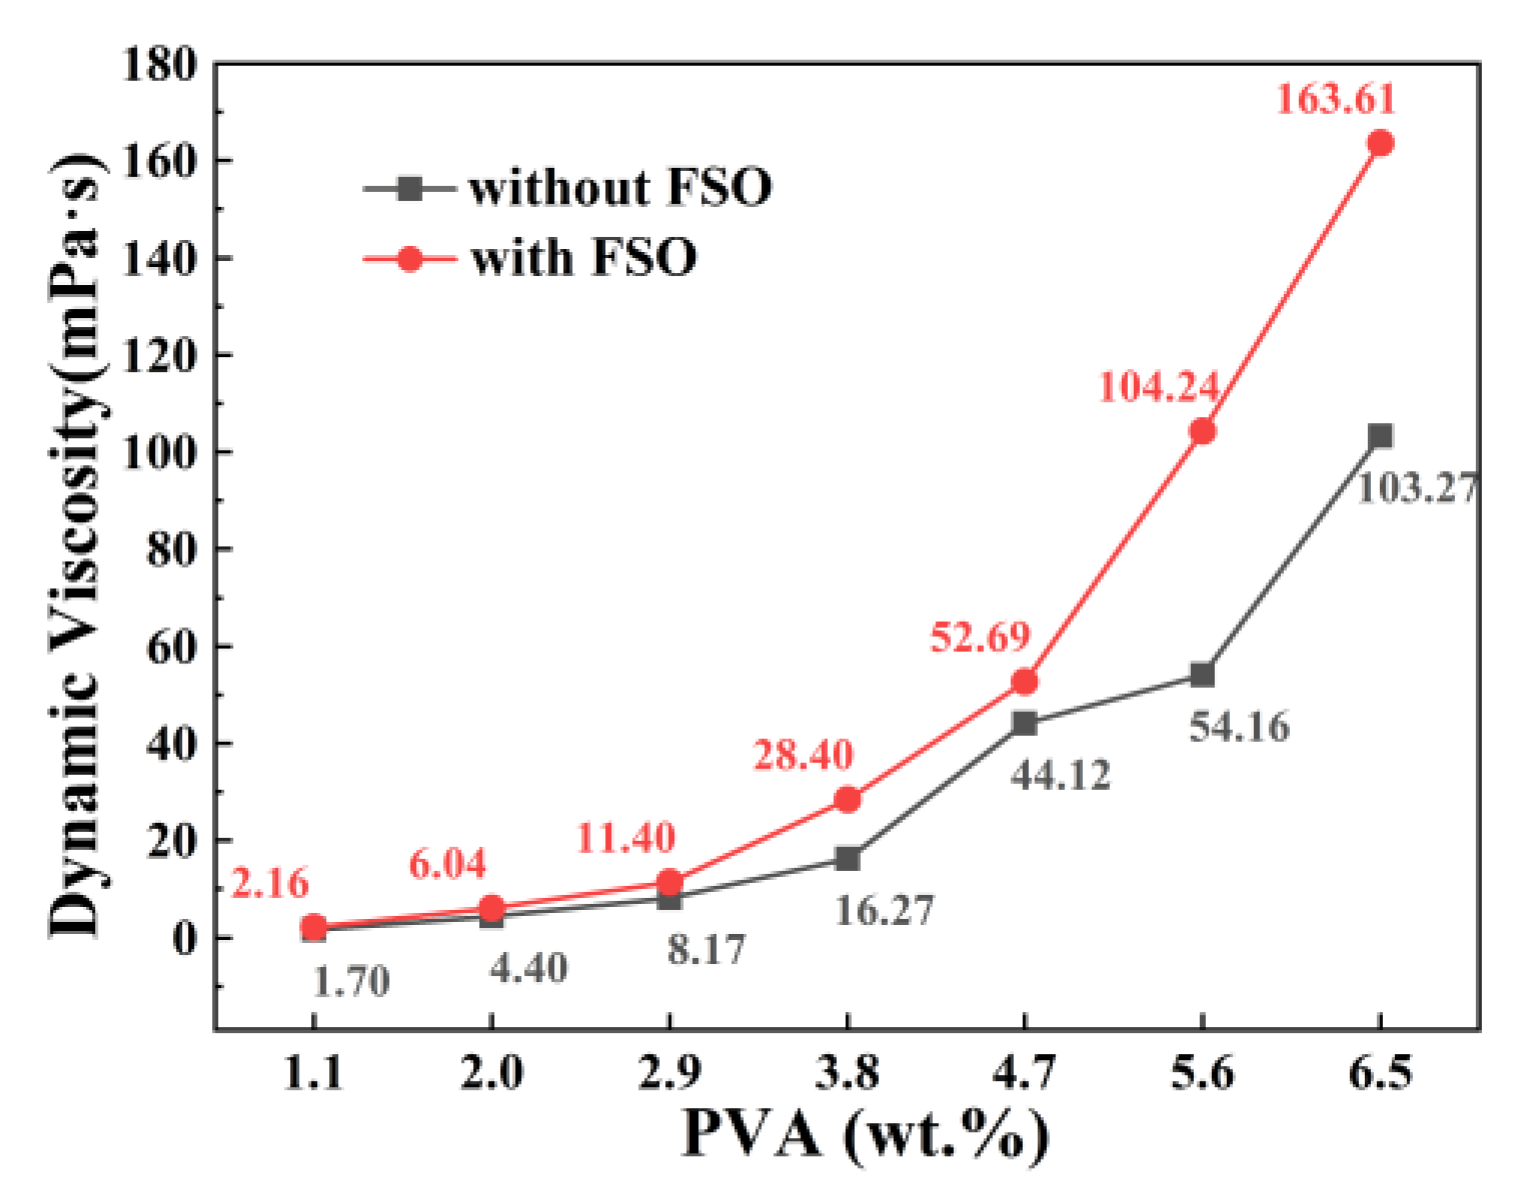
Abstract
:1. Introduction
2. Materials and Methods
3. Results and Discussion
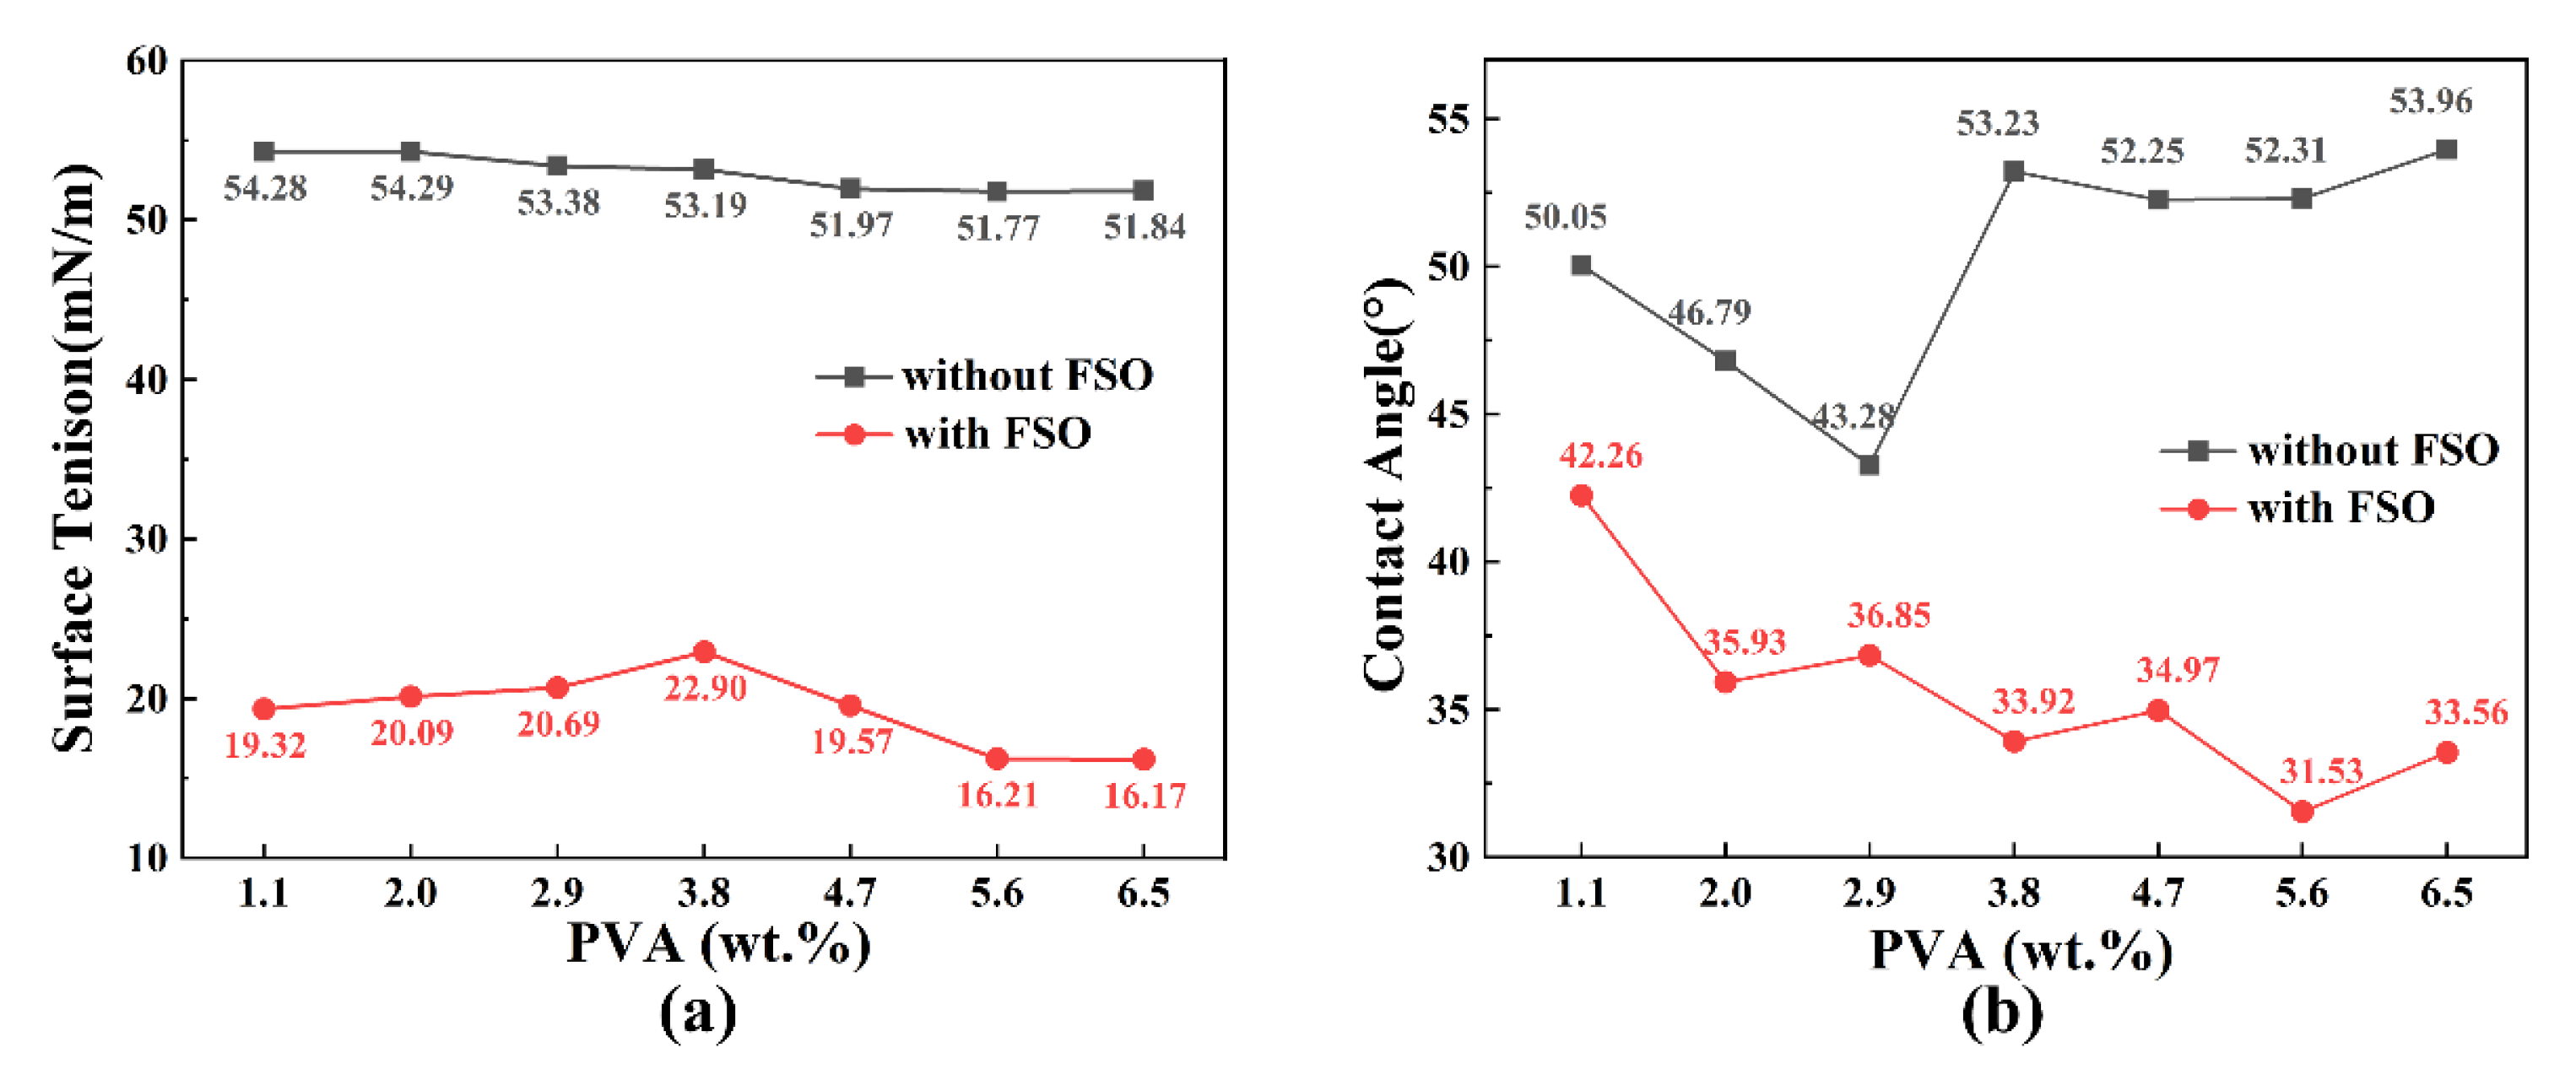
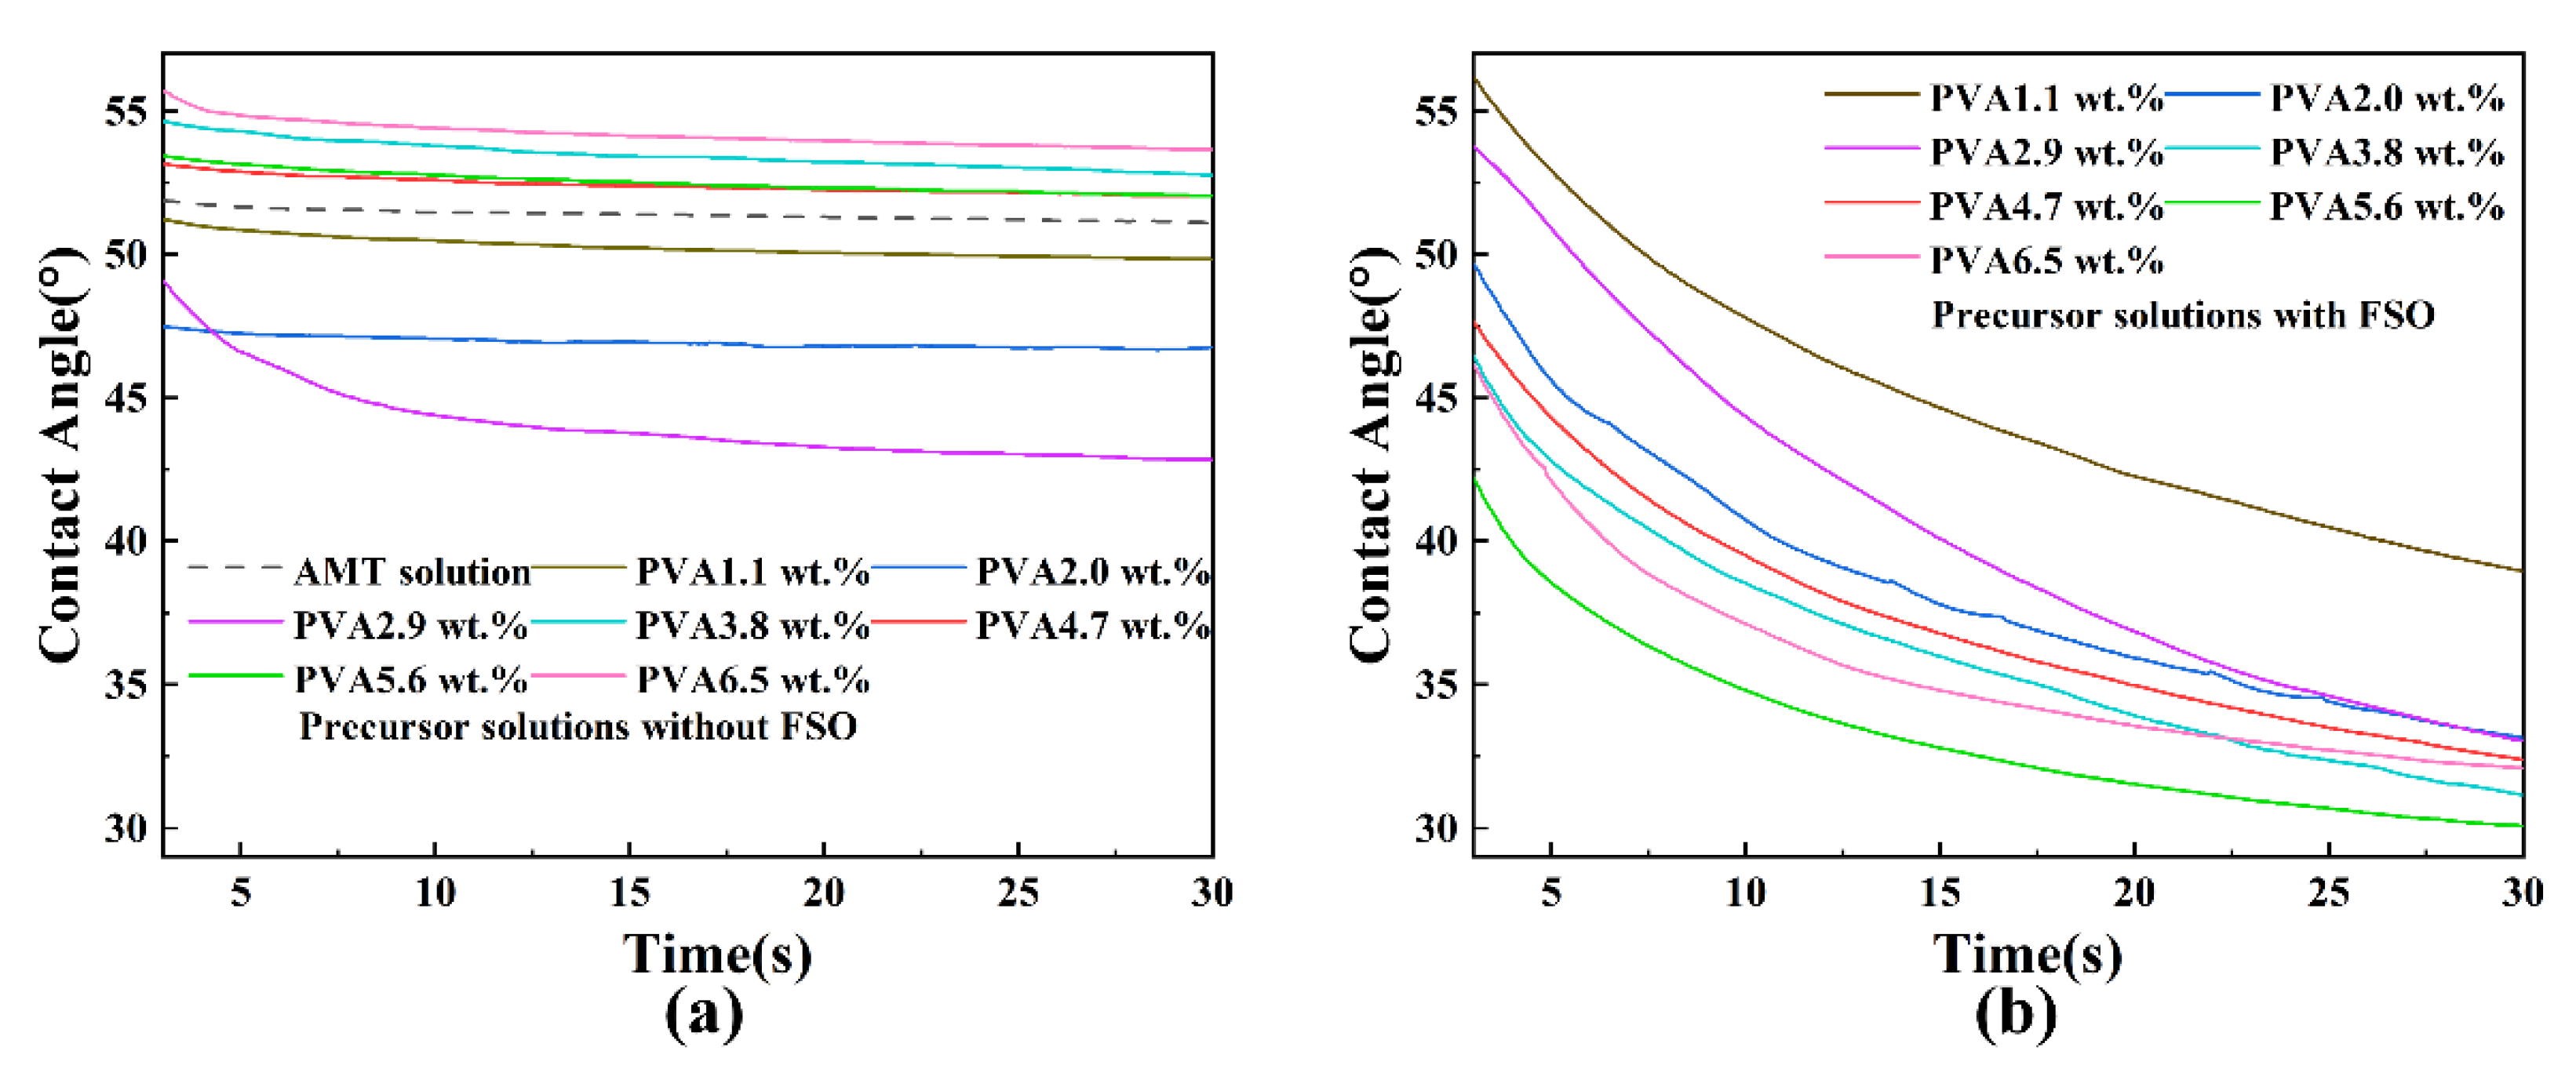
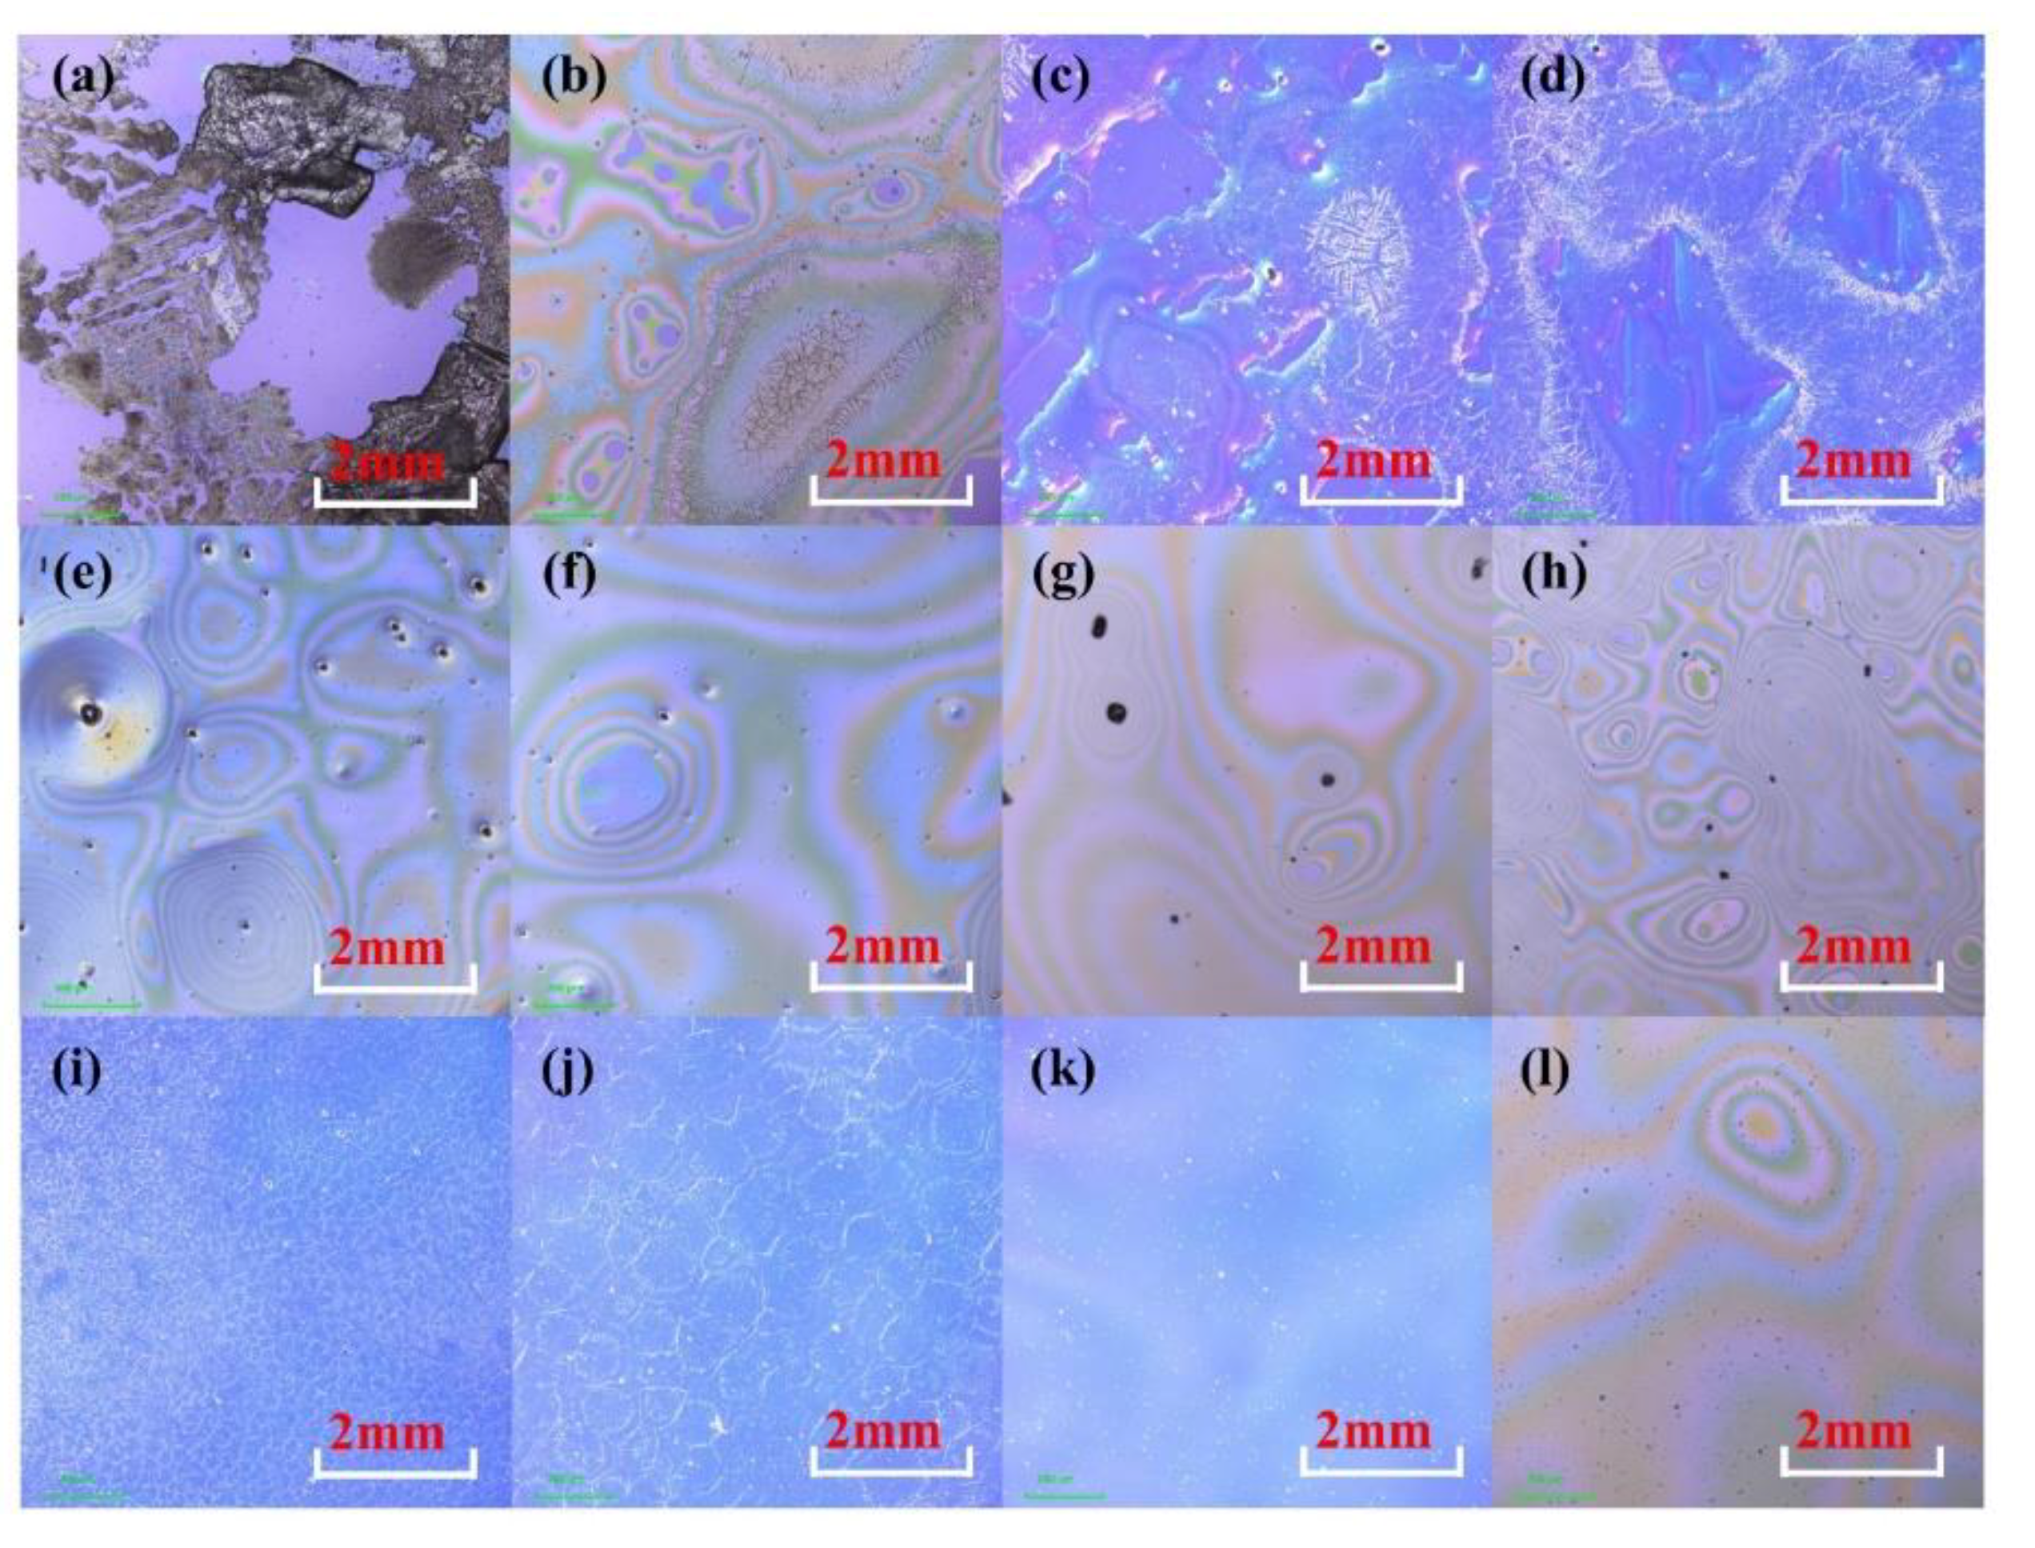
3.1. Effect of Polyvinyl Alcohol (PVA) and 2-Perfluoroalkyl Ethanol (FSO) on Precursor Solutions and Film Formation
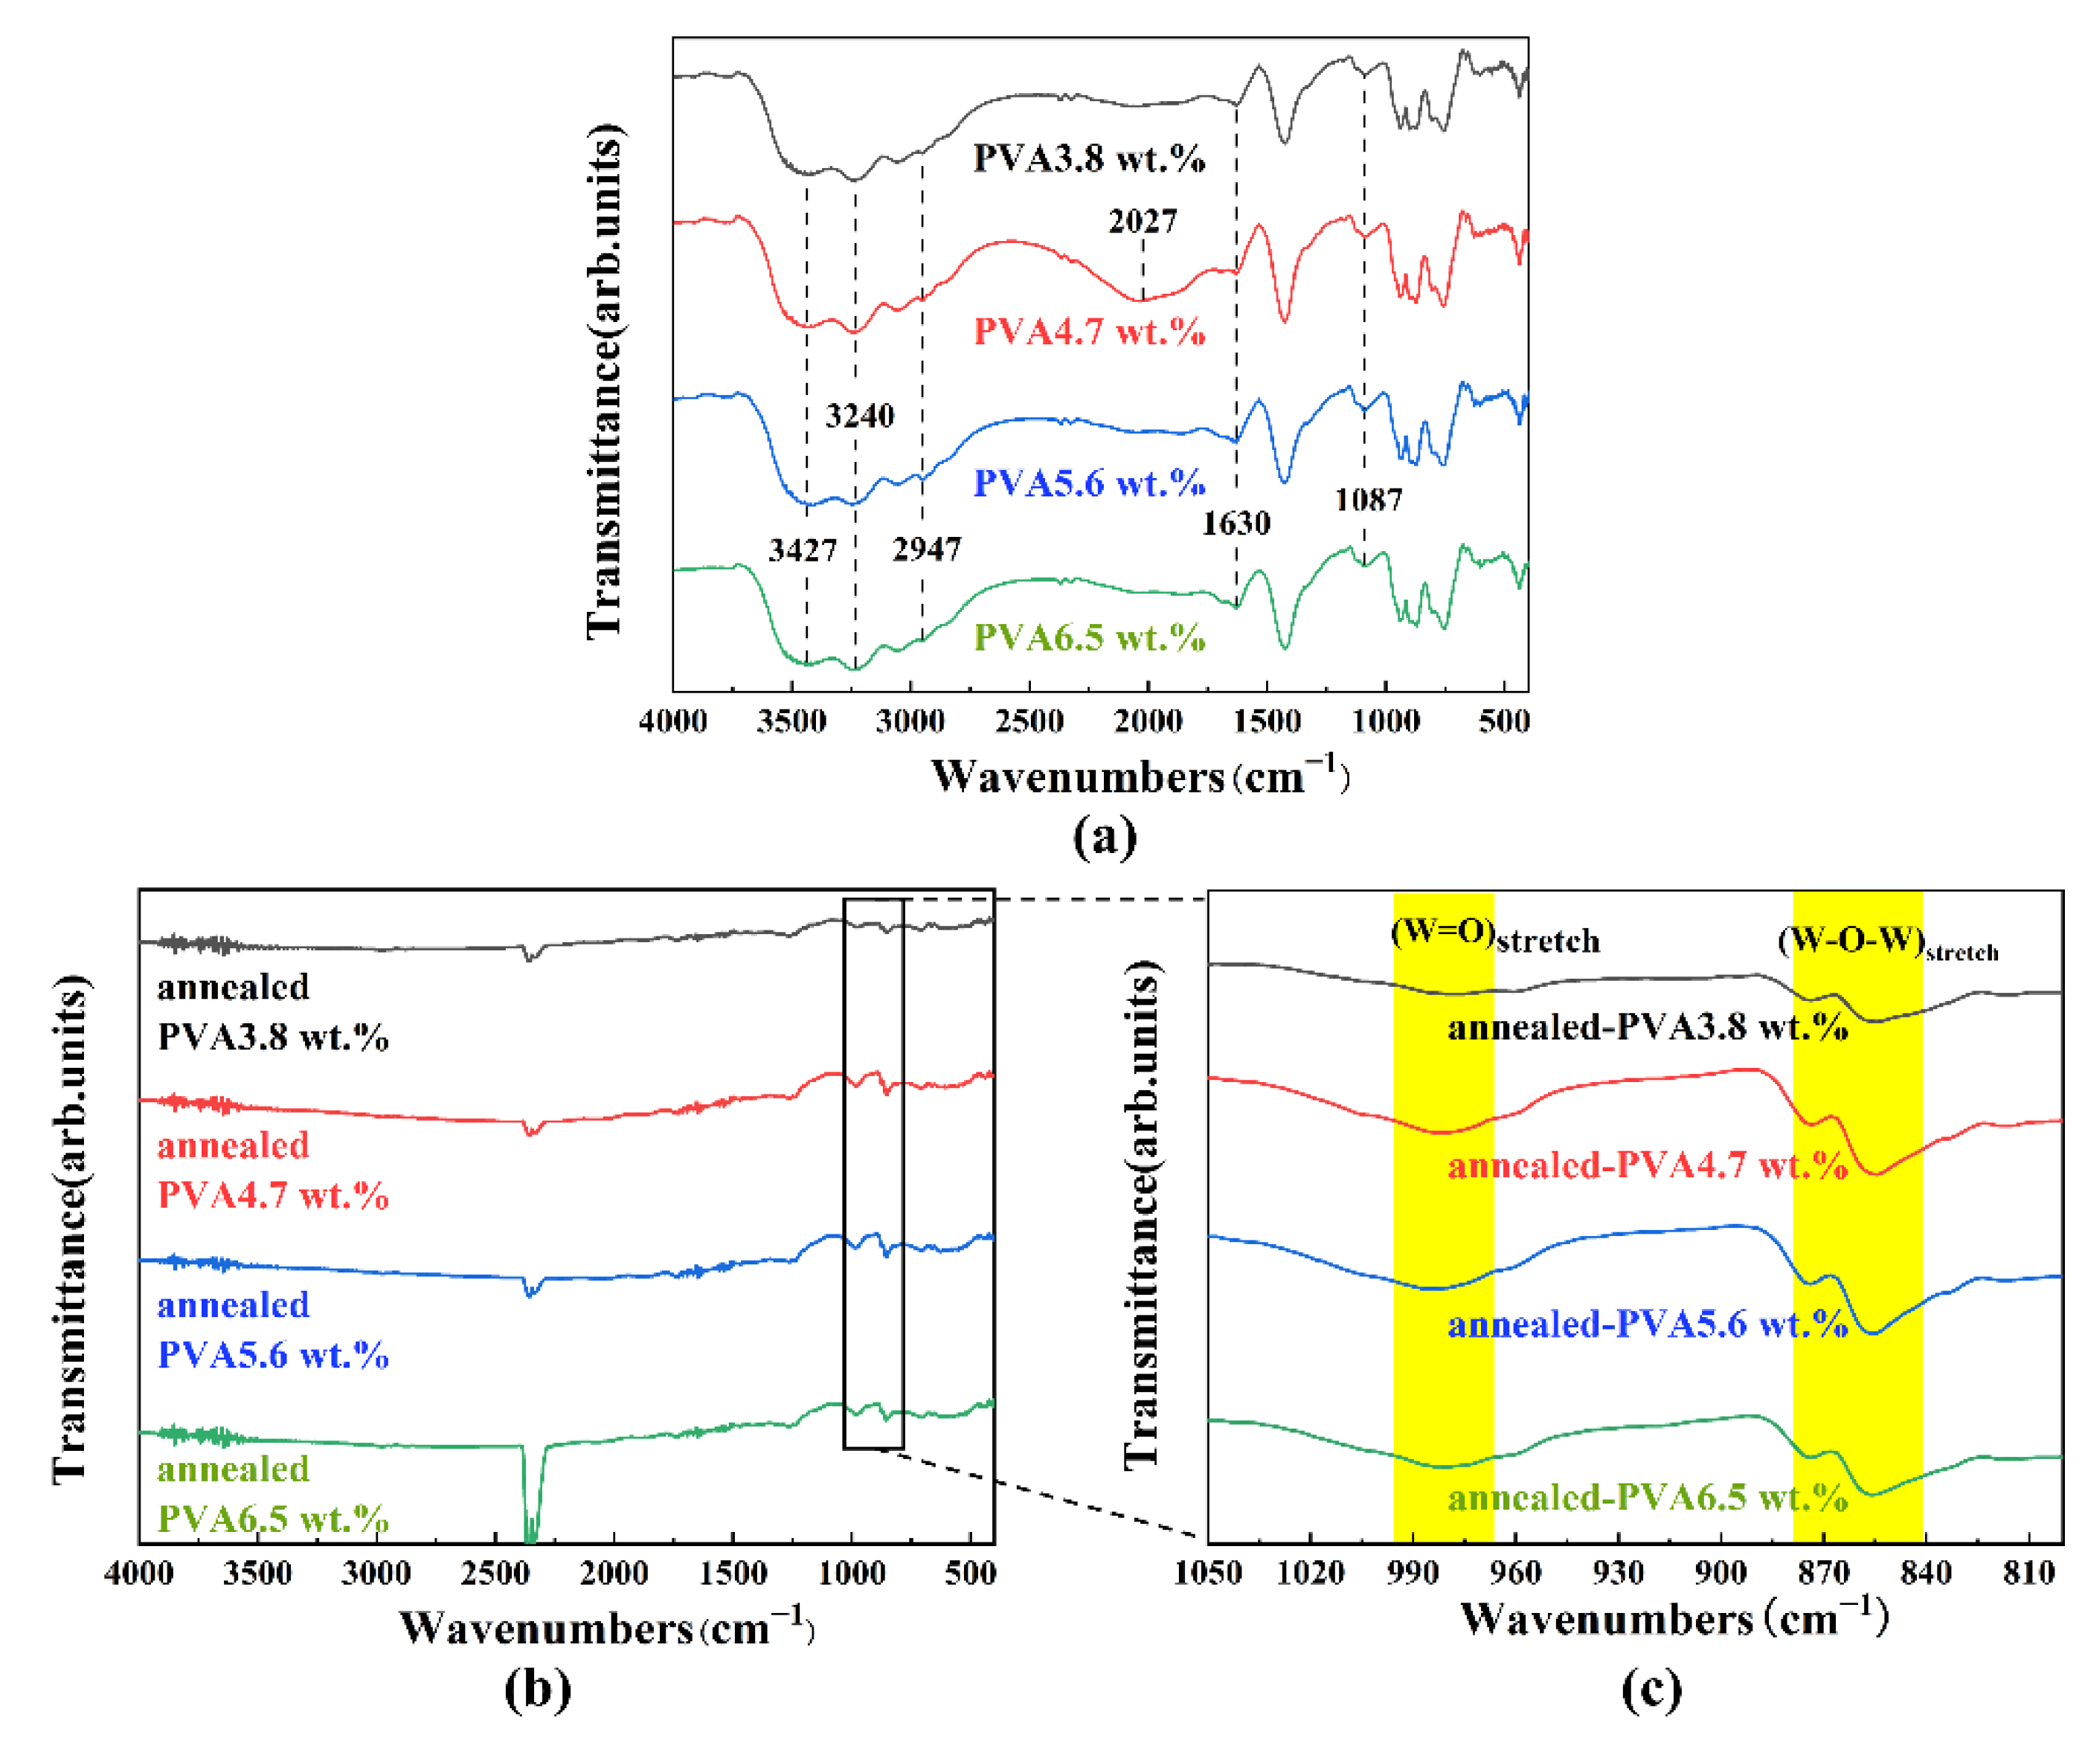
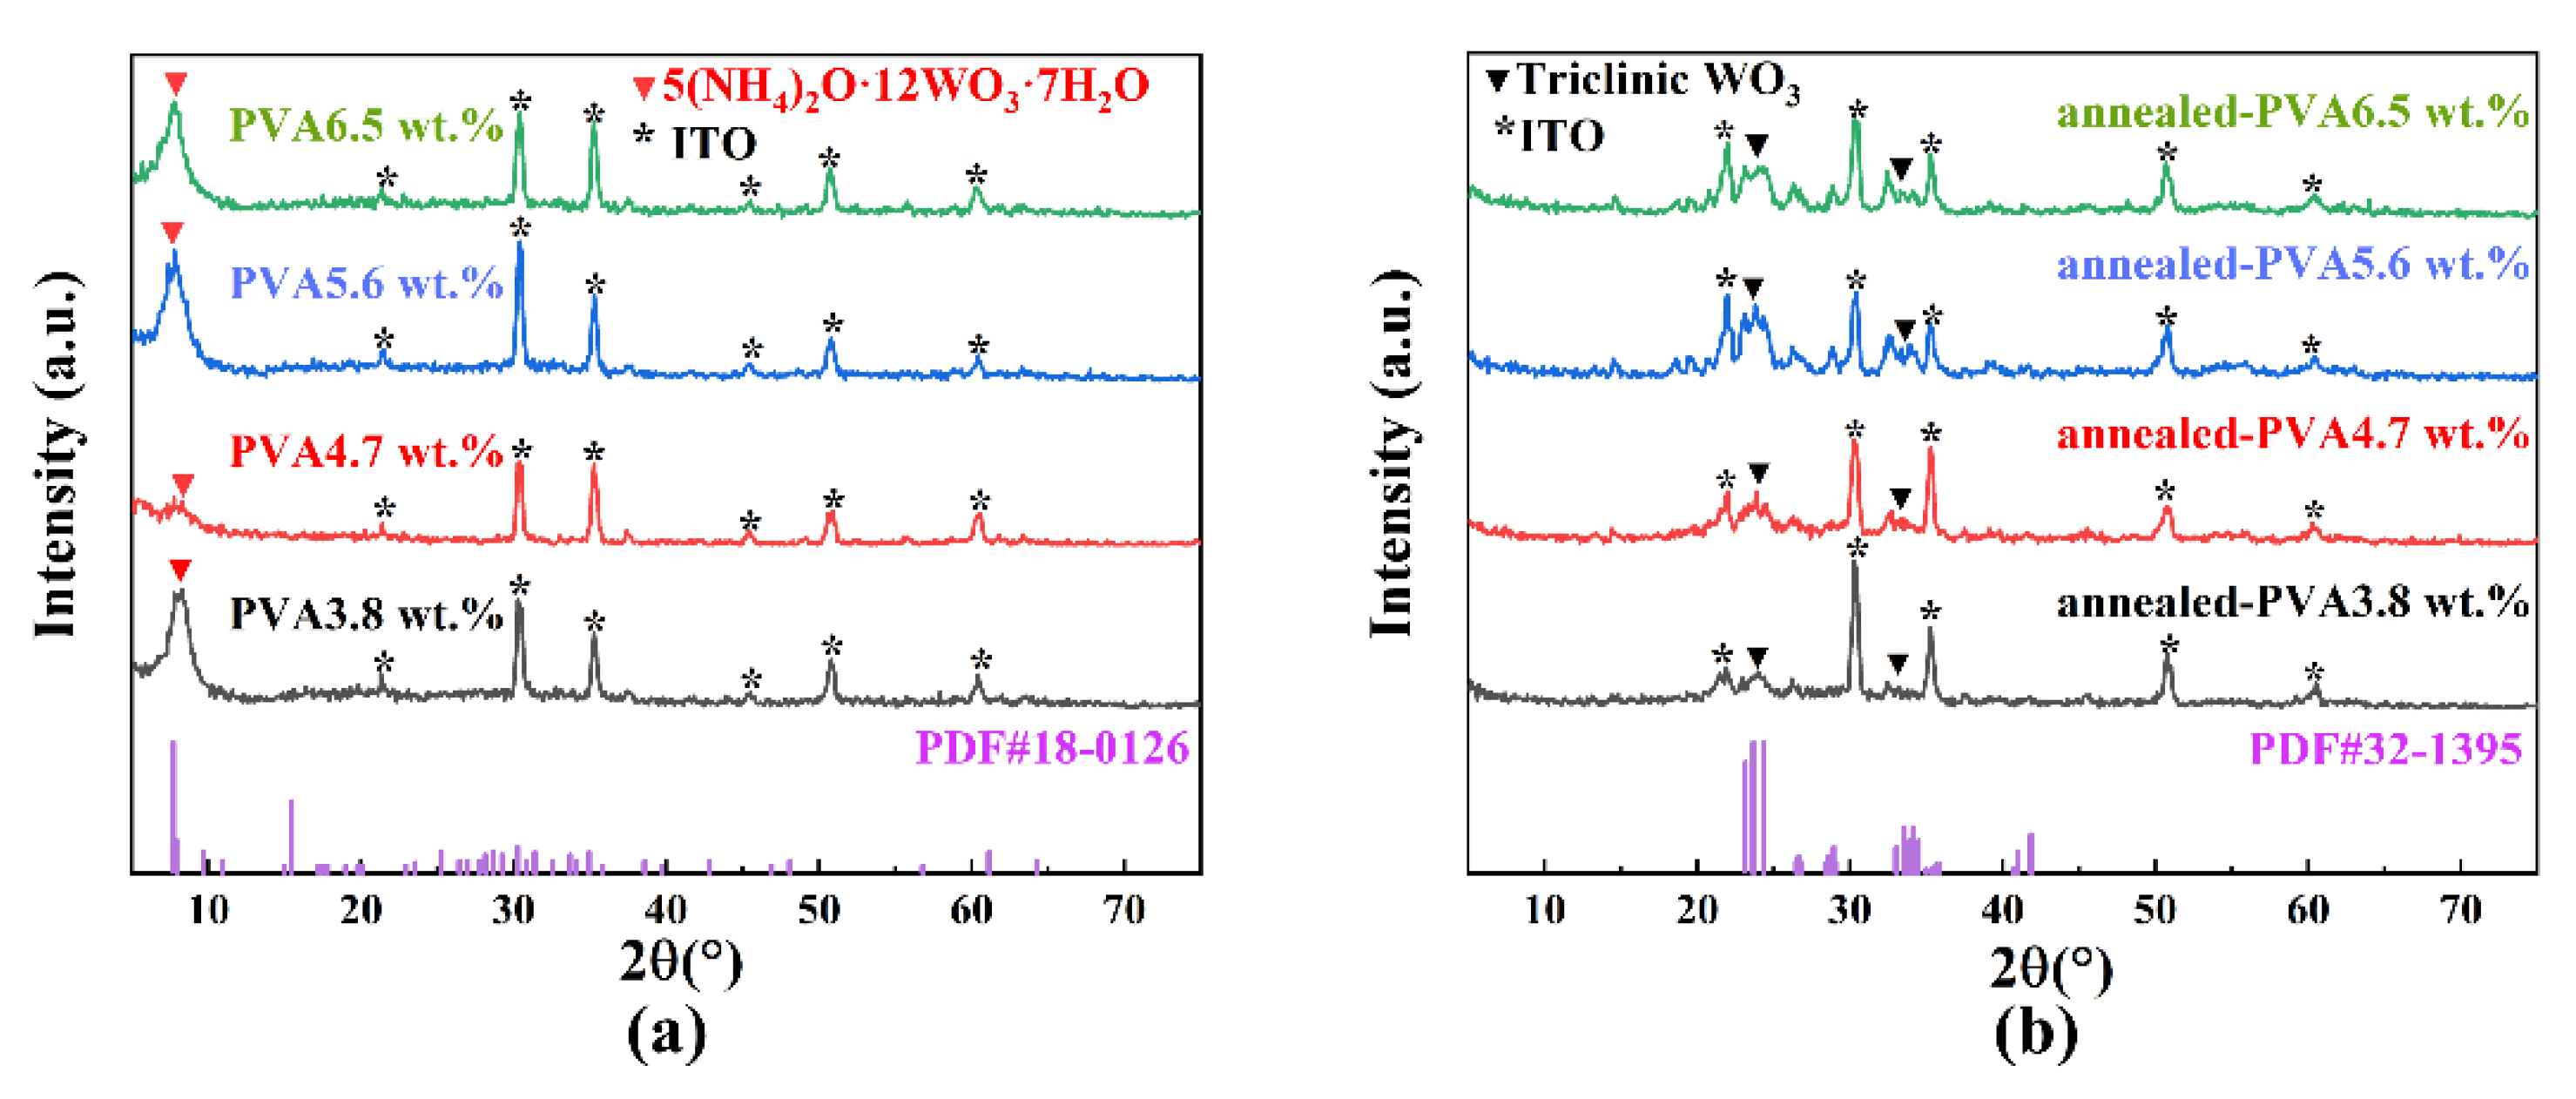
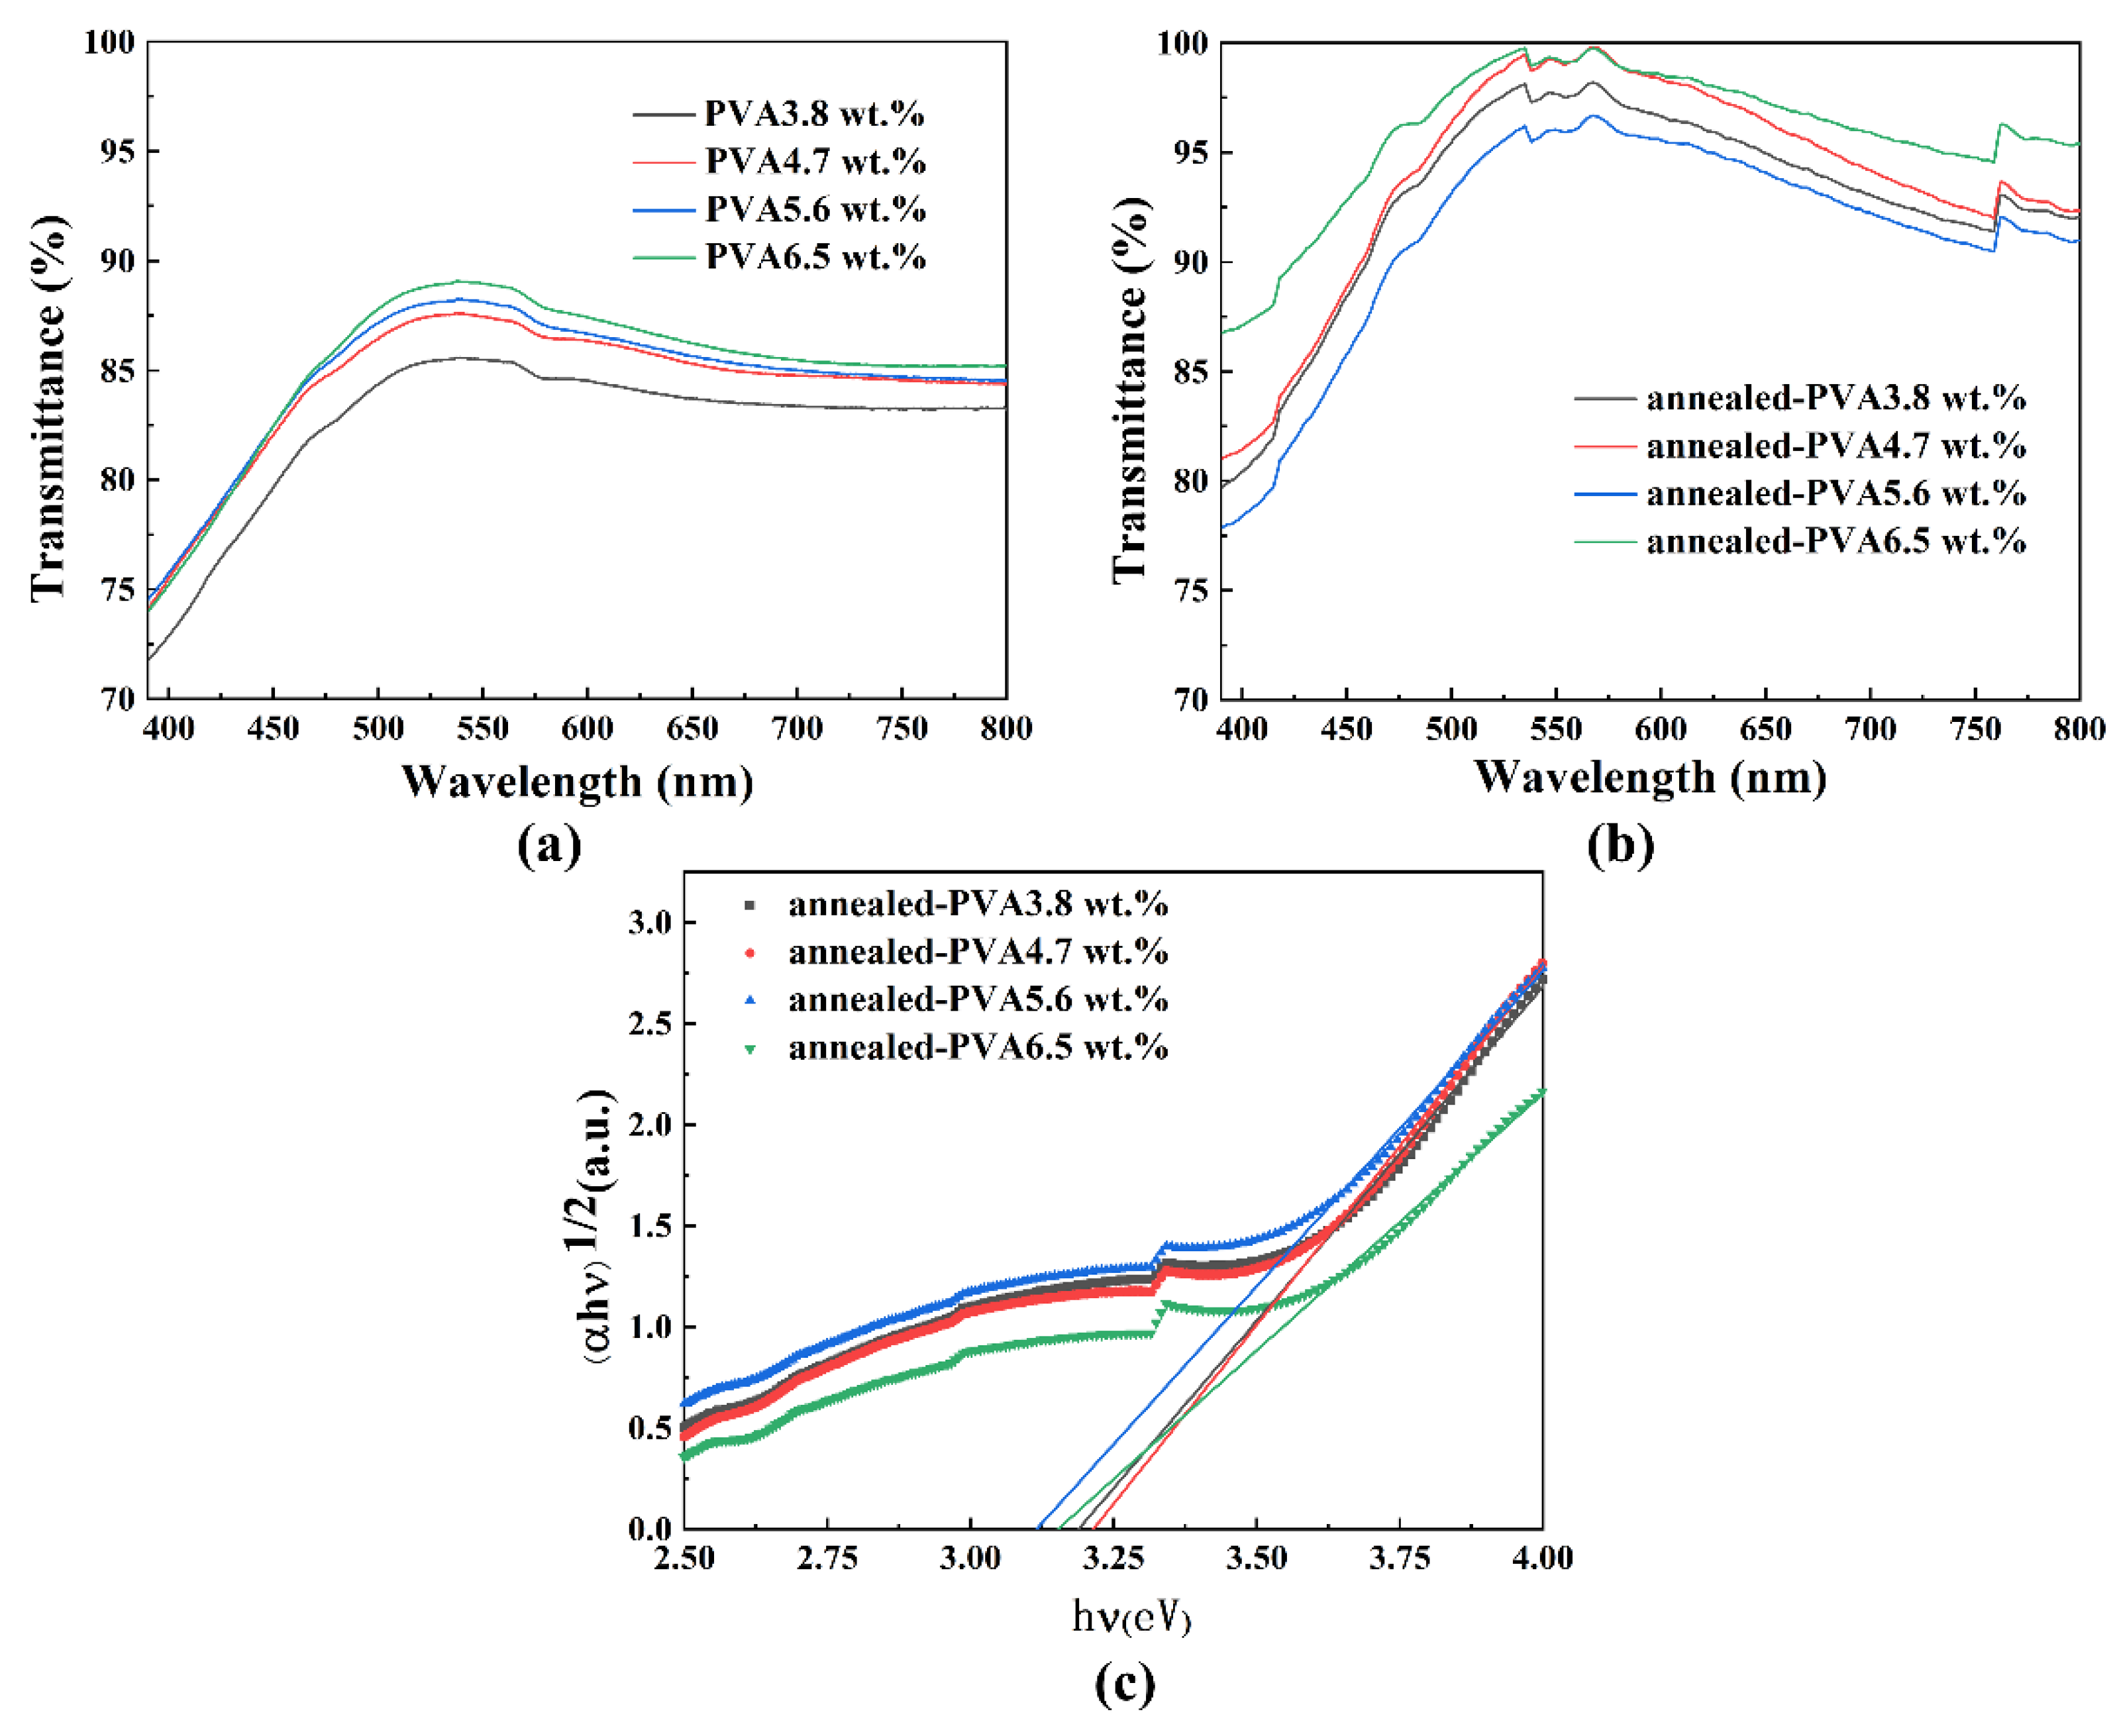
3.2. Effect of Annealing on Composition and Transmittance of Films
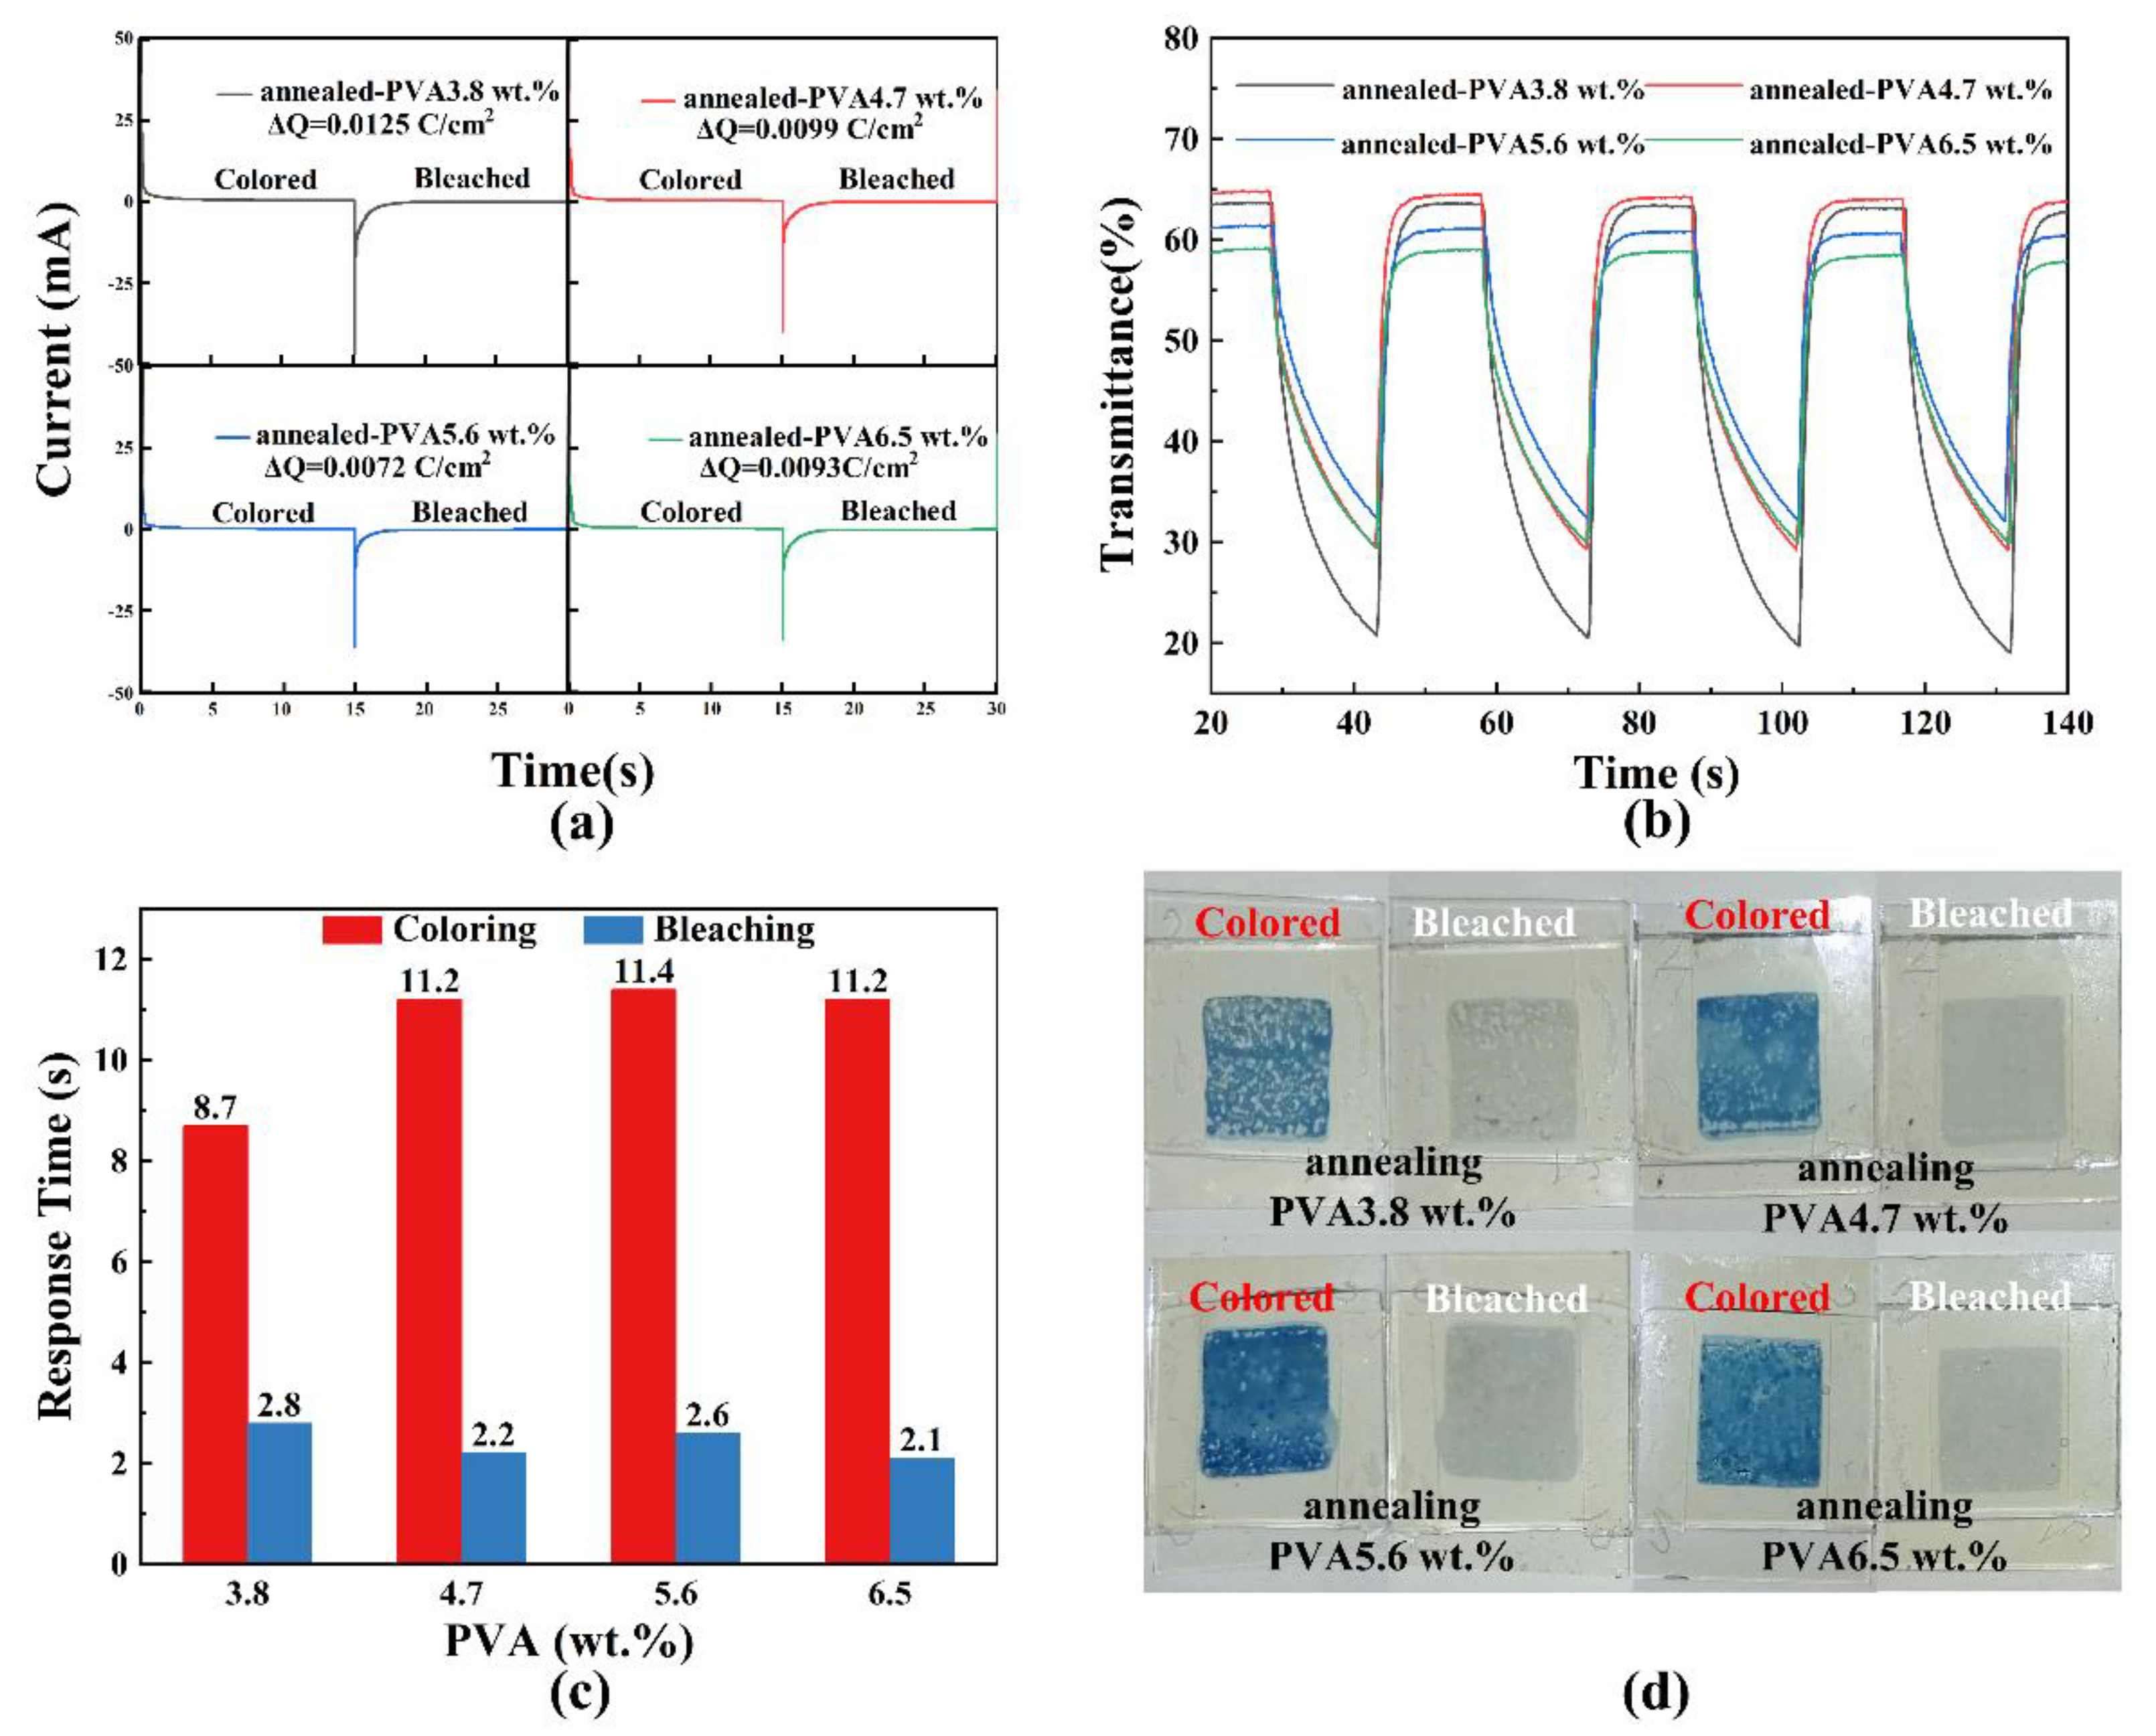
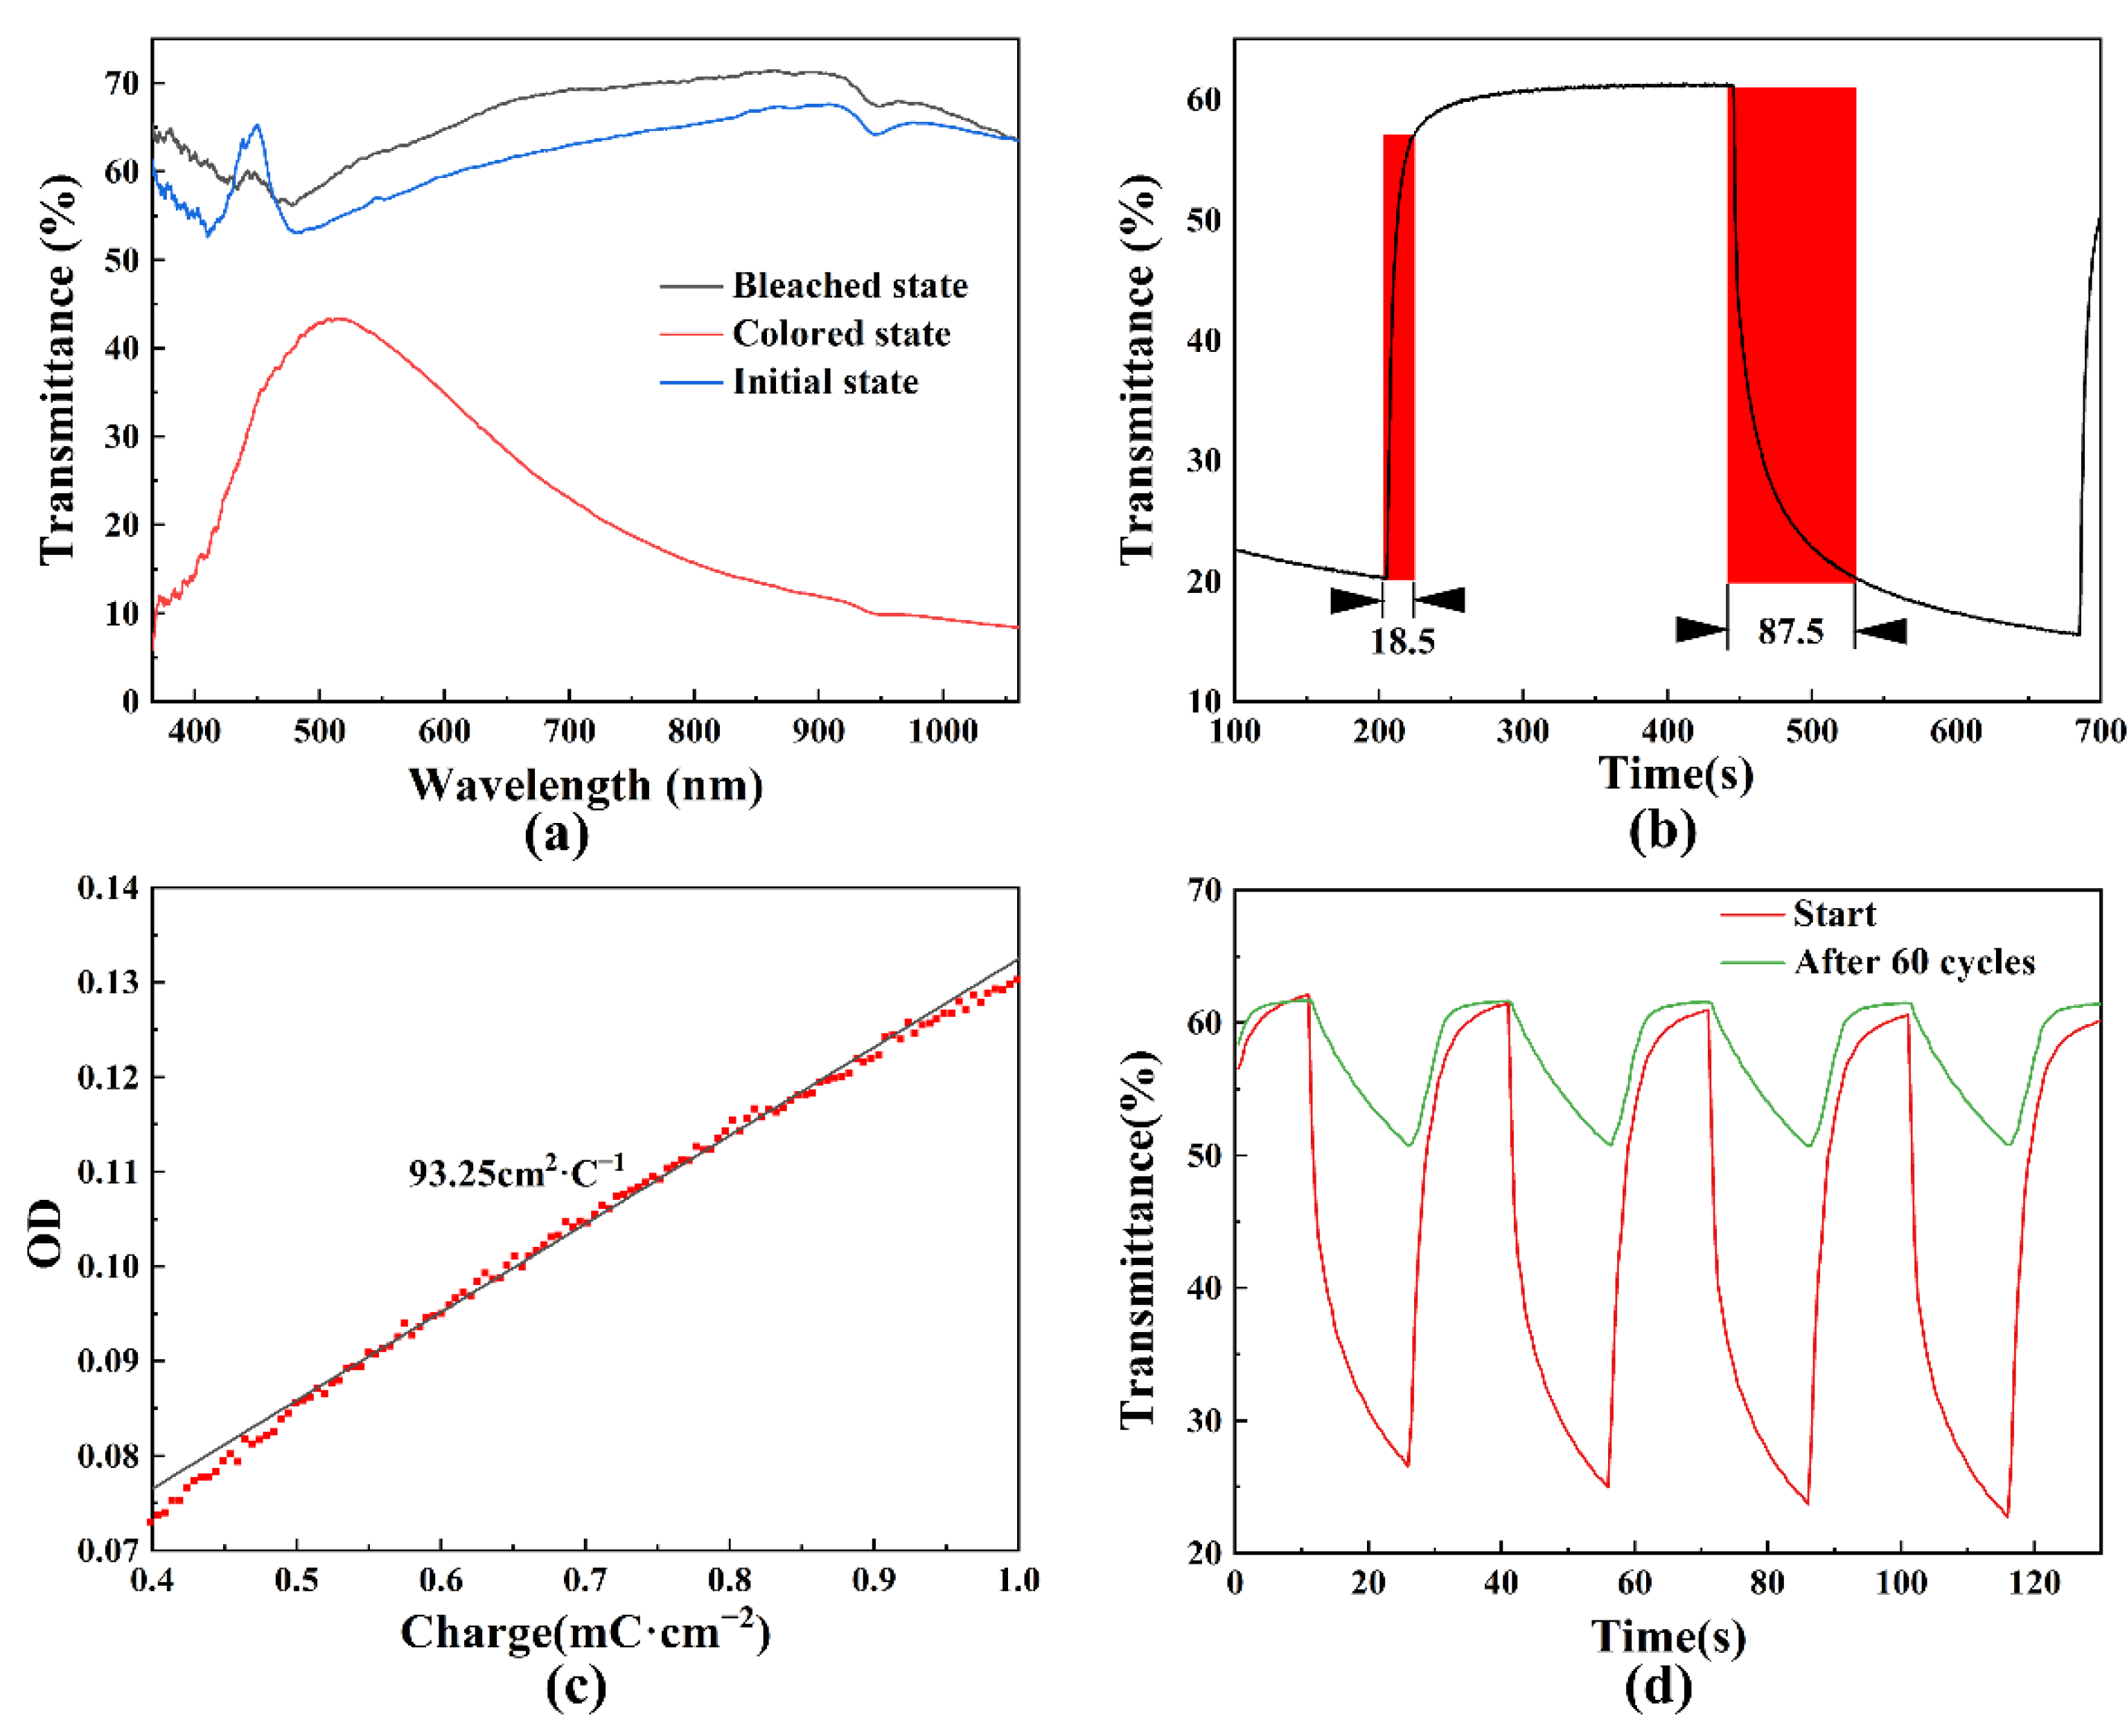
3.3. Electrochromic Performance
4. Conclusions
Author Contributions
Funding
Acknowledgments
Conflicts of Interest
References
- Wu, M.; Shi, Y.; Li, R.; Wang, P. Spectrally selective smart window with high near-infrared light shielding and controllable visible light transmittance. ACS Appl. Mater. Interfaces 2018, 10, 39819–39827. [Google Scholar] [CrossRef] [Green Version]
- Wang, Z.; Zhu, M.; Gou, S.; Pang, Z.; Wang, Y.; Su, Y.; Huang, Y.; Weng, Q.; Schmidt, O.G.; Xu, J. Pairing of luminescent switch with electrochromism for quasi-solid-state dual-function smart windows. ACS Appl. Mater. Interfaces 2018, 10, 31697–31703. [Google Scholar] [CrossRef] [PubMed]
- Kim, J.-H.; Hong, J.; Han, S.-H. Optimized physical properties of electrochromic smart windows to reduce cooling and heating loads of office buildings. Sustainability 2021, 13, 1815. [Google Scholar] [CrossRef]
- Ke, Y.; Chen, J.; Lin, G.; Wang, S.; Zhou, Y.; Yin, J.; Lee, P.S.; Long, Y. Smart windows: Electro-, thermo-, mechano-, photochromics, and beyond. Adv. Eng. Mater. 2019, 9, 1902066. [Google Scholar] [CrossRef]
- Cai, G.; Eh, A.L.-S.; Ji, L.; Lee, P.S. Recent advances in electrochromic smart fenestration. Adv. Sustain. Syst. 2017, 1, 1700074. [Google Scholar] [CrossRef]
- Li, H.; McRae, L.; Firby, C.J.; Elezzabi, A.Y. Rechargeable aqueous electrochromic batteries utilizing Ti-substituted tungsten molybdenum oxide based Zn2+ ion intercalation cathodes. Adv. Mater. 2019, 31, e1807065. [Google Scholar] [CrossRef] [PubMed]
- Celiesiute, R.; Ramanaviciene, A.; Gicevicius, M.; Ramanavicius, A. Electrochromic sensors based on conducting polymers, metal oxides, and coordination complexes. Crit. Rev. Anal. Chem. 2019, 49, 195–208. [Google Scholar] [CrossRef] [PubMed]
- Wu, W.; Wang, M.; Ma, J.; Cao, Y.; Deng, Y. Electrochromic metal oxides: Recent progress and prospect. Adv. Electron. Mater. 2018, 4, 1800185. [Google Scholar] [CrossRef]
- Wang, Z.; Wang, H.; Gu, X.; Cui, H.-N. Hierarchical structure WO3/TiO2 complex film with enhanced electrochromic performance. Solid State Ionics 2019, 338, 168–176. [Google Scholar] [CrossRef]
- Tang, C.-J.; He, J.-L.; Jaing, C.-C.; Liang, C.-J.; Chou, C.-H.; Han, C.-Y.; Tien, C.-L. An all-solid-state electrochromic device based on WO3-Nb2O5 composite films prepared by fast-alternating bipolar-pulsed reactive magnetron sputtering. Coatings 2019, 9, 9. [Google Scholar] [CrossRef] [Green Version]
- Zhang, X.P.; Zhang, H.K.; Li, Q.; Luo, H.L. An all-solid-state inorganic electrochromic display of WO3 and NiO films with LiNbO3 ion conductor. IEEE Electron. Device Lett. 2000, 21, 215–217. [Google Scholar] [CrossRef]
- Chen, H.-C.; Jan, D.-J.; Chen, C.-H. Investigation of optical and electrochromic properties of tungsten oxide deposited with horizontal DC and DC pulse magnetron sputtering. Jpn. J. Appl. Phys. 2012, 51, 045503. [Google Scholar] [CrossRef]
- Tajima, K.; Watanabe, H.; Nishino, M.; Kawamoto, T. Electrochromic properties of WO3 thin films fabricated by magnetron sputtering, ion plating, and spin coating: A comparative investigation. J. Ceram. Soc. Jpn. 2020, 128, 381–386. [Google Scholar] [CrossRef]
- Zhang, G.; Lu, K.; Zhang, X.; Yuan, W.; Shi, M.; Ning, H.; Tao, R.; Liu, X.; Yao, R.; Peng, J. Effects of annealing temperature on optical band gap of sol-gel tungsten trioxide films. Micromachines 2018, 9, 377. [Google Scholar] [CrossRef] [Green Version]
- Zhang, G.; Lu, K.; Zhang, X.; Yuan, W.; Ning, H.; Tao, R.; Liu, X.; Yao, R.; Peng, J. Enhanced transmittance modulation of SiO2-doped crystalline WO3 films prepared from a polyethylene oxide (PEO) template. Coatings 2018, 8, 228. [Google Scholar] [CrossRef] [Green Version]
- Shi, M.; Qiu, T.; Tang, B.; Zhang, G.; Yao, R.; Xu, W.; Chen, J.; Fu, X.; Ning, H.; Peng, J. Temperature-controlled crystal size of wide band gap nickel oxide and its application in electrochromism. Micromachines 2021, 12, 80. [Google Scholar] [CrossRef] [PubMed]
- Kadam, A.V.; Bhosale, N.Y.; Patil, S.B.; Mali, S.S.; Hong, C.K. Fabrication of an electrochromic device by using WO3 thin films synthesized using facile single-step hydrothermal process. Thin Solid Films 2019, 673, 86–93. [Google Scholar] [CrossRef]
- Pan, J.; Wang, Y.; Zheng, R.; Wang, M.; Wan, Z.; Jia, C.; Weng, X.; Xie, J.; Deng, L. Directly grown high-performance WO3 films by a novel one-step hydrothermal method with significantly improved stability for electrochromic applications. J. Mater. Chem. A 2019, 7, 13956–13967. [Google Scholar] [CrossRef]
- Varghese, T.; Dun, C.; Kempf, N.; Saeidi-Javash, M.; Karthik, C.; Richardson, J.; Hollar, C.; Estrada, D.; Zhang, Y. Flexible thermoelectric devices of ultrahigh power factor by scalable printing and interface engineering. Adv. Funct. Mater. 2019, 30, 1905796. [Google Scholar] [CrossRef]
- Limmanee, A.; Krudtad, P.; Songtrai, S.; Jaroensathainchok, S.; Krajangsang, T.; Sritharathikhun, J.; Sriprapha, K. MOCVD ZnO/screen printed Ag back reflector for flexible thin film silicon solar cell application. Int. J. Photoenergy 2014, 2014, 1–7. [Google Scholar] [CrossRef]
- Li, D.; Liu, X.; Chen, X.; Lai, W.Y.; Huang, W. A simple strategy towards highly conductive silver-nanowire inks for screen-printed flexible transparent conductive films and wearable energy-storage devices. Adv. Mater. Technol. 2019, 4, 1900196. [Google Scholar] [CrossRef]
- Hu, J.; Guo, H.; Li, C.-J.; Zhang, Y.-C.; Yuan, J.-X.; Zhang, S.-S.; Zhao, L.-L. Preparation and discharge performance of thin-film thermal battery. Energy Technol. 2020, 8, 2000737. [Google Scholar] [CrossRef]
- Duan, S.; Gao, X.; Wang, Y.; Yang, F.; Chen, M.; Zhang, X.; Ren, X.; Hu, W. Scalable fabrication of highly crystalline organic semiconductor thin film by channel-restricted screen printing toward the low-cost fabrication of high-performance transistor arrays. Adv. Mater. 2019, 31, e1807975. [Google Scholar] [CrossRef] [PubMed]
- Wang, L.-L.; Tay, B.-K.; See, K.-Y.; Sun, Z.; Tan, L.-K.; Lua, D. Electromagnetic interference shielding effectiveness of carbon-based materials prepared by screen printing. Carbon 2009, 47, 1905–1910. [Google Scholar] [CrossRef]
- Sánchez, M.; Rincón, M.E. Sensor response of sol–gel multiwalled carbon nanotubes-TiO2 composites deposited by screen-printing and dip-coating techniques. Sens. Actuators B Chem. 2009, 140, 17–23. [Google Scholar] [CrossRef]
- Santiago, S.; Aller, M.; Campo, F.J.; Guirado, G. Screen-printable electrochromic polymer inks and ion gel electrolytes for the design of low-power, flexible electrochromic devices. Electroanalysis 2019, 31, 1664–1671. [Google Scholar] [CrossRef]
- Krebs, F.C. Fabrication and processing of polymer solar cells: A review of printing and coating techniques. Sol. Energy Mater. Sol. Cells 2009, 93, 394–412. [Google Scholar] [CrossRef]
- Baharuddin, N.A.; Abdul Rahman, N.F.; Rahman, H.A.; Somalu, M.R.; Azmi, M.A.; Raharjo, J. Fabrication of high-quality electrode films for solid oxide fuel cell by screen printing: A review on important processing parameters. Int. J. Energy Res. 2020, 44, 8296–8313. [Google Scholar] [CrossRef]
- Ma, Q.; Du, L.; Yang, Y.; Wang, L. Rheology of film-forming solutions and physical properties of tara gum film reinforced with polyvinyl alcohol (PVA). Food Hydrocoll. 2017, 63, 677–684. [Google Scholar] [CrossRef]
- Shimizu, Y.; Tanabe, T.; Yoshida, H.; Kasuya, M.; Matsunaga, T.; Haga, Y.; Kurihara, K.; Ohta, M. Viscosity measurement of Xanthan-Poly(vinyl alcohol) mixture and its effect on the mechanical properties of the hydrogel for 3D modeling. Sci. Rep. 2018, 8, 16538. [Google Scholar] [CrossRef] [PubMed]
- Yang, H.; Xu, S.; Jiang, L.; Dan, Y. Thermal decomposition behavior of poly (vinyl alcohol) with different hydroxyl content. J. Macromol. Sci. Part B 2011, 51, 464–480. [Google Scholar] [CrossRef]
- Hunyadi, D.; Sajó, I.; Szilágyi, I.M. Structure and thermal decomposition of ammonium metatungstate. J. Therm. Anal. Calorim. 2013, 116, 329–337. [Google Scholar] [CrossRef] [Green Version]
- French, G.J.; Sale, F.R. A re-investigation of the thermal decomposition of ammonium paratungstate. J. Mater. Sci. 1981, 16, 3427–3436. [Google Scholar] [CrossRef]
- Li, G.-H.; Cho, C.-G. Synthesis and micellar behavior of poly(vinyl alcohol-b-styrene) copolymers containing PVA blocks with different syndiotacticity. Colloid. Polym. Sci. 2004, 283, 946–953. [Google Scholar] [CrossRef]
- Li, G.H.; Cho, C.G. CMC and dynamic properties of poly(VA-b-St) copolymer micelles for drug delivery. Korean J. Chem. Eng. 2008, 25, 1444–1447. [Google Scholar] [CrossRef]
- Wang, L.; Tiu, C.; Liu, T.J. Effects on nonionic surfactant and associative thickener on the rheology of polyacrylamide in aqueous glycerol solutions. Colloid. Polym. Sci. 1996, 274, 138–144. [Google Scholar] [CrossRef]
- Tretinnikov, O.N.; Zagorskaya, S.A. Effect of inorganic salts on the crystallinity of polyvinyl alcohol. J. Appl. Spectrosc. 2012, 78, 904–908. [Google Scholar] [CrossRef]
- Karimi, A.; Wan Daud, W.M.A. Materials, preparation, and characterization of PVA/MMT nanocomposite hydrogels: A review. Polym. Compos. 2015, 38, 1086–1102. [Google Scholar] [CrossRef]
- Asad, M.; Saba, N.; Asiri, A.M.; Jawaid, M.; Indarti, E.; Wanrosli, W.D. Preparation and characterization of nanocomposite films from oil palm pulp nanocellulose/poly (Vinyl alcohol) by casting method. Carbohydr. Polym. 2018, 191, 103–111. [Google Scholar] [CrossRef]
- Parameswaran, V.; Nallamuthu, N.; Devendran, P.; Manikandan, A.; Nagarajan, E.R. Assimilation of NH4Br in polyvinyl alcohol/poly(N-vinyl pyrrolidone) polymer blend-based electrolyte and its effect on ionic conductivity. J. Nanosci. Nanotechnol. 2018, 18, 3944–3953. [Google Scholar] [CrossRef]
- Vijayalakshmi, R.; Jayachandran, M.; Sanjeeviraja, C. Structural, electrochromic and FT-IR studies on electrodeposited tungsten trioxide films. Curr. Appl. Phys. 2003, 3, 171–175. [Google Scholar] [CrossRef]
- Joraid, A.A.; Alamri, S.N. Effect of annealing on structural and optical properties of WO3 thin films prepared by electron-beam coating. Physica. B Condens. Matter 2007, 391, 199–205. [Google Scholar] [CrossRef]
- Haro-Poniatowski, E.; Jouanne, M.; Morhange, J.F.; Julien, C.; Diamant, R.; Fernandez-Guasti, M.; Fuentes, G.A.; Alonso, J.C. Micro-Raman characterization of WO3 and MoO3 thin films obtained by pulsed laser irradiation. Appl. Surf. Sci. 1998, 127, 674–678. [Google Scholar] [CrossRef]
- Sallard, S.; Brezesinski, T.; Smarsly, B.M. Electrochromic stability of WO3 thin films with nanometer-scale periodicity and varying degrees of crystallinity. J. Phys. Chem. C 2007, 111, 7200–7206. [Google Scholar] [CrossRef]
- Ge, C.; Wang, M.; Hussain, S.; Xu, Z.; Liu, G.; Qiao, G. Electron transport and electrochromic properties of sol-gel WO3 thin films: Effect of crystallinity. Thin Solid Films 2018, 653, 119–125. [Google Scholar] [CrossRef]
- Yu, H.; Guo, J.; Wang, C.; Zhang, J.; Liu, J.; Dong, G.; Zhong, X.; Diao, X. Essential role of oxygen vacancy in electrochromic performance and stability for WO3-y films induced by atmosphere annealing. Electrochim. Acta 2020, 332, 135504. [Google Scholar] [CrossRef]
- Kuroki, T.; Matsushima, Y.; Unuma, H. Electrochromic response of WO3 and WO3-TiO2 thin films prepared from water-soluble precursors and a block copolymer template. J. Asian Ceram. Soc. 2016, 4, 367–370. [Google Scholar] [CrossRef] [Green Version]
- Park, Y.T.; Lee, S.H.; Lee, K.T. Electrochromic properties of silver nanowire-embedded tungsten trioxide thin films fabricated by electrodeposition. Ceram. Int. 2020, 46, 29052–29059. [Google Scholar] [CrossRef]
- Najafi-Ashtiani, H.; Bahari, A.; Gholipour, S. Investigation of coloration efficiency for tungsten oxide-silver nanocomposite thin films with different surface morphologies. J. Mater. Sci. Mater. Electron. 2018, 29, 5820–5829. [Google Scholar] [CrossRef]
- Hoseinzadeh, S.; Ghasemiasl, R.; Bahari, A.; Ramezani, A.H. The injection of Ag nanoparticles on surface of WO3 thin film: Enhanced electrochromic coloration efficiency and switching response. J. Mater. Sci. Mater. Electron. 2017, 28, 14855–14863. [Google Scholar] [CrossRef]
- Zhao, Y.M.; Zhang, X.; Chen, X.; Li, W.J.; Wang, L.B.; Ren, F.F.; Zhao, J.P.; Endres, F.; Li, Y. Preparation of WO3 films with controllable crystallinity for improved near-infrared electrochromic performances. ACS Sustain. Chem. Eng. 2020, 8, 11658–11666. [Google Scholar] [CrossRef]


Publisher’s Note: MDPI stays neutral with regard to jurisdictional claims in published maps and institutional affiliations. |
© 2021 by the authors. Licensee MDPI, Basel, Switzerland. This article is an open access article distributed under the terms and conditions of the Creative Commons Attribution (CC BY) license (https://creativecommons.org/licenses/by/4.0/).
Share and Cite
Guo, K.; Zhang, G.; Long, Y.; Ning, H.; Xu, Z.; Qiu, T.; Luo, D.; Li, M.; Yao, R.; Peng, J. Modifying Precursor Solutions to Obtain Screen-Printable Inks for Tungsten Oxides Electrochromic Film Preparation. Coatings 2021, 11, 872. https://0-doi-org.brum.beds.ac.uk/10.3390/coatings11080872
Guo K, Zhang G, Long Y, Ning H, Xu Z, Qiu T, Luo D, Li M, Yao R, Peng J. Modifying Precursor Solutions to Obtain Screen-Printable Inks for Tungsten Oxides Electrochromic Film Preparation. Coatings. 2021; 11(8):872. https://0-doi-org.brum.beds.ac.uk/10.3390/coatings11080872
Chicago/Turabian StyleGuo, Kaiyue, Guanguang Zhang, Yujie Long, Honglong Ning, Zhuohui Xu, Tian Qiu, Dongxiang Luo, Muyun Li, Rihui Yao, and Junbiao Peng. 2021. "Modifying Precursor Solutions to Obtain Screen-Printable Inks for Tungsten Oxides Electrochromic Film Preparation" Coatings 11, no. 8: 872. https://0-doi-org.brum.beds.ac.uk/10.3390/coatings11080872