1. Introduction
Gold (Au) can be deposited on substrates by various mechanisms including electrodeposition, physical vapour deposition (sputtering) and evaporation. Au electrodeposition has the advantage of being achieved with relatively simple and inexpensive equipment in a near ambient pressure and temperature environment [
1]. It is commonly used in the electronics and jewellery industries. Deposition of pure Au is not favoured in the electronics industry because the deposits are too soft. Instead gold–copper combinations increase strength and preserve the high conductivity of the deposits. Gold–indium and gold–rubidium combinations are favoured in the jewellery industry to modulate colour and lustre, and increase the deposit strength.
Neither lustre nor strength are essential when electrodepositing Au in dentistry. Tarnish and corrosion resistance, biocompatibility, aesthetics and durability (minimising breakdown of the deposit) are the important factors. The technique has been used, relatively infrequently, to enhance the aesthetics of removable, tooth-supported and implant-supported dental prostheses [
2,
3,
4,
5]. It has also been used to improve the porcelain-base metal alloy bond strength in metal–ceramic restorations [
6] and to reduce the corrosion and subsequent gingival irritation and possible allergic reactions of any exposed alloy [
4].
There is little information in the dental literature concerning the variables affecting electrodeposited Au coating (plate) thickness, durability and bond strength to the underlying alloy. Hardness and thickness of the coating have been identified as factors which are related to durability of the electrodeposited coating [
2]. Mechanical strength, which is modulated by the grain size, will also affect durability [
7]. The finer the grain size, the greater the mechanical strength of the deposit, both within it and in its attachment to the underlying metal substrate. Grain boundary strength is therefore determined by grain refinement mechanisms [
7]. Crystalline grain size is controlled by current density, bath temperature and the additive amount of the metal in the aqueous electrolyte. Thickness could also impact on the fit of prostheses, although it has been stated that thicknesses up to 12.5 µm have no clinical effect on fit [
2].
Controlling current density is a practical way of controlling grain size and nucleation rate, with an increase in current density resulting in a finer-grained structure. However, a crossover is reached whereby an overpotential occurs, resulting in an increase in grain size [
7].
Au sputtering can be used as an alternative coating technique and can be controlled to give reproducible and predictable thicknesses, but the expensive equipment involved renders the process impractical for dental applications. However, due to its accuracy and consistency, it can be used as a reference technique in research, as is reported in this study. Regarding electrodeposition, there is little information in the literature detailing the Au coating process regarding current, plating time and resultant thickness, with recommendations only to follow the manufacturer’s instructions.
Metal coating thickness can be measured with both destructive and non-destructive techniques. The destructive technique gives an actual measurement of the thickness, but the sample is destroyed. The non-destructive techniques require little or no preparation of the sample and the sample remains intact [
8]. Such techniques use electron-probe microanalysis. Accelerated electron or X-ray beams are directed at the coating and penetrate to a depth dependent on the energy of the accelerated beam. Collision of the electrons or X-rays in the beam with those in the sample results in the release and scatter of energy which is detected and analysed [
9]. Part of the spectrum of this reflected energy is in the form of X-rays with specific characteristics dependent on the atomic make-up of the excited elements. It is apparent that the coating has been penetrated when X-rays from elements in the underlying material are detected. The thicker the coating, the more energy required to penetrate it.
The required energies are then analysed and correlated to thickness. These techniques use mathematical algorithms which include some assumptions to calculate an estimated coating thickness [
10]. They are therefore classified as analytical techniques and the accuracy of measurements will be dependent on the validity of the algorithms used. Energy dispersive X-ray spectroscopy (EDS) and X-ray fluorescence spectroscopy (XFS) are such techniques. The difference between the two is the type of radiation hitting the sample. EDS uses an electron beam while XRF uses an X-ray beam. Accuracy in the order of ±5% is typical for single layer coatings [
11].
It is hypothesized that the resultant thickness of Au electrodeposited to a high-gold alloy at a constant current increases with plating time, and can be expressed by a mathematical formula.
This study aimed to determine parameters required to Au plate a high-gold alloy by electrodeposition to achieve a known thickness. Au was electrodeposited at a constant current on a high-gold alloy across varying coating times; and the resultant thickness was calculated with reference to Au deposits of known thickness created with the sputtering technique.
2. Materials and Methods
A commercially available high-gold alloy (75% Au) which is used to cast implant abutments and tooth-supported crowns in dentistry was chosen as the high-gold alloy for the study samples (V classic; Cendres+Métaux SA, Biel, Switzerland). Au was electrodeposited on 11 alloy plates (n = 11, samples A–K) obtained from the manufacturer (V classic; Cendres+Métaux SA, Biel, Switzerland) in a commercially available electroplating bath (Auroplatmini; Wieland Edelmetalle Gmbh, Pforzheim, Germany) filled with a plating solution (Aurogold C5 1.5gAu/L; Alphabond Dental Pty Ltd., Roseville, Australia) at constant voltage (2.8 V) for varying times ranging from 20 min and increasing in twenty minute increments to 220 min. The composition of the alloy is documented in
Table 1.
Au thickness strips (0, 50, 200, 250, 300, 350 and 500 nm) were prepared on two reference sample plates of the same alloy by sputter-coating using an FHR MS 150 coater (Quorum Technologies, Sussex, UK) in a cleanroom (Chalmers MC-2 cleanroom, SP Technical Research Institute, Gothenburg, Sweden). The reference samples with the known Au thickness strips were used to assist in calculation of Au thickness of the study samples (n = 11, A–K).
Energy dispersive X-ray spectroscopy (EDS) was used to estimate the thickness of Au strips (n = 7) sputtered on the two reference gold alloy plates, and the Au electrodeposited on the gold alloy samples (n = 11). XRF was used to cross-reference the thickness of the Au electrodeposited on the gold alloy samples that required electron acceleration energies greater than could penetrate the sample thickness with the available equipment.
The EDS analysis was performed using a X-Max 50 mm2 SDD detector (Oxford Instruments, Abingdon, UK) mounted on a Zeiss Supra 40VP scanning electron microscopy (SEM) system (Oxford Instruments, Abingdon, UK) and INCA Energy Analysis Software (Oxford Instruments NanoAnalysis, High Wycombe Bucks UK). For this EDS analysis, SEM settings included:
2–30 kV electron acceleration voltage.
“SE2” operating mode = secondary electron detection.
Working distance (WD) of 8.5 mm.
Beam aperture #6 =120 μm.
Magnifications of approximately × 100.
The voltage of the EDS was modified to measure the palladium (Pd) signal in the underlying alloy. The Pd signal (E0Pd) was defined as the minimal electron energy (E0) required to detect the reflection of a X-ray signal of 1% atomic concentration of Pd present in the underlying alloy through the Au coating. In this instrument set up, the maximum acceleration voltage that could be used to obtain the Pd signal was 30 kV. When deposition coatings are thick, the electron acceleration to obtain the Pd signals required for analysis can exceed this 30 kV limit. In these instances, although unable to directly measure the E0Pd, the analysis software can be used to analytically extrapolate results.
2.1. Phase 1
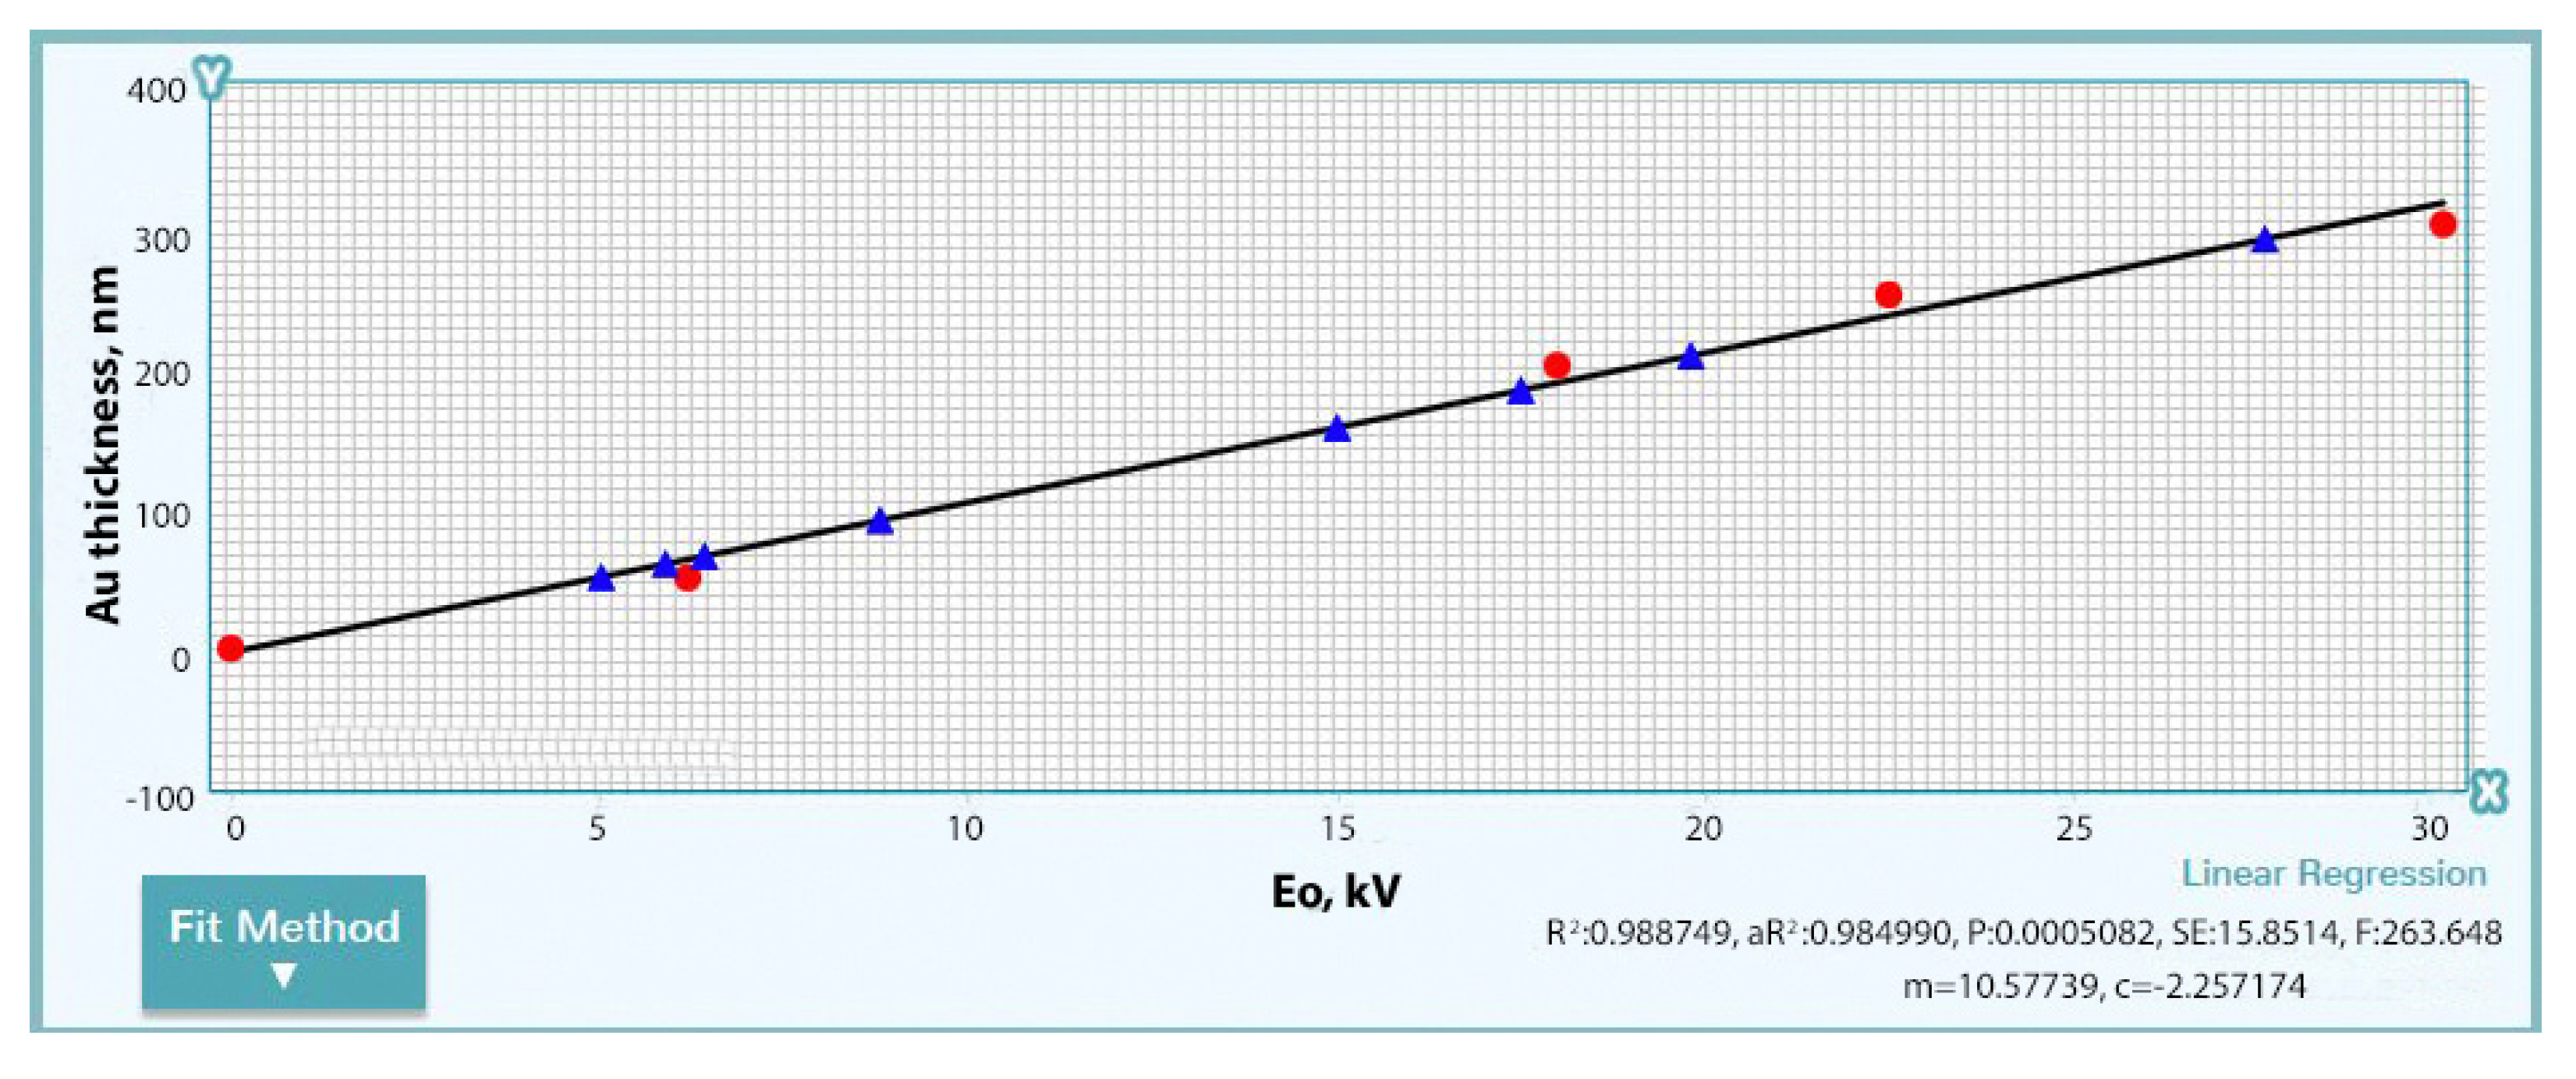
The E0Pd signals from the seven reference Au strips of known thickness (0–300 nm) across the two Au alloy sample plates and the samples of unknown thickness (A–K) were measured where possible up to the maximum 30 kV acceleration mode. Following data acquisition, the E0Pd signals were then analysed with the Energy Analysis Software, the linear fitting coefficients extracted, and the obtained signal–thickness relationship determined for the known thicknesses of the gold strips and then used to correlate Au thickness for the study samples (n = 11, A–K)
2.2. Phase 2
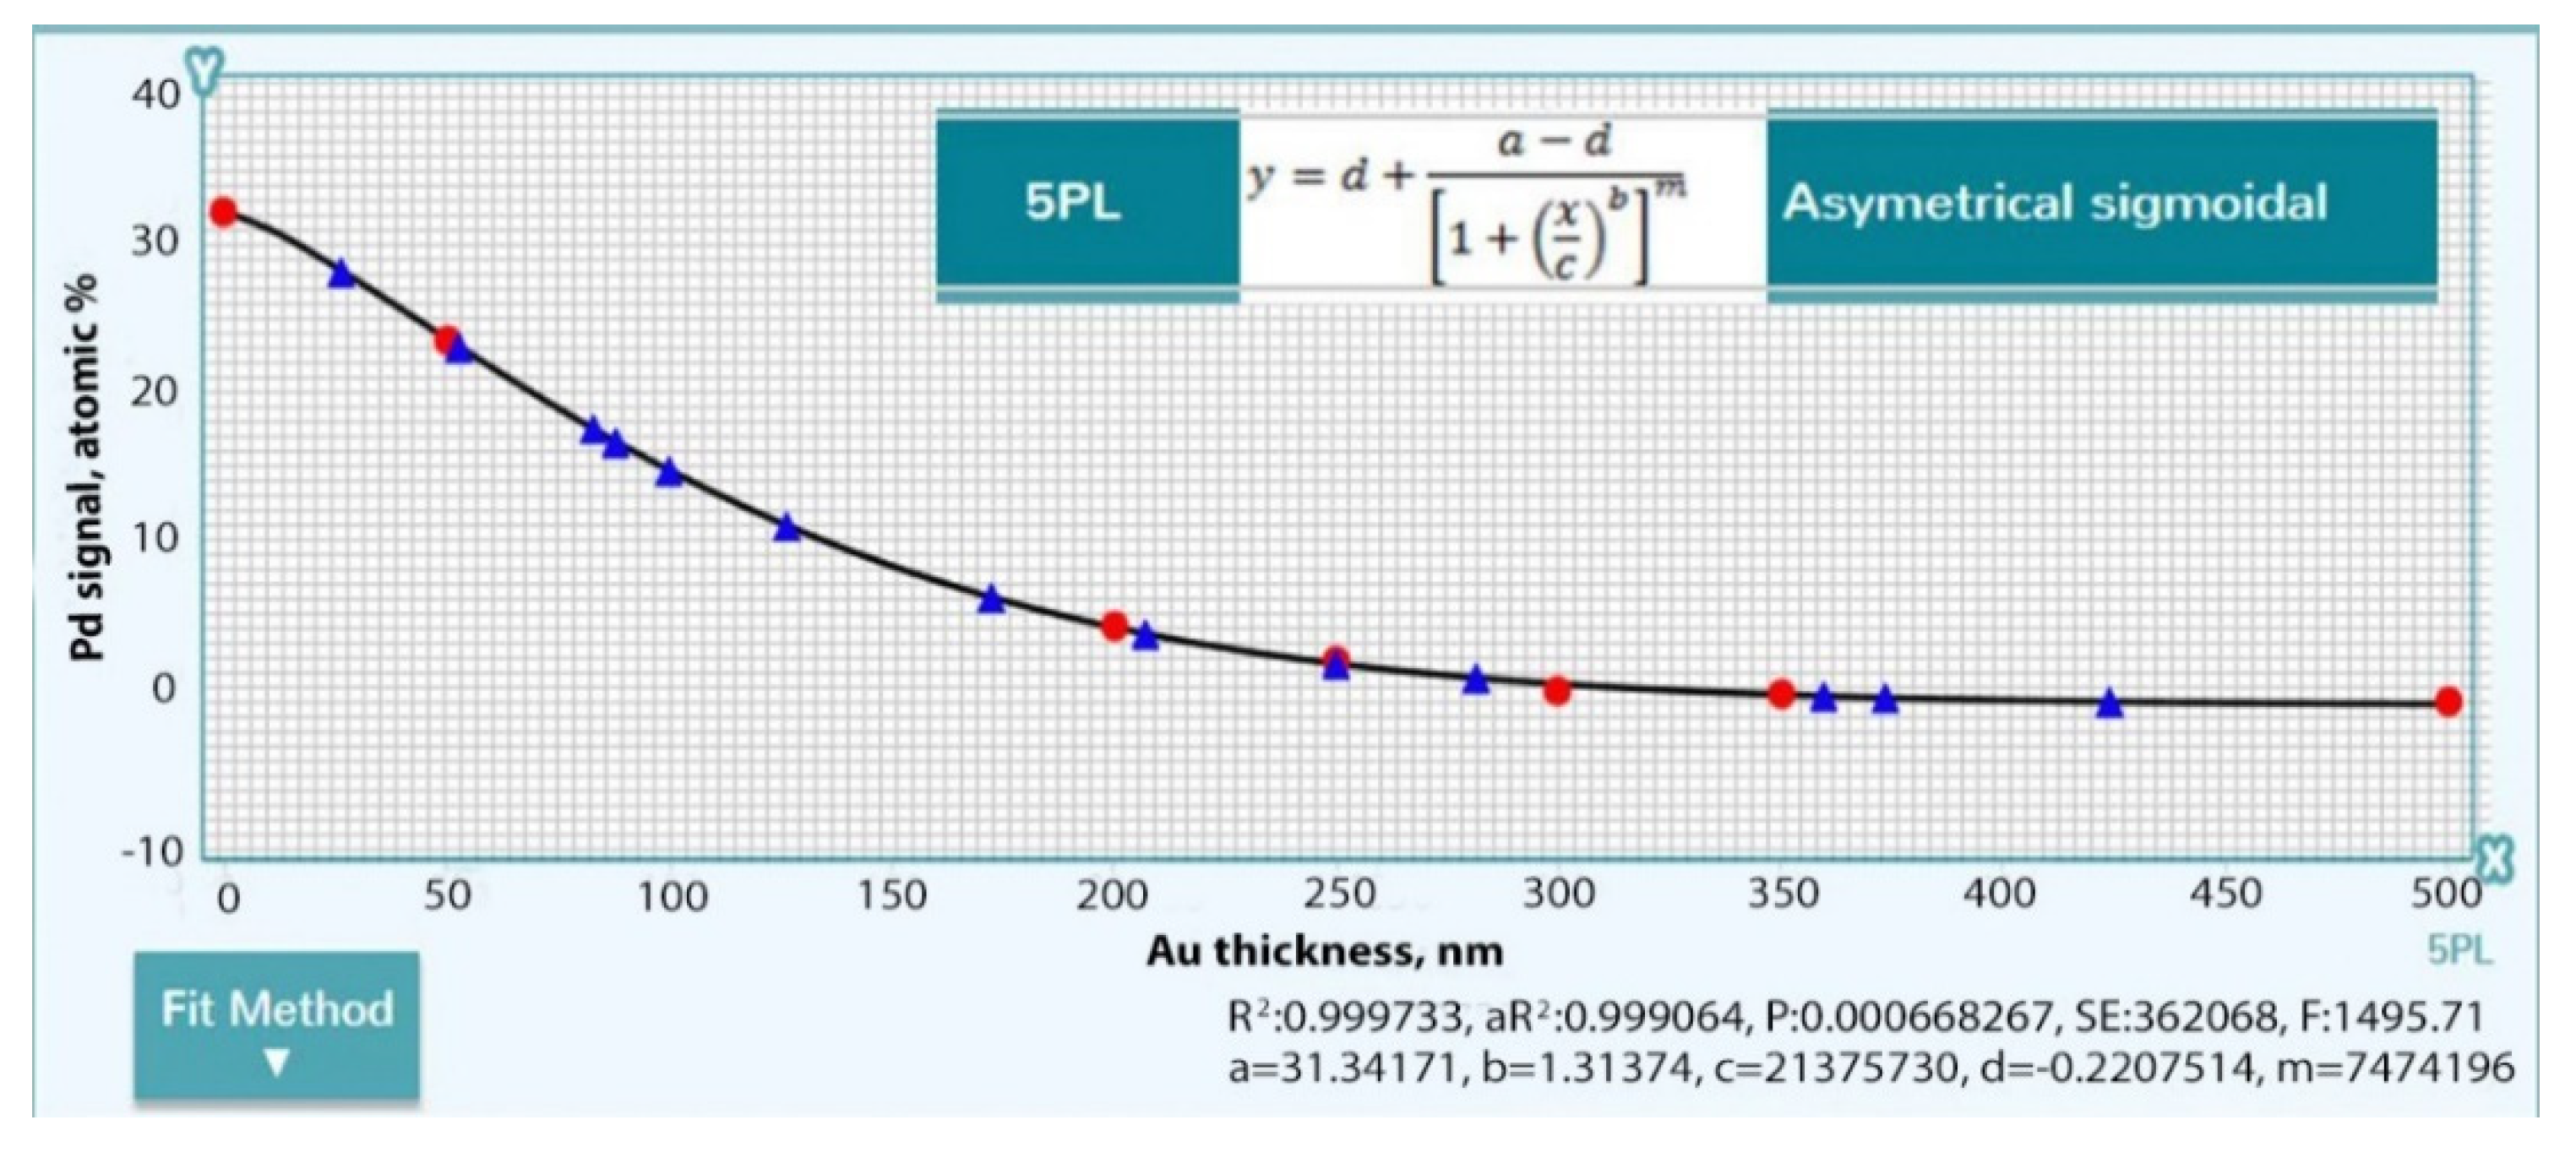
The % Pd concentration at the maximum constant acceleration mode of 30 kV was also measured for the seven reference Au strips of known thickness (0–300 nm) sputtered on the reference alloy plates and the samples of unknown thickness (A–K). The obtained % Pd concentration values of the reference Au strips were again analysed with the software and fitted to an asymmetric sigmoidal curve. Fitting constants of the % Pd concentration of the samples A–K were then fitted to estimate the coating thickness.
2.3. Phase 3
When the electron acceleration required for penetration through the Au coating was above 30 kV, the analytically extrapolated results from the EDS method were cross referenced with energy dispersive X-ray fluorescence spectroscopy (XRF), to confirm the coating thickness estimations were accurate. To do so, a XRF instrument (Thermo Scientific Niton XL3t GoldD+XRF Analyser, Waltham, MA, USA) and compatible software for analysis (UniQuant, Omega Data Systems BV, Veldhoven, The Netherlands) was used. X-ray spectra from pure gold (99.9%), a denominated sample of California Gold 297 (Cal Au 297, 99.9% Au) and the V classic high-gold alloy (75% Au) were used as references for calculating thickness of the Au coating by the UniQuant software.
2.4. Phase 4
The estimated Au thickness of the samples A–K was then related to plating time.
3. Results
3.1. Phase 1
The E
0Pd signals measured for the seven strips with known thickness of Au on the two reference plates are shown in
Table 2. It can be seen that for thicknesses above 300 nm, the E
0Pd could not be measured with the available instrumentation.
The E
0Pd signals able to be obtained from the unknown thickness samples (A–H) are shown in
Table 3. The values for samples I, J and K were not measurable, indicating they had thicknesses > 300 nm.
The linear fitting coefficients of the E
0Pd signals from the seven Au reference strips with known thickness are depicted in
Figure 1. The E
0Pd signals obtained from the sample plates (A–H) with unknown Au thicknesses were plotted on the same curve (
Figure 1) and thicknesses estimated shown in
Table 4.
The estimated thicknesses ranged from 52 to 289 nm. Except for samples C and D, the thickness increased with plating time.
3.2. Phase 2
The % Pd concentrations at the maximum constant acceleration mode of 30 kV measured for the seven reference Au strips are shown in
Table 5.
The fitting constants of these % Pd signals plotted on the asymmetric sigmoidal curve are shown in
Figure 2. The % Pd X-ray concentrations from the unknown thickness samples (A–K) were plotted on the same curve (
Figure 2) and thicknesses estimated (
Table 6).
The estimated thicknesses ranged from 27 to 425 nm. Except for samples C and D, the thickness increased with plating time.
A comparison of the estimated Au thicknesses obtained by the two methods (E
0Pd signals and EDS of % Pd concentration signals at 30 kV) is shown in
Table 7.
3.3. Phase 3
Even though the entire range of Au coating thickness could be estimated with the above methods, the measurements for the thicker coatings were less accurate due to the low X-ray signal from the Pd. Therefore, XRF measurements were undertaken to cross-reference the coating thickness estimation calculated with EDS. The resultant X-ray spectra and Au signal intensity of the reference samples—pure Au (99.9%), Cal Au (99.9%Au) and V classic alloy (75% Au)—are shown in
Table 8 along with those for samples J and K. The calculated Au coating thickness of samples J and K is also shown. It can be seen that the measurements by EDS and XRF match within 10% for samples J and K.
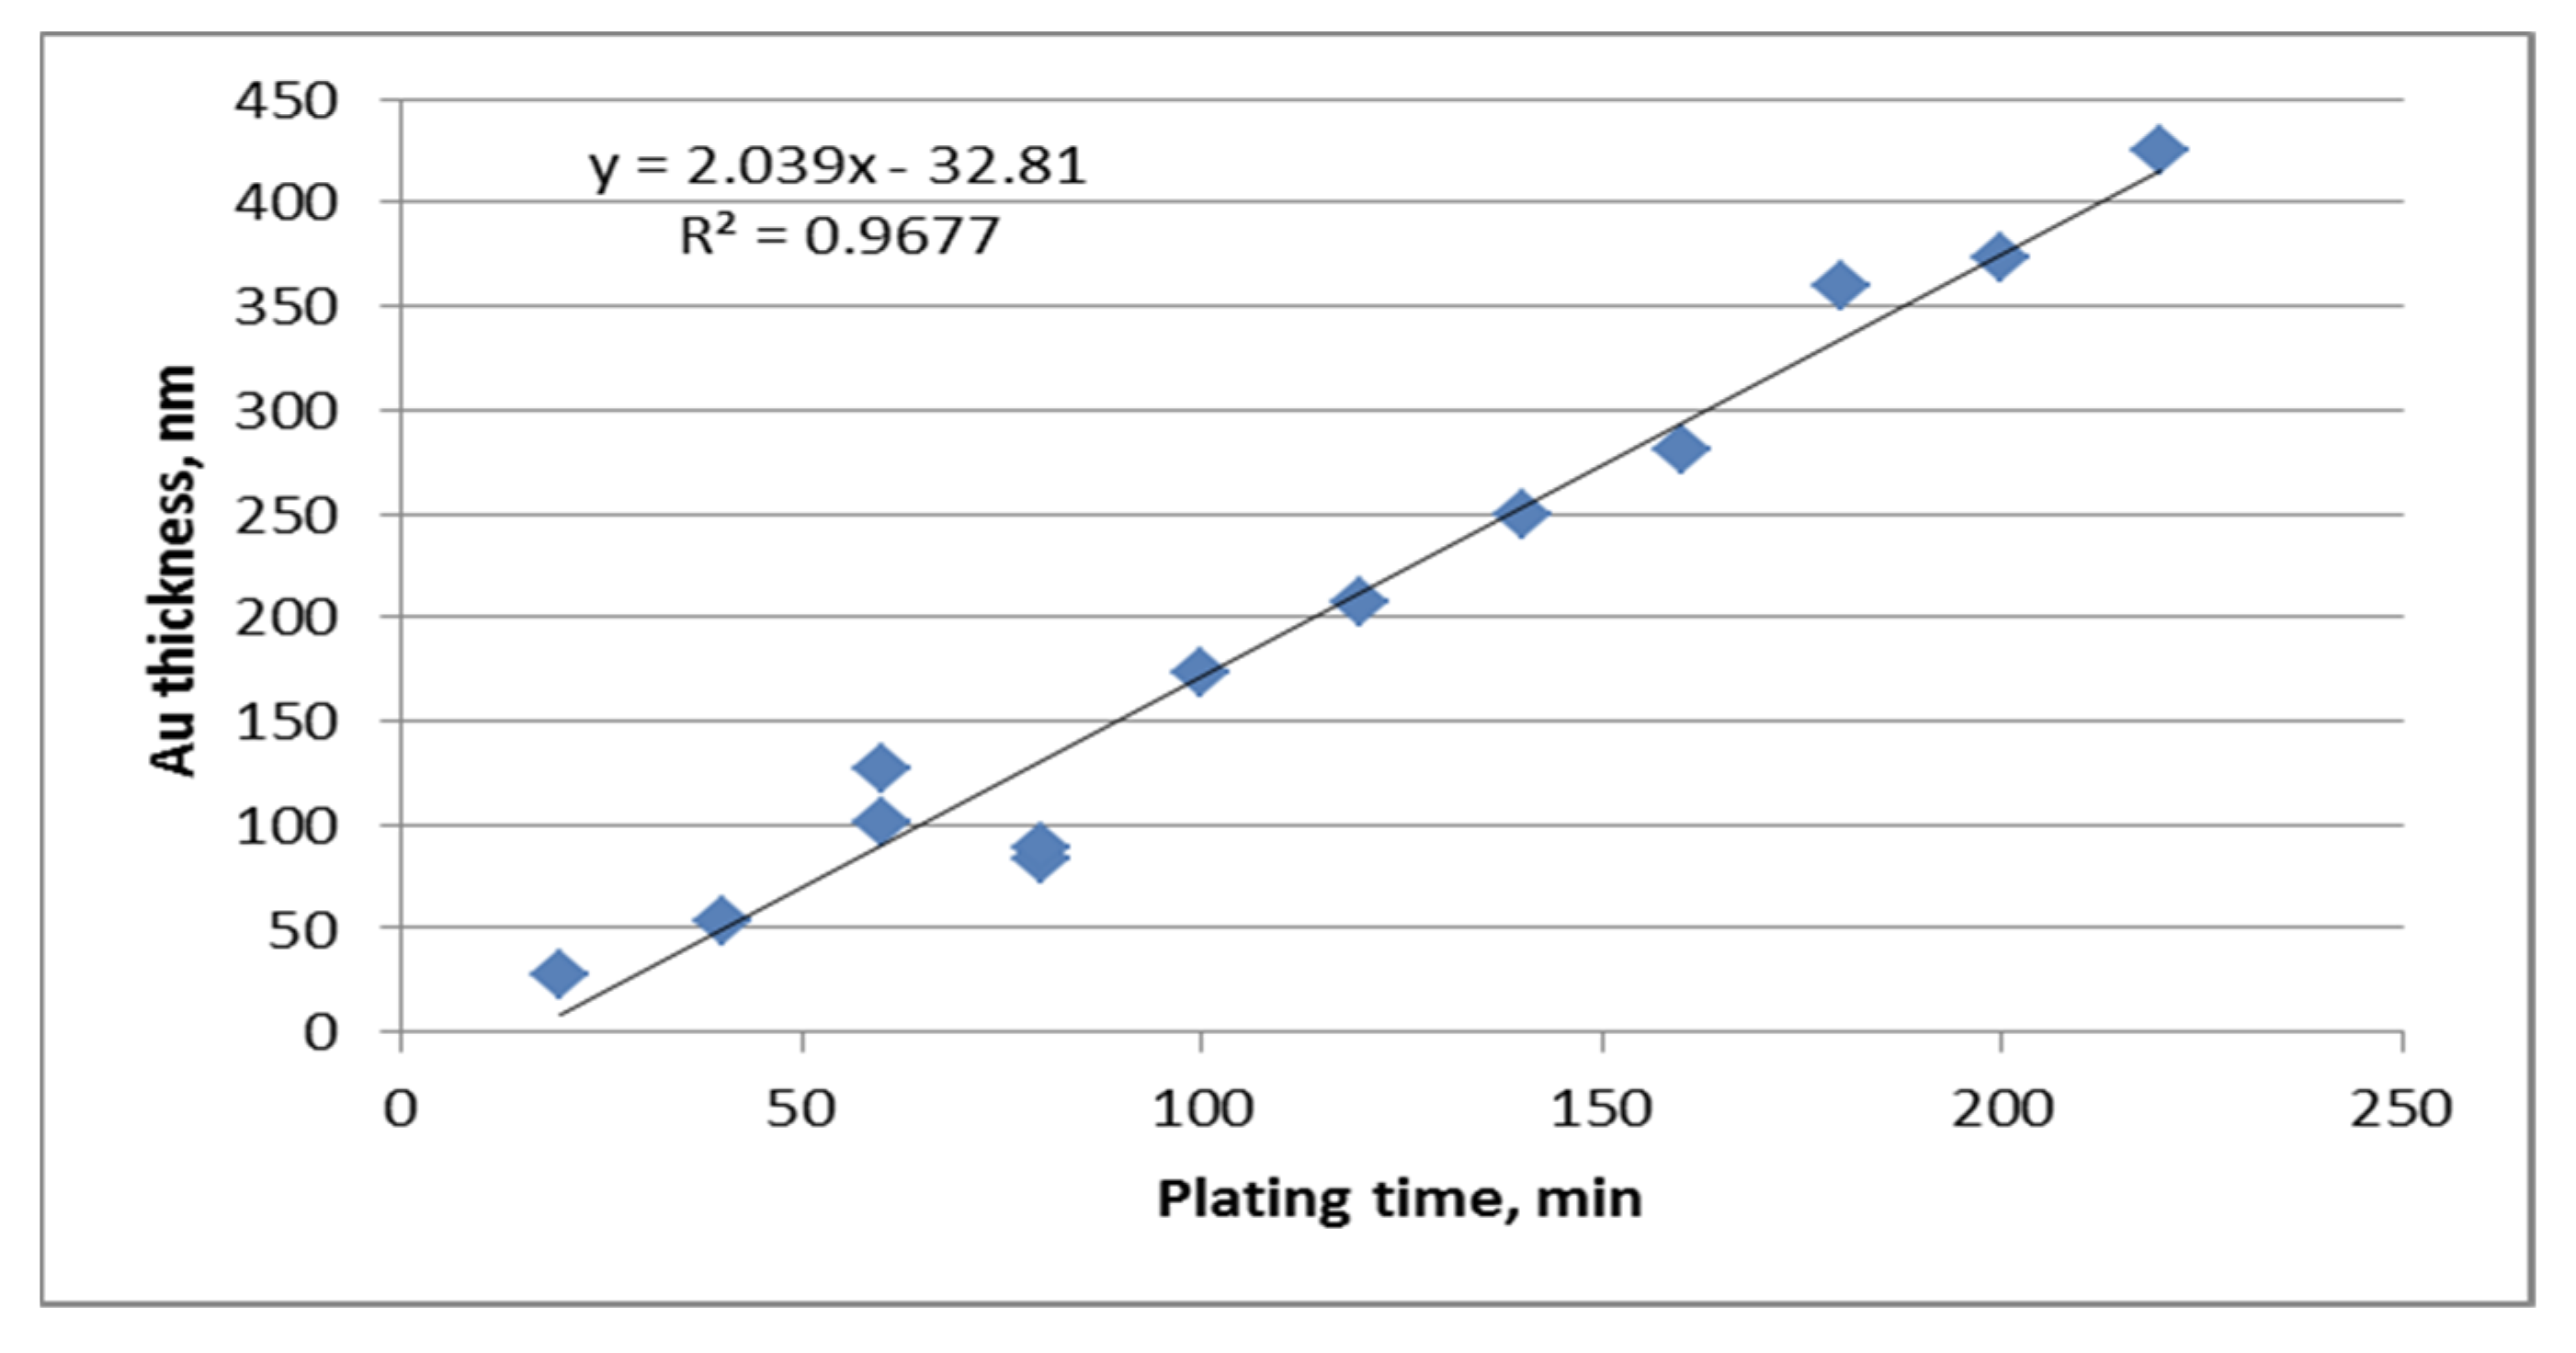
3.4. Phase 4
The estimated film thickness has a linear relationship to plating time (except for samples C–D and C*–D*, where there is an inverted relationship) (
Figure 3).
4. Discussion
A non-destructive assessment of the electrodeposited Au coating on a high-gold alloy was undertaken by combining energy dispersive X-ray spectroscopy (EDS) and the application of two different analytical formulas with known Au thickness coatings obtained by sputtering. The predicted values are expected to be within 5% of the actual values of the sputtered plates with the designated software [
11]. By cross-referencing the EDS values of the samples (A–K) with unknown Au thickness but known plating time, the estimated film thickness was subsequently shown to have a linear relationship to plating time except for samples C–D and C*–D*, where there was an inverted relationship. (It is possible that the plating times of these two alloy plates were transposed in the laboratory.) Thus, highly predictable coating thicknesses can be obtained by varying the plating time. By keeping the voltage at 0.2 mA, the grain size of the plate ensures a high mechanical strength and enhanced durability [
7].
Varying Au plating thickness could enable different applications in dentistry. The masking power of Au is extremely high due to its density. Thus, relatively thin plating thicknesses can eliminate light reflection from underlying alloys conveying the desired Au lustre for aesthetic purposes. Plating times of 2 h, giving an estimated thickness of 200 nm from the results in the present study, have proven to be effective clinically in satisfying aesthetic outcomes and maintaining durability over time [
5]. Gold/gold hue abutments have been claimed to result in enhanced soft tissue aesthetics in implant-supported single crowns due to reflective properties [
12]. Anodized titanium abutments have been introduced to simulate a desired Au lustre [
13].
The relatively soft and distinctively coloured properties of the Au layer have been utilized by this author to act as a “fit checker” for tooth-supported prostheses, whereby scoring of the layer during try-in procedures can identify inaccuracies or bindings (asperities) in the tooth fitting surface.
It has been proposed that Au electrocoated to the abutment surface approximating the head of a dental implant could act as a gasket or sealing agent, thereby minimising percolation of bacteria at the implant–abutment junction, the microgap [
14]. The effectiveness of any gasket would be especially influenced by the electrodeposit thickness. The results of this study show an increase in plating time from 2 to 4 h effectively doubles the estimated coating thickness. Further research is indicated to test this hypothesis.
In addition, the ductile and softer gold has been shown to reduce the frictional and galvanic corrosion (tribocorrosion) at the implant–abutment junction in an accelerated ageing study resulting in a decrease in release of titanium particles [
14]. There is much controversy in the dental literature concerning the pathobiological effects of titanium release and its relationship to peri-implantitis [
15].
The high cost of gold-based alloys and new fabricating technologies, such as computer assisted manufacture (CAM) and 3D printing, have spurred the development of alternative alloys for dental applications, especially in implant dentistry [
16,
17,
18]. However, this has resulted in an increase in possible corrosion and pathological effects associated with peri-implant hard and soft tissues [
19]. Au coating these alternative alloys may reduce associated corrosion. The anti-inflammatory reaction of Au has long been recognised in the medical field [
20,
21,
22,
23]. If the physiological and physical benefits of gold can be maintained in thin coatings and the pathological effects of alternate materials, suitable for these modern fabrication techniques, can be shielded by the gold coatings, this would be a significant development in ensuring that the benefits of implant dentistry are available to a broad range of “patients” and not just those in a very high socio-economic bracket. However, the replication of the measuring technique with other alloys requires further research.
There are several limitations to this study. Only one high-noble gold alloy was coated and one current density used. Further research is required to ascertain whether other alloys—particularly cobalt–chromium and stainless steel based—can be successfully Au plated and whether the linear relationship for coating thickness applies. Variations in current densities may be required to give a suitable grain size with adequate strength and bonding to the substrate alloy. In addition, different electroplating apparatuses and Au plating solutions may result in different plating thicknesses.
5. Conclusions
A non-destructive method for measuring electrodeposited thickness of Au on high-noble Au alloys related to plating time has been developed and verified. There is a linear relationship to Au thickness and plating time between 20 and 220 min.


