
Identification of Colourants and Varnishes in a 14th Century Decorated Wood-Carved Door of the Dionysiou Monastery in Mount Athos


Abstract
:1. Introduction
2. Materials and Methods
3. Results
3.1. Cross Section Analysis
3.2. SEM-EDX Results
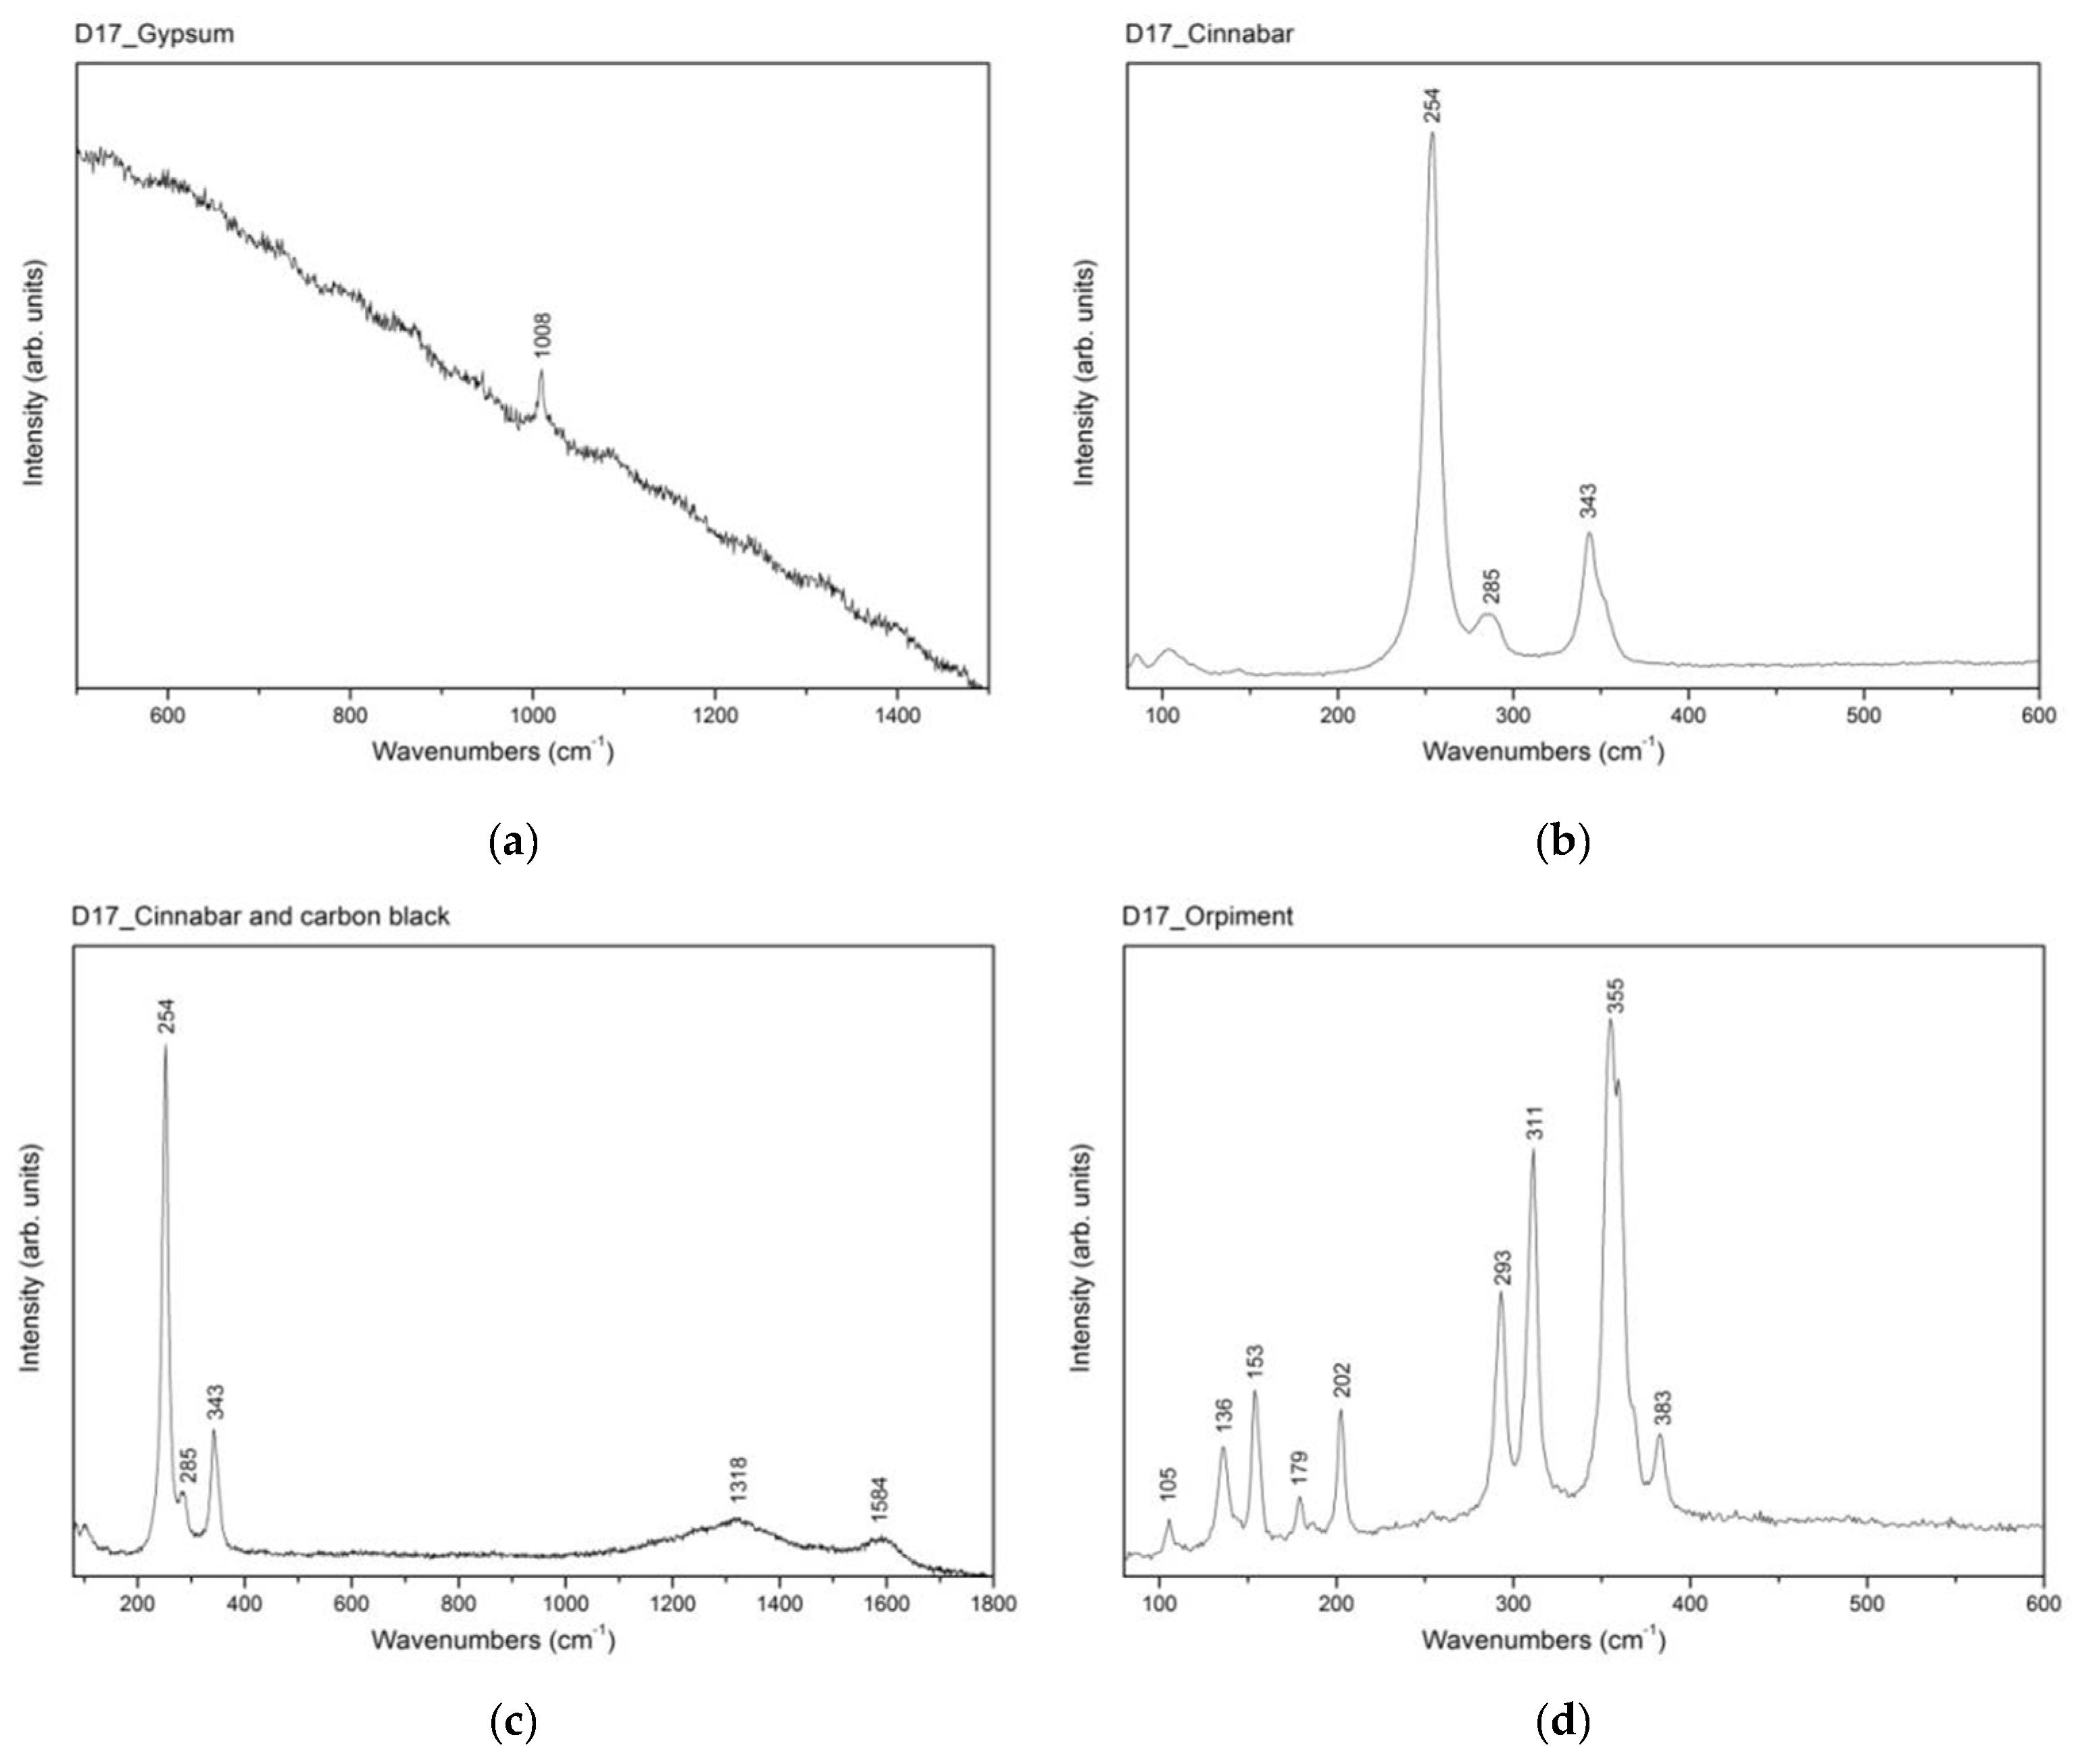
3.3. Raman Results
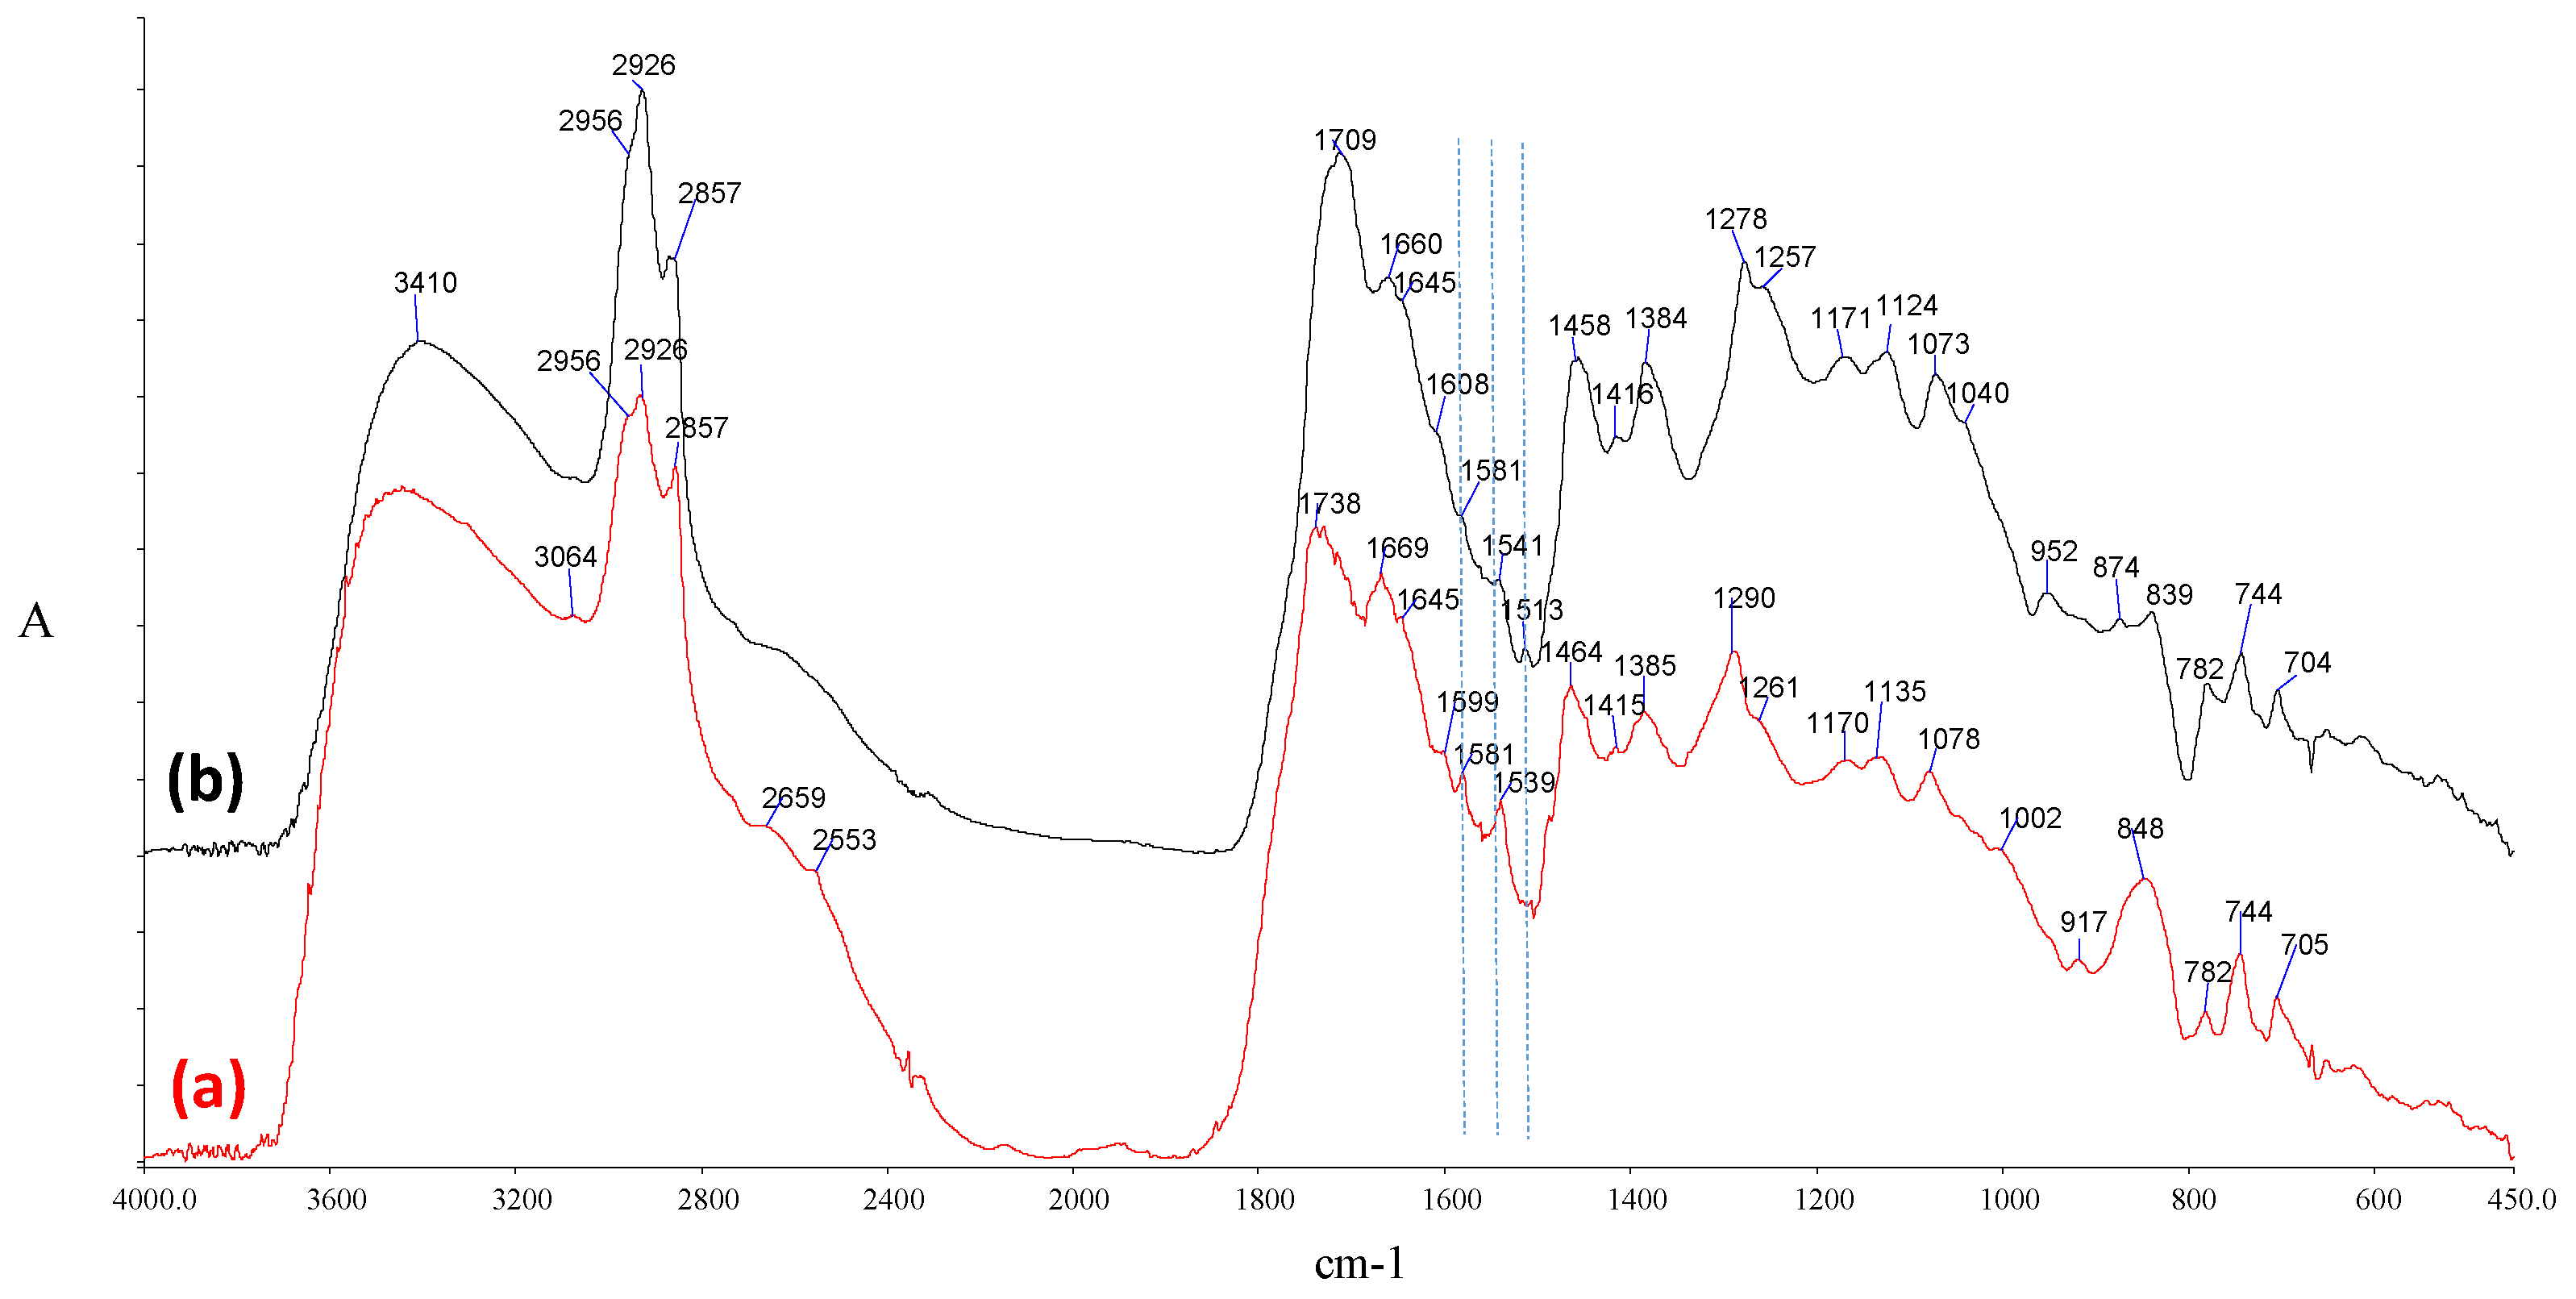
3.4. FTIR Results
4. Conclusions
Author Contributions
Funding
Institutional Review Board Statement
Informed Consent Statement
Acknowledgments
Conflicts of Interest
References
- Kadas, S.N. Monastery of Saint Dionysios. Pilgrimage Guide (History-Art-Relics), 3rd ed.; Monastery of Saint Dionysios: Mount Athos, Greece, 2002; pp. 56–59. [Google Scholar]
- Karapanagiotis, I.; Lampakis, D.; Konstanta, A.; Farmakalidis, H. Identification of colourants in icons of the Cretan School of iconography using Raman spectroscopy and liquid chromatography. J. Archaeol. Sci. 2013, 40, 1471–1478. [Google Scholar] [CrossRef]
- Karapanagiotis, I.; Minopoulou, E.; Valianou, L.; Daniilia, S.; Chryssoulakis, Y. Investigation of the colourants used in icons of the Cretan School of iconography. Anal. Chim. Acta 2009, 647, 231–242. [Google Scholar] [CrossRef]
- Valianou, L.; Wei, S.; Mubarak, M.S.; Farmakalidis, H.; Rosenberg, E.; Stassinopoulos, S.; Karapanagiotis, I. Identification of organic materials in icons of the Cretan School of iconography. J. Archaeol. Sci. 2011, 38, 246–254. [Google Scholar] [CrossRef]
- Daniilia, S.; Andrikopoulos, K.S.; Sotiropoulou, S.; Karapanagiotis, I. Analytical study into El Greco’s baptism of Christ: Clues to the genius of his palette. Appl. Phys. A 2008, 90, 565–575. [Google Scholar] [CrossRef]
- Nusimovici, M.A.; Meskaou, A. Raman scattering by α-HgS (Cinnabar). Phys. Stat. Sol. B 1973, 68, 121–125. [Google Scholar] [CrossRef]
- Bell, I.M.; Clark, R.J.H.; Gibbs, P.J. Raman spectroscopic library of natural and synthetic pigments (pre −1850 AD). Spectrochim. Acta A 1997, 53, 2159–2179. [Google Scholar] [CrossRef]
- Mazzocchin, G.A.; Agnoli, F.; Salvadori, M. Analysis of Roman age wall paintings found in Pordenone, Trieste and Montegrotto. Talanta 2004, 64, 732–741. [Google Scholar] [CrossRef] [PubMed]
- McCarty, K.F. Inelastic light scattering in a-Fe2O3: Phonon vs Magnon scattering. Solid State Commun. 1988, 68, 799–802. [Google Scholar] [CrossRef]
- Vigouroux, J.P.; Husson, E.; Calvarin, G.; Dao, N.Q. Etude par spectroscopié vibrationnelle des oxydes Pb3O4, SnPb2O4 et SuPb(Pb2O4)2. Spectrochim. Acta Part A Mol. Spectrosc. 1982, 38, 393–398. [Google Scholar] [CrossRef]
- Tuinstra, F.; Koenig, J.L. Raman spectrum of graphite. J. Chem. Phys. 1970, 53, 1126–1130. [Google Scholar] [CrossRef] [Green Version]
- Nakamizo, M.; Kammereck, R.; Walker, P.L., Jr. Laser Raman studies on carbons. Carbon 1974, 12, 259–267. [Google Scholar] [CrossRef]
- Tatsch, E.; Schrader, B. Near-infrared Fourier Transform Raman spectroscopy of indigoids. J. Raman Spectrosc. 1995, 26, 467–473. [Google Scholar] [CrossRef]
- Withnall, R.; Shadi, I.T.; Chowdhry, B.Z. Case study: The analysis of dyes by SERRS. In Raman Spectroscopy in Archaeology and Art History; Edwards, H.G.M., Chalmers, J.M., Barnett, N.W., Eds.; The Royal Society of Chemistry: Cambridge, UK, 2005; pp. 152–166. [Google Scholar]
- Gunasekaran, S.; Anbalagan, G.; Pandi, S. Raman and infrared spectra of carbonates of calcite structure. J. Raman Spectrosc. 2006, 37, 892–899. [Google Scholar] [CrossRef]
- Morimoto, N. The crystal structure of orpiment (As2S3) refined. Mineral. J. 1954, 1, 160–169. [Google Scholar] [CrossRef] [Green Version]
- Forneris, R. The infrared and Raman spectra of realgar and orpiment. Am. Mineral. 1969, 54, 1062–1074. [Google Scholar]
- Türker, M.C.Z.; Kısasöz, A.; Guler, K. Experimental Research on Properties of Naval Brass Castings. Prac. Metallogr. 2016, 53, 24–35. [Google Scholar] [CrossRef]
- Sandu, I.; Murta, E.; Neves, E.; Pereira, M.; Sandu, A.V.; Kuckova, S.; Maurício, A. A comparative interdisciplinary study of gilding techniques and materials in two Portuguese Baroque “talha dourada” complexes. Estud. Conserv. Restauro 2013, 1, 47–71. [Google Scholar] [CrossRef] [Green Version]
- Vermeulen, M.; Sanyova, J.; Janssens, K. Identification of artificial orpiment in the interior decorations of the Japanese tower in Laeken, Brussels, Belgium. Herit. Sci. 2015, 3, 9. [Google Scholar] [CrossRef] [Green Version]
- Ogalde, J.P.; Salas, C.O.; Lara, N.; Leyton, P.; Paipa, C.; Vallette, M.C.; Arriaza, B. Multi-instrumental identification of orpiment in archaeological mortuary contexts. J. Chil. Chem. Soc. 2014, 59, 2571–2573. [Google Scholar] [CrossRef] [Green Version]
- Rodríguez, S.L.; López, V.; Miguel, L.C. Microscopic Identification of Vine Black Pigment In A Tempera Painting By Francisco De Goya. SM Anal. Bioanal. Tech. 2017, 2, 1–8. [Google Scholar] [CrossRef]
- Tanevska, V.; Nastova, I.; Minčeva-Šukarova, B.; Grupče, O.; Ozcatal, M.; Kavčić, M.; Jakovlevska-Spirovska, Z. Spectroscopic analysis of pigments and inks in manuscripts: II. Islamic illuminated manuscripts (16th–18th century). Vib. Spectrosc. 2014, 73, 127–137. [Google Scholar] [CrossRef]
- Gómez, B.; Parera, S.; Siracusano, G.; Maier, M. Integrated analytical techniques for the characterization of painting materials in two South American polychrome sculptures. E-Preserv. Sci. 2010, 7, 1–7. [Google Scholar]
- Theodorakopoulos, C. The Excimer Laser Ablation of Picture Varnishes. Ph.D. Thesis, Royal College of Art, London, UK, 27 May 2005. [Google Scholar]
- Ménager, M.; Azémard, C.; Vieillescazes, C. Study of Egyptian mummification balms by FT-IR spectroscopy and GC-MS. Microchem. J. 2014, 114, 32–41. [Google Scholar] [CrossRef]
- Nevin, A.; Comelli, D.; Osticioli, I.; Toniolo, L.; Valentini, G.; Cubeddu, R. Assessment of the ageing of triterpenoid paint varnishes using fluorescence, Raman and FTIR spectroscopy. Anal. Bioanal. Chem. 2009, 39, 2139–2149. [Google Scholar] [CrossRef]
- Azémard, C.; Vieillescazes, C.; Ménager, M. Effect of photodegradation on the identification of natural varnishes by FT-IR spectroscopy. Microchem. J. 2014, 112, 137–149. [Google Scholar] [CrossRef]
- Bruni, S.; Guglielmi, V. Identification of archaeological triterpenoid resins by the non-separative techniques FTIR and 13C NMR: The case of Pistacia resin (mastic) in comparison with frankincense. Spectrochim. Acta Part A Mol. Biomol. Spectrosc. 2014, 121, 613–622. [Google Scholar] [CrossRef]
- Neilson, A.H.; Hynning, P. Polycyclic aromatic hydrocarbons: Products of chemical and biochemical transformation of Alicyclic precursors. Toxicol. Environ. Chem. 1996, 53, 45–89. [Google Scholar] [CrossRef]
- Tirat, S. Propriétés Physico-Chimiques et Vieillissement des Vernis huile de lin/Colophane: De la Technique du Luthier à la Conservation des Instruments de Musique Vernis. Ph.D. Thesis, Universite De Cergy-Pontoise, Cergy-Pontoise, France, 8 December 2017. [Google Scholar]
- Tirat, S.; Degano, I.; Echard, J.P.; Lattuati-Derieux, A.; Lluveras-Tenorio, A.; Arul, M.; Serfaty, S.; Huero, J.Y. Historical linseed oil/colophony varnishes formulations: Study of their molecular composition with micro-chemical chromatographic techniques. Microchem. J. 2016, 126, 200–213. [Google Scholar] [CrossRef]
- Otero, V.; Sanches, D.; Montagner, C.; Vilarigues, M.; Carlyle, L.; Lopes, J.; Melo, M. Characterisation of metal carboxylates by Raman and infrared spectroscopy in works of art. J. Raman Spectrosc. 2014, 45, 11–12. [Google Scholar] [CrossRef]
- Ma, X.; Beltran, V.; Ramer, G.; Pavlidis, G.; Parkinson, D.; Thoury, M.; Meldrum, T.; Centrone, A.; Berrie, B. Revealing the Distribution of Metal Carboxylates in Oil Paint from the Micro- to Nanoscale. Angew. Chem. 2019, 131, 11778–11782. [Google Scholar] [CrossRef]
- Hermans, J.J. Metal Soaps in Oil Paint: Structure, Mechanisms and Dynamics. Ph.D. Thesis, Van ‘t Hoff Institute for Molecular Sciences (HIMS), University of Amsterdam, Amsterdam, The Netherlands, 9 May 2017. [Google Scholar]
- Nakamoto, K. Infrared and Raman Spectra of Inorganic and Coordination Compounds, Part B, Applications in Coordination, Organometallic, and Bioinorganic Chemistry, 6th ed.; John Wiley & Sons: Hoboken, NJ, USA, 2009; pp. 64–65. [Google Scholar]
- Plater, M.J.; De Silva, B.; Gelbrich, T.; Hursthouse, M.; Higgitt, C.; Saunders, D. The characterisation of lead fatty acid soaps in “protrusions” in aged traditional oil paint. Polyhedron 2003, 22, 3171–3179. [Google Scholar] [CrossRef]
- Catalano, J.; Yao, Y.; Murphy, A.; Zumbulyadis, N.; Centeno, S.A.; Dybowski, C. Analysis of Lead Carboxylates and Lead-Containing Pigments in Oil Paintings by Solid- State Nuclear Magnetic Resonance. MRS Online Proc. Libr. 2014, 1656, 371–379. [Google Scholar] [CrossRef]
- Kadas, S.N. The Notes of the Manuscripts of the Monastery of Dionysios of Mount Athos; Monastery of Saint Dionysios: Mount Athos, Greece, 1996; pp. 64–67. [Google Scholar]


| Sample/Sampling Point | Stratigraphy | Raman Results | EDX Results |
|---|---|---|---|
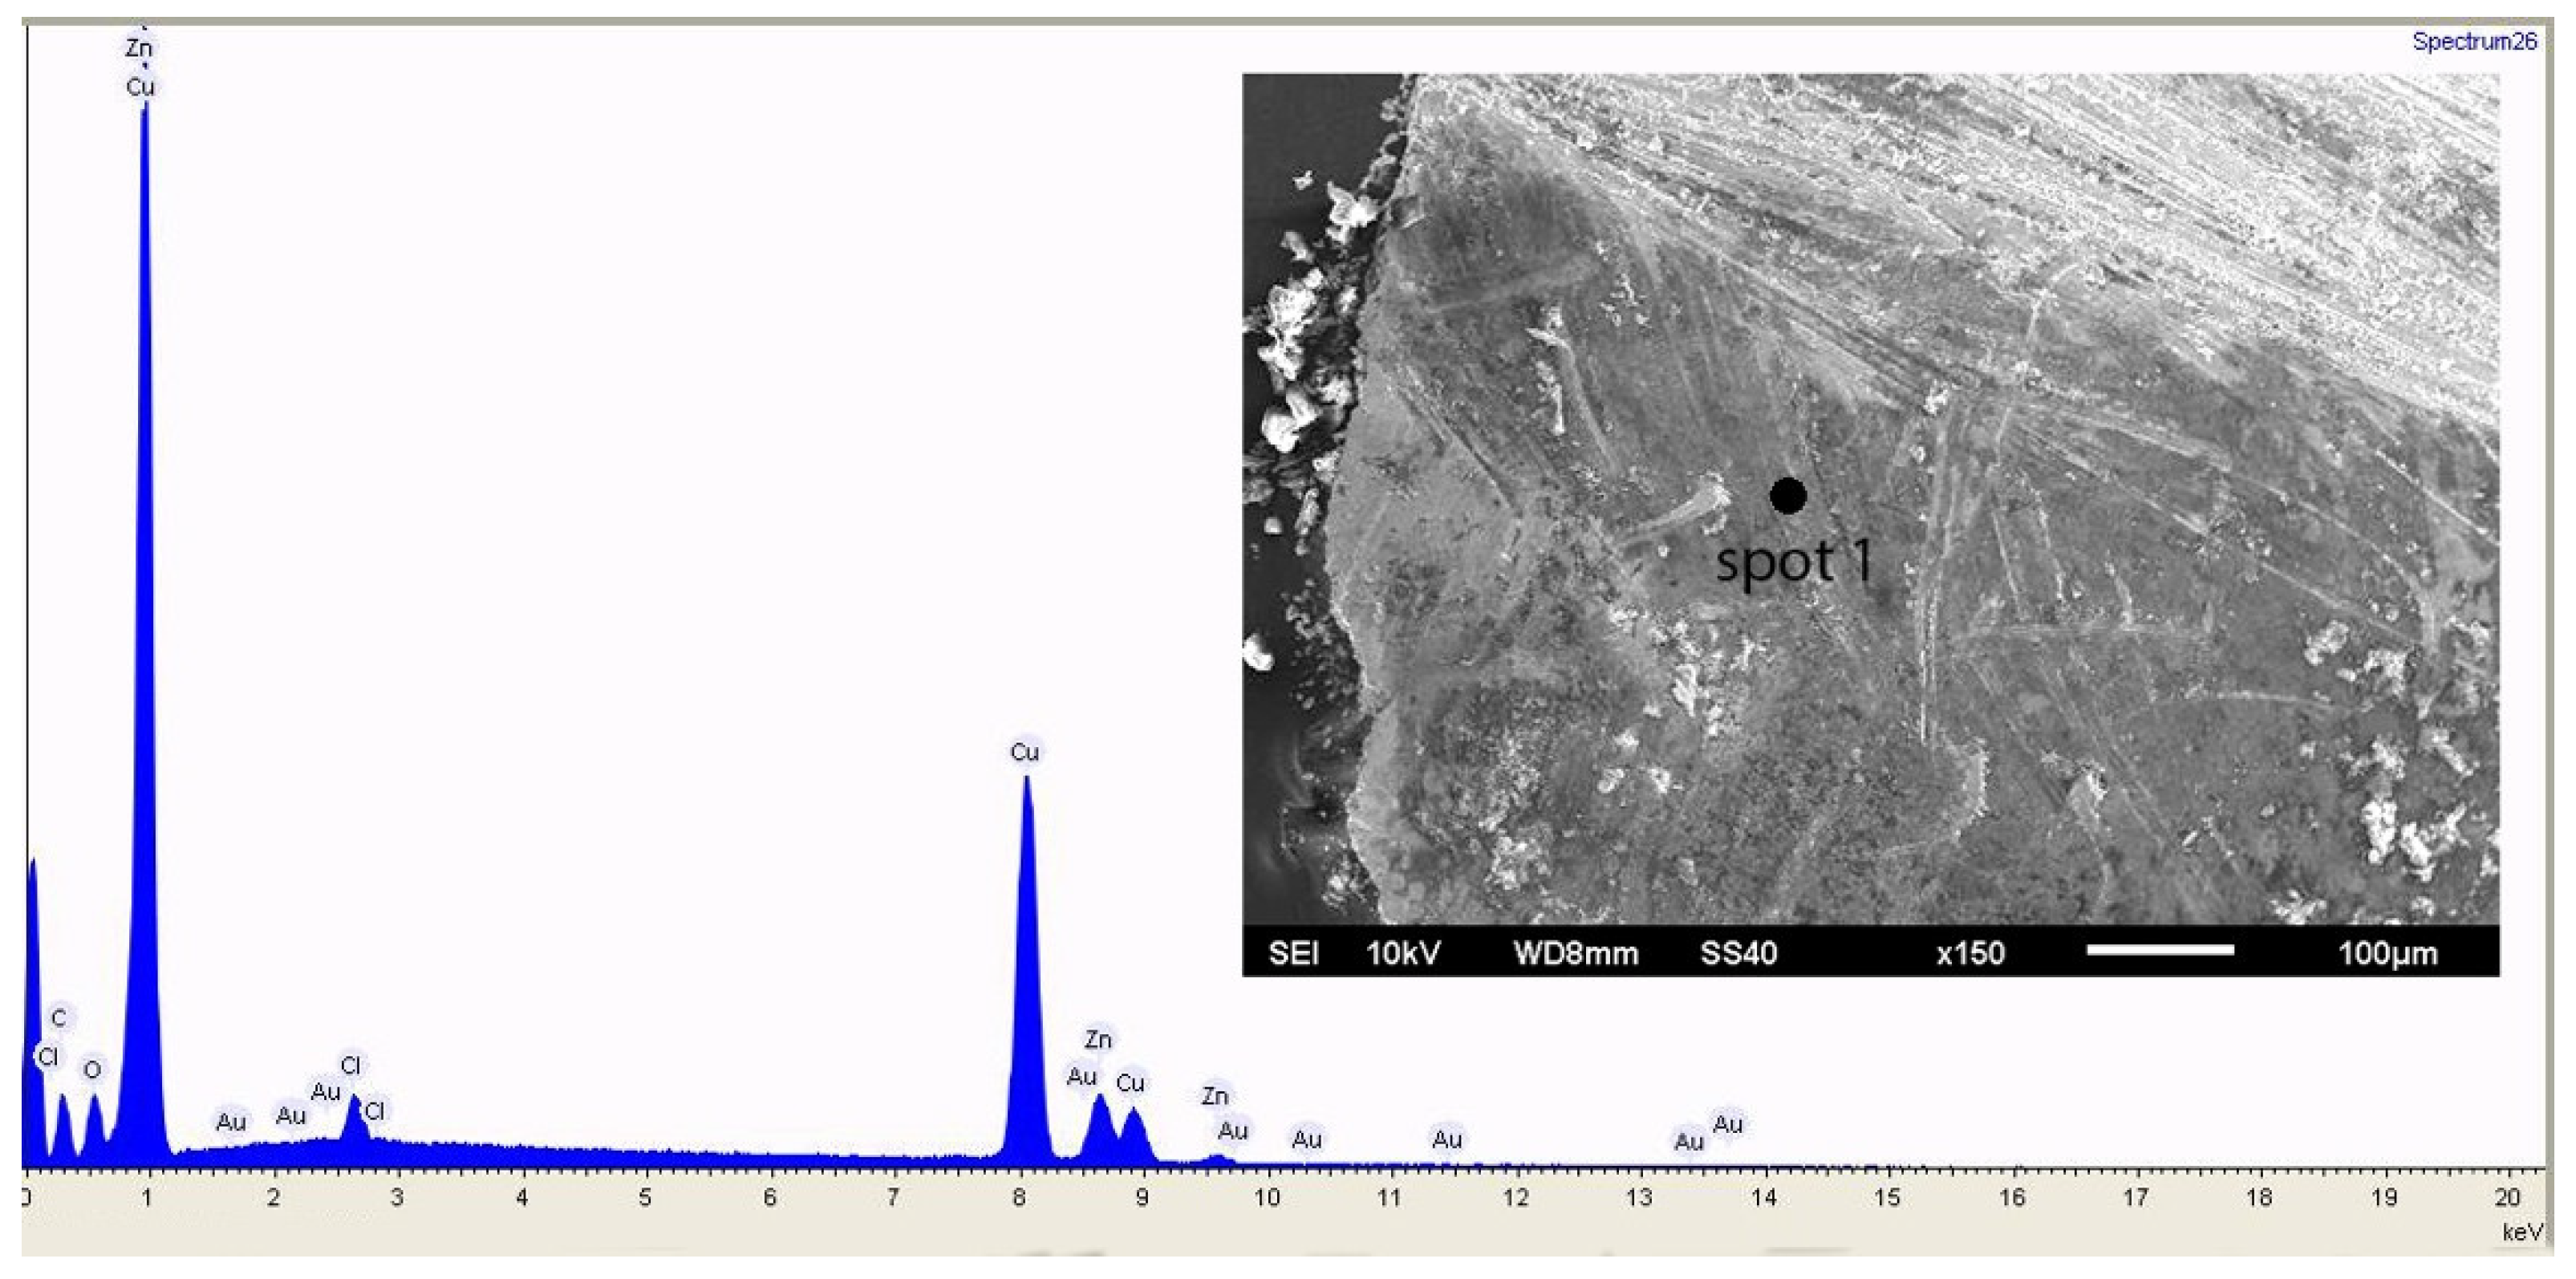
| D 1-Metal leaf from decoration | Back side | - | Cu, Zn |
| Front side | - | Cu, Zn, Au | |
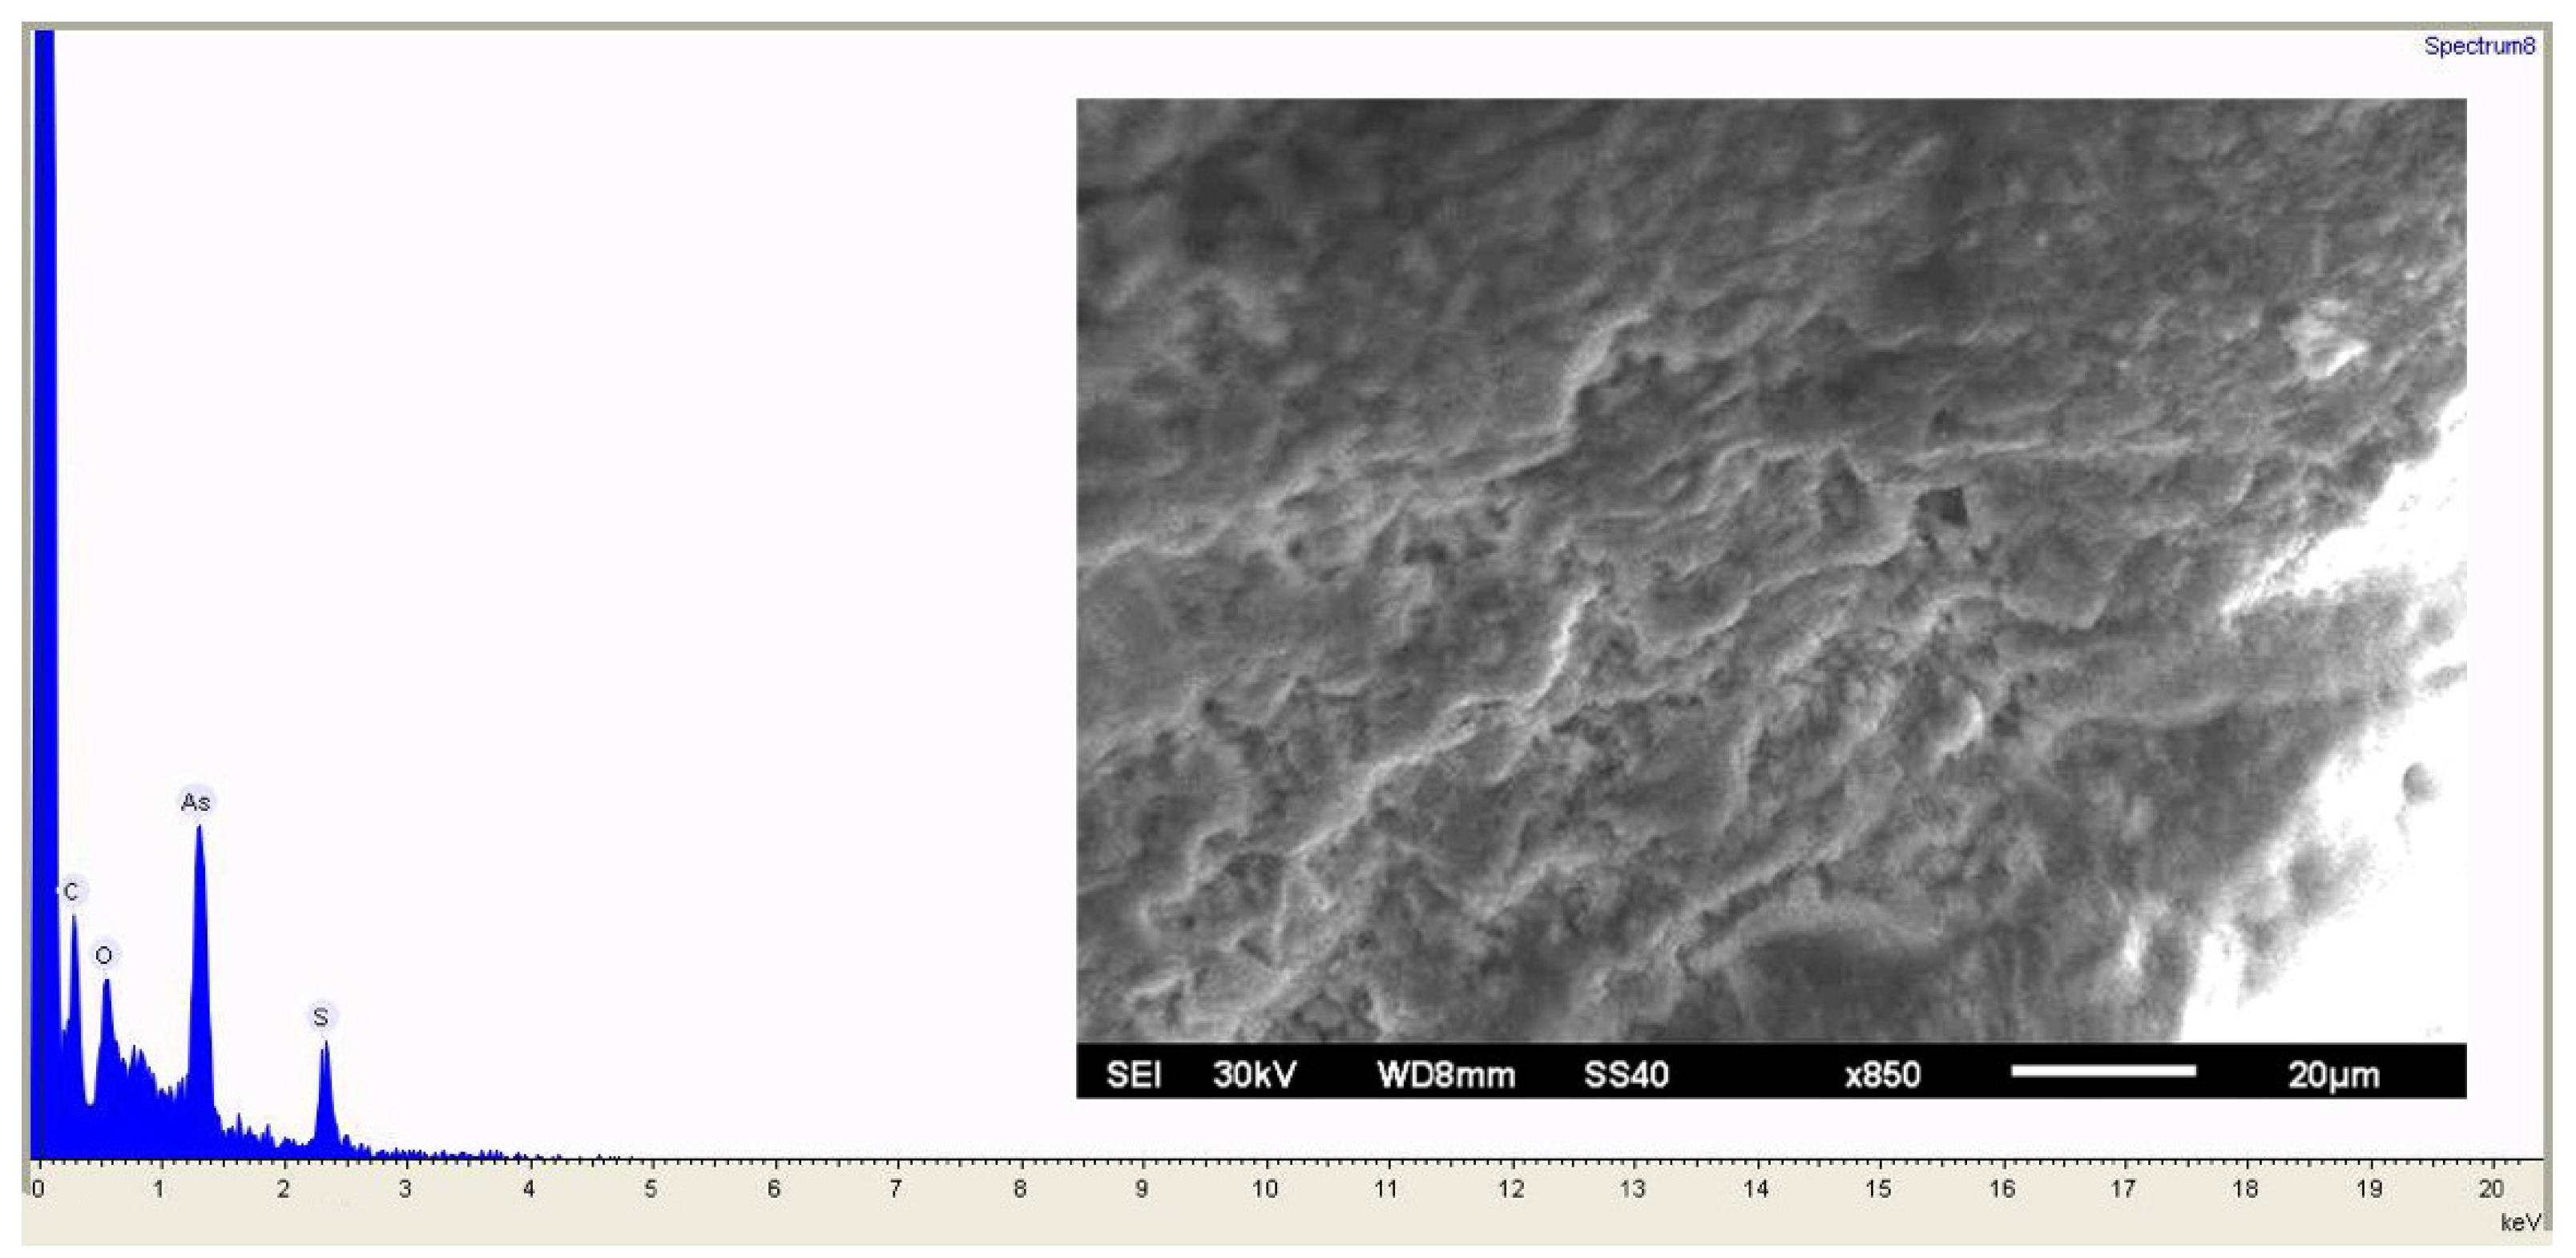
| D 2-Yellow spot | 1st painting layer | Orpiment | As, S, C, O |
| 1st varnish layer | - | - | |
| Soot layer | Carbon black | C, O | |
| 2nd varnish layer | - | - | |
| D 3-Red spot | Gesso ground | Gypsum | Ca, S, C, O |
| 1st painting layer | Lead white | Pb, O, C | |
| 2nd painting layer | Minium and lead white | Pb, O, C | |
| Varnish layer | - | - | |
| D 4-Light blue spot | 1st painting layer | Indigo/woad, lead white, red ochre, calcite, and gypsum | Ca, S, Pb, C, O |
| 2nd painting layer | Lead white, indigo/woad, red ochre, calcite, and gypsum | Ca, S, Pb, C, O | |
| Varnish layer | - | - | |
| D 5-Light blue spot | 1st painting layer | Lead white | Pb, Cu, C, O |
| 2nd painting layer | Indigo/woad, lead white, red lead, and calcite | Pb, Cu, Ca, C, O | |
| 3rd painting layer | Indigo/woad, lead white and calcite | ||
| 1st varnish layer | - | - | |
| Soot layer | Carbon black | C, O | |
| 2nd varnish layer | - | - | |
| D 6-Blue spot | Gesso ground | Gypsum | Ca, S, C, O |
| 1st painting layer | Lead white | Pb, C, O | |
| 2nd painting layer | Indigo/woad, gypsum, and lead white | Pb, Ca, S, C, O | |
| 1st varnish layer | - | - | |
| 2nd varnish layer | - | - | |
| D 7-Green spot | 1st painting layer | Lead white | Cu, Pb, C, O |
| 1st varnish layer | - | - | |
| Soot layer | Carbon black | C, O | |
| 2nd varnish layer | - | - | |
| D 8-Light red spot | 1st painting layer | Red lead and lead white | Pb, C, O |
| 1st varnish layer | - | - | |
| Soot layer | Carbon black | C, O | |
| 2nd varnish layer | - | - | |
| D 9-Light blue spot | 1st painting layer | Lead white | Pb, Cu, C, O |
| 2nd painting layer | Lead white | Pb, Cu, C, O | |
| 1st varnish layer | - | - | |
| Soot layer | Carbon black | C, O | |
| 2nd varnish layer | - | - | |
| D 10-Red spot | Gesso ground | Gypsum | Ca, S, C, O |
| 1st painting layer | Lead white | Pb, C, O | |
| 2nd painting layer | Red lead | Pb, C, O | |
| 1st varnish layer | - | - | |
| Soot layer | Carbon black | C, O | |
| 2nd varnish layer | - | - | |
| D 11-Light blue spot | 1st painting layer | Red lead | Pb, C, O |
| 2nd painting layer | Indigo/woad and lead white | Pb, C, O | |
| Varnish layer | - | - | |
| D12-Red spot | Gesso ground | Gypsum | Ca, S, C, O |
| 1st painting layer | Cinnabar | Hg, S, C, O | |
| Varnish layer | - | - | |
| D 14-Black spot | 1st painting layer | Orpiment | As, S, C, O |
| Gesso ground | Gypsum, calcite, and orpiment | Ca, S, As, C, O | |
| 2nd painting layer | Carbon black | C, O | |
| 1st varnish layer | - | - | |
| Soot layer | Carbon black | C, O | |
| 2nd varnish layer | - | - | |
| D 15-Green spot | Gesso ground: | Gypsum and anhydrite | Ca, S, C, O |
| 1st painting layer | Orpiment, indigo/woad, and anhydrite | Ca, S, As, C, O | |
| Varnish layer | - | - | |
| D 17-Yellow spot | 1st layer of gesso ground | Gypsum | Ca, S, C, O |
| 1st painting layer | Cinnabar and carbon black | Hg, S, C, O | |
| 2nd layer of gesso ground | Gypsum | Ca, S, C, O | |
| 2nd painting layer | Orpiment | As, S, C, O | |
| Varnish layer | - | - |
| Pigment | Sample | Composition | Raman Characteristic Peaks and Relative Intensities 1 (cm−1) |
|---|---|---|---|
| Orpiment | D1, D14, D15, D17 | As2S3 | 105 m, 136 s, 154 s, 179 m, 202 s, 293 s, 311 vs, 355 vs, 383 m |
| Lead white | D3, D4, D5, D6, D7, D8, D9, D10, D11 | 2PbCO3⋅Pb(OH)2 | 1055 vs |
| Minium | D3 | Pb3O4 | 232 w, 314 w, 391 w, 480 s, 550 vs |
| Red ochre | D4 | Fe2O3 | 225 vs, 295 s, 408 m, 498 w, 661 vw, 1320 m and br |
| Cinnabar | D12, D17 | HgS | 254 vs, 285 w, 343 m |
| Indigo/woad | D4, D5, D6, D11, D15 | C16H10N2O2 | 547 w, 600 w, 942 w, 1015 w, 1147 m, 1253 s, 1313 w, 1366 vs, 1463 m, 1486 m, 1573 s, 1585 s, 1616 s, 1700 s |
| Carbon black | D2, D5, D7, D8, D9, D10, D14, D17 | C | 1318 s and br, 1584 vs and br |
| Gypsum | D3, D4, D6, D10, D12, D14, D15, D17 | CaSO4⋅2H2O | 1008 vs |
| Anhydrite | D15 | CaSO4 | 1016 vs |
| Calcite | D4, D5, D14 | CaCO3 | 155 w, 280 w, 1088 vs |
Publisher’s Note: MDPI stays neutral with regard to jurisdictional claims in published maps and institutional affiliations. |
© 2021 by the authors. Licensee MDPI, Basel, Switzerland. This article is an open access article distributed under the terms and conditions of the Creative Commons Attribution (CC BY) license (https://creativecommons.org/licenses/by/4.0/).
Share and Cite
Konstantas, A.; Karapanagiotis, I.; Boyatzis, S.C. Identification of Colourants and Varnishes in a 14th Century Decorated Wood-Carved Door of the Dionysiou Monastery in Mount Athos. Coatings 2021, 11, 1087. https://0-doi-org.brum.beds.ac.uk/10.3390/coatings11091087
Konstantas A, Karapanagiotis I, Boyatzis SC. Identification of Colourants and Varnishes in a 14th Century Decorated Wood-Carved Door of the Dionysiou Monastery in Mount Athos. Coatings. 2021; 11(9):1087. https://0-doi-org.brum.beds.ac.uk/10.3390/coatings11091087
Chicago/Turabian StyleKonstantas, Alexander, Ioannis Karapanagiotis, and Stamatis C. Boyatzis. 2021. "Identification of Colourants and Varnishes in a 14th Century Decorated Wood-Carved Door of the Dionysiou Monastery in Mount Athos" Coatings 11, no. 9: 1087. https://0-doi-org.brum.beds.ac.uk/10.3390/coatings11091087