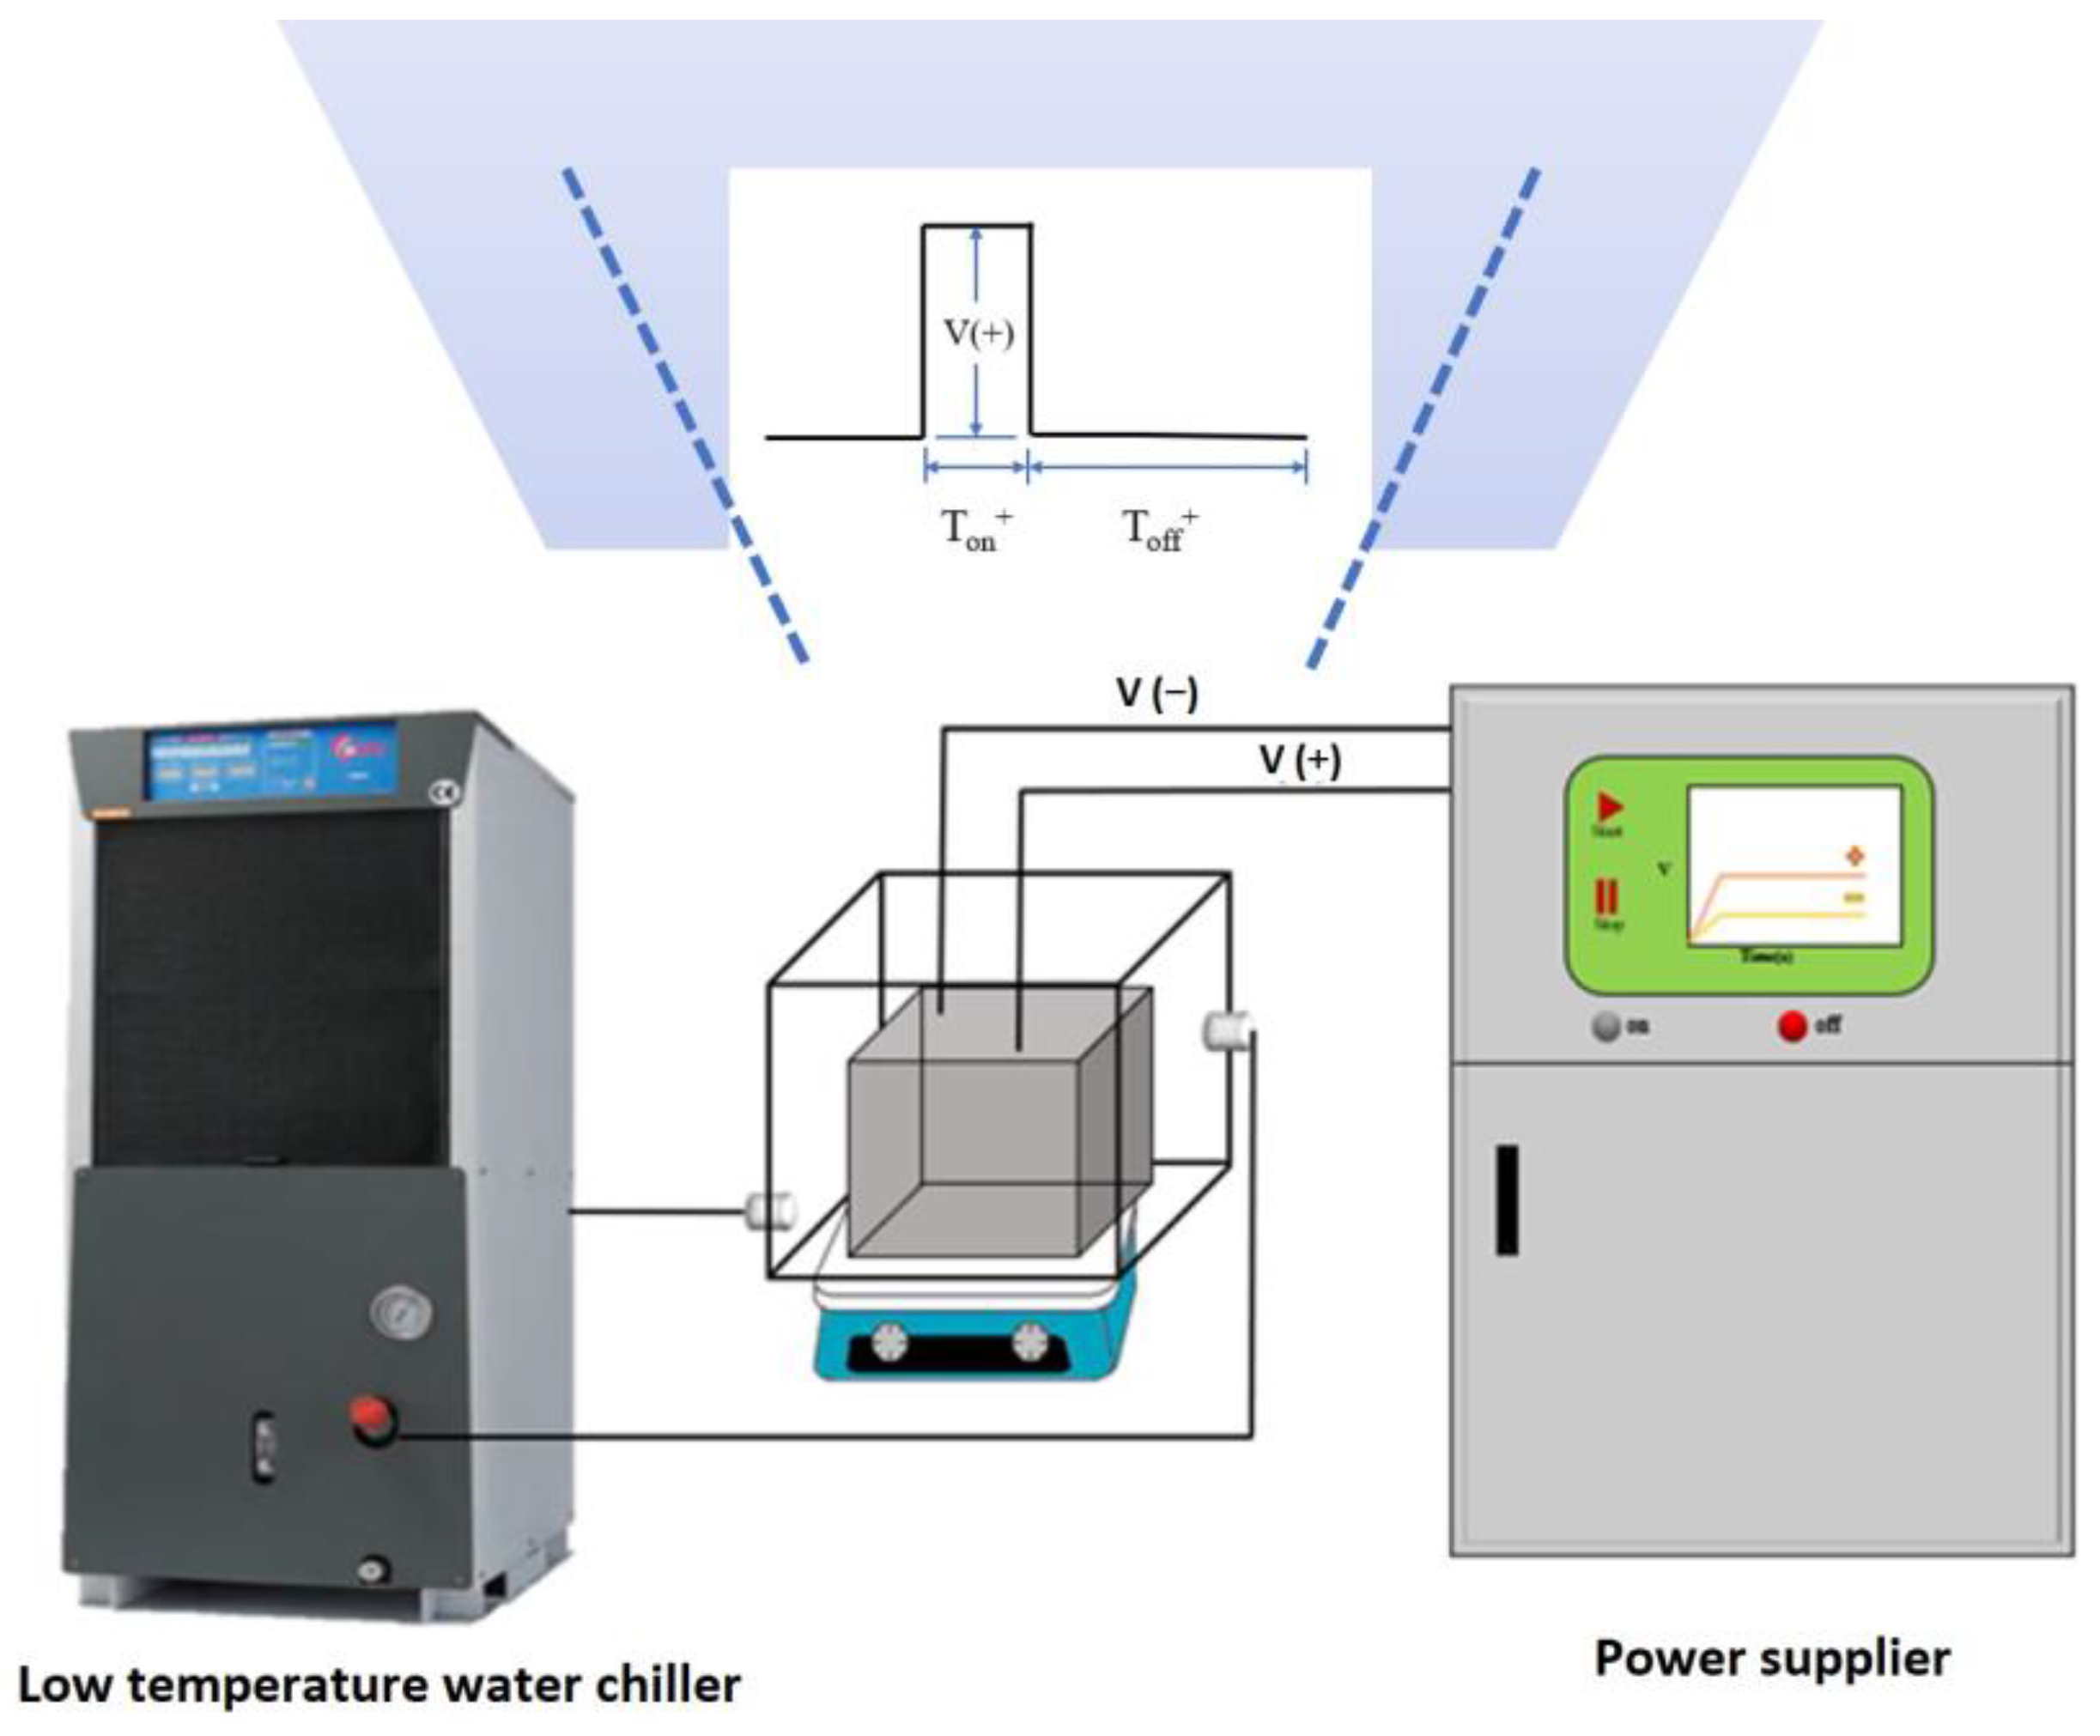
Figure 1.
A schematic of the micro-arc oxidation setup.
Figure 1.
A schematic of the micro-arc oxidation setup.
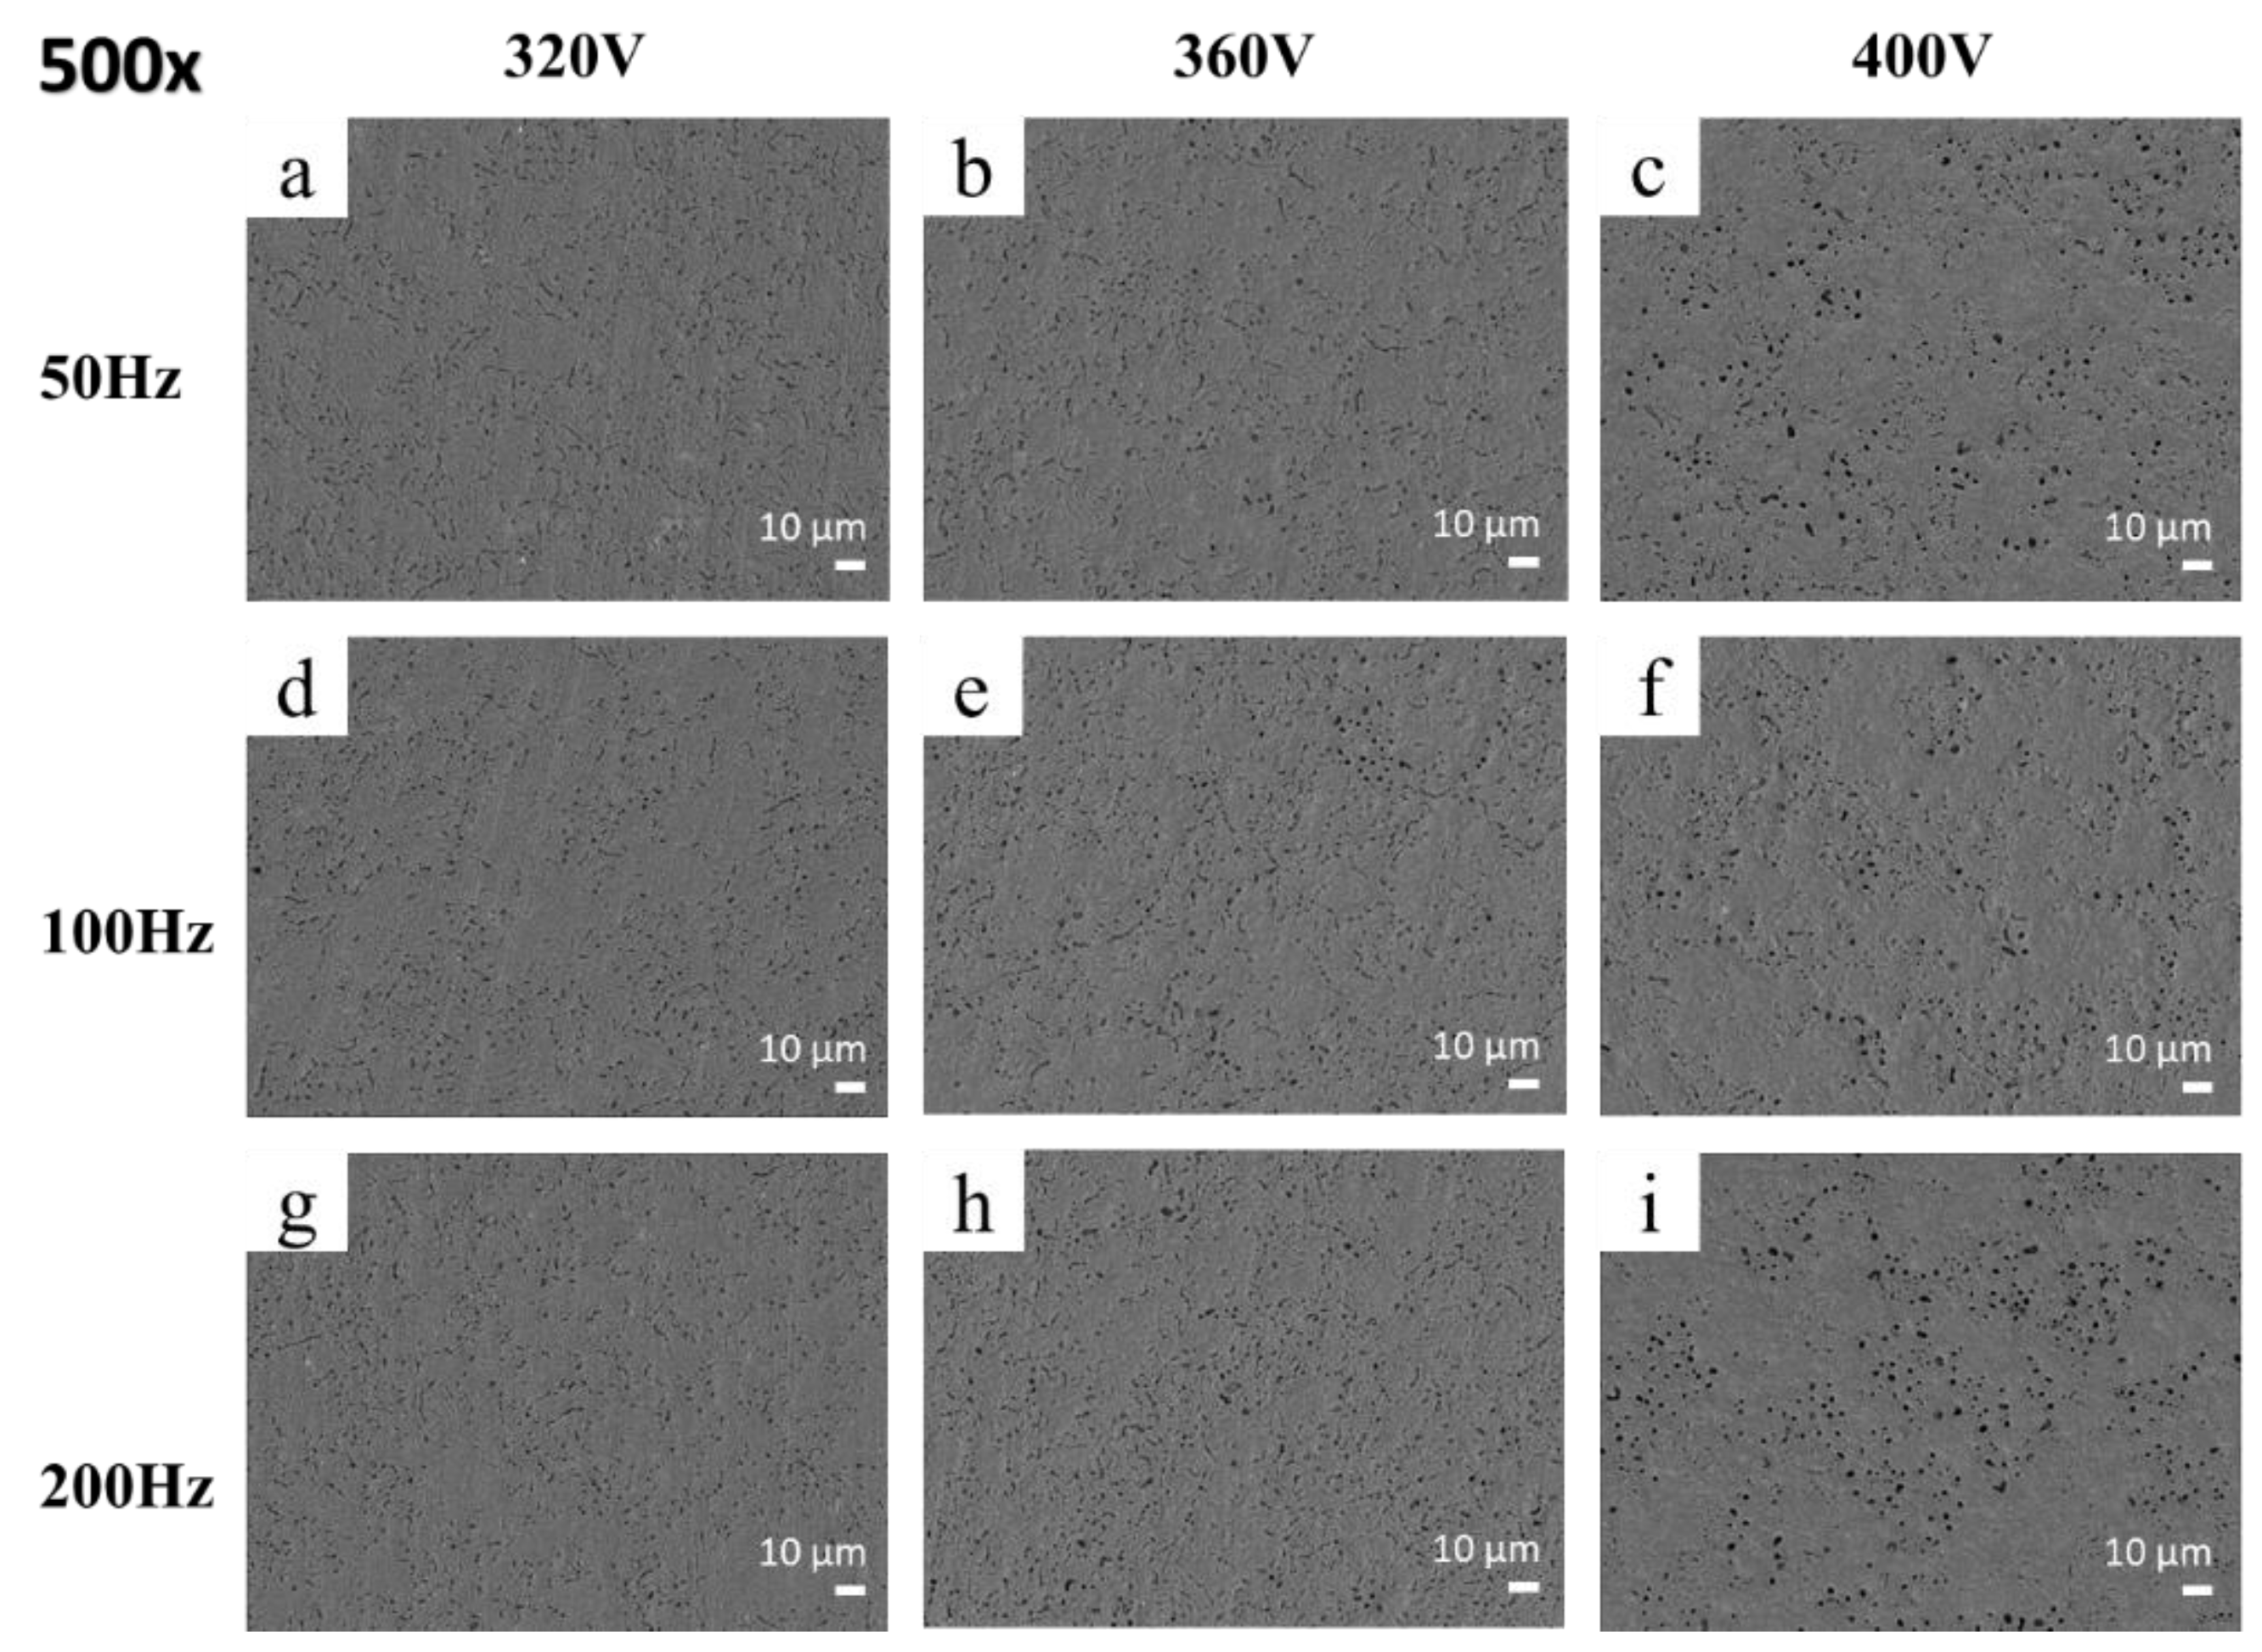
Figure 2.
Surface SEM images of MAO-coated 5052 Al alloy at different voltages and frequencies: (a) 320 V, 50 Hz; (b) 360 V, 50 Hz; (c) 400 V, 50 Hz; (d) 320 V, 100 Hz; (e) 360 V, 100 Hz; (f) 400 V, 100 Hz; (g) 320 V, 200 Hz; (h) 360 V, 200 Hz; and (i) 400 V, 200 Hz.
Figure 2.
Surface SEM images of MAO-coated 5052 Al alloy at different voltages and frequencies: (a) 320 V, 50 Hz; (b) 360 V, 50 Hz; (c) 400 V, 50 Hz; (d) 320 V, 100 Hz; (e) 360 V, 100 Hz; (f) 400 V, 100 Hz; (g) 320 V, 200 Hz; (h) 360 V, 200 Hz; and (i) 400 V, 200 Hz.
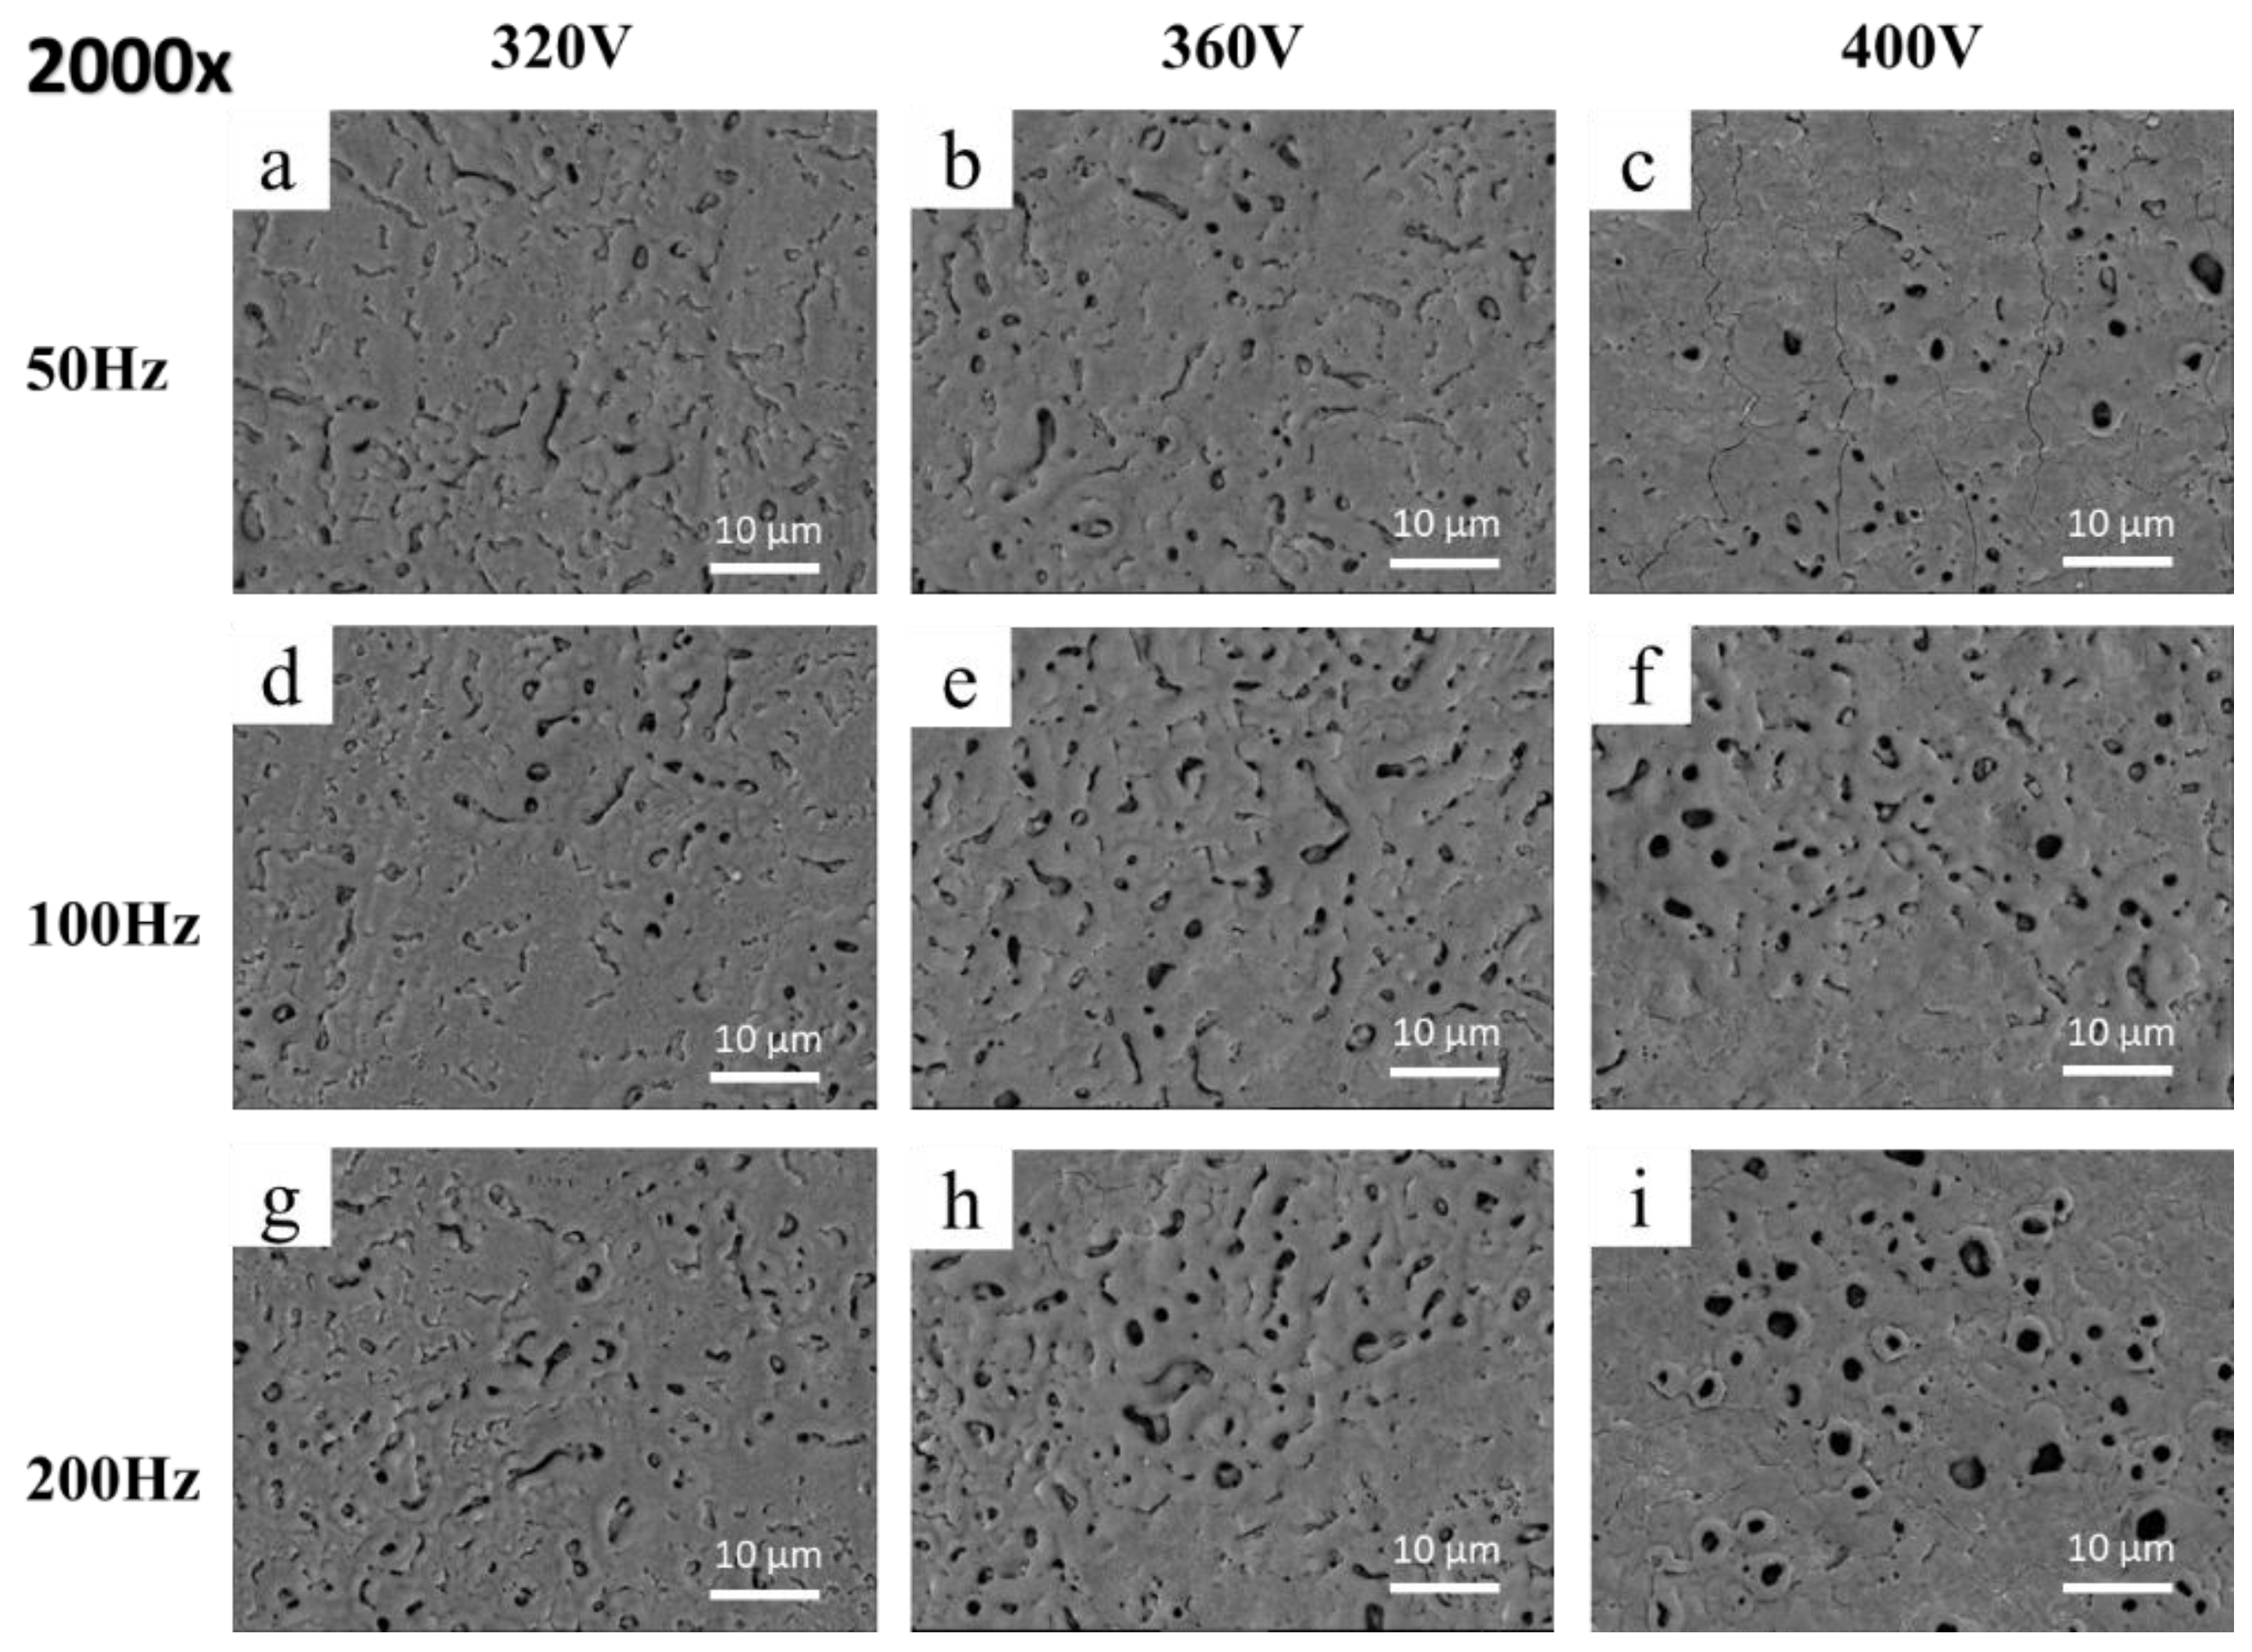
Figure 3.
High-magnification surface SEM images of MAO-coated 5052 Al alloy at different voltages and frequencies: (a) 320 V, 50 Hz; (b) 360 V, 50 Hz; (c) 400 V, 50 Hz; (d) 320 V, 100 Hz; (e) 360 V, 100 Hz; (f) 400 V, 100 Hz; (g) 320 V, 200 Hz; (h) 360 V, 200 Hz; and (i) 400 V, 200 Hz.
Figure 3.
High-magnification surface SEM images of MAO-coated 5052 Al alloy at different voltages and frequencies: (a) 320 V, 50 Hz; (b) 360 V, 50 Hz; (c) 400 V, 50 Hz; (d) 320 V, 100 Hz; (e) 360 V, 100 Hz; (f) 400 V, 100 Hz; (g) 320 V, 200 Hz; (h) 360 V, 200 Hz; and (i) 400 V, 200 Hz.
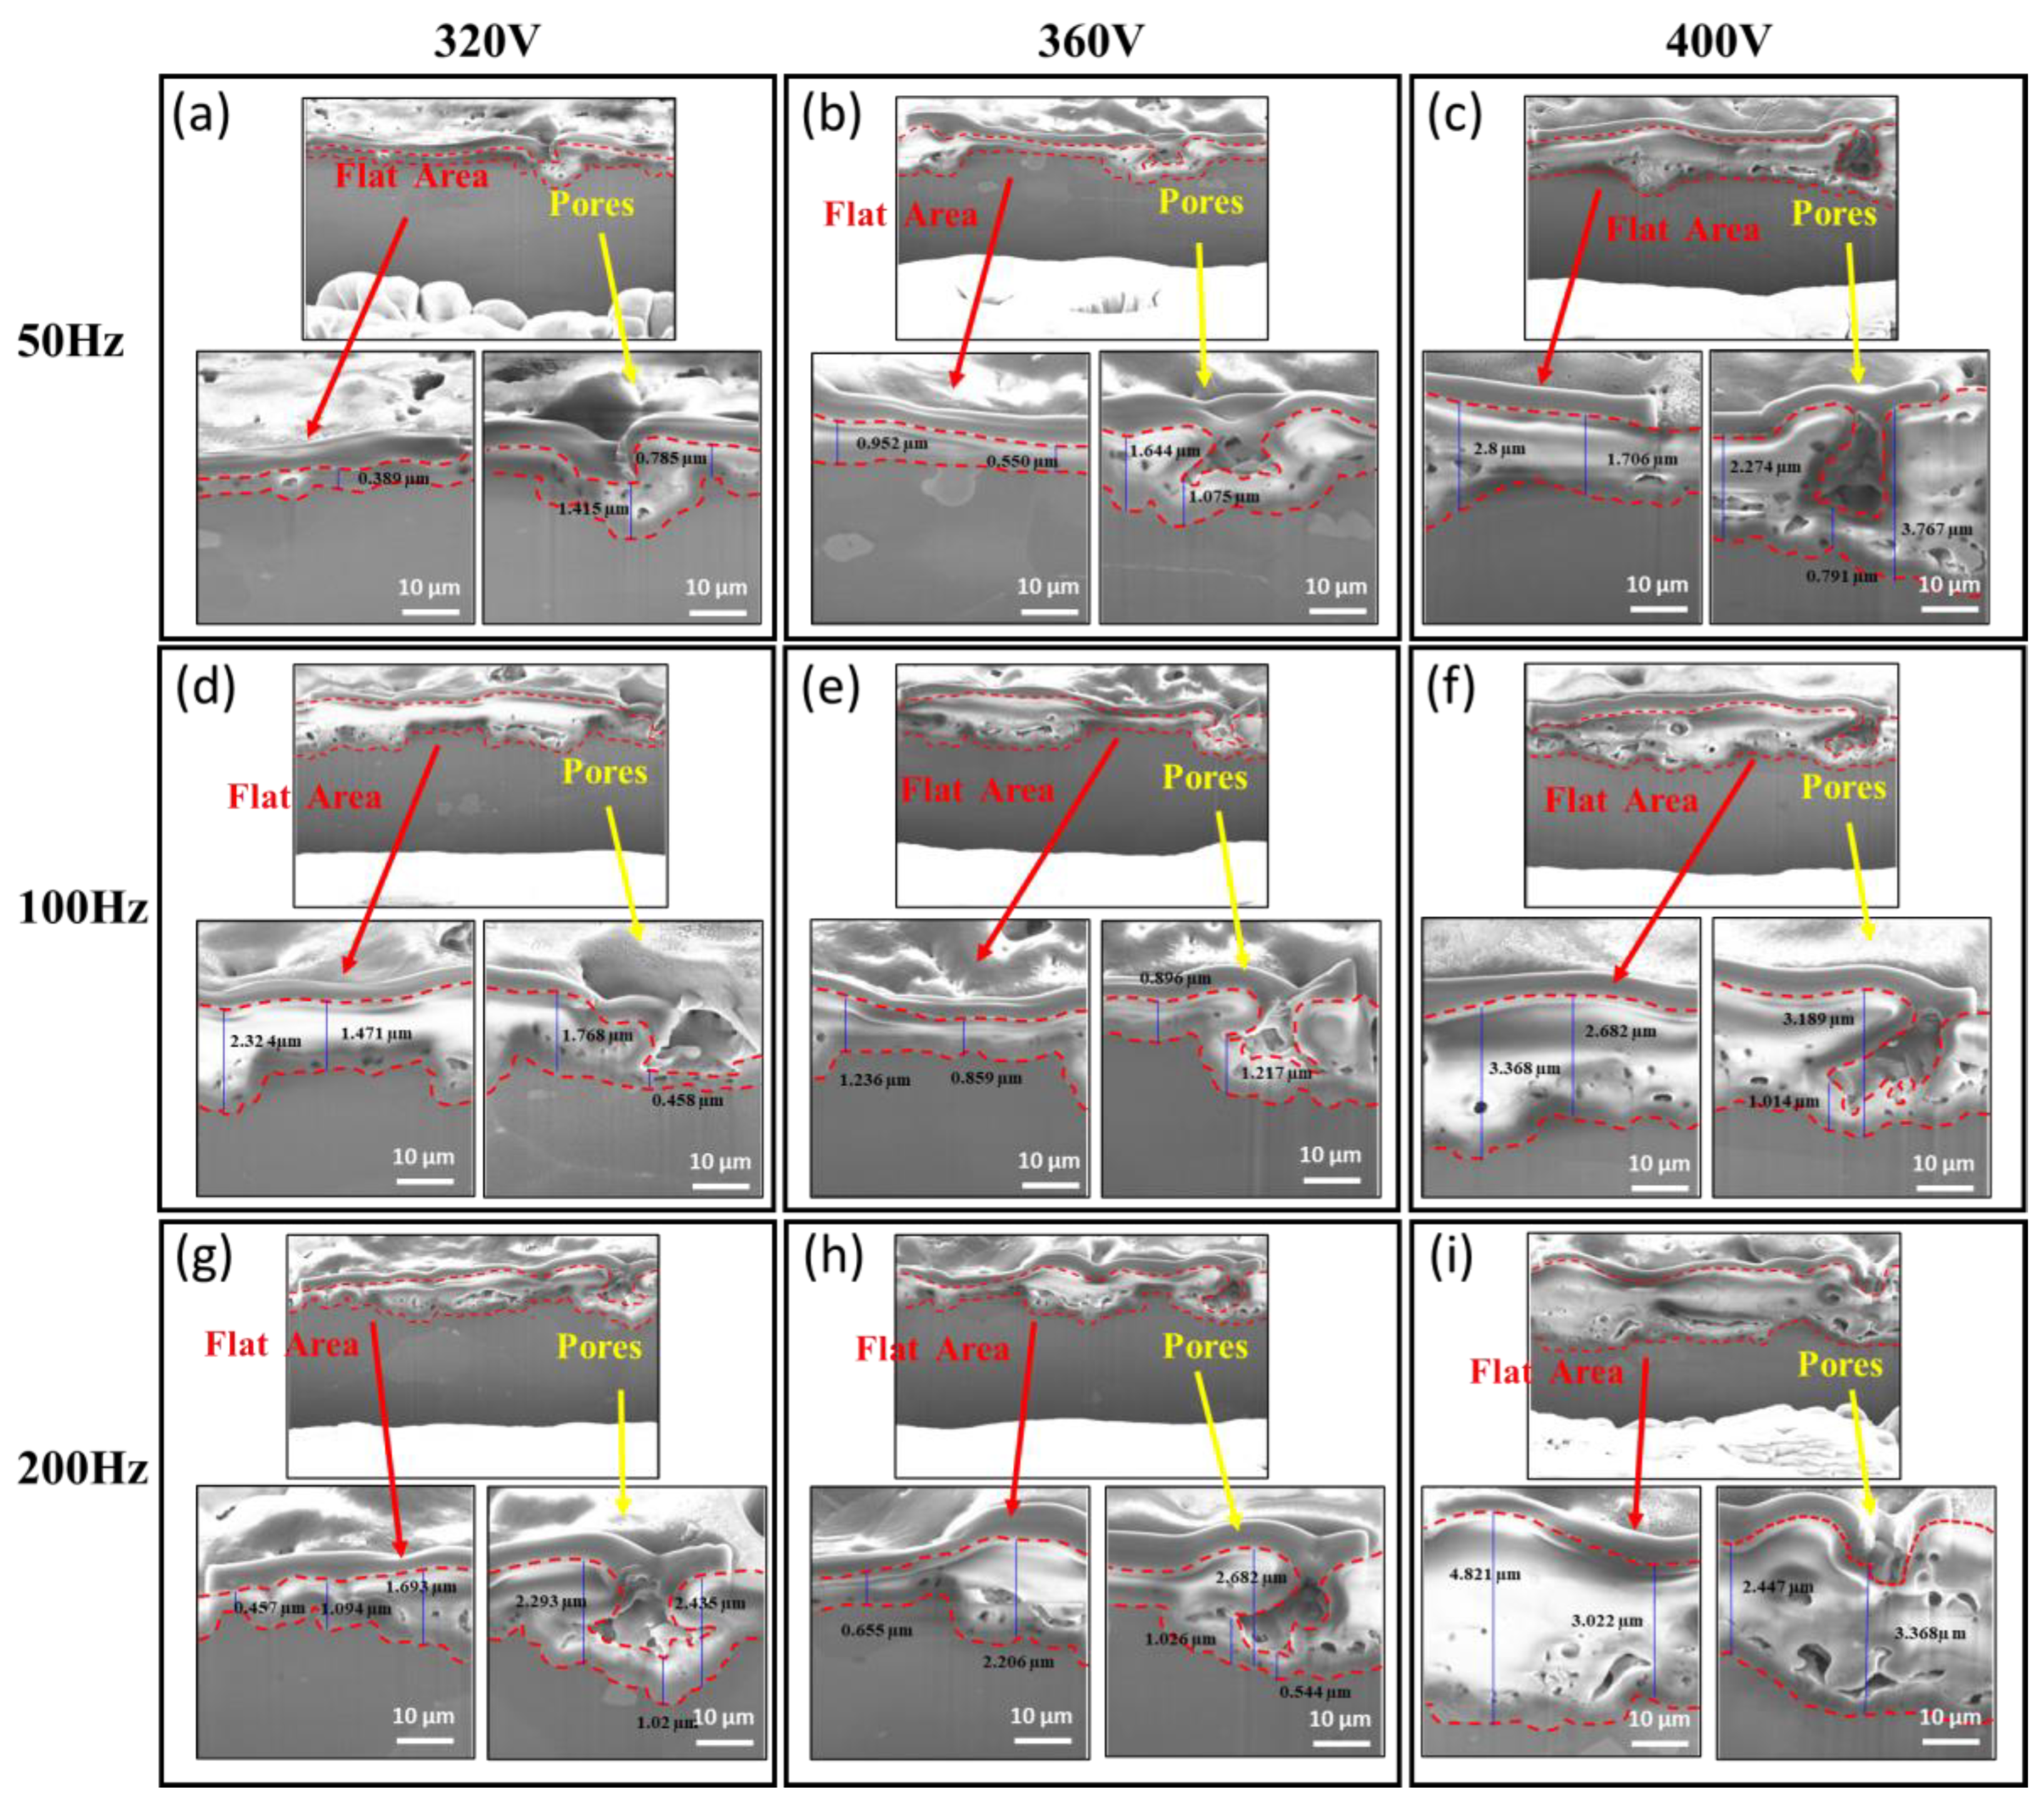
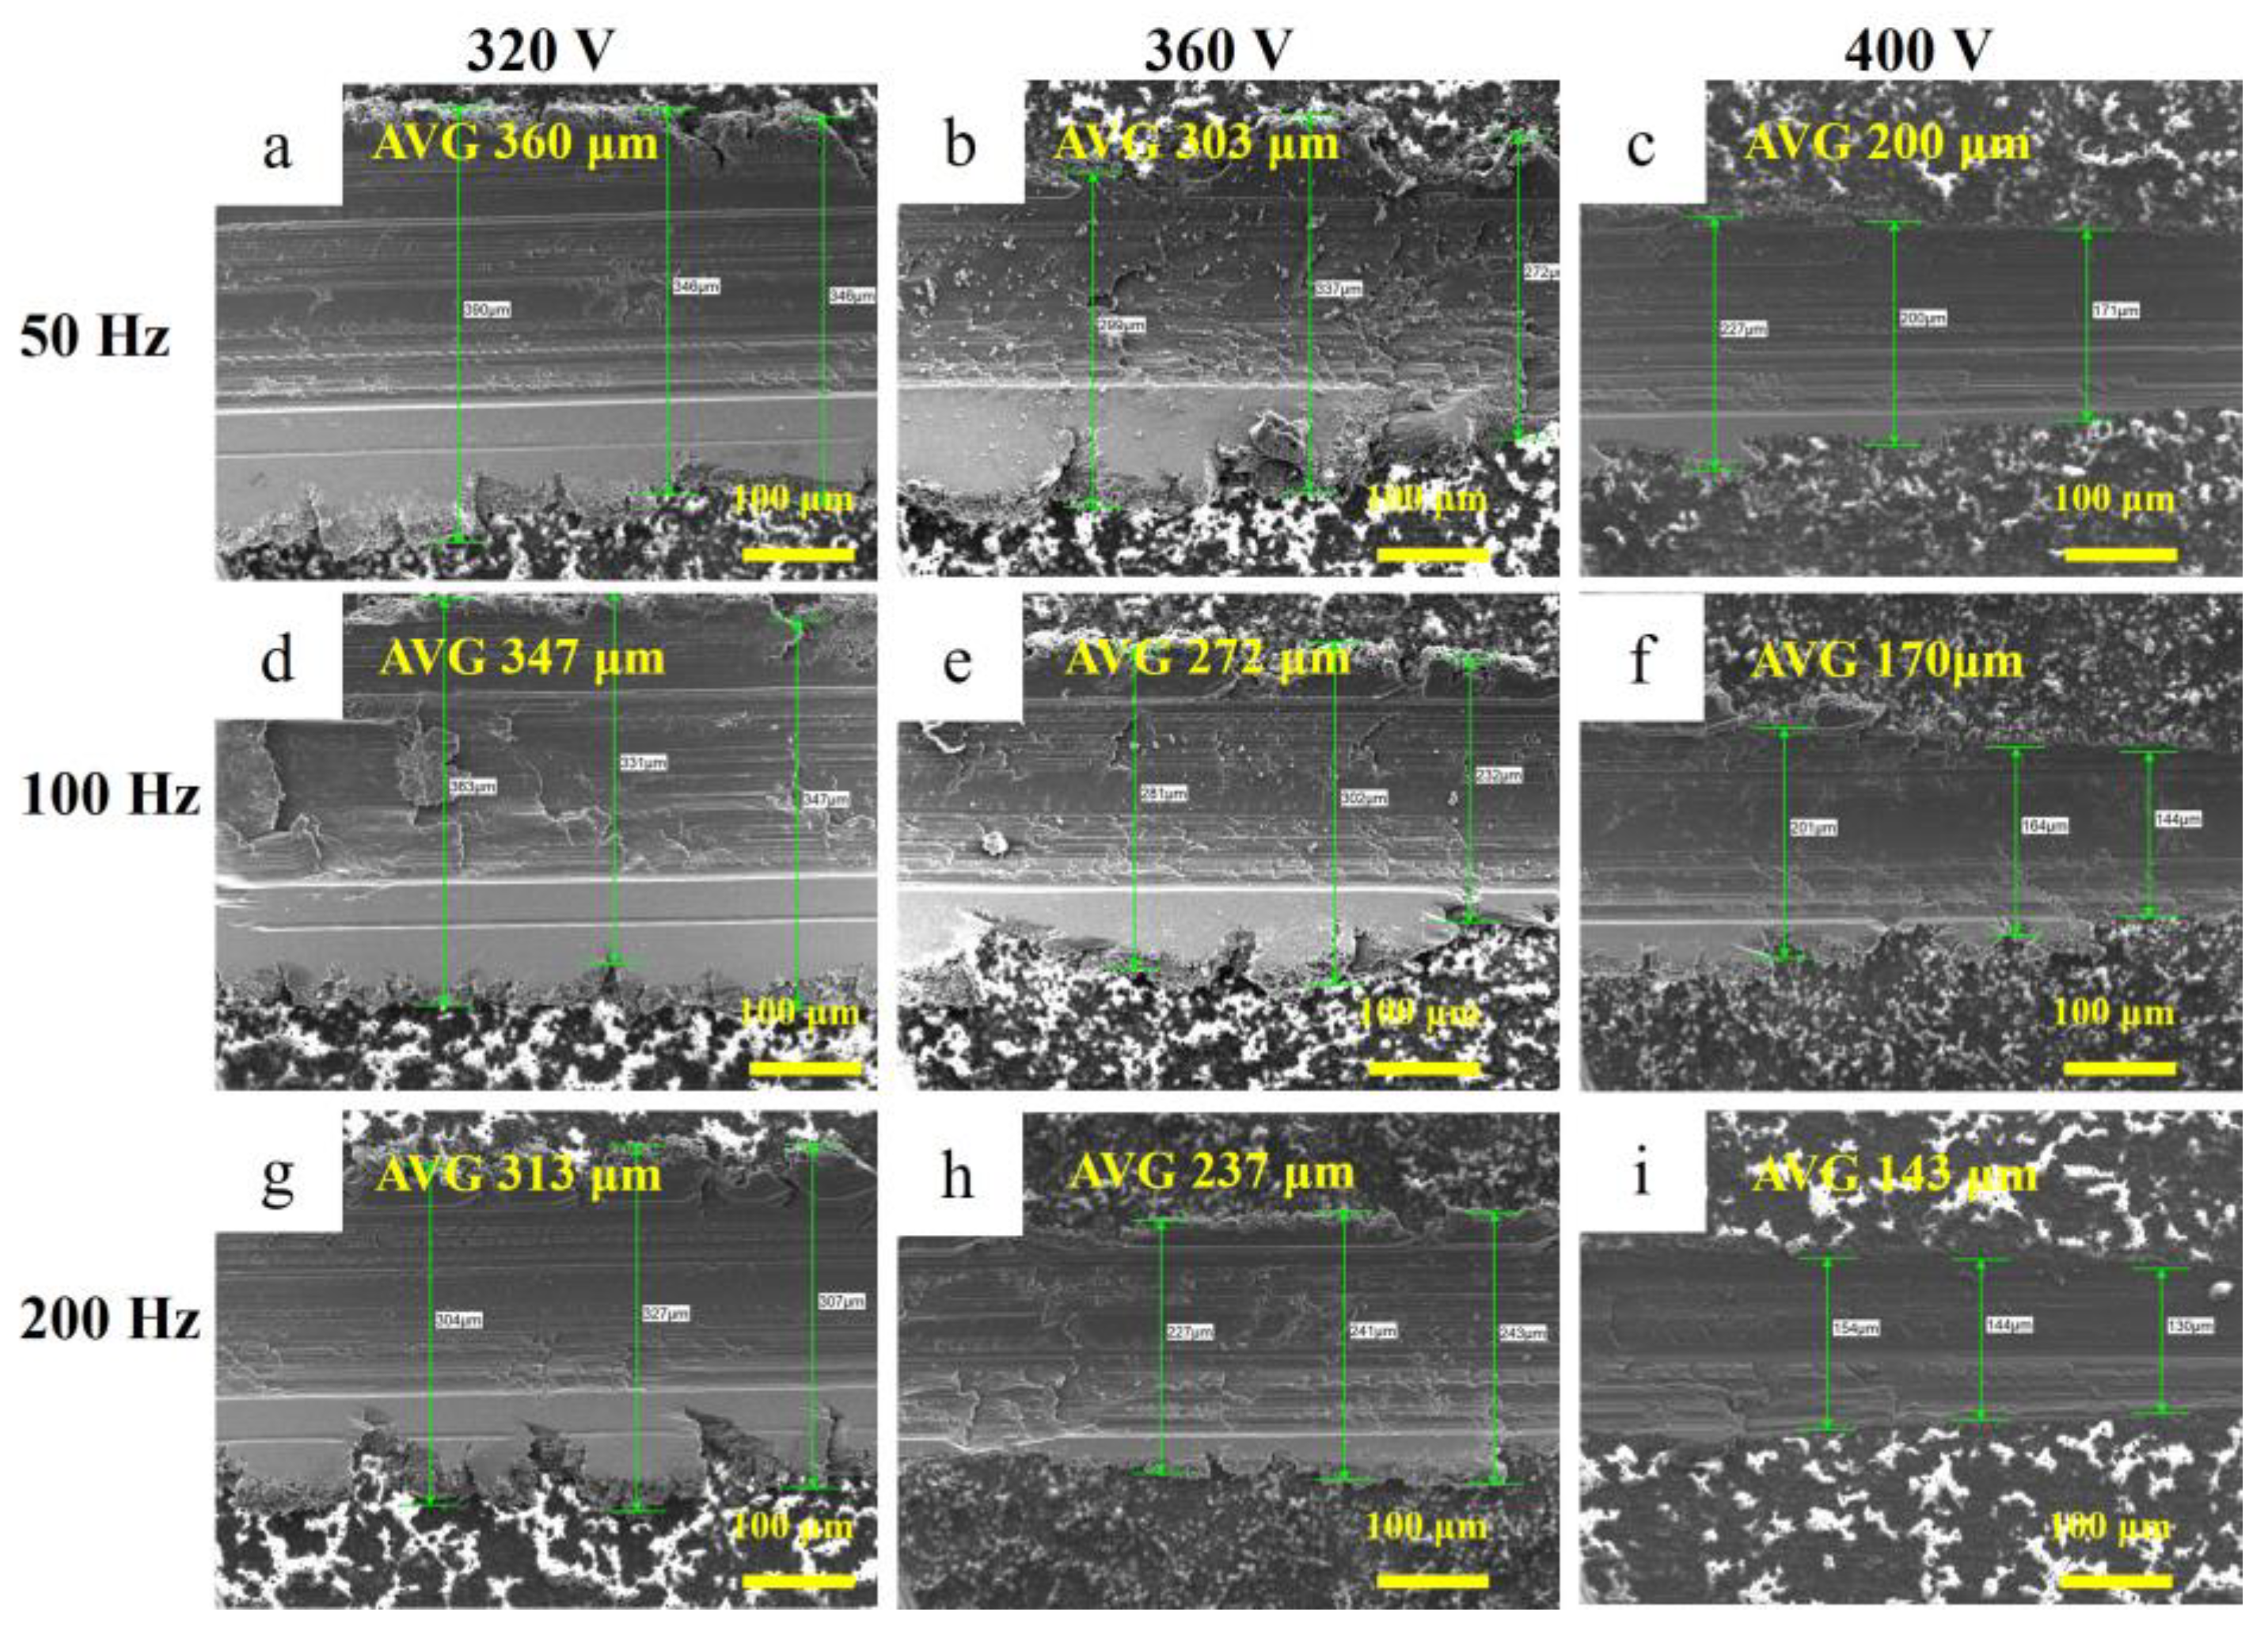
Figure 4.
Cross-sectional SEM images of the coated 5052 Al alloy at different voltages and frequencies: (a) 320 V, 50 Hz; (b) 360 V, 50 Hz; (c) 400 V, 50 Hz; (d) 320 V, 100 Hz; (e) 360 V, 100 Hz; (f) 400 V, 100 Hz; (g) 320 V, 200 Hz; (h) 360 V, 200 Hz; and (i) 400 V, 200 Hz.
Figure 4.
Cross-sectional SEM images of the coated 5052 Al alloy at different voltages and frequencies: (a) 320 V, 50 Hz; (b) 360 V, 50 Hz; (c) 400 V, 50 Hz; (d) 320 V, 100 Hz; (e) 360 V, 100 Hz; (f) 400 V, 100 Hz; (g) 320 V, 200 Hz; (h) 360 V, 200 Hz; and (i) 400 V, 200 Hz.
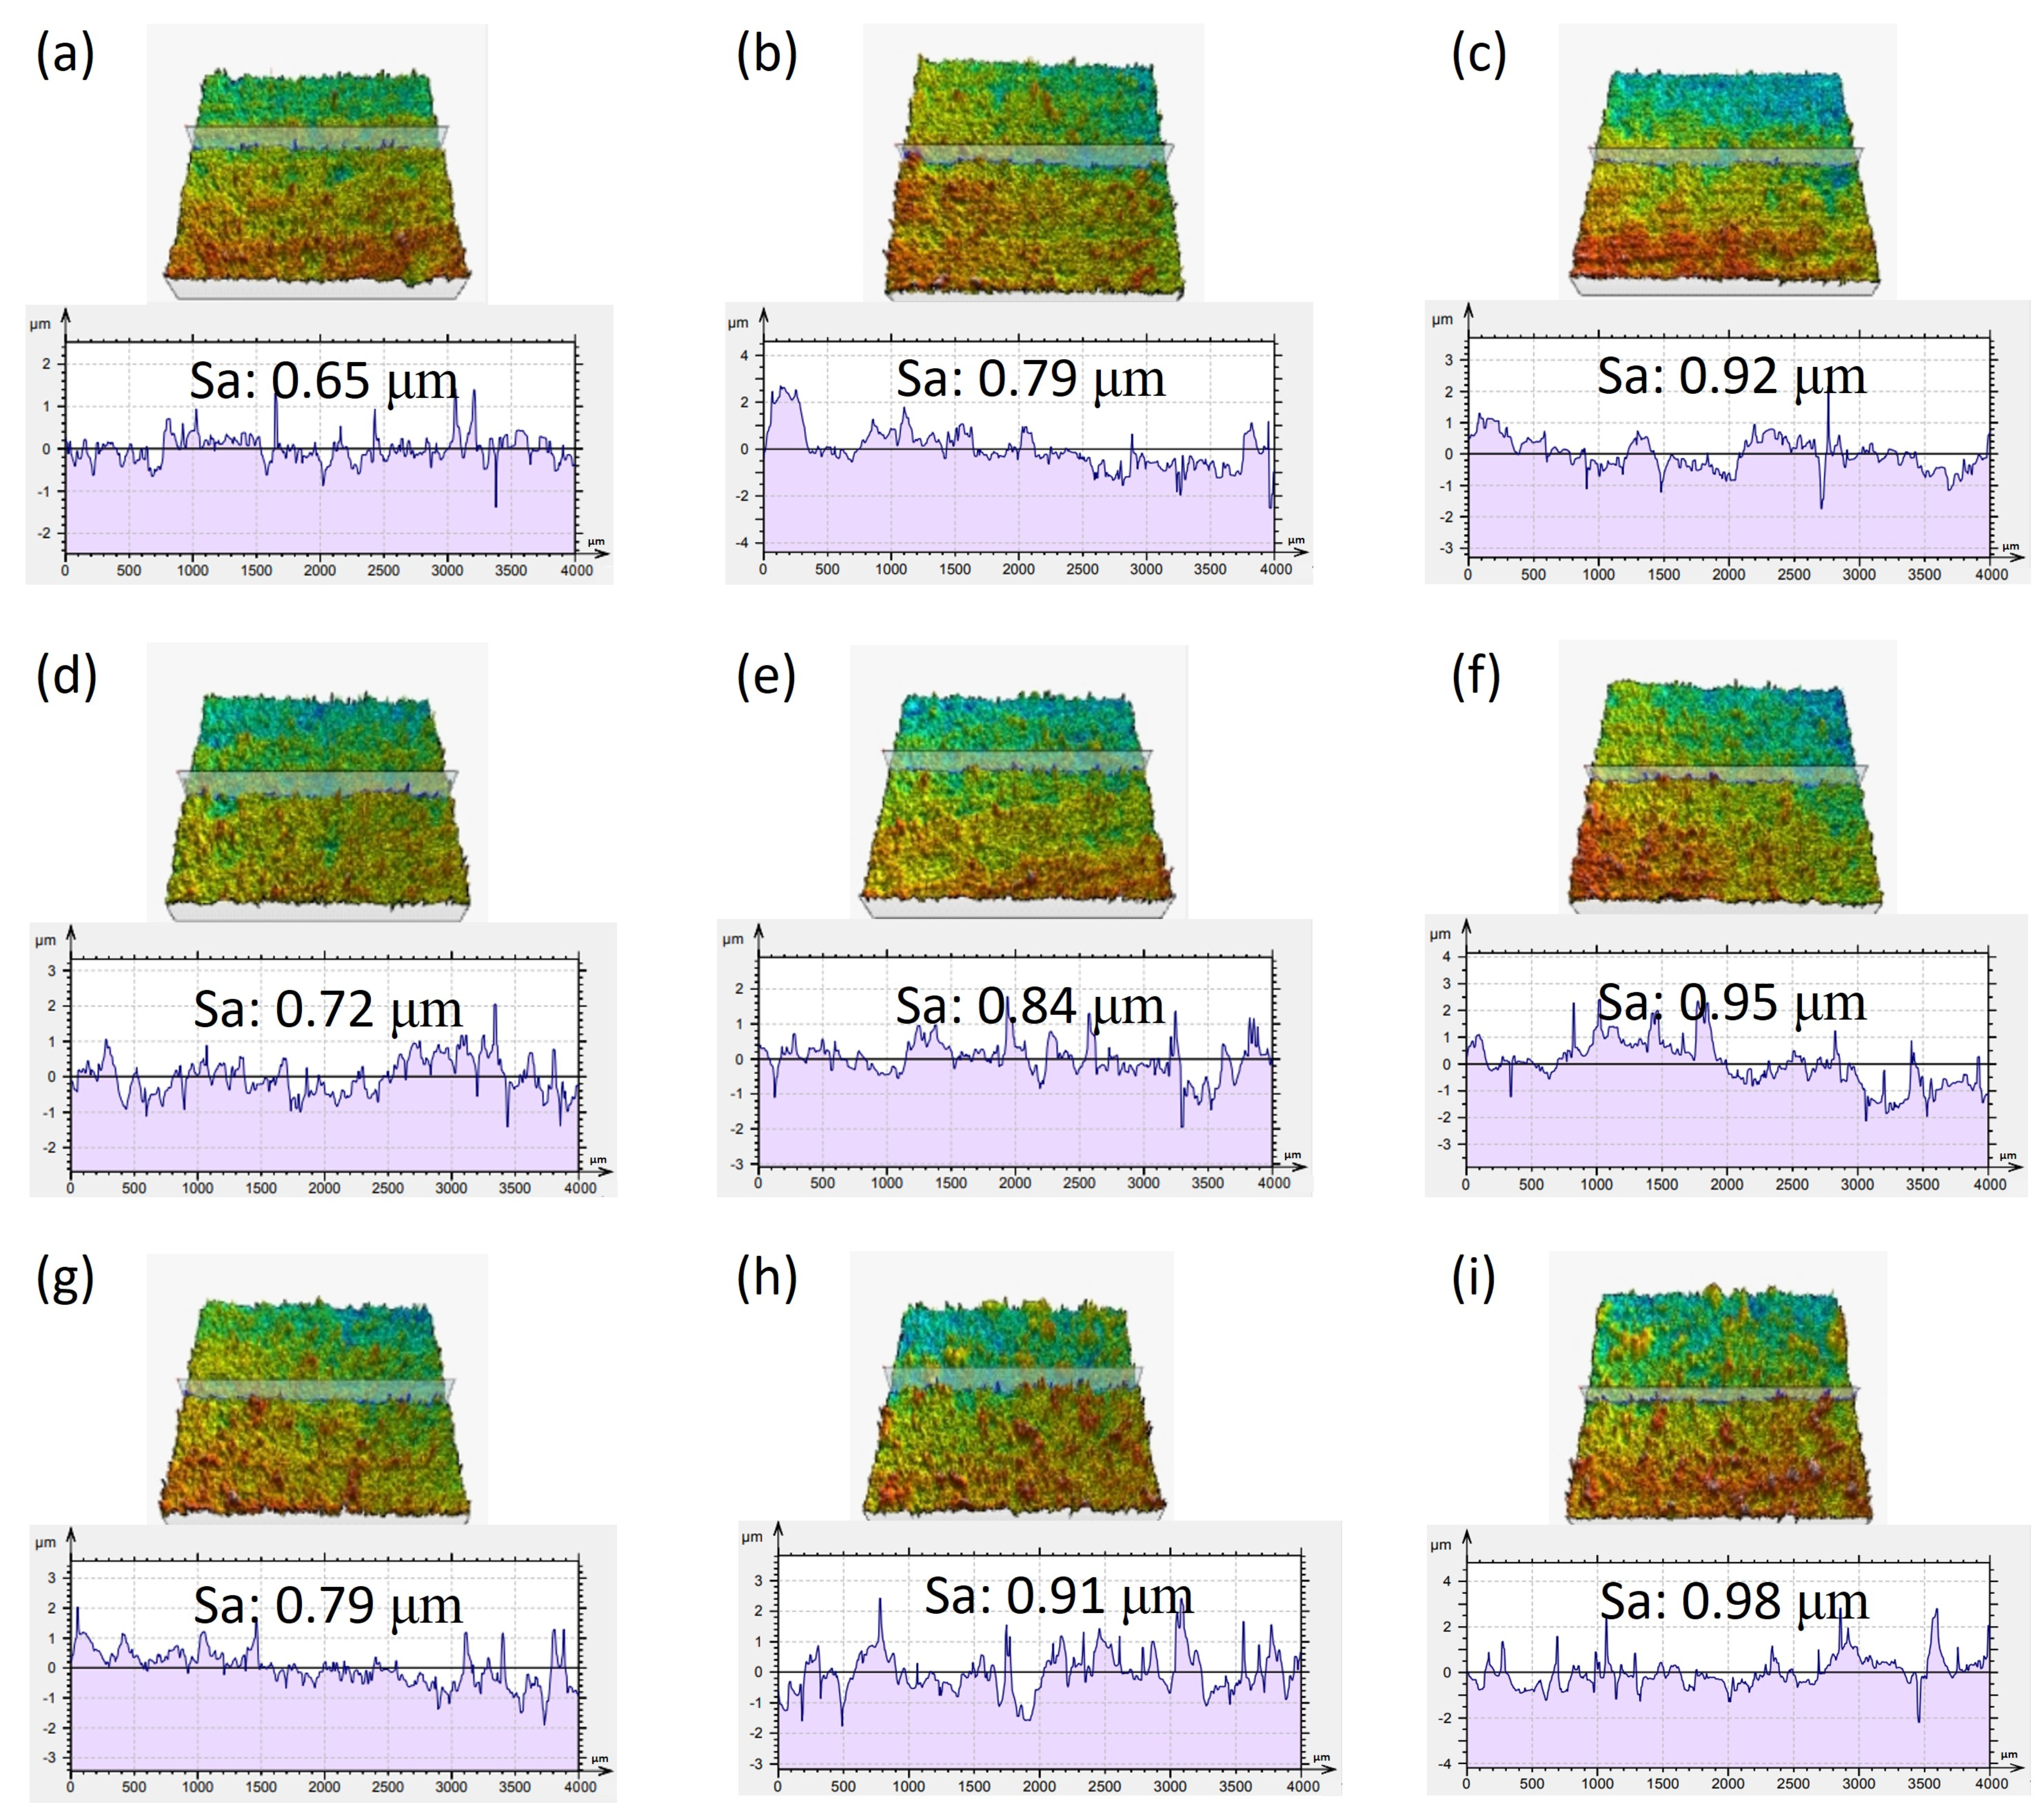
Figure 5.
Surface roughness and 3D profile morphology of MAO coatings at different voltages and frequencies: (a) 320 V, 50 Hz; (b) 360 V, 50 Hz; (c) 400 V, 50 Hz; (d) 320 V, 100 Hz; (e) 360 V, 100 Hz; (f) 400 V, 100 Hz; (g) 320 V, 200 Hz; (h) 360 V, 200 Hz; and (i) 400 V, 200 Hz.
Figure 5.
Surface roughness and 3D profile morphology of MAO coatings at different voltages and frequencies: (a) 320 V, 50 Hz; (b) 360 V, 50 Hz; (c) 400 V, 50 Hz; (d) 320 V, 100 Hz; (e) 360 V, 100 Hz; (f) 400 V, 100 Hz; (g) 320 V, 200 Hz; (h) 360 V, 200 Hz; and (i) 400 V, 200 Hz.
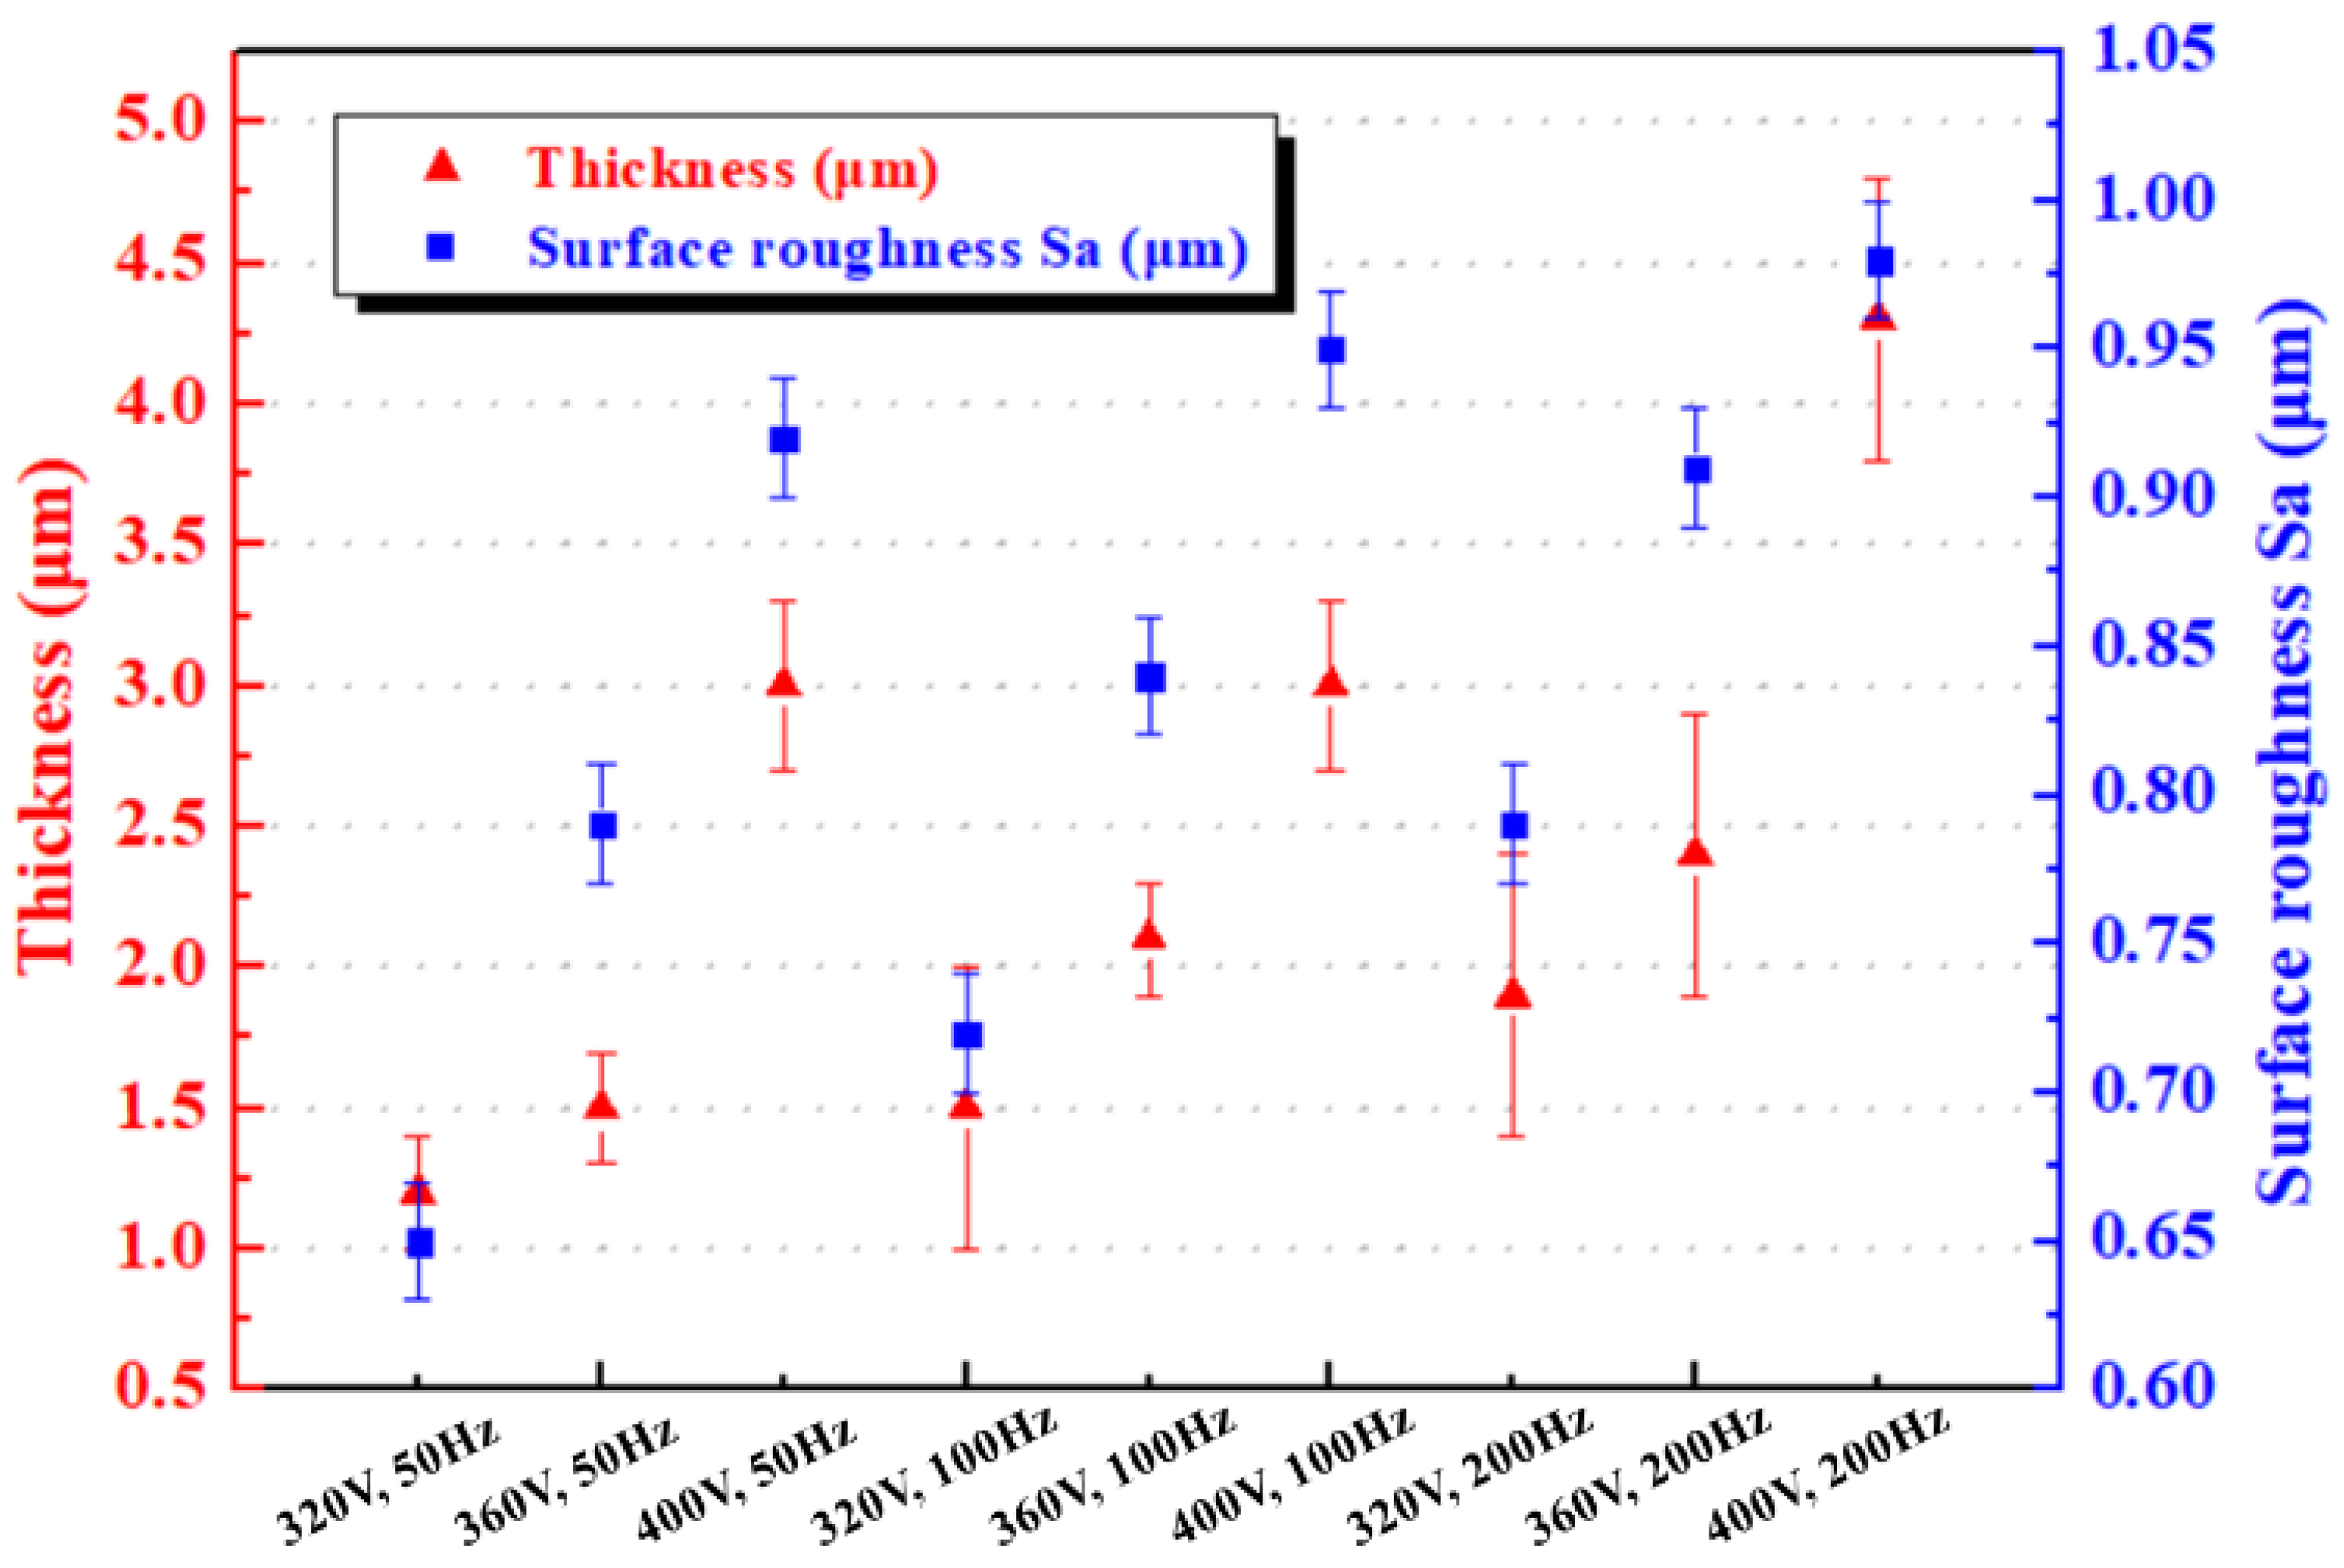
Figure 6.
Surface roughness and thickness of MAO coatings at different voltages and frequencies.
Figure 6.
Surface roughness and thickness of MAO coatings at different voltages and frequencies.
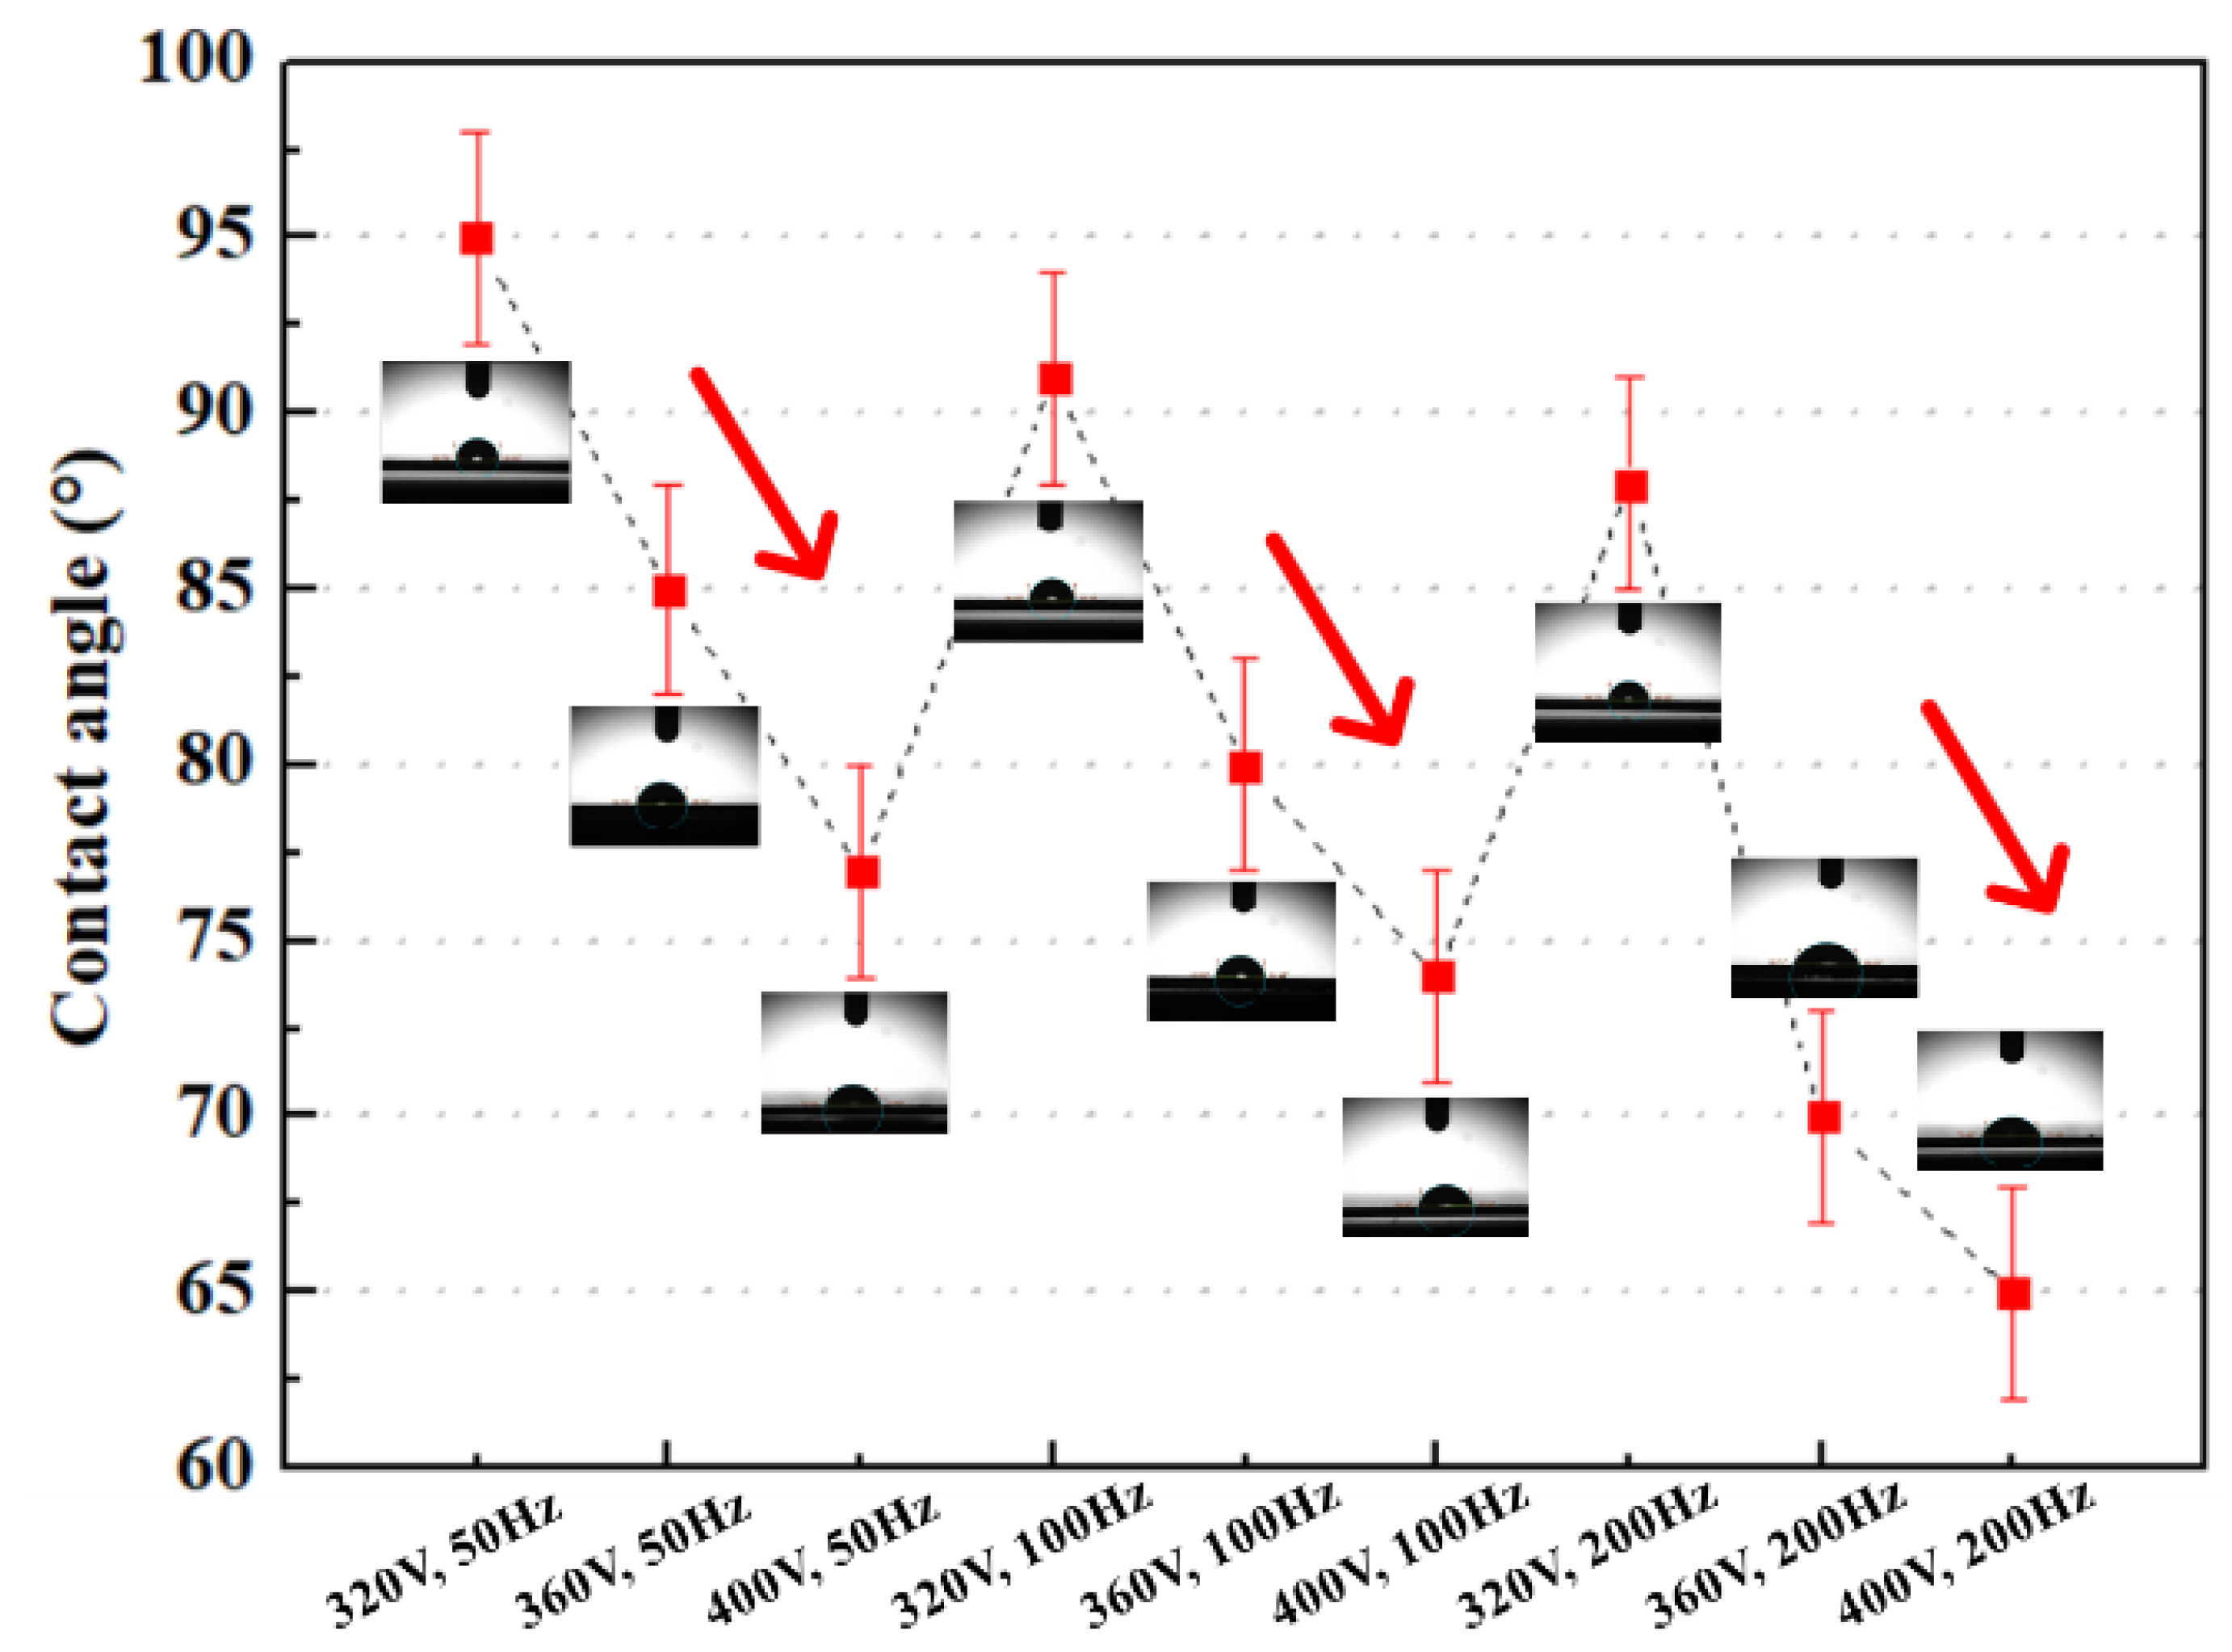
Figure 7.
Contact angle of MAO coatings at different voltages and frequencies.
Figure 7.
Contact angle of MAO coatings at different voltages and frequencies.
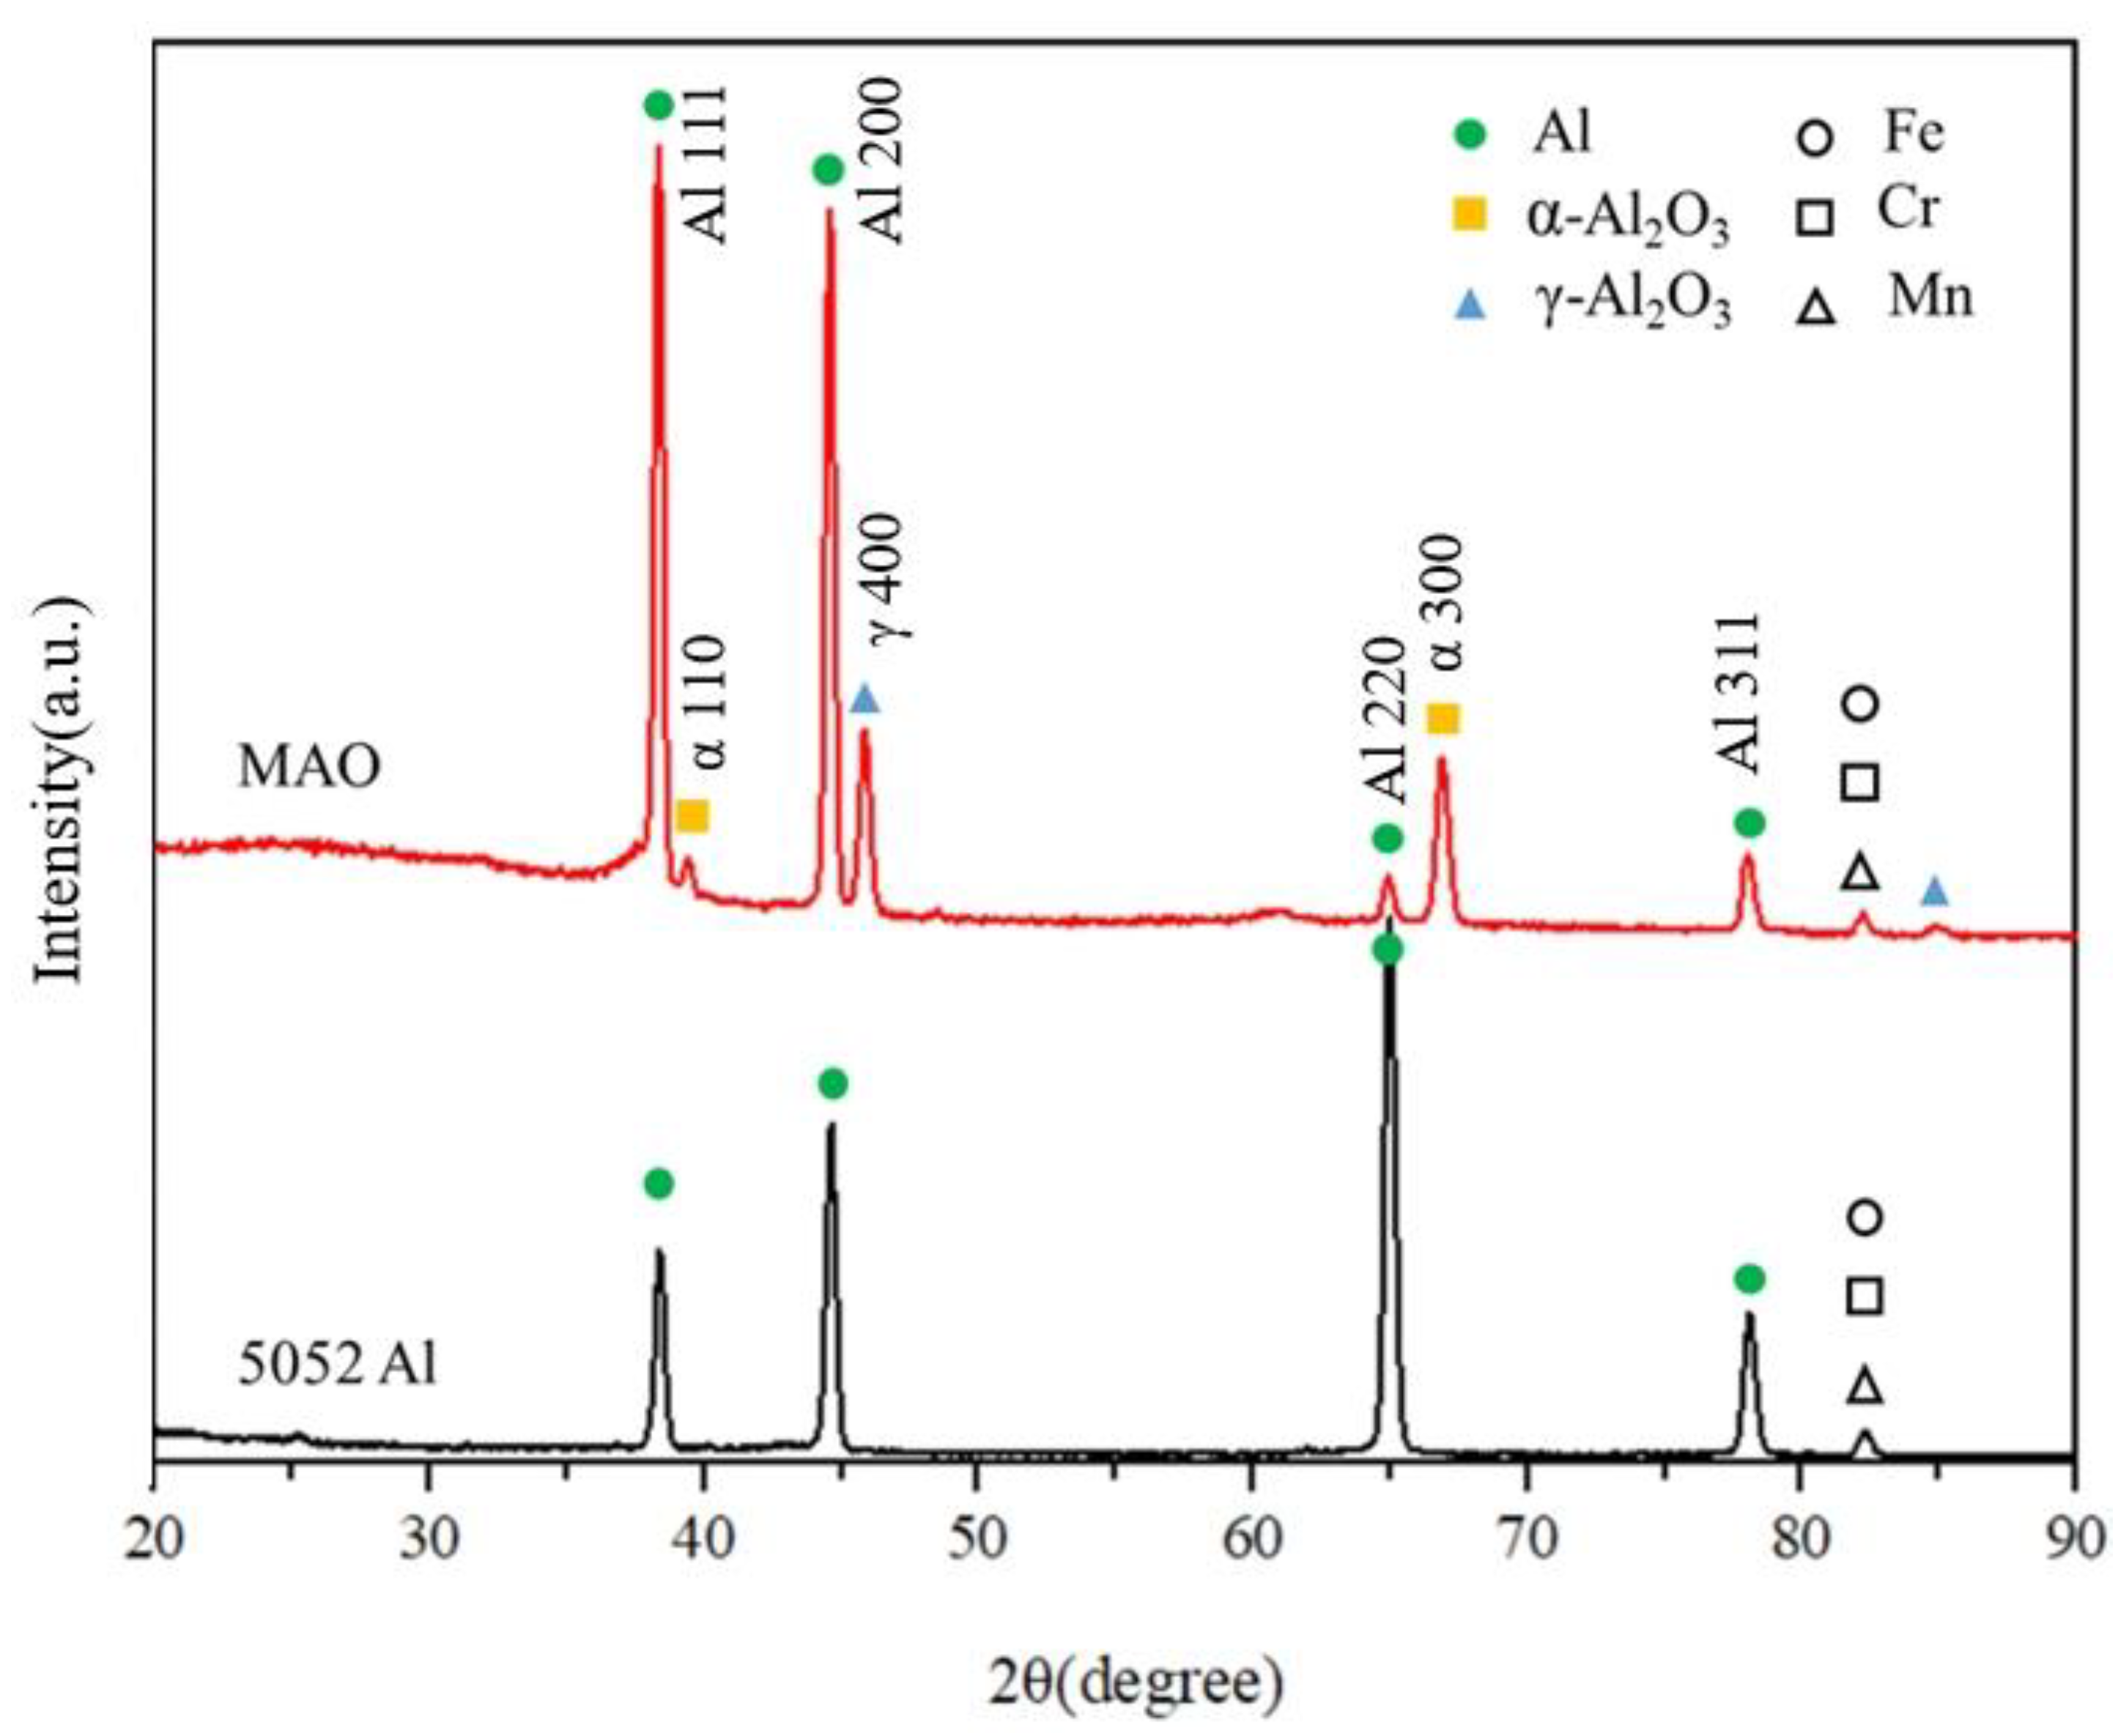
Figure 8.
XRD patterns of oxide layers formed by the MAO process and the original 5052 Al alloy substrate.
Figure 8.
XRD patterns of oxide layers formed by the MAO process and the original 5052 Al alloy substrate.
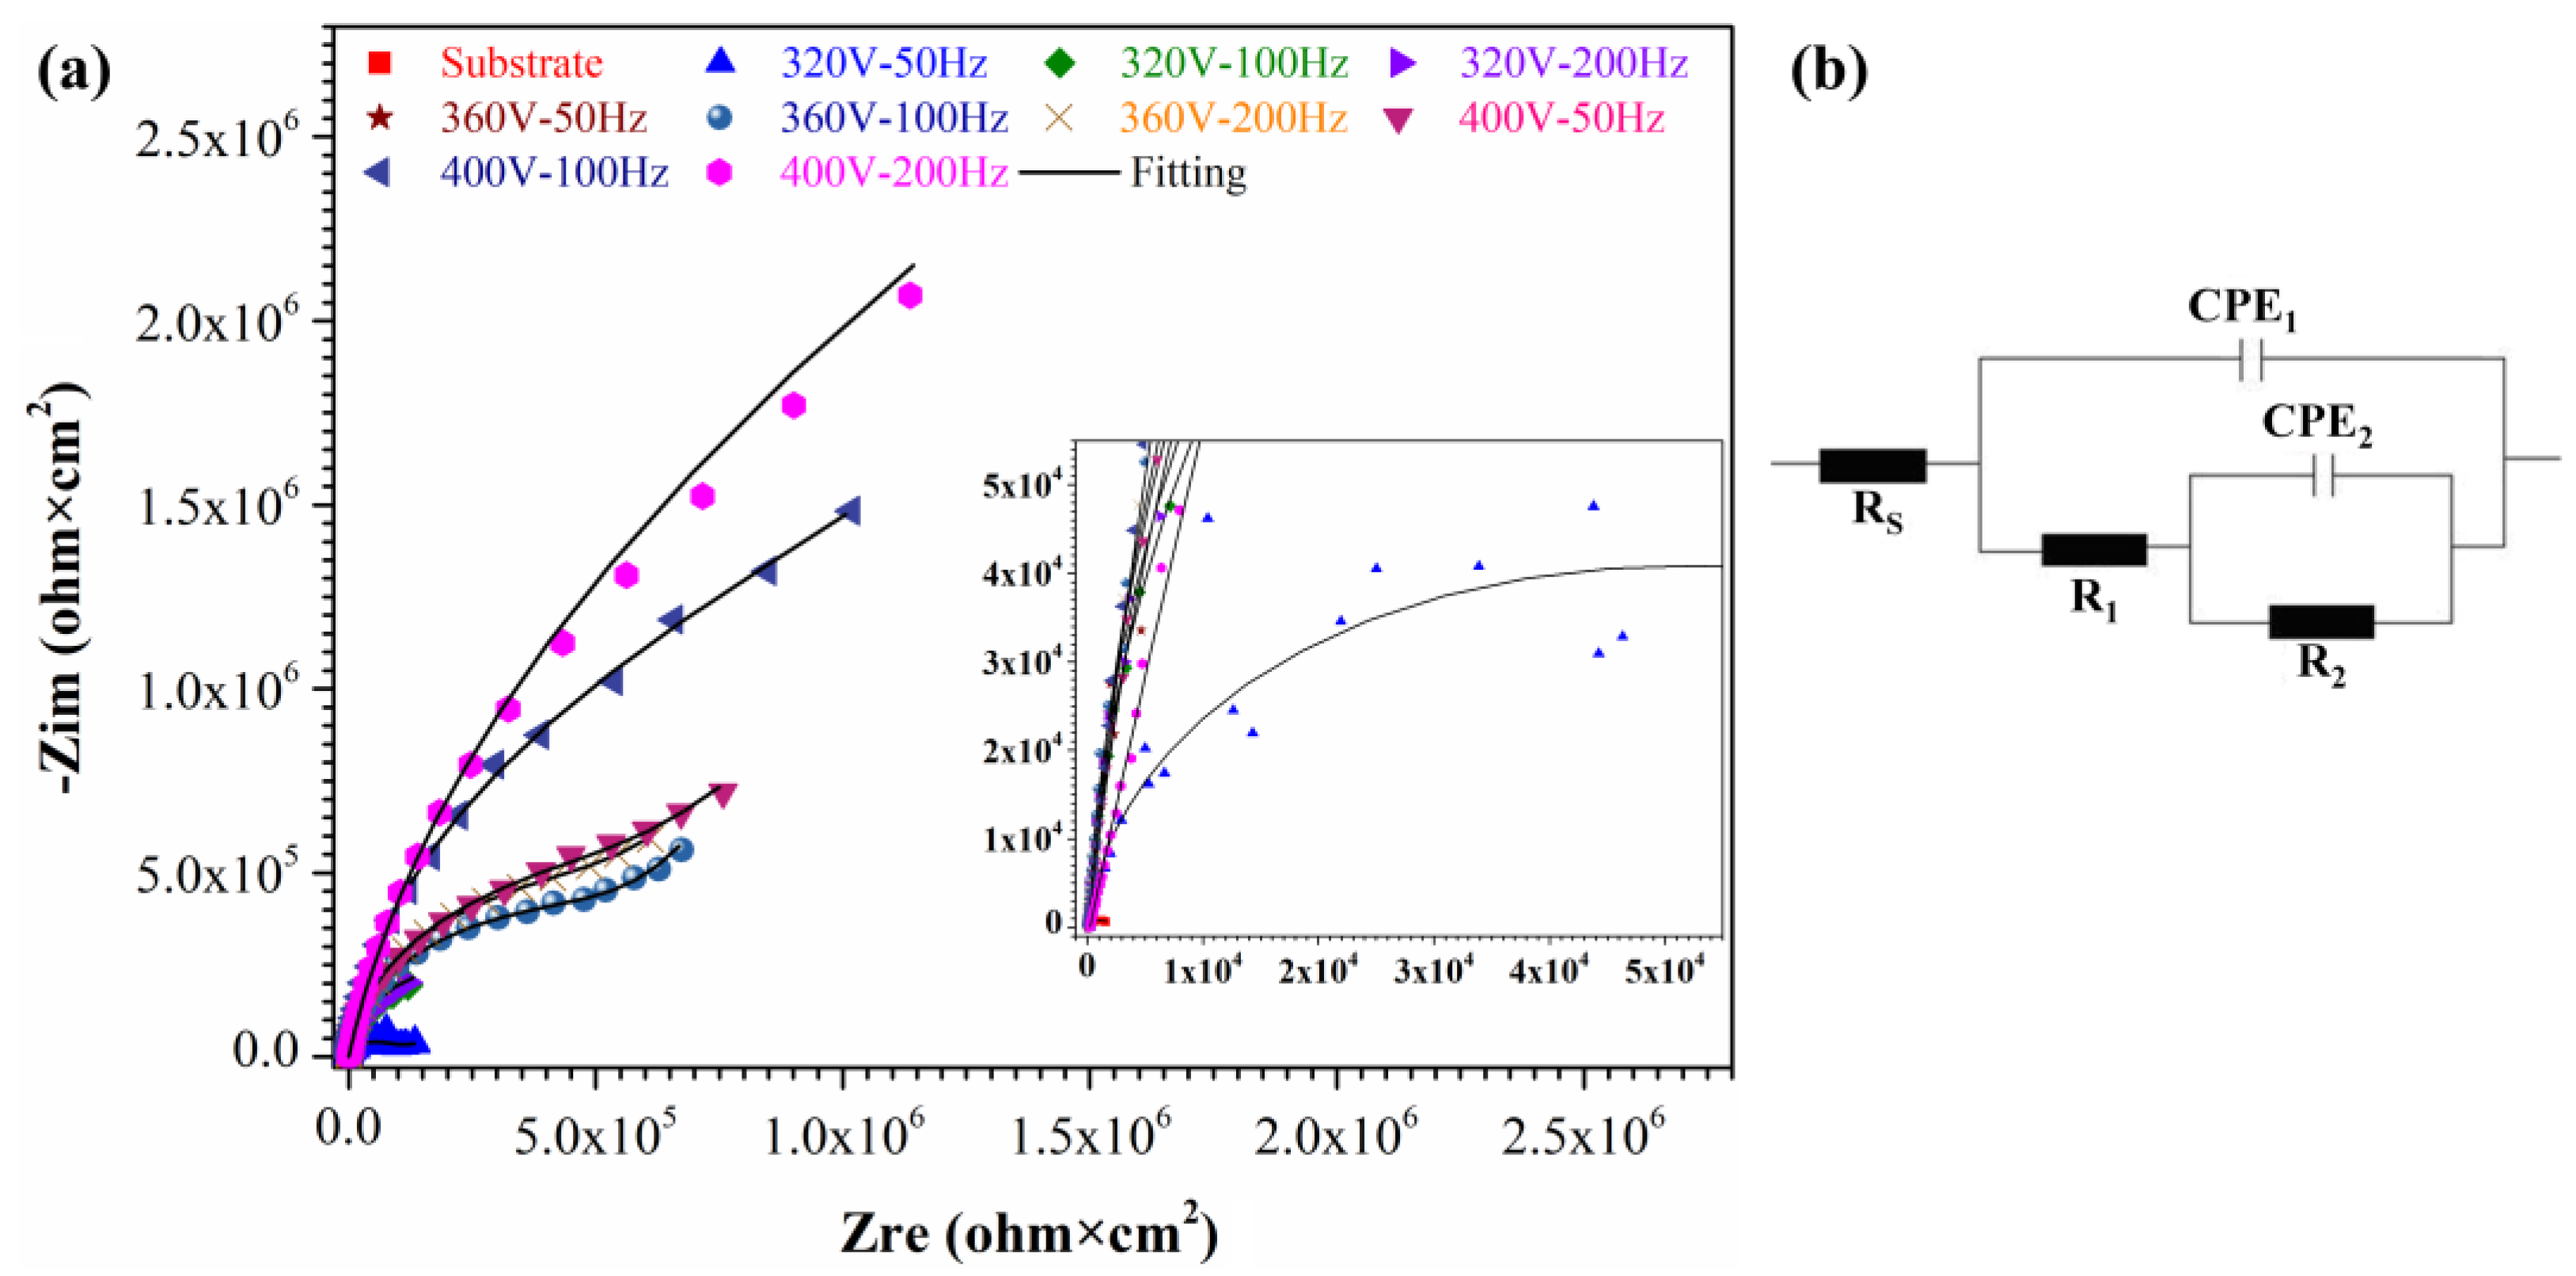
Figure 9.
Electrochemical impedance spectrum as (a) Nyquist plots for the bare 5052 and the MAO coated 5052 samples; (b) equivalent circuit models for the simulation of the Nyquist plots.
Figure 9.
Electrochemical impedance spectrum as (a) Nyquist plots for the bare 5052 and the MAO coated 5052 samples; (b) equivalent circuit models for the simulation of the Nyquist plots.
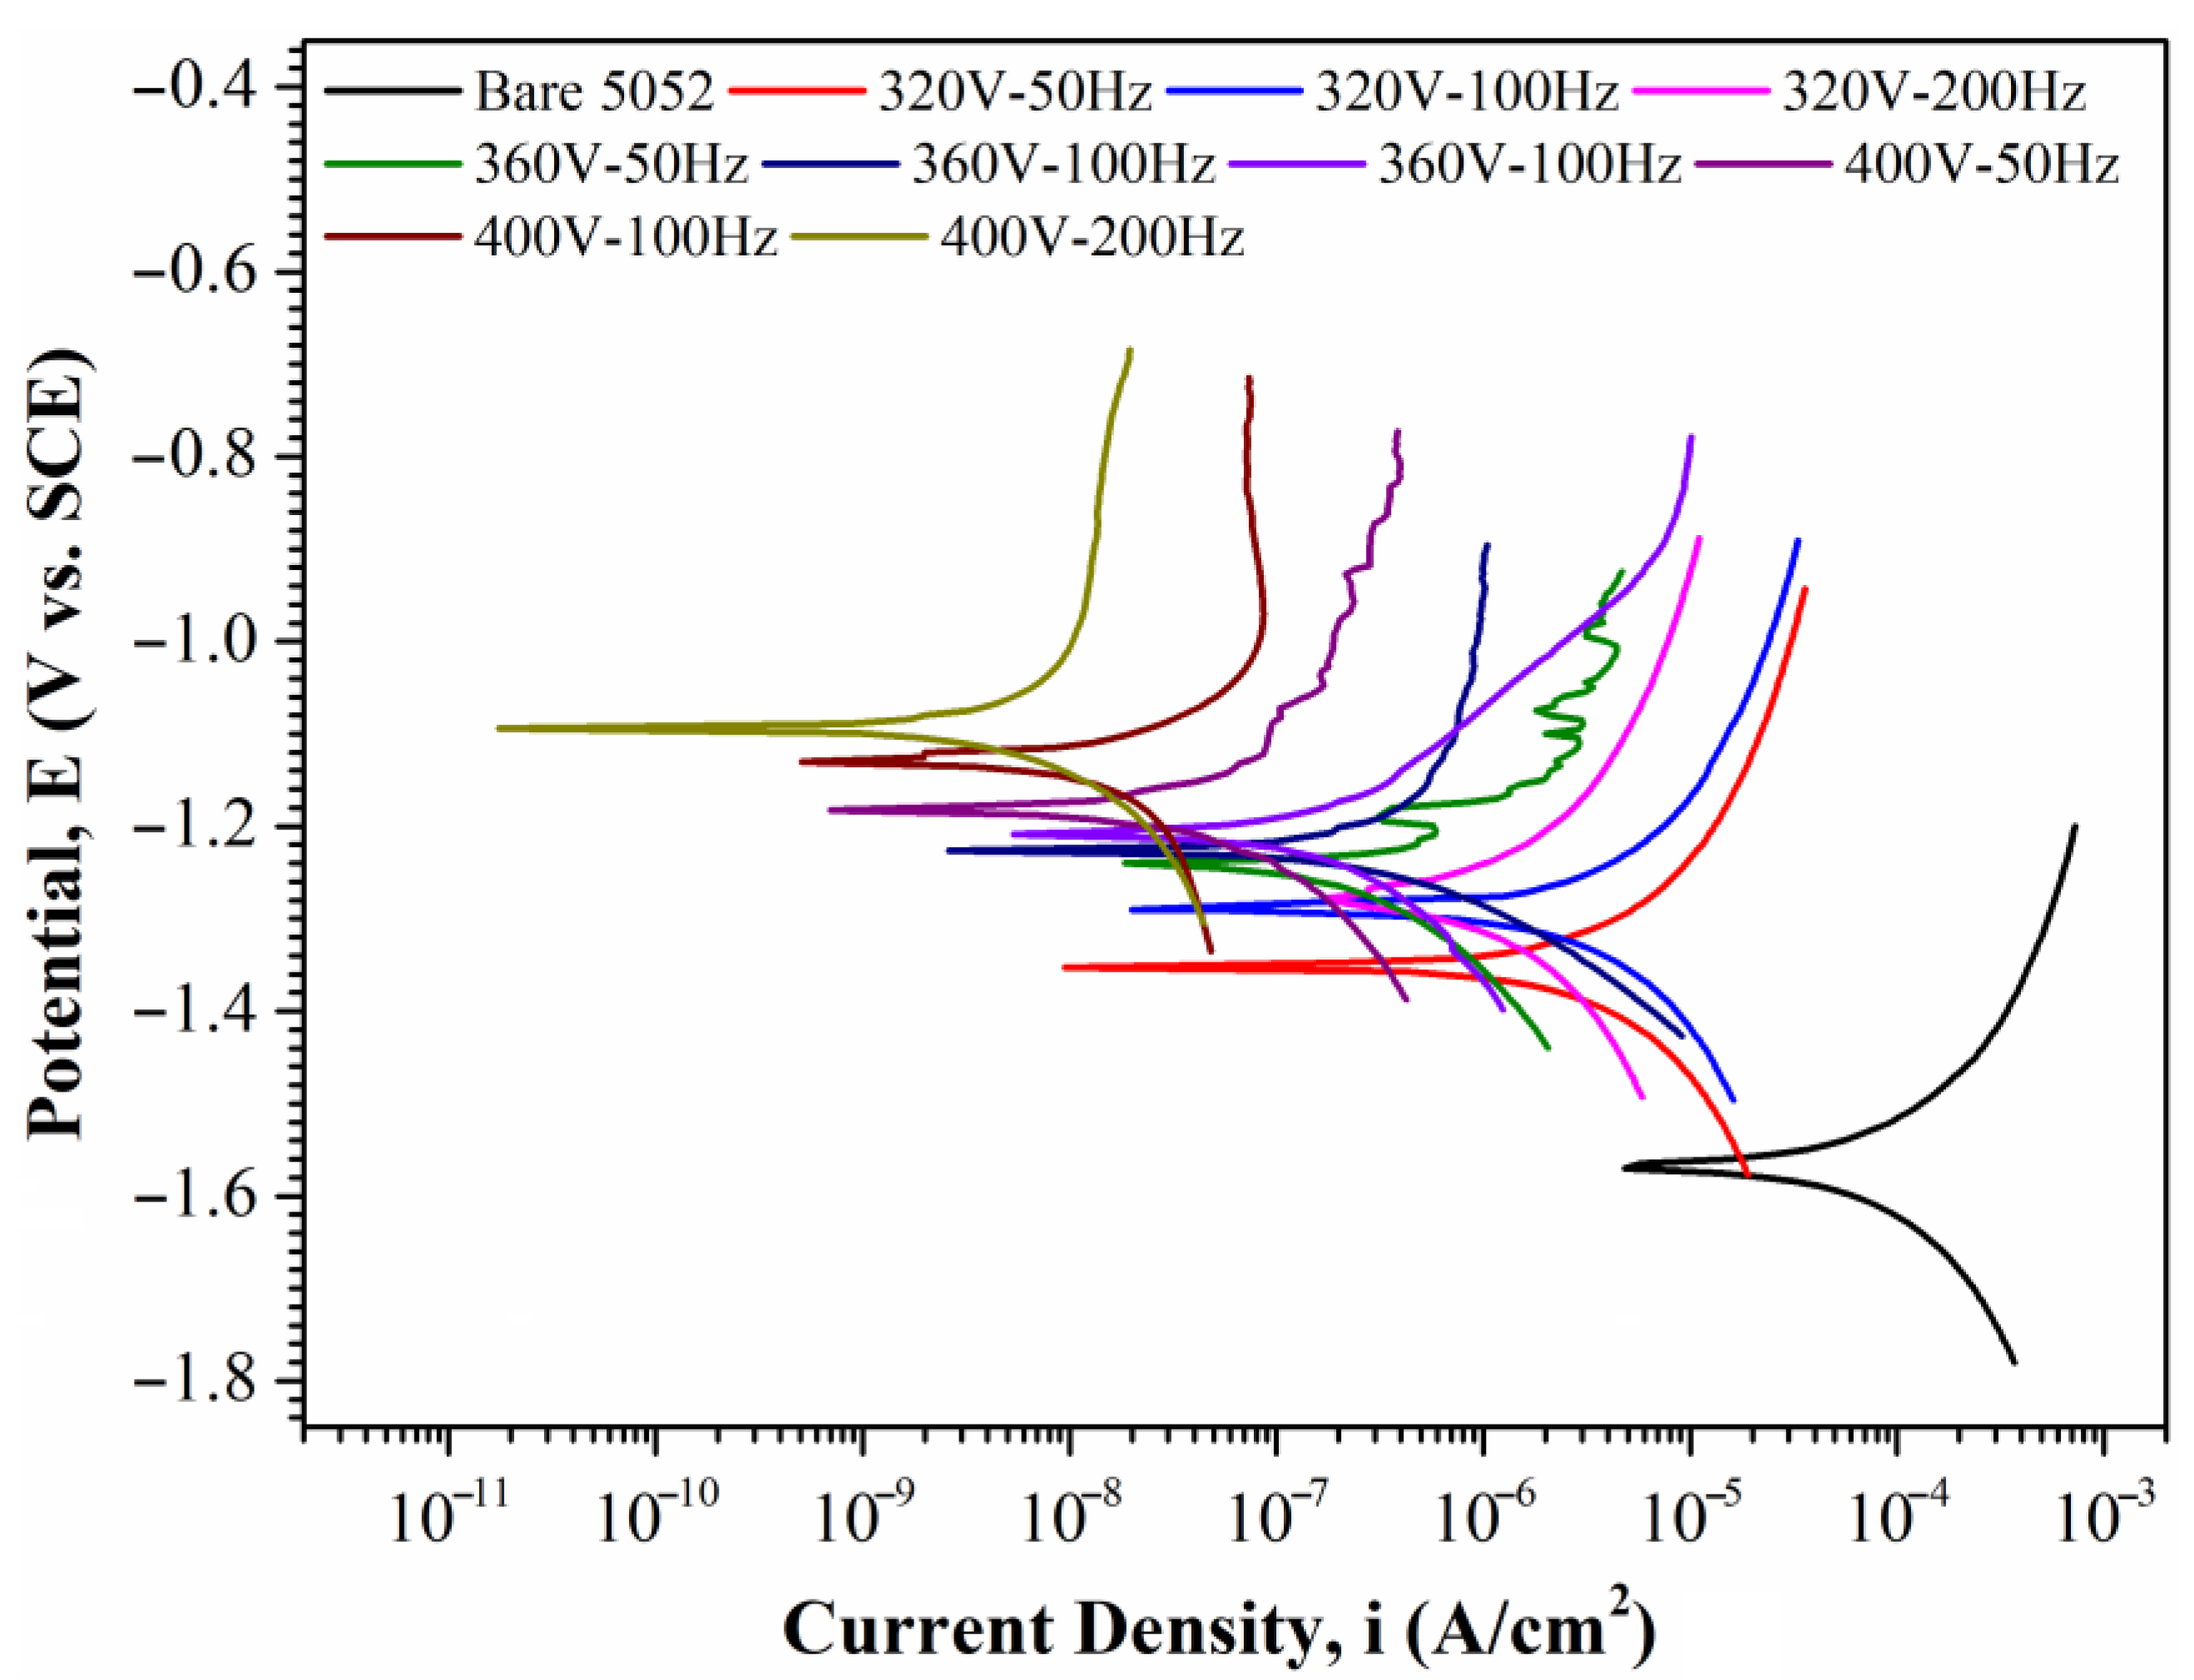
Figure 10.
Polarization curves of the bare 5052 Al alloy plate and the MAO-coated 5052 Al alloy plates in 3.5 wt.% NaCl solution.
Figure 10.
Polarization curves of the bare 5052 Al alloy plate and the MAO-coated 5052 Al alloy plates in 3.5 wt.% NaCl solution.
Figure 11.
SEM images of the width of the wear tracks of different MAO-coated specimens under dry sliding conditions: (a) 320 V, 50 Hz; (b) 360 V, 50 Hz; (c) 400 V, 50 Hz; (d) 320 V, 100 Hz; (e) 360 V, 100 Hz; (f) 400 V, 100 Hz; (g) 320 V, 200 Hz; (h) 360 V, 200 Hz; and (i) 400 V, 200 Hz.
Figure 11.
SEM images of the width of the wear tracks of different MAO-coated specimens under dry sliding conditions: (a) 320 V, 50 Hz; (b) 360 V, 50 Hz; (c) 400 V, 50 Hz; (d) 320 V, 100 Hz; (e) 360 V, 100 Hz; (f) 400 V, 100 Hz; (g) 320 V, 200 Hz; (h) 360 V, 200 Hz; and (i) 400 V, 200 Hz.
Table 1.
Composition and concentration of electrolytes for the MAO process.
Table 1.
Composition and concentration of electrolytes for the MAO process.
| Electrolytes Formula | 1L |
|---|
| Na2SiO3 | 6 g |
| KOH | 8 g |
| KF | 8 g |
| Na2WO4·2H2O | 0.56 g |
| (NaPO3)6 | 6 g |
Table 2.
MAO operating parameters.
Table 2.
MAO operating parameters.
| Operating Parameter | Value |
|---|
| Initial temperature (°C) | below 10 |
| Time (s) | 360 |
| DC field (V) | 320, 360, 400 |
| Frequency (Hz) | 50, 100, 200 |
Table 3.
The thickness of MAO coating at different voltages and frequencies.
Table 3.
The thickness of MAO coating at different voltages and frequencies.
| Voltage (V) | 320 V | 360 V | 400 V |
|---|
| Frequency (Hz) | 50 Hz | 100 Hz | 200 Hz | 50 Hz | 100 Hz | 200 Hz | 50 Hz | 100 Hz | 200 Hz |
| Thickness (μm) | 0.86 ± 0.422 | 1.51 ± 0.678 | 1.50 ± 0.709 | 1.06 ± 0.391 | 1.05 ± 0.175 | 1.42 ± 0.862 | 2.27 ± 1.01 | 2.56 ± 0.929 | 3.41 ± 0.876 |
Table 4.
EDS Analysis (at%) of Film.
Table 4.
EDS Analysis (at%) of Film.
| Voltage | 320 V | 360 V | 400 V |
|---|
| Frequency | 50 Hz | 100 Hz | 200 Hz | 50 Hz | 100 Hz | 200 Hz | 50 Hz | 100 Hz | 200 Hz |
|---|
| O | 42.6 | 45.8 | 48.4 | 44.5 | 48.6 | 50.9 | 46.5 | 49.1 | 53.0 |
| Al | 48.7 | 45.5 | 42.9 | 47.2 | 42.5 | 40.0 | 46.7 | 43.4 | 39.2 |
| Si | 4.8 | 5.2 | 5.6 | 5.2 | 5.9 | 6.3 | 5.5 | 6.3 | 6.5 |
| P | 2.2 | 1.9 | 1.7 | 1.9 | 1.7 | 1.6 | 0 | 0 | 0 |
| Mg | 1.0 | 1.0 | 0.8 | 0.7 | 0.7 | 0.7 | 0.8 | 0.7 | 0.7 |
| F | 0.6 | 0.5 | 0.5 | 0.4 | 0.5 | 0.4 | 0.4 | 0.4 | 0.5 |
| Na | 0.1 | 0.1 | 0.1 | 0.1 | 0.1 | 0.1 | 0.1 | 0.1 | 0.1 |
Table 5.
Corrosion parameters and impedance for the bare 5052 and the MAO coated 5052 samples in 3.5% NaCl.
Table 5.
Corrosion parameters and impedance for the bare 5052 and the MAO coated 5052 samples in 3.5% NaCl.
| - | Bare 5052 | 320 V | 360 V | 400 V |
|---|
| - | 50 Hz | 100 Hz | 200 Hz | 50 Hz | 100 Hz | 200 Hz | 50 Hz | 100 Hz | 200 Hz |
|---|
| Rs (ohm·cm2) | 82.1 | 79.4 | 84.5 | 87.6 | 81.7 | 83.1 | 81.1 | 78.9 | 78.3 | 83.4 |
| CPE1 (sn·μohm−1·cm−2) | 22.5 | 6.76 × 10⁻² | 4.73 × 10⁻² | 4.69 × 10⁻² | 5.86 × 10⁻² | 5.23 × 10⁻² | 4.82 × 10⁻² | 6.14 × 10⁻² | 6.17 × 10⁻² | 3.22 × 10⁻² |
| CPE1—n | 0.84 | 0.71 | 0.97 | 0.98 | 0.98 | 0.97 | 0.97 | 0.95 | 0.95 | 0.99 |
| R1 (ohm·cm2) | 964 | 3.19 × 10⁵ | 3.17 × 10⁶ | 3.24 × 10⁶ | 1.39 × 10⁶ | 1.11 × 10⁷ | 1.12 × 10⁷ | 1.14 × 10⁷ | 2.27 × 10⁷ | 9.39 × 10⁷ |
| CPE2 (sn·μohm−1·cm−2) | 282 | 3.76 | 4.79 | 1.84 | 4.07 | 4.69 | 2.90 | 2.09 | 2.91 | 1.62 |
| CPE2—n | 1 | 0.99 | 1 | 0.91 | 0.91 | 0.88 | 0.88 | 0.91 | 0.92 | 1 |
| R2 (ohm·cm2) | 697 | 6.35 × 10⁴ | 4.92 × 10⁵ | 4.98 × 10⁵ | 3.15 × 10⁵ | 1.14 × 10⁶ | 2.15 × 10⁶ | 2.29 × 10⁶ | 3.37 × 10⁶ | 3.91 × 10⁶ |
Table 6.
Results of potentiodynamic polarization tests of bare 5052 Al alloy and the MAO-coated 5052 Al alloy in 3.5 wt.% NaCl solution.
Table 6.
Results of potentiodynamic polarization tests of bare 5052 Al alloy and the MAO-coated 5052 Al alloy in 3.5 wt.% NaCl solution.
| - | Bare 5052 | 320 V | 360 V | 400 V |
|---|
| - | 50 Hz | 100 Hz | 200 Hz | 50 Hz | 100 Hz | 200 Hz | 50 Hz | 100 Hz | 200 Hz |
|---|
| Ecorr (VSCE) | −1.56 | −1.35 | −1.29 | −1.27 | −1.24 | −1.23 | −1.21 | −1.18 | −1.13 | −1.10 |
| icorr (µA/cm2) | 85.6 | 6.65 | 2.88 | 8.89 × 10⁻¹ | 5.44 × 10⁻¹ | 1.28 × 10⁻² | 7.76 × 10⁻² | 4.76 × 10⁻² | 8.86 × 10⁻³ | 1.01 × 10⁻³ |


