1. Introduction
Historically, orthopedic implants are primarily made of materials such as stainless steel and Ti alloys. Although these materials still function effectively, they will remain in the body when the bone has healed, leading to complications such as stress shielding and ion toxicity [
1,
2,
3]. This necessitates a secondary surgery to remove the implant, subjecting patients to further costs, discomfort, and risks. In contrast, biodegradable magnesium (Mg) alloys are gaining attention as a promising alternative for orthopedic implants. They offer a unique combination of biocompatibility and mechanical properties akin to natural bone, making them an ideal choice for bone screws and plates [
4]. Moreover, the biodegradability of Mg alloys eliminates the need for surgical removal and promotes beneficial bone metabolism and apatite formation [
5,
6,
7].
Traditional Mg alloy fabrication has relied on deformation processing at high temperatures. Yet, due to the limited cold workability of Mg alloys, this method has its constraints [
8]. In contrast, selective laser melting (SLM) offers a cutting-edge alternative. This 3D metal printing technique not only allows net shaping but also refines the resultant microstructure and hence improves the properties and performance of the printed parts. The SLM-printed Mg parts, known for their improved mechanical properties [
9,
10], are favored in biomedical implant applications because of their customizable production to meet individual patient needs.
Mg alloys offer promising benefits as implant materials, but their rapid degradation, particularly in bone screws or plates for internal fracture fixation, remains a concern. Inside the body, they quickly corrode in chloride-rich environments [
11,
12,
13]. Such corrosion can jeopardize implant integrity before full bone healing, leading to localized alkalisation and increased hydrogen bubble formation around the implant, disrupting the healing process [
14]. While the Mg implant should support until healing completes and then degrade harmlessly, early degradation can hinder implant efficacy and patient recovery. Addressing this challenge is crucial to expand the use of Mg alloys in a wider range of orthopedic implants.
Existing research studies have pinpointed three primary strategies for mitigating the corrosion of Mg alloys. First, the application of biodegradable coatings can effectively control and decelerate the degradation rate. However, these coatings may peel off or deteriorate over time, revealing the underlying Mg quicker than expected. Second, microstructure modification, achieved through process parameter optimization, may adjust the alloy properties using specific SLM settings. Despite its efficacy, this method requires an in-depth understanding of the SLM process and has inherent limitations. Lastly, modification of the alloy composition is attractive due to its dual advantages. It can enhance both the mechanical strength and corrosion resistance of the Mg alloys [
15]. Such holistic improvement makes the modified Mg alloys particularly suitable for demanding applications such as load-bearing implants.
In extensive research conducted on Mg alloys, those with aluminum (Al) or rare earth (RE) elements have been highlighted for their capability to improve alloy properties [
16,
17,
18,
19]. For instance, Niu et al. [
17] studied the SLM of Mg-Al alloy with 9 wt.% Al and achieved a notable 95.7% relative density. Shuai et al. [
18] used SLM to create the Mg-Al-Zn alloy, emphasizing the role of Al content in biodegradation. In another study, Liao et al. [
19] reported that a laser melting deposition (LMD)-produced Mg-RE alloy had superior tensile strength and stretchability compared with traditionally prepared Mg alloys. However, these Mg alloys raise concerns. There is a potential risk when ions from Al or RE are released inside the body. For instance, Al ions have been linked to conditions such as Alzheimer’s disease and are believed to weaken bones [
20]. In addition, the accumulation of Y
3+ (a type of RE ion) can cause liver toxicity [
21]. This underlines the need for Mg alloys that offer both corrosion resistance and safety. Recent research [
22] points to zinc (Zn) and manganese (Mn) as potential alloying elements for formulating biomedically safe Mg alloys. Zn, which is essential for human health, strengthens the alloy when combined with Mg. Similarly, Mn, which is safe and plays a role in our enzymes [
23], works alongside Zn to enhance the alloy properties.
The objective of this research study lies in examining the intricate effects of varying Zn content on the microstructure, porosity, and, in particular, the corrosion resistance of SLM-printed Mg-xZn-0.2Mn alloys. SLM-printed Mg alloys with Zn contents spanning from 1 wt.% to 7 wt.% were investigated. This specific range was chosen to represent Zn concentrations below and exceeding the solubility limit in Mg, which is around 6 wt.% [
24]. Additionally, the Mn content was kept at 0.2 wt.% to correspond with the Mn level in commercial Mg alloys [
25]. This investigation also attempted to understand how the inherent properties of the starting powder, particularly in conjunction with varying Zn contents, influenced the porosity of the SLM-printed samples.
2. Materials and Experimental Details
2.1. Powder Preparation and Analysis
Spherical Mg, Zn, and Mn powders (Tangshan Weihao, Hebei, China) with a purity of 99.9% were used as the raw materials. The median diameter for the powders of all three metals fell within the range of 30 to 50 μm. Three ternary Mg-xZn-0.2Mn powders with different Zn content (x = 1, 4, and 7 wt.%) were blended using ball milling equipment in an argon atmosphere for 2 h prior to the SLM process. The blending process aimed to achieve a homogeneous mix of the powders. A scanning electron microscope (SEM, Tescan VEGA 3, TESCAN, Brno, Czech) was used to assess the structural characteristics of the mixed powders. The images captured from SEM were further analyzed using ImageJ 1.51 software, focusing on characteristics such as powder size, circularity, and void areas between the powders.
2.2. SLM Fabrication of Mg-xZn-0.2Mn Samples
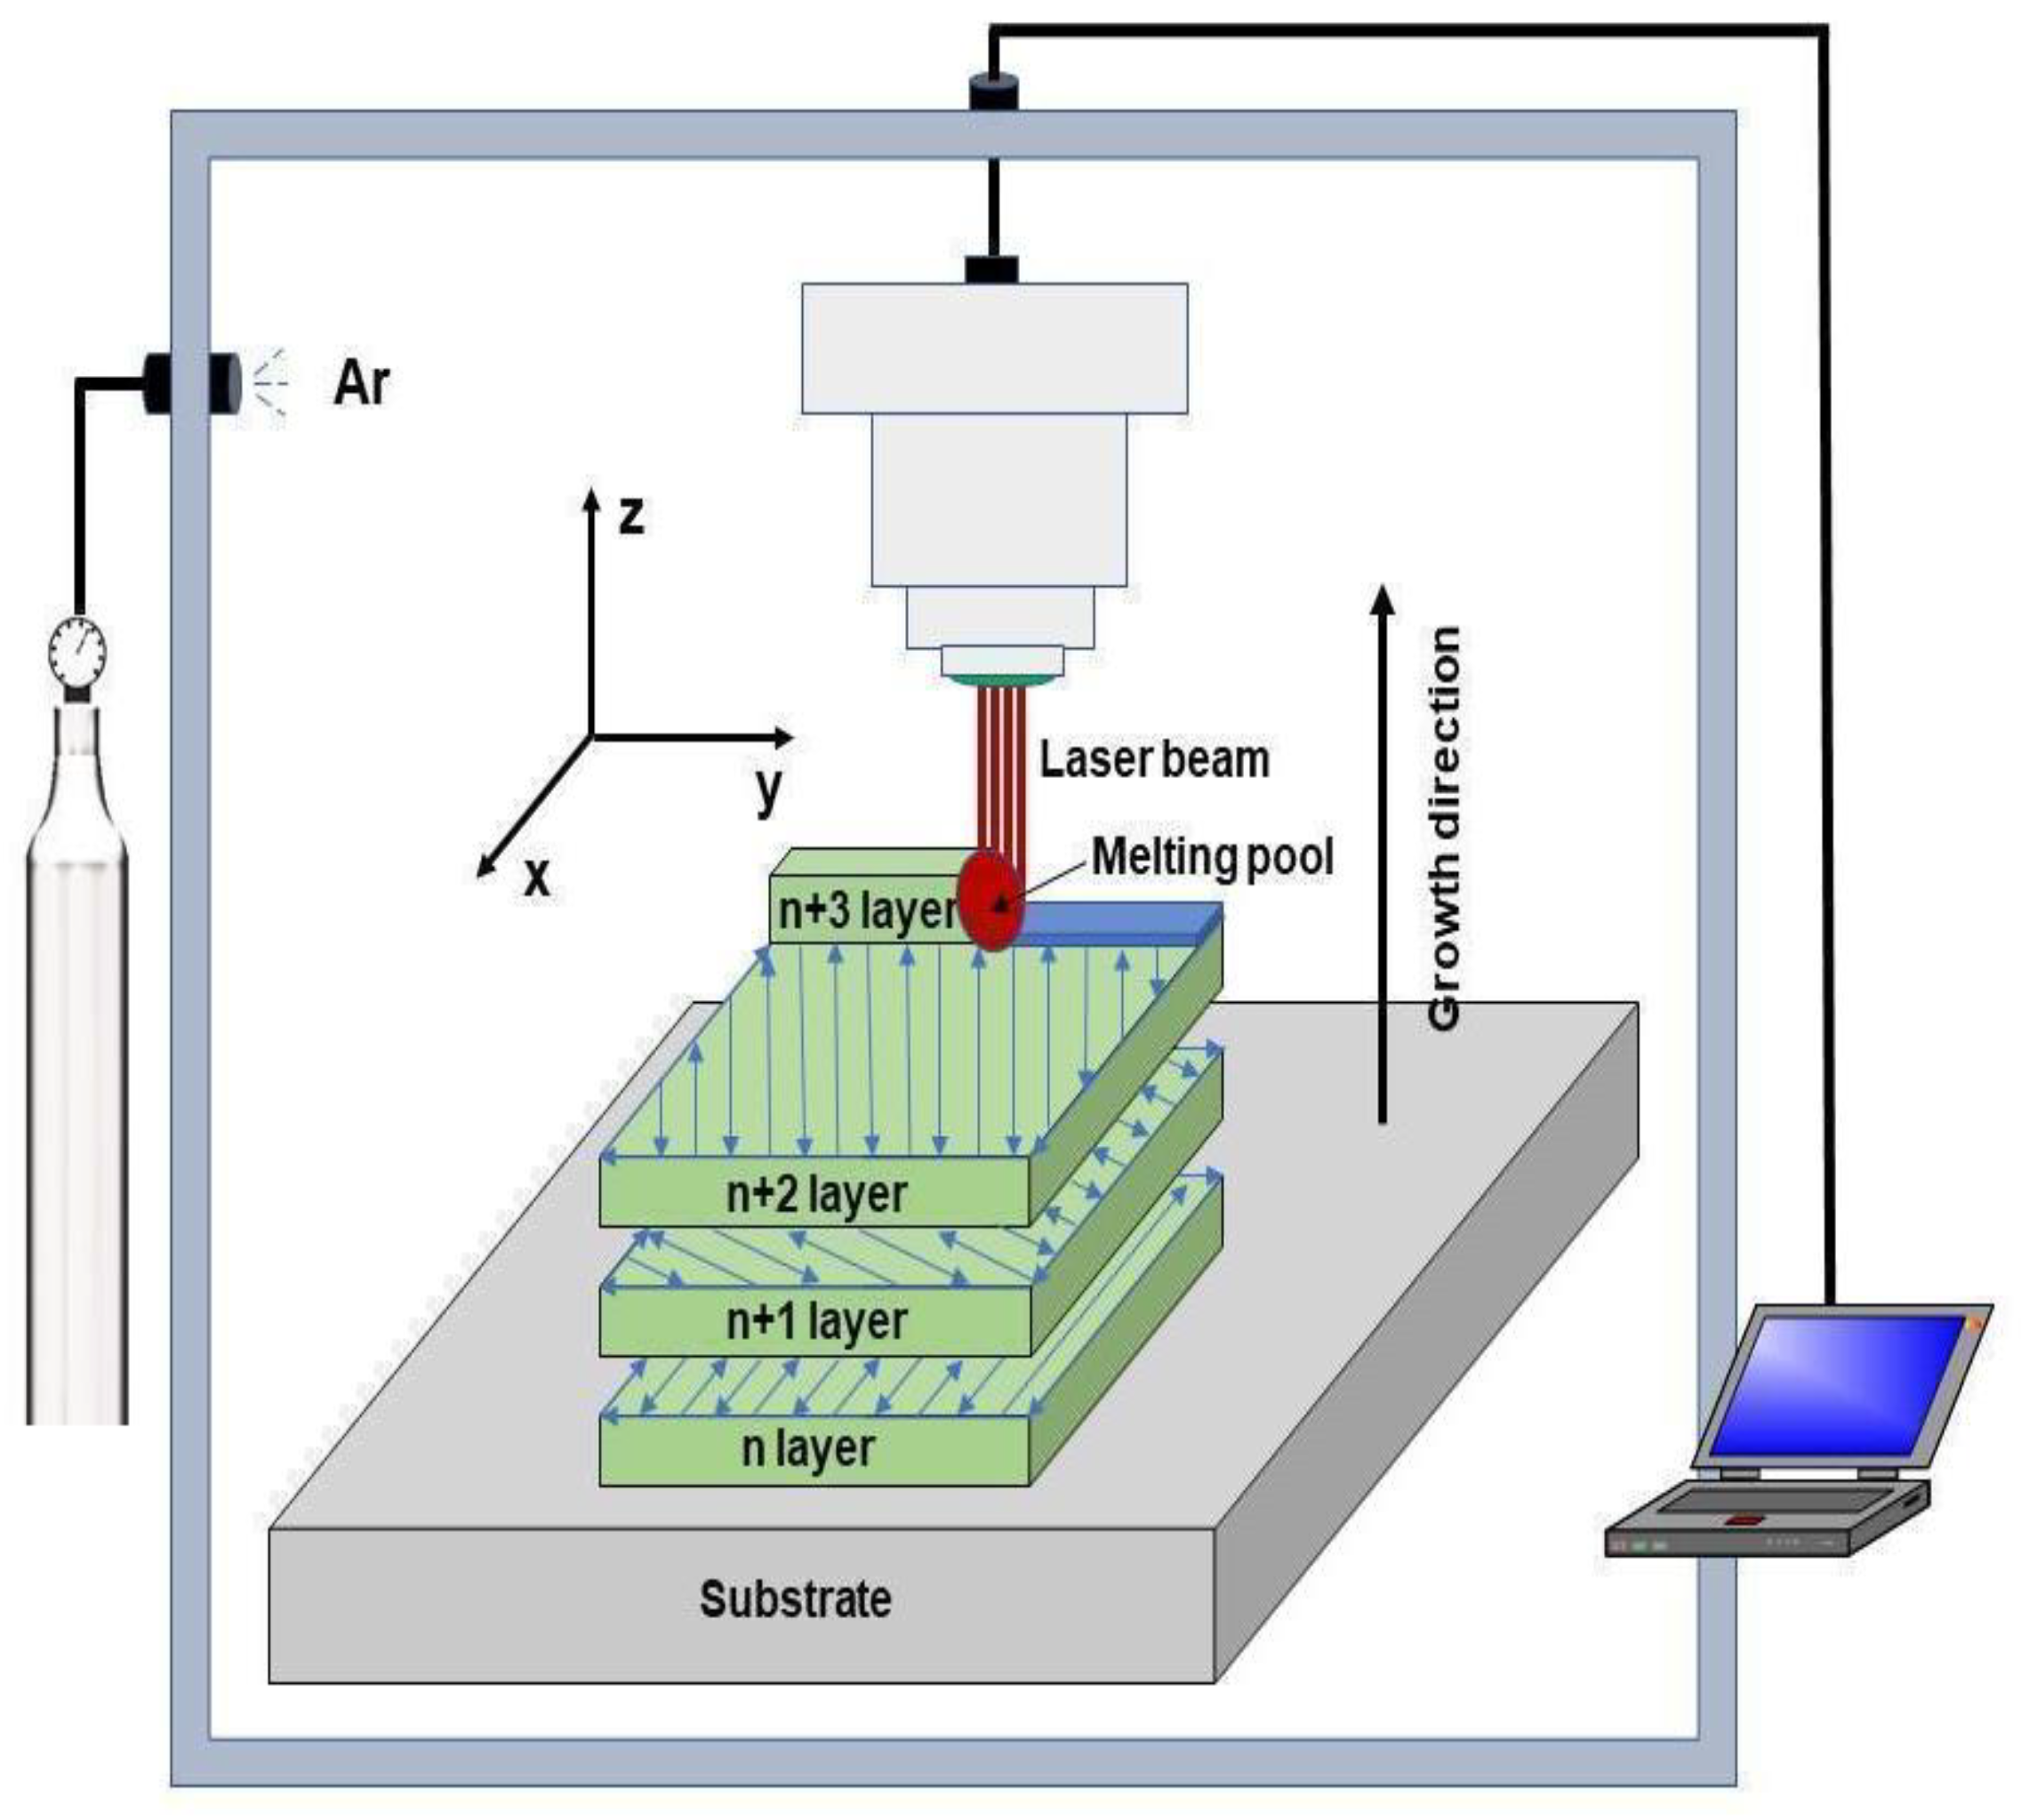
The SLM process was performed using a commercial laser additive manufacturing system (SLM 125 HL, SLM Solutions, Lübeck, Germany). This system consists of the following components: (i) a continuous wave fiber laser with a maximum output power of 400 W, (ii) an automatic powder supplying module, (iii) an atmosphere-controlled building chamber, (iv) a computer-controlled multi-axis motion system, and (iv) a workbench. A schematic representation of the SLM process is shown in
Figure 1. Before the SLM process, powders were dried in a vacuum oven at 60 °C for 12 h. The powders were subsequently spread across the platform (i.e., substrate) to form a powder bed. The SLM process was conducted using zigzag scanning patterns with a 67° rotation between successive layers. Based on the results of a preliminary study, the following optimized process parameters were employed: laser power at 135 W, scanning speed at 350 mm/s, and hatch spacing at 100 μm.
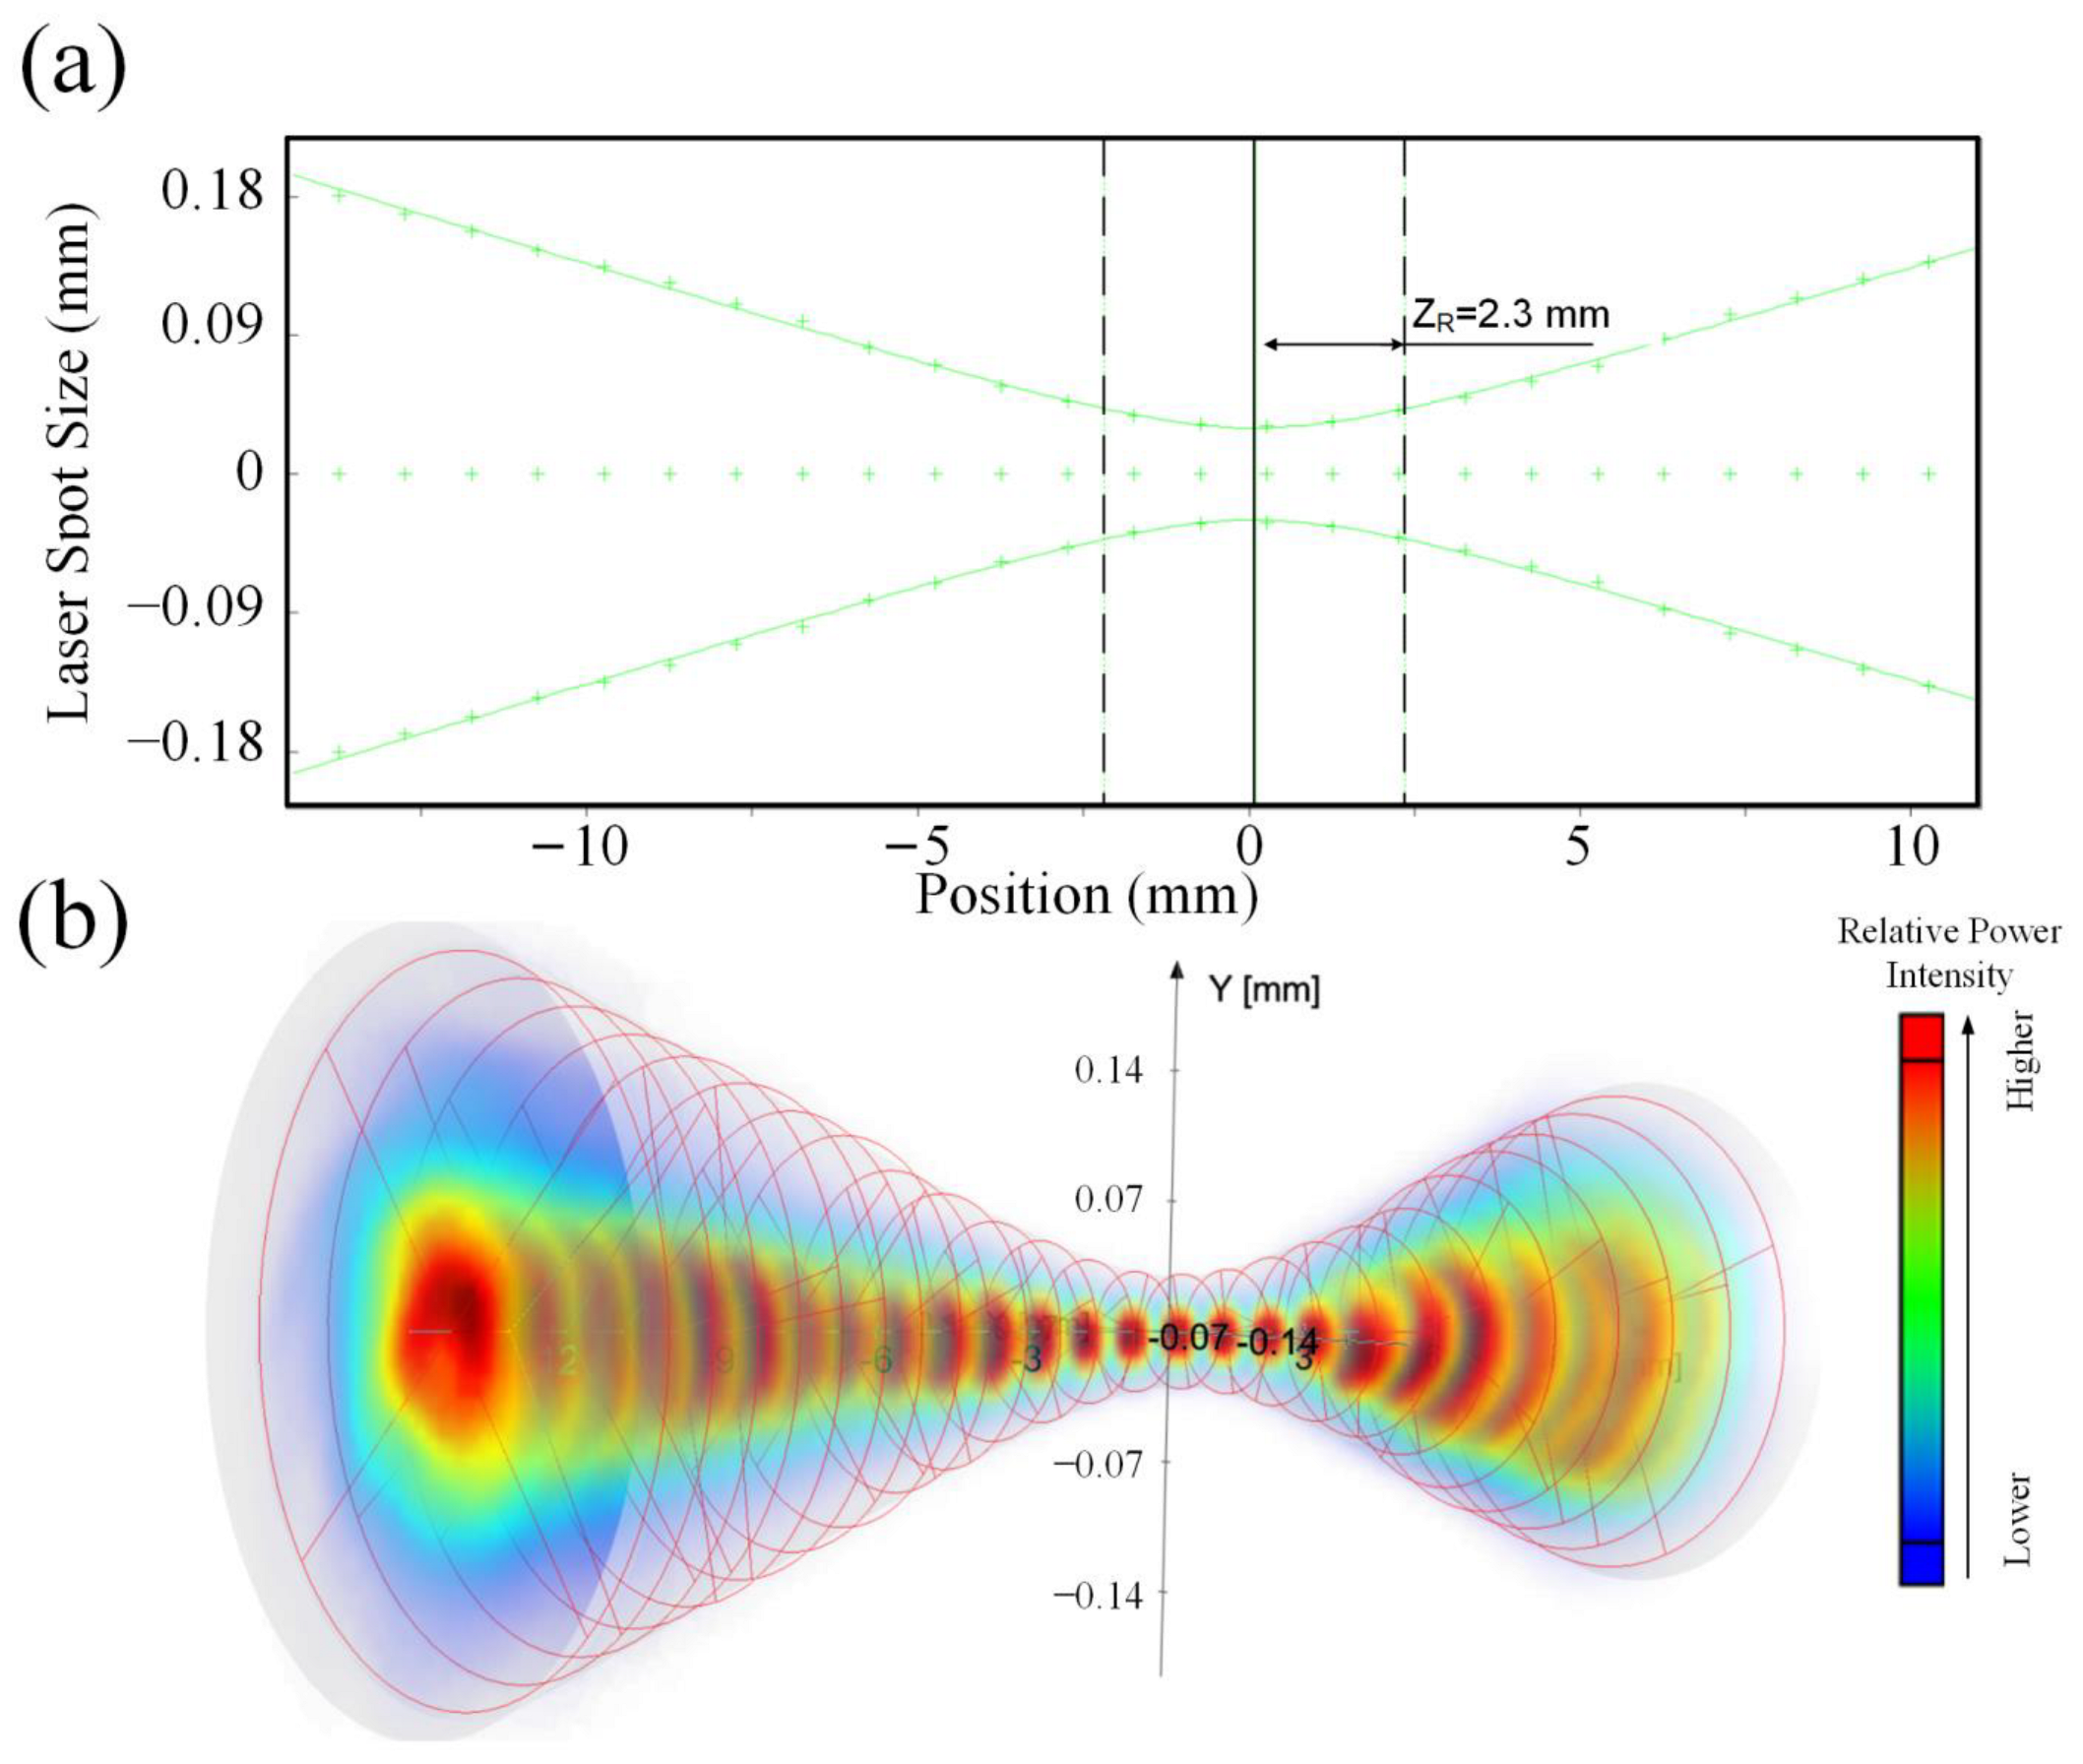
An important parameter to consider in the SLM process is the laser spot size, as it affects the interplay between the laser and powders. The laser spot size is important to determine the melt pool dimensions, heat distribution, and, consequently, the microstructure of the printed part [
27]. The relationship between the laser spot size and its position, as provided by SLM Solutions (Germany), is depicted in
Figure 2. In this study, the laser spot position was set at −4 mm away from the focal point, which is beyond the Rayleigh range, Z
R (2.3 mm). The purpose of this out-of-focus setting was to enlarge the laser spot size, subsequently reducing its power intensity to cater to the low melting point of Mg (~650 °C). To mitigate environmental contamination during the SLM process, the oxygen levels in the building chamber were monitored. Ultra-high purity (UHP) argon (99.999%) was employed to maintain a protective atmosphere, keeping the oxygen content under 100 ppm. The samples printed using SLM were 8.5 mm × 8.5 mm × 5 mm. Each sample condition was replicated seven times to ensure the repeatability of results.
2.3. Porosity, Microstructural and Phase Analysis
The SLM-printed samples were removed from the platform using a wire-cutting machine. For microstructural observation, the samples were ground to achieve a 3000 grit surface finish, then polished with a 1 μm diamond paste, and finally etched using a solution composed of 6 g picric acid, 5 mL acetic acid, 100 mL ethanol, and 10 mL distilled water.
An optical microscope (OM, Leica DMLM) was employed to capture the porosity on the sample surfaces. To ensure reliability, a minimum of three measurements were randomly taken across these surfaces. The Otsu thresholding method, which selects an optimal threshold by maximizing the variance between two classes of pixels, was used in the analysis of the acquired OM images [
28]. It separates pixel values into two categories: one representing the pore and the other indicating the base material. As a result, it facilitates an accurate assessment of porosity levels, pore sizes, and circularity. To analyze the surface morphology and chemical composition, a scanning electron microscope (SEM, Tescan VEGA3) equipped with an energy dispersive spectrometer (EDX, Oxford Instruments, Abingdon, UK) was used. The phases present in the samples were identified using an X-ray Diffractometer (XRD, Rigaku SmartLab, Tokyo, Japan), which utilized Cu Kα (λ = 1.5406 Å) radiation. The scan was conducted at a rate of 2° min
−1 across a range of 10° to 100° with the voltage set to 45 kV and the current set to 200 mA.
2.4. Electrochemical Corrosion Test
The corrosion resistance of the SLM-printed samples was assessed using potentiodynamic polarization tests. The tests were conducted in Hanks’ solution at a temperature of 37 ± 0.5 °C using the PARSTAT 2263 (AMETEK Princeton Applied Research, Oak Ridge, USA) equipment. In these tests, a standard three-electrode system was utilized, which consisted of a platinum sheet auxiliary electrode to facilitate current flow, a saturated calomel electrode (SCE) known for its stability as a reference, and the SLM-printed samples serving as the working electrode. For accurate results, each sample was encapsulated in epoxy resin to expose a surface area of 0.85 cm × 0.85 cm. These samples were then polished using SiC sandpapers, progressing from 600 to 3000 grits, ensuring a smooth and uniform surface. Prior to the corrosion tests, the samples were pre-soaked in Hanks’ solution for 1800 s to stabilize the open-circuit potential (OCP). The potentiodynamic polarization began from a potential of 200 mV below the OCP, increasing the electrode potential at a rate of 1 mV/s. The tests stopped once the anode current density was between 0.001 and 0.01 A/cm2. These obtained data were analyzed using the ZsimDemo 3.3 software package. The electrochemical corrosion tests were repeated three times to ensure the reliability of the results.
2.5. Degradation Behaviour
To understand the initial degradation behaviors of the SLM-printed samples, short-term immersion tests were conducted over 24 h in Hanks’ solution. This solution was buffered to a pH of 7.4 and maintained at a temperature of 37 ± 0.5 °C to mimic human body fluid conditions. The samples for immersion tests were embedded in epoxy resin, with an exposed area of 0.85 cm × 0.85 cm. Each sample was immersed in 250 mL solution to ensure consistent exposure conditions. Throughout the 24 h immersion tests, the volume of hydrogen released from the samples was recorded at intervals of 12 h, 18 h, and 24 h using a burette. To ensure the reliability of the results, three replicates were taken for each sample, from which an average hydrogen volume was determined. The hydrogen evolution rate was calculated using the equation below:
where
is the volume of hydrogen,
A is the surface area exposed to Hanks’ solution, and
t is the immersion time.
Following the 24 h immersion tests, visible indications of corrosion were observed on the surfaces of the samples. To analyze the morphology and composition of the corrosion products, both OM and SEM-EDX techniques were employed. The OM facilitated a broad overview of the corrosion, whereas the SEM-EDX provided detailed information, including variations in chemical compositions.
3. Results and Discussions
3.1. Pre-SLM Powder Analysis
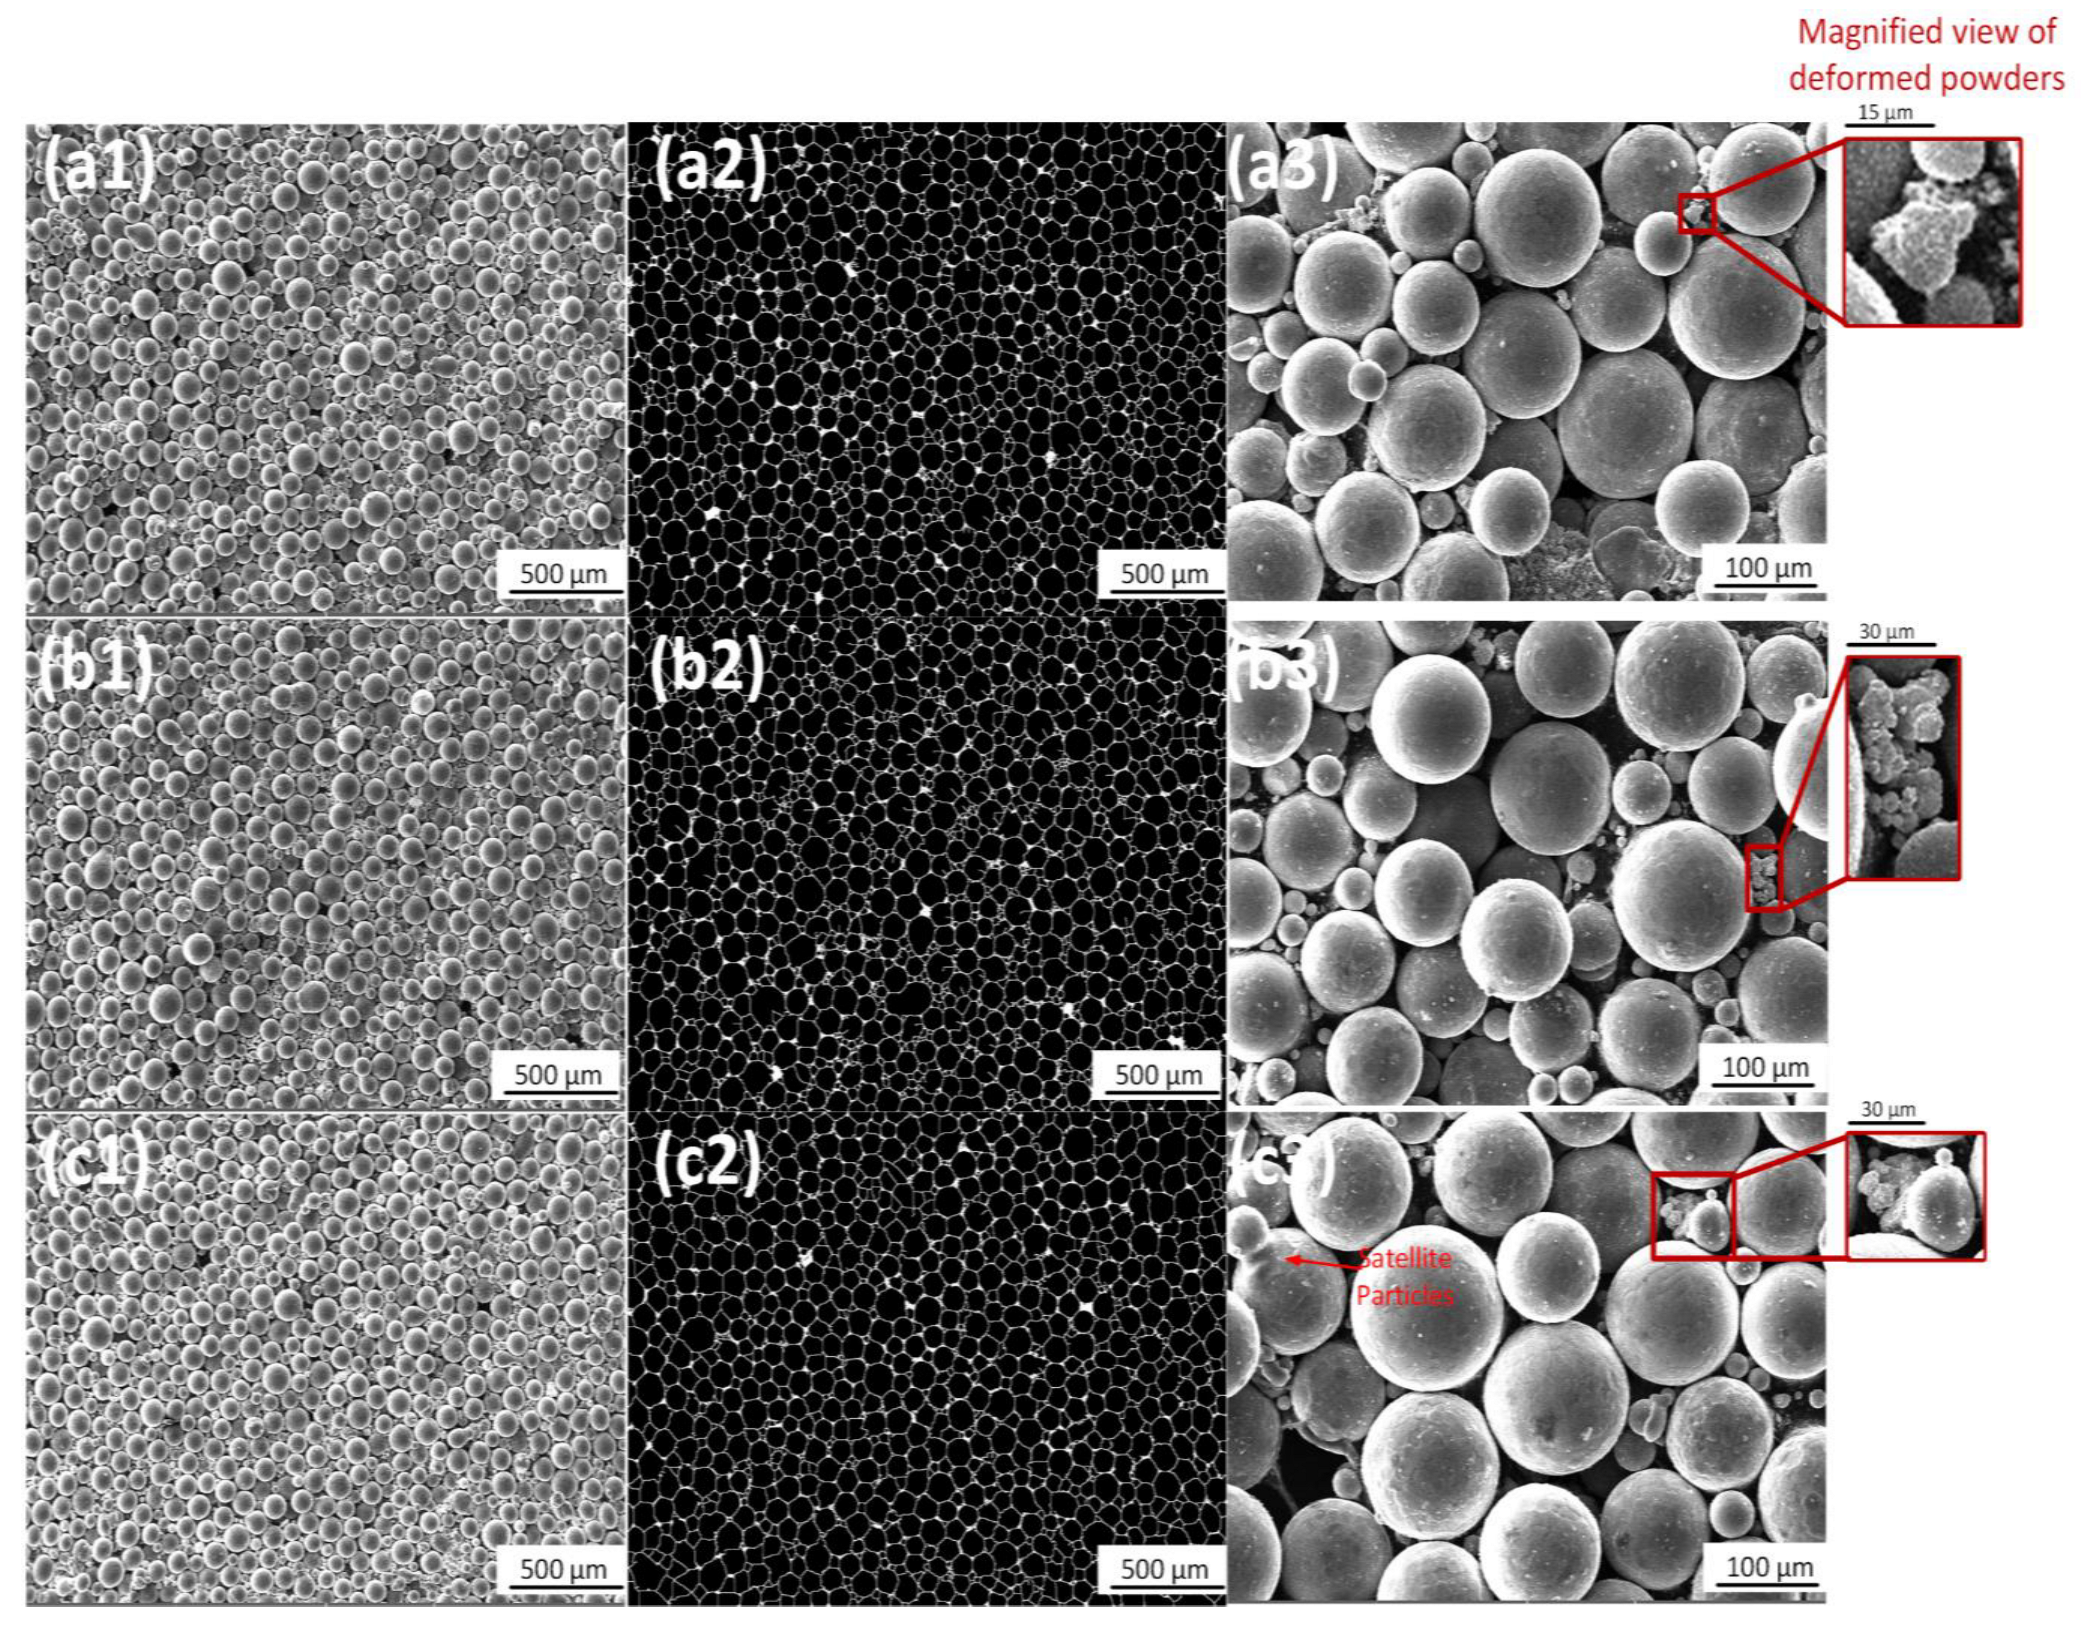
Figure 3a–c shows the SEM images illustrating the structural characteristics of the mixed powders. These include powder size, circularity, void areas between the powders, and other powder defects such as satellite particles and deformation. The summarized findings are presented in
Table 1.
In the Mg-Zn-Mn alloy system, the Zn content directly affects the alloy hardness and brittleness [
29], and hence, the characteristics of the Mg-Zn-Mn alloy powder formed in ball milling. A harder alloy typically produces finer powder particles. However, increased brittleness can result in a broader distribution of particle sizes due to varied fracture behaviors during mixing. Additionally, Mg naturally exhibits a tendency to cold weld [
8], a process where clean metal surfaces fuse under compression without the application of heat. The addition of Zn can either enhance or reduce this inherent property of Mg, affecting the degree of particle agglomeration in the mixing phase. Zn also modulates the alloy reactivity, influencing the formation, thickness, and consistency of the oxide layer on the particles [
30]. Such changes can have consequences for later processing steps in SLM or the longevity of the stored powder.
These attributes are important as they can influence the SLM process and the resulting SLM samples. The size of the powder was determined for different weight percentages of Zn (1, 4, and 7 wt.%) using ImageJ 1.51 software. While all samples showed a consistent d
90 (representing 90% of the particle size distribution), variations in d
10 (representing 10% of the particle size distribution) and d
50 indicate a disparity in their size distribution. Such a disparity can directly influence powder flowability, which is an important factor in the SLM process. Enhanced powder flowability is often preferred, as it promotes the formation of dense layers with minimal surface irregularities in the powder bed, leading to a stable melt pool [
31]. An in-depth analysis of powder shape (or circularity) indicates that the particles mostly exhibited a circular contour, with the mean circularity being 0.8. It has been reported that circular powders facilitate better flowability compared with their irregularly shaped counterparts [
32].
When analyzing the void areas between the powders, the sample with 1 wt.% Zn had an 8.8% void area fraction. In comparison, the samples with 4 wt.% and 7 wt.% Zn exhibited void area fractions of 8.9% and 7.4%, respectively. Such void areas can be interpreted as defects, potentially leading to porosity in the SLM-printed parts. On the other hand,
Figure 3(a3–c3) indicates that although the powders were carefully mixed, defects, such as satellite particles and deformed powders, were observed. Satellite particles are defined as smaller powder fragments attached to larger primary particles. These irregularities can influence the quality of SLM printing.
3.2. Porosity Assessment of SLM-Printed Mg Alloys
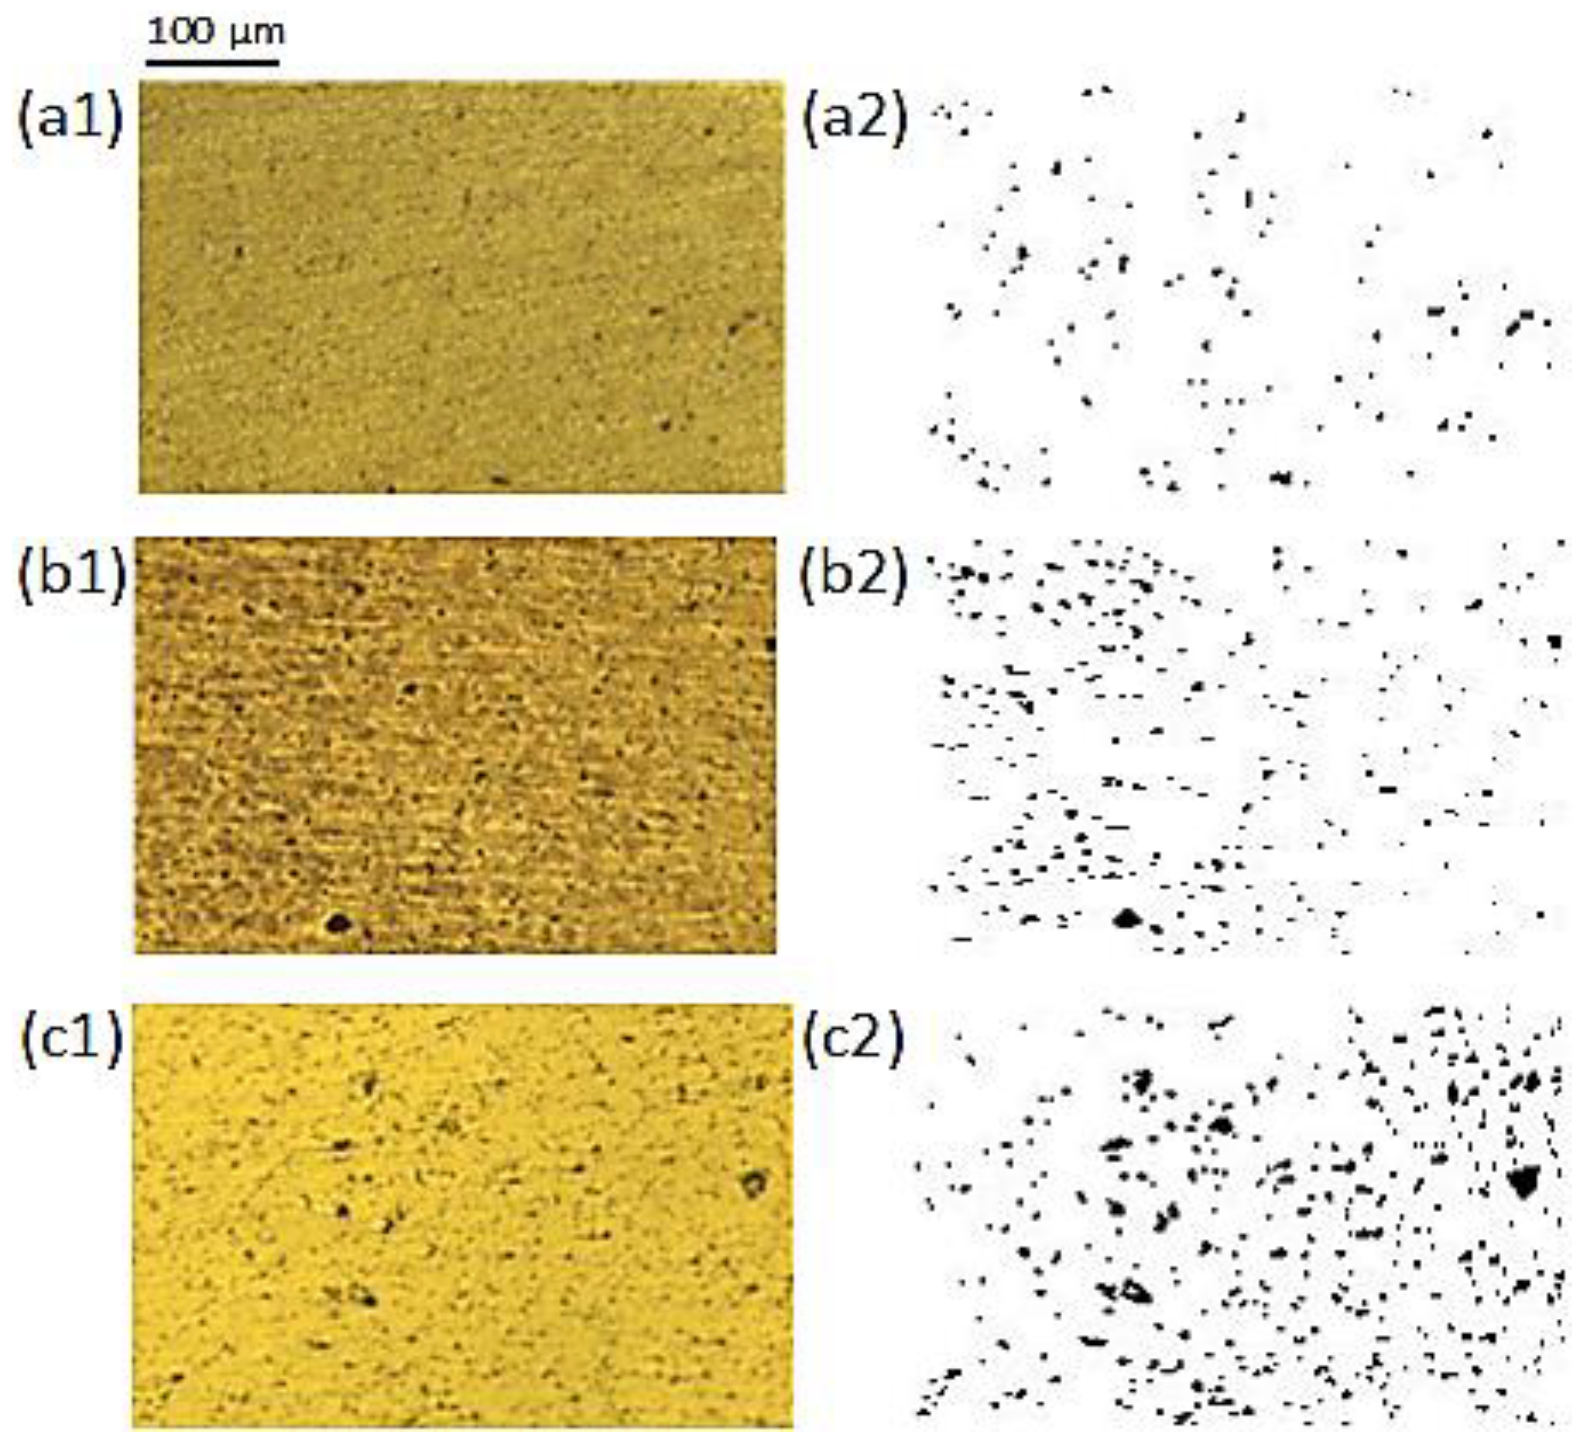
Figure 4(a1–c1) shows optical images of SLM-printed samples with varying Zn content. An analysis of these images, presented in
Figure 4(a2–c2), reveals the pore area fraction, size, and circularity using the ImageJ 1.51 software. The analysis indicates a clear correlation between the Zn content and the average pore area fraction derived from three measurements. The sample with 1 wt.% Zn demonstrated a low pore area fraction of 1.0%. With an increase in Zn content to 4 wt.%, this fraction increased to 2.5%. At the highest Zn content of 7 wt.%, the pore area fraction reached its peak value at 5.3%. It is noted that porosity can influence surface roughness, with lower porosity usually corresponding to a smoother and more consistent surface [
33].
In
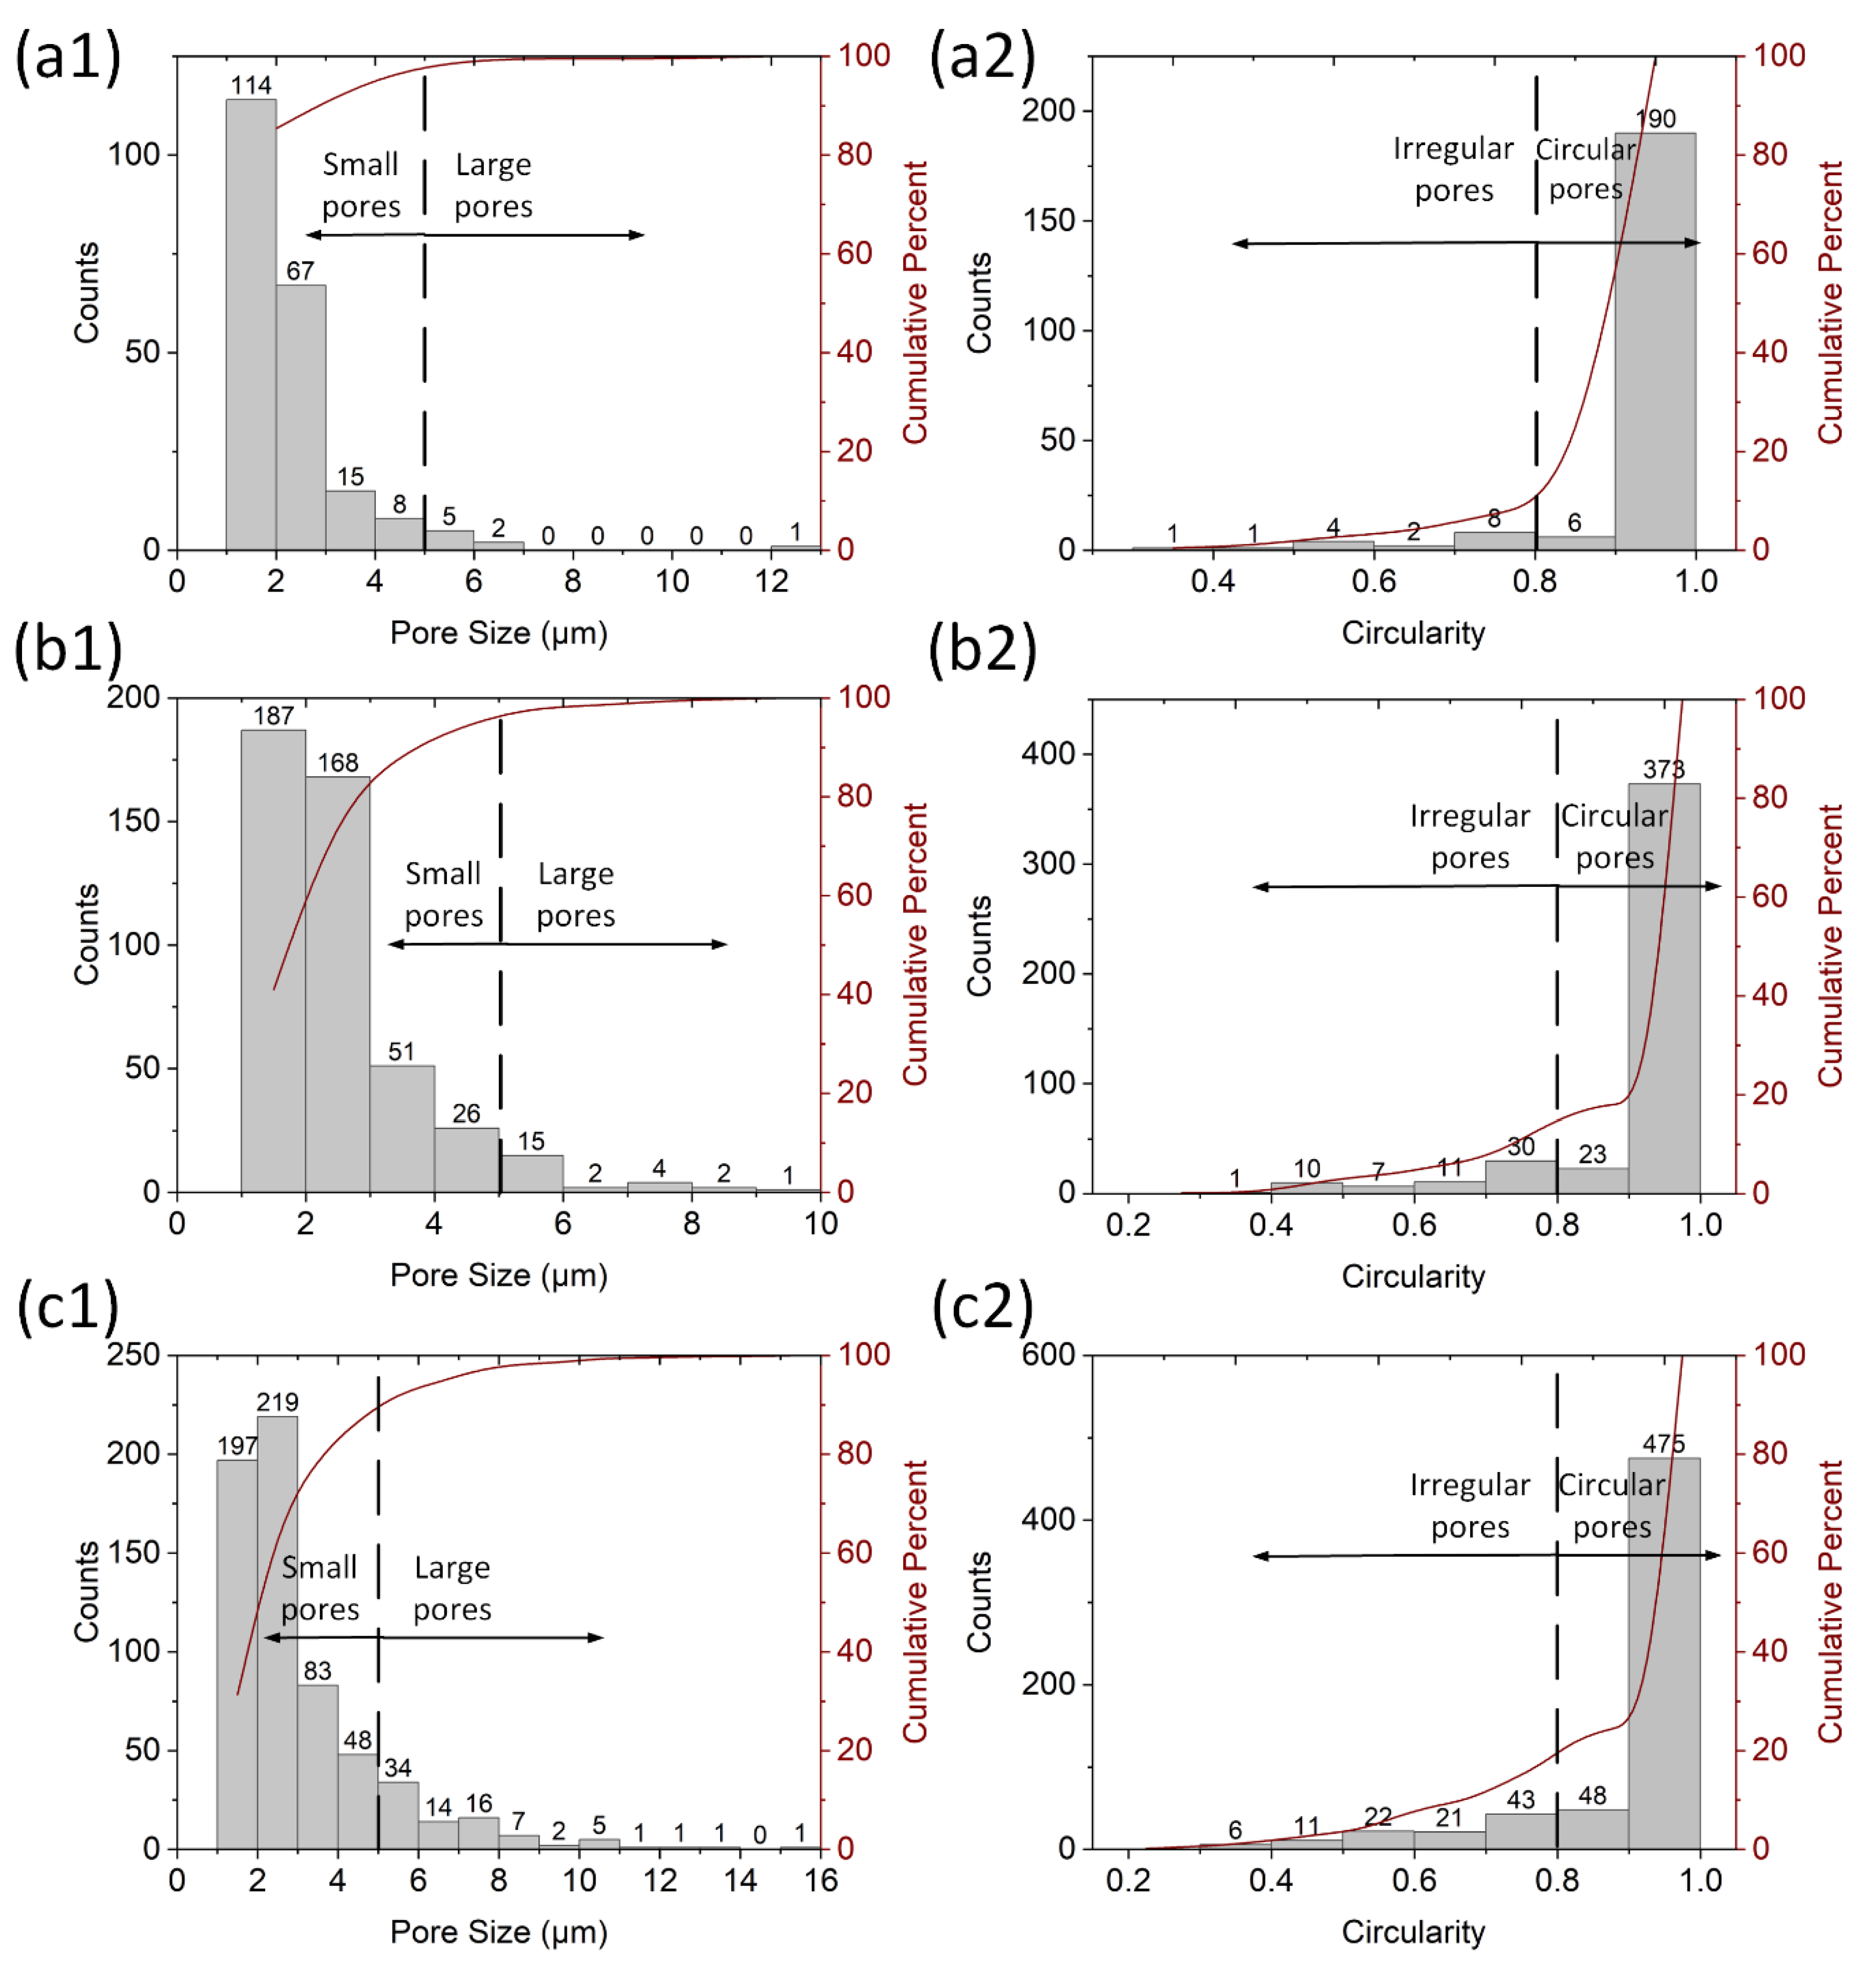
Figure 5(a1–c1,a2–c2), the difference in pore size and circularity for the SLM-printed samples across different Zn contents is further examined. Pores were categorically divided according to their size. The pores less than 5 μm, with the smallest identifiable at 1.4 μm, were categorized as small, whereas the pores equal to or exceeding 5 μm were classified as large. In the sample with 1 wt.% Zn, 212 pores were observed with an average size of 2.2 μm. The largest pore was measured as 12.2 μm. A total of 96% of the pores fell within the small pore category. When the Zn content was increased to 4 wt.%, the sample revealed 456 pores, averaging 2.4 μm in size. The largest pore was measured as 9.2 μm. A total of 94% of the pores were classified as small pores. With a further increase in Zn to 7 wt.%, the sample had 629 pores with an average size of 3.0 μm. The largest pore was 15.6 μm, and the small pores accounted for 87% of the total.
When examining pore circularity, the pores were considered as either circular (circularity ≥ 0.8) or irregular (circularity < 0.8). The most irregular pore was identified with a circularity close to 0.3. As Zn content increased from 1 to 7 wt.%, the circular pores dropped from 92% to 83%. A study from Al-Maharma et al. [
34] indicates that pore shape plays an important role in influencing the mechanical properties of the printed parts. Circular pores facilitate a more uniform stress distribution, which can reduce the initiation sites for cracks. In contrast, irregular pores increase stress concentration areas, which can weaken the overall structural integrity and fatigue resistance [
34]. Additionally, although both types of pores are susceptible to pitting corrosion, irregular pores lead to less predictable and more accelerated corrosion behaviors [
35].
3.2.1. Effect of Powder Characteristics on Porosity of Printed Parts
In the SLM process, both powder particle size and laser spot size are important. Finer particles require a smaller laser spot size for melting, leading to improved resolution and precision in the printed components. However, they can pose challenges such as poor flowability and increased oxidation risk, impacting the build quality [
36]. In contrast, larger particles can reflect laser beams, reducing the quality of deposited layers [
37]. Thus, a balance between particle size and flowability is essential to achieve optimal printing quality.
Laser spot size, which represents the laser beam diameter, influences the spatial resolution and accuracy of the SLM process. Although smaller spot sizes facilitate the creation of finer features in the printed part, they can introduce defects, especially when interacting with non-uniform powder beds or larger particles [
26]. In this study, the laser spot size was set at 123.4 μm. This choice aligns with the characteristics of raw powders across varied Zn compositions. As a result, better particle fusion was promoted, leading to the porosity level ranging from 1 to 5.3% in the SLM-printed samples. On the other hand, raw powder defects, such as satellite powders (seen in
Figure 3(c3)), deformed powders, and voids can affect printing quality. Such defects can obstruct powder flowability, leading to inconsistent melting and increased porosity [
38]. Particularly, inter-powder voids can serve as potential gas traps during laser exposure. These voids can subsequently introduce bubbles, which compromise the structural integrity [
39]. Their formation is influenced by factors such as powder size distribution, spreader speed, and texture of the preceding layers [
40,
41].
3.2.2. Effect of Increased Zn Content on Porosity of Printed Parts
The alloying element of Zn can influence the solidification process of Mg alloys. In this study, samples with a higher Zn content (x = 7) demonstrated a higher porosity level than those with a lower Zn content. This observation aligns with the finding of Wei et al. [
42], who investigated the effect of element vaporization on the formability of SLM Mg-Zn-Zr alloys. They observed that in the temperature range between 900 K (the liquidus temperature of Mg-6Zn-0.5Zr) and 3000 K, the evaporation flux of Zn on the melt pool surface was substantially lower than with Mg. This suggests a significant burning loss in Zn-rich samples during laser irradiation, leading to the rapid generation of vapor fumes and a turbulent flow above the melt pool. Such vapor gases are prone to re-enter the melt pool. Jha et al. [
43] indicate an increased Mg to Zn ratio reduces surface tension in Mg-Zn liquid alloys. This constrains the flow of molten metal and complicates the expulsion of dissolved gases from the melt pool, subsequently increasing the likelihood of pore formation in the solidified alloy.
3.3. SEM-EDX Morphological Analysis of SLM-Printed Mg Alloys
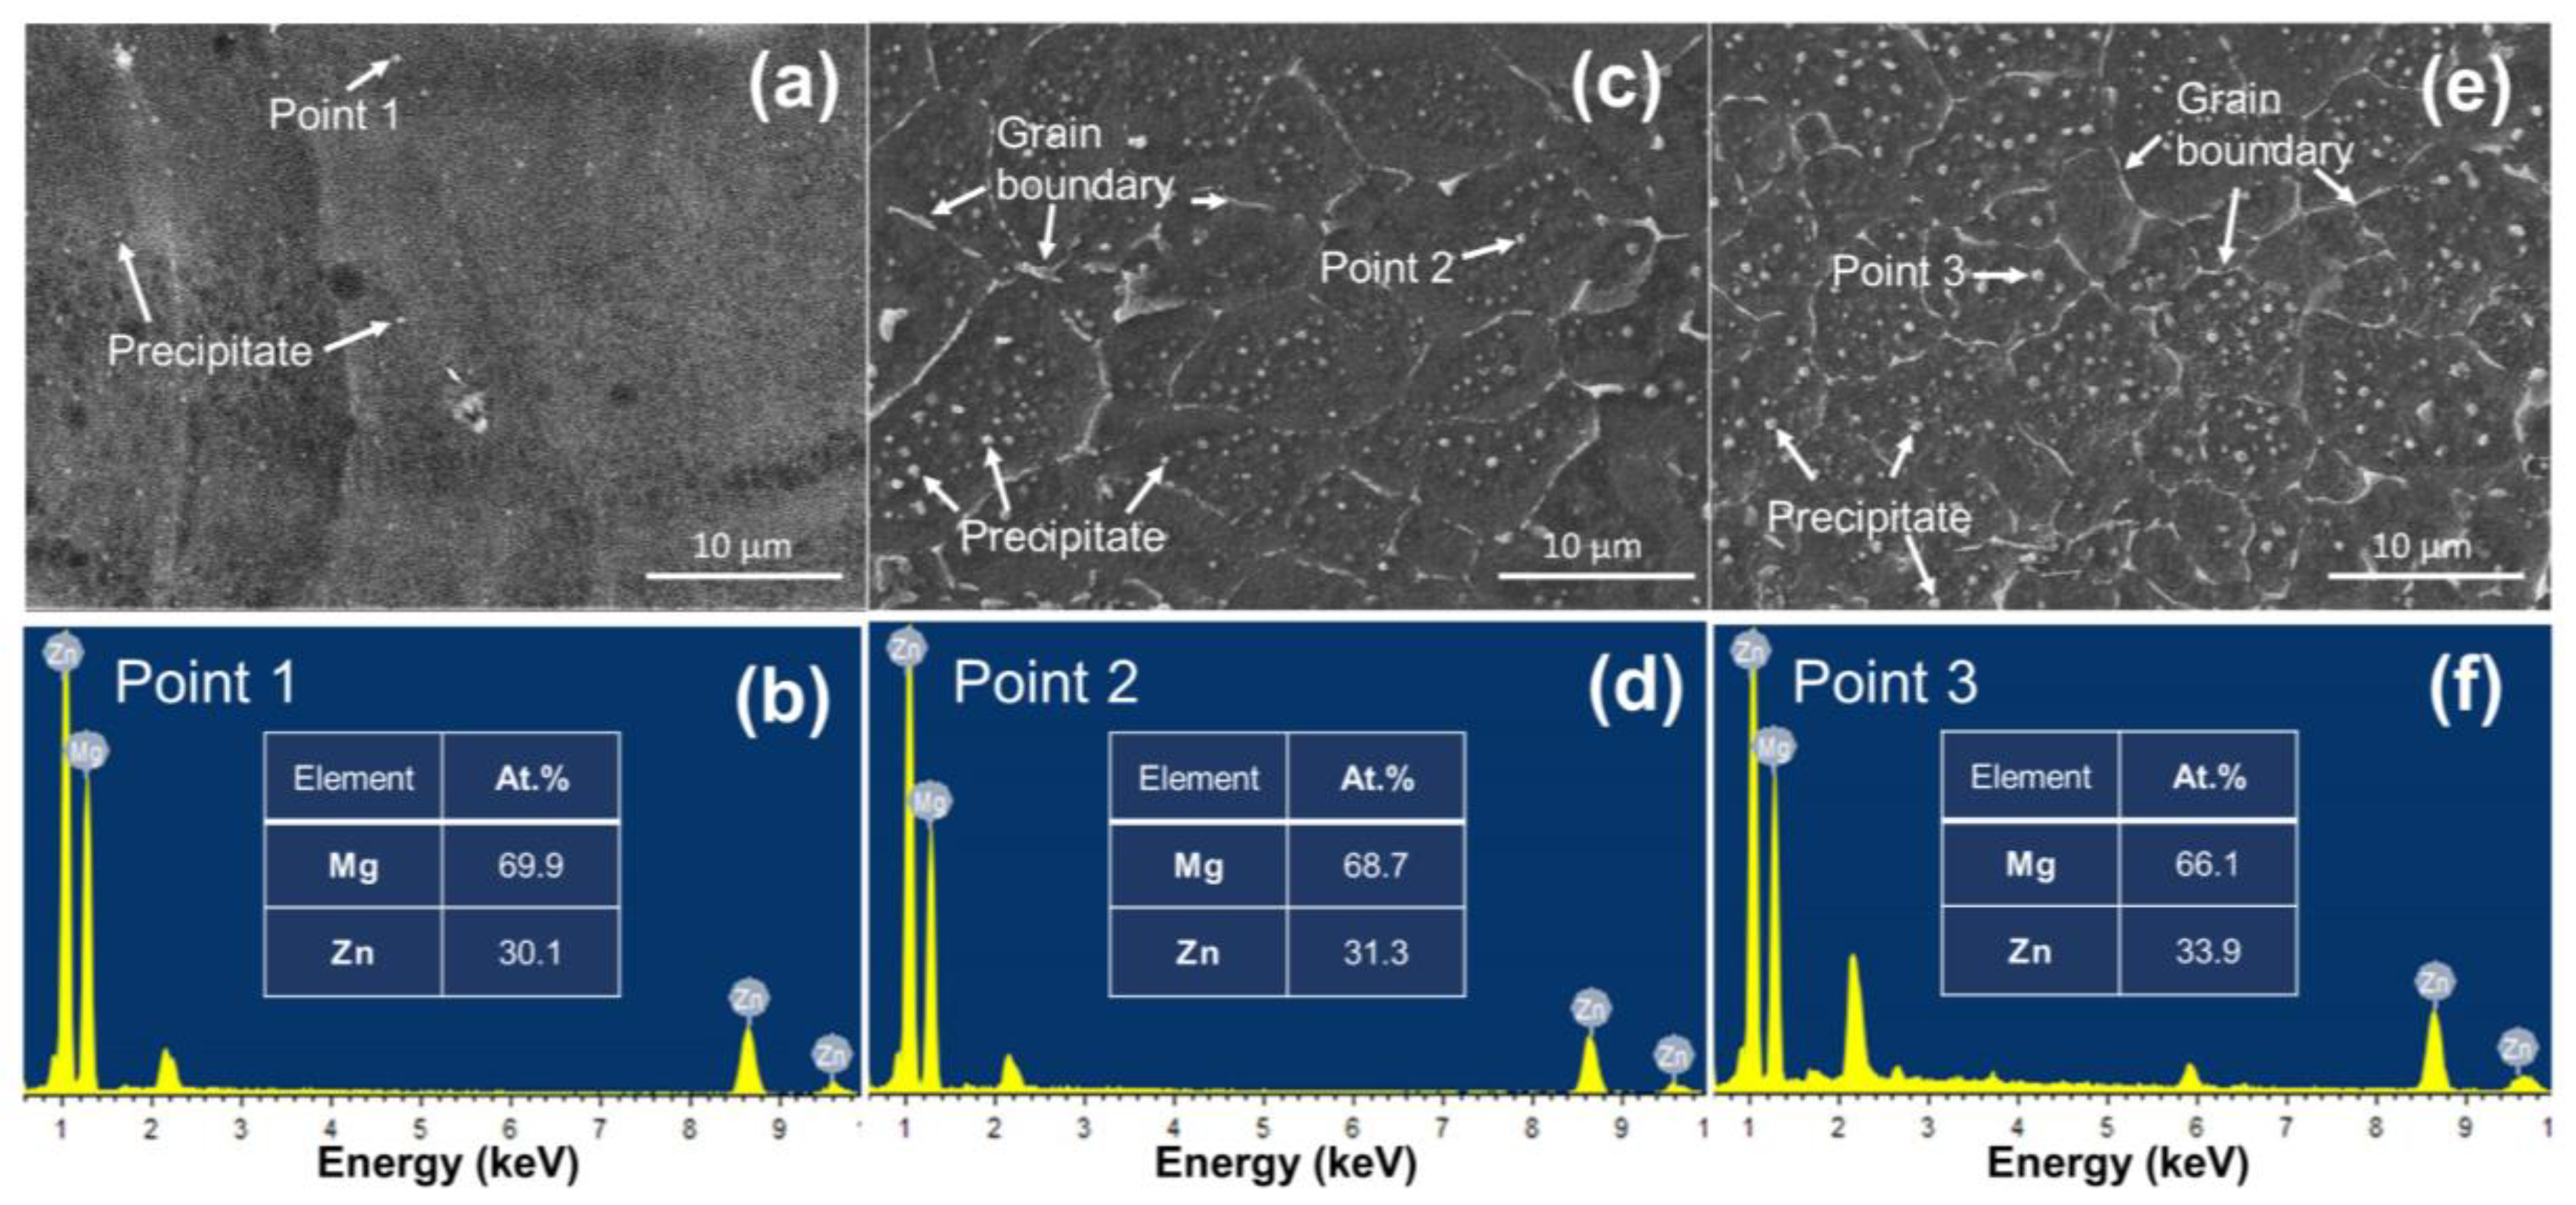
Figure 6 illustrates the SEM morphology of different SLM-printed samples. The samples with varying Zn contents contain a grey α-Mg matrix interspersed with distinct white regions. These features appear in two primary morphologies: isolated white particles and networked line structures, representative of grain boundaries. However, such grain boundary features were not observed in the 1 wt.% Zn sample.
The white particulate features are postulated to be precipitates. The inherent conditions associated with the SLM process, such as high temperature gradients and rapid cooling rates, promote the formation of precipitates. This is attributed to certain phases becoming supersaturated and subsequently nucleated during rapid solidification [
44]. The density of these precipitates appears to increase with increased Zn content, implying a direct correlation. Based on an average derived from 20 measurements, the sizes of these precipitates were determined as 0.27 ± 0.06, 0.41 ± 0.27, and 0.46 ± 0.17 μm for Zn contents of 1, 4, and 7 wt.%, respectively. It was found that the precipitates associated with a Zn content of 1% were smaller than their counterparts with higher Zn contents (4 and 7%). These precipitates also exhibited no clear spatial distribution.
The tables in
Figure 6 display the elemental composition analysis of these precipitates, revealing that the Mg content varied between 66.1 and 69.9 wt.%, while the Zn content ranged from 30.1 to 33.9 wt.%. Given these proportions, the Mg to Zn ratios of the samples ranged from 1.95:1 to 2.32:1. These observed ratios suggested that the composition of the precipitates might be consistent with Mg
7Zn
3, which has a stoichiometric ratio of 7:3 (or 2.33:1). The Mg
7Zn
3 phase is a commonly reported precipitate in Mg-Zn alloys produced using SLM [
29,
45]. However, this identification is preliminary and requires further confirmation from the XRD analysis in
Section 3.5.
For samples containing 4 and 7 wt.% Zn, the grains exhibited an equiaxed morphology. Their respective grain sizes were measured to be 4.0 μm and 3.0 μm. The decreasing grain size with increasing Zn content suggests a grain refinement process. Such refinement can affect the corrosion behavior. Grain boundaries can either accelerate corrosion due to their difference in electrochemical potential compared with the grain interior or act as barriers to the progression of corrosion [
46]. Finer grains introduce more grain boundaries, which dictate the mechanical properties. It is reported that finer grains tend to enhance mechanical strength as the abundance of grain boundaries acts as obstacles to dislocation movement [
47].
3.4. Influence of Zn on Grain Refinement and Growth Restriction in SLM-Printed Mg Alloys
The growth restriction factor (
GRF), proposed by Maxwell and Hellawell [
48], provides a metric for assessing the effectiveness of grain refinement.
GRF is determined using the phase diagram of a specific material [
49] and is expressed by the following equation:
where
mi is the slope of the liquidus line,
ki is the distribution coefficient, and
Co,i is the initial content of the element
i.
The
GRF exhibits a correlation with the growth restriction parameter (GRP), denoted by the values of m(k − 1) in
Table 2. An increased GRP suggests a corresponding increase in
GRF, implying a stronger influence on grain refinement. However, it should be noted that this relationship is not consistent for GRP values exceeding 9. Research by Lee et al. [
49] evaluated the role of elements such as Zr, Ca, and Si on grain refinement in Mg alloys, identifying their effects to be relatively comparable. Among the elements (in
Table 2) with a GRP value below 9, Zn possesses the highest GRP, recorded at 5.31. These data suggest a significant contribution of Zn to grain refinement in Mg alloys. Studies by Maxwell and Hellawell [
48], complemented by findings from Cho et al. [
50], provide further insight into the role of Zn in refining the microstructure of SLM-printed Mg alloys. The reported mechanism of grain refinement is that when Mg alloys cool from the liquid to the solid state, the segregation of Zn at the front of grain growth forms an intensive constitutional undercooling in a diffusion layer ahead of the advancing solid–liquid interface [
30]. Such undercooling limits the grain growth and promotes the nucleation of primary Mg, leading to grain refinement. This is consistent with the findings presented by Cho et al. [
50], who observed that Zn tends to segregate at the boundary between liquid and solid phases during melt pool solidification in the SLM process.
3.5. XRD Characterization and Phase Transitions in SLM-Printed Mg Alloys
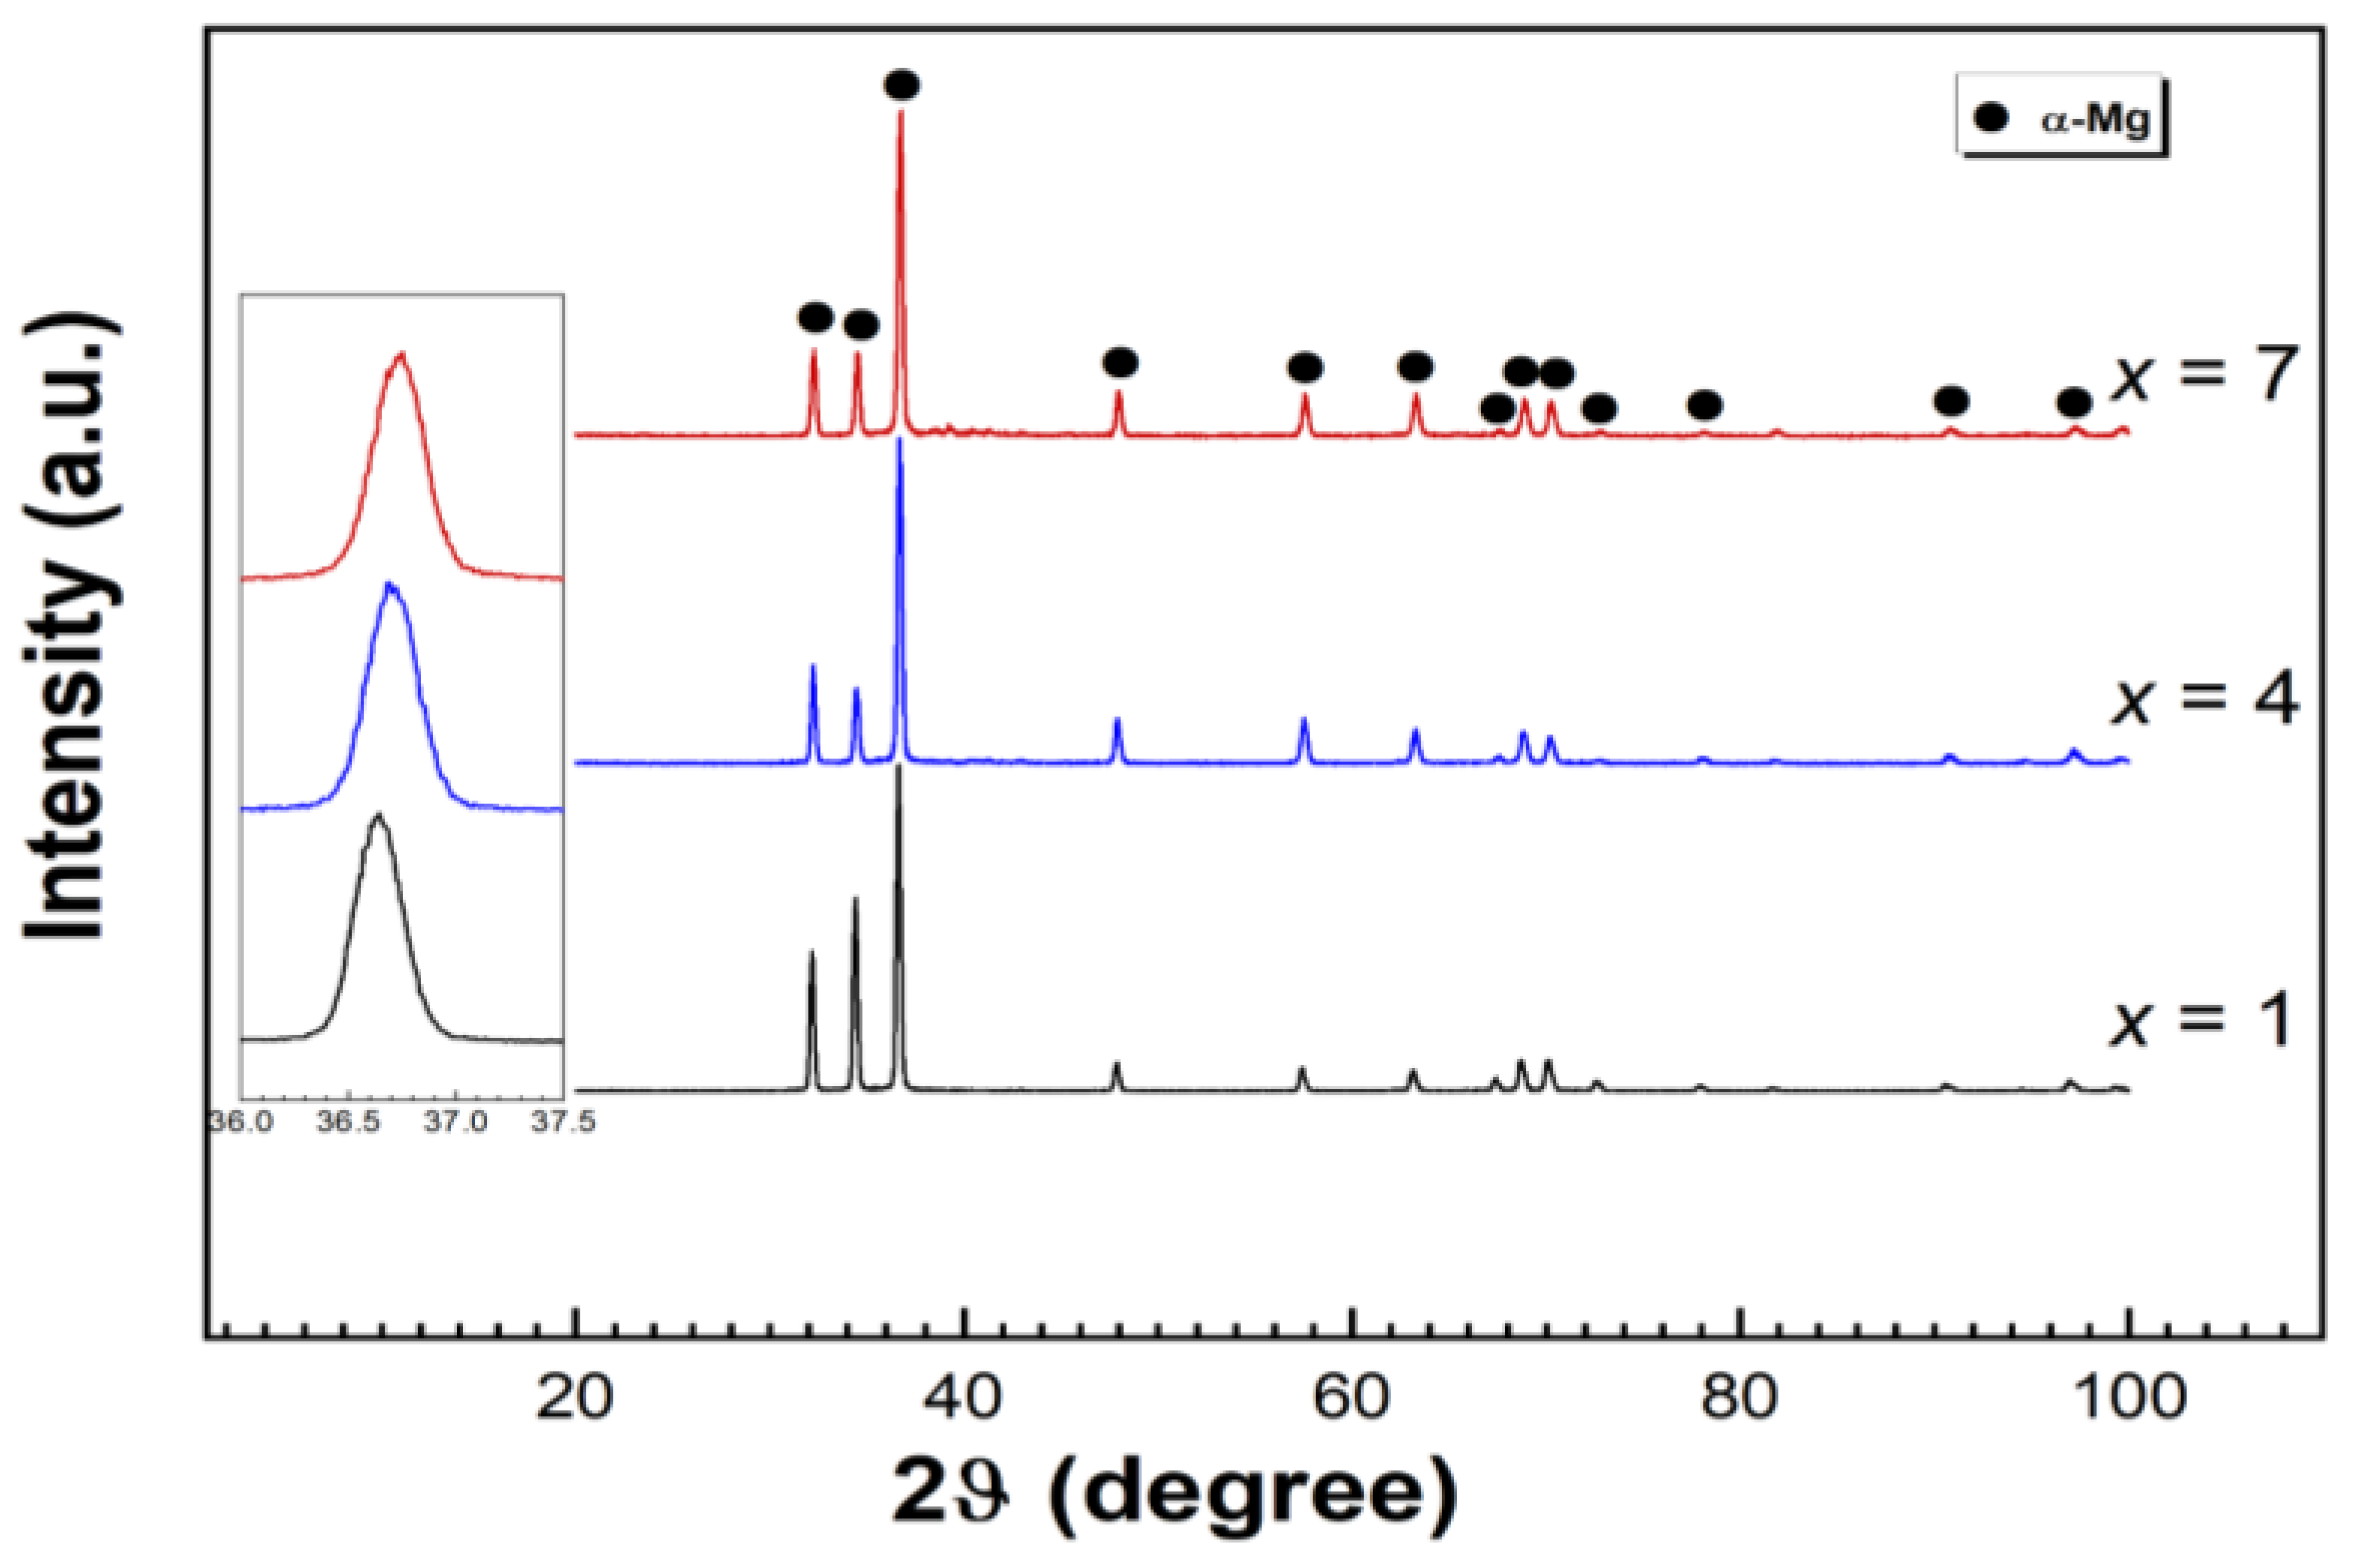
Figure 7 shows the XRD patterns of different SLM-printed samples. It reveals a dominant α-Mg matrix with a hexagonal close-packed structure across all samples.
The inset in
Figure 7 indicates the XRD patterns between 2θ = 36°–37.5°. The prominent diffraction peaks of the α-Mg matrix exhibit a rightward shift as Zn content increases. This observation aligns with Bragg’s law of diffraction [
41]:
In this equation, d is the interplanar spacing in the atomic lattice, θ is the angle of interaction between the incident ray and scattering planes, n is an integer (n = 1, 2, 3…), and λ is the wavelength of incident wave (with λ = 1.54060 Å for Cu Kα radiation).
The observed rightward shift in the diffraction peaks indicates a decrease in lattice parameters attributed to the substitution of Zn in the α-Mg matrix. Given that the atomic radius of Zn (0.1187 nm) is less than that of Mg (0.1333 nm) [
42], it is possible that the incorporation of Zn induces lattice contraction. However, other factors, such as bonding characteristics and potential defects, can also influence this phenomenon. The rapid solidification inherent to the SLM process can increase the solid solubility of Zn in the α-Mg matrix, thus enhancing the shift in diffraction angles. Similar observations regarding diffraction peak shifts with Zn addition in Mg-Zn alloys produced through laser manufacturing have been reported by Wei et al. [
42] and Manne et al. [
45].
Despite the evidence of precipitates from the SEM images (
Figure 6), the associated diffraction peaks are absent in the XRD results. These precipitates could be below the detection size threshold of XRD, or their peaks could coincide with the peaks of the main phase. Further research will be necessary to investigate this discrepancy.
3.6. Corrosion Behaviour of SLM-Printed Mg Alloys in Hanks’ Solution: Potentiodynamic Polarisation Tests
Hanks’ solution was chosen due to its closer resemblance to interstitial fluids found in the human body compared with basic saline solutions such as NaCl. The constitution of ions in Hanks’ solution, encompassing Na
+, K
+, Ca
2+, Cl
−, and HCO
3−, mimics physiological environments. This complex ionic setting can induce diverse corrosion mechanisms relative to simpler media. Hanks’ solution is buffered by bicarbonate ions, ensuring a stable pH during corrosion. This is crucial as Mg corrosion can significantly alter pH in non-buffered solutions [
51].
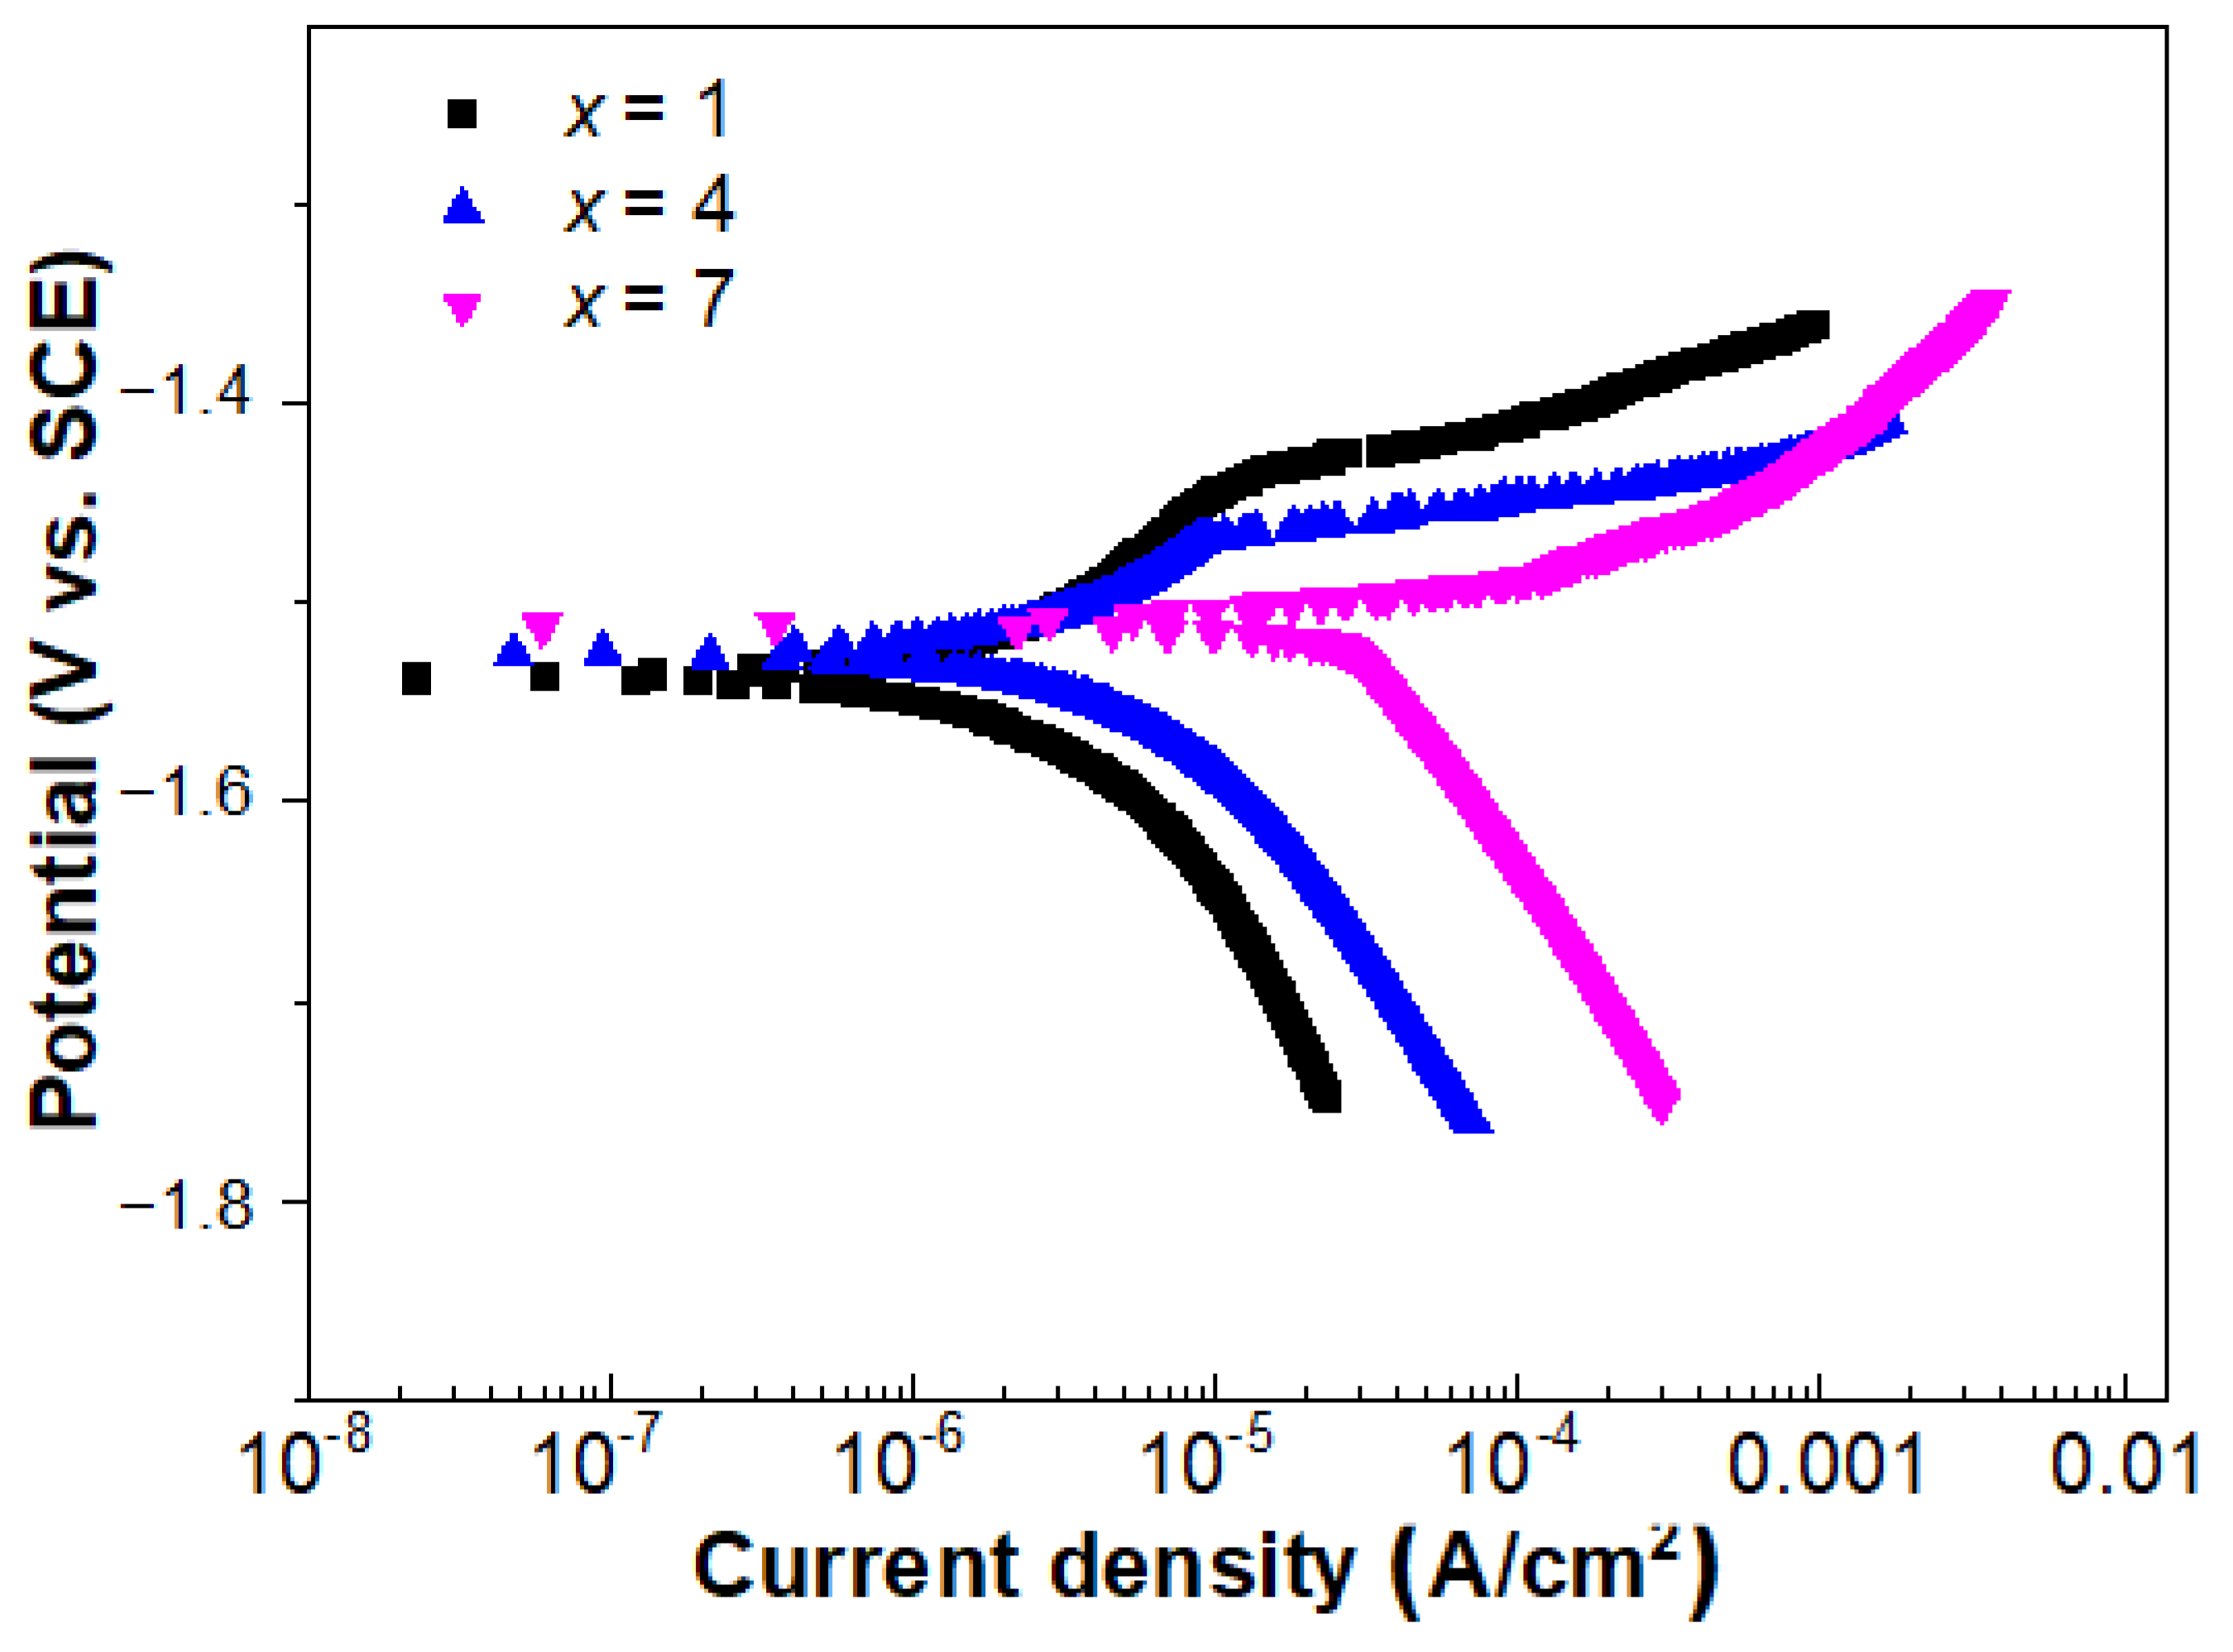
Figure 8 displays the polarization curves of different SLM-printed samples. Corrosion parameters, such as E
corr and I
corr, are extracted using Tafel extrapolation, and the results are shown in
Table 3.
Figure 8 shows the significance of the hydrogen evolution reaction in determining the cathodic branch. The current density of the cathodic branch, at consistent potentials, follows the order of Mg-7Zn-0.2Mn > Mg-4Zn-0.2Mn > Mg-1Zn-0.2Mn. This order suggests that as Zn content increases, the current density of the cathodic branch also increases, indicating a potential relationship between the Zn content and the impact of hydrogen evolution reaction on the cathodic branch. As presented in
Table 3, the sample with x = 1 exhibits the lowest rates for both anodic dissolution and cathodic hydrogen evolution. In contrast, the x = 7 sample shows the highest I
corr, measured at 35.12 μA/cm
2.
3.7. Corrosion Mechanism of SLM-Printed Mg Alloys in Hanks’ Solution
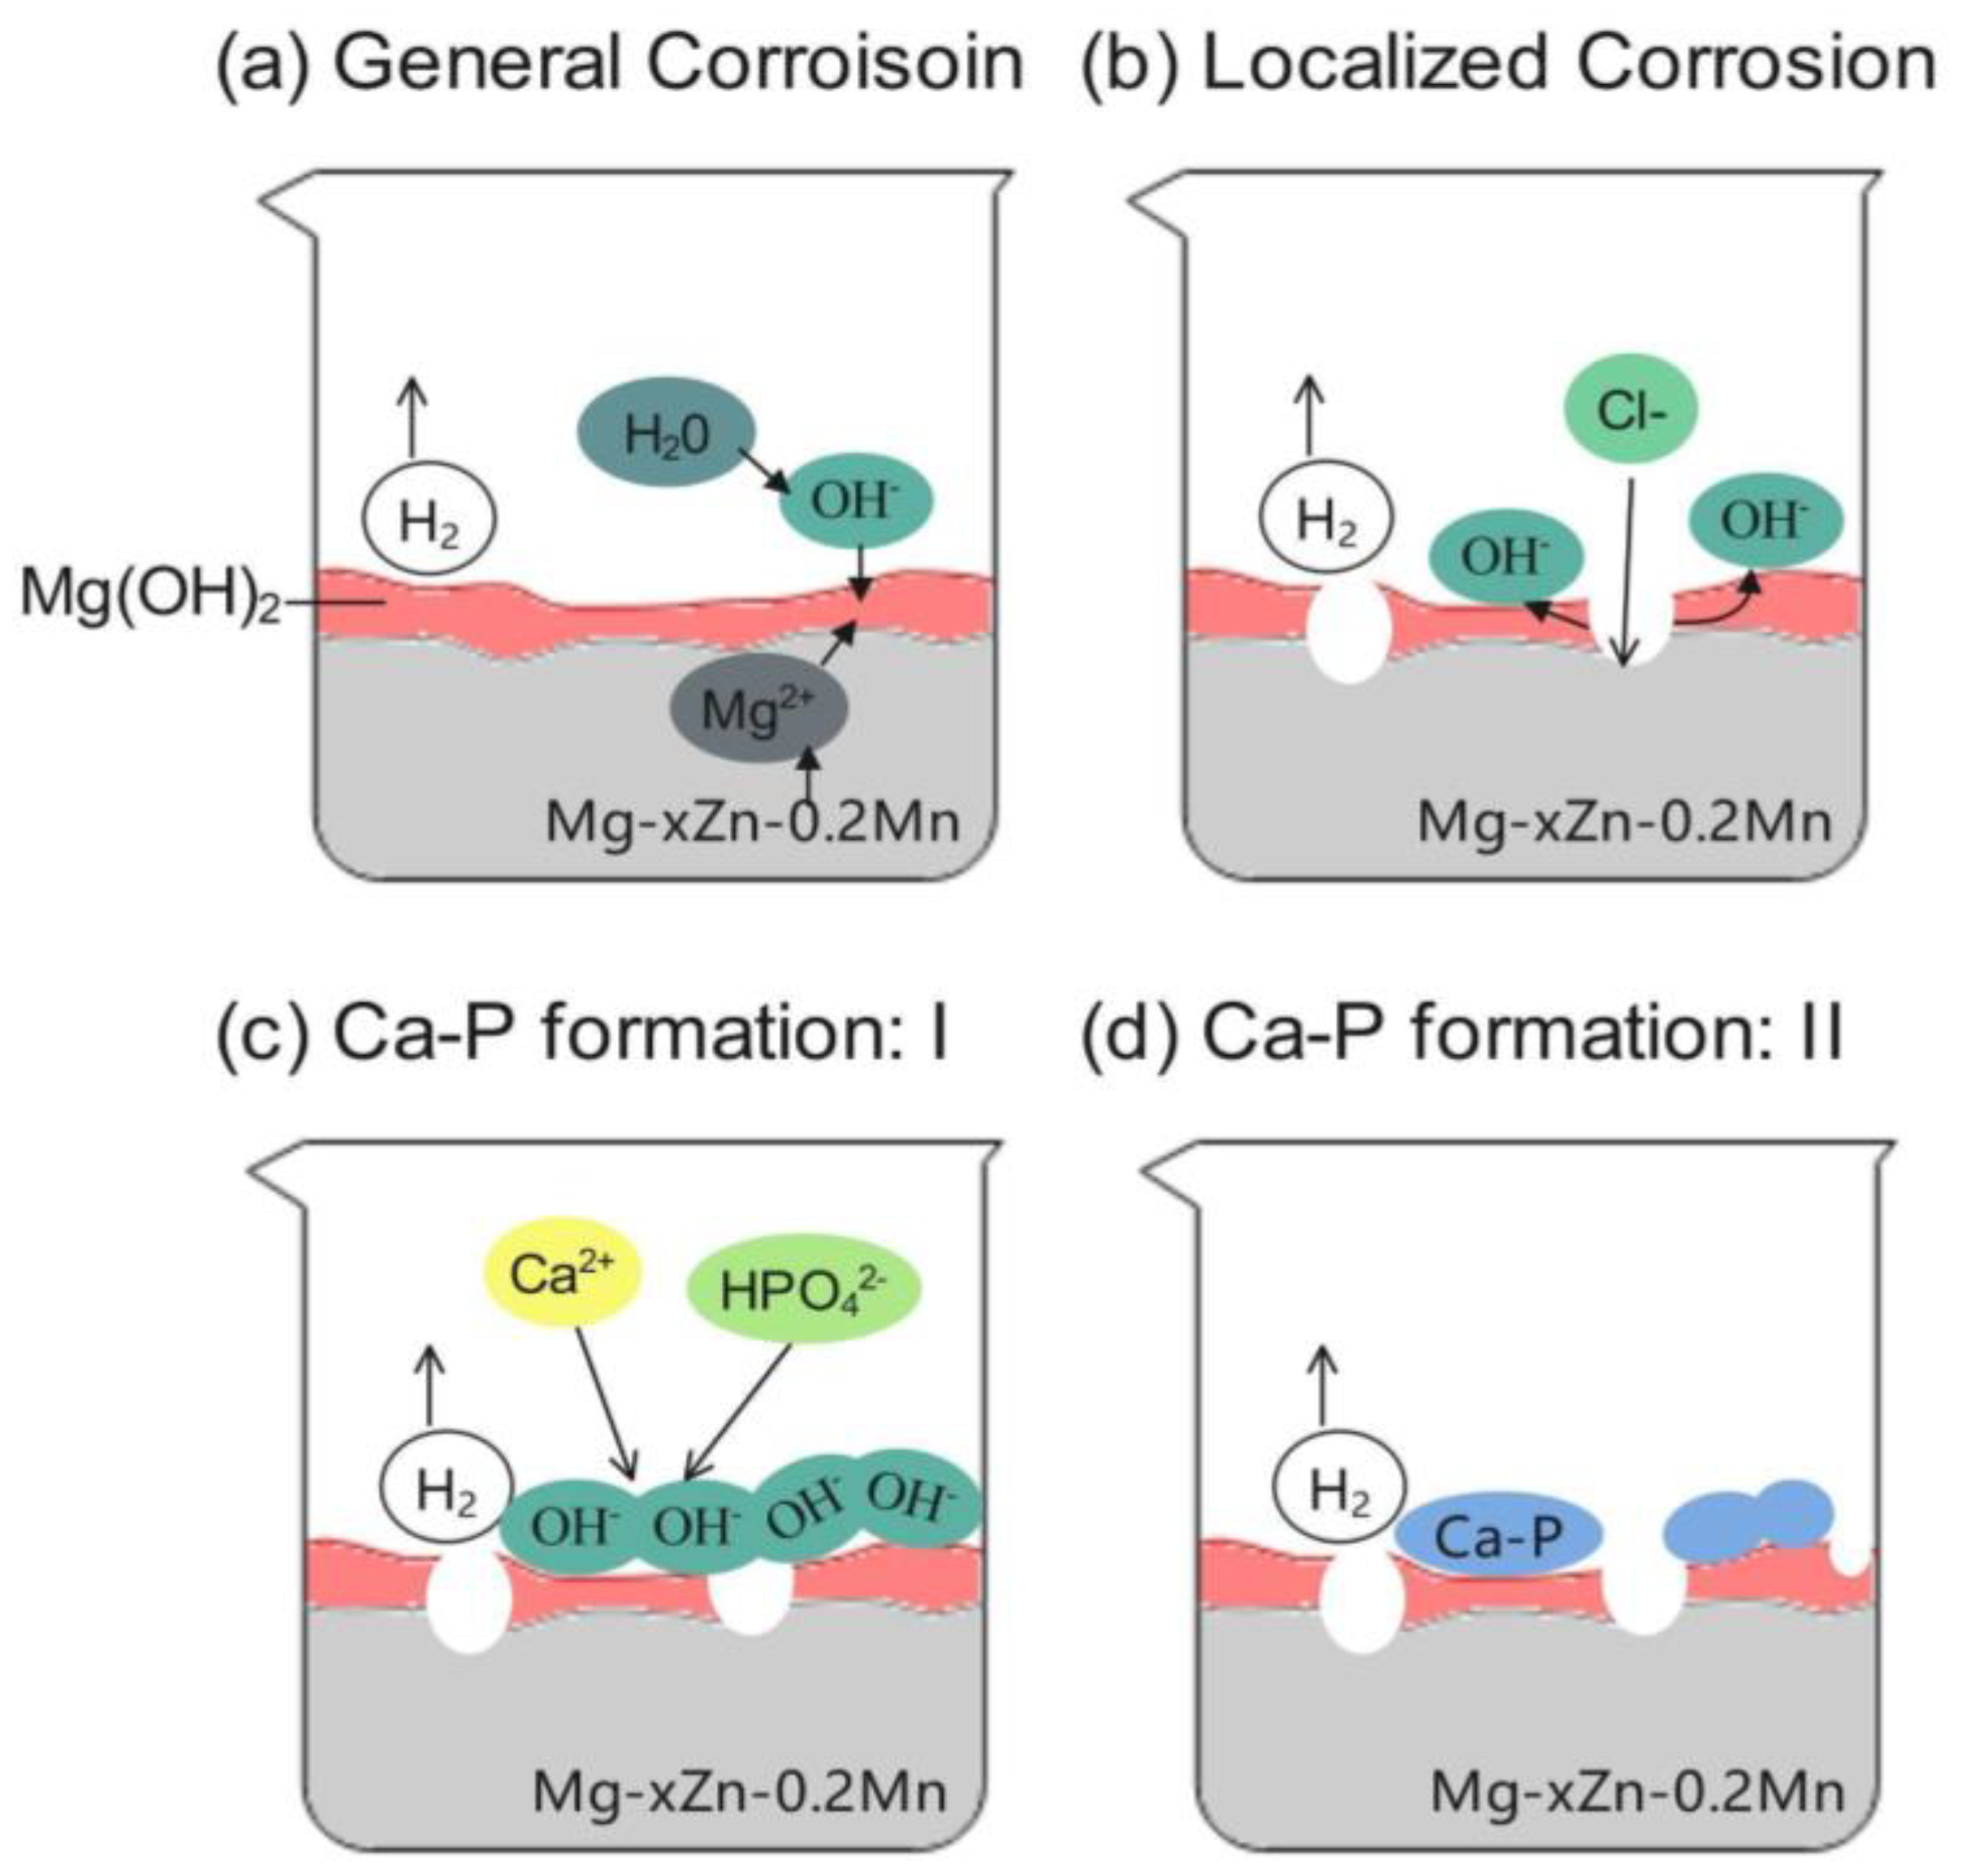
The corrosion dynamics of the Mg-xZn-0.2Mn alloy in Hanks’ solution are characterized by a complex pathway. During immersion, this specific alloy undergoes three critical stages: general corrosion, localized corrosion, and the subsequent formation of Ca-P compounds [
52]. Each of these stages, with their distinct mechanisms, is illustrated in
Figure 9.
The anodic and cathodic reactions may be presented as:
A thin Mg(OH)
2 film is formed on the alloy surface:
While this film can act as a protective barrier, its potential instability makes it susceptible to aggressive attacks by Cl
− ions. Significant localized corrosion can result from the infiltration and activity of these ions. Such interactions occur when Mg(OH)
2 comes into contact with Cl
− ions, producing magnesium chloride (Mg(Cl)
2) and more hydroxide ions (OH
−):
Additionally, magnesium cation (Mg
2+) also bond with Cl
− ions to produce Mg(Cl)
2:
According to Equation (7) and
Figure 9c, when there is an increased concentration of OH
− ions near the surface of the alloy, these ions react with Ca
2⁺ and HPO₄
2− ions to form Ca-P compounds:
During the corrosion process, hydrogen gas bubbles form as a result of the cathodic reactions. Over time, these bubbles can elevate the corrosion products, exposing fresh alloy surfaces to the corrosive medium and subsequently accelerating the corrosion rate.
The final stages of corrosion are indicated by the complex formation of Ca-P compounds, commonly termed apatites. These Ca-P compounds can influence the corrosion behavior. Their exact composition varies depending on factors such as local pH value, ionic concentration, temperature, as well as the kinetics and duration of the reaction [
53].
3.8. Influence of Zn Content on Corrosion Patterns in SLM-Printed Mg Alloys
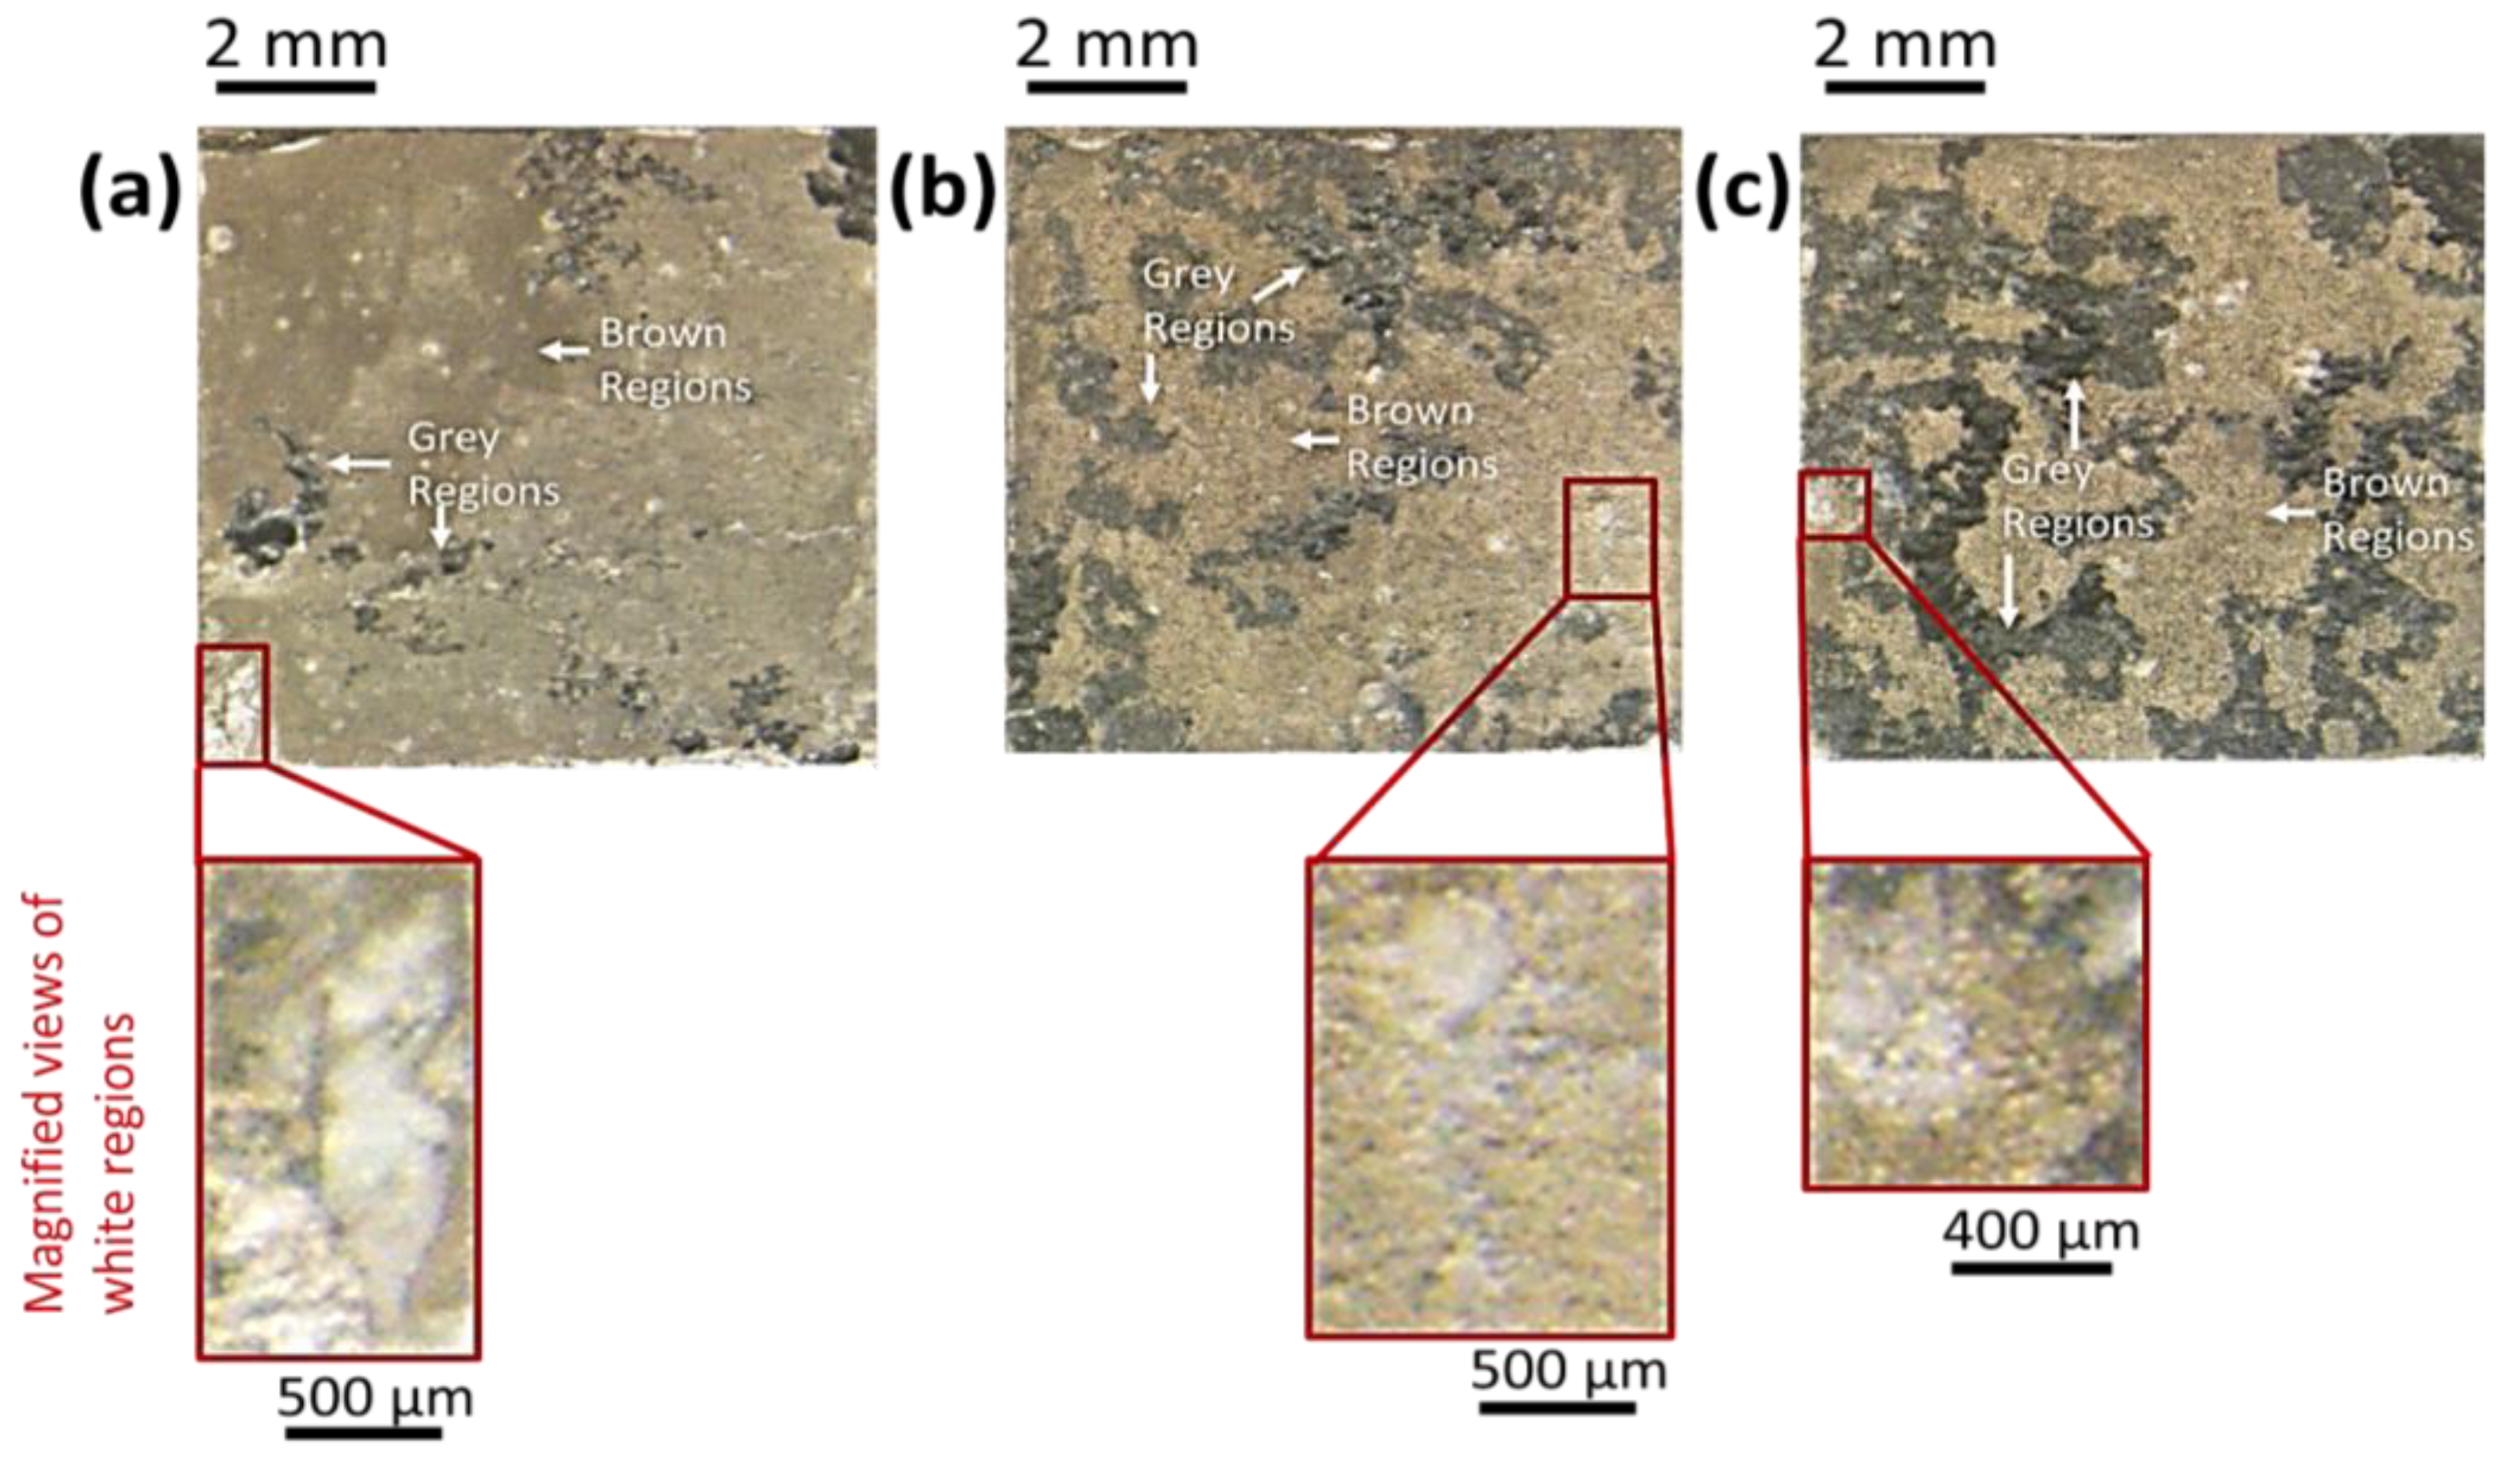
The degradation behavior of different SLM-printed samples was evaluated over a 24 h immersion period in Hanks’ solution.
Figure 10a–c shows the OM images, revealing the morphological changes in these samples after the immersion. Differences in these changes can be attributed to the varied Zn contents. These images depict distinct regions based on color differentiation in OM, namely grey, brown, and white. While these colors are visually distinct, they are indicative of particular corrosion characteristics inherent to Mg alloys.
The grey regions, indicative of localized corrosion, exhibit shading due to the formation of pits or cavities, which tend to be deeper than their width. Such depth can create shadows and angles in optical images, giving these specific corrosion areas a grey appearance. The brown regions in the images offer a dual interpretation. They could represent regions of the alloy that remain uncorroded or regions undergoing uniform general corrosion across the surface. This brown color is similar to the appearance of Mg during the initial stages of oxidation [
54]. Although the brown regions might not appear as severe as other regions, their uniform coloration suggests a steady thinning of the Mg alloy over time. The white regions correspond to the accumulated corrosion products, potentially Mg(OH)
2 and Ca-P compounds. Mg reacts with water to produce Mg(OH)
2, which appears as a white powdery substance. Similarly, Ca-P compounds also exist as white residues [
52]. These observations are consistent with the chemical reactions expected in Hanks’ solution, as detailed in
Section 3.7.
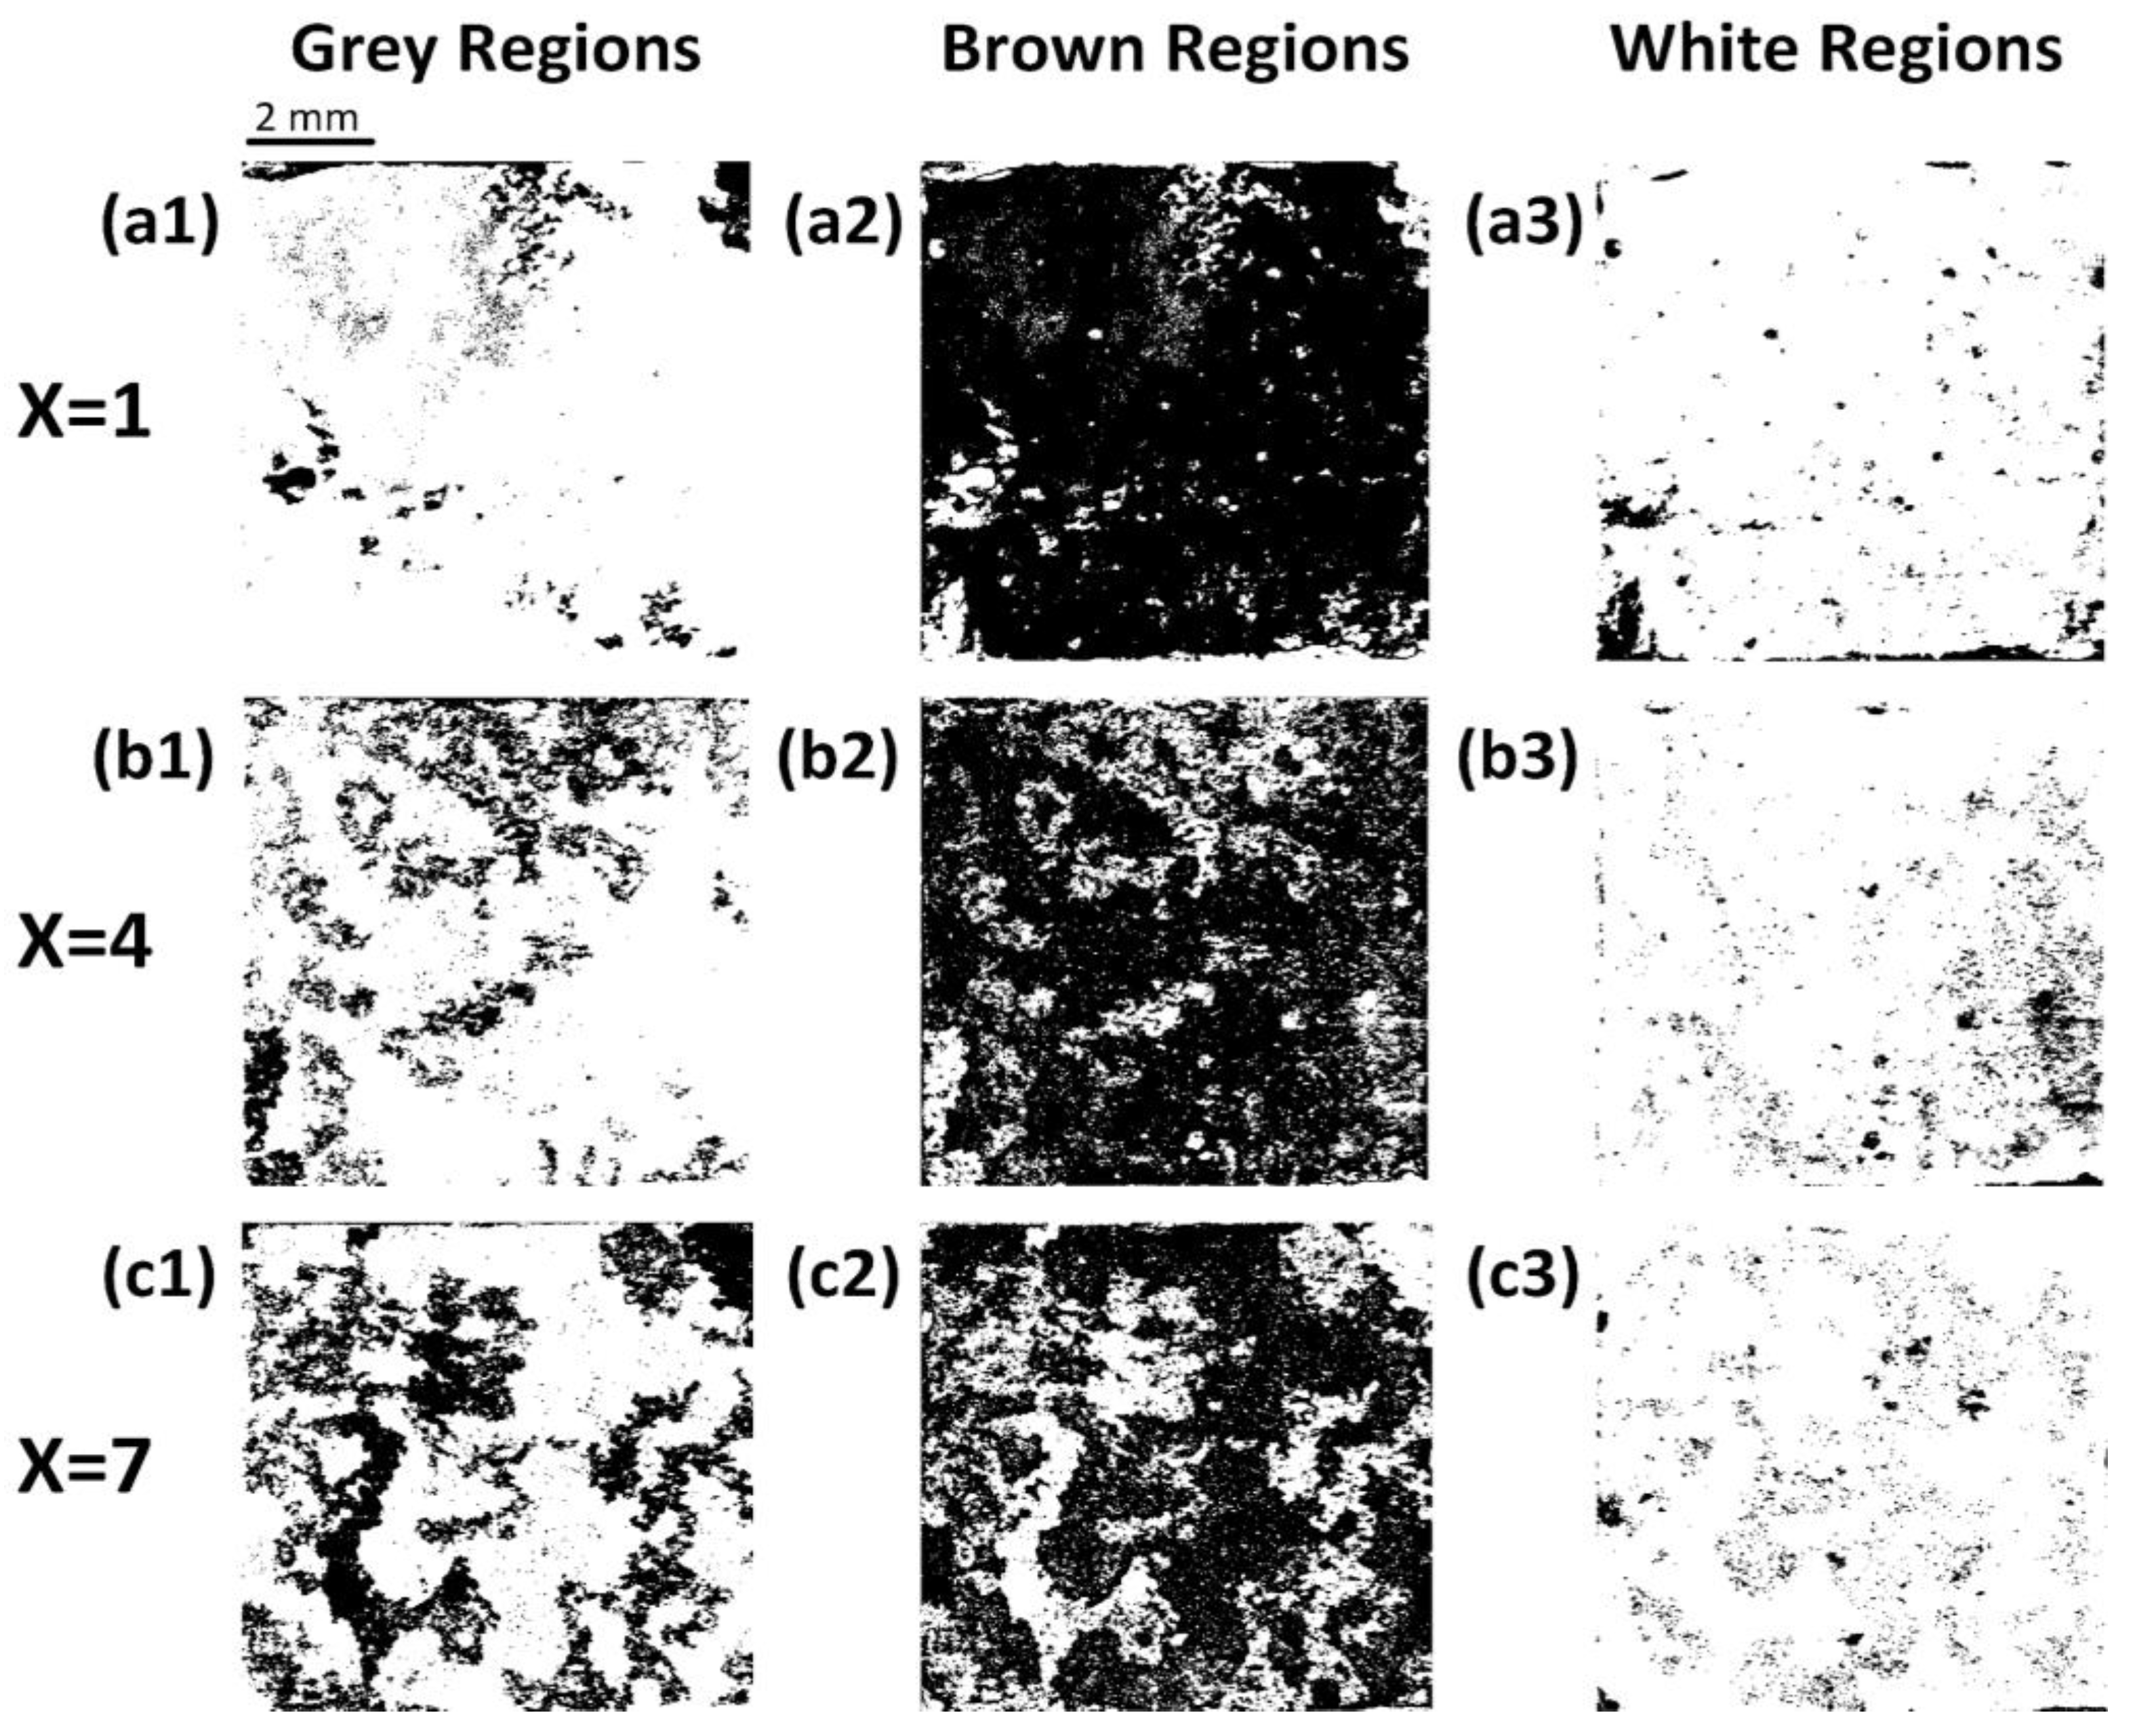
The quantitative results from the ImageJ analysis are given in
Table 4 and illustrated in
Figure 11. This process converted the OM images to grayscale, with pixel values assigned from 0 (darkest) to 255 (brightest). Pixels with grey values from 0 to 85 were categorized as grey regions, those ranging from 86 to 114 as brown regions, and those from 115 to 255 as white regions. It is important to note that this grayscale classification only provides an approximation and does not encompass every type of corrosion.
For the x = 1 sample, brown regions dominate by covering 89.84% of the area, while grey and white regions represent 5.64% and 4.52%, respectively. Regarding the x = 4 sample, there is a noticeable shift, with grey regions increasing to 16.4%, brown regions declining to 78.94%, and white regions showing a marginal rise to 4.66%. In contrast, the x = 7 sample shows a further change, with grey regions rising to 31.58% and brown and white regions decreasing to 65.2% and 3.22%, respectively.
This result suggests a trend where increased Zn content corresponds with an increase in corroded surface areas (grey regions) and a reduction in areas potentially uncorroded or exhibiting general corrosion (brown regions). Several factors can contribute to this observed trend. First, porosity can accelerate the corrosion rate. Samples with higher porosity offer more initial sites for corrosion and areas trapping corrosive agents. Second, precipitates (or secondary phases) within the alloys possess distinct electrochemical properties compared with the alloy matrix. This disparity often results in micro-galvanic corrosion. The presence of these secondary phases creates potential differences at the micro-level, establishing micro-galvanic cells between the matrix and the precipitates. This micro-galvanic action can accelerate the overall corrosion process [
55]. Moreover, the spatial distribution, size, and morphology of these precipitates can further influence the corrosion dynamics. For instance, densely packed secondary phases might offer different corrosion resistance compared with sparsely distributed ones. Lastly, grain boundaries can emerge as primary sites for corrosion because of their lower corrosion potential compared with the matrix [
56]. The localized attack along the grain boundaries of Mg-Zn-Zr alloys was reported by Zeng et al. [
57]. The x = 7 sample displayed more severe localized corrosion compared with the x = 1 and x = 4 samples. However, this increased corrosion did not correspond to a linear increase in corrosion products, as indicated by the white regions. A detailed discussion of this observation can be found in
Section 3.9.1.
3.9. Hydroxyapatite (HA) Formation and Corrosion Product Morphology on SLM-Printed Mg Alloys
Calcium phosphate (Ca-P) compounds play an important role in biomedical applications. Their bioactivity can influence various cellular processes, from protein adsorption to cellular interactions, and is primarily governed by the Ca/P ratio [
58]. HA can serve as a scaffold to promote bone growth, both on its surface and within its porous structures [
59,
60]. Consequently, evaluating the ability of SLM-printed Mg alloys to produce HA becomes essential in assessing their biocompatibility.
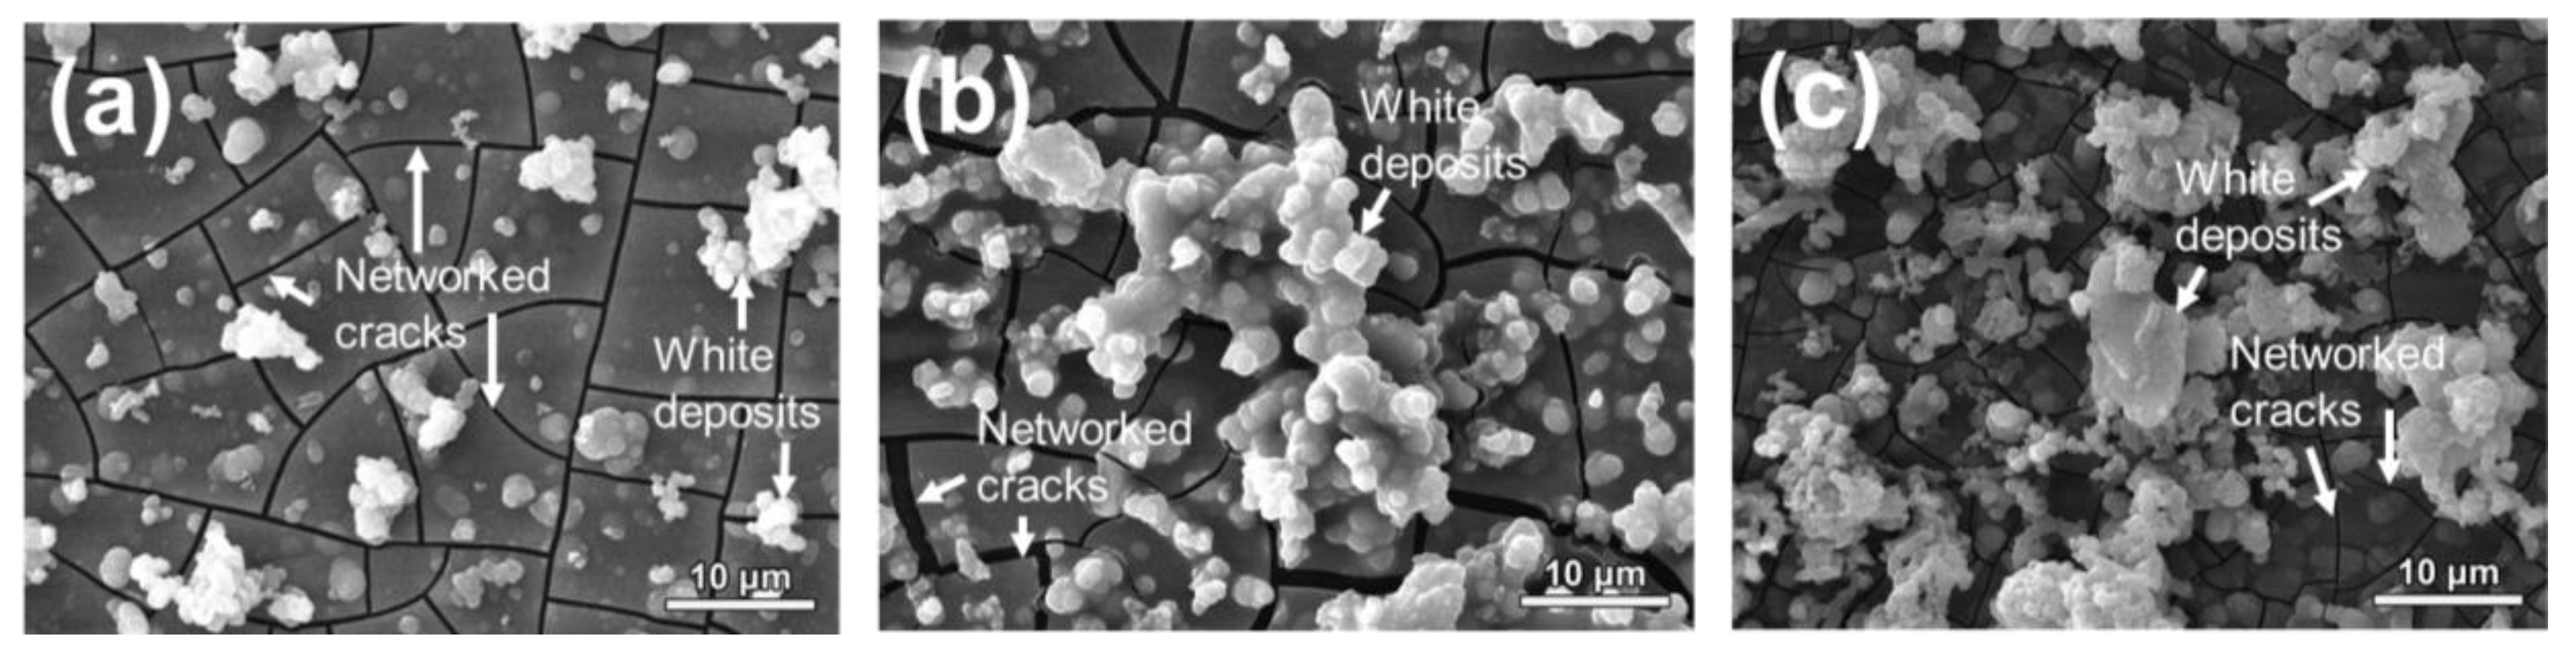
3.9.1. SEM Morphology of Corrosion Products
Figure 12a–c illustrates the SEM morphology of the corrosion products, namely the white regions indicated in
Figure 10, for different x-values (1, 4, 7 wt.% Zn). Based on this visual analysis, two primary features are observed: a series of networked microcracks and white deposits on the alloy surface. The networked microcracks, present across all samples, indicate the material response to its environment. Supported by the corrosion models in
Figure 9, it is understood that these cracks are attributed to localized corrosion. This phenomenon occurs when the Cl
− ions penetrate and weaken the protective film on the samples. As the protective film deteriorates, the underlying fresh Mg substrate becomes exposed, leading to increased aggressiveness of the Cl
− ions and a subsequent intensification of cracking.
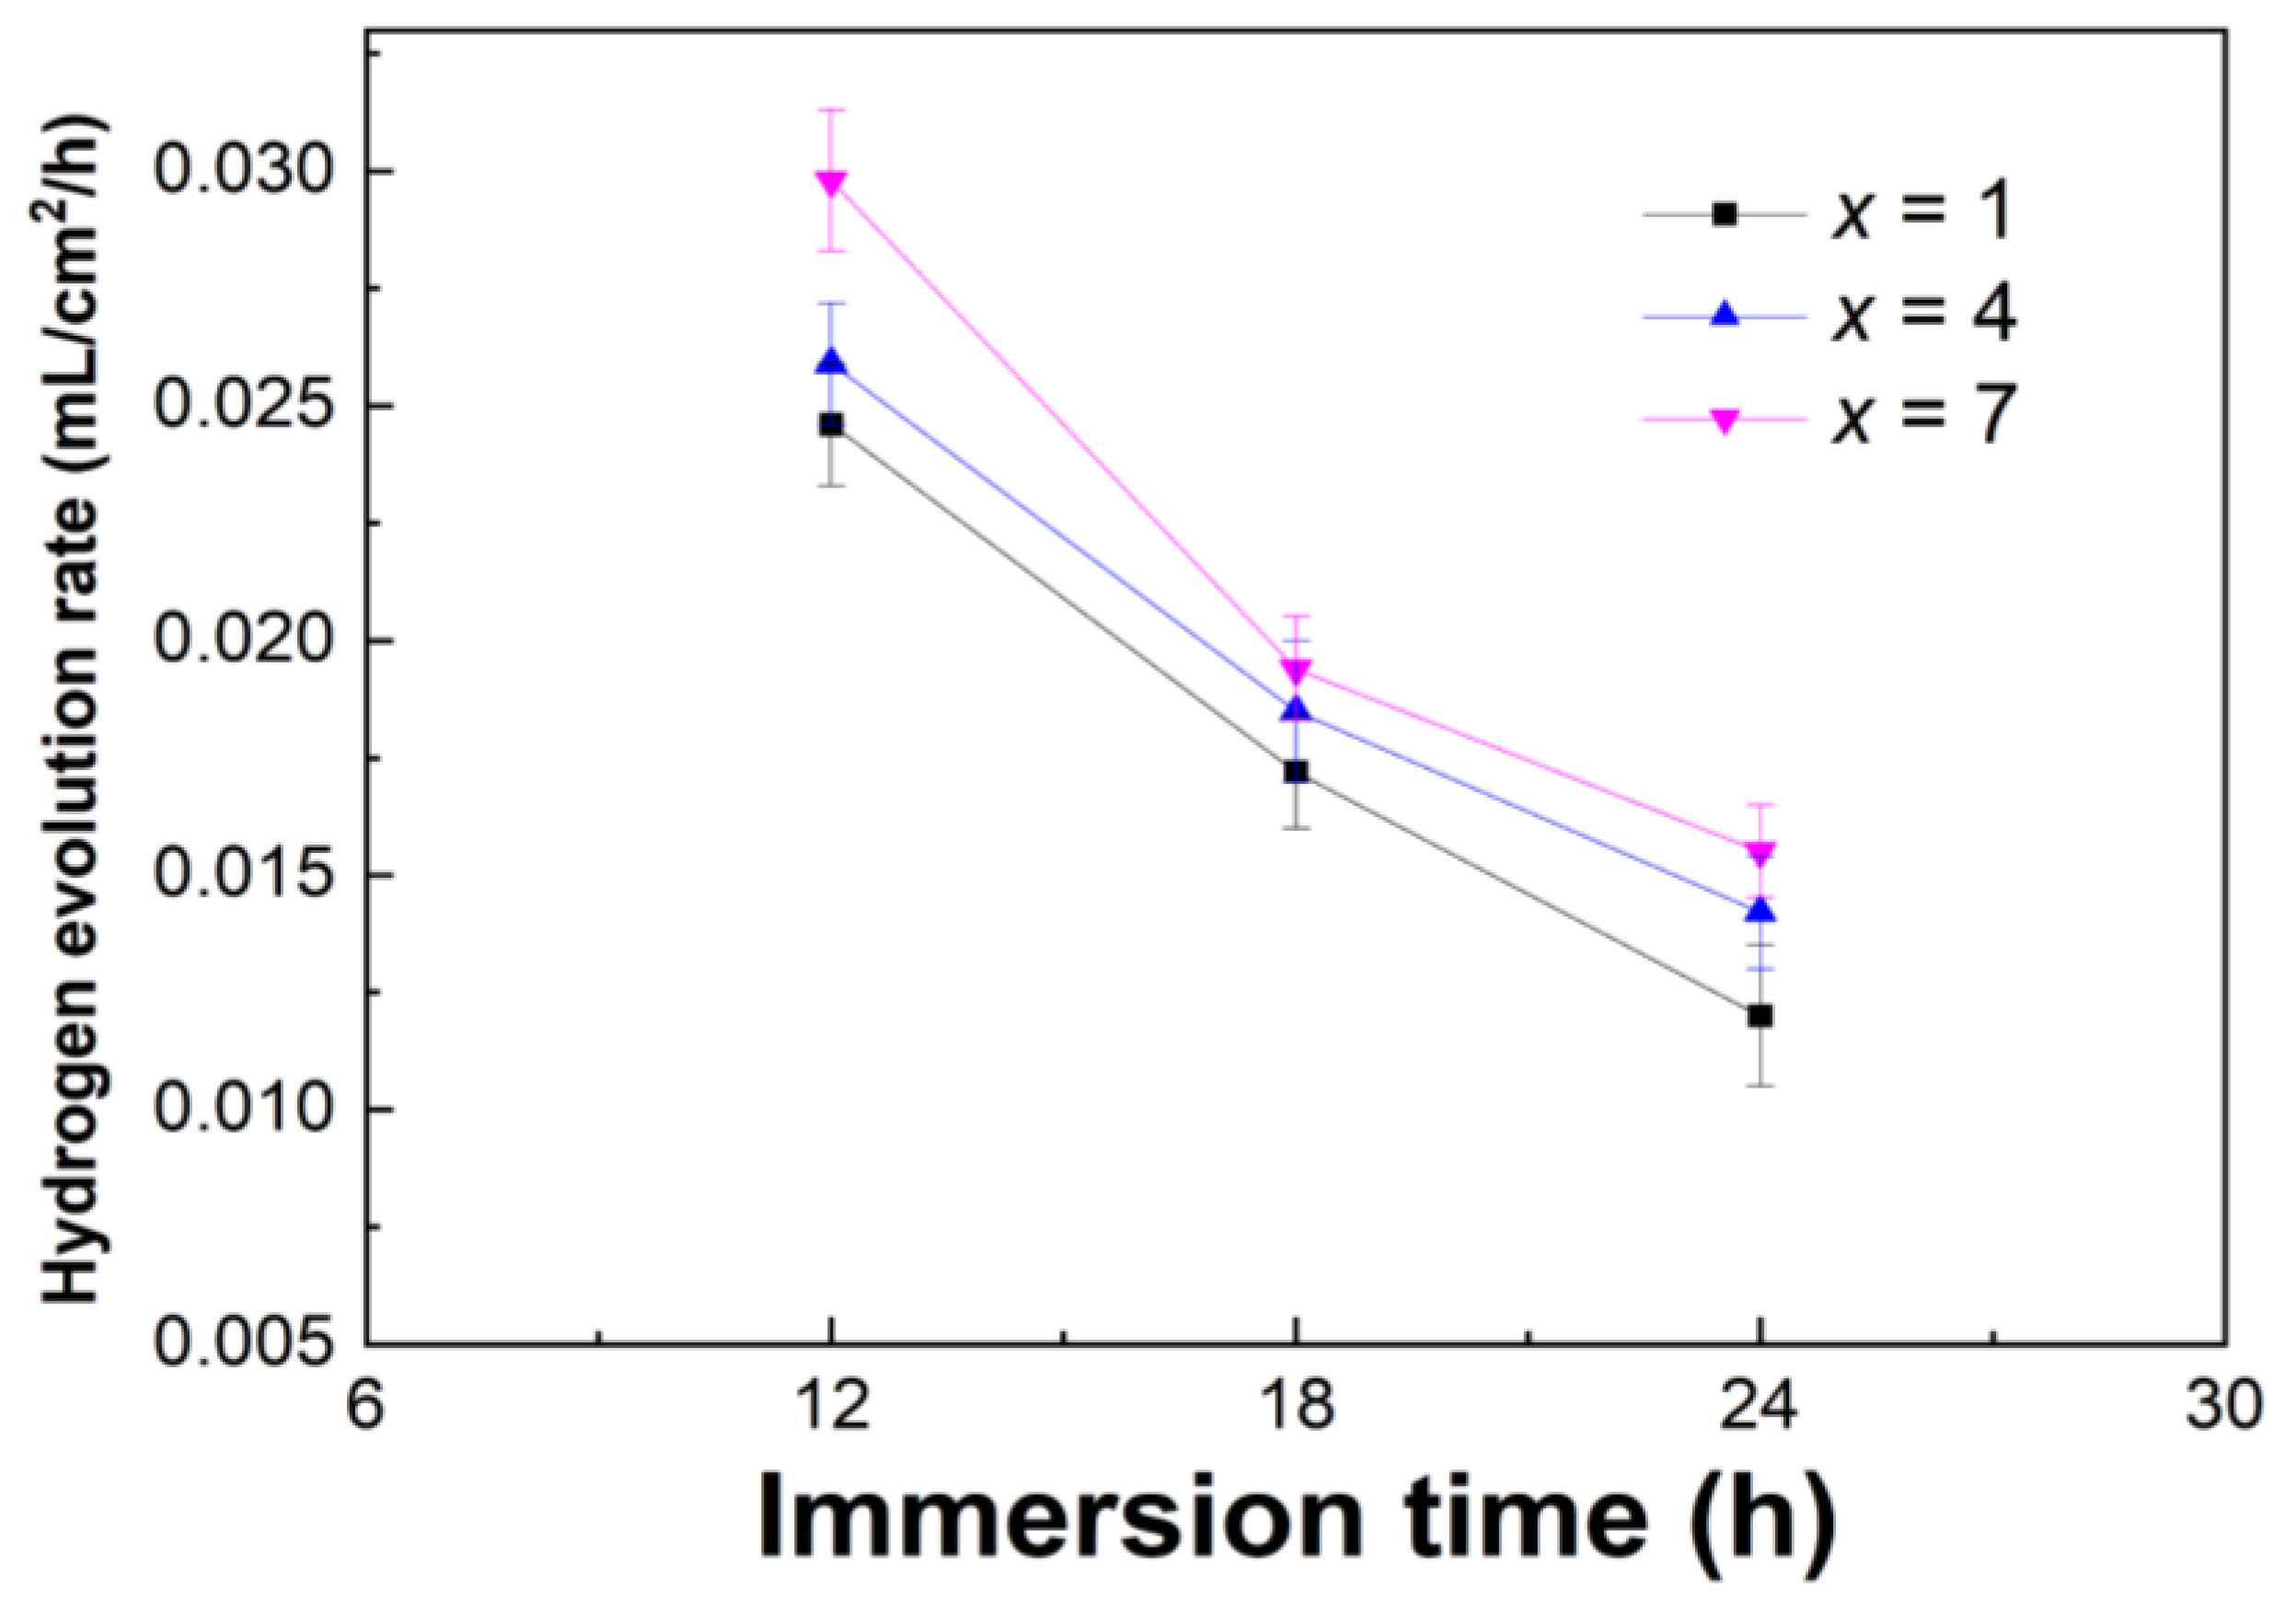
In proximity to these cracks, the white deposits on the sample surface are indicative of corrosion products. These deposits differ in appearance, indicating the varied corrosion behaviors driven by different Zn contents. The x = 1 alloy sample displays smaller, dispersed deposits, demonstrating a more uniform and slower corrosion rate. In contrast, the x = 4 sample shows deposits that coalesce into larger formations. This suggests pronounced localized corrosion or specific regions of the alloy being particularly susceptible due to microstructural differences. Conversely, the x = 7 sample displays fragmented portions of the larger deposits observed in the x = 4 sample. This fragmentation may result from aggressive corrosion dynamics, possibly due to factors such as rapid hydrogen evolution or intense localized corrosion. As illustrated in
Figure 13, the x = 7 sample demonstrates an increased hydrogen evolution rate compared to the x = 1 sample between the immersion periods of 12 h and 24 h, further indicating these aggressive corrosion dynamics. It is interesting to note that the corrosion rate decreases over time for all samples, which can be attributed to the accumulation of corrosion products on the sample surfaces.
3.9.2. EDX Mapping Analysis of Corrosion Products
The EDX mapping analysis in
Figure 14 indicates that the white deposits (shown in
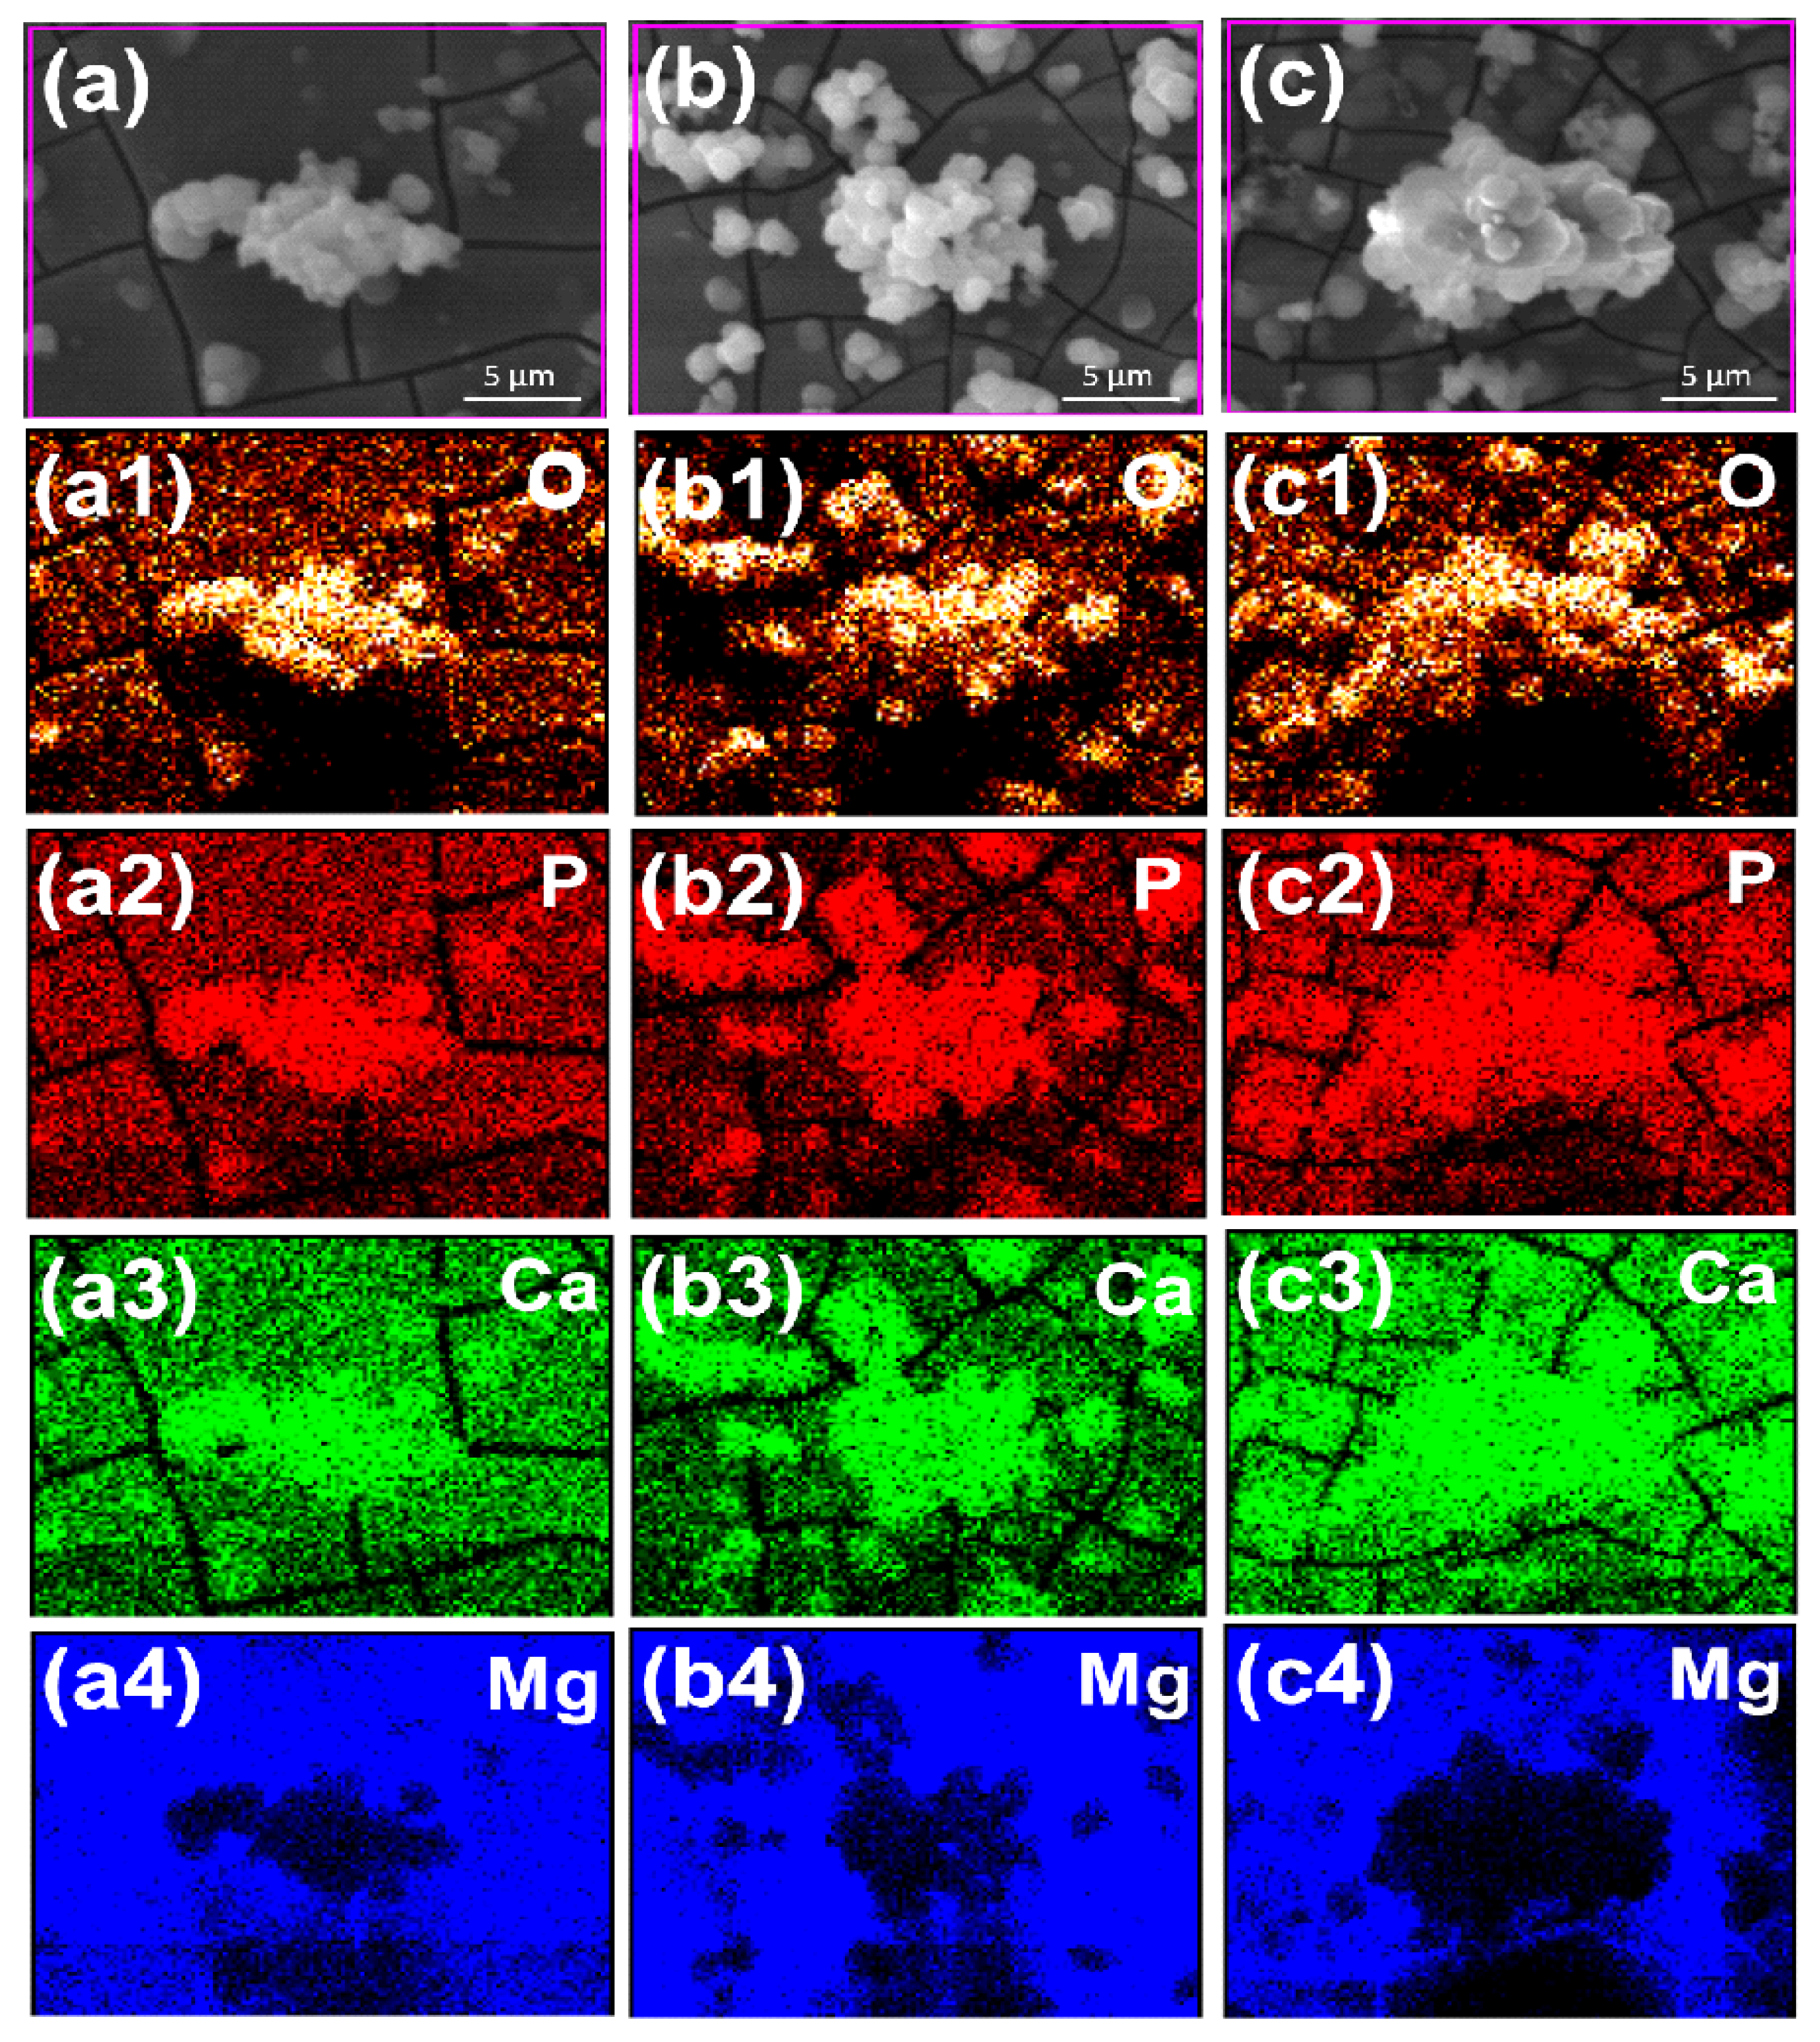
Figure 12) predominantly consist of O (displayed as brown), P (red), and Ca (green). In contrast, there is a reduction in the Mg content (blue). The coexistence of P and Ca suggests the potential formation of various calcium phosphate compounds, such as monocalcium phosphate (Ca(H₂PO₄)₂), dicalcium phosphate (CaHPO₄), tricalcium phosphate (Ca₃(PO₄)₂), and hydroxyapatite (Ca₅(PO₄)₃OH). However, inferring the formation of HA only based on these observations is speculative. In the areas adjacent to the white deposits, where the blue hue is more densely populated, there is a clear indication of increased Mg concentrations. The accompanying colors of brown, red, and green in these areas correspond to O, P, and Ca elements. Such areas are likely to comprise compounds such as magnesium hydroxide (Mg(OH)₂), magnesium phosphate (Mg₃(PO₄)₂), other calcium phosphate derivatives, and oxides, predominantly MgO. Further research will be necessary to determine these postulated compounds.
For successful HA formation on the Mg-xZn-0.2Mn surfaces, dome-shaped Ca-P compounds are essential. Their consistent presence ensures that the sample surfaces are shielded from hydrogen gas, which has the potential to disrupt the corrosion products [
61]. The results of immersion tests indicate that the x = 7 sample is less suitable for stable HA formation because of its rapid hydrogen release, which can disturb the consistent deposition of Ca-P compounds. However, given the short immersion duration of 24 h, it is premature to conclude the HA formation potential of the x = 1 and x = 4 samples. An extended observation period will be necessary to offer a more comprehensive insight into these corrosion dynamics.


