Mechanical Behavior of High-Performance Yarns Transversely Loaded by Different Indenters


1
School of Aeronautics and Astronautics, Purdue University, West Lafayette, IN 47907, USA
2
School of Materials Engineering, Purdue University, West Lafayette, IN 47907, USA;
*
Author to whom correspondence should be addressed.
Fibers 2018, 6(4), 69; https://0-doi-org.brum.beds.ac.uk/10.3390/fib6040069
Submission received: 11 August 2018
/
Revised: 18 September 2018
/
Accepted: 21 September 2018
/
Published: 23 September 2018
Abstract
:In this study, we performed off-axis transverse loading experiments to study the stress concentration developed in a high-performance yarn with different indenters. A universal testing machine was utilized to perform quasi-static transverse loading experiments on Twaron® yarns. Seven different round indenters possessing radius of curvature ranging from 0.20 to 4.50 mm were employed in the experiments. In addition, post-mortem failure analysis was performed on the recovered specimens via a scanning electron microscope. From the transverse loading experiments, the results showed that, as the radius of curvature of the indenters increased, the concentrated load decreased, causing the failure surfaces to change from a combination of kink band, snapped-back, and localized shear to only fibrillations. The concentrated stresses were predicted by a strain energy model when loaded by an indenter with a radius of curvature smaller than 1.59 mm. For indenters larger than 1.59 mm, the specimens failed in fibrillation, the concentrated stresses agreed well with the stresses predicted by quasi-static circular curved beam theory.
1. Introduction
High performance fibers are known for their superior mechanical properties, including a high Young’s modulus, a high ultimate tensile strength, a high impact resistance, and a low density. Due to these superior mechanical properties, high performance fibers have become prominent in ballistic protection applications such as turbine fragment containment systems and soft body armors.
The indicator of the ballistic performance for high-performance yarns is the critical velocity [1,2,3,4,5]. Critical velocity is defined as the projectile’s striking velocity that causes instantaneous rupture on the yarn specimen upon impact. A classical theory developed by Smith et al. [6] has been shown to be capable of predicting the critical velocity using only the axial mechanical properties. However, the critical velocity obtained from the experiments revealed a demonstrative reduction compared to the critical velocity obtained from theoretical analysis [3,4]. Moreover, ballistic experiments performed by Hudspeth et al. [2] revealed that, when a Kevlar® KM2 yarn was impacted by a razor blade and a 7.62 mm round projectile at the corresponding critical velocities, the failure surfaces of the fibers changed from shear to fibrillation. These results suggest that there is a transition radius of curvature that is causing fibers to fail only in fibrillation. However, the transition radius of curvature was not yet determined.
When impacted by a projectile with a large radius of curvature, the stress concentration developed in the yarn specimen was speculated to be caused by bending of the specimen [7,8]. For example, when a yarn was impacted by a 7.62 mm round projectile, the high-speed images revealed that the yarn deformed to the contour of the projectile prior to failure [9]. This deformation induced an additional component of axial strain caused by bending in the specimens [7].
The classical Smith theory assumes that bending is negligible, which may turn out to be the culprit of inaccurate prediction on the critical velocity. Therefore, in this study, to isolate the bending effects without the addition of inertia effects, quasi-static transverse loading experiments were performed on Twaron® yarns using seven different round indenters to study the stress concentration developed in the yarns. Post-mortem failure analysis was performed on the recovered yarns via a scanning electron microscope (SEM) to correlate the failure mode with the indenter radius and ascertain the critical radius of curvature. Finally, a strain energy model and a quasi-static circular curved beam model were used to predict the concentrated load and to compare with the experimental results.
2. Materials and Methods
The specimens used in this study were strands of Twaron® yarns extracted from a plain weave single ply CT 709 Twaron® in the warp direction. According to Teijin Aramid, this fabric is weaved using Twaron® 2040 yarn. This type of yarn consists of 1000 filaments with an average diameter of 9 µm. Plain weave fabric consists of warp and weft directions. An optical method was used to determine these directions in which the warp yarns typically exhibit more crimp and have thicker widths compared to weft yarns [10]. The specimens used for both uniaxial tensile and transverse loading experiments were extracted from the warp yarns for consistency.
2.1. Uniaxial Tensile Experiments
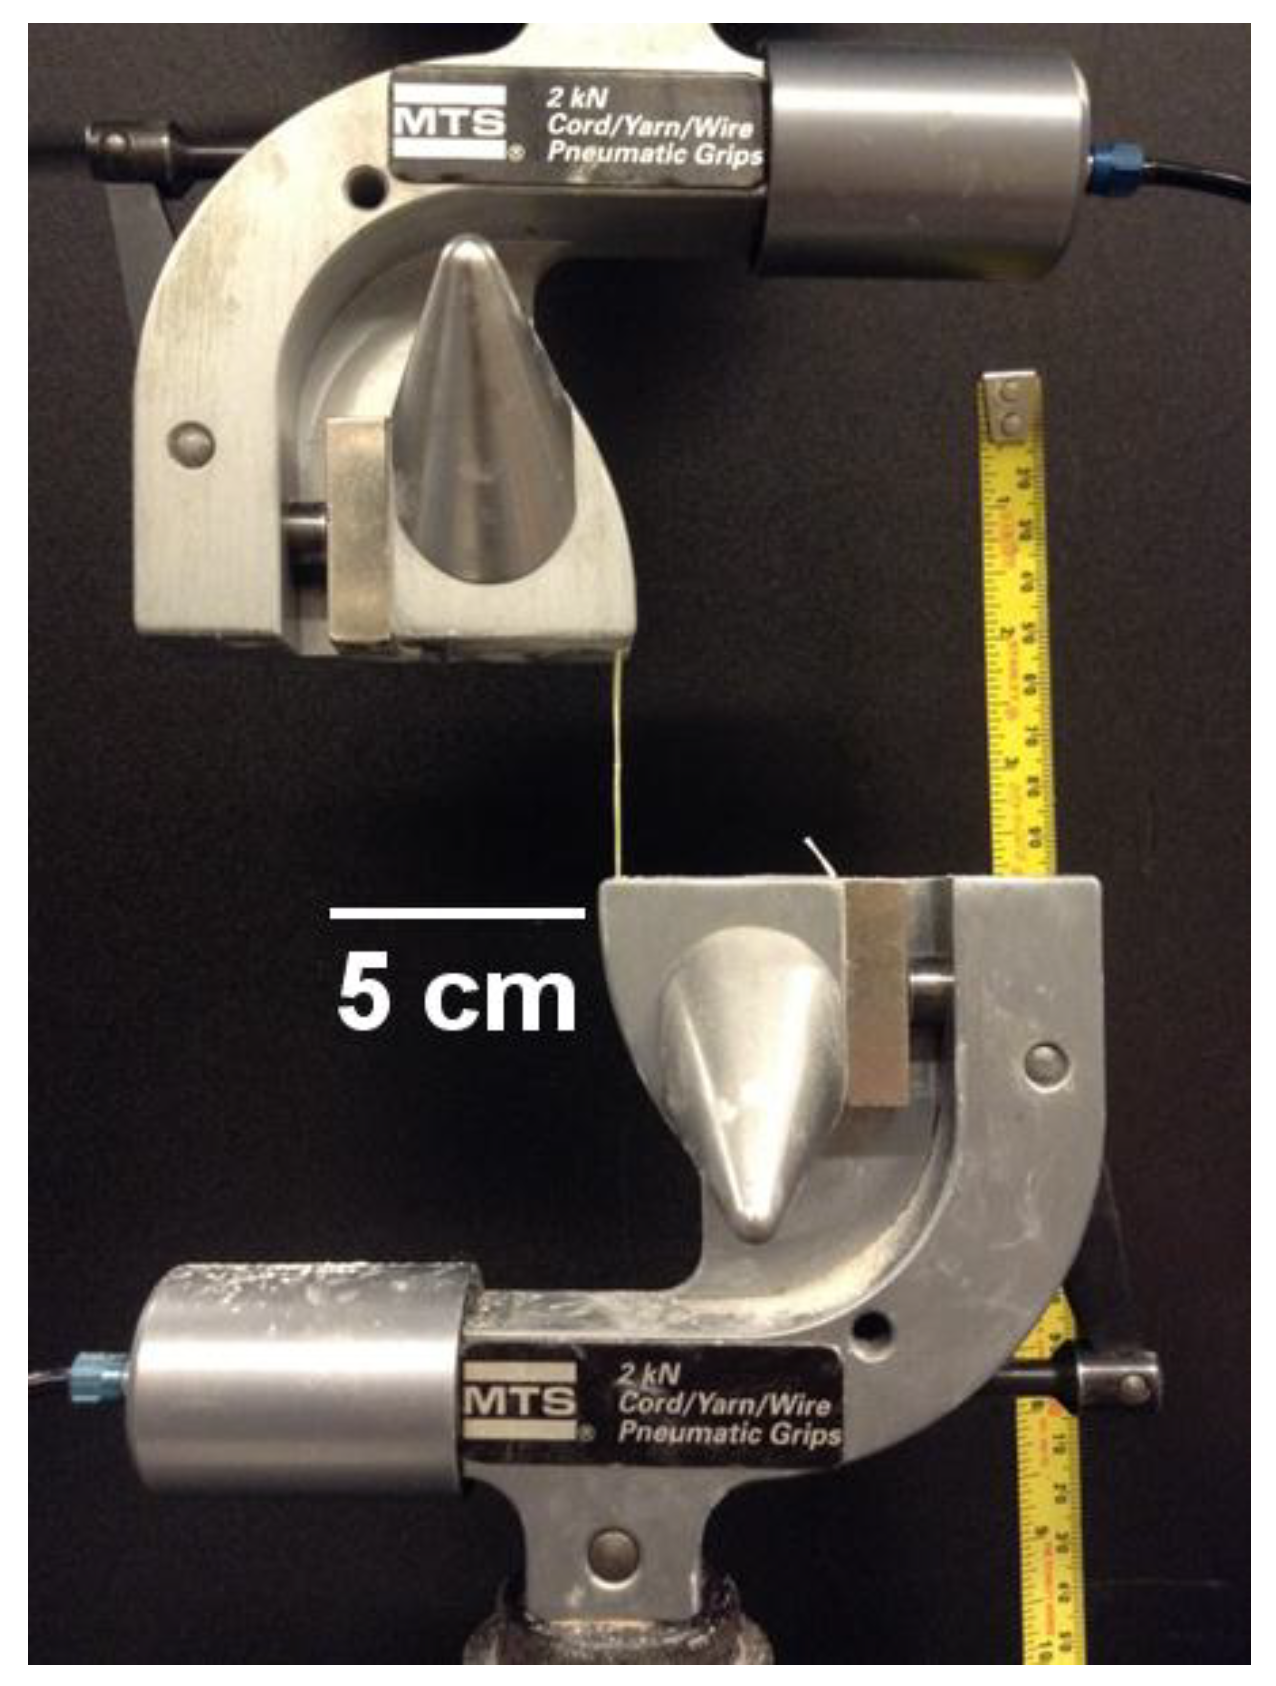
Uniaxial tension experiments were performed using a servo-hydraulic universal testing system (MTS 810) at a quasi-static strain rate of 0.01/s to determine the constitutive properties of the yarn specimens. Figure 1 shows the experimental apparatus used to perform the uniaxial tensile experiments. The experiments were performed with references to ASTM D7269 [11] and ASTM D2256 [12]. First, the specimen was attached to the bollard grip. To minimize the gage length effect, the gage length of the specimens including the curved region of the bollard grips was chosen to be around 190 mm [13]. Furthermore, to minimize the slippage between the specimen and the gripping platen, carbon tape was attached to the platen assembly. A slack-start procedure from ASTM D7269 [11] was deployed in the experimental procedure to ensure that pre-tension on the specimen was minimal. When the specimen was loaded from the slack condition, the load remained zero initially and increased linearly upon loading. The point where the slope of the load history changed from zero to linear was set at the starting point of the experiments. Ten repeated experiments were performed to obtain the mechanical properties and their levels of scattering.
2.2. Transverse Loading Experiments
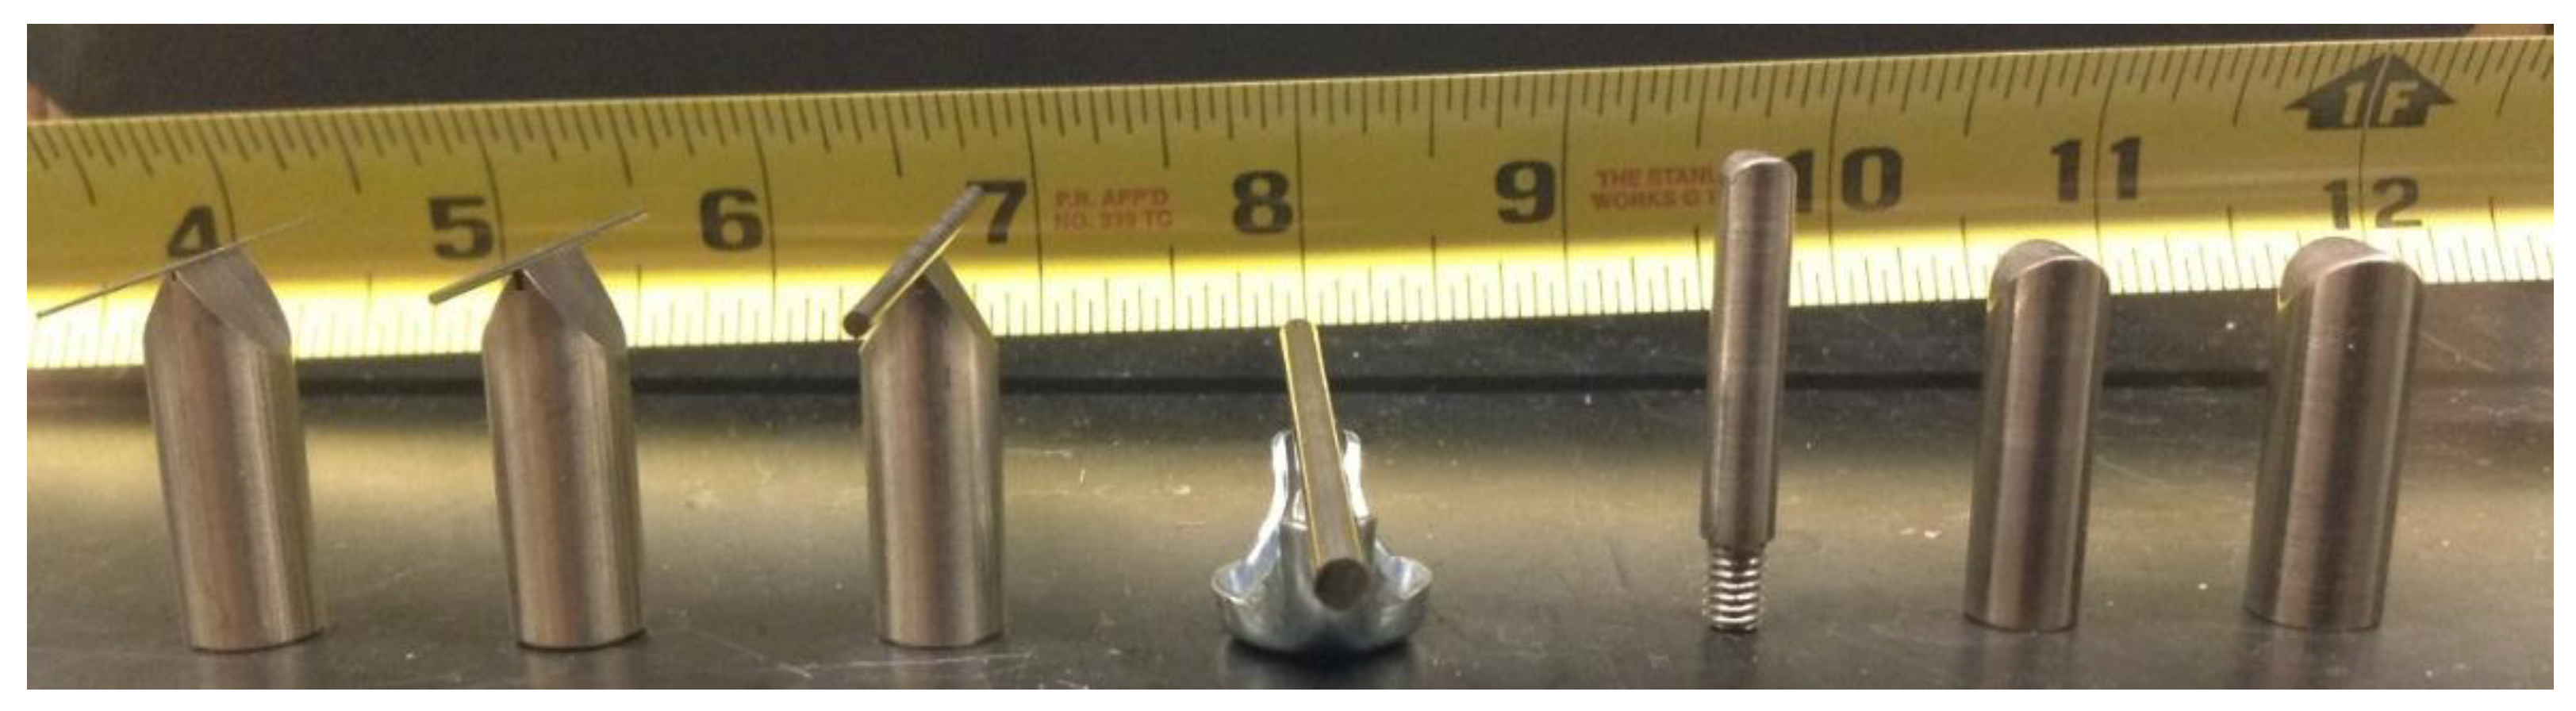
Transverse loading experiments were performed on the Twaron® yarns to determine the effect of the radius of curvature on the concentrated load developed in the yarns. Figure 2 presents the seven different round indenters used in the current study.
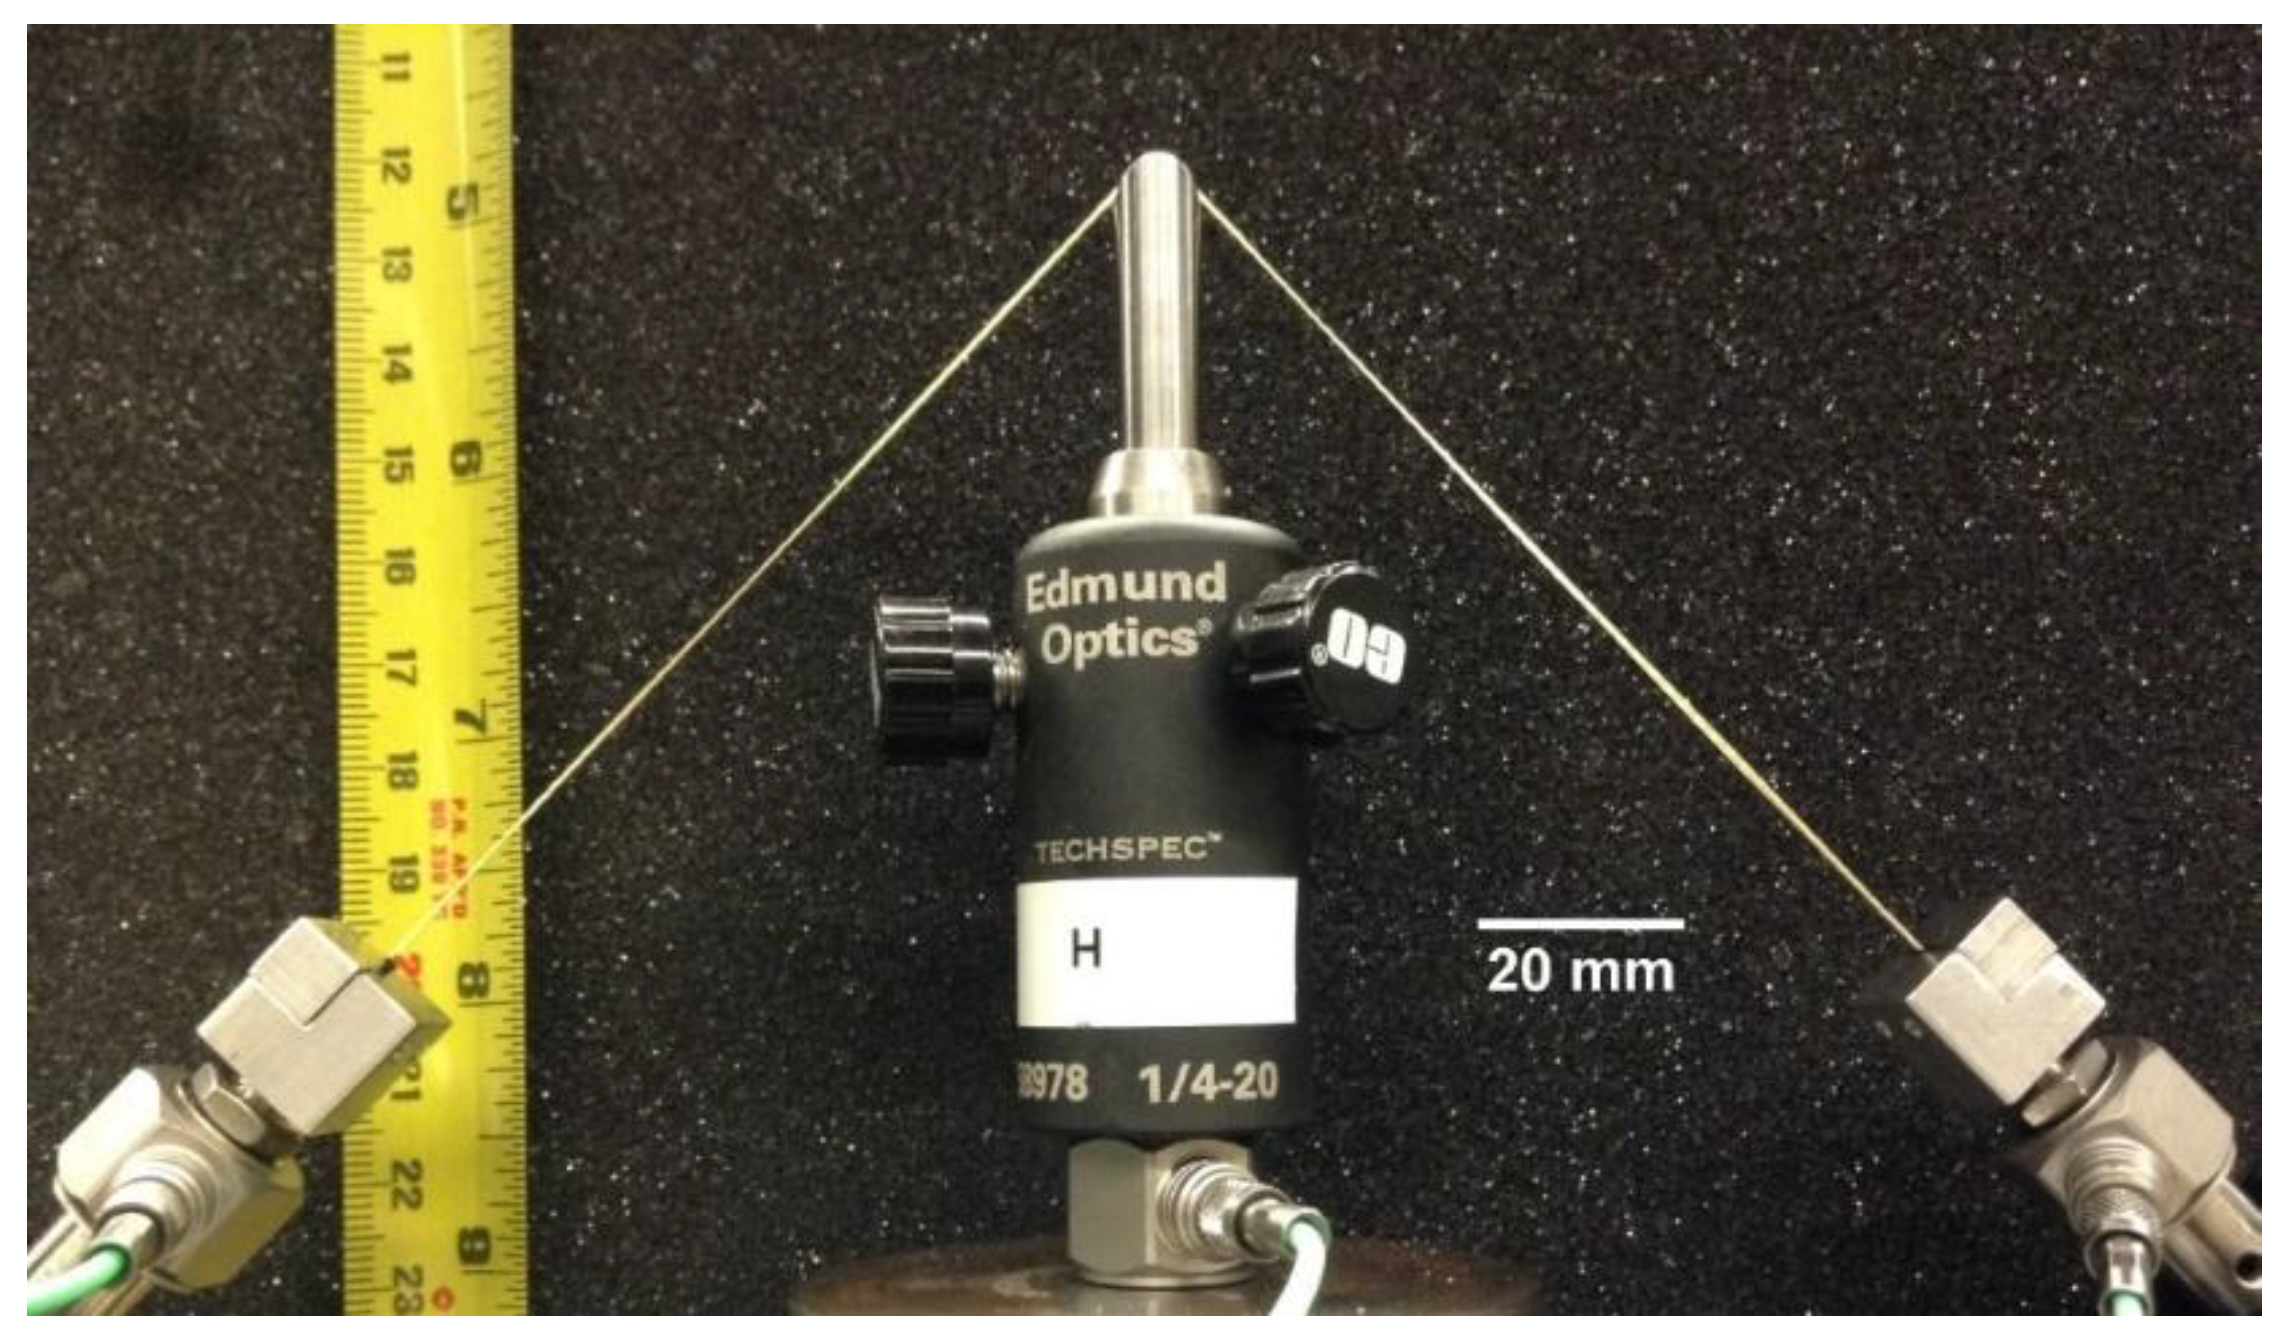
All of the indenters were made of 316 stainless steel with radii of curvatures of 0.20, 0.40, 0.79, 1.59, 2.50, 3.81, and 4.50 mm. The three largest indenters were made by machining precision steel rods into round indenters with their corresponding radii of curvatures at the tips, as shown on the right side in Figure 2. On the other hand, the four smaller round indenters were made by placing the precision ground dowel pins on top of the pin holder, as shown on the left side in Figure 2. These pin holders prevented the dowel pins from bending during the experiments. A new dowel pin was used in every experiment to ensure the respective radius of curvature remains the same across the experiments. Similar to uniaxial tensile experiments, the gage length used in the transverse loading experiments was 190 mm. To facilitate the attachment of specimens on the grips, both ends of the yarns were first sandwiched and glued with two pieces of paper cardboards using epoxy adhesive. The specimen was then gripped between the block grippers using fasteners. Of all the experiments performed, none of the specimens slipped out or failed at any of the grips which suggested that the end effects due to this gripping method was negligible. A load cell was mounted below the indenter to measure the transverse load. Two additional load cells were mounted at the grips to record the axial load. These load cells were mounted at 45 degrees (angle between the horizontal axis and the specimen), as shown in Figure 3. At a 45-degree starting angle, the corresponding breaking angle was similar due to the small failure strain in the yarn. This setup ensured that both load cells mounted at the grips indeed measured the axial load in the yarn [1,3]. Similar to uniaxial tension experiments, the slack-start procedure, including the determination of the starting point, was utilized to ensure that the pre-tension in the specimen, if any, was minimal [11]. The indenters moved up vertically at a speed of 1.9 mm/s. As a result, the yarns were loaded with an axial strain rate of 0.014/s. For each indenter, 10 repeated experiments were performed.
3. Results
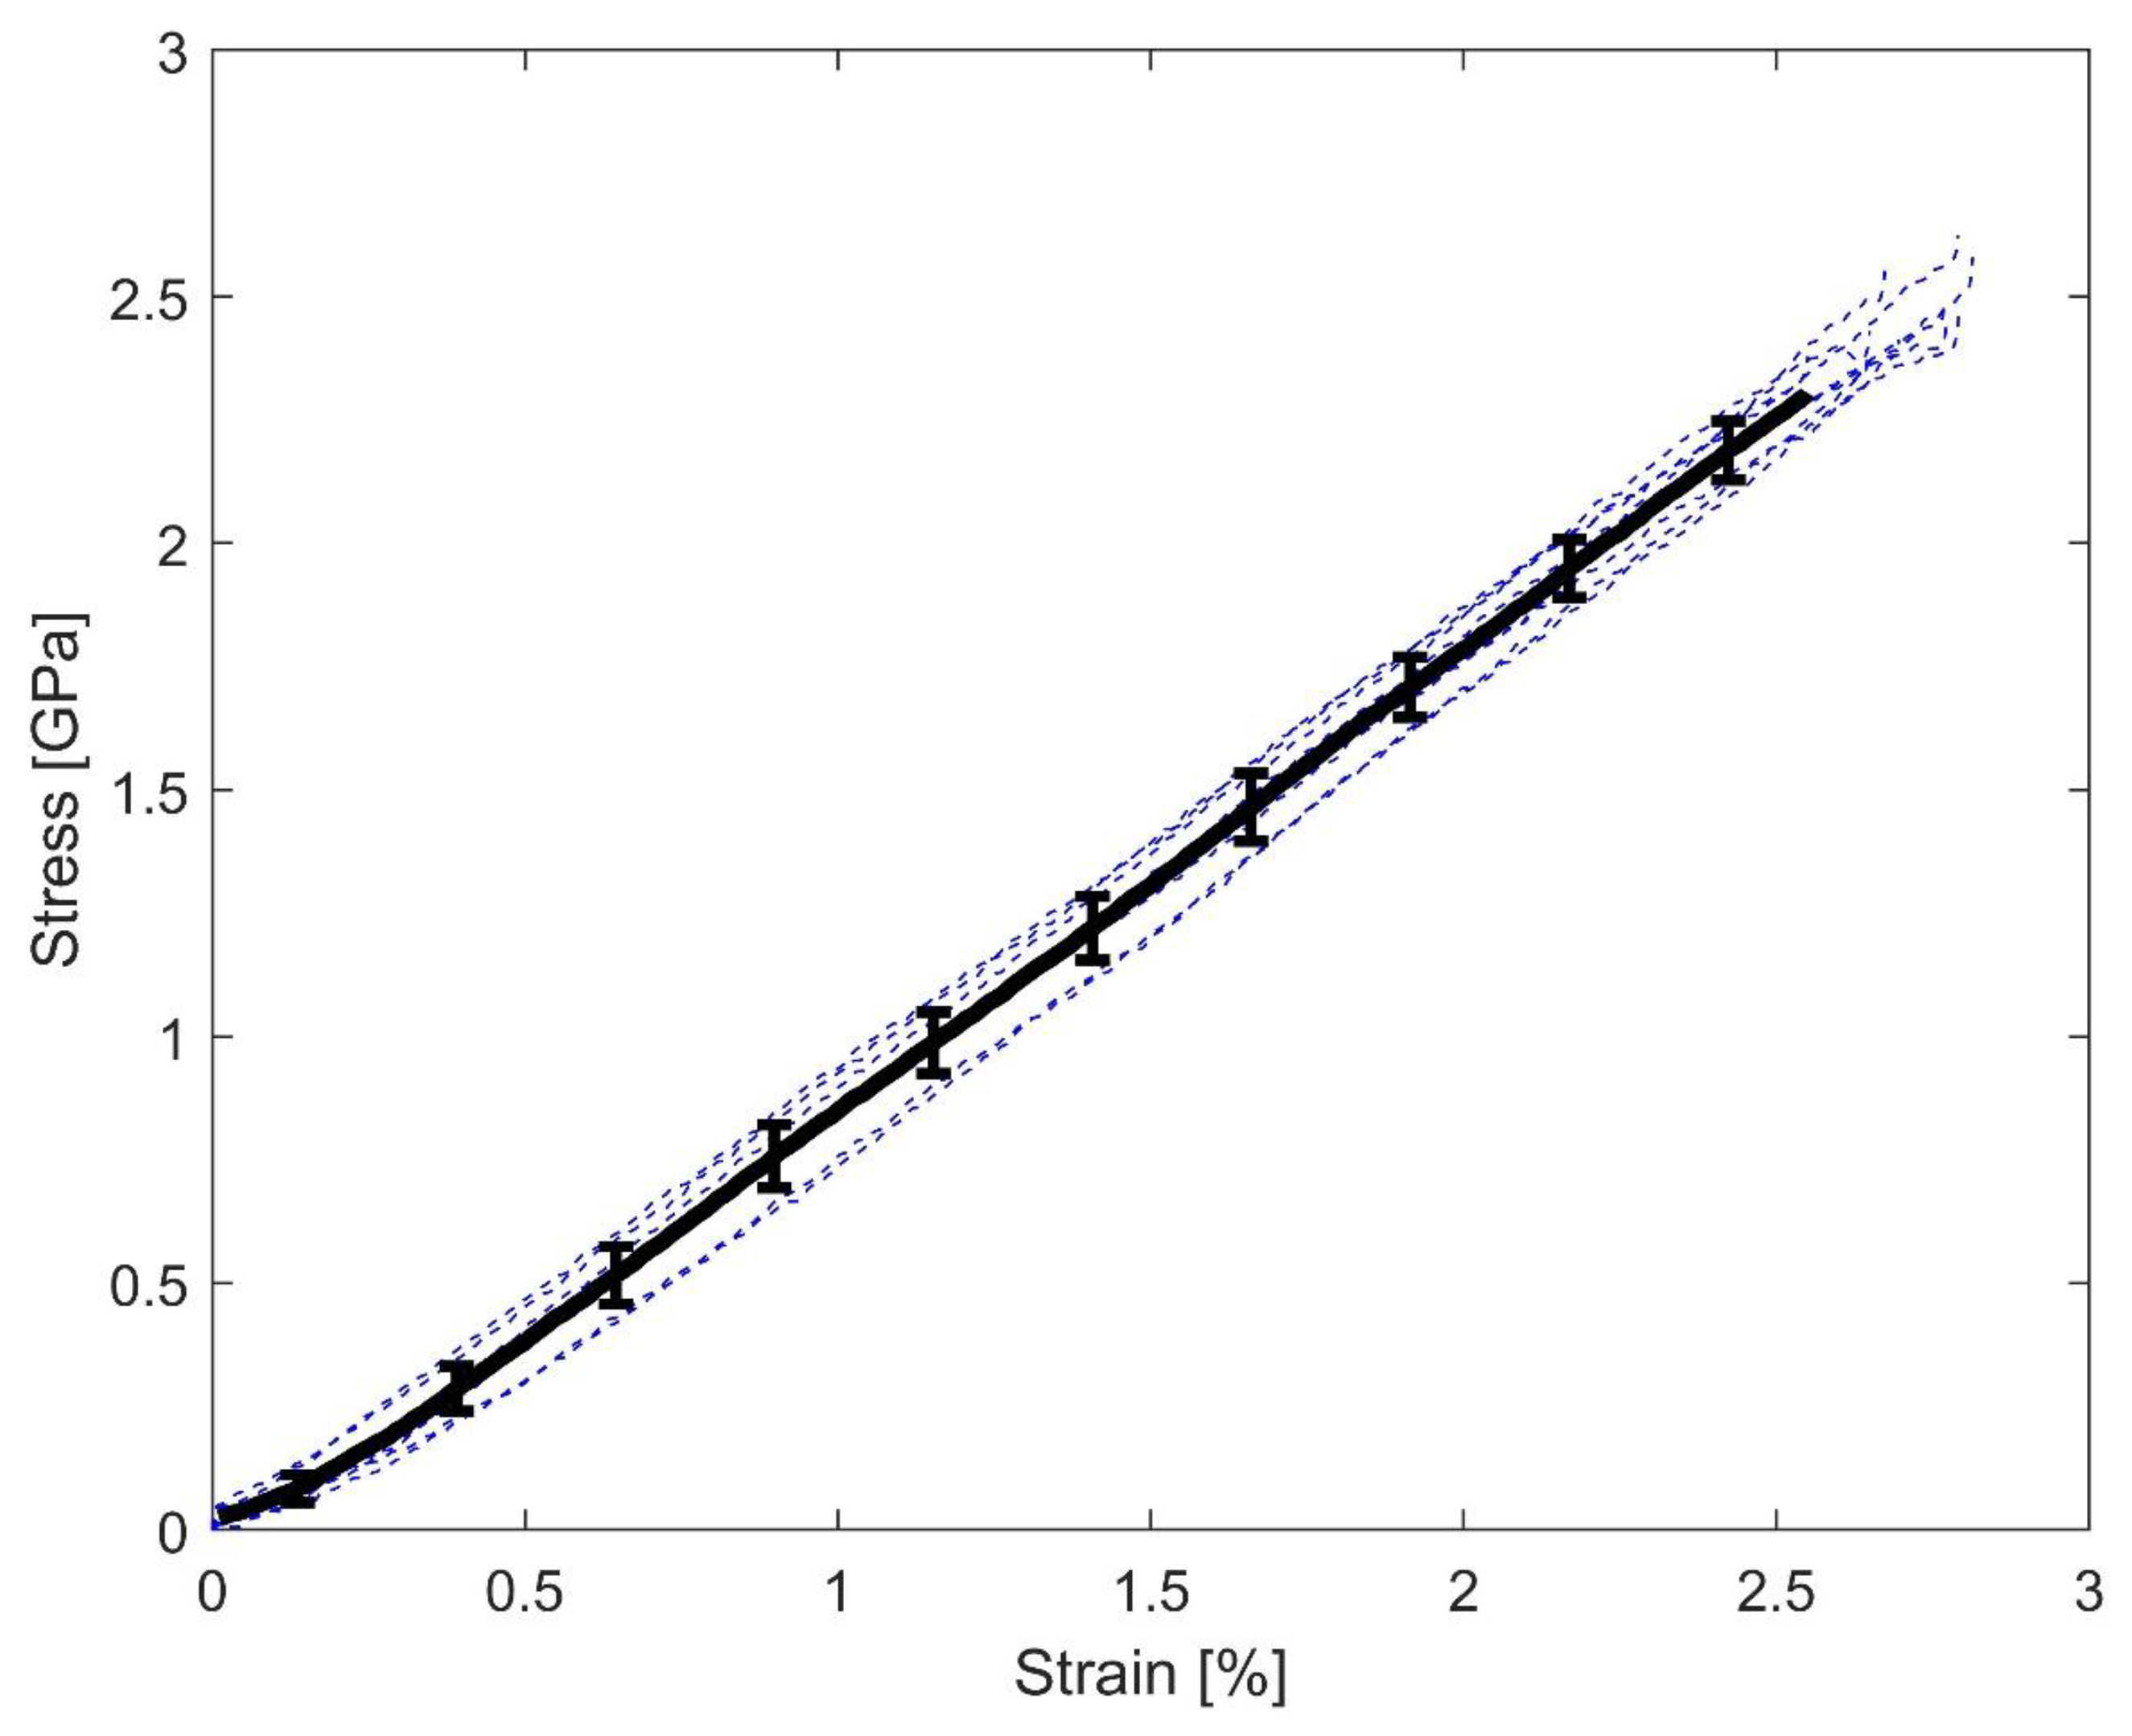
The axial tensile stress–strain properties of Twaron® 2040 yarns were obtained via uniaxial tensile experiments. The stress–strain curves for all 10 experiments are presented in Figure 4. Prior to rupture, the stress–strain relationship was linear, which was similar to those observed by Cheng et al. for Kevlar® [14]. The average and standard deviation values for the Young’s modulus (E), ultimate tensile strength (σuts), and ultimate tensile strain were 92.55 ± 1.66 GPa, 2.47 ± 0.08 GPa, and 2.71 ± 0.08%, respectively.
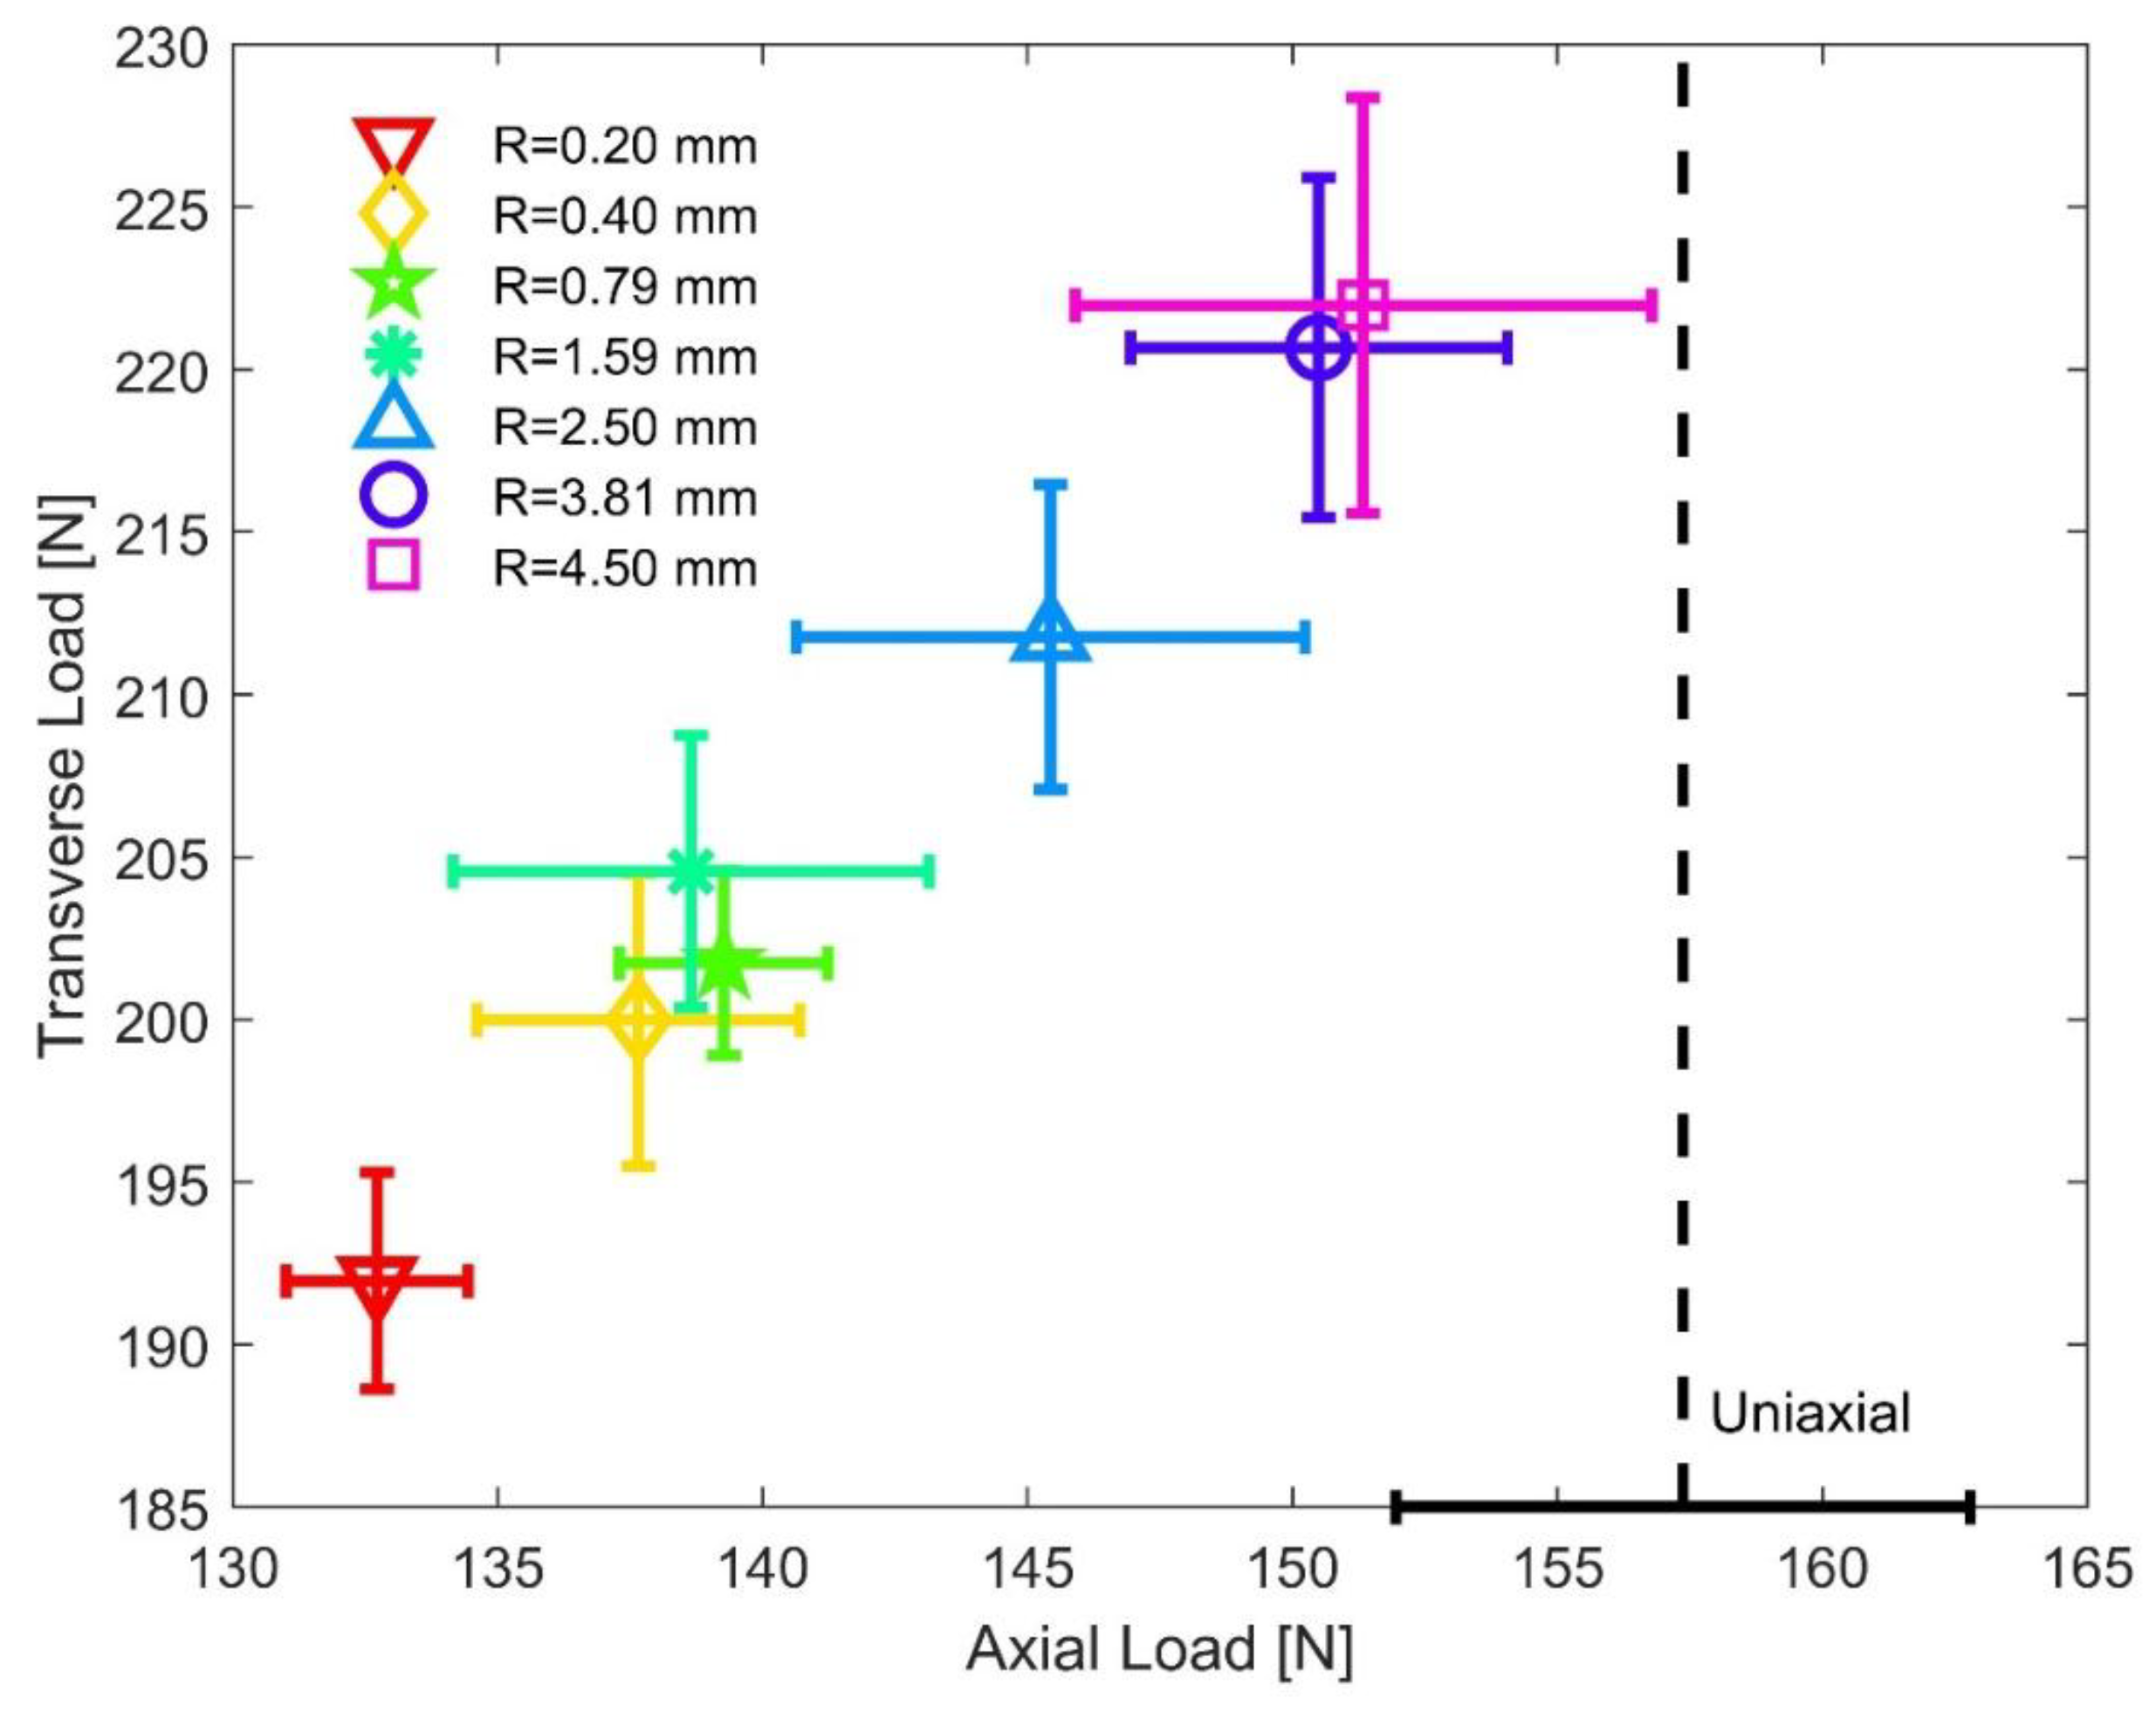
On the other hand, Table 1 lists the maximum axial load and maximum transverse load obtained from the transverse loading experiments for all seven cases. The results and errors reported in Table 1 are the average and the standard deviation values. In addition, the results are also graphically presented in Figure 5.
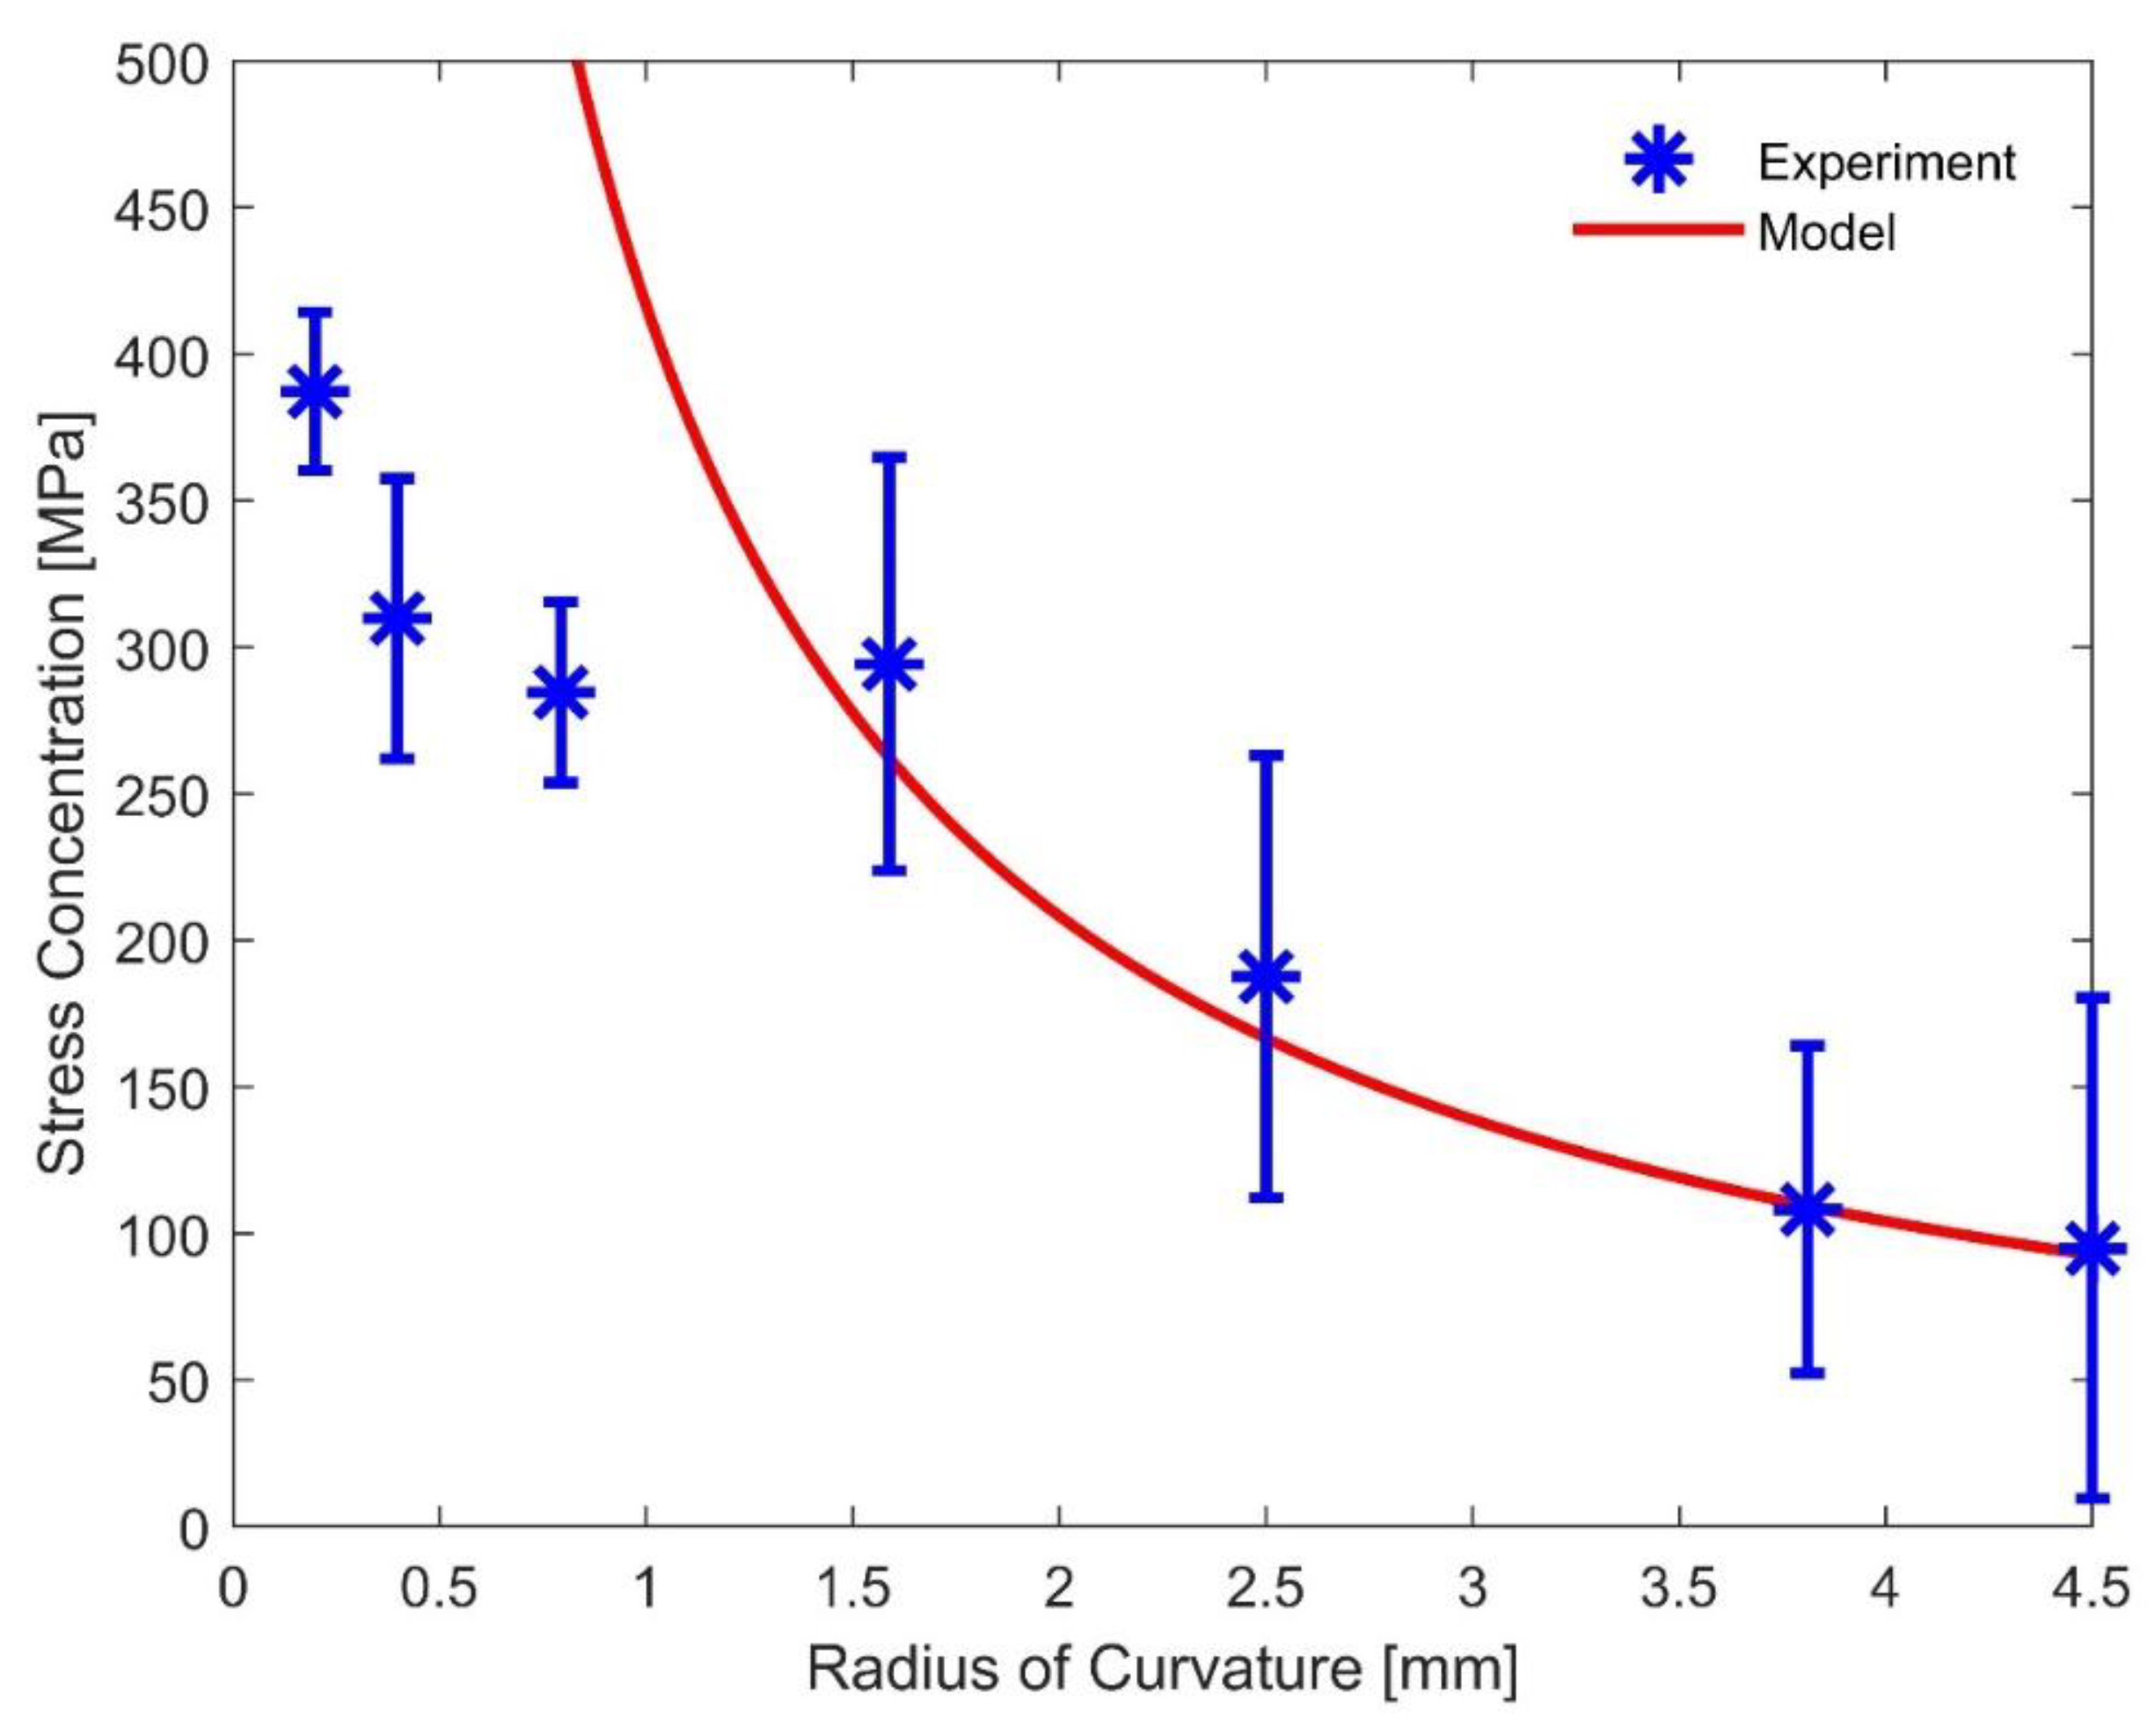
The results in Figure 5 show that the maximum axial loads under quasi-static transverse loading were lower than the ultimate tensile load for all cases. This phenomenon suggested that a stress concentration exists in a yarn under transverse loading conditions [2,3]. One approach to describe the stress concentration is to take the difference between the ultimate tensile load and maximum axial load and divide the result by the cross-sectional area of the yarn for each case. The corresponding results are presented in Figure 6.
As can be seen in Figure 6, the stress concentration decreased as the radius of curvature increased. This trend agrees with the experimental results obtained from Hudspeth et al. [1,2], who performed transverse loading experiments with a razor blade and a 7.62 mm round projectile. Furthermore, when transversely loaded by an indenter with a smaller radius of curvature, the load was localized in a concentrated area, leading to a decrease in standard deviation.
4. Discussion
In this section, we explore the models to predict the stress concentration developed in the yarns when transversely loaded by these indenters. The stress concentration developed in a Twaron® 2040 yarn when transversely loaded by an indenter possessing a radius of curvature between 0.20 and 1.59 mm was predicted by the strain energy model. However, for an indenter larger than 1.59 mm, the stress concentration was estimated by a curved beam model.
4.1. Strain Energy Model
By taking the difference between the specific axial strain energy from the uniaxial tensile experiments (uuts) and the transverse loading experiments (uax), the residual specific strain energy (ures) was determined for each case using Equation (1) [15]:
where Pax is the average maximum axial load from the transverse loading experiments and Ay is the cross-sectional area of a yarn. The strain energy was then calculated by taking the volume integral of the specific strain energy around the arc of the indenter as formulated in Equation (2):
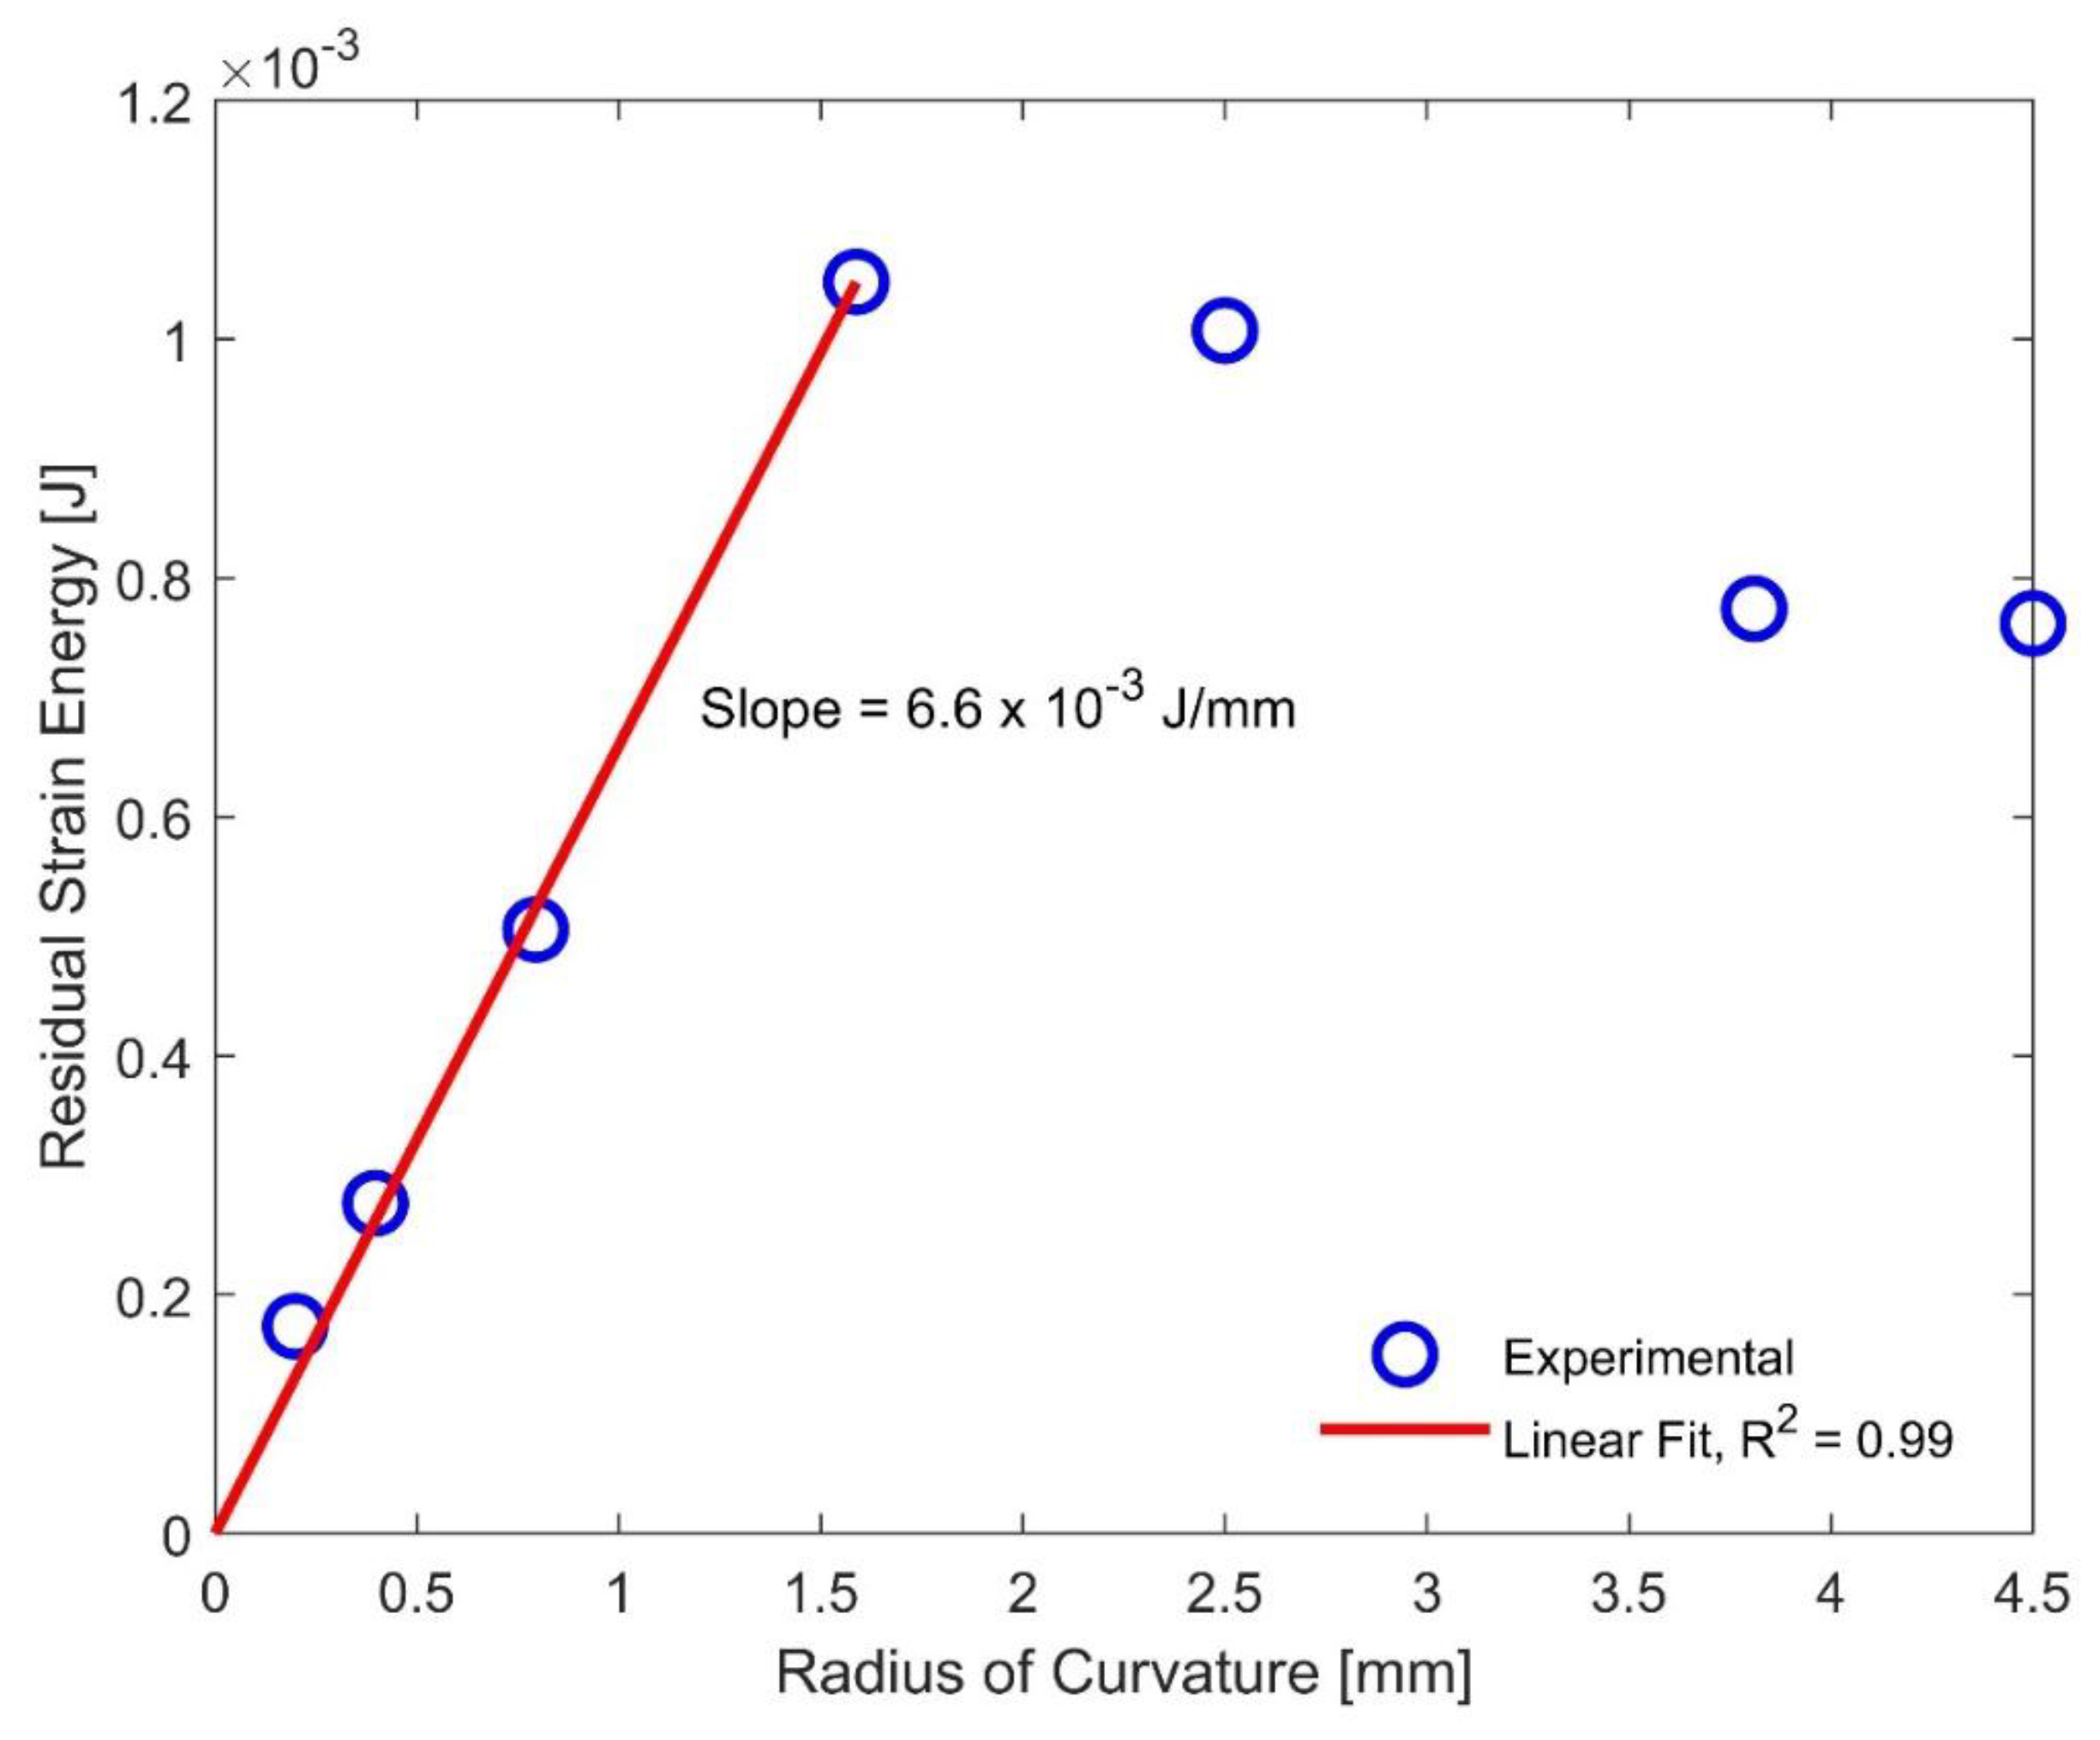
where R is the radius of curvature of the indenter, and is the arc length of the yarn on top of the indenter that was transversely loaded at 45°. The average residual strain energy, as a function of radius of curvature of the indenter, is presented in Figure 7.
In Figure 7, it can be seen that the residual strain energy for a small radius of curvature up to 1.59 mm forms a linear curve with a slope of 6.6 × 10⁻³ J/mm and a coefficient of determination (R2) of 0.99. These results also indicate that the stress concentration developed in a Twaron® 2040 yarn loaded transversely by an indenter possessing a radius of curvature between 0.20 and 1.59 mm can be predicted using Equations (1) and (2) together with the slope given in Figure 7. Additionally, from Figure 7, for the cases above 1.59 mm, the experimental data revealed a non-linear behavior. These results suggested that the failure mode may have changed when transversely loaded with a larger indenter. Thus, we used a curved beam model to explore the change in driving force behind the failure mode change.
4.2. The Curved Beam Model
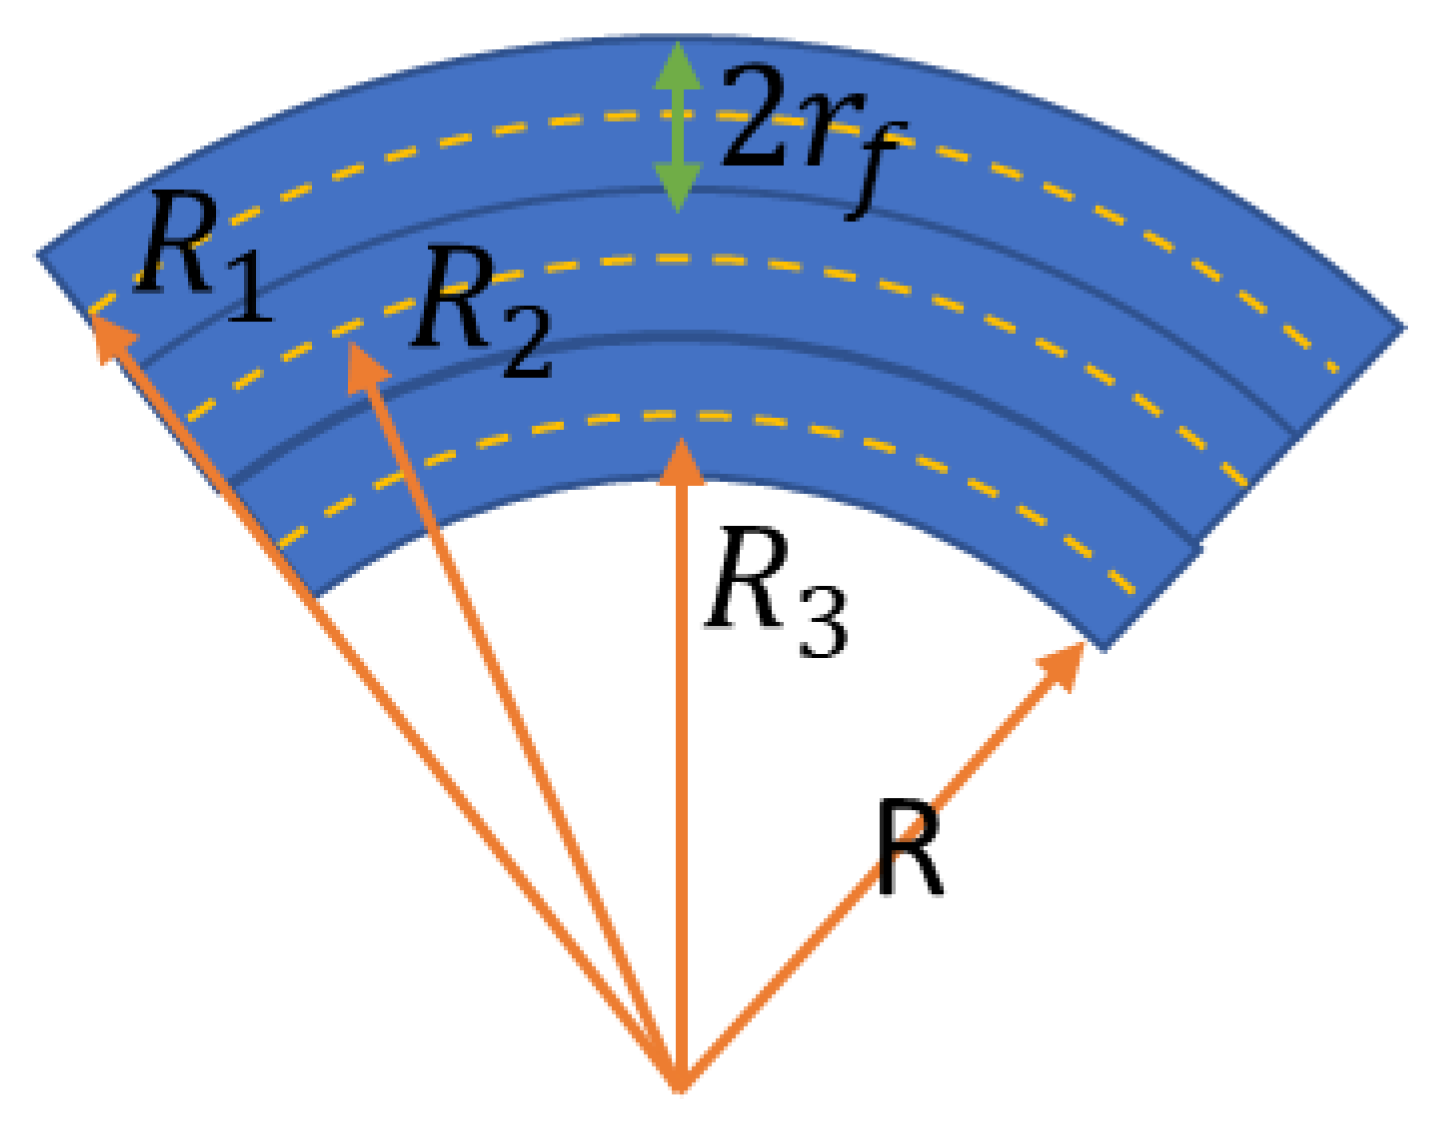
Quasi-static circular curved beam model was used to describe the stress concentration developed in the yarns when transversely loaded by a large radius of curvature indenter. Under transverse loading, the yarn was deformed to the contour of the indenter prior to failure. Even though Twaron® 2040 yarn consists of 1000 fibers, only 3 fibers are shown in Figure 8 for illustration purposes. When the radius of curvature is relatively larger compared to the fiber radius, the centroid axis is almost equivalent to the neutral axis where the engineering strain along each of these axes is zero [16].
The maximum bending strains that occur for each fiber at the outer surface are given in Equation (3) [16]:
where and indicate the bending strain and the radius of fiber, respectively. If the radius of curvature of the indenter is significantly larger than the radius of the fiber (i.e., ), the bending stress in each fiber along the axial direction may be approximated as the ratio of the radius of fiber to the radius of curvature as given in Equation (4).
According to Equation (4), when the radius of curvature of the indenter increases, the bending stress developed in the specimen decreases. Superimposing this prediction from Equation (4) into Figure 6, the quasi-static curved beam theory describes the experimental results on the stress concentration very well, especially when the radius of curvature is larger than 1.59 mm. The agreed results between the experiments and the model suggest that, under transverse loading, the stress concentration developed in the yarn is very likely to be caused by the bending stress. However, when the radius of curvature of the indenter was less than 1.59 mm, the theory overestimated the stress concentration developed in the yarn under transverse loading. This deviation could be the results of a failure mode change in the yarn caused by the change in the radius of curvature of the indenter for which the curved beam model does not account for. We thus examined the failure surfaces of the recovered yarns.
4.3. Failure Surfaces
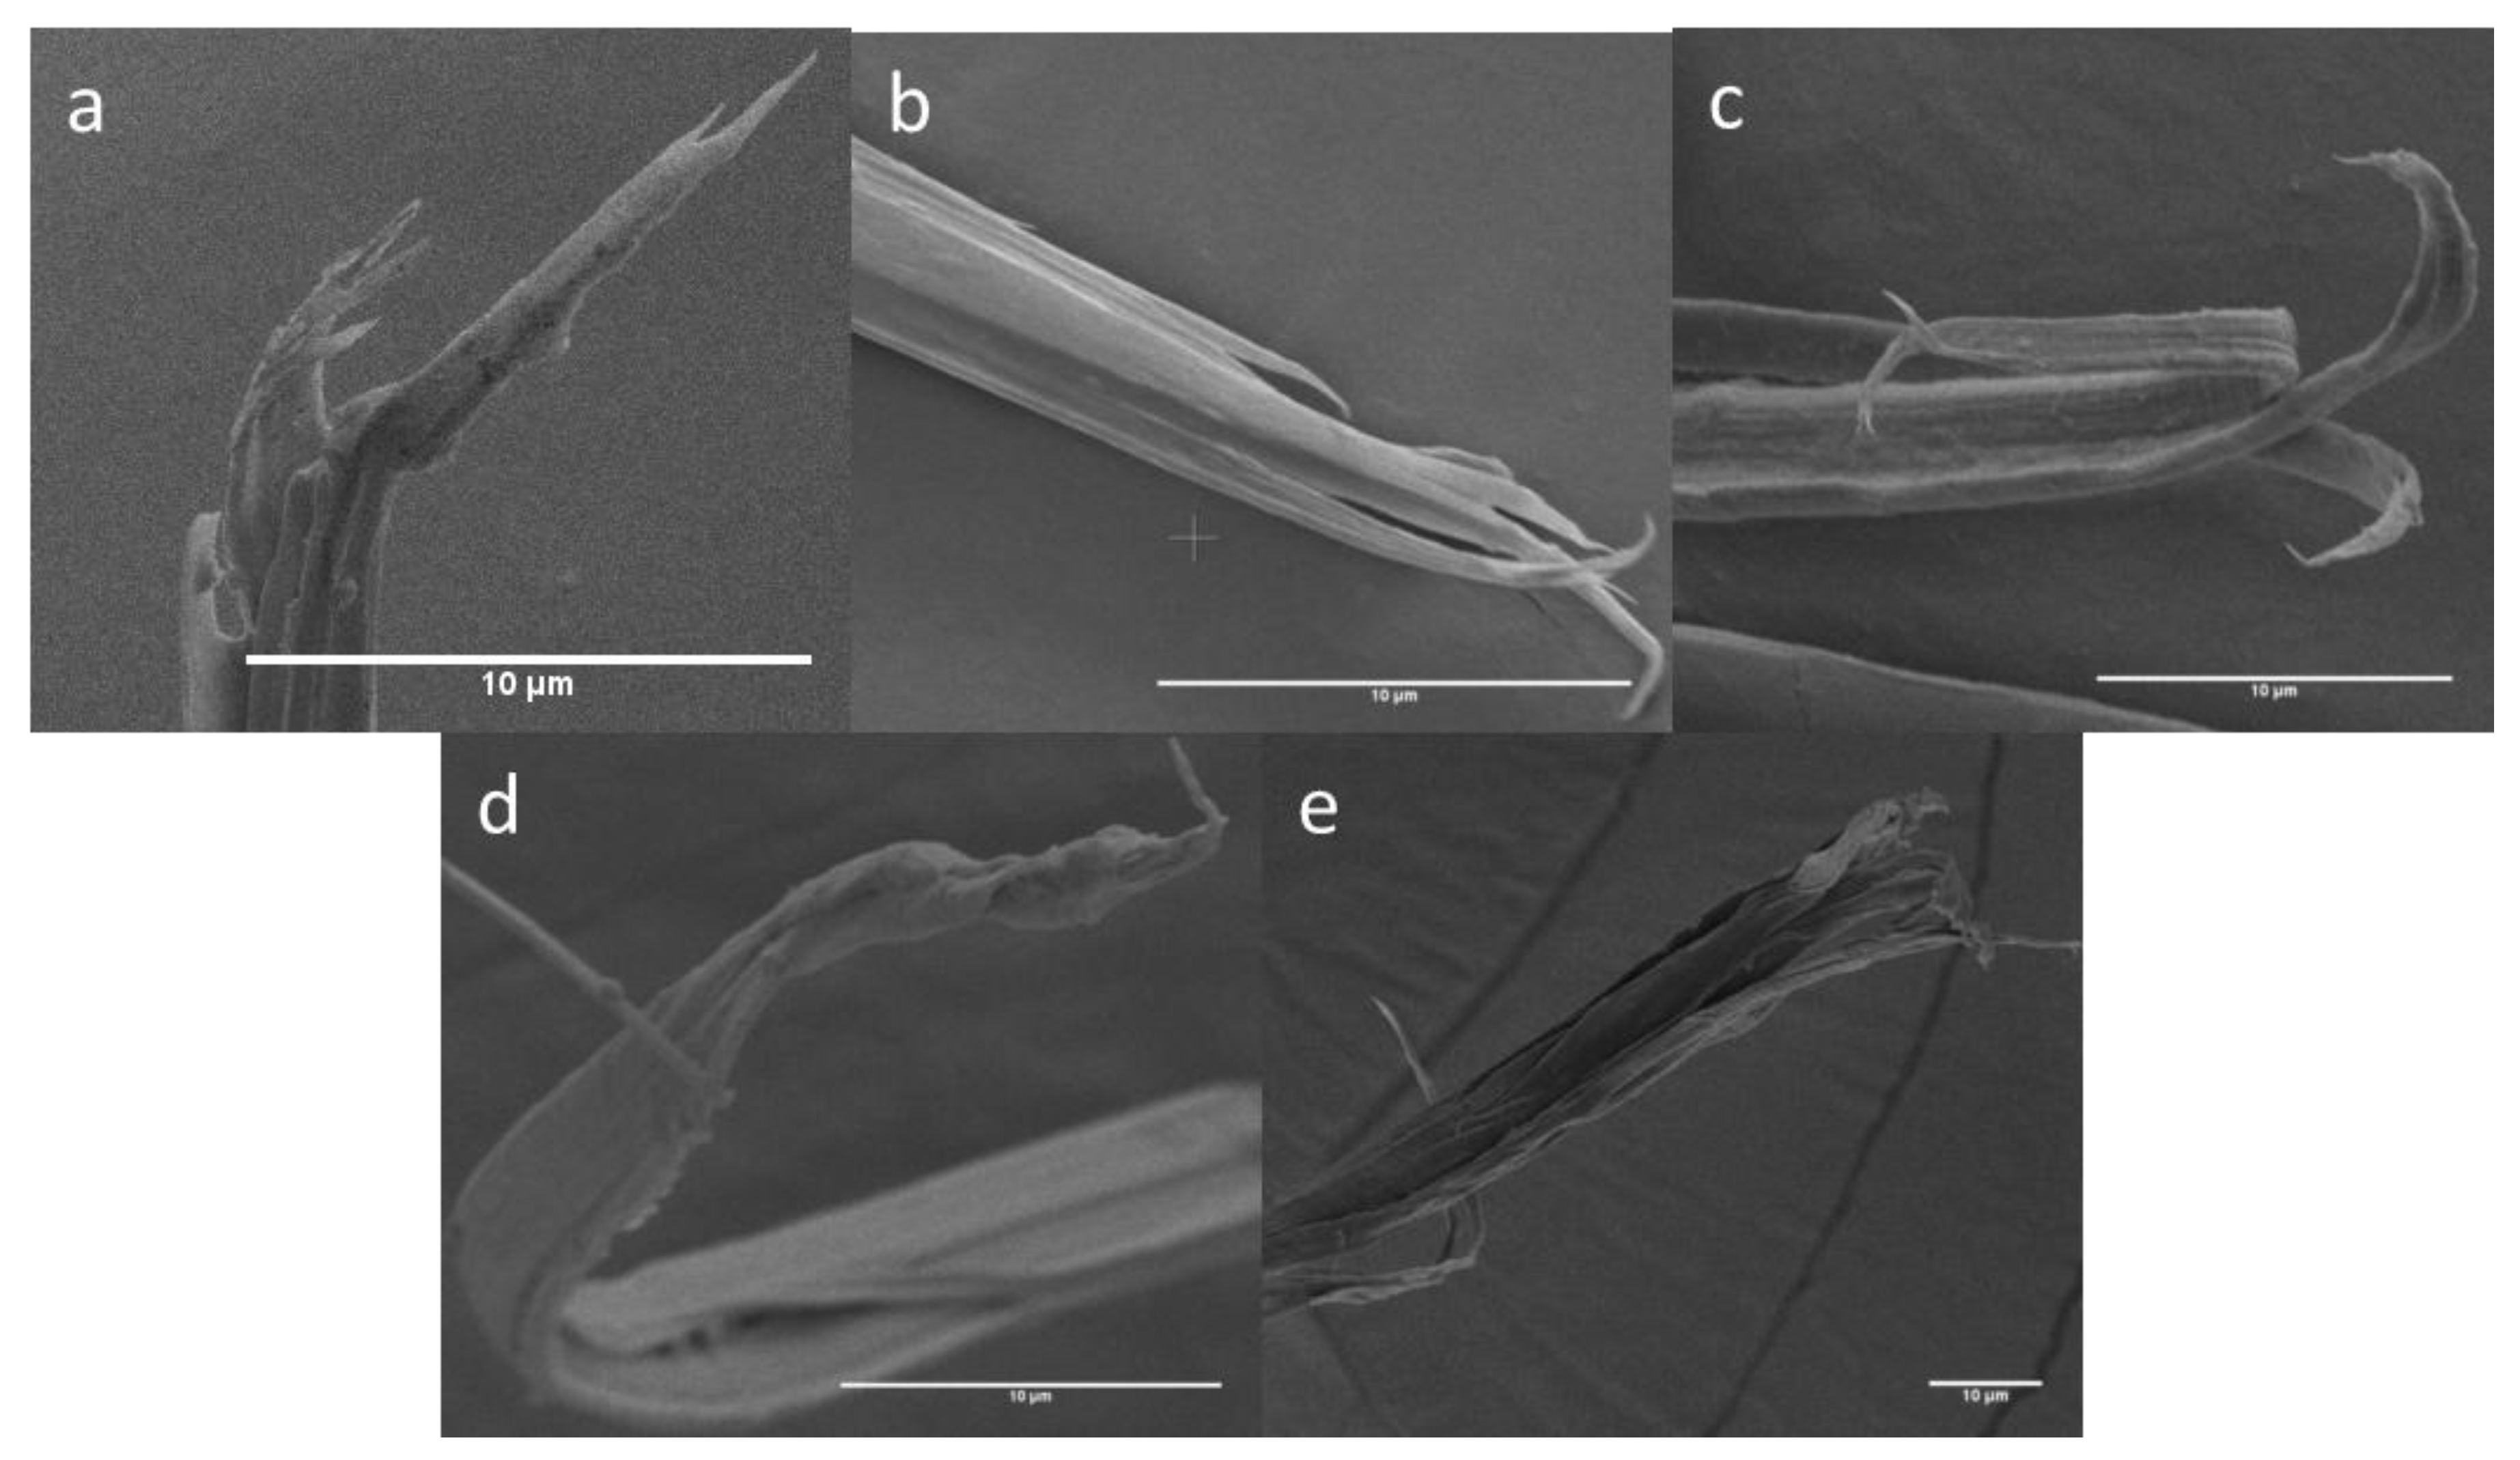
To understand how these yarns failed under transverse loading condition, an FEI Nova Nano scanning electron microscope (SEM) was used to examine the failure surfaces of the recovered specimens. An ETD detector was used for the SEM imaging. Furthermore, all the images presented were taken with an operating voltage of 5 kV (HV), a spot size of 3, and an average working distance of 5 mm. Figure 9 presents the post-mortem images of the recovered fibers that failed in fibrillation loaded transversely by five of the indenters, excluding two of the largest radius indenters.
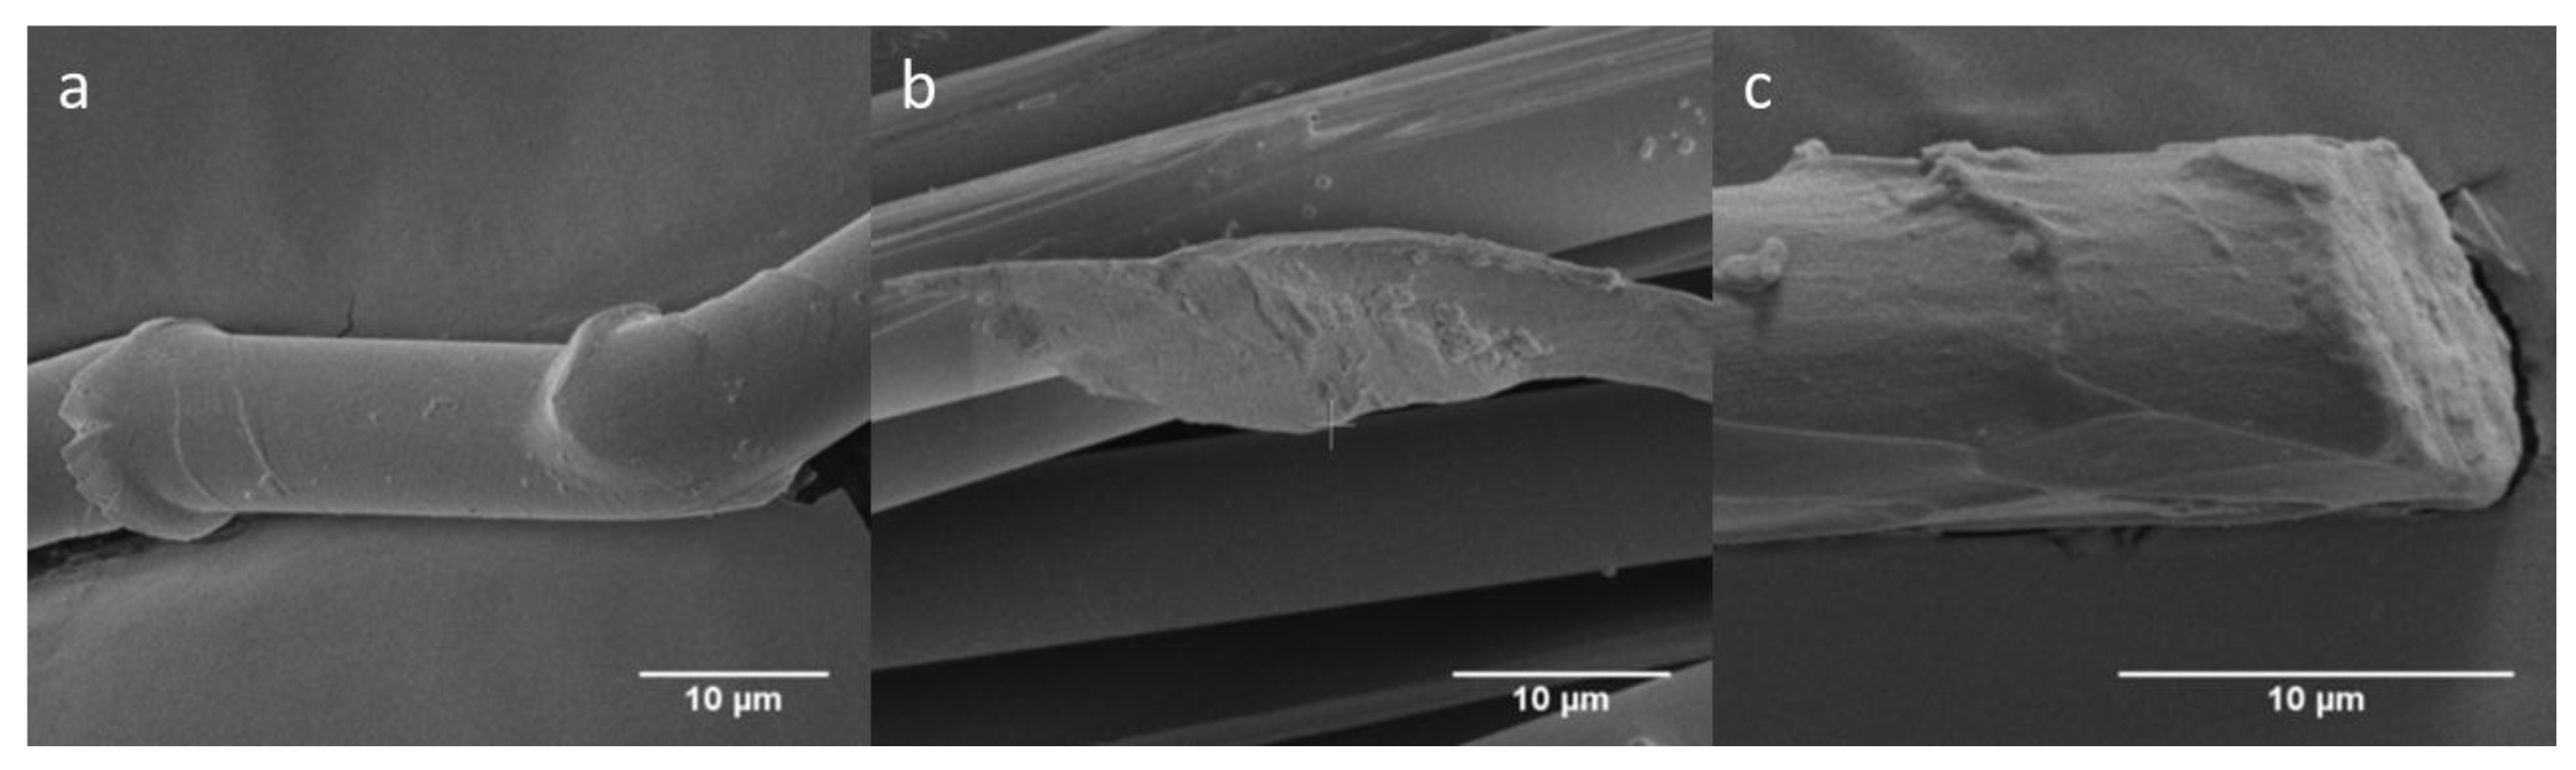
When loaded transversely by a 0.20 mm indenter, the fibers failed by axial splitting, causing them to fibrillate, as shown in Figure 9a [17]. At failure, the release of strain energy caused the snapping back behavior of the fibers as shown in Figure 10b [17]. The failure location then became a free end. To remain stress free at that location, a compressive load must be generated and propagated in the fibers, which led to buckling and created kink bands, as shown in Figure 10a [17]. In Figure 10a, it can be seen that the fiber, at one end, bent downward and, at the other, bent upward. This phenomenon suggested that the kink bands were formed after the fiber snapped back—not after it was severely bent. For severe local bending, both ends of the fibers should bend in the same direction, as sketched in Figure 8.
A similar failure mechanism was also observed when the yarn was loaded transversely by a 0.40 mm indenter. However, the failure surfaces at the end of some fibers were flattened, suggesting that the localized cutting occurred when the yarn was loaded transversely by such a projectile, as shown in Figure 10c. Such a localized cutting phenomenon was also observed by Hudspeth et al. [1,2], Shin et al. [18], and Maya and Wetzel [19].
For the failure mechanism induced by an indenter with radius of curvature of 0.79 mm, the fibers underwent fibrillation (Figure 9c) and localized shear failure only. Neither the kink band nor snapped-back behaviors was observed. The fibrillated fibers revealed a rectangular shape and flatter surfaces (Figure 9c) compared to those loaded by the smaller indenters.
For the cases where the indenters had radii of curvature of 1.59 and 2.50 mm, the failure surfaces of the fibers only showed fibrillation, as shown in Figure 9d,e. This observation was very similar to those observed by Hudspeth et al. [2] under transverse impact by a 7.62 mm round projectile and by Cheng et al. [14] under uniaxial tensile loading. The fibrillated failure region revealed flatter damage for those loaded by 1.59 mm indenters compared to those loaded by 2.50 mm indenters. Unlike the previous indenters, localized cutting, shearing, snapped-back, and kink-band failure modes were not observed when loaded by 1.59 and 2.50 mm indenters. Such a scenario was caused by the lower stress concentration and the strain energy released at failure developed by these two indenters.
Figure 6 shows that the concentrated load developed in the yarn could be predicted by the quasi-static circular curved beam theory when the yarn was loaded transversely by indenters with a radius of curvature larger than 1.59 mm. The model assumed the concentrated load in the fibers was caused by the additional stretching of the fibers due to bending. Thus, the failure surface should only reveal fibrillation without other failure mechanisms. Unlike large indenters, when the yarn was loaded with indenters smaller than 1.59 mm, localized shear and kink-band were observed in the recovered fibers. Since a quasi-static circular curved beam did not account for such failures, the experimental data was not in agreement for indenters possessing a radius of curvature smaller than 1.59 mm.
5. Conclusions
Quasi-static transverse loading experiments on Twaron® 2040 warp yarns were performed to study the stress concentration developed in the yarns. The results showed that the stress concentration decreased as the radius of curvatures of the indenter increased. Post-mortem failure analysis revealed the failure surfaces changed from combination of fibrillation, snapped-back, kink band, and localized shear to only fibrillation as the radius of curvature increased. For the cases where the radius of curvature of the indenter was smaller than 1.59 mm, the residual strain energy from the strain energy model scale linearly with the radius of curvature of the indenter. Finally, the quasi-static circular curved beam theory was utilized to predict the stress concentration induced by the indenters with a radius of curvature larger than 1.59 mm.
Author Contributions
B.H.L., J.-M.C., and W.C. analyzed the results and contributed in discussion. B.H.L. and J.-M.C. performed the experiments. W.C. supervised the project direction.
Funding
This research was funded by US Army PEO Soldier with a grant number W91CRB-14-C-0025. In addition, this research was partially sponsored by the Army Research Laboratory and was accomplished under Cooperative Agreement Number W911NF-12-2-0022.
Acknowledgments
The authors would like to express their gratitude to US Army PEO Soldier and Army Research Laboratory for providing financial support for this work.
Conflicts of Interest
The authors declare no conflict of interest.
References
- Hudspeth, M.; Li, D.; Spatola, J.; Chen, W.; Zheng, J. The effects of off-axis transverse deflection loading on the failure strain of various high-performance fibers. Text. Res. J. 2016, 86, 897–910. [Google Scholar] [CrossRef]
- Hudspeth, M.; Chu, J.-M.; Jewell, E.; Lim, B.; Ytuarte, E.; Tsutsui, W.; Horner, S.; Zheng, J.; Chen, W. Effect of projectile nose geometry on the critical velocity and failure of yarn subjected to transverse impact. Text. Res. J. 2016, 87, 953–972. [Google Scholar] [CrossRef]
- Hudspeth, M.; Chen, W.; Zheng, J. Why the smith theory over-predicts instant rupture velocities during fiber transverse impact. Text. Res. J. 2015, 86, 743–754. [Google Scholar] [CrossRef]
- Walker, J.D.; Chocron, S. Why impacted yarns break at lower speed than classical theory predicts. J. Appl. Mech. 2011, 78, 051021. [Google Scholar] [CrossRef]
- Chocron, S.; Kirchdoerfer, T.; King, N.; Freitas, C.J. Modeling of fabric impact with high speed imaging and nickel-chromium wires validation. J. Appl. Mech. 2011, 78, 051007. [Google Scholar] [CrossRef]
- Smith, J.C.; McCrackin, F.L., Jr.; Schiefer, H.F. Stress-strain relationships in yarns subjected to rapid impact loading: Part V: Wave propagation in long textile yarns impacted transversely. Text. Res. J. 1958, 28, 288–302. [Google Scholar] [CrossRef]
- Sockalingam, S.; Gillespie, J.W.; Keefe, M. Dynamic modeling of Kevlar KM2 single fiber subjected to transverse impact. Int. J. Solids Struct. 2015,, 67–68, 297–310. [Google Scholar] [CrossRef]
- Sockalingam, S.; John, W.; Gillespie, J.; Keefe, M. Modeling the fiber length-scale response of Kevlar KM2 yarn during transverse impact. Text. Res. J. 2017, 87, 2242–2254. [Google Scholar] [CrossRef]
- Hudspeth, M.C. Multi-Axial Failure of High-Performance Fiber During Transverse Impact. Ph.D. Thesis, Purdue University, West Lafayette, IN, USA, 2016. [Google Scholar]
- Guo, Z.; Hong, J.; Zheng, J.; Chen, W. Out-of-plane effects on dynamic pull-out of p-phenylene terephthalamide yarns. Text. Res. J. 2015, 85, 140–149. [Google Scholar] [CrossRef]
- ASTM International. Standard Test Methods for Tensile Testing of Aramid Yarns; ASTM International: West Conshohocken, PA, USA, 2011. [Google Scholar]
- ASTM International. Standard Test Method for Tensile Properties of Yarns by the Single-Strand Method; ASTM International: West Conshohocken, PA, USA, 2015. [Google Scholar]
- Hudspeth, M.; Nie, X.; Chen, W. Dynamic failure of Dyneema SK76 single fibers under biaxial shear/tension. Polymer 2012, 53, 5568–5574. [Google Scholar] [CrossRef]
- Cheng, M.; Chen, W.; Weerasooriya, T. Mechanical properties of Kevlar® KM2 single fiber. J. Eng. Mater. Technol. 2005, 127, 197–203. [Google Scholar] [CrossRef]
- Doyle, J.F. Wave Propagation in Structure: Spectral Analysis Using Fast Discrete Fourier Transforms; Springer-Verlag: New York, NY, USA, 1997. [Google Scholar]
- Barber, J.R. Intermediate Mechanics of Materials; Springer Science & Business Media: Berlin, Germany, 2010; Volume 175. [Google Scholar]
- Hearle, J.W.; Lomas, B.; Cooke, W.D. Atlas of Fibre Fracture and Damage to Textiles; Elsevier: New York, NY, USA, 1998. [Google Scholar]
- Shin, H.-S.; Erlich, D.C.; Simons, J.W.; Shockey, D.A. Cut resistance of high-strength yarns. Text. Res. J. 2006, 76, 607–613. [Google Scholar] [CrossRef]
- Mayo, J.B.; Wetzel, E. Cut resistance and failure of high-performance single fibers. Text. Res. J. 2014, 84, 1233–1246. [Google Scholar] [CrossRef]
Figure 1.
Experimental apparatus for uniaxial tensile experiments.

Figure 2.
Seven different indenters used in transverse loading experiments. From left to right, the indenters possess radii of curvature of 0.20, 0.40, 0.79, 1.59, 2.50, 3.81, and 4.50 mm.
Figure 2.
Seven different indenters used in transverse loading experiments. From left to right, the indenters possess radii of curvature of 0.20, 0.40, 0.79, 1.59, 2.50, 3.81, and 4.50 mm.

Figure 3.
Experimental apparatus for transverse loading experiment.

Figure 4.
Stress–strain curves for all 10 experiments. The dashed curves indicate the experimental data, whereas the solid curve indicates the average stress–strain curve.
Figure 4.
Stress–strain curves for all 10 experiments. The dashed curves indicate the experimental data, whereas the solid curve indicates the average stress–strain curve.

Figure 5.
Transverse load versus axial load at failure for seven different indenters.

Figure 6.
Stress concentration in the yarns for seven different indenters.

Figure 7.
Residual strain energy for seven different indenters.

Figure 8.
Schematic of circular curved beam.

Figure 9.
Fibrillation of fiber transversely loaded by indenter with radii of curvature of (a) 0.20, (b) 0.40, (c) 0.79, (d) 1.59, and (e) 2.50 mm. All scale bars are 10 µm.
Figure 9.
Fibrillation of fiber transversely loaded by indenter with radii of curvature of (a) 0.20, (b) 0.40, (c) 0.79, (d) 1.59, and (e) 2.50 mm. All scale bars are 10 µm.

Figure 10.
Additional failure surfaces that caused the fibers to form (a) kink-band, (b) snapped-back and (c) localized shear. All scale bars are 10 µm.
Figure 10.
Additional failure surfaces that caused the fibers to form (a) kink-band, (b) snapped-back and (c) localized shear. All scale bars are 10 µm.


Table 1.
Maximum axial and transverse load for seven different indenters.
| Radius of Curvature (mm) | Maximum Axial Load, Pax (N) | Maximum Transverse Load (N) |
|---|---|---|
| 0.20 | 132.7 ± 1.7 | 192.0 ± 3.3 |
| 0.40 | 137.6 ± 3.0 | 200.0 ± 4.5 |
| 0.79 | 139.3 ± 2.0 | 201.7 ± 2.9 |
| 1.59 | 138.7 ± 4.5 | 204.6 ± 4.2 |
| 2.50 | 145.5 ± 4.8 | 211.8 ± 4.7 |
| 3.81 | 150.5 ± 3.6 | 220.7 ± 5.2 |
| 4.50 | 151.3 ± 5.4 | 222.0 ± 6.4 |
© 2018 by the authors. Licensee MDPI, Basel, Switzerland. This article is an open access article distributed under the terms and conditions of the Creative Commons Attribution (CC BY) license (http://creativecommons.org/licenses/by/4.0/).
Share and Cite
MDPI and ACS Style
Lim, B.H.; Chu, J.-M.; Chen, W. Mechanical Behavior of High-Performance Yarns Transversely Loaded by Different Indenters. Fibers 2018, 6, 69. https://0-doi-org.brum.beds.ac.uk/10.3390/fib6040069
AMA Style
Lim BH, Chu J-M, Chen W. Mechanical Behavior of High-Performance Yarns Transversely Loaded by Different Indenters. Fibers. 2018; 6(4):69. https://0-doi-org.brum.beds.ac.uk/10.3390/fib6040069
Chicago/Turabian StyleLim, Boon Him, Jou-Mei Chu, and Wayne Chen. 2018. "Mechanical Behavior of High-Performance Yarns Transversely Loaded by Different Indenters" Fibers 6, no. 4: 69. https://0-doi-org.brum.beds.ac.uk/10.3390/fib6040069
Note that from the first issue of 2016, this journal uses article numbers instead of page numbers. See further details here.