
Time-Dependent Pathological Changes in Hypoperfusion-Induced Abdominal Aortic Aneurysm


 and
and
Abstract
:Simple Summary
Abstract
1. Introduction
2. Materials and Methods
2.1. Animals
2.2. Induction of Hypoperfusion in the Abdominal Aortic Wall
2.3. Histological Analysis
2.4. Microscopy
2.5. Statistical Analyses
3. Results
3.1. Protein Levels in AAA-Related Factors in the Hypoperfusion-Induced Animal Model
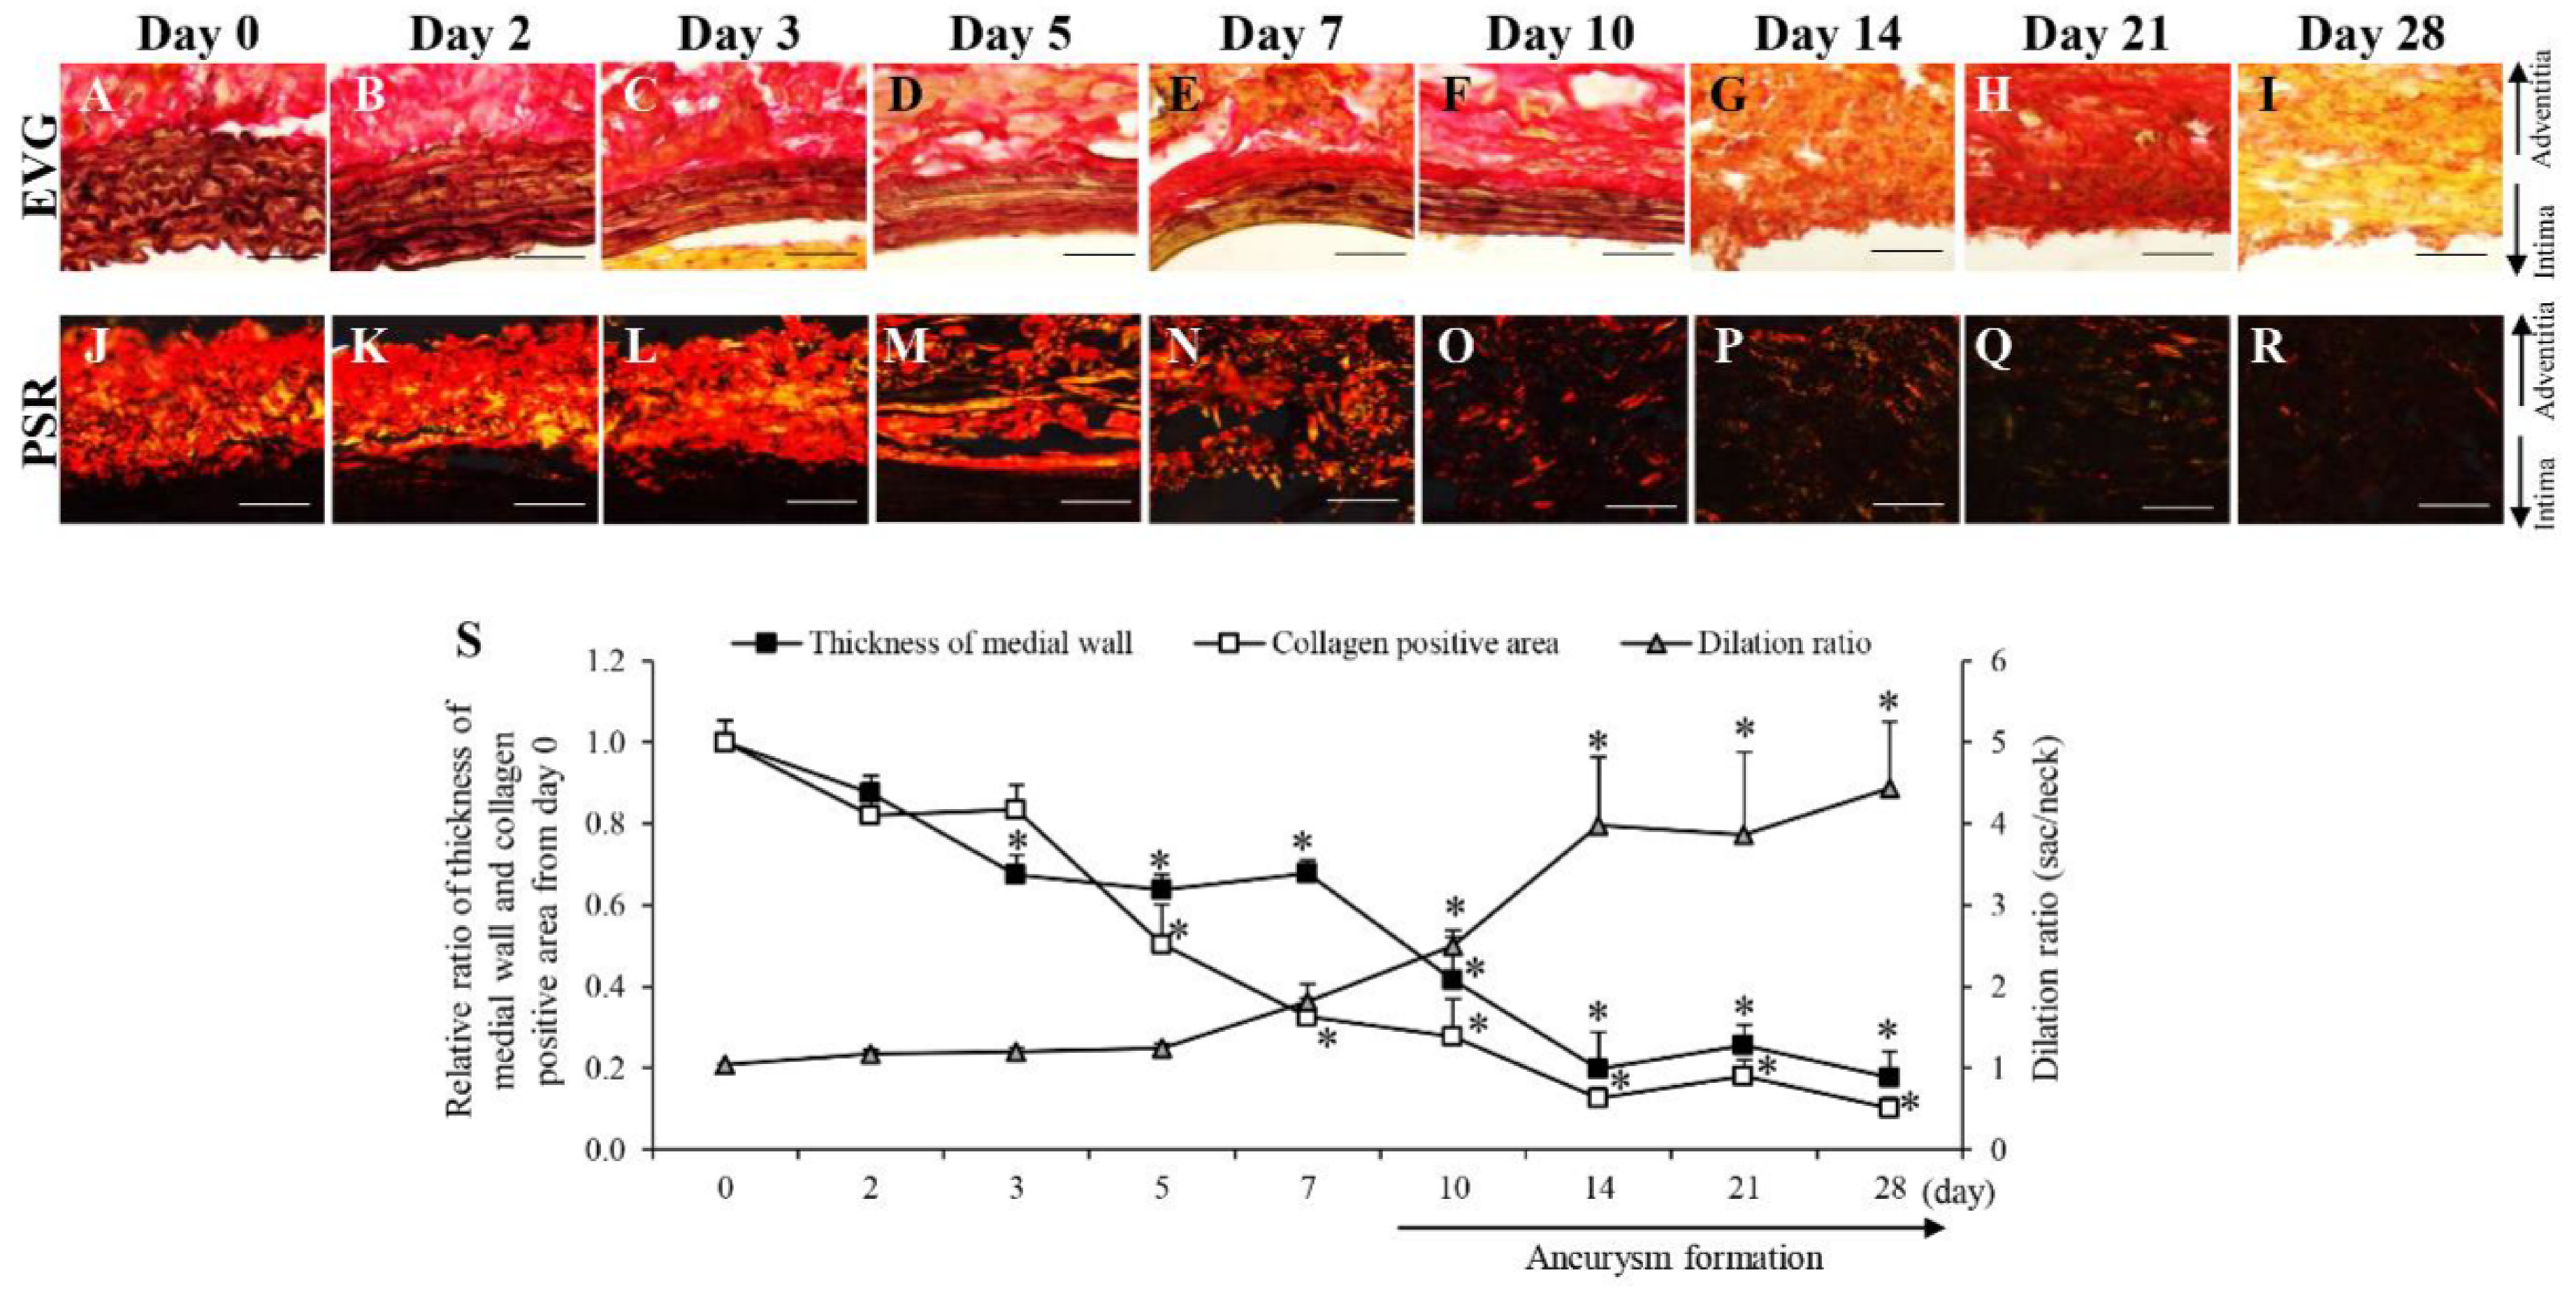
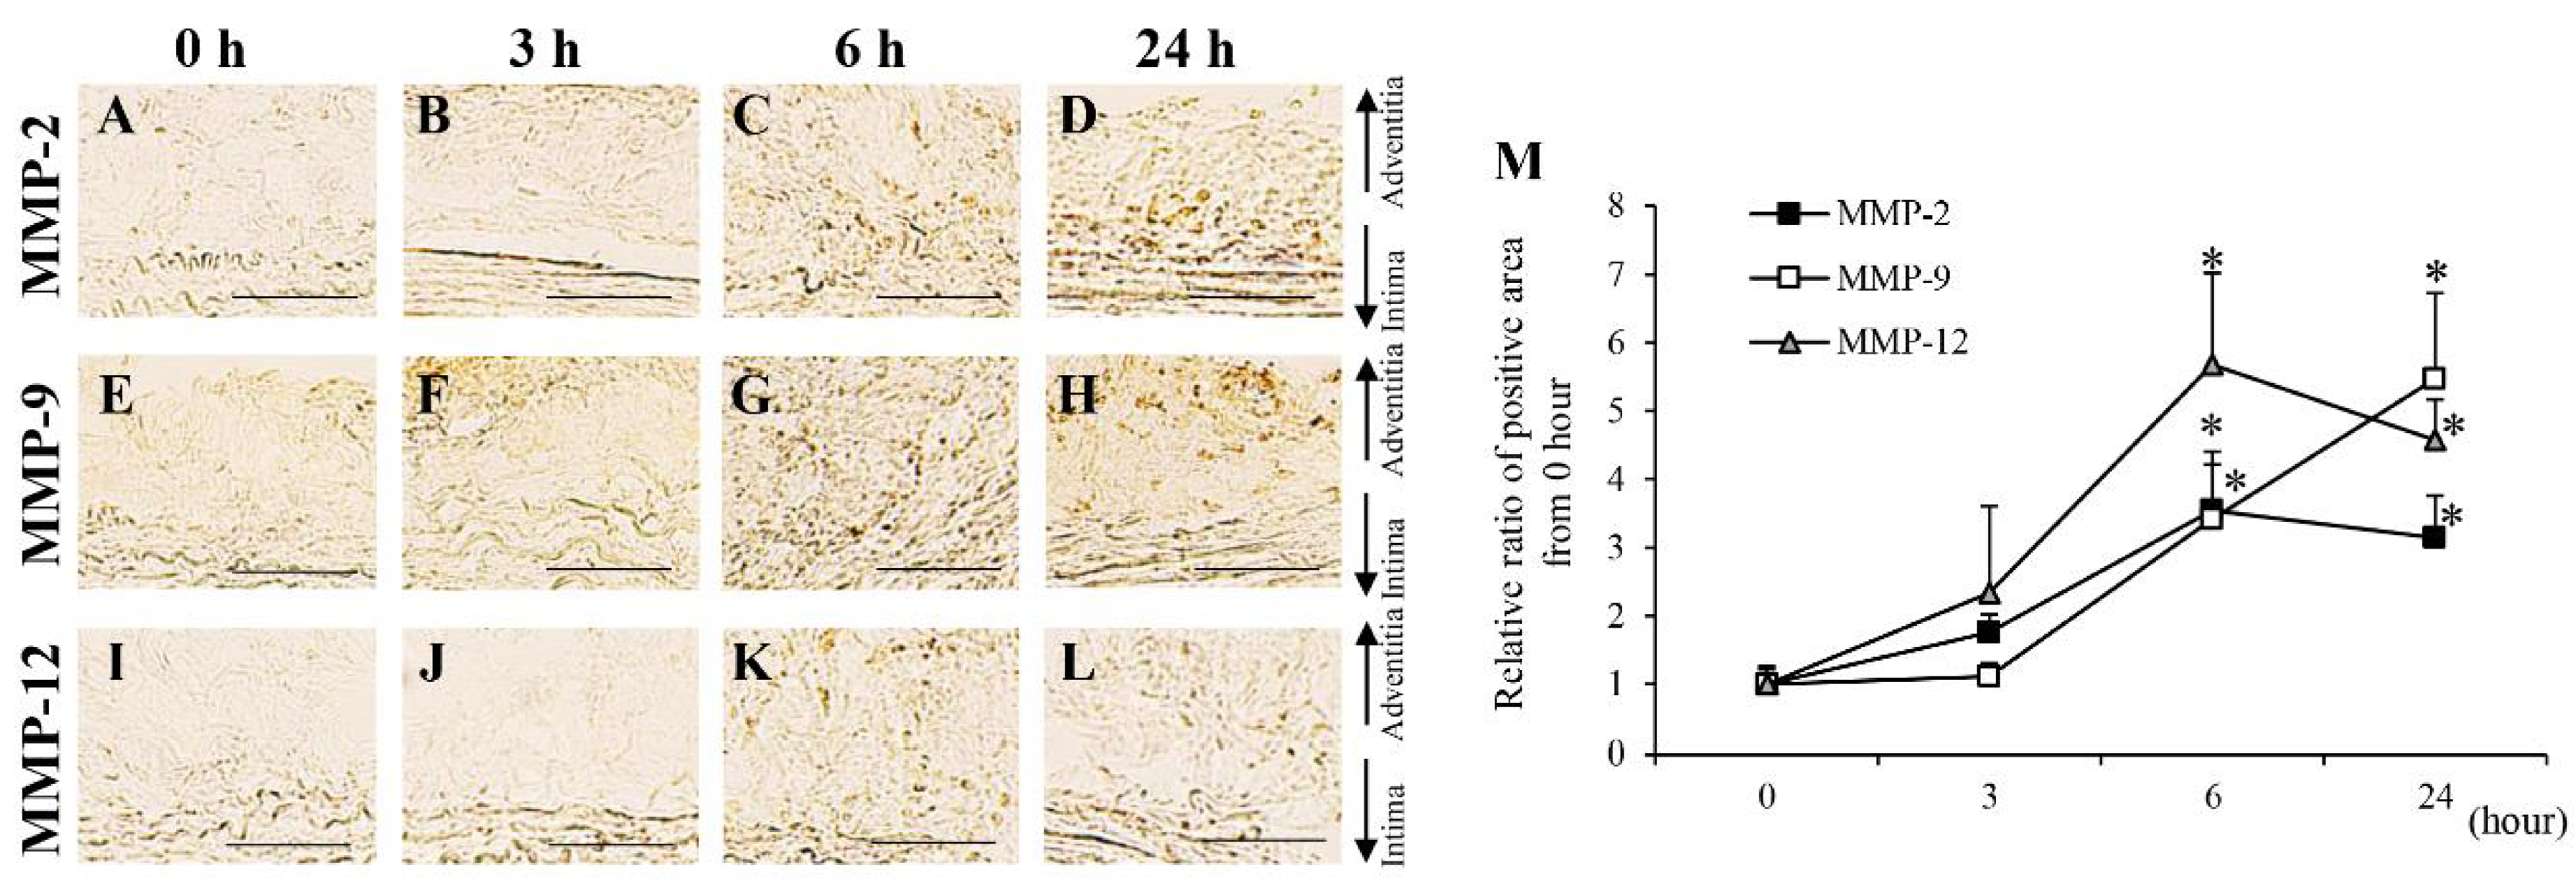
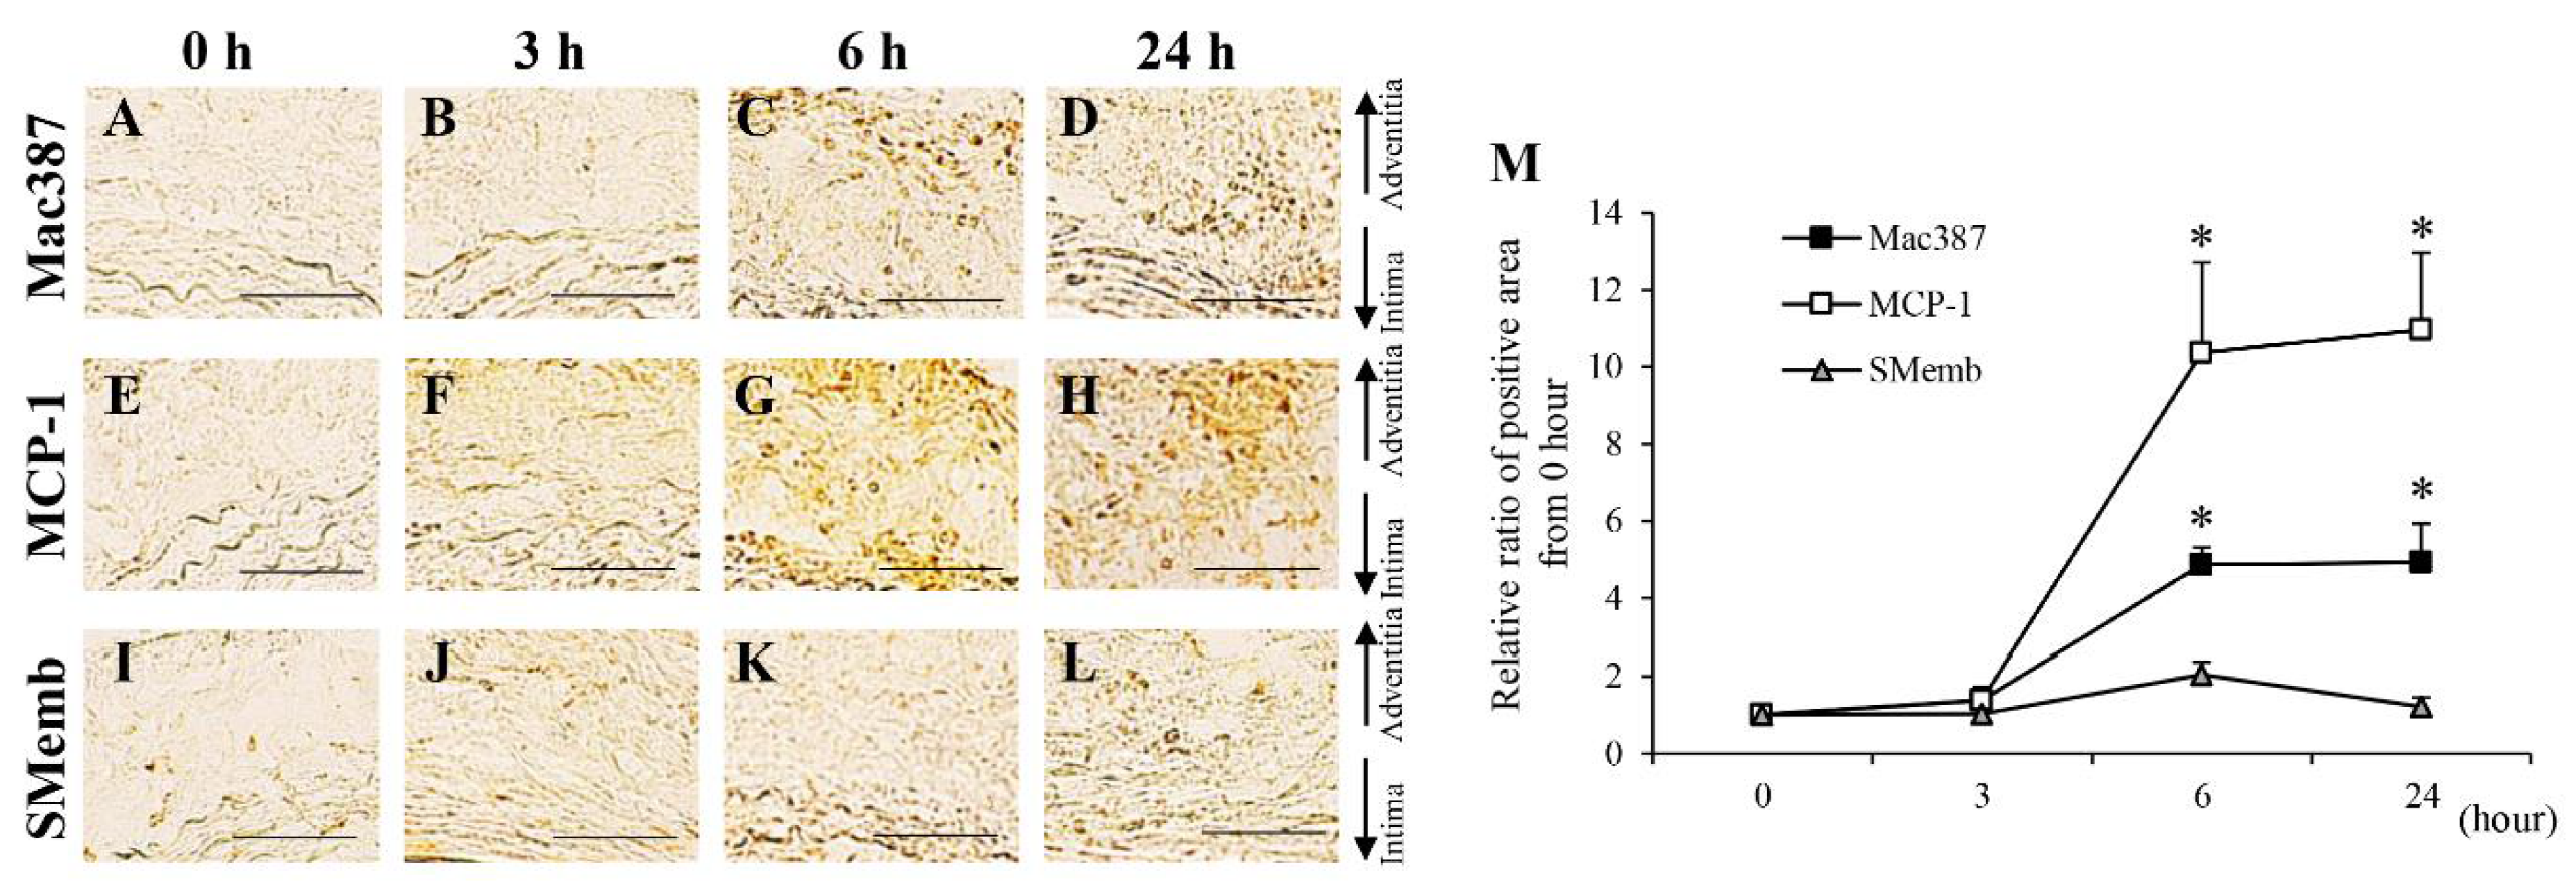
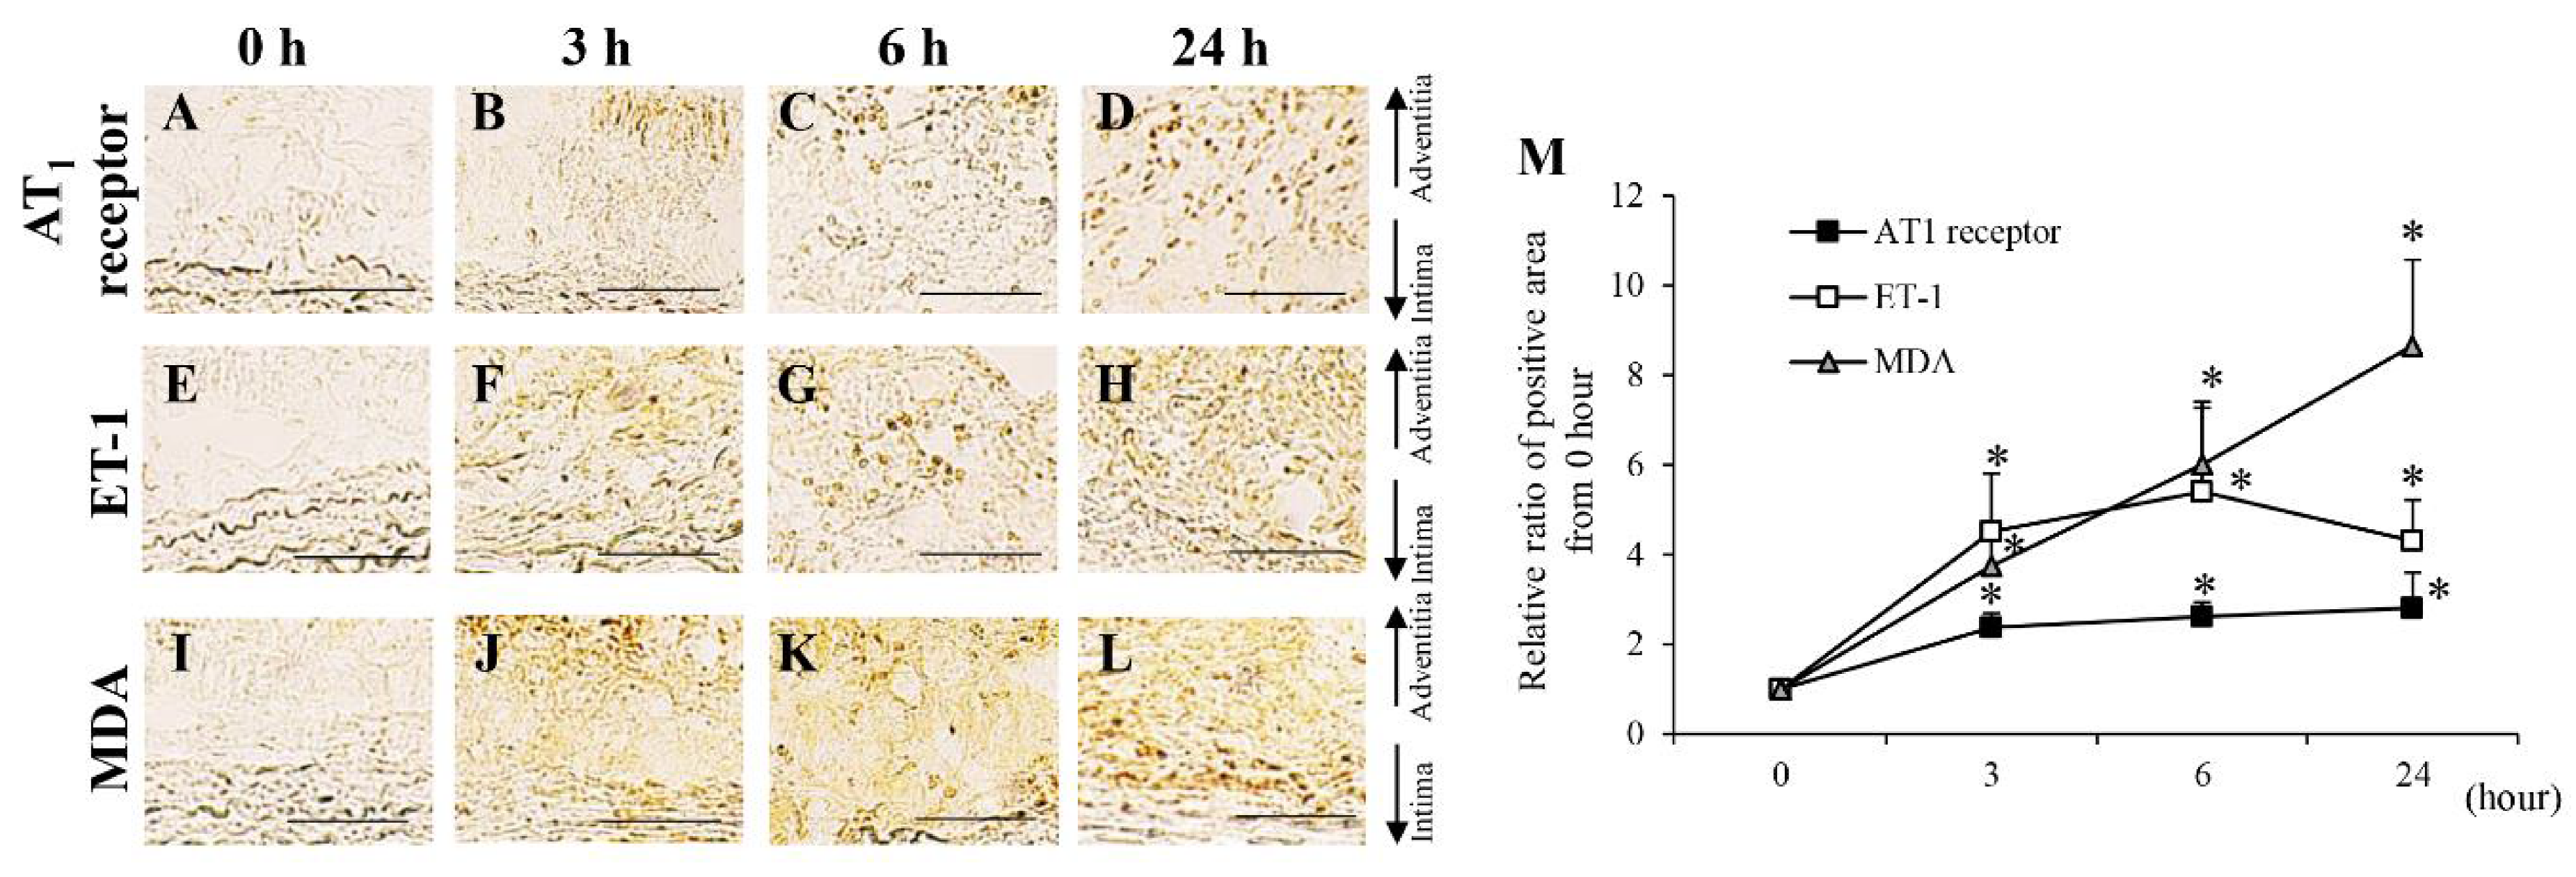
3.2. Time-Dependent Changes in AAA-Related Factors in the Hypoperfusion-Induced Animal Model
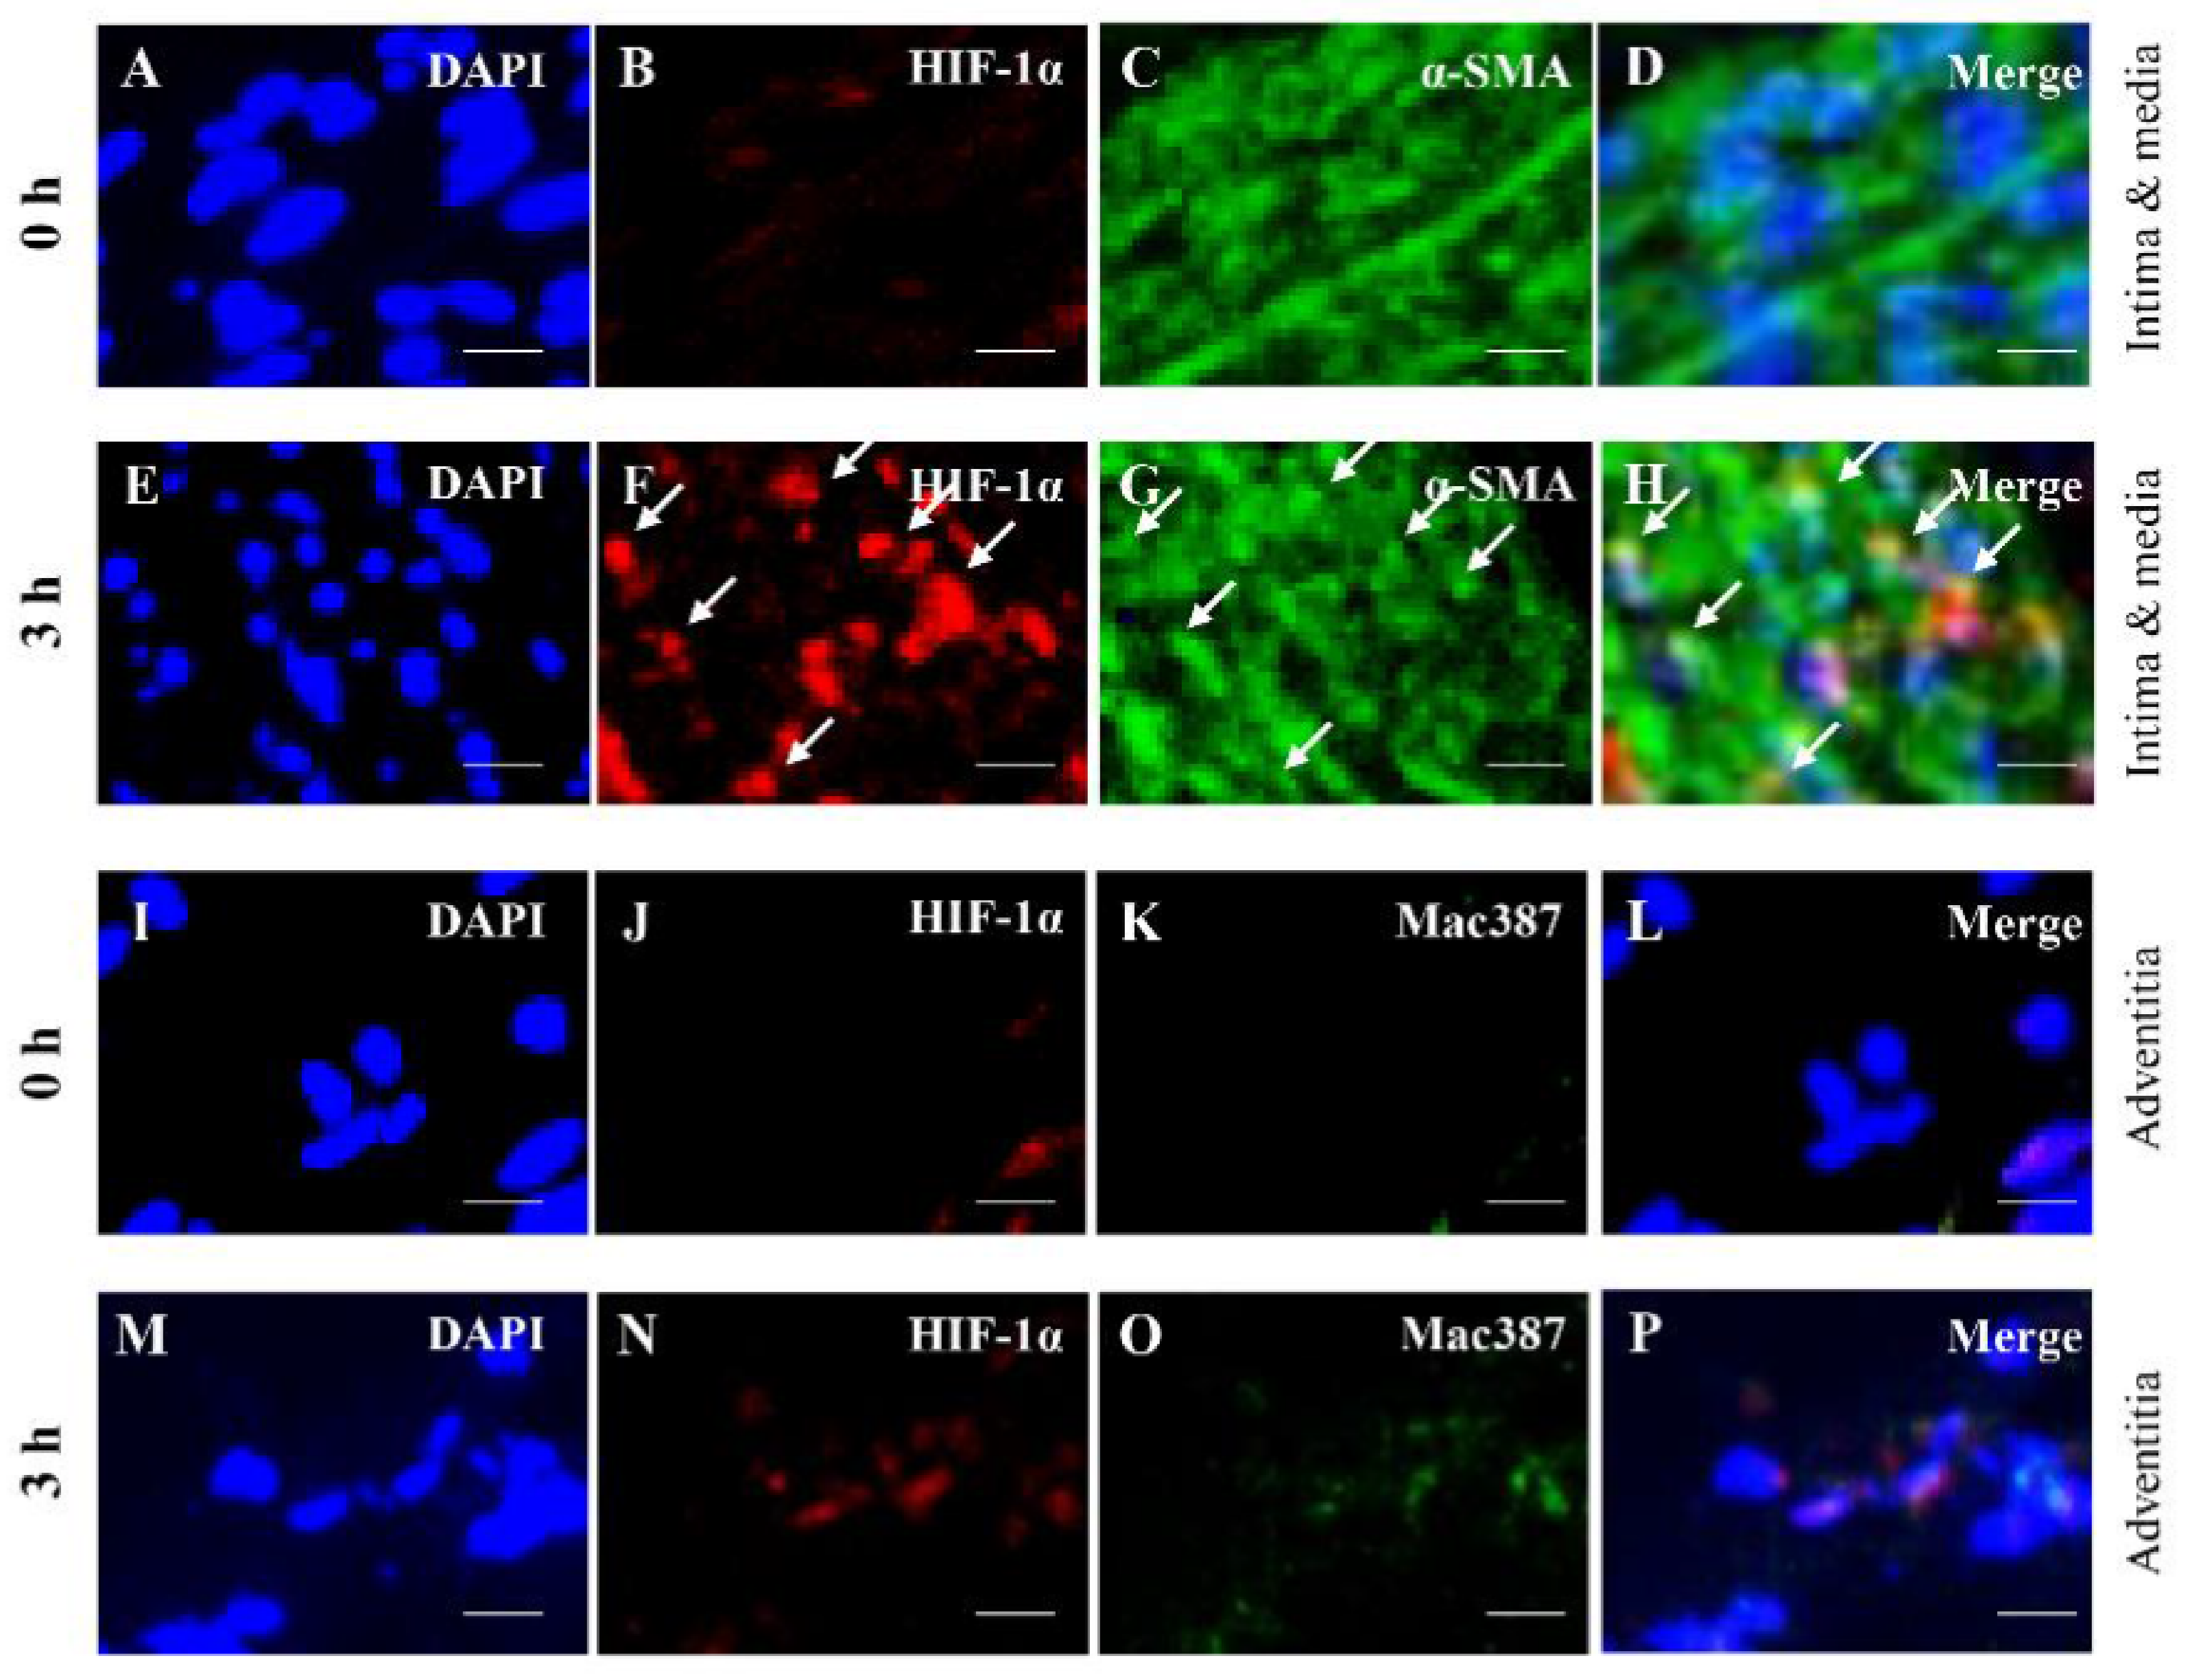
3.3. Colocalization Studies of AAA-Related Factors with α-SMA+ Cells and Mac387+ Cells
4. Discussion
5. Conclusions
Supplementary Materials
Author Contributions
Funding
Institutional Review Board Statement
Informed Consent Statement
Data Availability Statement
Conflicts of Interest
References
- Weintraub, N.L. Understanding abdominal aortic aneurysm. N. Engl. J. Med. 2009, 361, 1114–1116. [Google Scholar] [CrossRef] [PubMed] [Green Version]
- Moll, F.L.; Powell, J.T.; Fraedrich, G.; Verzini, F.; Haulon, S.; Waltham, M.; van Herwaarden, J.A.; Holt, P.J.; van Keulen, J.W.; Rantner, B.; et al. Management of abdominal aortic aneurysms clinical practice guidelines of the European society for vascular surgery. Eur. J. Vasc. Endovasc. Surg. 2011, 41 (Suppl. 1), S1–S58. [Google Scholar] [CrossRef] [Green Version]
- Kuivaniemi, H.; Ryer, E.J.; Elmore, J.R.; Tromp, G. Understanding the pathogenesis of abdominal aortic aneurysms. Expert Rev. Cardiovasc. Ther. 2015, 13, 975–987. [Google Scholar] [CrossRef] [Green Version]
- Wolinsky, H.; Glagov, S. Comparison of abdominal and thoracic aortic medial structure in mammals. Deviat. Man Usual Pattern Circ. Res. 1969, 25, 677–686. [Google Scholar] [CrossRef] [PubMed] [Green Version]
- Blassova, T.; Tonar, Z.; Tomasek, P.; Hosek, P.; Hollan, I.; Treska, V.; Molacek, J. Inflammatory cell infiltrates, hypoxia, vascularization, pentraxin 3 and osteoprotegerin in abdominal aortic aneurysms—A quantitative histological study. PLoS ONE 2019, 14, e0224818. [Google Scholar] [CrossRef] [PubMed]
- Vorp, D.A.; Lee, P.C.; Wang, D.H.; Makaroun, M.S.; Nemoto, E.M.; Ogawa, S.; Webster, M.W. Association of intraluminal thrombus in abdominal aortic aneurysm with local hypoxia and wall weakening. J. Vasc. Surg. 2001, 34, 291–299. [Google Scholar] [CrossRef] [PubMed] [Green Version]
- Tanaka, H.; Zaima, N.; Sasaki, T.; Hayasaka, T.; Goto-Inoue, N.; Onoue, K.; Ikegami, K.; Morita, Y.; Yamamoto, N.; Mano, Y.; et al. Adventitial vasa vasorum arteriosclerosis in abdominal aortic aneurysm. PLoS ONE 2013, 8, e57398. [Google Scholar] [CrossRef] [PubMed]
- Tanaka, H.; Zaima, N.; Sasaki, T.; Sano, M.; Yamamoto, N.; Saito, T.; Inuzuka, K.; Hayasaka, T.; Goto-Inoue, N.; Sugiura, Y.; et al. Hypoperfusion of the Adventitial Vasa Vasorum Develops an Abdominal Aortic Aneurysm. PLoS ONE 2015, 10, e0134386. [Google Scholar] [CrossRef]
- Kugo, H.; Zaima, N.; Tanaka, H.; Mouri, Y.; Yanagimoto, K.; Hayamizu, K.; Hashimoto, K.; Sasaki, T.; Sano, M.; Yata, T.; et al. Adipocyte in vascular wall can induce the rupture of abdominal aortic aneurysm. Sci. Rep. 2016, 6, 31268. [Google Scholar] [CrossRef] [PubMed] [Green Version]
- Sakalihasan, N.; Limet, R.; Defawe, O.D. Abdominal aortic aneurysm. Lancet 2005, 365, 1577–1589. [Google Scholar] [CrossRef]
- Doderer, S.A.; Gabel, G.; Kokje, V.B.C.; Northoff, B.H.; Holdt, L.M.; Hamming, J.F.; Lindeman, J.H.N. Adventitial adipogenic degeneration is an unidentified contributor to aortic wall weakening in the abdominal aortic aneurysm. J. Vasc. Surg. 2017, 67, 1891–1900. [Google Scholar] [CrossRef]
- Niestrawska, J.A.; Regitnig, P.; Viertler, C.; Cohnert, T.U.; Babu, A.R.; Holzapfel, G.A. The role of tissue remodeling in mechanics and pathogenesis of abdominal aortic aneurysms. Acta Biomater 2019, 88, 149–161. [Google Scholar] [CrossRef]
- Tanaka, H.; Zaima, N.; Sasaki, T.; Yamamoto, N.; Inuzuka, K.; Sano, M.; Saito, T.; Hayasaka, T.; Goto-Inoue, N.; Sato, K.; et al. Imaging Mass Spectrometry Reveals a Unique Distribution of Triglycerides in the Abdominal Aortic Aneurysmal Wall. J. Vasc Res. 2015, 52, 127–135. [Google Scholar] [CrossRef] [PubMed]
- Adolph, R.; Vorp, D.A.; Steed, D.L.; Webster, M.W.; Kameneva, M.V.; Watkins, S.C. Cellular content and permeability of intraluminal thrombus in abdominal aortic aneurysm. J. Vasc. Surg. 1997, 25, 916–926. [Google Scholar] [CrossRef] [Green Version]
- Iijima, M.; Azuma, R.; Hieda, T.; Makino, Y. A surgical case of inflammatory abdominal aortic aneurysm that responded remarkably to preoperative steroid therapy. J. Surg. Case Rep. 2018, 2018, rjy020. [Google Scholar] [CrossRef]
- Henderson, E.L.; Geng, Y.J.; Sukhova, G.K.; Whittemore, A.D.; Knox, J.; Libby, P. Death of smooth muscle cells and expression of mediators of apoptosis by T lymphocytes in human abdominal aortic aneurysms. Circulation 1999, 99, 96–104. [Google Scholar] [CrossRef] [Green Version]
- Sakalihasan, N.; Delvenne, P.; Nusgens, B.V.; Limet, R.; Lapiere, C.M. Activated forms of MMP2 and MMP9 in abdominal aortic aneurysms. J. Vasc. Surg. 1996, 24, 127–133. [Google Scholar] [CrossRef] [Green Version]
- Yamashita, A.; Noma, T.; Nakazawa, A.; Saito, S.; Fujioka, K.; Zempo, N.; Esato, K. Enhanced expression of matrix metalloproteinase-9 in abdominal aortic aneurysms. World J. Surg. 2001, 25, 259–265. [Google Scholar] [CrossRef]
- Emeto, T.I.; Moxon, J.V.; Au, M.; Golledge, J. Oxidative stress and abdominal aortic aneurysm: Potential treatment targets. Clin. Sci. 2016, 130, 301–315. [Google Scholar] [CrossRef]
- Guzik, B.; Sagan, A.; Ludew, D.; Mrowiecki, W.; Chwala, M.; Bujak-Gizycka, B.; Filip, G.; Grudzien, G.; Kapelak, B.; Zmudka, K.; et al. Mechanisms of oxidative stress in human aortic aneurysms--association with clinical risk factors for atherosclerosis and disease severity. Int. J. Cardiol. 2013, 168, 2389–2396. [Google Scholar] [CrossRef] [PubMed] [Green Version]
- Kugo, H.; Zaima, N.; Tanaka, H.; Hashimoto, K.; Miyamoto, C.; Sawaragi, A.; Urano, T.; Unno, N.; Moriyama, T. Pathological Analysis of the Ruptured Vascular Wall of Hypoperfusion-induced Abdominal Aortic Aneurysm Animal Model. J. Oleo Sci. 2017, 66, 499–506. [Google Scholar] [CrossRef] [Green Version]
- Gabel, G.; Northoff, B.H.; Weinzierl, I.; Ludwig, S.; Hinterseher, I.; Wilfert, W.; Teupser, D.; Doderer, S.A.; Bergert, H.; Schonleben, F.; et al. Molecular Fingerprint for Terminal Abdominal Aortic Aneurysm Disease. J. Am. Heart Assoc. 2017, 6, e006798. [Google Scholar] [CrossRef] [Green Version]
- Curci, J.A.; Liao, S.; Huffman, M.D.; Shapiro, S.D.; Thompson, R.W. Expression and localization of macrophage elastase (matrix metalloproteinase-12) in abdominal aortic aneurysms. J. Clin. Invest. 1998, 102, 1900–1910. [Google Scholar] [CrossRef] [Green Version]
- Dale, M.A.; Ruhlman, M.K.; Baxter, B.T. Inflammatory cell phenotypes in AAAs: Their role and potential as targets for therapy. Arterioscler. Thromb. Vasc. Biol. 2015, 35, 1746–1755. [Google Scholar] [CrossRef] [Green Version]
- Rubio-Navarro, A.; Amaro Villalobos, J.M.; Lindholt, J.S.; Buendia, I.; Egido, J.; Blanco-Colio, L.M.; Samaniego, R.; Meilhac, O.; Michel, J.B.; Martin-Ventura, J.L.; et al. Hemoglobin induces monocyte recruitment and CD163-macrophage polarization in abdominal aortic aneurysm. Int. J. Cardiol. 2015, 201, 66–78. [Google Scholar] [CrossRef] [PubMed]
- Koch, A.E.; Kunkel, S.L.; Pearce, W.H.; Shah, M.R.; Parikh, D.; Evanoff, H.L.; Haines, G.K.; Burdick, M.D.; Strieter, R.M. Enhanced production of the chemotactic cytokines interleukin-8 and monocyte chemoattractant protein-1 in human abdominal aortic aneurysms. Am. J. Pathol. 1993, 142, 1423–1431. [Google Scholar]
- Zhong, L.; He, X.; Si, X.; Wang, H.; Li, B.; Hu, Y.; Li, M.; Chen, X.; Liao, W.; Liao, Y.; et al. SM22alpha (Smooth Muscle 22alpha) Prevents Aortic Aneurysm Formation by Inhibiting Smooth Muscle Cell Phenotypic Switching Through Suppressing Reactive Oxygen Species/NF-kappaB (Nuclear Factor-kappaB). Arterioscler. Thromb. Vasc. Biol. 2019, 39, e10–e25. [Google Scholar] [CrossRef] [PubMed] [Green Version]
- Miyamoto, C.; Kugo, H.; Hashimoto, K.; Moriyama, T.; Zaima, N. Ovariectomy increases the incidence and diameter of abdominal aortic aneurysm in a hypoperfusion-induced abdominal aortic aneurysm animal model. Sci. Rep. 2019, 9, 18330. [Google Scholar] [CrossRef] [PubMed]
- Kanda, Y. Investigation of the freely available easy-to-use software ’EZR’ for medical statistics. Bone Marrow Transplant. 2013, 48, 452–458. [Google Scholar] [CrossRef] [PubMed] [Green Version]
- Kugo, H.; Moriyama, T.; Zaima, N. The role of perivascular adipose tissue in the appearance of ectopic adipocytes in the abdominal aortic aneurysmal wall. Adipocyte 2019, 8, 229–239. [Google Scholar] [CrossRef] [PubMed] [Green Version]
- Kugo, H.; Zaima, N.; Mouri, Y.; Tanaka, H.; Yanagimoto, K.; Urano, T.; Unno, N.; Moriyama, T. The preventive effect of fish oil on abdominal aortic aneurysm development. Biosci. Biotechnol. Biochem. 2016, 80, 1186–1191. [Google Scholar] [CrossRef] [PubMed] [Green Version]
- Sano, M.; Sasaki, T.; Hirakawa, S.; Sakabe, J.; Ogawa, M.; Baba, S.; Zaima, N.; Tanaka, H.; Inuzuka, K.; Yamamoto, N.; et al. Lymphangiogenesis and angiogenesis in abdominal aortic aneurysm. PLoS ONE 2014, 9, e89830. [Google Scholar] [CrossRef] [PubMed]
- Thompson, R.W. Basic science of abdominal aortic aneurysms: Emerging therapeutic strategies for an unresolved clinical problem. Curr. Opin. Cardiol. 1996, 11, 504–518. [Google Scholar] [CrossRef] [PubMed]
- Matsushita, M.; Nishikimi, N.; Sakurai, T.; Nimura, Y. Relationship between aortic calcification and atherosclerotic disease in patients with abdominal aortic aneurysm. Int. Angiol. 2000, 19, 276–279. [Google Scholar]
- Lindholt, J.S. Aneurysmal wall calcification predicts natural history of small abdominal aortic aneurysms. Atherosclerosis 2008, 197, 673–678. [Google Scholar] [CrossRef] [PubMed]
- Nakayama, A.; Morita, H.; Hayashi, N.; Nomura, Y.; Hoshina, K.; Shigematsu, K.; Ohtsu, H.; Miyata, T.; Komuro, I. Inverse Correlation Between Calcium Accumulation and the Expansion Rate of Abdominal Aortic Aneurysms. Circ. J. 2016, 80, 332–339. [Google Scholar] [CrossRef] [Green Version]
- Thompson, R.W.; Parks, W.C. Role of matrix metalloproteinases in abdominal aortic aneurysms. Ann. N. Y. Acad. Sci. 1996, 800, 157–174. [Google Scholar] [CrossRef]
- Hashimoto, K.; Kugo, H.; Tanaka, H.; Iwamoto, K.; Miyamoto, C.; Urano, T.; Unno, N.; Hayamizu, K.; Zaima, N.; Moriyama, T. The Effect of a High-Fat Diet on the Development of Abdominal Aortic Aneurysm in a Vascular Hypoperfusion-Induced Animal Model. J. Vasc. Res. 2018, 55, 63–74. [Google Scholar] [CrossRef]
- Miyamoto, C.; Kugo, H.; Hashimoto, K.; Sawaragi, A.; Zaima, N.; Moriyama, T. Effect of a High-sucrose Diet on Abdominal Aortic Aneurysm Development in a Hypoperfusion-induced Animal Model. J. Oleo. Sci. 2018, 67, 589–597. [Google Scholar] [CrossRef] [Green Version]
- Ghigliotti, G.; Barisione, C.; Garibaldi, S.; Brunelli, C.; Palmieri, D.; Spinella, G.; Pane, B.; Spallarossa, P.; Altieri, P.; Fabbi, P.; et al. CD16(+) monocyte subsets are increased in large abdominal aortic aneurysms and are differentially related with circulating and cell-associated biochemical and inflammatory biomarkers. Dis. Markers 2013, 34, 131–142. [Google Scholar] [CrossRef]
- Kamijima, T.; Isobe, M.; Suzuki, J.; Fukui, D.; Arai, M.; Urayama, H.; Nishimaki, K.; Sekiguchi, M.; Kawasaki, S. Enhanced embryonic nonmuscle myosin heavy chain isoform and matrix metalloproteinase expression in aortic abdominal aneurysm with rapid progression. Cardiovasc. Pathol. 1999, 8, 291–295. [Google Scholar] [CrossRef]
- Cohen, J.R.; Parikh, S.; Grella, L.; Sarfati, I.; Corbie, G.; Danna, D.; Wise, L. Role of the neutrophil in abdominal aortic aneurysm development. Cardiovasc Surg. 1993, 1, 373–376. [Google Scholar] [PubMed]
- Kaschina, E.; Scholz, H.; Steckelings, U.M.; Sommerfeld, M.; Kemnitz, U.R.; Artuc, M.; Schmidt, S.; Unger, T. Transition from atherosclerosis to aortic aneurysm in humans coincides with an increased expression of RAS components. Atherosclerosis 2009, 205, 396–403. [Google Scholar] [CrossRef] [PubMed]
- Miller, F.J., Jr.; Sharp, W.J.; Fang, X.; Oberley, L.W.; Oberley, T.D.; Weintraub, N.L. Oxidative stress in human abdominal aortic aneurysms: A potential mediator of aneurysmal remodeling. Arterioscler. Thromb Vasc. Biol. 2002, 22, 560–565. [Google Scholar] [CrossRef] [PubMed] [Green Version]
- Cassis, L.A.; Rateri, D.L.; Lu, H.; Daugherty, A. Bone marrow transplantation reveals that recipient AT1a receptors are required to initiate angiotensin II-induced atherosclerosis and aneurysms. Arterioscler. Thromb Vasc. Biol. 2007, 27, 380–386. [Google Scholar] [CrossRef] [PubMed] [Green Version]
- Chen, X.L.; Tummala, P.E.; Olbrych, M.T.; Alexander, R.W.; Medford, R.M. Angiotensin II induces monocyte chemoattractant protein-1 gene expression in rat vascular smooth muscle cells. Circ. Res. 1998, 83, 952–959. [Google Scholar] [CrossRef] [Green Version]
- Griendling, K.K.; Minieri, C.A.; Ollerenshaw, J.D.; Alexander, R.W. Angiotensin II stimulates NADH and NADPH oxidase activity in cultured vascular smooth muscle cells. Circ. Res. 1994, 74, 1141–1148. [Google Scholar] [CrossRef] [Green Version]
- Wang, C.; Qian, X.; Sun, X.; Chang, Q. Angiotensin II increases matrix metalloproteinase 2 expression in human aortic smooth muscle cells via AT1R and ERK1/2. Exp. Biol. Med. 2015, 240, 1564–1571. [Google Scholar] [CrossRef] [PubMed] [Green Version]
- Li, M.W.; Mian, M.O.; Barhoumi, T.; Rehman, A.; Mann, K.; Paradis, P.; Schiffrin, E.L. Endothelin-1 overexpression exacerbates atherosclerosis and induces aortic aneurysms in apolipoprotein E knockout mice. Arterioscler. Thromb Vasc. Biol. 2013, 33, 2306–2315. [Google Scholar] [CrossRef] [Green Version]
- Flondell-Site, D.; Lindblad, B.; Gottsater, A. High levels of endothelin (ET)-1 and aneurysm diameter independently predict growth of stable abdominal aortic aneurysms. Angiology 2010, 61, 324–328. [Google Scholar] [CrossRef]
- Treska, V.; Wenham, P.W.; Valenta, J.; Topolcan, O.; Pecen, L. Plasma endothelin levels in patients with abdominal aortic aneurysms. Eur. J. Vasc. Endovasc. Surg. 1999, 17, 424–428. [Google Scholar] [CrossRef] [PubMed] [Green Version]
- Lucas, M.L.; Carraro, C.C.; Bello-Klein, A.; Kalil, A.N.; Aerts, N.R.; Carvalho, F.B.; Fernandes, M.C.; Zettler, C.G. Oxidative Stress in Aortas of Patients with Advanced Occlusive and Aneurysmal Diseases. Ann. Vasc. Surg. 2018, 52, 216–224. [Google Scholar] [CrossRef]
- Siasos, G.; Mourouzis, K.; Oikonomou, E.; Tsalamandris, S.; Tsigkou, V.; Vlasis, K.; Vavuranakis, M.; Zografos, T.; Dimitropoulos, S.; Papaioannou, T.G.; et al. The Role of Endothelial Dysfunction in Aortic Aneurysms. Curr. Pharm. Des. 2015, 21, 4016–4034. [Google Scholar] [CrossRef] [PubMed]
- Manalo, D.J.; Rowan, A.; Lavoie, T.; Natarajan, L.; Kelly, B.D.; Ye, S.Q.; Garcia, J.G.; Semenza, G.L. Transcriptional regulation of vascular endothelial cell responses to hypoxia by HIF-1. Blood 2005, 105, 659–669. [Google Scholar] [CrossRef]
- Erdozain, O.J.; Pegrum, S.; Winrow, V.R.; Horrocks, M.; Stevens, C.R. Hypoxia in abdominal aortic aneurysm supports a role for HIF-1alpha and Ets-1 as drivers of matrix metalloproteinase upregulation in human aortic smooth muscle cells. J. Vasc Res. 2011, 48, 163–170. [Google Scholar] [CrossRef] [PubMed]
- Wang, S.; Zhang, C.; Zhang, M.; Liang, B.; Zhu, H.; Lee, J.; Viollet, B.; Xia, L.; Zhang, Y.; Zou, M.H. Activation of AMP-activated protein kinase alpha2 by nicotine instigates formation of abdominal aortic aneurysms in mice in vivo. Nat. Med. 2012, 18, 902–910. [Google Scholar] [CrossRef] [Green Version]
- Wan, R.; Mo, Y.; Chien, S.; Li, Y.; Tollerud, D.J.; Zhang, Q. The role of hypoxia inducible factor-1alpha in the increased MMP-2 and MMP-9 production by human monocytes exposed to nickel nanoparticles. Nanotoxicology 2011, 5, 568–582. [Google Scholar] [CrossRef] [Green Version]
- Aikawa, M.; Sivam, P.N.; Kuro-o, M.; Kimura, K.; Nakahara, K.; Takewaki, S.; Ueda, M.; Yamaguchi, H.; Yazaki, Y.; Periasamy, M.; et al. Human smooth muscle myosin heavy chain isoforms as molecular markers for vascular development and atherosclerosis. Circ. Res. 1993, 73, 1000–1012. [Google Scholar] [CrossRef] [PubMed] [Green Version]
- Owens, G.K. Regulation of differentiation of vascular smooth muscle cells. Physiol. Rev. 1995, 75, 487–517. [Google Scholar] [CrossRef]
- Salmon, M.; Johnston, W.F.; Woo, A.; Pope, N.H.; Su, G.; Upchurch, G.R., Jr.; Owens, G.K.; Ailawadi, G. KLF4 regulates abdominal aortic aneurysm morphology and deletion attenuates aneurysm formation. Circulation 2013, 128, S163–S174. [Google Scholar] [CrossRef] [PubMed] [Green Version]
- Ailawadi, G.; Moehle, C.W.; Pei, H.; Walton, S.P.; Yang, Z.; Kron, I.L.; Lau, C.L.; Owens, G.K. Smooth muscle phenotypic modulation is an early event in aortic aneurysms. J. Thorac. Cardiovasc. Surg. 2009, 138, 1392–1399. [Google Scholar] [CrossRef] [PubMed] [Green Version]
- Takahashi, K.; Yamanaka, S. Induction of pluripotent stem cells from mouse embryonic and adult fibroblast cultures by defined factors. Cell 2006, 126, 663–676. [Google Scholar] [CrossRef] [PubMed] [Green Version]
- Mathieu, J.; Zhang, Z.; Zhou, W.; Wang, A.J.; Heddleston, J.M.; Pinna, C.M.; Hubaud, A.; Stadler, B.; Choi, M.; Bar, M.; et al. HIF induces human embryonic stem cell markers in cancer cells. Cancer Res. 2011, 71, 4640–4652. [Google Scholar] [CrossRef] [Green Version]
- Spinosa, M.; Su, G.; Salmon, M.D.; Lu, G.; Cullen, J.M.; Fashandi, A.Z.; Hawkins, R.B.; Montgomery, W.; Meher, A.K.; Conte, M.S.; et al. Resolvin D1 decreases abdominal aortic aneurysm formation by inhibiting NETosis in a mouse model. J. Vasc. Surg. 2018, 68, 93S–103S. [Google Scholar] [CrossRef] [PubMed]
- Pagano, M.B.; Bartoli, M.A.; Ennis, T.L.; Mao, D.; Simmons, P.M.; Thompson, R.W.; Pham, C.T. Critical role of dipeptidyl peptidase I in neutrophil recruitment during the development of experimental abdominal aortic aneurysms. Proc. Natl. Acad. Sci. USA 2007, 104, 2855–2860. [Google Scholar] [CrossRef] [Green Version]
- Papayannopoulos, V.; Metzler, K.D.; Hakkim, A.; Zychlinsky, A. Neutrophil elastase and myeloperoxidase regulate the formation of neutrophil extracellular traps. J. Cell Biol. 2010, 191, 677–691. [Google Scholar] [CrossRef] [PubMed] [Green Version]
- Yan, H.; Zhou, H.F.; Akk, A.; Hu, Y.; Springer, L.E.; Ennis, T.L.; Pham, C.T.N. Neutrophil Proteases Promote Experimental Abdominal Aortic Aneurysm via Extracellular Trap Release and Plasmacytoid Dendritic Cell Activation. Arterioscler. Thromb Vasc. Biol. 2016, 36, 1660–1669. [Google Scholar] [CrossRef] [Green Version]
- Evans, C.E. Hypoxia and HIF activation as a possible link between sepsis and thrombosis. Thromb J. 2019, 17, 16. [Google Scholar] [CrossRef] [PubMed] [Green Version]
- Kobori, H.; Harrison-Bernard, L.M.; Navar, L.G. Expression of angiotensinogen mRNA and protein in angiotensin II-dependent hypertension. J. Am. Soc. Nephrol. 2001, 12, 431–439. [Google Scholar] [PubMed]
- Abdul-Hafez, A.; Shu, R.; Uhal, B.D. JunD and HIF-1alpha mediate transcriptional activation of angiotensinogen by TGF-beta1 in human lung fibroblasts. FASEB J. 2009, 23, 1655–1662. [Google Scholar] [CrossRef] [Green Version]
- Koh, T.J.; DiPietro, L.A. Inflammation and wound healing: The role of the macrophage. Expert Rev. Mol. Med. 2011, 13, e23. [Google Scholar] [CrossRef] [PubMed] [Green Version]
- Szade, A.; Grochot-Przeczek, A.; Florczyk, U.; Jozkowicz, A.; Dulak, J. Cellular and molecular mechanisms of inflammation-induced angiogenesis. IUBMB Life 2015, 67, 145–159. [Google Scholar] [CrossRef] [PubMed]
- Weis, N.; Weigert, A.; von Knethen, A.; Brune, B. Heme oxygenase-1 contributes to an alternative macrophage activation profile induced by apoptotic cell supernatants. Mol. Biol. Cell 2009, 20, 1280–1288. [Google Scholar] [CrossRef] [PubMed] [Green Version]
- Sierra-Filardi, E.; Vega, M.A.; Sanchez-Mateos, P.; Corbi, A.L.; Puig-Kroger, A. Heme Oxygenase-1 expression in M-CSF-polarized M2 macrophages contributes to LPS-induced IL-10 release. Immunobiology 2010, 215, 788–795. [Google Scholar] [CrossRef] [PubMed]


| Contractile SMC (α-SMA) | M1 Macrophage (Mac387) | |||
|---|---|---|---|---|
| 0 h | 3 h | 0 h | 6 h | |
| HIF-1α | - | + | - | - |
| AT1 receptor | + | + | - | + |
| ET-1 | - | + | - | - |
| MDA | - | + | - | - |
| MMP-2 | + | + | - | - |
| MMP-9 | - | + | - | + |
| MMP-12 | - | - | - | + |
| MCP-1 | + | + | - | - |
| Neutrophil elastase | - | - | - | - |
| Angiotensinogen | + | + | - | - |
| (A) Pathological events in human AAA and hypoperfusion-induced model. | ||||||||
| Pathological feature | Human AAA | Reference | Hypoperfusion model | Reference | ||||
| Aortic dilation | + | Lancet [10] | + | PLoS ONE [8] | ||||
| Aneurysm rupture | + | Lancet [10] | + | Sci Rep [9], J Oleo Sci [21] | ||||
| Adipogenesis | + | J Vasc Res [13], J Vasc Surg. [11], Acta Biomater [12] | + | Sci Rep [9], J Oleo Sci [21], Adipocyte [30] | ||||
| Intraluminal thrombus | + | J Vasc Surg. [14], J Vasc Surg. [6] | + | PLoS ONE [8] | ||||
| Vascular wall thickening | + | J Surg. Case Rep [15] | + | Sci Rep [9] | ||||
| Medial wall thinning | + | Circulation [16] | + | Sci Rep [9] | ||||
| Collagen fiber degradation | + | Lancet [10] | + | PLoS ONE [8] | ||||
| Elastin fiber degradation | + | Lancet [10] | + | PLoS ONE [8] | ||||
| Gelatinolytic activity | + | J Vasc Surg. [17], World J Surg. [18] | + | PLoS ONE [8] | ||||
| Oxidative stress | + | Clin Sci (Long) [19], In J Cardiol [20] | + | Biosci Biotechnol Biochem [31] | ||||
| Stenosis of vasa vasorum | + | PLoS ONE [7] | + | PLoS ONE [8] | ||||
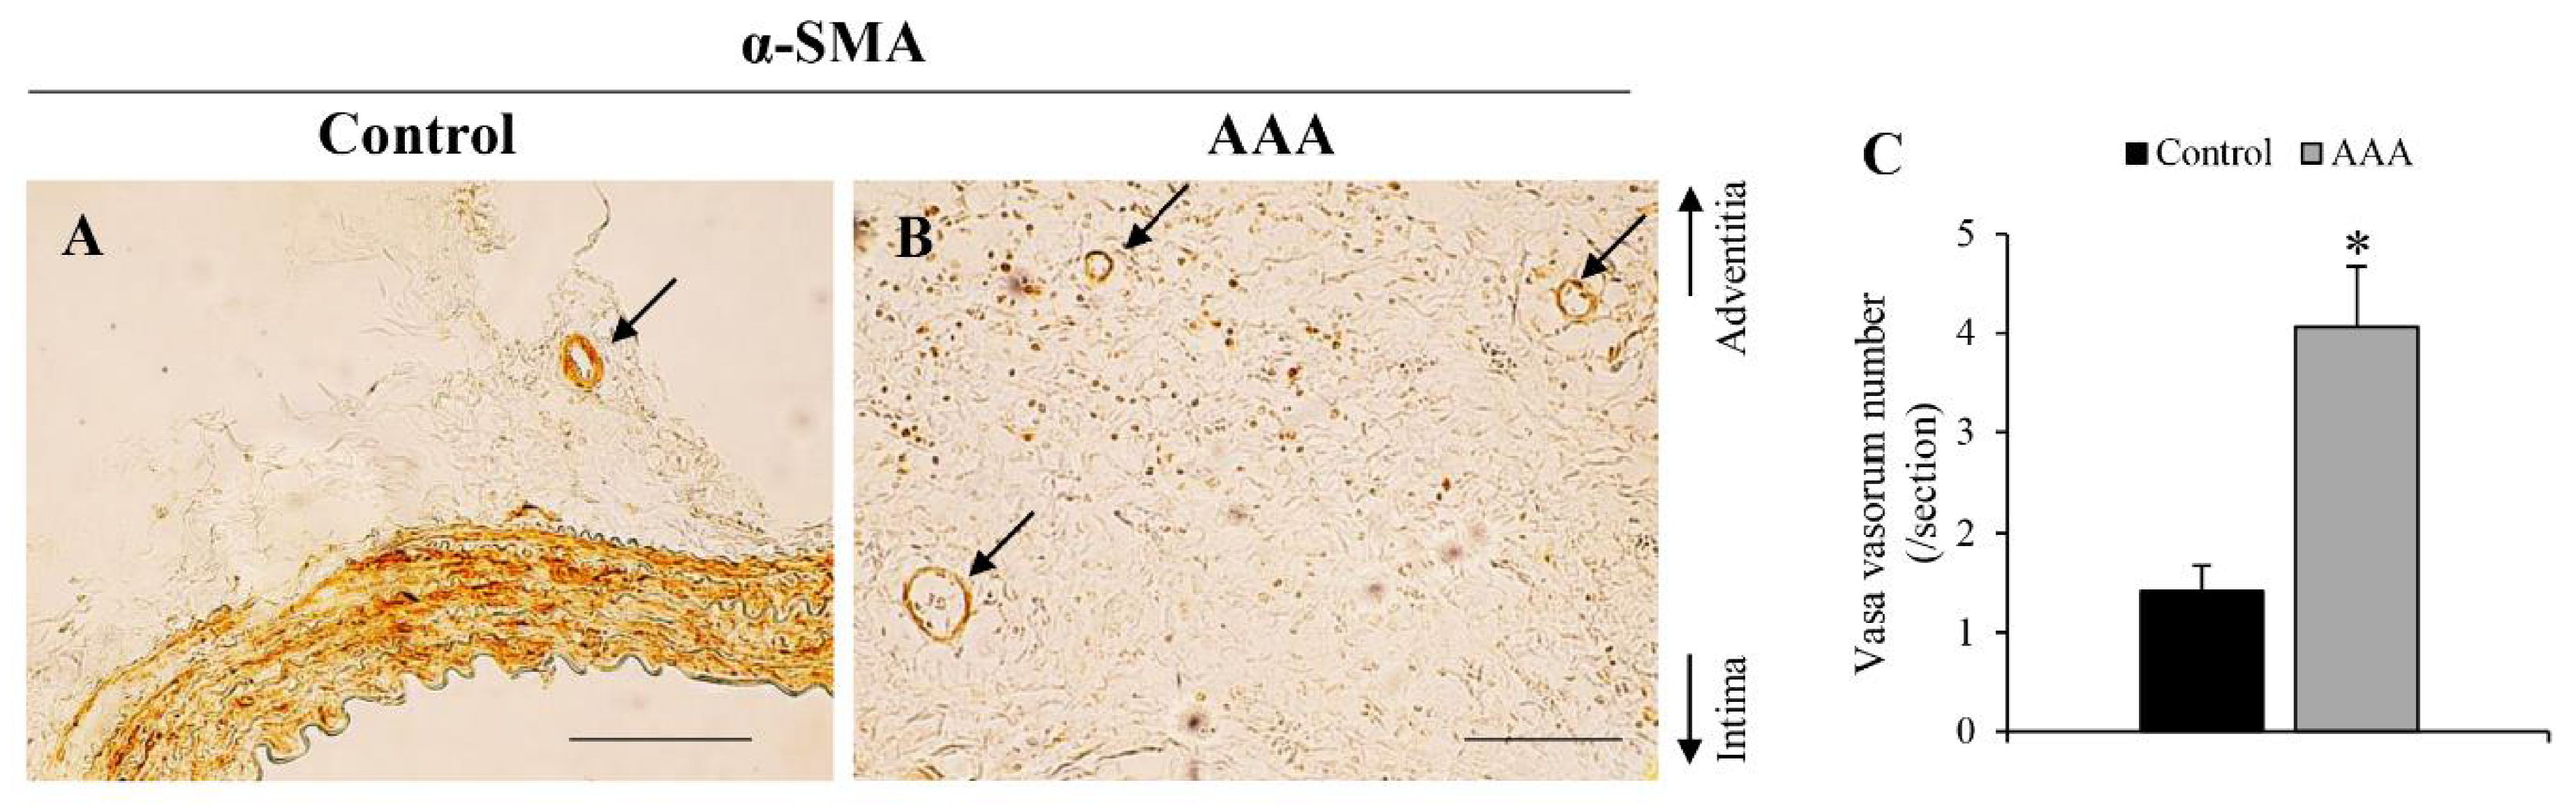
| Angiogenesis | + | J Am Heart Assoc [22], PLoS ONE [32] | + | Figure 7 | ||||
| Atherosclerosis | + | Curr Opin Cardiol [33] | - | |||||
| Calcification | + | Int Angiol [34], Atherosclerosis [35], Circ J [36] | - | |||||
| (B) Protein expressions of AAA-related factors in human AAA and hypoperfusion-induced model. | ||||||||
| Pathological feature | Human AAA | Reference | Hypoperfusion model | Reference | ||||
| HIF-1α | ↑ | J Am Heart Assoc [22] | ↑ | PLoS ONE [8] | ||||
| MMP-2 | ↑ | J Vasc Surg. [17], Ann N Y Acad Sci [37] | ↑ | PLoS ONE [8], Sci Rep [9], J Vasc Res [38], J Oleo Sci [39] | ||||
| MMP-9 | ↑ | J Vasc Surg. [17], Ann N Y Acad Sci [37] | ↑ | PLoS ONE [8], Sci Rep [9], J Vasc Res [38], J Oleo Sci [39] | ||||
| MMP-12 | ↑ | J Clin Invest [23] | ↑ | J Vasc Res [38], J Oleo Sci [39] | ||||
| M1 macrophage | ↑ | Dis Markers [40], Arterioscler Thromb Vasc Biol [24] | ↑ | PLoS ONE [8], Sci Rep [9], J Vasc Res [38], J Oleo Sci [39] | ||||
| M2 macrophage | ↑ | Int J Cardiol [25] | ↑ | Sci Rep [9] | ||||
| MCP-1 | ↑ | Am J Pathol [26] | ↑ | Sci Rep [9], J Vasc Res [38], J Oleo Sci [39] | ||||
| Contractile SMC | ↓ | Arterioscler Thromb Vasc Biol [27] | ↓ | PLoS ONE [8], Sci Rep [9] | ||||
| Synthetic SMC | ↑ | Cardiovasc Pathol [41] | ↑ | Figure 1C | ||||
| Neutrophil elastase | ↑ | Cardiovasc Surg. [42] | ↑ | Figure 1F | ||||
| Angiotensinogen | ↑ | Atherosclerosis [43] | ↑ | Figure 1I | ||||
| AT1 receptor | ↑ | Atherosclerosis [43] | ↑ | Figure 1L | ||||
| MDA | ↑ | Arterioscler Thromb Vasc Biol [44] | ↑ | Figure 1O | ||||
| ET-1 | ? | ↑ | Figure 1R | |||||
| (A) Time-dependent changes of pathological events in hypoperfusion-induced model. | |||||||||||||
| Pathology | Day 1 | ||||||||||||
| 0 h | 3 h | 6 h | 24 h | Day 2 | Day 3 | Day 5 | Day 7 | Day 10 | Day 14 | Day 21 | Day 28 | ||
| Medial wall thickness | → | → | → | → | → | ↓ | ↓ | ↓ | ↓ | ↓ | ↓ | ↓ | |
| Collagen fiber degradation | → | → | → | → | → | → | ↑ | ↑ | ↑ | ↑ | ↑ | ↑ | |
| AAA | → | → | → | → | → | → | → | → | ↑ | ↑ | ↑ | ↑ | |
| (B) Time-dependent changes of protein expressions of AAA-related factors in hypoperfusion-induced model. | |||||||||||||
| Protein | Day 1 | Group | |||||||||||
| 0 h | 3 h | 6 h | 24 h | Day 2 | Day 3 | Day 5 | Day 7 | Day 10 | Day 14 | Day 21 | Day 28 | ||
| HIF-1α | → | ↑ | ↑ | ↑ | ↑ | ↑ | ↑ | ↑ | ↑ | ↑ | ↑ | ↑ | First |
| AT1 receptor | → | ↑ | ↑ | ↑ | ↑ | ↑ | ↑ | ↑ | ↑ | ↑ | ↑ | ↑ | |
| ET-1 | → | ↑ | ↑ | ↑ | ↑ | ↑ | ↑ | ↑ | ↑ | ↑ | ↑ | ↑ | |
| MDA | → | ↑ | ↑ | ↑ | ↑ | ↑ | ↑ | ↑ | ↑ | ↑ | ↑ | ↑ | |
| MMP-2 | → | → | ↑ | ↑ | ↑ | ↑ | ↑ | ↑ | ↑ | ↑ | ↑ | ↑ | Second |
| MMP-9 | → | → | ↑ | ↑ | ↑ | ↑ | ↑ | ↑ | ↑ | ↑ | ↑ | ↑ | |
| MMP-12 | → | → | ↑ | ↑ | ↑ | ↑ | ↑ | ↑ | ↑ | ↑ | ↑ | ↑ | |
| M1 macrophage (Mac387) | → | → | ↑ | ↑ | ↑ | ↑ | ↑ | ↑ | ↑ | ↑ | ↑ | ↑ | |
| MCP-1 | → | → | ↑ | ↑ | ↑ | ↑ | ↑ | ↑ | ↑ | ↑ | ↑ | ↑ | |
| Synthetic SMC (SMemb) | → | → | → | → | ↑ | ↑ | ↑ | ↑ | ↑ | ↑ | ↑ | ↑ | Third |
| Neutrophil elastase | → | → | → | → | → | ↑ | ↑ | ↑ | ↑ | ↑ | ↑ | ↑ | Forth |
| Angiotensinogen | → | → | → | → | → | ↑ | ↑ | ↑ | ↑ | ↑ | ↑ | ↑ | |
| Contractile SMC (α-SMA) | → | → | → | → | → | ↓ | ↓ | ↓ | ↓ | ↓ | ↓ | ↓ | |
| M2 macrophage (CD163) | → | → | → | → | → | → | → | → | → | → | ↑ | ↑ | Fifth |
Publisher’s Note: MDPI stays neutral with regard to jurisdictional claims in published maps and institutional affiliations. |
© 2021 by the authors. Licensee MDPI, Basel, Switzerland. This article is an open access article distributed under the terms and conditions of the Creative Commons Attribution (CC BY) license (http://creativecommons.org/licenses/by/4.0/).
Share and Cite
Kugo, H.; Sukketsiri, W.; Tanaka, H.; Fujishima, R.; Moriyama, T.; Zaima, N. Time-Dependent Pathological Changes in Hypoperfusion-Induced Abdominal Aortic Aneurysm. Biology 2021, 10, 149. https://0-doi-org.brum.beds.ac.uk/10.3390/biology10020149
Kugo H, Sukketsiri W, Tanaka H, Fujishima R, Moriyama T, Zaima N. Time-Dependent Pathological Changes in Hypoperfusion-Induced Abdominal Aortic Aneurysm. Biology. 2021; 10(2):149. https://0-doi-org.brum.beds.ac.uk/10.3390/biology10020149
Chicago/Turabian StyleKugo, Hirona, Wanida Sukketsiri, Hiroki Tanaka, Rena Fujishima, Tatsuya Moriyama, and Nobuhiro Zaima. 2021. "Time-Dependent Pathological Changes in Hypoperfusion-Induced Abdominal Aortic Aneurysm" Biology 10, no. 2: 149. https://0-doi-org.brum.beds.ac.uk/10.3390/biology10020149