
Investigating Market Diffusion of Electric Vehicles with Experimental Design of Agent-Based Modeling Simulation


1
Major in Industrial Data Science & Engineering, Department of Industrial and Data Engineering, Pukyong National University, Busan 48513, Korea
2
Department of Systems Management and Engineering, Pukyong National University, Busan 48513, Korea
*
Author to whom correspondence should be addressed.
Systems 2022, 10(2), 28; https://0-doi-org.brum.beds.ac.uk/10.3390/systems10020028
Submission received: 30 January 2022
/
Revised: 26 February 2022
/
Accepted: 28 February 2022
/
Published: 2 March 2022
(This article belongs to the Topic Toward the New Era of Sustainable Design, Manufacturing and Management)
Abstract
:The transportation sector is recognized as one of the largest contributors to the problems of global warming and environmental pollution, and is responsible for a great deal of global energy consumption, which is heavily dependent upon scarce crude oil reserves. Different countries have adopted promotional policies to replace conventional internal combustion engine vehicles with electric vehicles as a means of mitigating global warming. Nevertheless, the current market share of eco-friendly vehicles remains stagnant in many parts of the world. This study aims to investigate the impact and relative importance of financial, technical, and political measures on the market penetration of electric vehicles using an agent-based simulation. More specifically, a series of agent-based simulation experiments is carried out following the statistical experimental design scheme to systematically assess the diffusion of electric vehicles. Affected by various factors and measures, the choice behavior of individual agents is modeled with a multinomial logit utility function of experimental factors. The simulated data are analyzed using different analysis methods, including full factorial analysis, response surface methodology, and support vector machine, in order to scrutinize the effects of different measures. It is advocated that factors affecting the choice of vehicle by individuals, including two-way interactions among various measures as well as policy measures such as purchase subsidies and tax breaks, have more significant effects on the widespread adoption of electric vehicles than do technical improvements in terms of battery charging times and driving mileage. This implies that the adoption of such measures needs to be carefully designed in order to account for potential interactions among individual measures as well as their main effects on the diffusion of electric vehicles.
1. Introduction
Climate change has emerged as one of the biggest environmental challenges around the globe, mainly due to increased greenhouse gas (GHG) emissions [1,2]. Consuming energy in significant quantities and accounting for more than 20% of global energy consumption in 2013 [3], the transportation sector is recognized as one of the main contributors to global warming due to the rising number of vehicles, which currently account for about 17% of global carbon dioxide (CO2) emissions [3]. Hence, both climate change and the scarcity of energy resources require a transition to an energy-efficient transportation system. Electric vehicles (EVs) that can operate either partially or fully on electric power are a promising alternative to conventional internal combustion engine vehicles (ICEVs). The use of such vehicles may significantly reduce both air and noise pollution from passenger and freight vehicles. There are different types of EVs; the four common types are hybrid electric vehicles (HEVs), plug-in hybrid electric vehicles (PHEVs), battery electric vehicles (BEVs), and fuel cell electric vehicles (FCEVs); readers may refer to [4] for more detailed descriptions of each type. Overall, HEV and PHEV can be categorized as hybrid vehicles (HVs) that have reduced emission levels compared to conventional ICEVs that use diesel or gasoline, whereas BEVs and FCEVs are zero-emission vehicles (ZEVs) that can be considered a viable step toward zero-carbon transportation.
As a means of mitigating climate change, several countries have begun to implement policy measures such as subsidy incentives and tax reductions to support the shift from the traditional ICEVs to EVs. Nonetheless, the global market of vehicles remains dominated by ICEVs, and the share of EVs is small, accounting for only 12% in 2020 [5]. There are an increasing number of studies investigating the market diffusion of EVs and the impacts of technological advancements and various policies. Most previous studies have been concerned with price-related attributes; non-monetary incentives, which may largely influence the diffusion of EVs, have received less attention. As pointed out in [6], indirect and non-monetary incentives should be incorporated in examinations of EV diffusion. Further, it is critical to investigate the relative importance of a combination of different policy measures in expanding the spread of EVs in order to deal with the problems of global warming and energy scarcity; this has not been addressed sufficiently in the literature. Mathematical models have traditionally been used to examine the diffusion behavior of innovations. Examples of such models include the epidemic model pioneered by [7], the rational choice or threshold model in [8], and the evolutionary (or non-equilibrium) model proposed in [9]. For example, Hackbarth and Madlener [10] and Hoen and Koetse [11] analyzed customers’ EV purchasing behavior using discrete choice models, including mixed logit models. On the other hand, structural equation models have been employed by other authors, including Degirmenci and Breitner [12]. Although these models have demonstrated their value in analyzing diffusion behavior, they have yet to be applied to new emerging environmental products [13]. It is argued here that these mathematical models may have limitations when considering details of the effects of individual policy measures and their interactions on diffusion. Alternatively, the agent-based modeling (ABM) approach has drawn growing attention for analysis of the EV diffusion [13,14,15,16,17,18,19]. Specifically, an ABM analysis of innovation diffusion was conducted by incorporating the context of changing social appraisal and regulatory support for eco-friendly vehicles in [13], where two different scenarios were investigated. Eppstein et al. [14] developed an ABM-based vehicle choice model accounting for spatial, social, and media effects on the market penetration of PHEVs. Exploring possible interactions between policies and consumer behavior, Kangur et al. [15] used a social simulation model based on survey data to forecast the market share of PHEVs and BEVs in the Netherlands. Ning et al. [16] established an ABM model of the consumer choice behavior in the context of EV sharing from the perspective of individual preference and social network influences. The market diffusion of EVs has been investigated under different regional contexts in [17,18,19]. An Electric Vehicle Regional Market Penetration Tool was developed to analyze the potential market share of EVs in the United States in the year 2030, and suggested that government subsidies can play a vital role in the market penetration of EVs [17]. The evolution of EV market share was investigated in [18] in the context of EV competition with ICEVs for market penetration in the passenger car market of Iceland using a vehicle choice algorithm that accounted for social influences and consumer preferences. Most recently, the market acceptance of EVs in China under multi-policy scenarios was scrutinized through consideration of consumer preferences, charging facilities, and subsidies [19].
Along these lines, this study is aimed at contributing to the existing literature on the development of ABM for analyzing the market diffusion of EVs. The defining aspect of this study is to adopt a statistical analysis of experimental design combined with ABM to examine the interactions of individual factors as well as their main effects. The use of the experimental design is considered highly efficient for systematic assessment and in order to delve into the relationship between output variables and the statistical factors affecting them. To the best of our knowledge, such as study using the experimental design approach to investigate the diffusion behavior of EVs has not yet been conducted. Furthermore, the findings in the related literature reveal that the relative contributions of individual measures to EV diffusion are not well specified and often inconsistent. Therefore, we propose to employ a support vector machine (SVM) methodology, which may be well-suited for examining the relative importance of individual factors. Finally, previous studies have often only considered a single alternative option, which may neglect possible competition among different types of eco-friendly vehicles. On the contrary, six different types of vehicles (Gasoline ICEV, Diesel ICEV, HEV, PHEV, BEV, and FCEV) are considered here. The remainder of this article is organized as follows: the development of ABM is described in the next section, followed by the experimental design scheme for the purpose of statistical analysis. The simulated data from the ABM are then analyzed to examine the effects of individual factors and their interactions on the diffusion of EVs, using SVM and response surface methodology (RSM). Concluding remarks follow in the final section.
2. Model Development
The empirical analysis of experiments in this study was grounded in an ABM simulation, in which six different types of vehicles, namely, Gasoline ICEVs, Diesel ICEVs, HEVs, PHEVs, BEVs, and FCEVs, were considered to be available for sale in an artificial marketplace. It is intuitive that customers’ preferences for EVs are affected by various factors, including policy measures, technical aspects, and monetary attributes. Sierzchula et al. [20] classified the factors affecting EVs diffusion into internal and external ones. Internal factors may include characteristics of the EVs themselves, such as purchase price, driving mileage, and battery charging time. On the other hand, external factors are those factors that are out of the direct control of manufacturers, such as consumer characteristics and preferences, fuel prices, availability of charging stations, and policy incentives such as subsidies and tax reductions; there is a growing body of literature focusing on the effects of financial incentives in facilitating EV diffusion. Social networks and interactions may play a significant role in the diffusion of any technological innovation, including EVs [16]; it has been previously discussed that technology diffusion proceeds much faster in a clustered environment [16,21].
In the context of the behavioral dimension, every customer is assumed to make a rational decision in purchasing a vehicle with the highest level of utility among the different vehicle type alternatives. The utility represents the value attributed to each type of vehicle choice based on how customers perceive each alternative. Several attributes can accordingly be identified as the main inputs of the utility function, including purchase price, fuel cost of ICEVs/charging cost of EVs, driving mileage per full tank/full charge, tank refueling time/battery recharging time, availability of the fuel/charging stations, and CO2 emissions. These attributes were selected for this study because they correspond to the most common vehicle characteristics applied in the literature and are the most important vehicle features affecting the car purchase decision-making process of customers. A multinomial logit function was employed to represent the utility of individuals, as the most common way to mathematically model technology diffusion processes involves exponential functions. Thus, the utility of each vehicle type is generally assumed to be an exponential linear combination of all the attributes of each vehicle type multiplied by a preference parameter that denotes the weight of the attribute.
Given a combination of attributes, the ABM simulation was run to examine the spread of eco-friendly vehicles in the market over time. A simulation run may yield different results for different settings of attributes, as the utility function is dependent upon the attributes. Thus, the behavior of EV diffusion may be observed for various settings of attributes which can be realized through the application of the experimental design. For the purpose of this study, six different factors associated with the diffusion of EVs were considered in the design of experiment. First and foremost, the cost of transition to EVs and the purchase and operating costs (e.g., fueling) are the most crucial factors. The relatively higher purchase price compared to the ICEVs is the major impediment to EV diffusion. In an attempt to lower the barrier to EV transition, policy measures such as subsidies and tax benefits have been widely implemented in many countries for the purpose of promoting EV market diffusion. In order to reduce the negative influence of the higher price of EVs, financial incentives are important and used by many countries. However, there are contradictory findings as to the effectiveness of such polices in facilitating the diffusion of EVs. Sierzchula et al. [20] found financial incentives to be slightly positive and statistically significant, whereas Zhang et al. [22] found no evidence of the impact of incentives on EV purchases. In addition to subsidies, there are other policies (e.g., no driving restrictions, free parking, priority/bus lane access) applied in the EV marketplace which can be expected to promote the diffusion of EVs [23]. It is obvious that the fuel cost as well as subsidy and tax benefits affect the transition to EVs from the cost perspective, and any consequent effects on the diffusion of EVs must be investigated in order to implement policy measures effectively. The low accessibility of charging stations is a significant barrier for the diffusion of EVs. There is no common operationalization for the accessibility of charging stations, and different definitions have been used in the literature. Several of these definitions involve the density of charging stations relative to usual fuel stations, the distance from home to the closest charging station, and the presence of charging stations in different areas [24]. Whatever definition is considered, addressing charging infrastructure as a barrier is essential. It should be noted, however, that the installation of charging stations is hampered by future demand uncertainty, which increases the risk associated with the investment. In general, customer adoption of EVs is coupled with the development of current and future charging infrastructures. Finally, limited driving mileage per full charge and longer charging times are the two major technical barriers to EV diffusion. As most EVs currently available on the market have relatively shorter driving mileage compared to conventional ICEVs, customers may be concerned about the possibility of running out of power. Such limited-range vehicles may not be useable for longer trips, especially if charging stations are not sufficiently available. If customers feel that they cannot use a vehicle for certain their trips, this represents a significant barrier to purchasing EVs. Another issue from the technical aspect is the time required for charging the battery. Though EVs may save energy costs by using electricity, the battery charging time is significantly longer than the fueling time of ICEVs. The inadequacy of charging stations makes the impact of this technical barrier more severe.
For initializing the ABM simulation, the baseline values of individual factors were taken from different sources in the literature, as summarized in Table 1. The fuel cost was derived from the cost of fuel or fuel-equivalent in dollars per 100 km distance travelled by each vehicle type. This cost has the same unit of measurement and is easily comparable among the different vehicle alternatives, whether propelled by fuel or electricity. The purchase price is the price of each type of vehicle in thousands of US Dollars. The driving mileage is the distance traveled on a full tank of fuel and/or a fully charged battery. The refueling time is the time in minutes to refuel the entire tank, whereas the recharging time is the time in minutes to fully charge the battery. Lastly, fuel/charging station availability and CO2 emissions are expressed in percentages relative to conventional ICEVs. All the baseline values can be adjusted as per the actual values of the vehicle market contexts based on stated preference survey data, although data from the current literature are used for demonstration purposes in this study. The ABM simulation was constructed using NetLogo software version 6.2.0. Each iteration (called a ‘tick’ in NetLogo) in the simulation corresponds to a month, and all simulations were run for ten years. For each iteration, a random sample of individuals was generated from a Poisson distribution with a mean of 500, which formed the market of newly purchased vehicles. Then, the potential utility for each type of vehicle was calculated for individual customers. As mentioned earlier, the utility function was constructed as a multinomial logit model, and is thus expressed as a linear combination of different factors, which are listed in Table 1.
For example, denotes the utility for customer of vehicle type , expressed as
where and represent the normalized value of attribute for customer and the preference parameter for vehicle type with respect to attribute , respectively, and is the number of attributes considered in the model. Each attribute may have a different range of values from others, which could affect the simulation experiments in such a way that attributes with larger values automatically have greater effects on the utility model. To overcome this problem, individual attributes were normalized such that all attributes would an impartial influence on a specified objective function [27], which in this study was the utility function.
Accounting for uncertainties or variations associated with the choice of vehicle purchase, the random error was introduced and assumed to follow a normal distribution , as is usual. Let denote the utility-based choice probability of customer for vehicle type ; then
where is the number of vehicle types available on the market. Then, a random number representing the choice probability of customer (denoted by ) can be generated from a uniform distribution between 0 and 1, and the customer will make a purchase decision for a vehicle of type if for where . Once the purchase decisions are made by all the individuals at each iteration, the market share of each vehicle type can simply be obtained over time. The pseudo-code for the ABM simulation algorithm is presented in Algorithm 1.
| Algorithm 1 Pseudo-Code for ABM Simulation |
| 1: for to do 2: Generate customers from a Poisson distribution with mean 500; 3: for to do 4: for =1 to do 5: Calculate utility for vehicle type ; 6: end 7: Utility vector for customer ; 8: Utility-based choice probability vector for customer ; 9: Generate a random probability from a Uniform distribution (0,1); 10: Choose vehicle type it 11: end 12: Count each type of vehicles purchased before or at time ; 13: Determine the cumulative market share of each vehicle type. 14: end |
3. Experimental Design and Simulation Results
The design of experiments has widely been employed to investigate and systematically assess the causal relationship between input and output variables. This study adopted a conventional three-level factorial design to examine the statistical significance of various factors and their interactions on the diffusion of EVs in the market. The interactions among different factors refer to the likelihood a variable will have a different effect on the output variable depending on the level of another variable; thus, the interrelationship among different measures can be effectively estimated. The six factors considered here were subsidies, tax reductions, fueling cost, driving mileage per full tank/charge, fueling/battery charging time, and charging station availability. The output variable was the market share of six different car types, namely, Gasoline ICEV, Diesel ICEV, HEV, PHEV, BEV, and FCEV. The respective levels for each factor are summarized in Table 2. The number of factor level combinations in the simulation was 729 (i.e., three levels for six, factors, yielding ), and the simulation was replicated ten times at each combination to mitigate the influence of random variations, resulting in 7290 observations. The simulated data were then exported to R for statistical analysis.
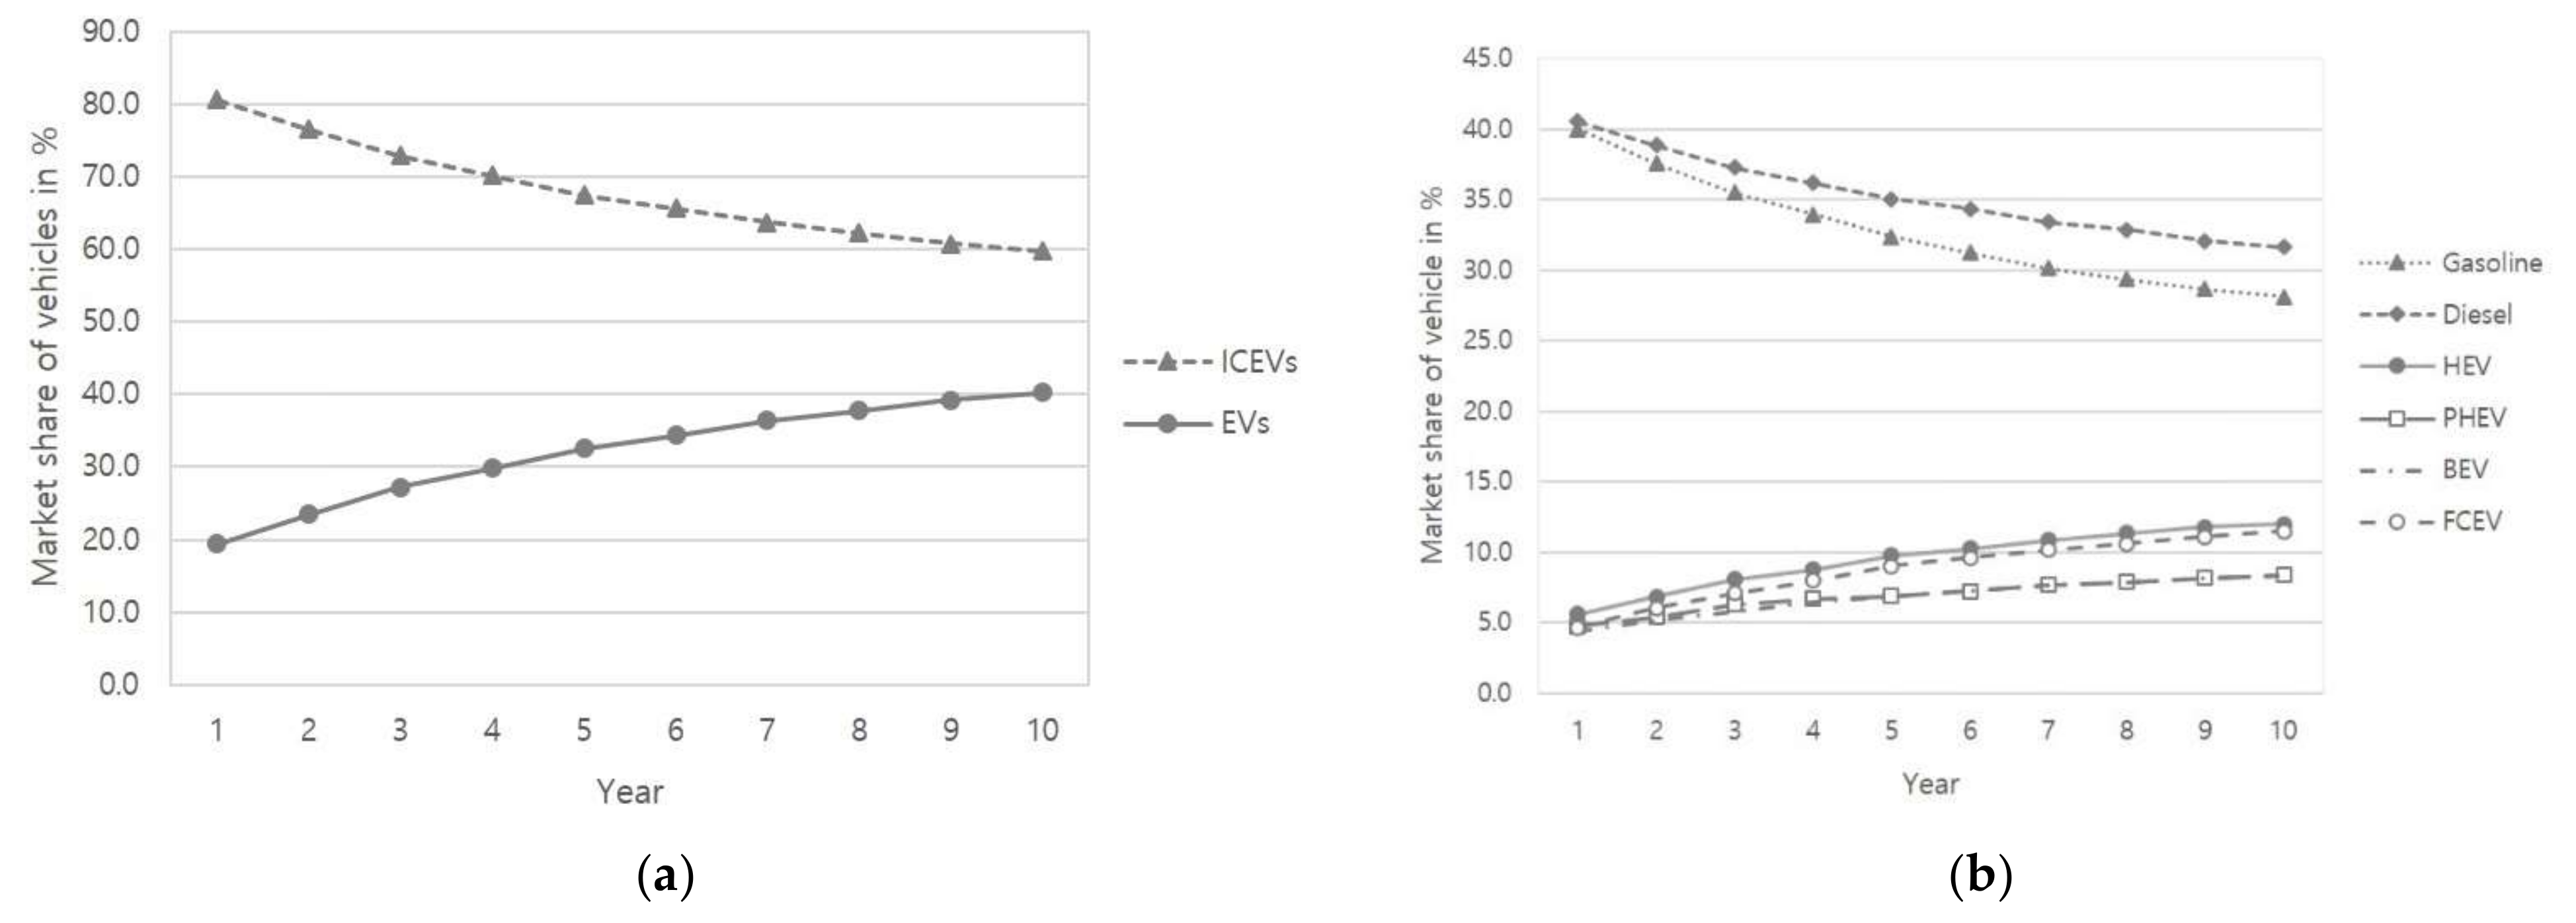
The baseline scenario assumed a 5% purchase tax for Gasoline and Diesel ICEVs by default, no subsidies provided for EVs, no fuel cost increase, the usual driving mileage of EVs, the existing charging time, and the currently available charging stations, as specified in Table 1. The simulation results for the baseline scenario are depicted in Figure 1. The total market share of EVs at the end of the simulation (i.e., ten years) increased from the initial 19.43% to 40.22%. Specifically, the market shares of HEVs, PHEVs, BEVs, and FCEVs increased from 5.59% to 11.99%, 4.78% to 8.36%, 4.39% to 8.35%, and 4.66% to 11.52%, respectively. On the other hand, the market share of ICEVs decreased from 80.57% to 59.78%, specifically 40.02% to 28.13% for Gasoline vehicles and 40.55% to 31.65% for Diesel vehicles. These results indicate that conventional ICEVs remained dominant in the baseline scenario.
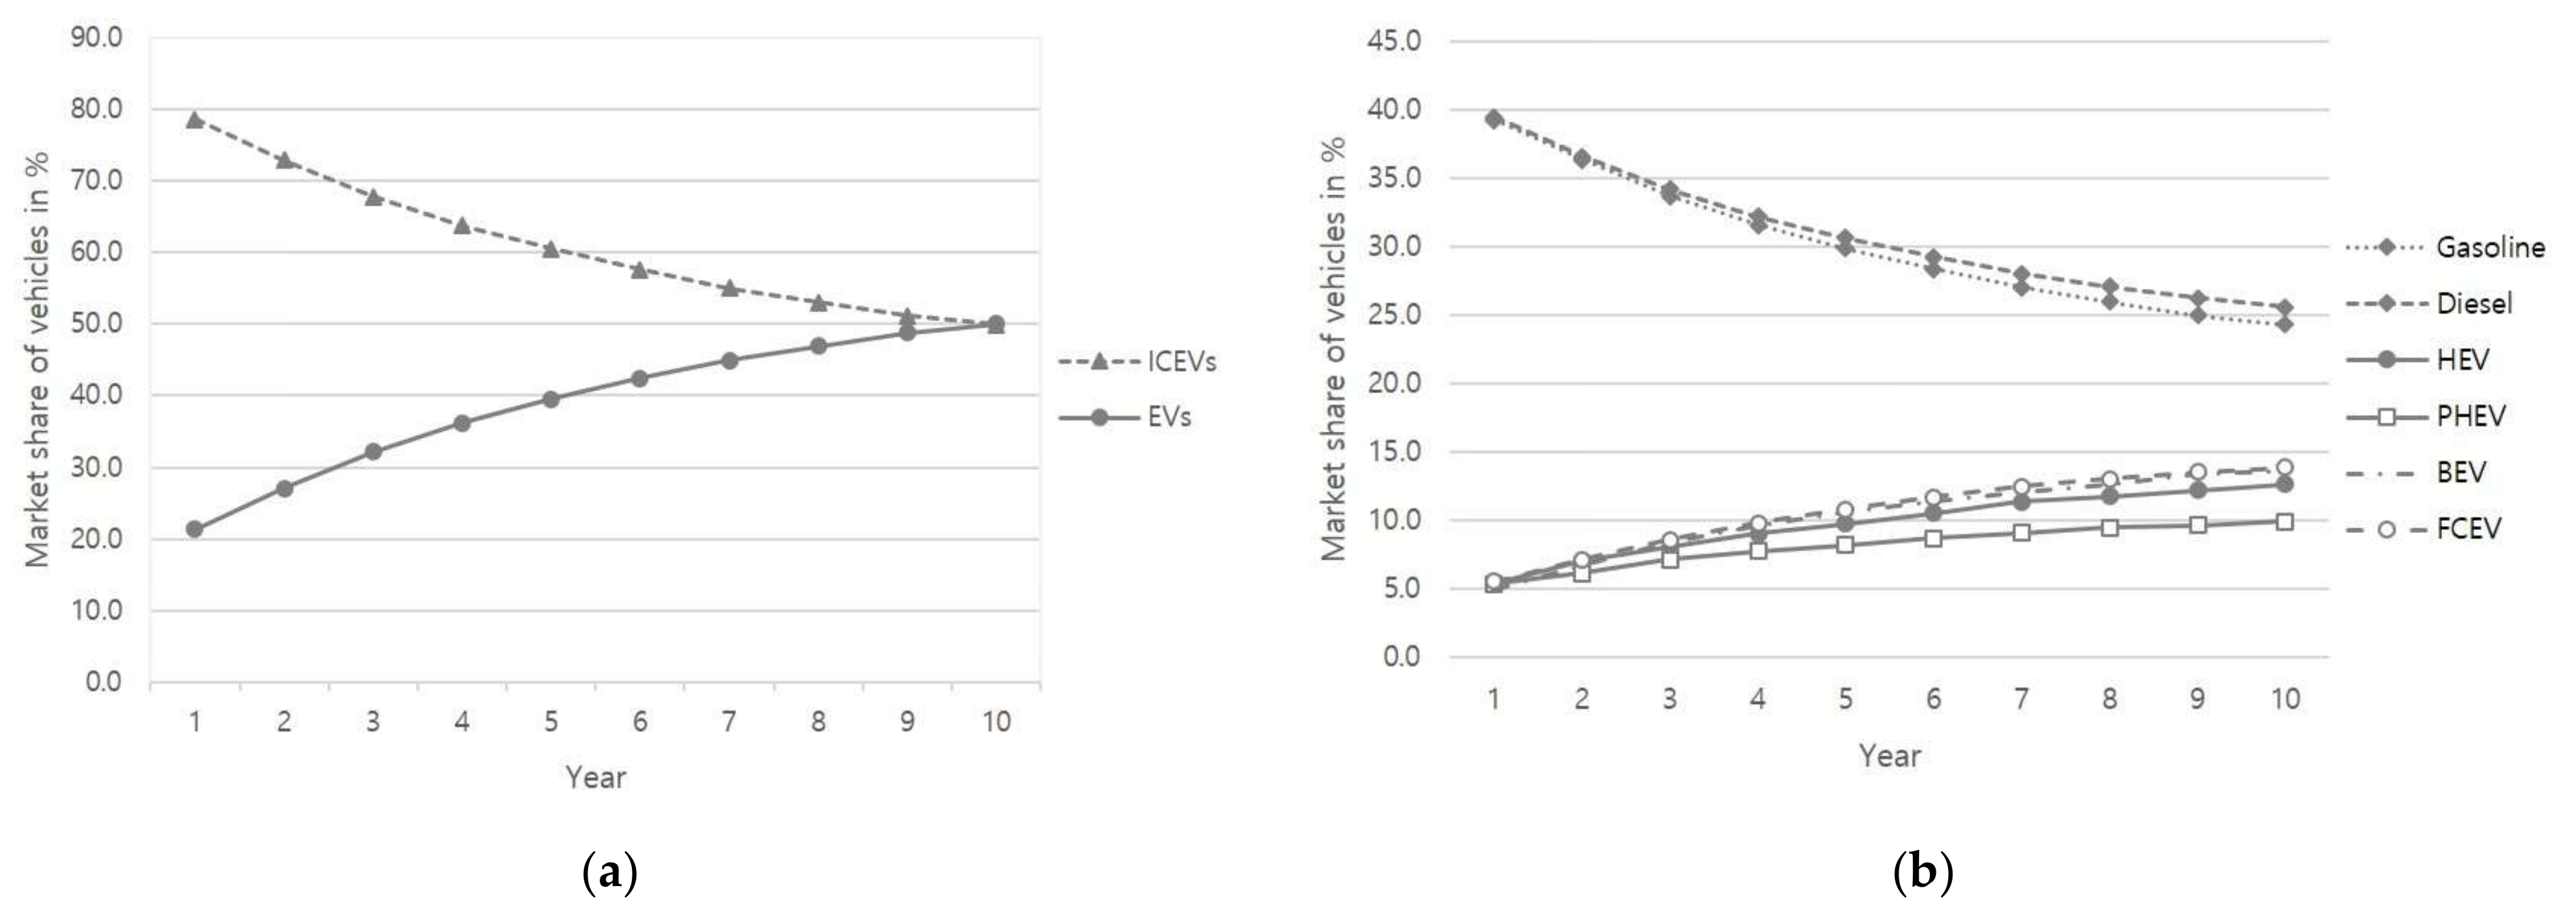
For the sake of comparison, an alternative scenario was analyzed, and is depicted in Figure 2. The alternative scenario assumed a 15% purchase tax on ICEVs, 20% of the purchase price of Evs covered by a subsidy, fuel costs increased by 15%, driving mileage of Evs improved by 50%, battery charging time of Evs decreased by 50%, and double the charging station availability. In this scenario, the market share of all Evs increased from the initial 21.30% to 50.07%. Specific to each type of EV, HEVs increased from 5.37% to 12.65%, PHEVs increased from 5.37% to 9.93%, BEVs increased from 4.99% to 13.64%, and FCEVs increased from 5.58% to 13.85. On the contrary, the market share of ICEVs decreased from the initial 78.70% to 49.93%. It seems that Evs tend to penetrate the market at the end of ten years, and become dominant in the market under this specific scenario. Of course, there could be other possible scenarios under which the market is dominated by Evs among the 729 different possible combinations of factor levels.
4. Statistical Analysis of SVM and RSM
4.1. Feature Selection with SVM
In any kind of statistical modeling feature selection is an important aspect, as it helps in building predictive models, such as response surface models, that are free from multi-collinearity, biases, and unwanted noises. In this study, SVM methodology was adopted for the feature selection. Specifically, the selection of features was carried out using the Boruta algorithm, which is known to be computationally efficient and simple. In fact, there are different approaches available for assessing relative importance in SVM. However, most methods select features on the basis of their scores as a preprocessing step; thus, feature selection is independent of any machine learning algorithm. On the contrary, the Boruta algorithm captures all important and significant features with respect to a response variable through a random forest classifier, which requires no user-defined parameters to tune; thus, it overcomes the drawbacks of the existing feature selection approaches. For this reason, the Boruta algorithm was used to screen the most important factors of the candidate features. Accordingly, the relative importance of each factor to the market share of EVs as a whole and on each type of EV could be identified, as presented in Table 3.
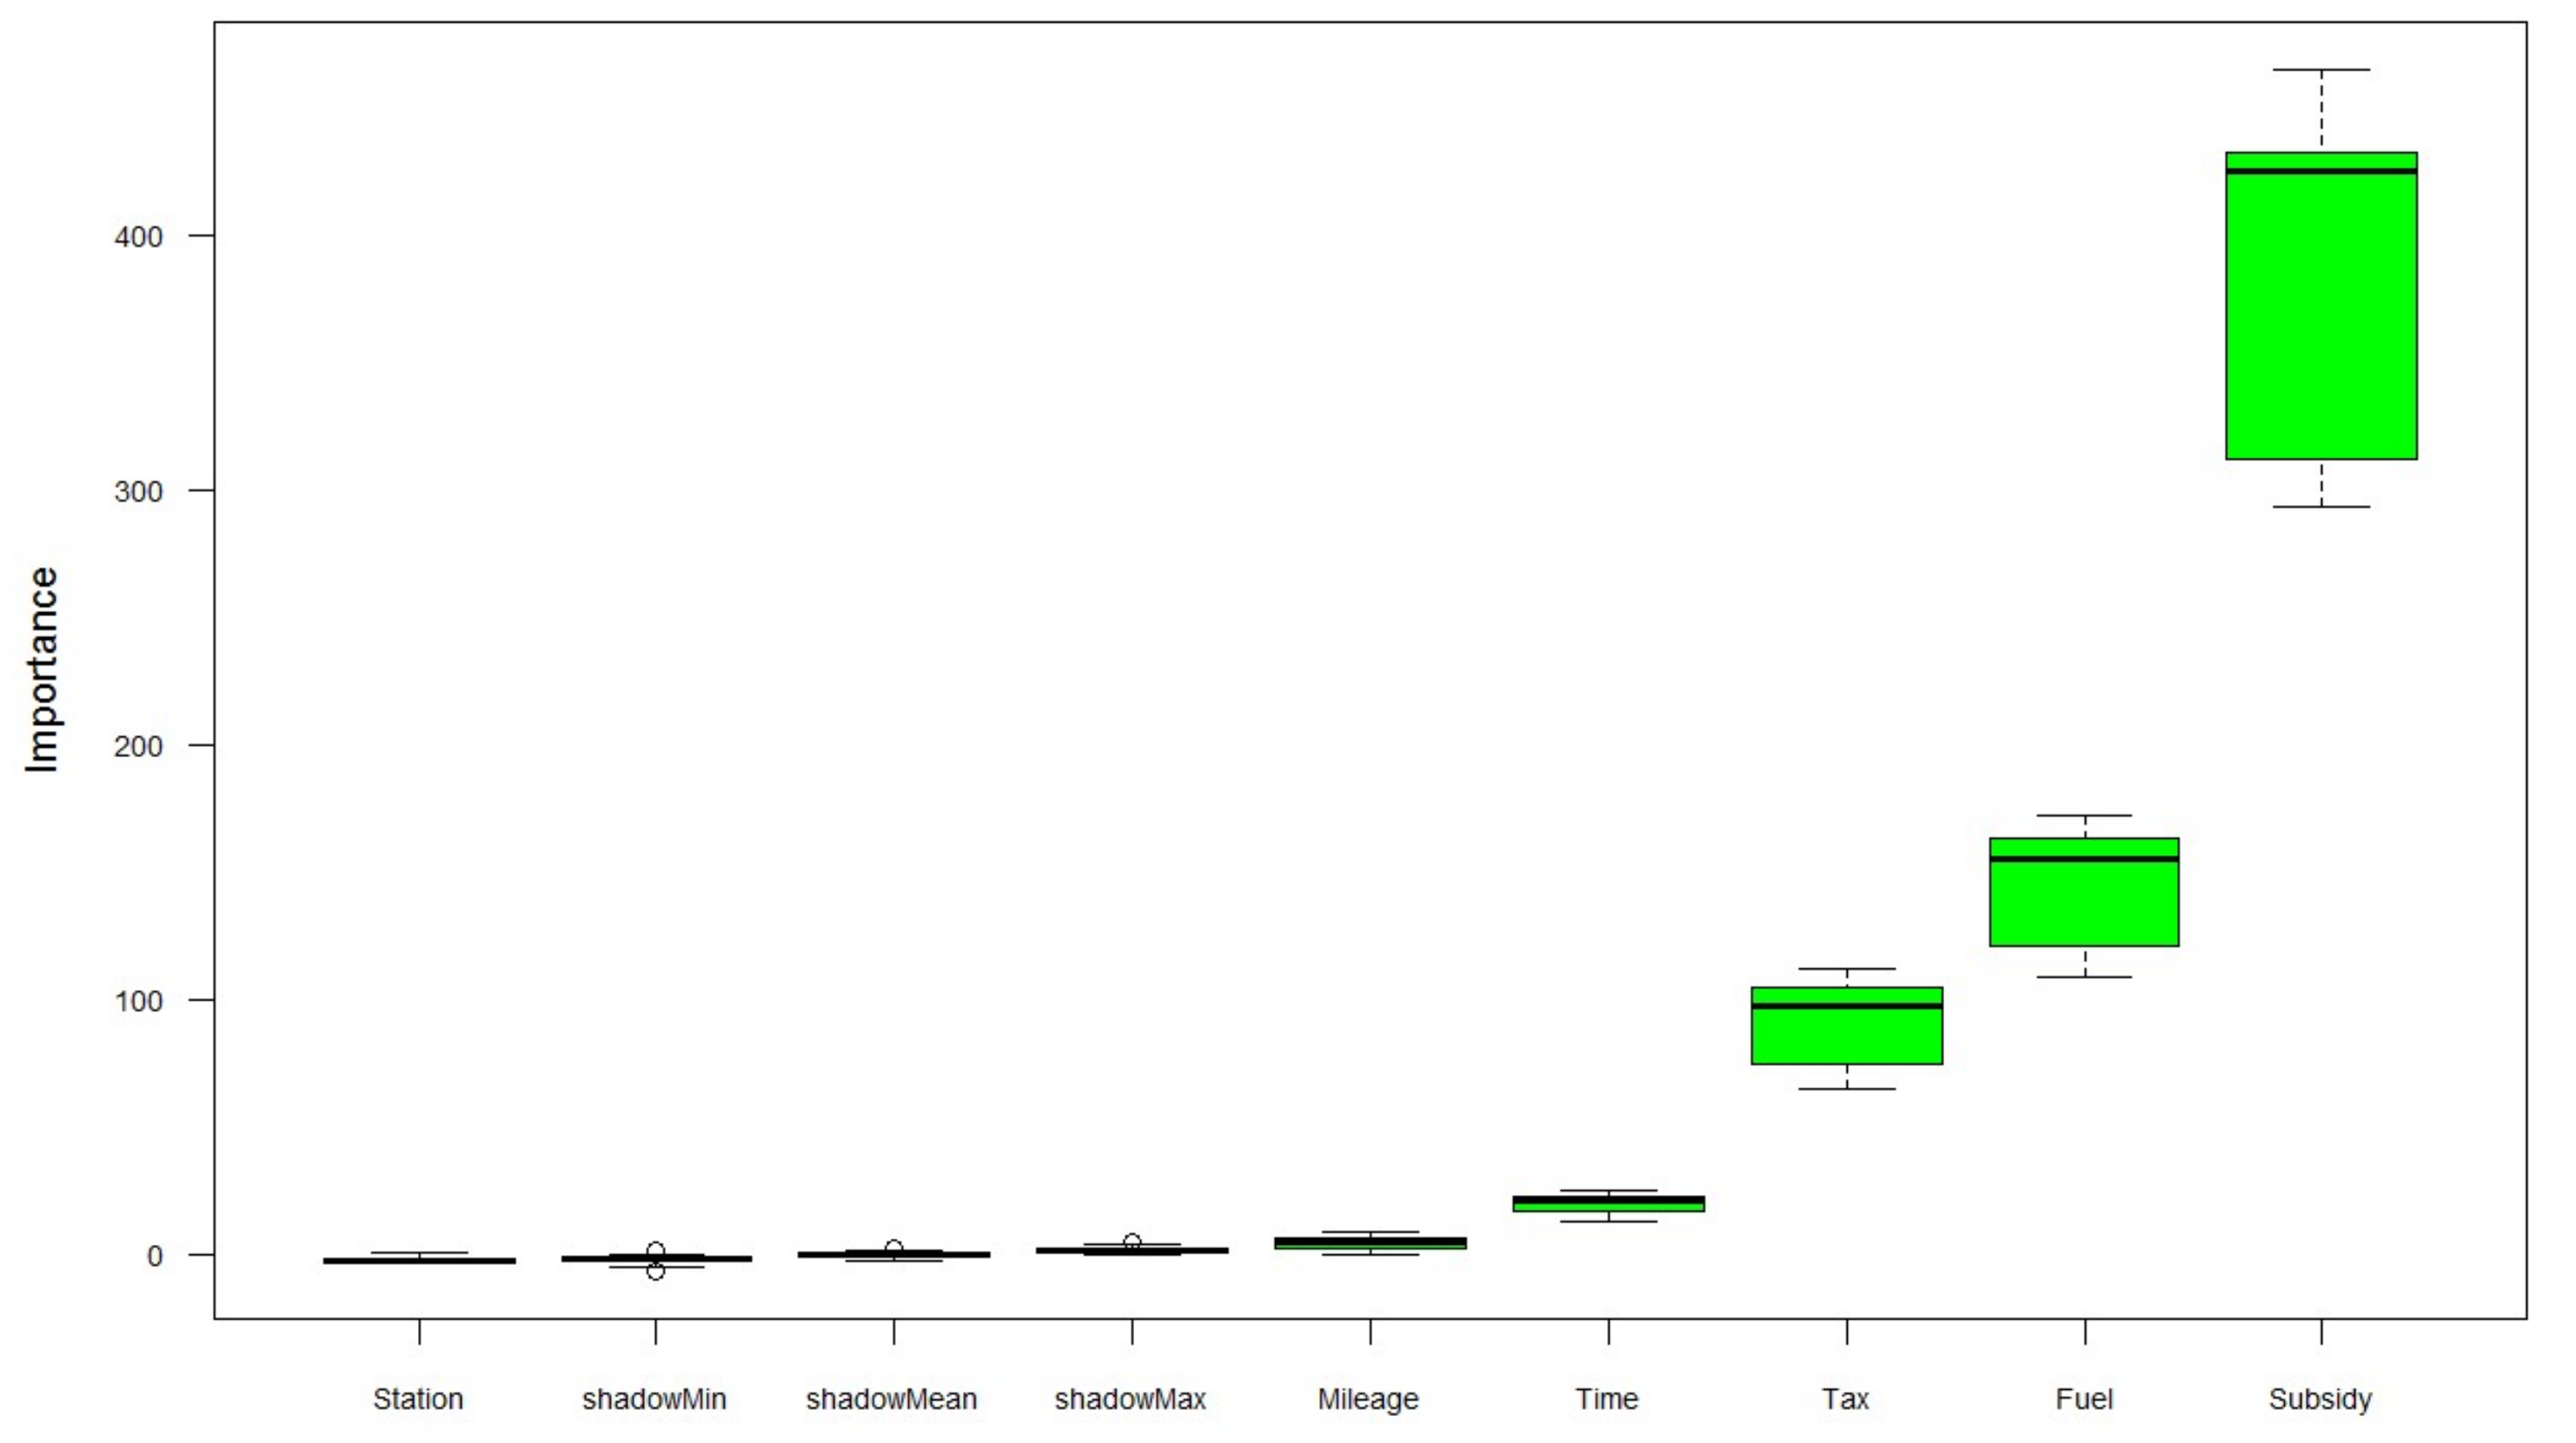
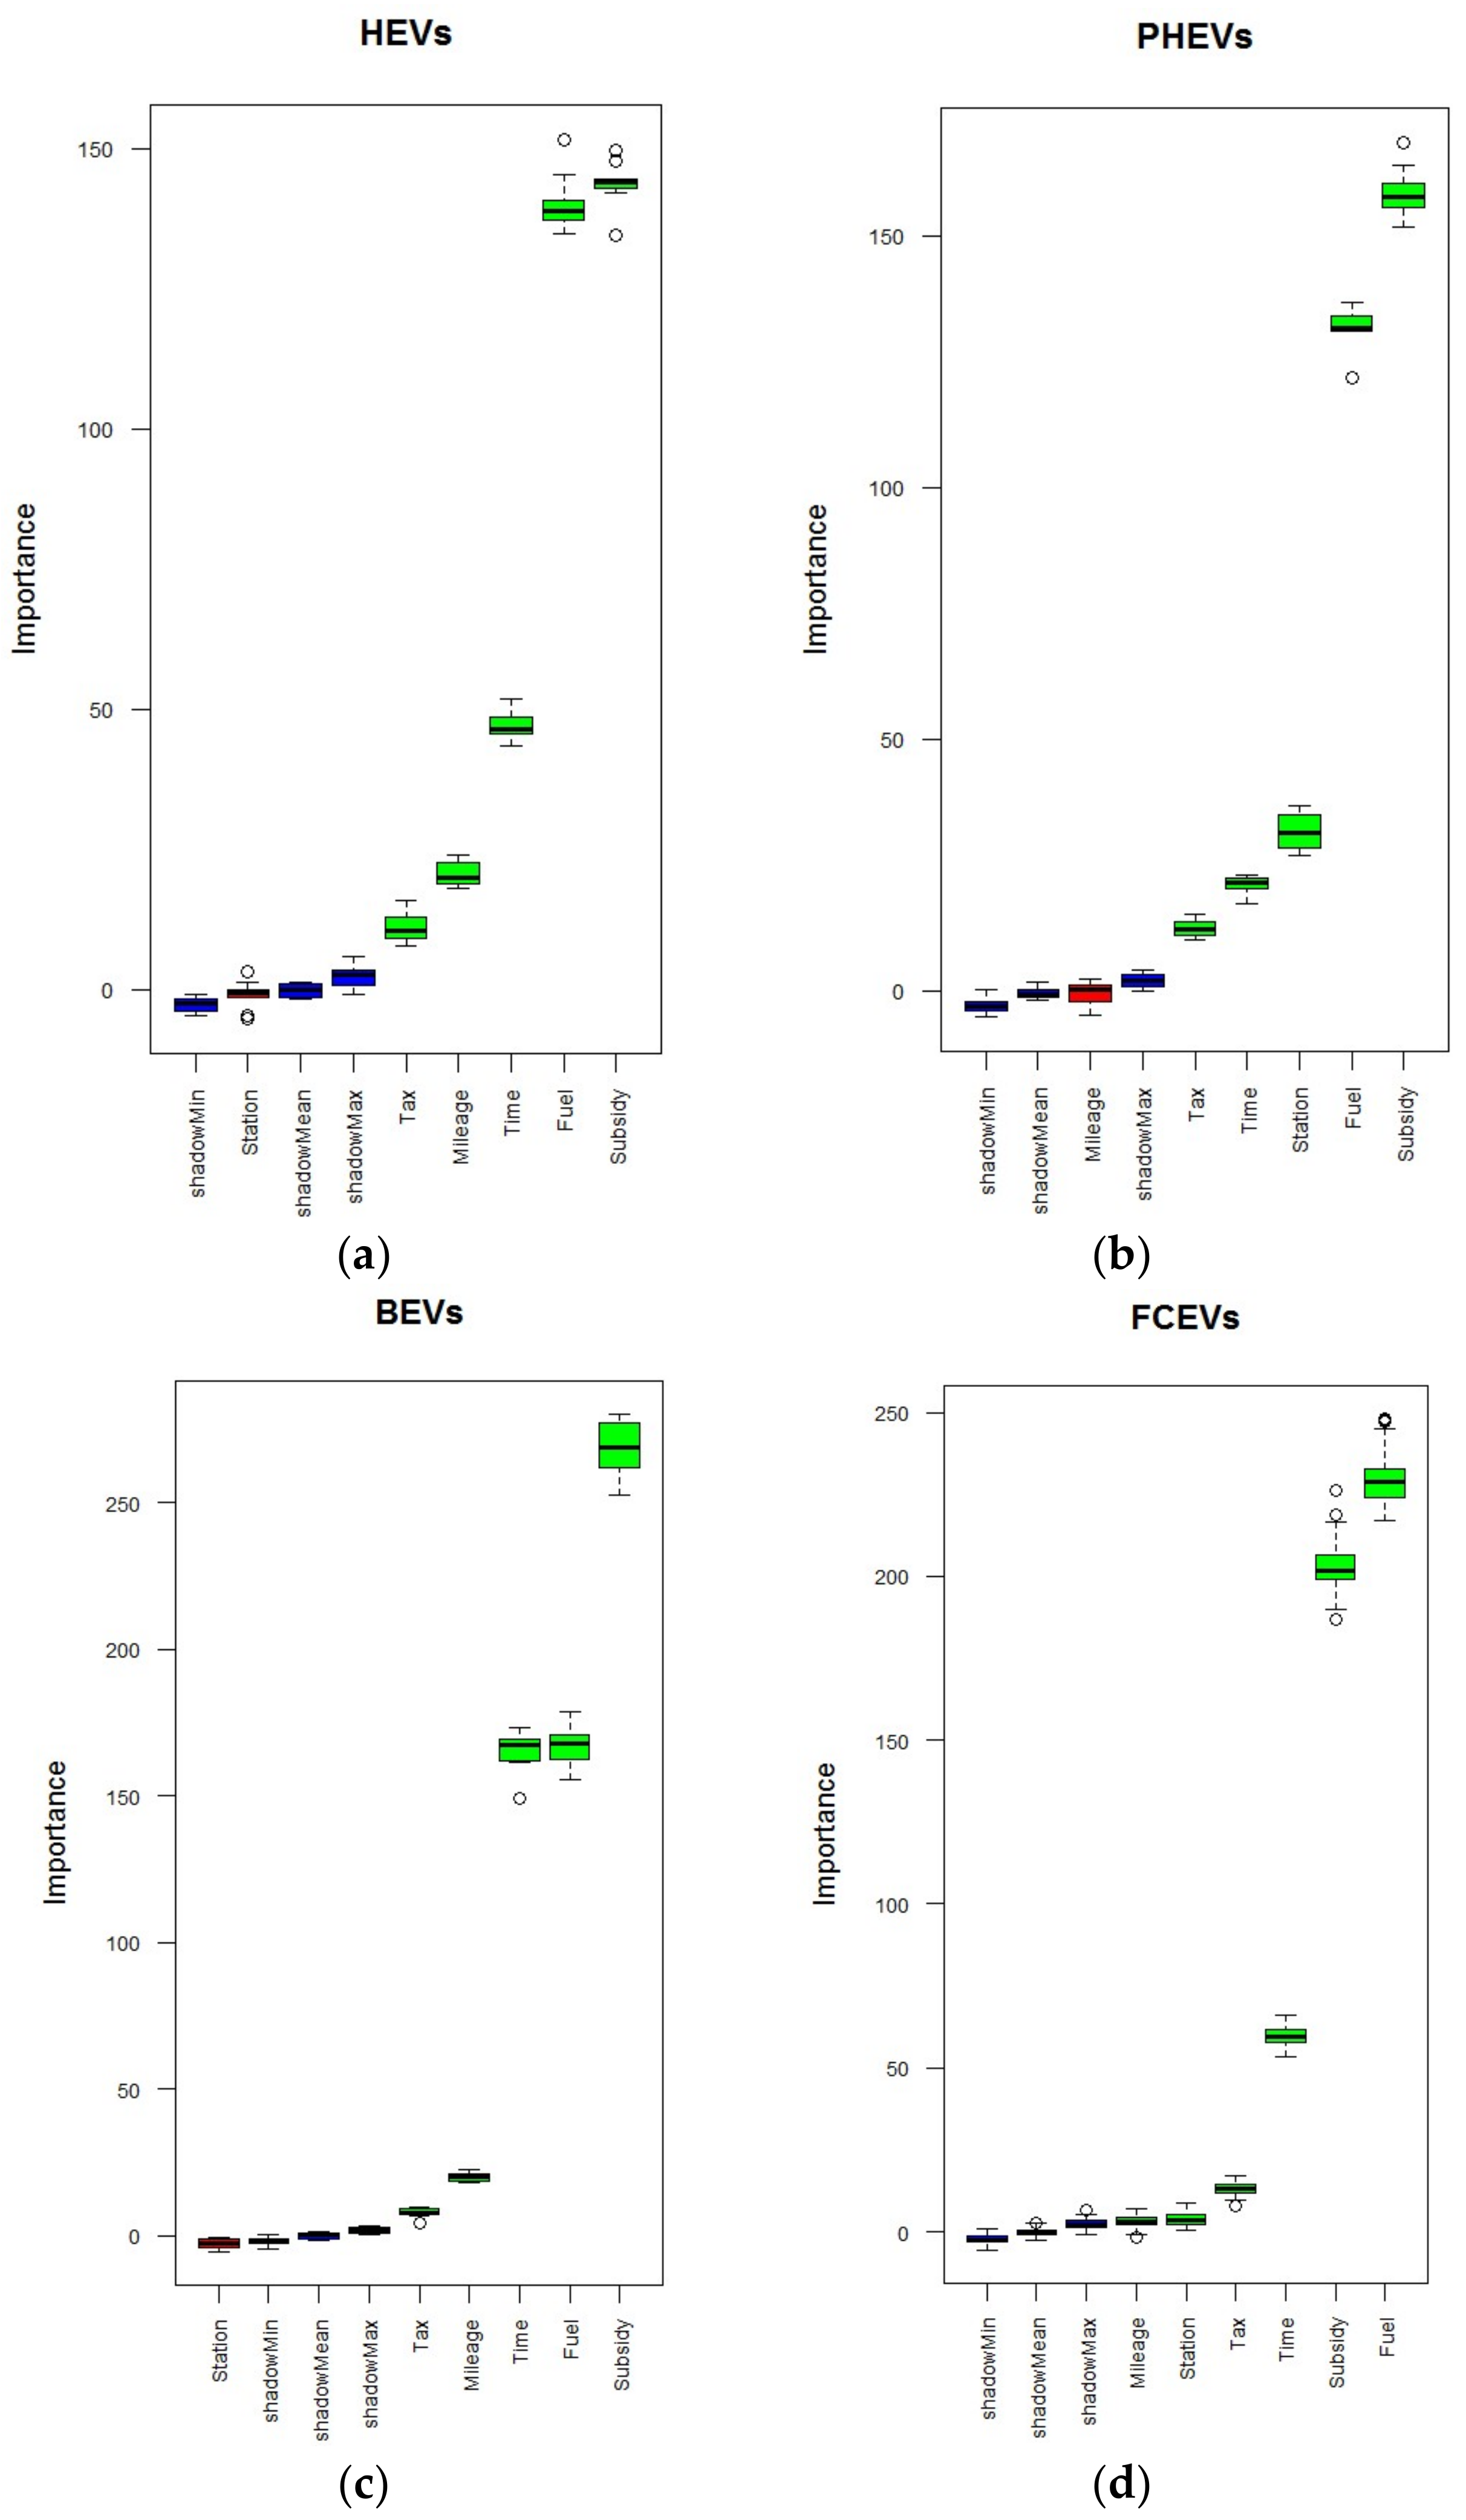
The mean scores of the relative importance of the factors are depicted in Figure 3 and Figure 4. Three box plots, designated as shadowMin, shadowMean and shadowMax, represent shadow features that are only used as a reference to determine whether factors are significant or not. The box plots of significant factors are located on the right of shadowMax, whereas those of insignificant factors are shown on the left of shadowMin. In addition, the importance of certain factors may not be conclusive; their box plots lie in between shadowMax and shadowMin. As shown in Figure 3, all the factors except for charging station availability were found to have a significant contribution on the aggregate market share of EVs. The effects of individual factors on the diffusion of each vehicle type were investigated as well, as shown in Figure 4. Similar to its impact on the diffusion of all types of EVs, charging station availability was found to be insignificant for the diffusion of HEVs, as depicted in Figure 4a. It would be a surprise if the contribution of charging station availability had a significant contribution, because HEVs are propelled by an electric motor in addition to a conventional internal combustion engine, which cannot be recharged from an external outlet and instead is charged through captured kinetic braking energy from regenerative braking. For the spread of PHEVs in Figure 4b, the impact of improvement in driving mileage seems marginal, which is because PHEVs have a larger battery size that can be recharged from an external outlet, unlike HEVs, and they can travel a decent distance on electric power alone. In addition, PHEVs are equipped with an internal combustion engine, which has sufficient fueling stations everywhere. For these two reasons, the current driving mileage of PHEVs may remain sufficient. The effects of individual factors on the spread of zero-emission vehicle types, namely, BEVs and FCEVs, were examined and are depicted in Figure 4c,d. Similar to the diffusion of HEVs, charging station availability does not have a significant impact on the market share of BEVs, which operate entirely on electricity and can have one or more electric motors charged from an external grid. Lastly, all factors show a significant contribution with regard to the market share of FCEVs; this is mostly affected by the fuel cost, followed by the purchase subsidy for EVs.
As observed in Table 3 and Figure 3 and Figure 4, the factor of purchase subsidies for EVs has the largest contribution to explaining the market diffusion of all types of EVs except for FCEVs. It can be confirmed that one of the main barriers to the transition to EVs is their higher purchase price relative to ICEVs, which has already been identified in previous studies. Hence, the role of subsidies in reducing the purchase price of EVs and thereby promoting their market diffusion seems appealing [28,29]. However, purchase subsidies alone may not be sufficient to facilitate the market diffusion of EVs, and individual factors should therefore be considered along with other factors in order to account for possible interactions among factors. Focusing on the market share of EVs as a whole, fuel costs and purchase taxes on ICEVs have the second and third largest contributions, respectively; these represent exogenous variables that will encourage customers to buy EVs rather than conventional ICEVs. Technical measures, specifically improvements in battery charging time and driving mileage per full charge, are ranked fourth and fifth, respectively. Finally, there is not sufficient evidence regarding the significance of the contribution of improved charging station accessibility to promoting EV market diffusion, as this factor exhibited a negative value in the Boruta feature selection algorithm. The insignificance of charging station accessibility may be explained by the fact that the current level of charging station accessibility is low enough that even a 100% improvement might not be sufficient enough to affect the diffusion of EVs. Consequently, five of six factors (excluding charging station availability) were included in the subsequent analysis of the simulated data using full factorial and RSM.
4.2. Statistical Analysis with RSM
As revealed in the preliminary analysis using the features selection algorithm of SVM described in Section 4.1, the analytical procedures presented here exclude charging station availability. As each of five factors has three levels, the total number of experimental groups is ; thus, the number of replications in each group is 30 due to the exclusion of charging station availability. A simple one-way analysis of variance (ANOVA) was first carried out in order to examine the main effects of each factor on the spread of EVs, then a full factorial experimental analysis was performed on all possible combinations of the factors. The purchase subsidy exhibits the greatest contribution among the main factor effects, followed by fuel cost, purchase tax, charging time, and finally driving mileage. As presented in the feature selection summary in Table 3 and Figure 3, the order of factors in explaining the market share of EVs is exactly consistent. The rank order of factors remains the same when the full factorial model, including charging station availability, is performed, and the contribution of charging station availability is the lowest among all the factors. Therefore, both the feature selection algorithm and the full factorial analysis confirm the exclusion of charging station availability in further analyses. In addition to the main effects, five two-way interactions (purchase tax–fuel cost increment, purchase tax–subsidy, fuel cost increment–subsidy, subsidy–driving mileage, and subsidy–battery charging time), were significant at the usual 5% significance level. The existence of significant interactions on the spread of EVs called for further statistical analysis through with the application of RSM.
The functional relationship between factors and response (i.e., the market share of different types of EVs) can be estimated in a polynomial equation with RSM; thus, four different RSM models (first-order, two-way interaction, pure quadratic, and second-order) were built and tested in order to identify the most appropriate model for explaining the market diffusion of EVs. Individual models were then explored and compared using different statistical metrics. More specifically, the significance of the linear, interaction, and quadratic effects of factors were tested with ANOVA. Table 4 summarizes the ANOVA results for the overall significance of models along with the results for the lack-of-fit test and adjusted coefficient of determination. It can be seen that nearly 90% of the variation in the market share of EVs is explained by the five factors in all the models. Even though the explained percentage of variations does not differ greatly across the models, a significant lack-of-fit exists in all but the second-order model. Hence, the second-order response surface model can be considered the most appropriate compared to the other models for the purpose of explaining the market share of EVs. The parameter estimates along with their standard errors and corresponding p-values are presented in Table 5.
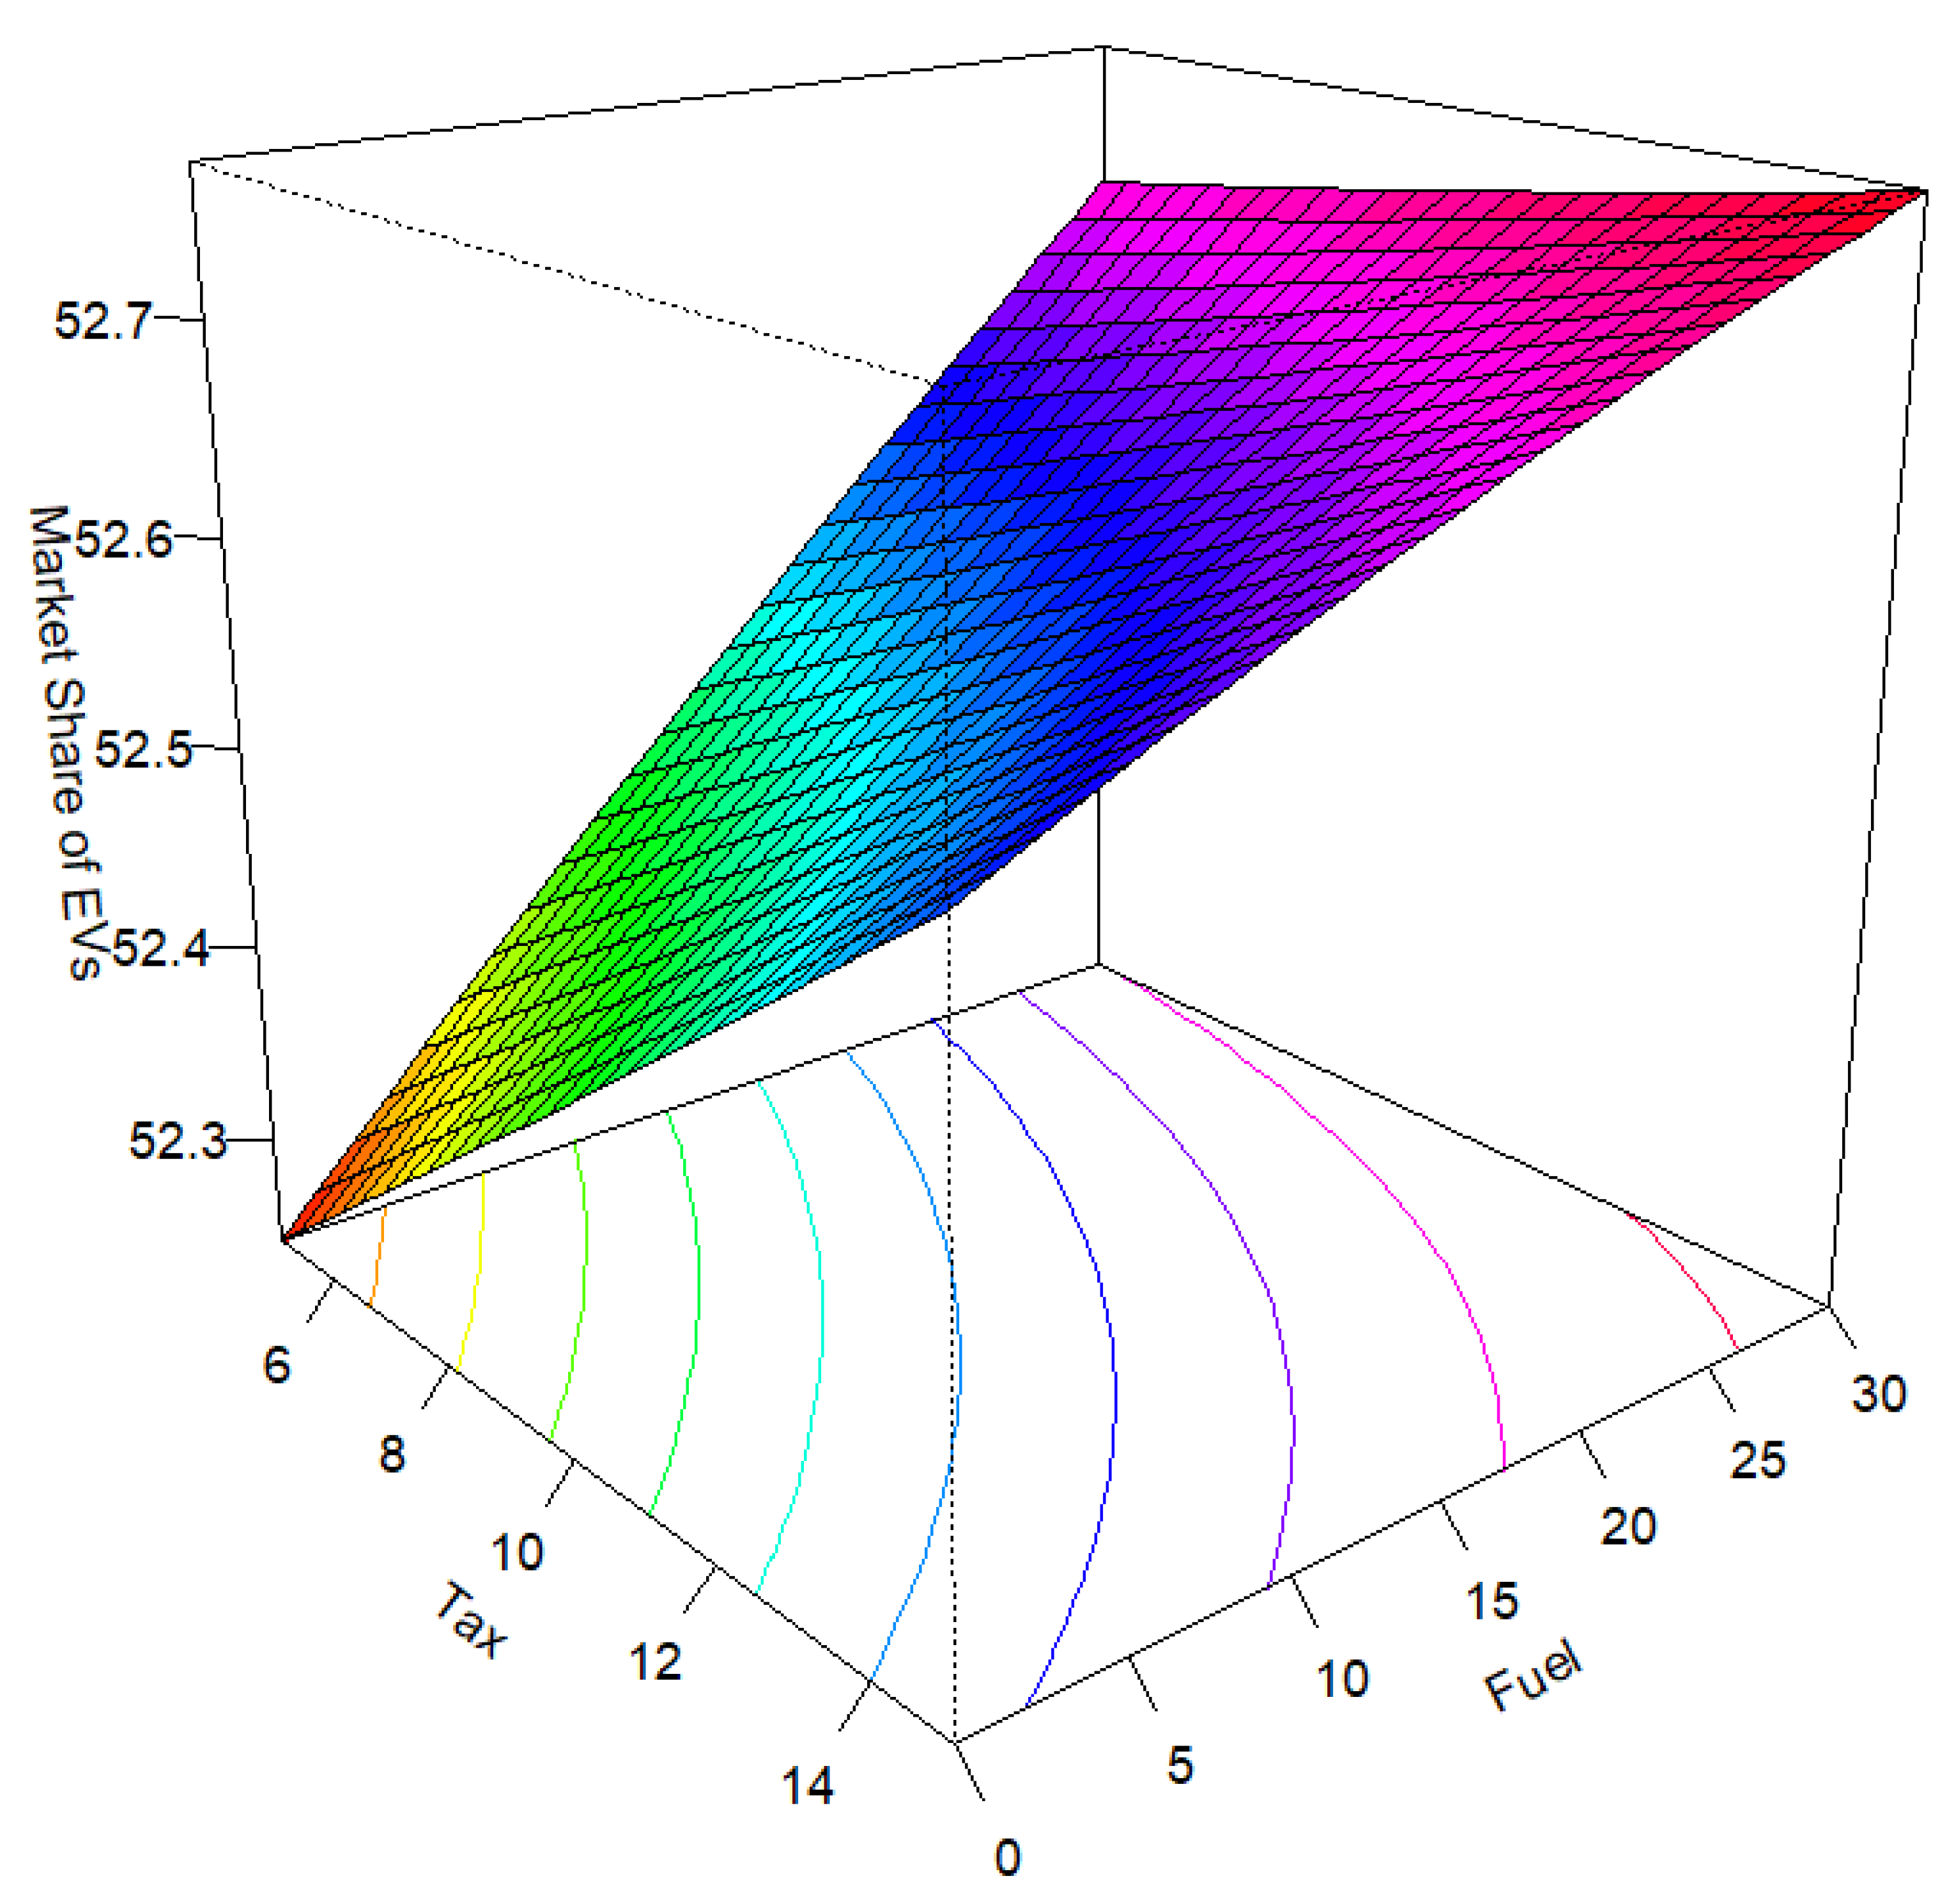
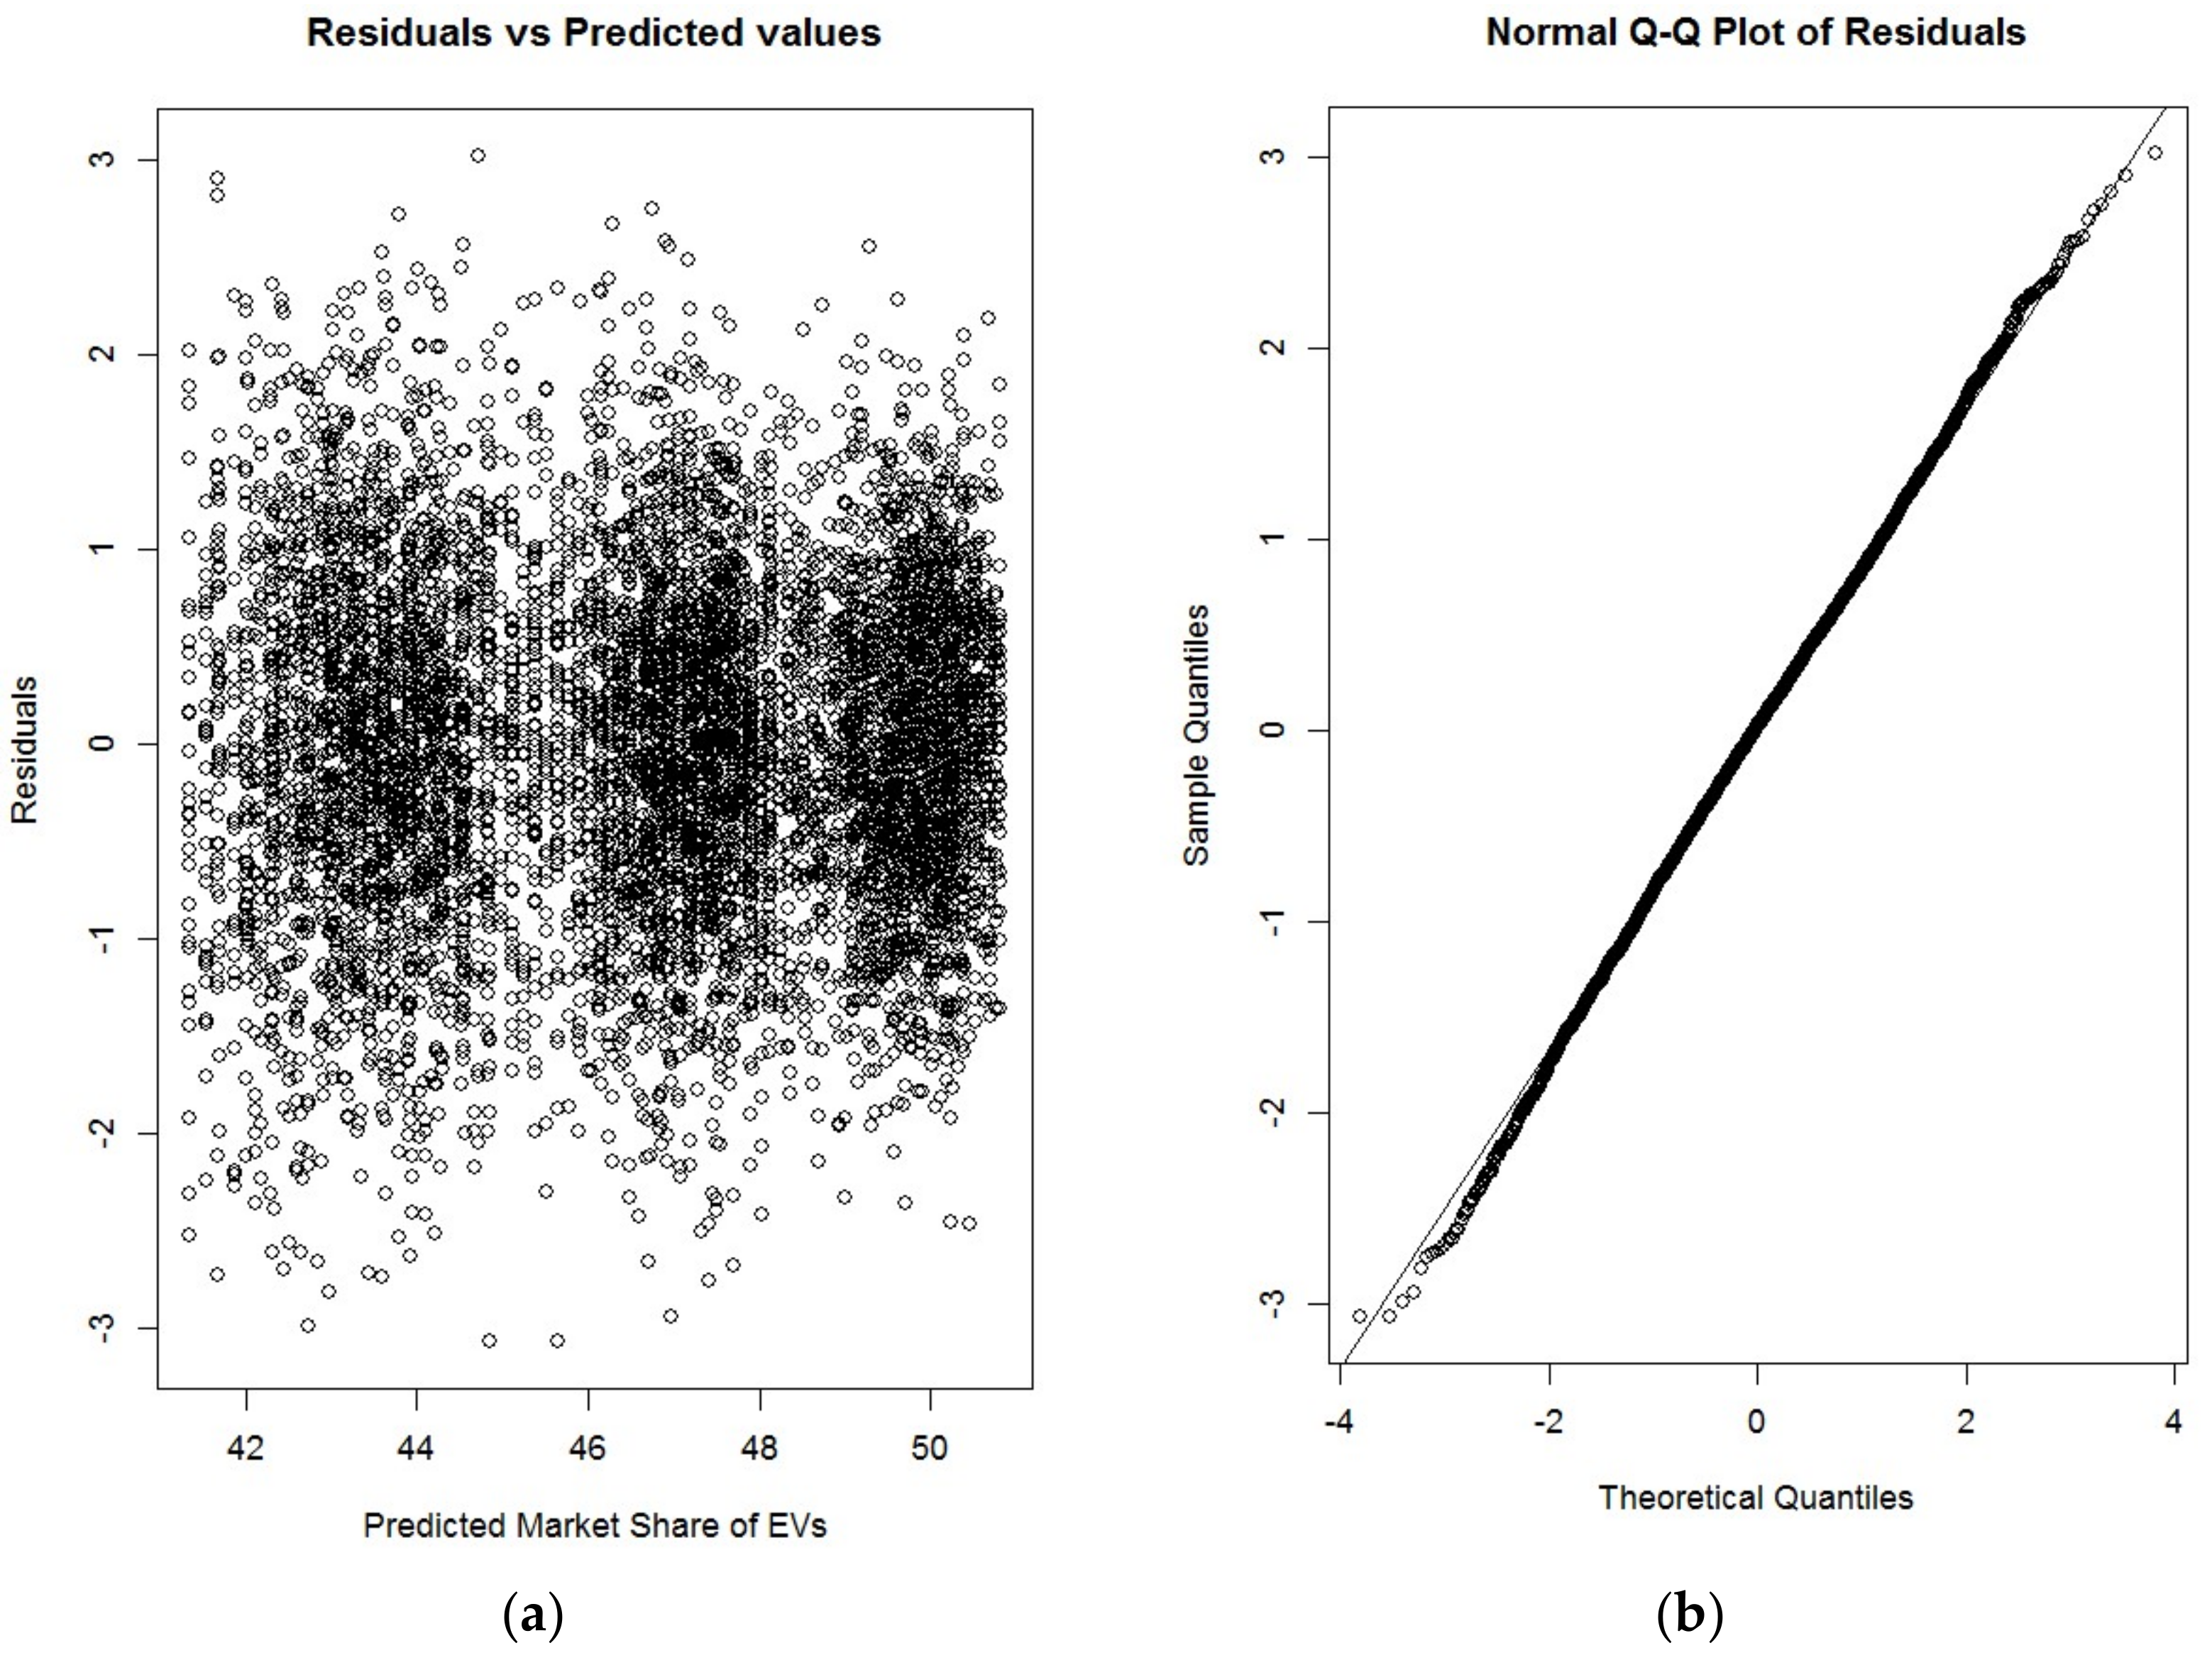
It should be noted that purchase subsidy is the only factor having a significant quadratic effect on the market share of EVs, and that the sign of this term is negative (i.e., −0.4419), which means that an increase in subsidies does not necessarily yield a higher market share of EVs. Furthermore, five of ten two-way interactions are significant, which implies that the implementation of policy and technical measures needs to be scrutinized in combination with other factors. When two factors have a significant interaction, a moderate curvature can be observed in the response surface plot. For example, Figure 5 depicts the response surface plot with respect to purchase tax and fuel cost, which indicates that jointly implementing these policy measures may expand the spread of EVs much faster. Finally, a residual analysis was conducted to check the adequacy of the second-order response surface model. Figure 6a shows the plot of model residuals against the predicted values. As observed, all the residuals are within the 3-sigma limits and there are no systematic patterns, ensuring that the residuals are independent and the assumption of constant variance is not violated. The Q–Q plot in Figure 6b indicates that the normality assumption for the residuals holds as well. The residual analysis thus confirms that the second-order response surface model is appropriate for investigating the effects of the individual factors on the diffusion behavior of EVs.
As previously mentioned, this study aims to outline the application of ABM simulation combined with the experimental design for in-depth statistical analysis. Possible interactions among different factors are explored via the proposed approach. The study identified five two-way interaction that could facilitate the diffusion of EVs. It is worth noting that interactions among different factors for the transition to EVs have been little-investigated in previous studies. In addition to financial factors such as purchase subsidy, fuel cost, and purchase tax, technical improvements in driving mileage and battery charging time are significant and have a positive impact on the diffusion of EVs, which is consistent with the preference survey conducted in [30]. On the other hand, the availability of charging stations appears to not be significantly associated with the market penetration of EVs, which coincides with [31] and indicates that financial factors and incentives are more important than charging infrastructure. Even though policy measures exhibit greater effects than other factors in the experimental environment used here, different results could be obtained depending on the analytical context.
5. Concluding Remarks
While working at an increasing pace to develop technical measures for reducing carbon emissions and excessive energy consumption, a wide variety of policy interventions to cope with global warming and energy scarcity have been adopted by many countries. The most widely implemented policy measures are monetary incentives such as subsidies and tax benefits. The motivation of this study was to propose an analytical approach based on ABM simulation combined with experimental design to analyze the main effects of technical and policy measures and their interactions on the diffusion of eco-friendly vehicles. An agent-based model was constructed to examine the impact of various factors on potential EV market penetration, and the purchase behavior of individual customers was prescribed using a multinomial logit utility function described by the attributes of purchase price, fuel cost, driving mileage, refueling/recharging time, fuel/charging station availability, and CO2 emissions. Then, a series of simulation experiments was designed including six different factors with three levels for each factor to yield a full factorial design. The simulated data were analyzed with a support vector machine and response surface methodology to further examine the statistical significance of individual factor effects and their interactions. Under the specified circumstances, the market diffusion of EVs was more affected by policy measures such as subsidies and tax benefits than by other measures, which is consistent with the results for the U.S. market as investigated by [17]. It should be noted that the significant interactions among individual factors observed imply that individual policy measures need to be carefully designed with a holistic perspective. In other words, the magnitude of effects from the combined implementation of different policy interventions is far greater than the simple sum of the individual main effects, which concurs with the results obtained by [19].
It is worth noting that, to the best of the authors’ knowledge, this study is one of the first to attempt such a combination of ABM simulation with experimental design to investigate the interactions and main effects of individual factors that affect the diffusion of EVs. Nevertheless, a major shortcoming of this study lies in its lack of consideration of social network influences on the transition to eco-friendly transport, which, as noted in [32], may have a profound impact. Furthermore, the proposed approach needs to be validated using real-market data in order to better understand the decision-making processes of customers in detail and account for the preferences of real customers. Thoroughly-stated preference survey data are required in order to specify the baseline scenario input variables and the parameter coefficients of the utility function. It is expected that the proposed approach can be improved by better representing social network structures and individual preferences in the context of adopting different vehicle types.
Author Contributions
Conceptualization, Y.J.K. and A.S.E.; Methodology, Y.J.K.; software, A.S.E.; validation, Y.J.K.; formal analysis, A.S.E.; investigation, A.S.E.; resources, Y.J.K.; data curation, A.S.E.; writing—original draft preparation, A.S.E.; writing—review and editing, Y.J.K.; visualization, A.S.E.; supervision, Y.J.K.; project administration, Y.J.K.; funding acquisition, Y.J.K. All authors have read and agreed to the published version of the manuscript.
Funding
This research was supported by the Basic Science Research Program through the National Research Foundation of Korea (NRF), funded by the Ministry of Education (2021R1I1A3047456).
Data Availability Statement
Not applicable.
Conflicts of Interest
The authors declare no conflict of interest. The funders had no role in the design of the study; in the collection, analyses, or interpretation of data; in the writing of the manuscript, or in the decision to publish the results.
References
- Ribeiro, S.K.; Kobayashi, S.; Beuthe, M.; Gasca, J.; Greene, D.; Lee, D.S.; Muromachi, S.; Newton, P.J.; Plotkin, S.; Sperling, D.; et al. Transport and Its Infrastructure, Technical Report of Working Group III to the Fourth Assessment Report of the Intergovernmental Panel on Climate Change; Intergovernmental Panel on Climate Change: Geneva, Switzerland, 2007. [Google Scholar]
- International Energy Agency (IEA). Energy Technology Perspectives; International Energy Agency: Paris, France, 2010. [Google Scholar]
- International Energy Agency (IEA). World Energy Outlook; International Energy Agency: Paris, France, 2015. [Google Scholar]
- BEV, PHEV or HEV: The Differences Affect the Architecture. Available online: https://www.aptiv.com/en/insights/article/bev-phev-or-hev-the-differences-affect-the-architecture (accessed on 1 October 2021).
- Arora, A.; Niese, N.; Dreyer, E.; Waas, A.; Xie, A. Why Electric Cars Can’t Come Fast Enough; Boston Consulting Group: Boston, MA, USA, 2021. [Google Scholar]
- Gnann, T.; Stephens, T.S.; Lin, Z.; Plotz, P.; Liu, C.; Brokate, J. What Drives the Market for Plug-In Electric Vehicles?—A Review of International PEV Market Diffusion Models. Renew. Sustain. Energy Rev. 2018, 93, 158–164. [Google Scholar] [CrossRef]
- Bass, F.M. A New Product Growth Model for Consumer Durables. Manag. Sci. 1969, 15, 215–227. [Google Scholar] [CrossRef]
- David, P.A. A Contribution to the Theory of Diffusion; Stanford Centre for Research in Economic Growth: Stanford, CA, USA, 1969. [Google Scholar]
- Nelson, R.R.; Winter, S. An Evolutionary Theory of Economic Change; Harvard University Press: Cambridge, MA, USA, 1982. [Google Scholar]
- Hackbarth, A.; Madlener, R. Consumer Preferences for Alternative Fuel Vehicles: A Discrete Choice Analysis. Transp. Res. Part D Transp. Environ. 2013, 25, 5–17. [Google Scholar] [CrossRef] [Green Version]
- Hoen, A.; Koetse, M.J. A Choice Experiment on Alternative Fuel Vehicle Preferences of Private Car Owners in the Netherlands. Transp. Res. Part A Policy Pract. 2014, 61, 199–215. [Google Scholar] [CrossRef]
- Degirmenci, K.; Breitner, M.H. Consumer Purchase Intentions for Electric Vehicles: Is Green More Important Than Price and Range? Transp. Res. Part D Transp. Environ. 2017, 51, 250–260. [Google Scholar] [CrossRef] [Green Version]
- Dijk, M.; Kemp, R.; Valkering, P. Incorporating Social Context and Co-Evolution in an Innovation Diffusion Model with an Application to Cleaner Vehicles. J. Evol. Econ. 2013, 23, 295–329. [Google Scholar] [CrossRef] [Green Version]
- Eppstein, M.; Grover, D.; Marshall, J.; Rizzo, D. An Agent-Based Model to Study Market Penetration of Plug-In Hybrid Electric Vehicles. Energy Policy 2011, 39, 3789–3802. [Google Scholar] [CrossRef]
- Kangur, A.; Jager, W.; Verbrugge, R.; Bockarjova, M. An Agent-Based Model for Diffusion of Electric Vehicles. J. Environ. Psychol. 2017, 52, 166–182. [Google Scholar] [CrossRef] [Green Version]
- Ning, W.; Guo, J.; Liu, X.; Pan, H. Incorporating Individual Preference and Network Influence on Choice Behavior of Electric Vehicle Sharing Using Agent-Based Model. Int. J. Sustain. Transp. 2020, 14, 917–931. [Google Scholar] [CrossRef]
- Noori, M.; Tatari, O. Development of an Agent-Based Model for Regional Market Penetration Projections of Electric Vehicles in the United States. Energy 2016, 96, 215–230. [Google Scholar] [CrossRef]
- Shafiei, E.; Thorkelsson, H.; Asgeirsson, E.I.; Davidsdottir, B.; Raberto, M.; Stefansson, H. An Agent-Based Modeling Approach to Predict the Evolution of Market Share of Electric Vehicles: A Case Study from Iceland. Technol. Forecast. Soc. Chang. 2012, 79, 1638–1653. [Google Scholar] [CrossRef]
- Huang, X.; Lin, Y.; Zhou, F.; Lim, M.K.; Chen, S. Agent-Based Modelling for Market Acceptance of Electric Vehicles: Evidence from China. Sustain. Prod. Consum. 2021, 28, 206–217. [Google Scholar] [CrossRef]
- Sierzchula, W.; Bakker, S.; Maat, K.; Wee, B. The Influence of Financial Incentives and Other Socio-Economic Factors on Electric Vehicle Adoption. Energy Policy 2014, 68, 183–194. [Google Scholar] [CrossRef]
- Sznajd-Weron, K.; Szwabinski, J.; Weron, R.; Weron, T. Rewiring the Network. What Helps an Innovation to Diffuse? J. Stat. Mech. Theory Exp. 2014, 3, 3007. [Google Scholar] [CrossRef] [Green Version]
- Zhang, T.; Gensler, S.; Garcia, R. A Study of the Diffusion of Alternative Fuel Vehicles: An Agent-Based Modeling Approach. J. Prod. Innov. Manag. 2011, 28, 152–168. [Google Scholar] [CrossRef]
- Hao, H.; Ou, X.; Du, J.; Wang, H.; Ouyang, M. China’s Electric Vehicle Subsidy Scheme: Rationale and Impacts. Energy Policy 2014, 73, 722–732. [Google Scholar] [CrossRef]
- Fanchao, L.; Eric, M.; van Bert, W. Consumer Preferences for Electric Vehicles: A Literature Review. Transp. Rev. 2017, 37, 252–275. [Google Scholar]
- Maeng, K.; Ko, S.; Shin, J.; Cho, Y. How Much Electricity Sharing Will Electric Vehicle Owners Allow from Their Battery? Incorporating Vehicle-to-Grid Technology and Electricity Generation Mix. Energies 2020, 13, 4248. [Google Scholar] [CrossRef]
- Propfe, B.; Redelbach, M.; Santini, D.J.; Friedrich, H. Cost Analysis of Plug-In Hybrid Electric Vehicles Including Maintenance & Repair Costs and Resale Values. In Proceedings of the EVS26 International Battery, Hybrid and Fuel Cell Electric Vehicle Symposium, Los Angeles, CA, USA, 6–9 May 2012. [Google Scholar]
- Pham, D.T.; Prostov, Y.I.; Suarez-Alvarez, M.M. Statistical Approach to Numerical Databases: Clustering Using Normalized Minkowski Metrics. In Intelligent Production Machines and Systems; Pham, D.T., Eldukhri, E.E., Soroka, A.J., Eds.; Elsevier: Amsterdam, The Netherlands, 2006. [Google Scholar]
- Silvia, C.; Krause, R.M. Assessing the Impact of Policy Interventions on the Adoption of Plug-In Electric Vehicles: An Agent-Based Model. Energy Policy 2016, 96, 105–118. [Google Scholar] [CrossRef]
- Sun, X.; Liu, X.; Yun, W.; Fang, Y. The Effects of Public Subsidies on Emerging Industry: An Agent-Based Model of the Electric Vehicle Industry. Technol. Soc. Chang. 2019, 140, 281–295. [Google Scholar] [CrossRef]
- Kim, E.; Heo, E. Key Drivers behind the Adoption of Electric Vehicle in Korea: An Analysis of the Revealed Preferences. Sustainability 2019, 11, 6854. [Google Scholar] [CrossRef] [Green Version]
- Clinton, B.C.; Steinberg, D.C. Providing the Spark: Impact of Financial Incentives on Battery Electric Vehicle Adoption. J. Environ. Econ. Manag. 2019, 98, 102255. [Google Scholar] [CrossRef]
- Rahmandad, H.; Sterman, J. Heterogeneity and Network Structure in the Dynamics of Diffusion: Comparing Agent-Based and Differential Equation Models. Manag. Sci. 2008, 54, 998–1014. [Google Scholar] [CrossRef] [Green Version]
Figure 1.
Market shares of different types of vehicles in baseline scenario: (a) comparison of market share of ICEVs and EVs; (b) market share by individual vehicle type.
Figure 1.
Market shares of different types of vehicles in baseline scenario: (a) comparison of market share of ICEVs and EVs; (b) market share by individual vehicle type.

Figure 2.
Market shares of different types of vehicles in alternative scenario: (a) comparison of market share of ICEVs and EVs; (b) market share by individual vehicle type.
Figure 2.
Market shares of different types of vehicles in alternative scenario: (a) comparison of market share of ICEVs and EVs; (b) market share by individual vehicle type.

Figure 3.
Box plots for relative importance of factors on diffusion of EVs.

Figure 4.
Box plots for relative importance of factors on diffusion of each type of EVs: (a) factors affecting the diffusion of HEVs; (b) factors affecting the diffusion of PHEVs; (c) factors affecting the diffusion of BEVs; (d) factors affecting the diffusion of FCEVs.
Figure 4.
Box plots for relative importance of factors on diffusion of each type of EVs: (a) factors affecting the diffusion of HEVs; (b) factors affecting the diffusion of PHEVs; (c) factors affecting the diffusion of BEVs; (d) factors affecting the diffusion of FCEVs.

Figure 5.
Response surface plot for purchase tax and fuel cost.

Figure 6.
Residual analysis of second-order response surface model: (a) residual plot; (b) Q-Q plot.
Figure 6.
Residual analysis of second-order response surface model: (a) residual plot; (b) Q-Q plot.


Table 1.
Baseline values of factors included in the ABM simulation.
| Description of Attributes | Gasoline | Diesel | HEV | PHEV | BEV | FCEV |
|---|---|---|---|---|---|---|
| Fuel Cost ($/100 km) 1 | 9.3 | 6.1 | 5.6 | 6.1 | 2.5 | 8.8 |
| Purchase Price ($) 2 | 31,426 | 31,426 | 33,694 | 34,641 | 40,922 | 34,463 |
| Mileage Per Full Tank/Charge (km) 3 | 1000 | 1000 | 1000 | 750 | 175 | 750 |
| Refueling Time (min) 3 | 5 | 5 | 5 | 5 | - | 5 |
| Recharging Time (min) 3 | - | - | - | 240 | 480 | - |
| Fuel/Charging Station Availability (%) 1,3 | 100 | 100 | 100 | 43.3 | 14.1 | 0.2 |
| CO2 Emission (%) 3 | 100 | 100 | 77 | 31 | 0 | 0 |
Table 2.
Factor Settings for ABM Simulation Experiments.
| Factors | Levels | Values | ||
|---|---|---|---|---|
| A: Purchase Tax on ICEVs (% Purchase Price) | 3 | 5%, | 10%, | 15% |
| B: Fuel Cost (% Increase) | 3 | 0%, | 15%, | 30% |
| C: Purchase Subsidy for EVs (% Purchase Price) | 3 | 0%, | 10%, | 20% |
| D: Driving Mileage Per Full Charge (% Improvement) | 3 | 0%, | 50%, | 100% |
| E: Battery Charging Time (% Reduction) | 3 | 0%, | 25%, | 50% |
| F: Charging Station Availability (% Increase) | 3 | 0%, | 50%, | 100% |
Table 3.
Mean relative importance scores of different factors on the market share of EVs.
| Factors | HEV | PHEV | BEV | FCEV | All EVs | |||||
|---|---|---|---|---|---|---|---|---|---|---|
| Mean | Rank | Mean | Rank | Mean | Rank | Mean | Rank | Mean | Rank | |
| A | 11.24 | 5 | 12.31 | 5 | 7.74 | 5 | 13.15 | 4 | 92.46 | 3 |
| B | 140.14 | 2 | 131.80 | 2 | 166.49 | 3 | 229.27 | 1 | 146.55 | 2 |
| C | 143.82 | 1 | 158.72 | 1 | 268.44 | 1 | 202.70 | 2 | 391.45 | 1 |
| D | 20.53 | 4 | −0.69 | 6 | 20.17 | 4 | 3.26 | 5 | 4.19 | 5 |
| E | 47.20 | 3 | 20.91 | 4 | 167.24 | 2 | 59.57 | 3 | 19.92 | 4 |
| F | −1.01 | 6 | 31.44 | 3 | −2.47 | 6 | 3.74 | 6 | −1.89 | 6 |
Table 4.
Summary of ANOVA results for four response surface models.
| Source of Variation | Sum of Squares | Degrees of Freedom | Mean Squares | F-Statistic | p-Value | |
|---|---|---|---|---|---|---|
| First-Order (0.899) | Model | 52,270 | 5 | 10,454.0 | 12,934.76 | <0.001 * |
| Residuals | 5887 | 7284 | 0.8082 | |||
| Lack of fit | 716 | 237 | 3.0211 | 4.1171 | <0.001 * | |
| Pure Error | 5171 | 7047 | 0.7338 | |||
| Total | 58,157 | 7289 | ||||
| Two-Way Interaction (0.902) | Model | 52,489 | 15 | 3499.20 | 4490.68 | <0.001 * |
| Residuals | 5668 | 7274 | 0.7792 | |||
| Lack of fit | 497 | 227 | 2.1894 | 2.9837 | <0.001 * | |
| Pure Error | 5171 | 7047 | 0.7338 | |||
| Total | 58,157 | 7289 | ||||
| Pure Quadratic (0.904) | Model | 52,587 | 10 | 5258.70 | 6872.19 | <0.001 * |
| Residuals | 5570 | 7279 | 0.7652 | |||
| Lack of fit | 399 | 232 | 1.7198 | 2.3438 | <0.001 * | |
| Pure Error | 5171 | 7047 | 0.7338 | |||
| Total | 58,157 | 7289 | ||||
| Second-Order (0.908) | Model | 52,805 | 20 | 2640.25 | 3585.95 | <0.001 * |
| Residuals | 5352 | 7269 | 0.7362 | |||
| Lack of fit | 181 | 222 | 0.8153 | 1.1111 | 0.131 | |
| Pure Error | 5171 | 7047 | 0.7338 | |||
| Total | 58,157 | 7289 |
* Statistically significant at 5% significance level.
Table 5.
Estimates of the second-order response surface model.
| Effects | Estimate | Standard Error | p-Value |
|---|---|---|---|
| Purchase Tax | 0.5266 | 0.0123 | <0.001 * |
| Fuel Cost | 0.7066 | 0.0123 | <0.001 * |
| Purchase Subsidy | 3.1480 | 0.0123 | <0.001 * |
| Driving Mileage | 0.1130 | 0.0123 | <0.001 * |
| Charging Time | 0.2369 | 0.0123 | <0.001 * |
| Purchase Tax: Fuel Cost | −0.0669 | 0.0151 | <0.001 * |
| Purchase Tax: Purchase Subsidy | −0.1412 | 0.0151 | <0.001 * |
| Purchase Tax: Driving Mileage | −0.0140 | 0.0151 | 0.3522 |
| Purchase Tax: Charging Time | −0.0261 | 0.0151 | 0.0839 |
| Fuel Cost: Purchase Subsidy | −0.1909 | 0.0151 | <0.001 * |
| Fuel Cost: Driving Mileage | 0.0014 | 0.0151 | 0.9245 |
| Fuel Cost: Charging Time | 0.0026 | 0.0151 | 0.8618 |
| Purchase Subsidy: Driving Mileage | −0.0434 | 0.0151 | 0.0040 * |
| Purchase Subsidy: Charging Time | −0.0612 | 0.0151 | <0.001 * |
| Driving Mileage: Charging Time | −0.0051 | 0.0151 | 0.7339 |
| Purchase Tax2 | 0.0026 | 0.0213 | 0.9039 |
| Fuel Cost2 | −0.0095 | 0.0213 | 0.6568 |
| Purchase Subsidy2 | −0.4419 | 0.0213 | <0.001 * |
| Driving Mileage2 | −0.0096 | 0.0213 | 0.6518 |
| Charging Time2 | −0.0073 | 0.0213 | 0.7336 |
* Statistically significant at 5% significance level.
Publisher’s Note: MDPI stays neutral with regard to jurisdictional claims in published maps and institutional affiliations. |
© 2022 by the authors. Licensee MDPI, Basel, Switzerland. This article is an open access article distributed under the terms and conditions of the Creative Commons Attribution (CC BY) license (https://creativecommons.org/licenses/by/4.0/).
Share and Cite
MDPI and ACS Style
Ebrie, A.S.; Kim, Y.J. Investigating Market Diffusion of Electric Vehicles with Experimental Design of Agent-Based Modeling Simulation. Systems 2022, 10, 28. https://0-doi-org.brum.beds.ac.uk/10.3390/systems10020028
AMA Style
Ebrie AS, Kim YJ. Investigating Market Diffusion of Electric Vehicles with Experimental Design of Agent-Based Modeling Simulation. Systems. 2022; 10(2):28. https://0-doi-org.brum.beds.ac.uk/10.3390/systems10020028
Chicago/Turabian StyleEbrie, Awol Seid, and Young Jin Kim. 2022. "Investigating Market Diffusion of Electric Vehicles with Experimental Design of Agent-Based Modeling Simulation" Systems 10, no. 2: 28. https://0-doi-org.brum.beds.ac.uk/10.3390/systems10020028
Note that from the first issue of 2016, this journal uses article numbers instead of page numbers. See further details here.