
Adapting the ESSENZ Method to Assess Company-Specific Criticality Aspects


Department of Sustainable Engineering, Institute of Environmental Technology, Technische Universität Berlin, Strasse des 17. Juni 135, 10623 Berlin, Germany
*
Author to whom correspondence should be addressed.
Resources 2021, 10(6), 56; https://0-doi-org.brum.beds.ac.uk/10.3390/resources10060056
Submission received: 23 April 2021
/
Revised: 22 May 2021
/
Accepted: 28 May 2021
/
Published: 31 May 2021
Abstract
:In times of increasing awareness of limited resources, companies are becoming especially interested in criticality assessments. Based on the existing approaches of ESSENZ (integrated method to assess resource efficiency) and SCARCE (approach is to enhance the assessment of critical resource use at the country level), a method called CS-ESSENZ (company-specific ESSENZ) has been developed to measure the company-specific aspects of criticality and social impact in supply chains for abiotic resources. These comprise 20 categories and corresponding indicators, based on 19 ESSENZ and 25 SCARCE categories. Eleven of these indicators were modified, four were newly developed (e.g., economic importance), and the last five were applied as they are in ESSENZ or SCARCE. CS-ESSENZ was tested using the case study of a smartphone, demonstrating the method’s applicability as well as generating additional information on company-specific improvement potential. The results for supply risk showed that 29 out of 58 ESSENZ hotspots showed high, and 12 showed medium, improvement potential from the company perspective. CS-ESSENZ enables companies to obtain specific information on criticality and social aspects in their supply chains and points out areas for improvement, e.g., with respect to purchasing strategies for cobalt.
1. Introduction
Over the last few decades, the international demand for resources and raw materials has continued to increase, and is predicted to double by 2060 [1]. Temporary shortages of abiotic resources [2] and politically imposed restrictions have hit international markets several times in recent years [3,4]. Simultaneously, evidence of the negative environmental and social effects of resource use has increased [5]. These aspects, along with others, have made the sustainable management of resources and raw materials shift into the political and societal focus [5,6,7]. Various national and international measures to increase resource efficiency have been taken, such as the “Roadmap to a Resource Efficient Europe” [8] and the “German Resource Efficiency Program” [9]. The increasing awareness, political legislation, and economic necessity have increased businesses’ attention to supply chain risks arising from sustainability.
Various factors and dimensions are relevant in this context. The environmental and the social dimension are most prominent among society as a whole, but as mentioned above, the economic sustainability of a supply chain has become increasingly relevant for both companies and countries (e.g., [10]). On the one hand, companies need to be aware of the potential supply risks they are facing, and on the other hand, they need to measure the economic impact of those risks (this economic aspect is referred to in the literature as “vulnerability”). This combined assessment of a resource’s supply risk and economic importance is referred to as its “criticality” [10]. Measuring these factors is essential for making informed economic and political decisions.
Schrijvers et al. [11] supply a comprehensive overview of the current state of the art of criticality assessment. They clarify the mechanisms that affect the methodological choices, which then impact the results of criticality assessments. Two approaches exist for generally assessing criticality on the product level, as shown in the comprehensive review by Cimprich et al. [12]. These are called GeoPolRisk [12,13,14] and ESSENZ (an integrated method to assess resource efficiency) [15,16]. These methods assess supply risks for materials that make up the product, over the life cycle and throughout the supply chain. These use either global data or import-based data, and therefore cannot guarantee that the hotspots identified are relevant for the supply chain of a specific company. Fewer approaches exist for company-level assessments (e.g., [17,18,19,20]), which in addition to supply risk (availability constraints) also include measurements of vulnerability (to those availability constraints) within a company.
However, so far, there is no comprehensive approach to assess company-specific criticality and the social aspects of a product’s supply chain. Companies have to rely on global averages, which might not represent the specific threats or opportunities related to their own supply chains. For example, a company endeavoring to maintain high social standards within their supply chains might perform better than the world average. This company would not be able to assess some of its efforts if it used methods based on world averages. Thus, this paper supplies a method that enables companies to obtain specific information on criticality, as well as social aspects in their own supply chains, and that points out areas for improvement. It uses company-specific data to develop a company-specific method to measure company-specific criticality and the social aspects of company-specific product supply chains.
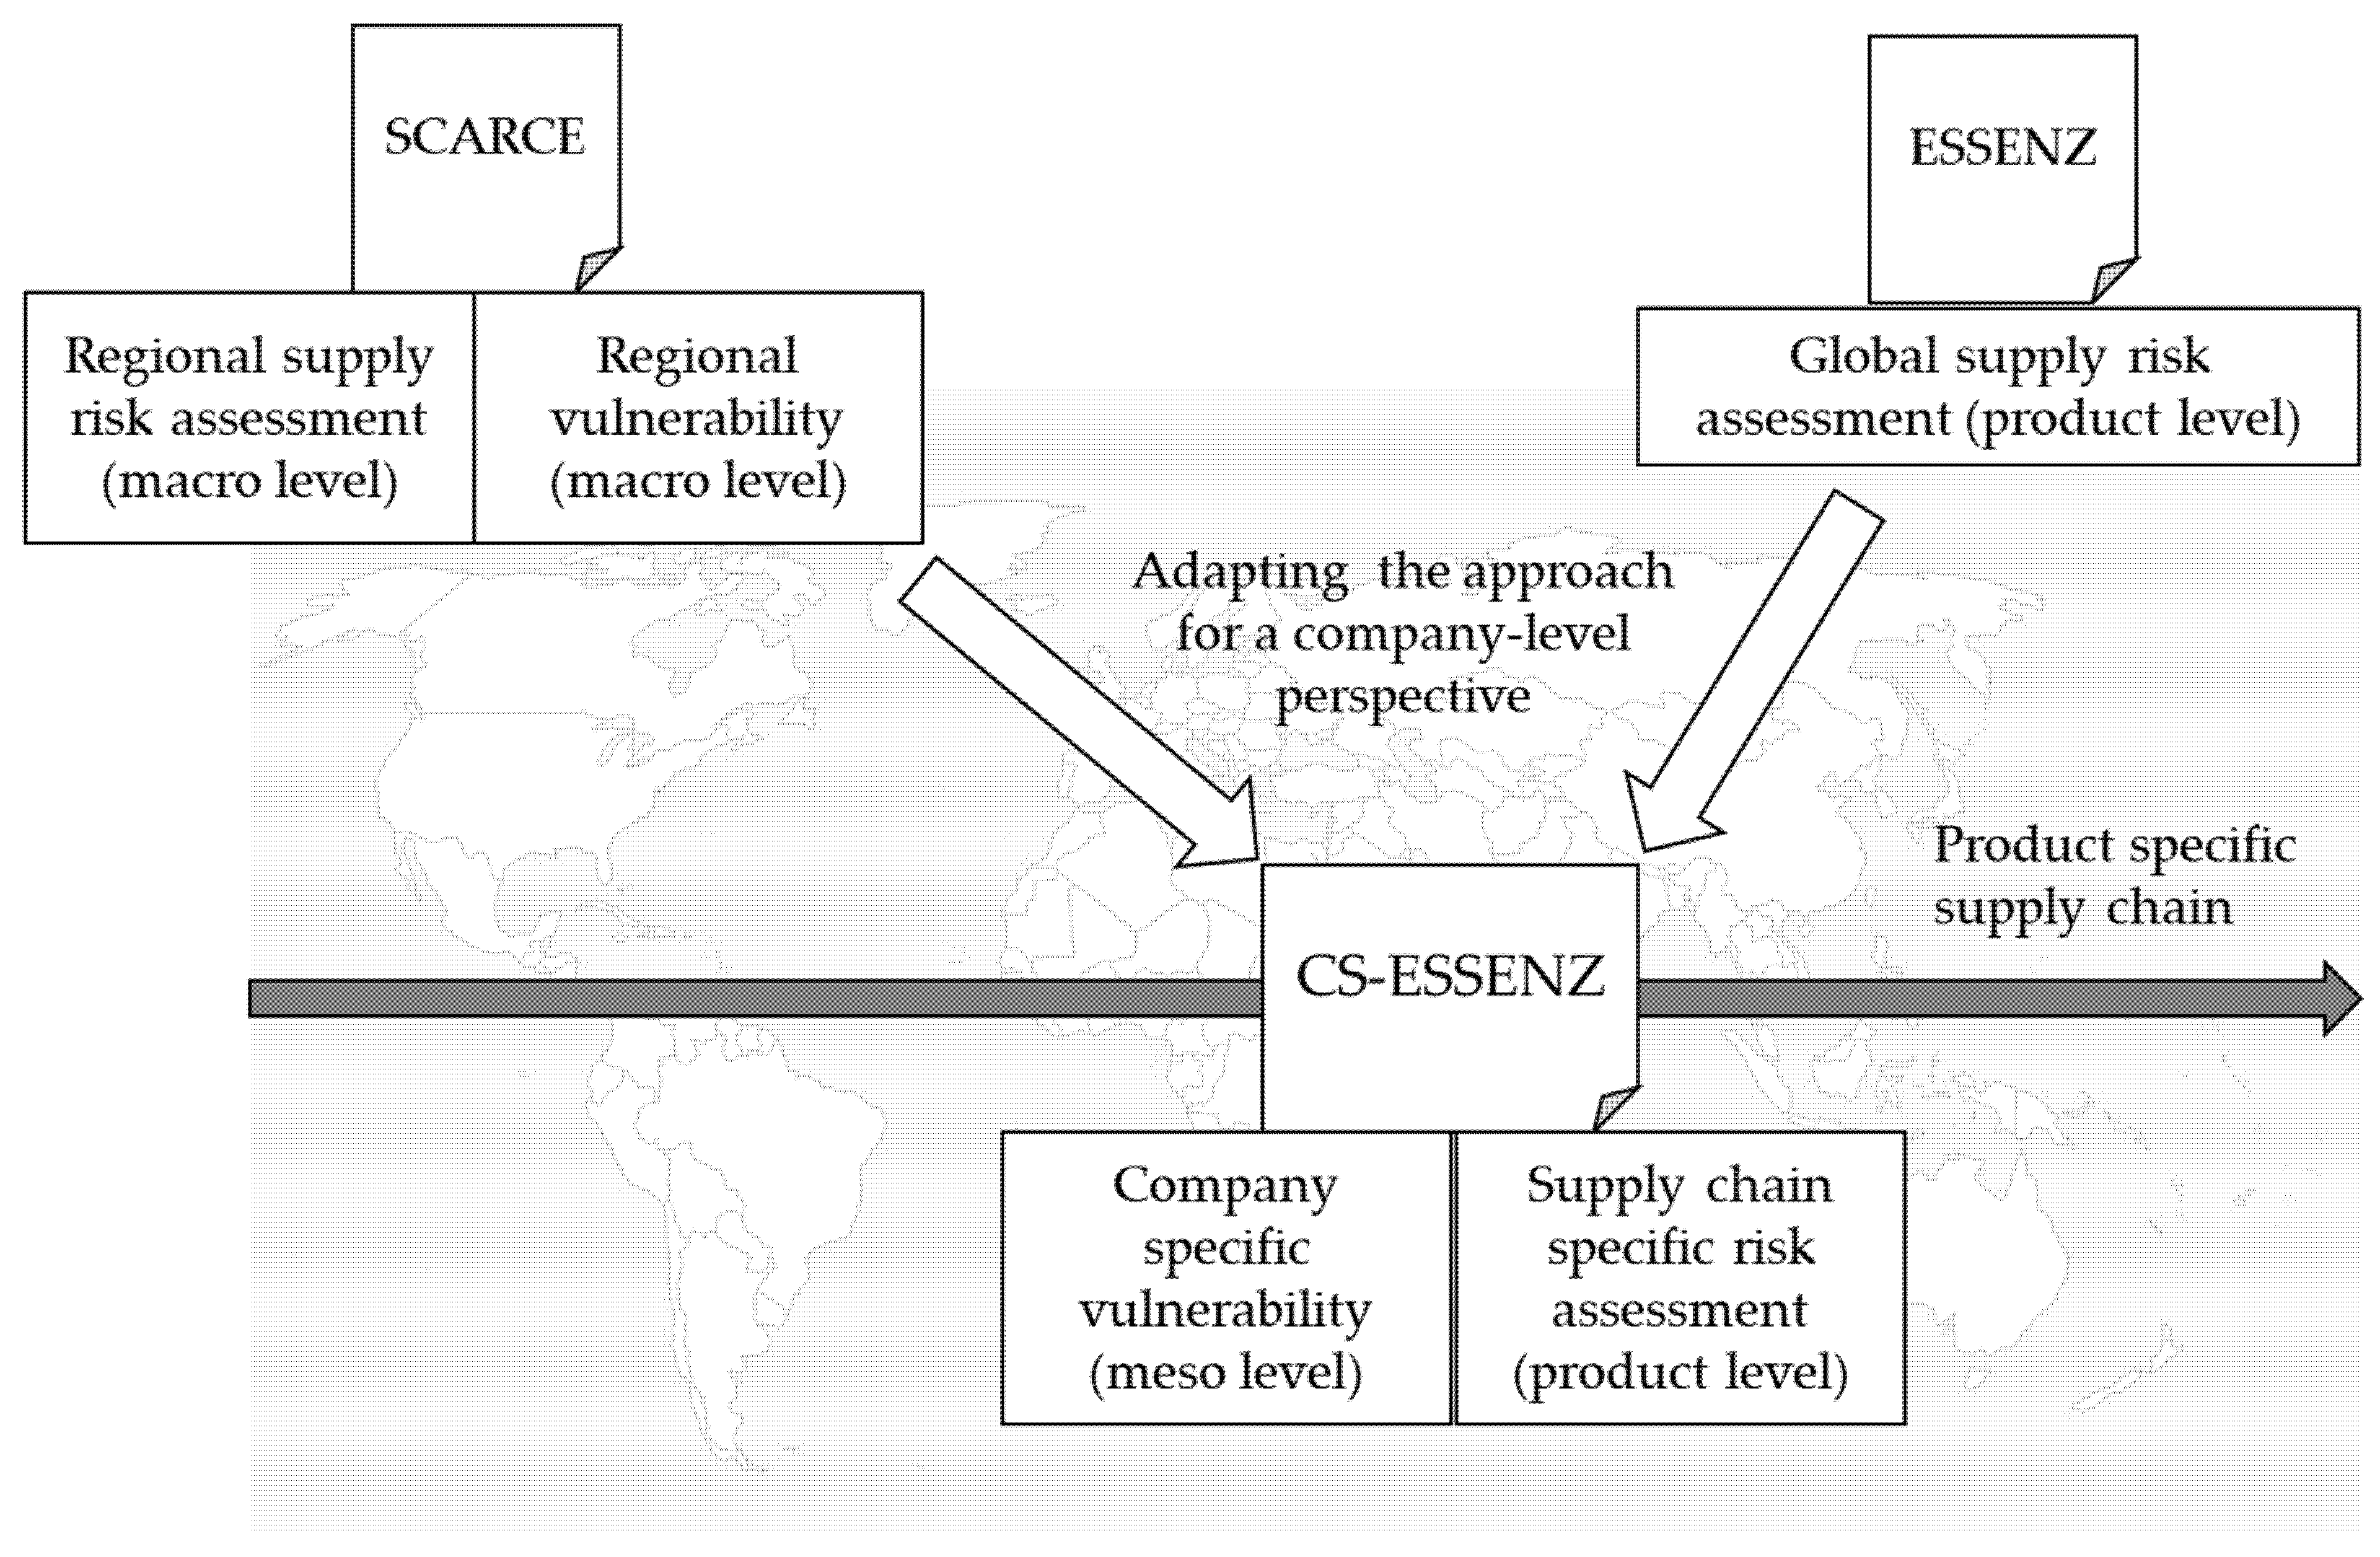
This newly developed approach is based on ESSENZ [15,16] and SCARCE [21] (approach is to enhance the assessment of critical resource use at the country level) (see Figure 1). Based on these two approaches available for product assessment, ESSENZ was chosen because it was identified as one of the more appropriate approaches for addressing criticality aspects within product assessments, according to the UNEP/SETAC task force for mineral resources [22,23,24]. SCARCE is a region-specific approach derived from ESSENZ. As some of the authors of this paper were also involved in developing ESSENZ and SCARCE, the limitations and characteristics of both approaches were known, and background data for calculation were available.
ESSENZ is an approach for determining the resource efficiency of abiotic materials on the product level throughout the supply chain, considering social and environmental impacts as well as criticality. SCARCE assesses the criticality of abiotic resources on a regional level, and also considers social and environmental impacts. Impacts are measured in 21 (ESSENZ) and 25 (SCARCE) categories. For each category, an indicator is defined, and this is used to calculate the final characterizing factors (CFs) (more details on the methods, categories, and indicators can be found in Section S1 of the Supplementary Materials). In ESSENZ, the CFs are based on global averages. The data fed into SCARCE are mainly derived from the import mix of the country under review. The indicator values for availability and/or criticality are placed in relation to target values, applying the distance to target approach (DtT) (see Equation (1)). A DtT value lower than one means that the indicator value is lower than the target, and thus at least as good as the target. Therefore, it can be set to zero, and ignored in further evaluation.
The company-specific ESSENZ method developed in this paper (hereafter referred to as CS-ESSENZ) identifies potential points of criticality within a company’s supply chain for a specific product. It extracts the results generated with ESSENZ and complements these results with data from SCARCE’s vulnerability measurements, using company-specific data along the supply chain as well as for its vulnerability (see Figure 1). This way, the method can reveal areas where a company can improve its position with respect to criticality and enable it to increase the transparency of its supply chains.
2. The CS-ESSENZ Method
2.1. Developing CS-ESSENZ
CS-ESSENZ was developed in five steps. Step 1 entailed selecting ESSENZ and SCARCE categories relevant from a company’s perspective. Categories that did not prove relevant for the company-level perspective were excluded (more details are presented in Section S1.2 of the Supplementary Materials). Out of 19 ESSENZ and 25 SCARCE categories, 20 were relevant from a company-level perspective.
Step 2 involved adapting all indicators of the categories included to a company-level perspective (see Table 1). The indicators for five of these categories were taken directly from ESSENZ; for one indicator, different input data were used, but otherwise, this approach followed the same logic as the ESSENZ indicator. Another five indicators had to be adjusted, and four completely new indicators developed (see detailed information in Section 2.2.1 and Section 2.2.2. of the paper and in Section S1.3 of the Supplementary Materials). The main objective of these modifications was to derive indicators that would display the opportunities for and threats to the company’s supply chains. These were then analyzed for redundancy in Step 3 to minimize the number of indicators (see Section S1.2 of the Supplementary Materials). Existing target values were adjusted, and new target values were defined in Step 4 (see Section S1.4 of the Supplementary Materials). Finally, Step 5 involved deriving the CS-ESSENZ method (see Figure 2). The following sections explain in detail the various sub-dimensions, categories and corresponding indicators, and calculations.
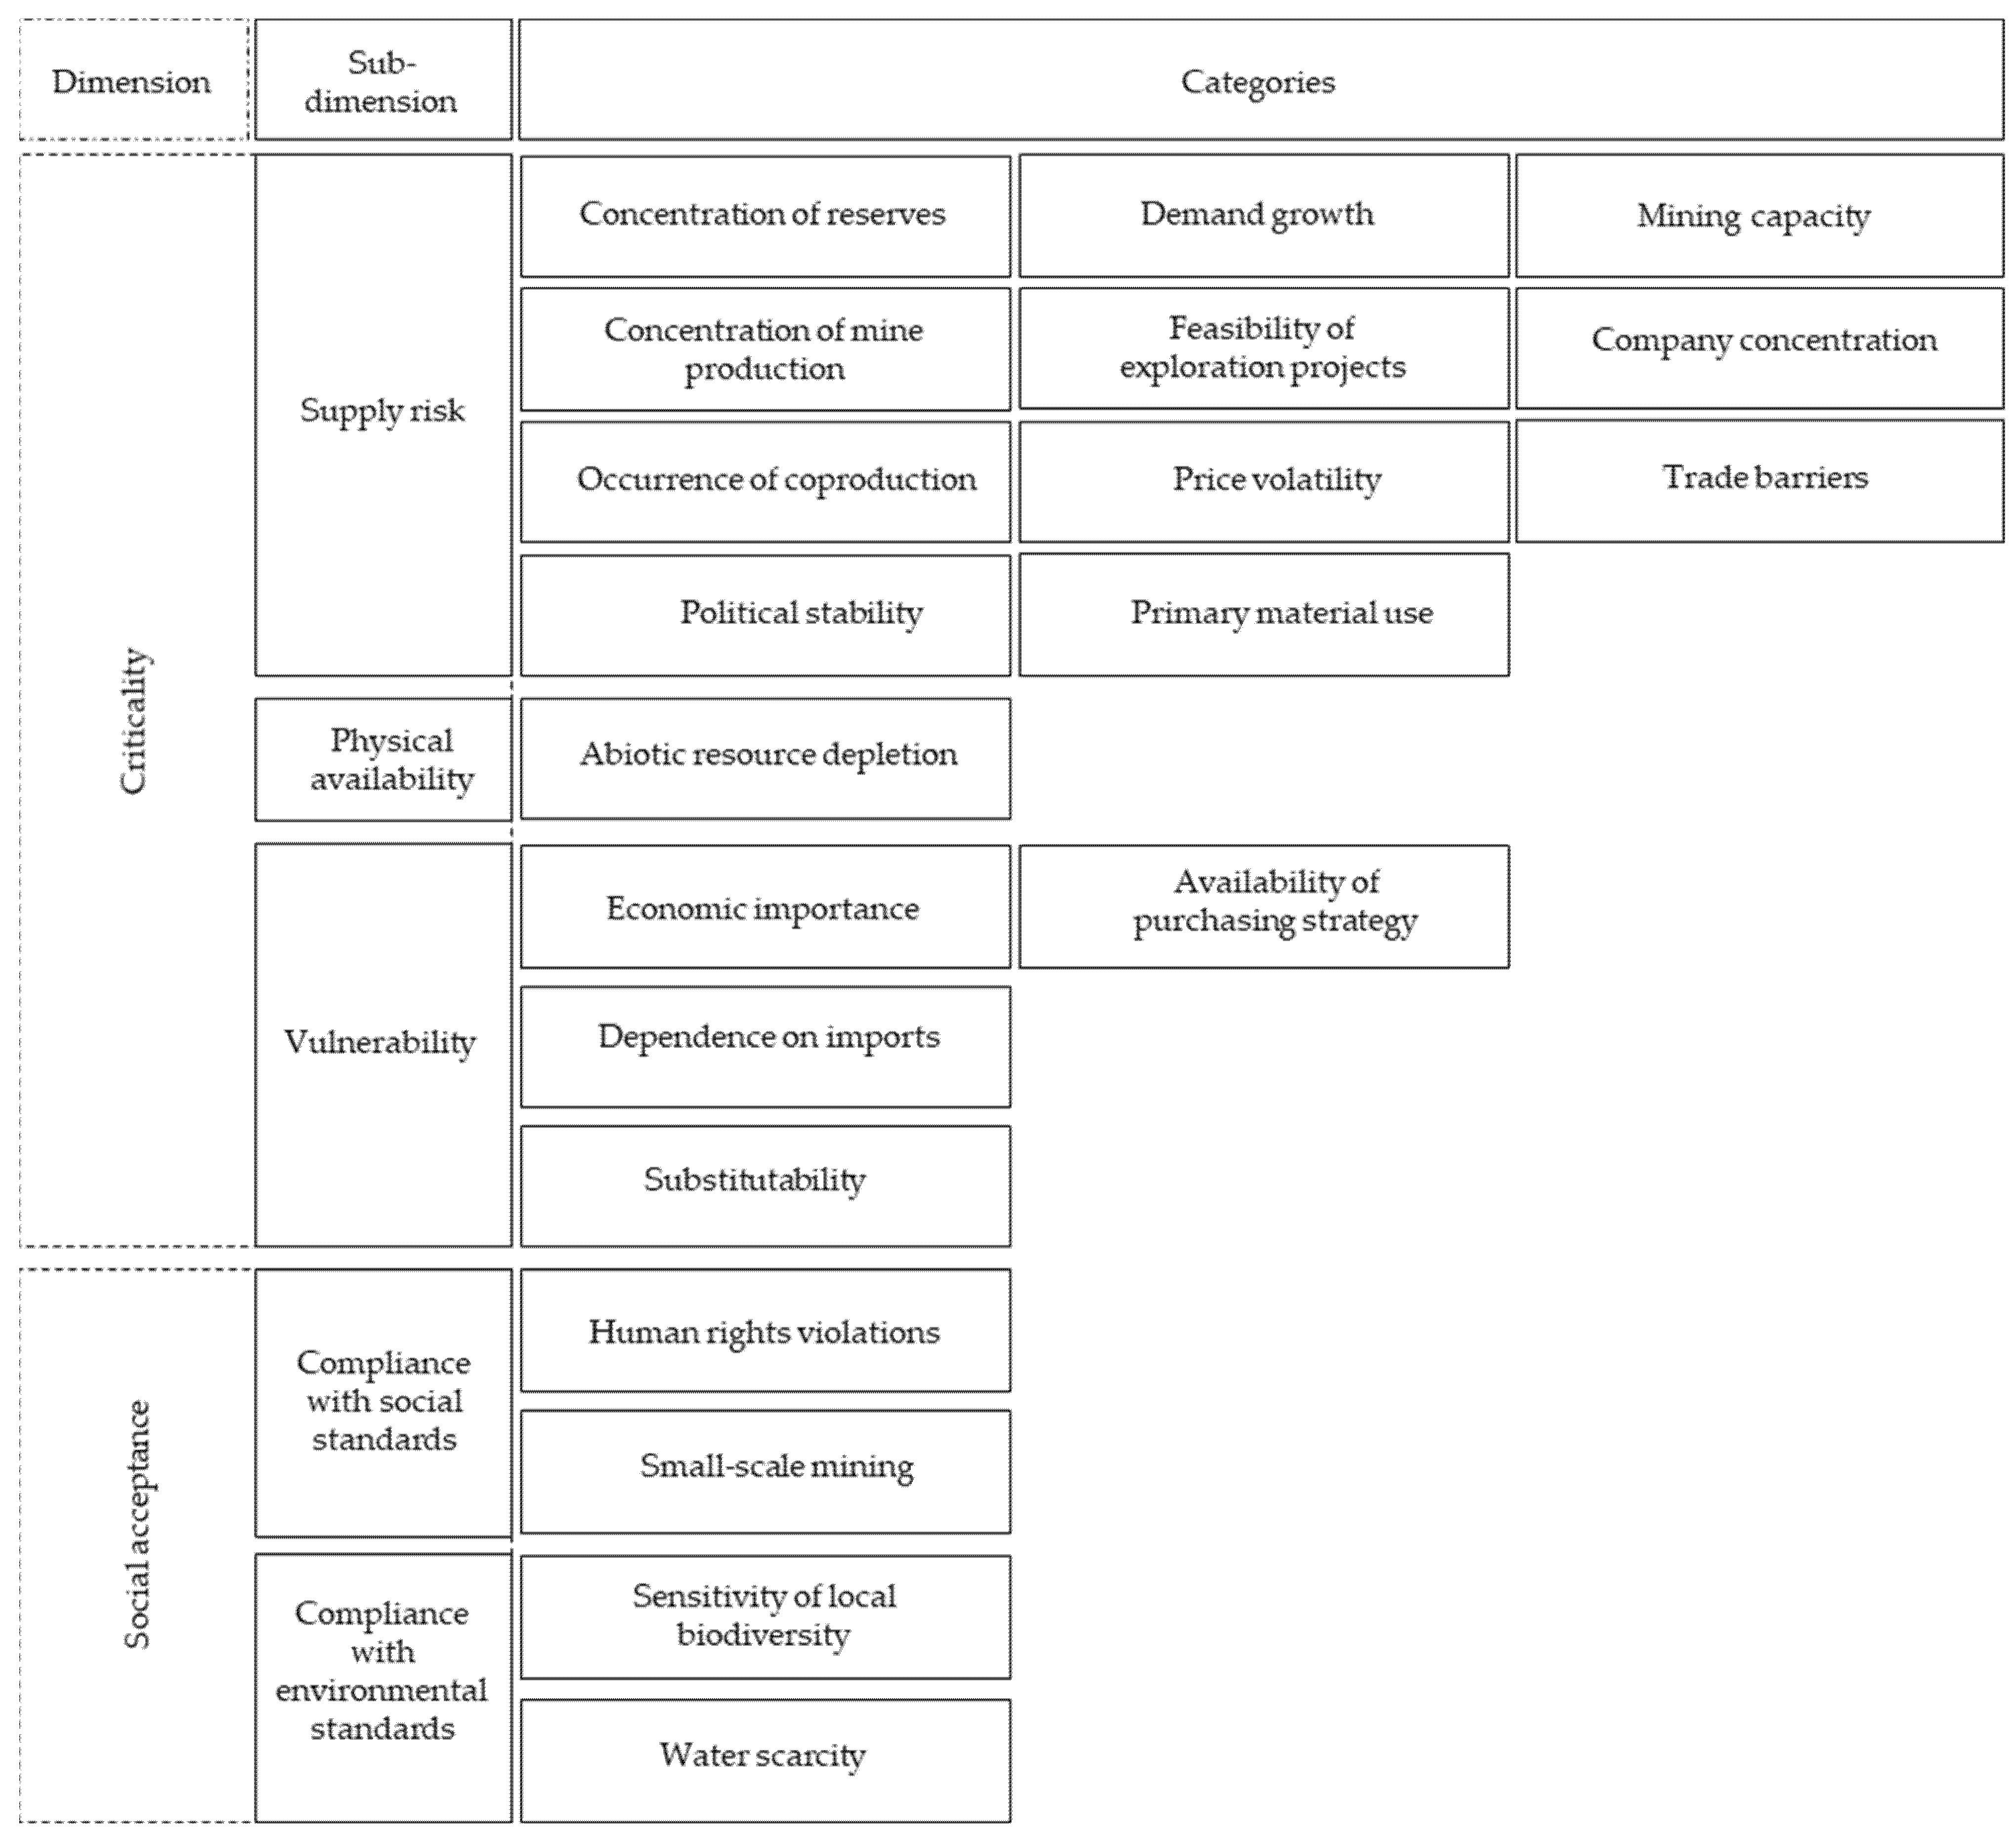
In comparison to ESSENZ, which addresses resources in line with sustainable development, the focus of CS-ESSENZ focuses on comprehensive criticality by covering the two dimensions: (classical) criticality (consisting of supply risk, physical availability, and vulnerability) and the societal dimension (compliance with social and environmental standards), which represents the extended criticality view. The environmental assessment of ESSENZ, which consists of carrying out a life cycle assessment, is omitted in CS-ESSENZ, because the focus is on an extended criticality assessment.
2.2. The Application of CS-ESSENZ
The following section describes the procedure of applying CS-ESSENZ in two steps.
2.2.1. Preparatory Step: Hotspot Analysis Using the ESSENZ Approach
Since CS-ESSENZ complements results from the ESSENZ evaluation, the relevant product system should first undergo an ESSENZ evaluation. The results of ESSENZ reveal hotspots, which are then further evaluated with CS-ESSENZ. The identification of hotspots among the supply risk categories proceeds as follows:
- identification of the highest results for each category (five highest, except for cases where several results were very close);
- identification of the highest results for each resource (four highest, except for cases where several results were very close);
- when the element–category combinations identified in Steps 1 and 2 overlapped, these were identified as hotspots;
- finally, the highest and second-highest results from Steps 1 and 2 were identified as hotspots as well.
This process ensures that no category or resource is limited to a single combination of analysis, which could otherwise generate blind spots in the interpretation of the scaled results.
2.2.2. Determination of Company-Specific Characterization Factors
The next step involves calculating the CFs for a company-specific product assessment.
In CS-ESSENZ, the supply risk is represented by 11 categories (see Table 2). The following paragraphs describe how these company-specific product indicators are calculated for each of these categories:
- Concentration (reserves, production, and company): when the global concentration of one of the elements is high, it is harder for a company to improve its supplier structure. Therefore, each concentration category consists of two values set in relation to the others. One value represents the concentration among the suppliers/supplying countries, and the second value reflects the global concentration of reserves, production, or companies. The Herfindahl–Hirschmann Index (HHI) was used to calculate the concentration values [25]. The concentration of reserves is calculated as the ratio of the HHI of reserves among the supplying countries to the global HHI of reserves. The concentration of production, and company concentration, are calculated analogously. Equation (2) shows the generic concentration formula that is used for all three concentration categories. A concentration indicator lower than one implies that the company is performing better than the world average; a value higher than one, on the other hand, implies that the concentration within the company’s supply chain is higher than the world average, and therefore there is potential for improvement.
- Mining capacity: the indicator for mining capacity is calculated using a static lifetime. Only countries with current supply reserves are considered, because only these countries can provide information on how long a resource is available in the short term. Changing the supplying countries would require finding new suppliers and, thus, cause transaction costs due to information needs, exploration, and negotiation [26].
- Feasibility of exploration projects: the indicator for a material i is calculated by multiplying Stedman and Green’s policy perception indicator (PPI) [27] in supplying country x (PPIx) for material i by the relative share of supply of material i from country x (sspx,i) and finally totaled (see Equation (3)). A high value indicates high attractiveness for further exploration projects within the supplying countries, and vice versa.
- Occurrence of coproduction: in CS-ESSENZ, the indicator results are based on data by Nasser et al. [28]; this publication supplies data on the occurrence of a metal as a byproduct on a scale from zero to 100% in steps of 10%. The data from Nasser et al. [28] were recalculated so that the indicator ranges from zero to one. Zero represents a metal occurring strictly as a main product, while one represents a metal occurring only as a companion.
- Trade barriers: to avoid value judgments concerning liberalism and protectionism, the CS-ESSENZ indicator for trade barriers assesses the facilities of trade in a country, such as the efficiency and transparency of border administration, and the quality of transport infrastructure, as well as the viability and security of economic contracts (e.g., the quality of public institutions and protection of property rights), but omits market access. In other words, three of the pillars of the enabling trade index (ETI) are incorporated into this indicator: border administration, infrastructure, and the operating environment [29]. The three scores are equally weighted as a single trade score (tsx) for each country x. They are then multiplied by the country x’s share of a material i relative to all countries supplying that material (see Equation (4)).
- Political stability: the indicator result for political stability is calculated analogously as in ESSENZ (for details, see Section S1.3 of the Supplementary Materials). The only difference is that only supplying countries are used.
- Demand growth: in CS-ESSENZ, the demand growth of material i (DGi) of the relevant company in the previous year (DGi, company previous year) is divided by the ESSENZ indicator (see Section S1.3 of the Supplementary Materials) for demand growth (see Equation (5)). Here the DGi of ESSENZ is not interpreted as demand growth, but rather as a production trend. The company-specific DGi represents the relationship between the increasing/decreasing need of a specific material i of a company to the change in the production of that raw material i. If the company purchases significantly more material i than in the previous year but global production of the given material does not increase at the same rate, this will lead to a result greater than one. This poses a higher supply risk to the company.
- Primary material use: in CS-ESSENZ, the ESSENZ results for the primary material use (PMU) of metal i are used to determine the relative performance of the company in primary material use (PPM), in relation to the global average (see Equation (6)).A PPMi higher than one indicates that the company is using more primary material than the world average, while a PPMi lower than one will result when a company is performing better than the world average. An indicator result that is higher than one implies the potential for improvement.
- Price volatility: the indicator result is calculated analogously to ESSENZ.
The determination of the CFs of supply risk is analogous to ESSENZ (details are described in Section S1.1 of the Supplementary Materials).
The CS-ESSENZ method uses four categories to constitute the dimension of vulnerability (see Table 2):
- Economic importance: the more important a material is for the economic activities of a company; the higher the company’s vulnerability is to supply problems. The economic importance of a raw material can be reflected in how important this mineral is for the functionality of the company’s product or products. To measure the importance of material i for functionality, qualitative data from various sources [37,38,39] were transformed into functionality scores (fsi,p) of material i for product p. The economic importance of a material (EIi) is calculated based on the fsi,p, as shown in Equation (7). The functionality scores range from zero to one, where one represents the material being essential for functionality, and zero as irrelevant for functionality. These scores are multiplied by the turnover the company generates with product p (top) and totaled. The sum is then divided by total turnover (tto). This way, the different functionality scores are weighted by their contribution to total turnover.
- Dependence on imports: this indicator result is calculated analogously to SCARCE, with the difference that company-specific imports for the product are used.
- Purchasing strategy: The indicator for purchasing strategy (PSi) represents the share of material i originating from countries that have signed raw materials partnerships with the company’s home country.
- Substitutability: To generate an indicator for the substitutability of a material (SIi) that accounts for technical substitutability as well as economic, geological, and political considerations, CS-ESSENZ’s SIi is an average of both substitution indices (SIi,EI and SIi,SR) from the European Commission [10] and Vidal-Legaz et al. [31] (see Equation (8)). SIi,EI covers the economic supply risk of substitutes for material i and SIi,SR, including societal, political, and geological parameters for substitutes. Both are limited to materials that are technologically proven to be substitutes of material i [31].
The determination of the CFs of the vulnerability dimension is analogous to the process in SCARCE. However, CS-ESSENZ uses target values for vulnerability as well. This is done for consistency and to ease interpretation. These target values are derived from the following assumptions:
- Economic importance: the high economic importance of a material implies a high dependence on the material. To reduce the impact of potential supply risks of individual materials on the overall business activities of a company, the economic importance of the materials should not be minimized. Since this is limited by technological factors, a relatively high target value of 0.25 was set.
- Purchasing strategy: since a politically secured procurement should be the goal, the target value is set to one.
- Substitutability: to keep vulnerability low, substitutability should be very high. Therefore, 0.1 was chosen as a target on a scale from one to zero, where one represents no substitutability and zero completely equivalent substitutability.
The same approach as presented in SCARCE was applied to determine the categories of “human rights violations” and “small-scale and artisanal mining” of the subdimension of “compliance with social standards.” “Compliance with environmental standards” is displayed in the “sensitivity of local biodiversity” and “water scarcity” analogously to SCARCE but leaves out “climate change.” “Climate change” is not included in the company-specific method, as an assessment of the specific global warming potential would demand a complete life cycle assessment (LCA). In the case of a given LCA, the global warming potential, as well as other environmental impacts, can and should be integrated in CS-ESSENZ.
3. Case Study: A Smartphone
This section demonstrates how CS-ESSENZ is applied and how to obtain results. CS-ESSENZ was used to further evaluate the hotspots identified when applying ESSENZ, and to verify their relevance for a specific product using the company’s data. With the help of a theoretical case study, the applicability of CS-ESSENZ is shown, for which several simplifying assumptions are made concerning the company’s product portfolio and the bill of materials (BoM) of the smartphone.
3.1. Goal and Scope of the Case Study
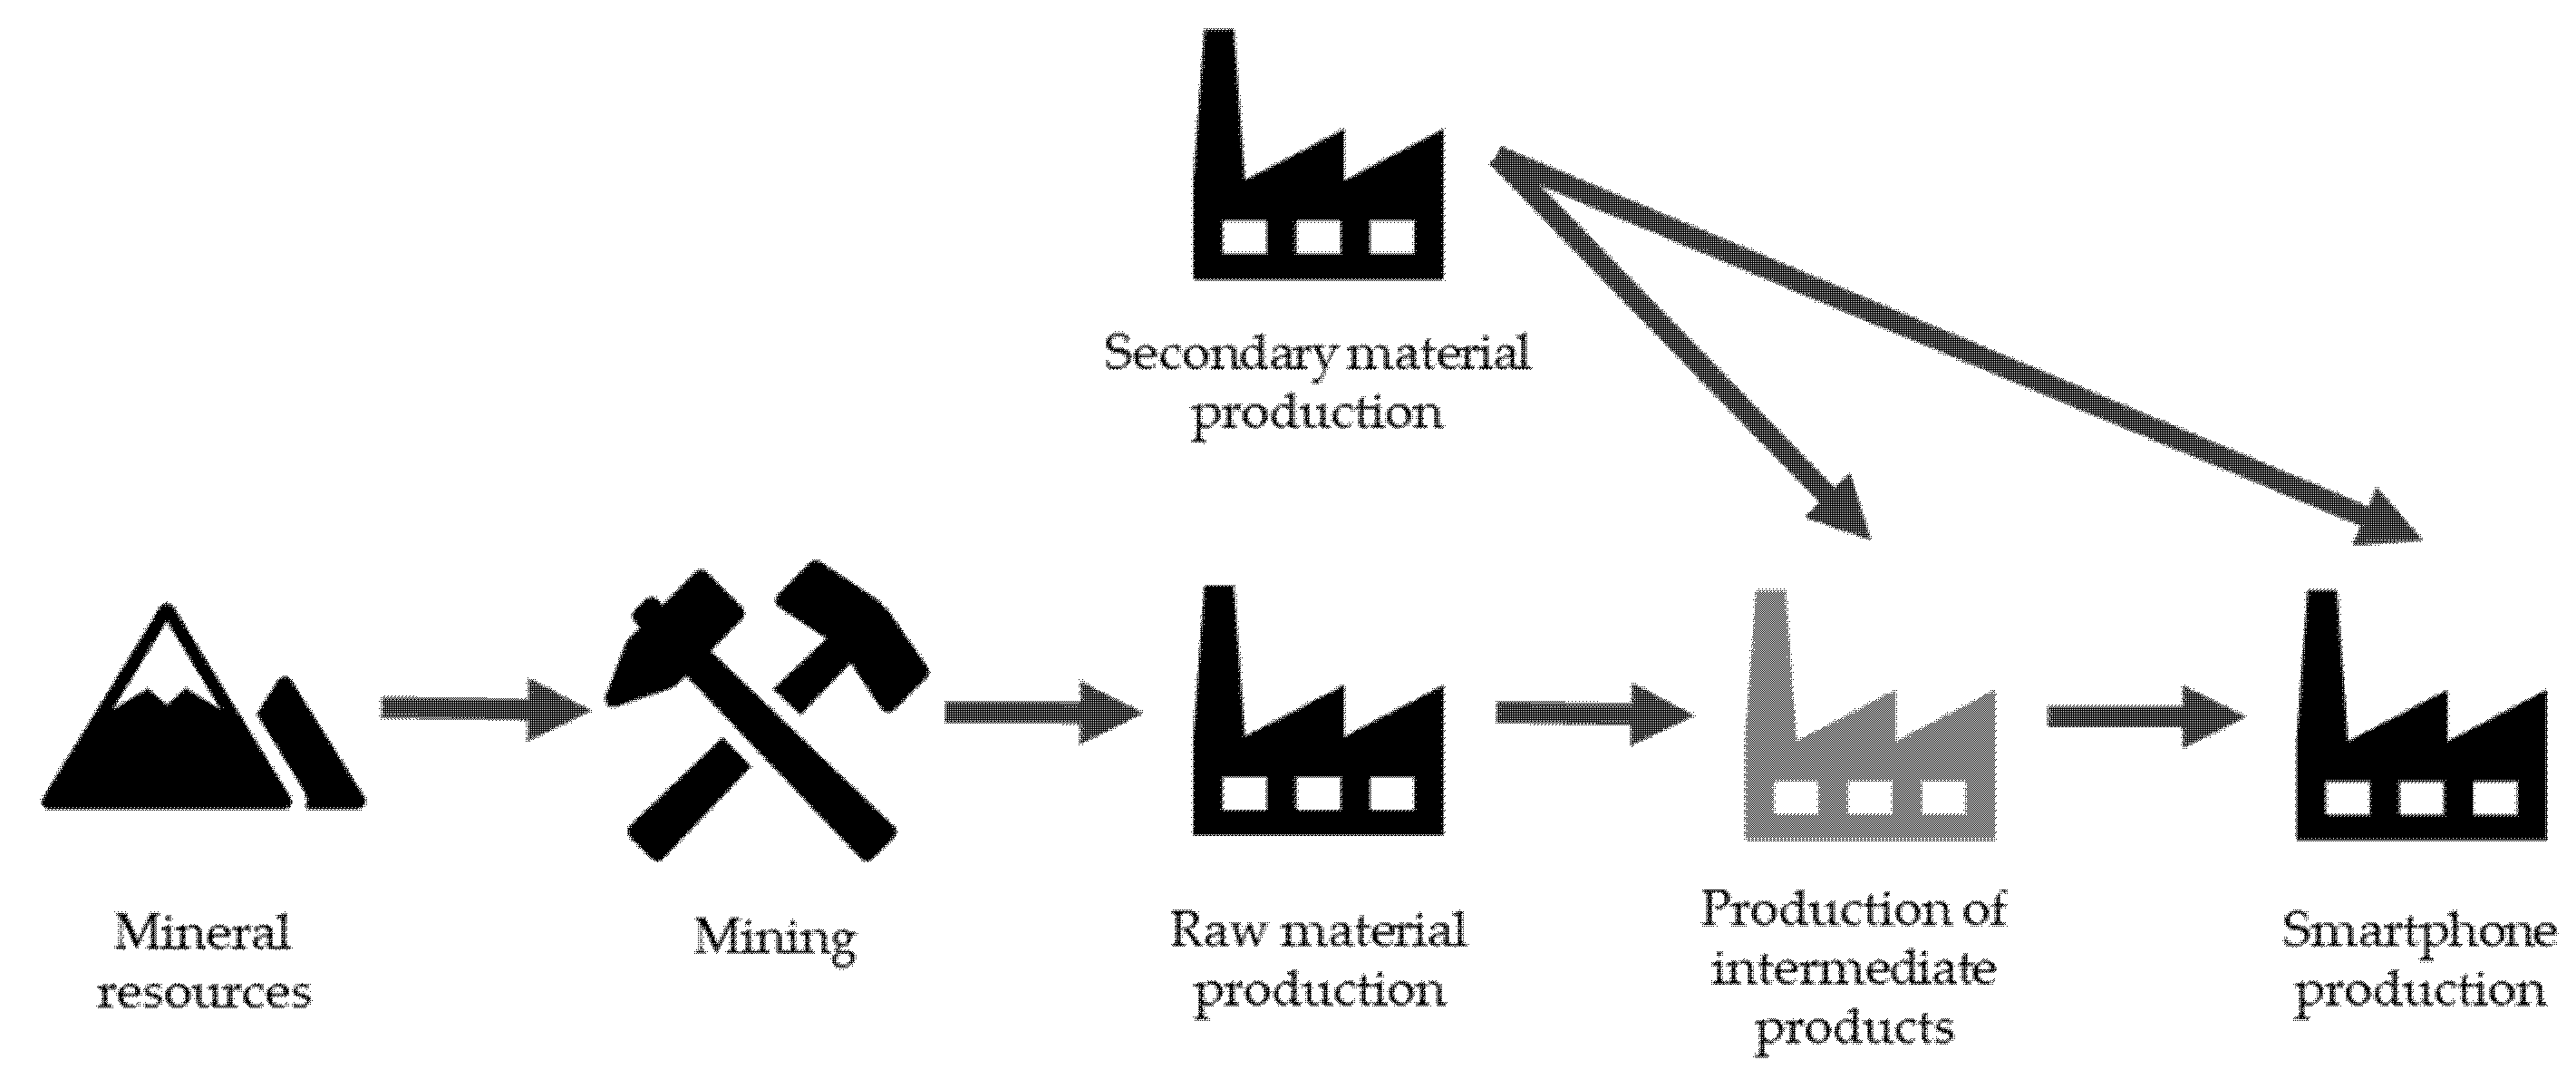
The case study uses a hypothetical German smartphone-producing company for analysis. The model assumes that the company produces only smartphones, and exclusively of one type. The functional unit of the case study is a single smartphone ready for customer use. The processes from the mineral resources to the production of the product are included (see Figure 3), as these processes are part of the company’s supply chain. The resources used for infrastructure, transportation, energy, and heat production are not considered. The BoM is based on a literature review including papers on older technologies. Therefore, elements that are no longer allowed to be used, such as lead [41], are still included in the BoM, while other commonly used elements, such as silicon and lithium, are not included. Nevertheless, this does not undermine the goal of this paper, which is merely to demonstrate the applicability of the method. The comprehensive BoM, as well as the supplying countries, share of supply by country, demand growth, recycling content in production, and criticality for the functionality of the phone, are presented in Section S2, Table S2 of the Supplementary Materials.
The BoM of the smartphone is based on Cucchiella et al. [42], who determined an average BoM based on a literature review. In the case study, the mining and producing countries in the supply chain were selected based on information from [43,44,45]. Detailed information on the BoM and the origin of the materials can be found in Section S2 of the Supplementary Materials.
First, the ESSENZ approach was applied to determine global supply risk hotspots (see Section 3.2). Next, the CS-ESSENZ approach was applied for these hotspots (see Section 3.3) to assess the product on the company-specific level and to refine the global results from ESSENZ.
3.2. ESSENZ Results of the Case Study
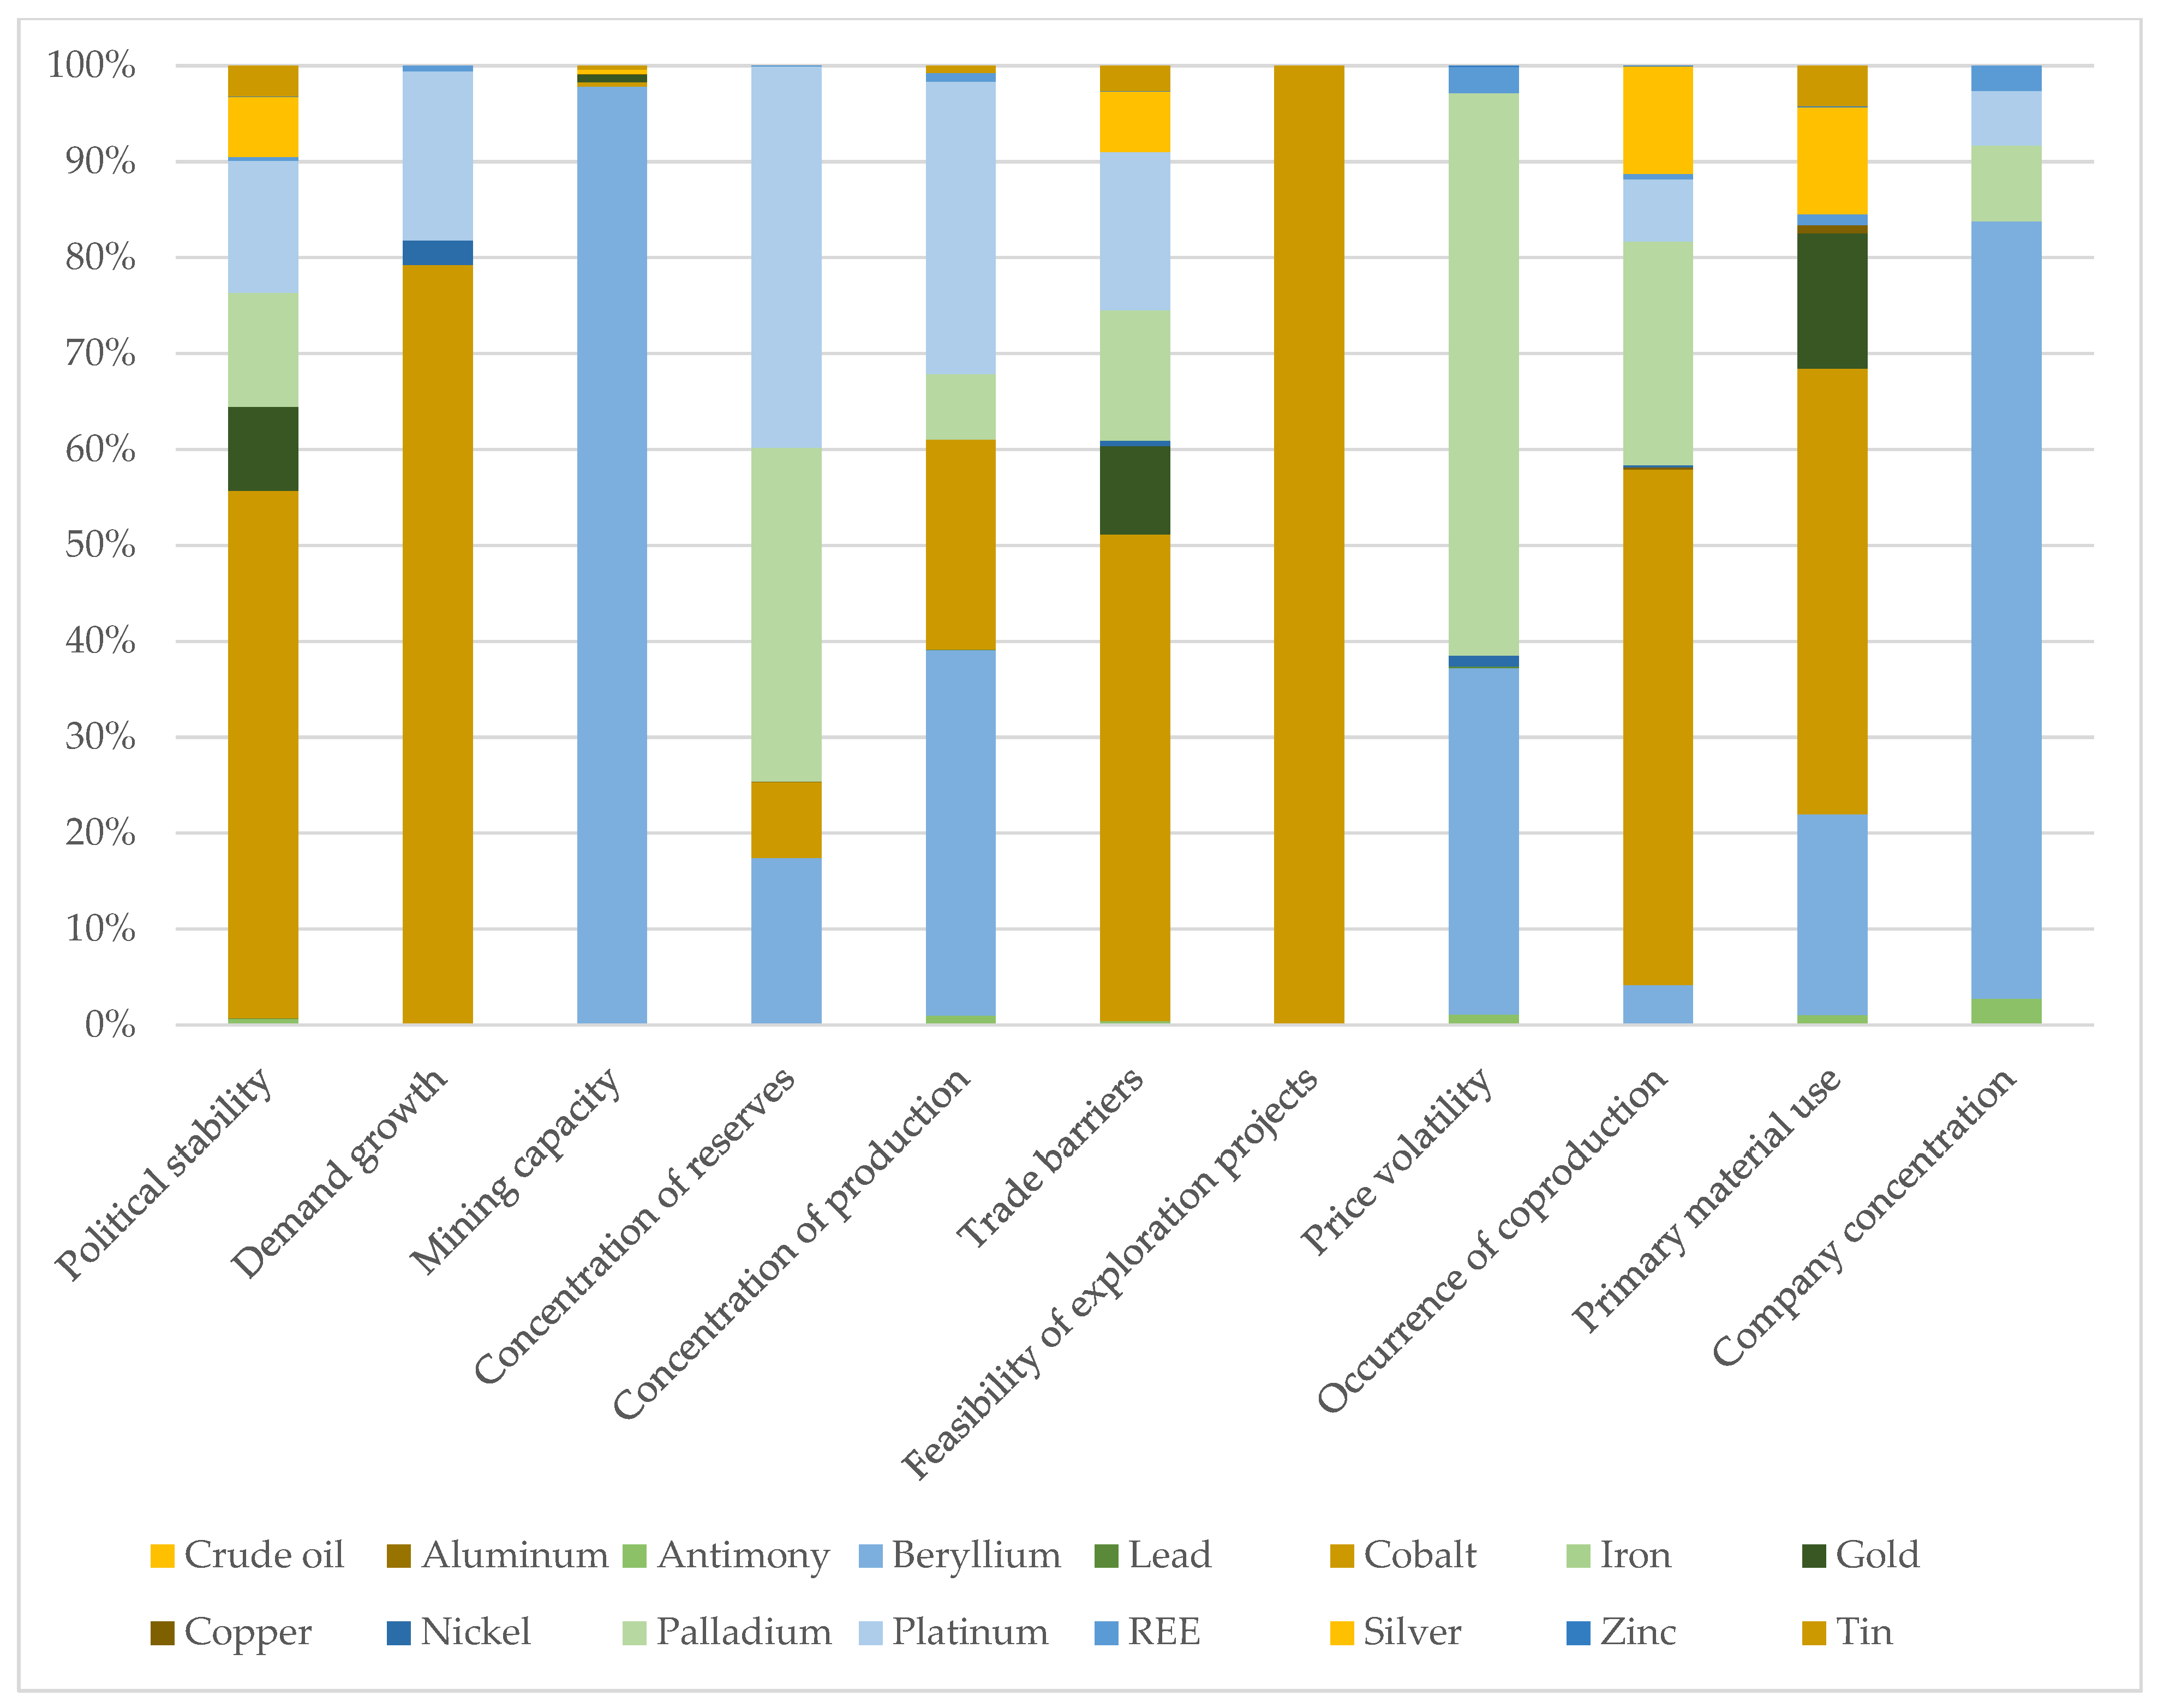
The results for supply risk are displayed in Figure 4, where the aggregated results for each category of materials are set to 100% (for more details, e.g., on physical availability, compliance with social standards, and compliance with environmental standards, see Section S3 of the Supplementary Materials). It shows which material has the highest relative result within a category. Within the categories of political stability, demand growth, trade barriers, feasibility of exploration projects, occurrence of coproduction, and primary material use, cobalt has the highest impact. Cobalt is primarily mined in the Democratic Republic of Congo (Dem. Rep. Congo), which contributed about 56% of the worldwide production in 2015 [46]. The political situation in the Dem. Rep. Congo is highly unstable due to political conflicts that officially ended at the beginning of the 21st century (e.g., the Second Congo War) but continue to have an impact [47]. Thus, the country’s trading environment is unstable. Beryllium is the element most profoundly affected by mining capacity and company concentration, as the majority of beryllium is mined in the USA by one company [48]. Concentration of reserves is mainly driven by palladium and platinum. About 95% of the world’s platinum group metal reserves are in South Africa [48]. For price volatility, palladium has the biggest impact. The concentration of production is the highest for beryllium and platinum.
Table 3 lists the material/category combinations that were identified as hotspots (as described in Section 2.1).
3.3. CS-ESSENZ Results for the Case Study
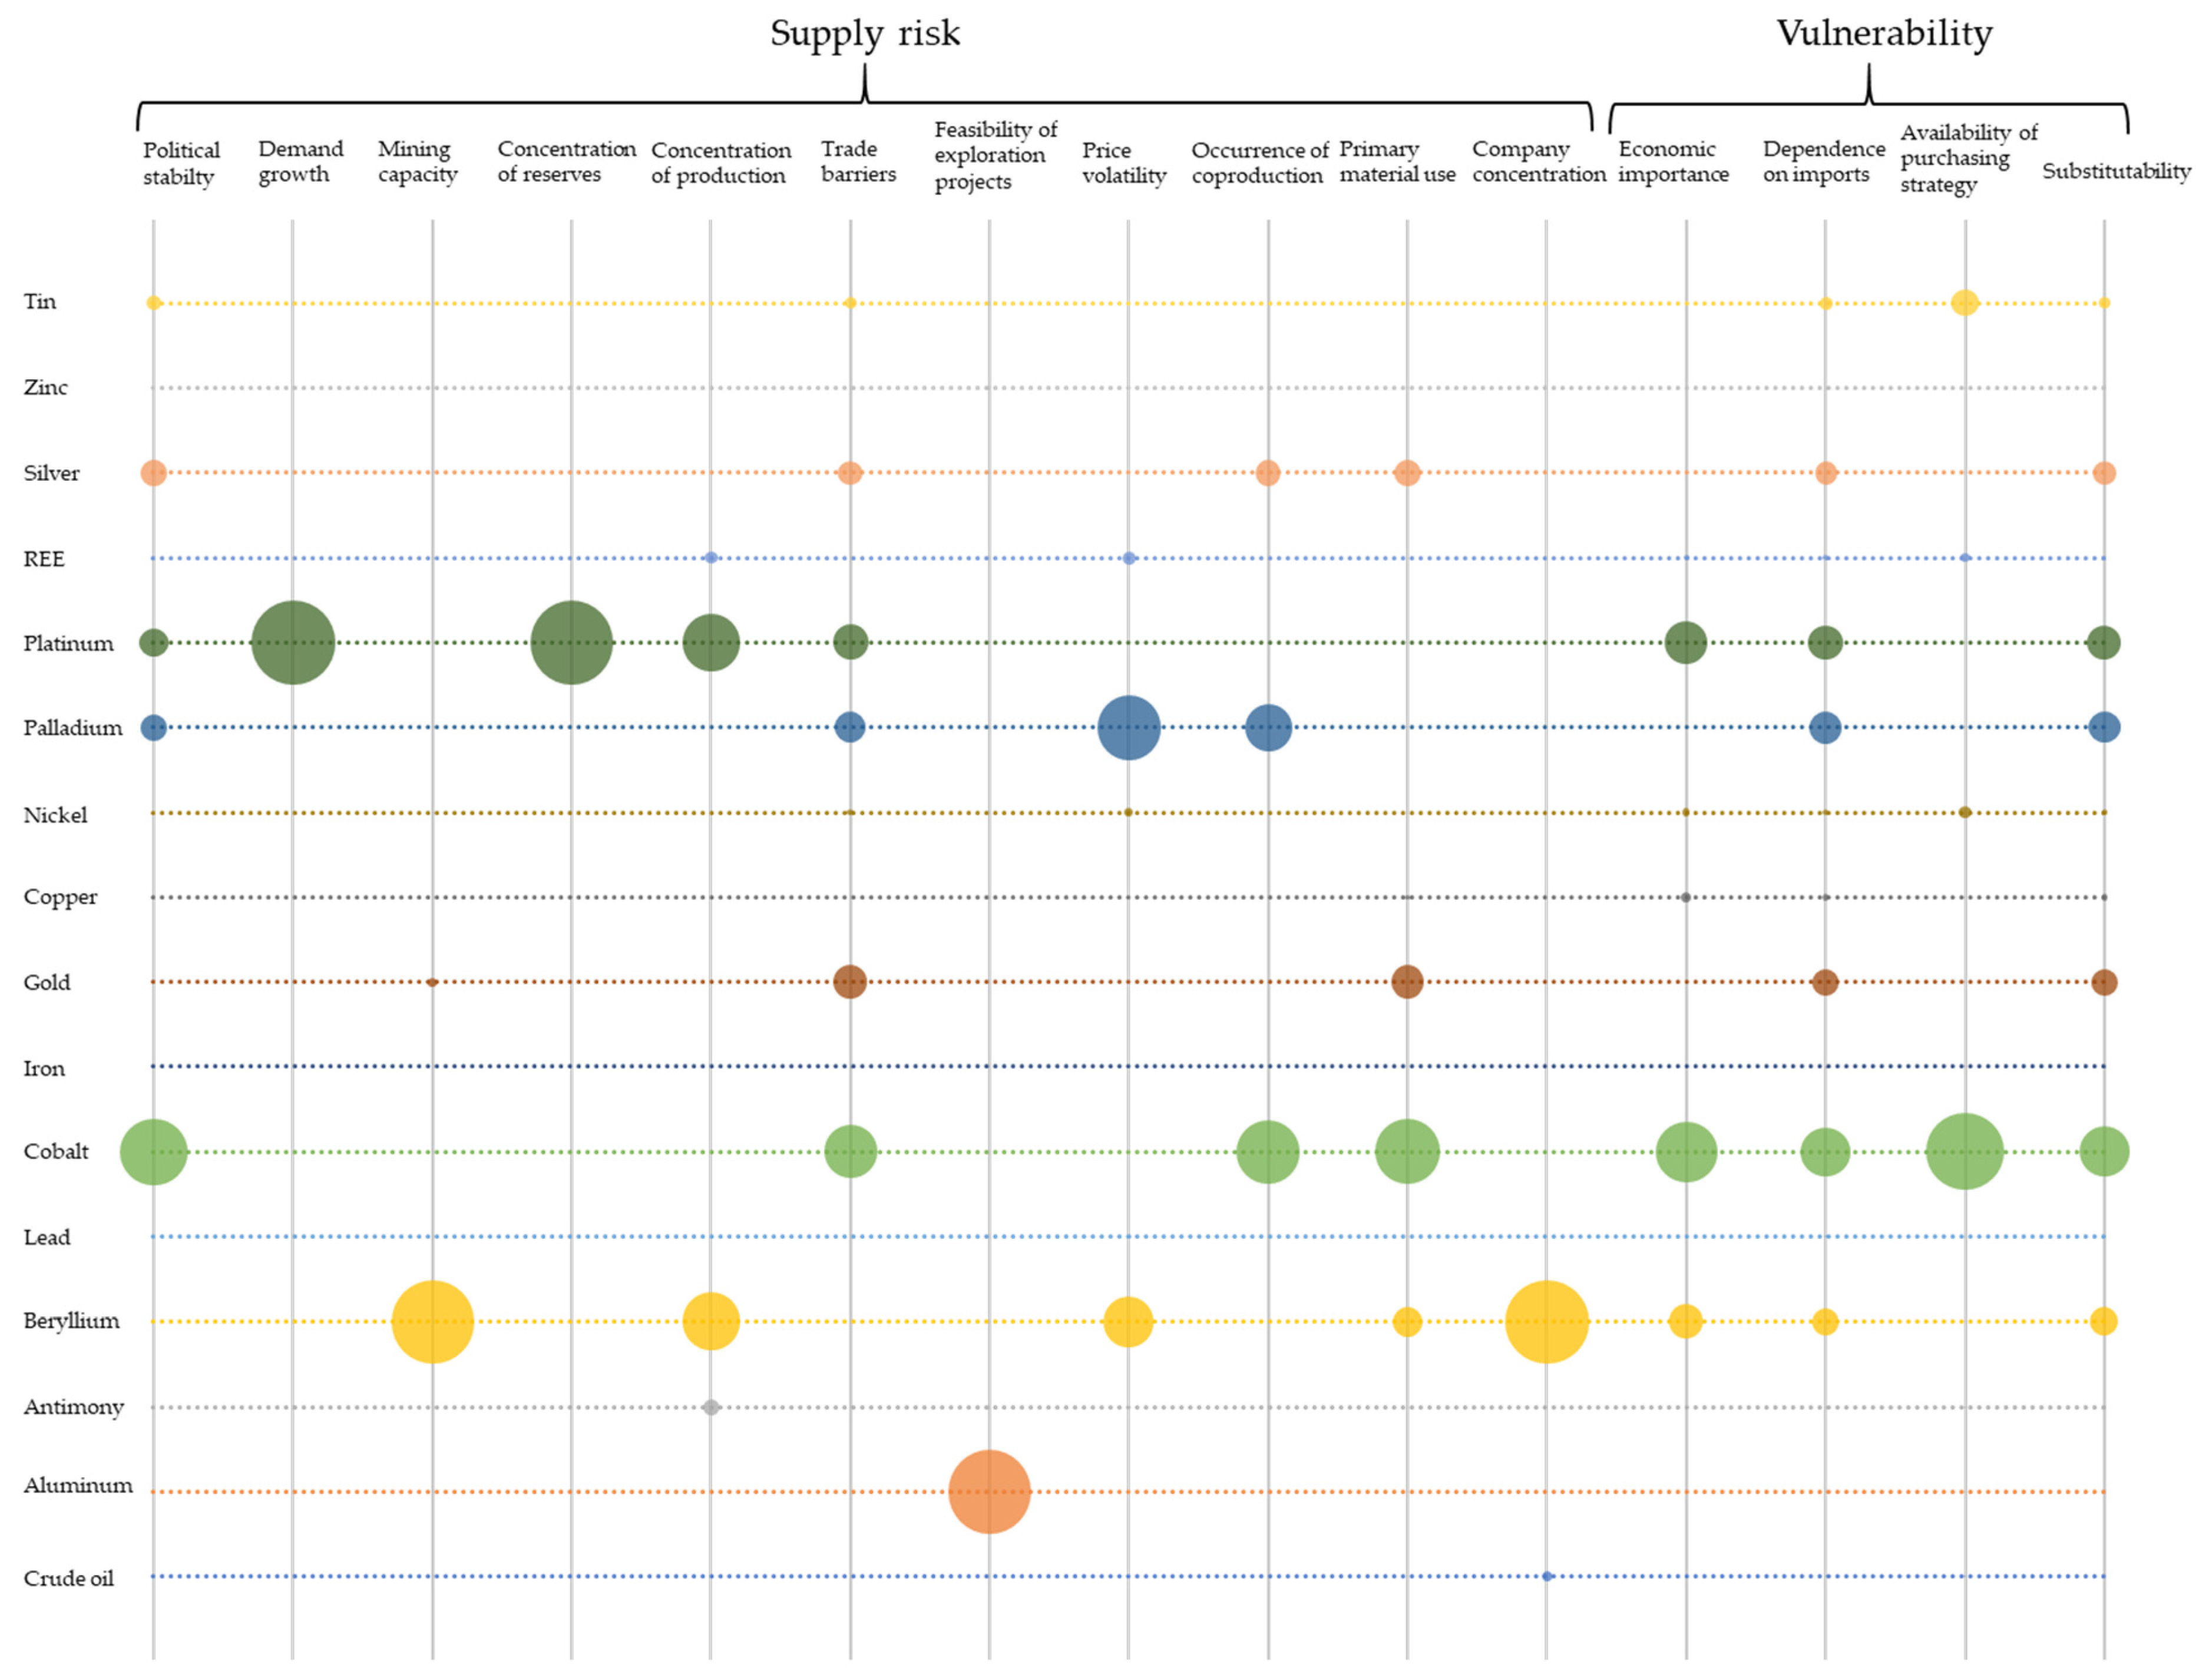
The resulting hotspots were further evaluated with CS-ESSENZ by applying the CS-ESSENZ CFs (as presented in Section 3). This enabled a company-specific evaluation of the product to be achieved, since the CFs are based on company data. In addition, vulnerability is evaluated for all elements of the BoM. Figure 5 shows the CS-ESSENZ results for criticality (vulnerability and supply risks). The bigger the circle in the figure, the higher is the hotspot of the element-category combination. No circle means that the result is at least as good as the company-specific target values (e.g., crude oil and feasibility of exploration projects) or that no hotspot was identified with ESSENZ (e.g., gold in demand growth). The element-category combinations evaluated with CS-ESSENZ are listed in Table 3.
Figure 5 shows the results scaled to the category, setting the sum of the outcomes of all elements within one category to 100%. Figure S6 in Section S5 of the Supplementary Materials presents these results scaled to each element. Here the sum of the results of all categories for one element was defined as 100%. In the following, the results shown in Figure 5 are presented and compared to the ESSENZ results. If the detailed presentation is not of interest to the reader, he or she is advised to skip to Section 4.
Figure 5 shows the results of the categories of supply risk and vulnerability. The results for supply risk show that low political stability has the highest impact on the supply chain of cobalt, followed by palladium, silver, platinum, and tin. This trend was also observed in the ESSENZ results. The result for demand growth indicates that the production trends for the materials are higher than the company’s demand trend, except in the case of platinum. As in ESSENZ, the mining capacity of beryllium and gold was identified as a limiting factor for the supply chain. The concentration of reserves was found to be a relevant factor for platinum. The effect on beryllium and cobalt is negligible in comparison to platinum. Similarly to the ESSENZ results, the concentration of production poses the highest risk to beryllium and platinum, followed by antimony and rare earth elements. Although the concentration of reserves is identical for the production of beryllium and platinum within the supply chain, the overall results of the two differ. In CS-ESSENZ, the HHI of suppliers is placed in relation to the HHI of the global concentration. Since the global beryllium market, production, and distribution of reserves are highly concentrated [48], the CF of the company-specific concentration categories is lower for beryllium. Both CS-ESSENZ and ESSENZ reveal that the supply of cobalt, gold, nickel, palladium, platinum, silver, tin, and zinc is especially threatened by trade barriers. In CS-ESSENZ, the restriction on the supply of antimony and iron is not high in contrast to ESSENZ. The reason for this is that the majority of antimony is imported from Australia and Bolivia (80%) and the majority of iron (90%) comes from Brazil in the case study. A lack of feasibility of exploration projects is highly relevant to the supply of aluminum. In contrast to the ESSENZ results, neither the feasibility of exploration projects of cobalt, nor crude oil is affected in the company-specific case, as the supplying countries (Canada and China) have a low PPI. The trend of ESSENZ in the price volatility and occurrence in coproduction categories is confirmed by CS-ESSENZ. The primary material use of beryllium, cobalt, gold, copper, and silver was investigated in greater detail using CS-ESSENZ. The company in this case does not use secondary material for any of the elements under review, and thus performs worse than the market average. The company concentration only proved high for beryllium and crude oil in the company-specific product evaluation. Although the market concentration of palladium and rare earth elements is high, the company’s relative performance regarding the given market situation is good, and there is little potential for improvement for palladium and rare earth elements.
The right-hand side of Figure 5 shows the results for the vulnerability categories. Beryllium, platinum, rare earth elements, and cobalt are particularly important for the company economically because it is virtually impossible to replace these materials with others. They are essential for the functionality of the smartphone [49]. All elements in the case study are imported to Germany, resulting in a high dependence on imports. The supply of antimony, crude oil, cobalt, nickel, rare earth elements, tin, and zinc is not based entirely on bilateral or multilateral contracts. This factor increases the risk of supply chain disruptions due to changes in diplomacy, because all of these materials are imported. It is virtually impossible to find replacements for beryllium, gold, palladium, and platinum, while crude oil can indeed be fully substituted.
Putting the results for supply risk and vulnerability together allows further interpretation: Although the supply of silver in the case study is likely to be affected by trade barriers, this material can be substituted and is economically less important for the company, which is the same case for tin. Both tin and silver perform well in the societal categories, while cobalt performs poorly in both. Furthermore, the supply of cobalt could be limited by low political stability, high usage of primary material, trade barriers, and a frequent occurrence in coproduction. In addition, there is virtually no substitute for cobalt—the material is economically very important and is imported from countries that have not concluded a political raw material diplomacy contract. Improving the supply chain of cobalt should therefore take a higher priority than silver and tin. The improvement of supply chains for materials with a high supply risk and vulnerability should be prioritized by the company (e.g., cobalt), to minimize risks arising from criticality.
The societal categories were evaluated for crude oil, aluminum, cobalt, iron, and copper. Cobalt (20%) and copper (6%) are supplied in part by artisanal and small-scale mining (ASM). Since more copper than cobalt is used in the production of the smartphone, the difference between the results for both artisanal and small-scale mining is small (see Figure S7 in the Supplementary Materials). The results for human rights violations (see Figure S8 in the Supplementary Materials) show that crude oil performs worst in this category, mainly due to 50% of it originating from China and 10% from Saudi Arabia. Human rights violations are also likely to occur in the exploitation of the iron, cobalt, and copper supplied. The iron in the case study originates from Brazil and China. The cobalt is mainly imported from China and the Dem. Rep. Congo. All these countries perform badly when it comes to human rights. The case is slightly different for copper. The CF of copper for human rights violations is less than half of the CFs of iron or cobalt. However, since the mass of copper in the smartphone is much higher than the mass of the other two metals, its overall result with regard to human rights violations is the third worst result. The local biodiversity is gravely impacted by copper (see Figure S9 of the Supplementary Materials), since the majority of copper is mined and produced in high-density biodiversity zones (e.g., most parts of Chile). The effect of crude oil is less than half as high, followed by iron and cobalt. Water scarcity is highest for crude oil, followed by iron and copper (see Figure S10 of the Supplementary Materials), due to high water scarcity in some of the mining countries.
4. Discussion
Table 4 shows a comparison of the hotspots identified by ESSENZ, and the result of the evaluation of these hotspots using CS-ESSENZ for the supply risk. The “H” on the left indicates a hotspot identified using ESSENZ; the value on the right stands either for “hotspot not confirmed” (N), “small potential for improvement identified” (S), “medium potential for improvement identified” (M), or “high potential for improvement identified” (H). The results of the case study show that 11 out of 58 hotspots identified using ESSENZ could not be confirmed using CS-ESSENZ in the supply risk dimension. Six hotspots showed only a small potential for improvement in the company’s supply chains. Most of the hotspots identified using ESSENZ (29 out of 58) proved to have a high potential for improvement for the company; 12 more exhibited a medium potential for improvement from the company perspective.
The European Commission identified 30 raw materials as critical [50]. Most of the materials with a high potential for improvement in more than three categories identified using CS-ESSENZ (Table 4) are also included in the list of 30 raw materials identified as critical by the European Commission. Beryllium, cobalt, palladium, and platinum are among them. Silver, however, was identified by CS-ESSENZ as having a high potential for improvement in more than three categories, and yet it was not identified as critical by the European Commission. The deviation in results is caused by the differences between the average EU supply chain and the specific supply chain of the company regarded in the case study.
Since only the hotspots identified by ESSENZ were evaluated in further detail (e.g., the impact of political stability on the supply of aluminum or the demand growth for cobalt, etc.), there can be no guarantee that all relevant aspects are considered in CS-ESSENZ. A further inspection of aspects that were not identified as hotspots by ESSENZ (e.g., the impact of political stability on beryllium, the demand growth for lead) revealed that, for some category-element combinations, further hotspots occur when CS-ESSENZ is applied (see Section S5, Table S6 of the Supplementary Materials). The results show, for example, that the impact of the feasibility of exploration projects on palladium and platinum was neglected, because it was not identified as a hotspot by ESSENZ. This was despite the fact that the values resulting for CS-ESSENZ are high when applied to all category-element combinations and not only to the hotspots identified using ESSENZ. Calculating the supply risk results for all elements may therefore reveal additional supply risk challenges, which could be useful information for a company. However, applying CS-ESSENZ to all category-material combinations would scale up the volume of the results, making them less manageable. This decision should therefore be taken depending on the audience and target of the evaluation.
The CFs use a distance-to-target approach to determine criticality results. A target value or a global average served as a reference value. In this case, therefore, the results reflect not only an assessment of criticality aspects, but also the company’s potential for cost-efficiency improvements. The case study shows, for example, that the mining and production of beryllium is highly concentrated [48]. Nonetheless, its result in the concentration of reserves category is comparably low. This accounts for the fact that an improvement in the company’s own supply chain is harder to achieve when the global mining, production, and marketing of a material is highly concentrated. However, the use of target values poses a major challenge. The target values or the comparison with global averages reduces improvement incentives for companies that are already performing better than the target. To meet this negative incentive scheme, both CS-ESSENZ and ESSENZ only consider target values for the criticality/supply risk categories, whereby the incentive for improvement in the societal and environmental categories is not affected. Global averages are only taken as a reference value, where a buying company has little to no impact in the case study, e.g., the concentration of reserves, concentration of production, company concentration, and demand growth. The only exception is primary material use, for which the global average recycling values were included, although improvement is possible if primary material is used. However, a target value was used here because not every industry sector can supply its goods using large quantities of secondary material, e.g., the production of microelectronics demands a high quality and purity of materials [51]. A smartphone, such as the one in the case study, is mainly composed of microelectronic devices. For this reason, such a product cannot be expected to use the same share of recycled content that is used to produce many other goods. For sectors in which a higher share of secondary material usage can be expected, the target value of primary material use should be decreased. Since the indicator for primary material use represents the ratio of a company’s own share of secondary material used compared to the global average secondary material of an element, reducing the target value to less than one would mean that the company must perform better than average to meet the target. Moreover, all target values should be revised before each evaluation to adjust them to the sector/product system, the values of the evaluating institution, and the technological state of the art. The use of outdated target values can generate wrong or misleading results.
Even though it is incentive-driven to reduce the overall vulnerability of an economic entity to the compromise of its supply as much as possible [21], there are two reasons why targets are introduced for vulnerability categories in CS-ESSENZ: a reduction in vulnerability to zero is impracticable, and its introduction enables the results to be to prioritized.
A number of simplifications were needed to determine the indicator for economic importance. In the defined category, the turnover of a product is only regarded as dependent on the product’s functionality. However, other factors also have an impact on a company’s pricing and turnover (e.g., brand, status, marketing strategy, price strategy, etc.). These factors, however, are either hardly quantifiable or impossible to scale. In addition, there is no scientific consensus on the extent of the impacts of these factors, and what those impacts are [52,53,54,55].
In particular, the categories constituting societal acceptance might have to be adjusted over time. If the problems reflected in the societal categories become minor in the future, new categories might have to be introduced, such as employment contracts, payment, etc. They are not included at present because more basic factors such as human rights violations and water scarcity must be addressed.
As in the case of compliance with social standards, it is hard to conduct an individual and site-specific assessment for compliance with environmental standards. It is assumed that mining companies at least comply with the environmental standards imposed by the government in the respective country. The two SCARCE indicators can therefore be assumed to be a good approximation of the actual individual value. To gain a complete perspective on company-specific sustainability issues in the supply chain of a company, the environmental perspective should be extended in further steps.
Generally speaking, the results should be interpreted cautiously and in the context of the methodology as argued by Schrijvers et al. [11]. A quantitative result might suggest a precise result in each category. The results should rather be interpreted as trends and tendencies to support company-internal communication and improvement processes. To emphasize this, it was decided to present the results as circles (see Figure 5). This should avoid having to represent the results as concrete numbers, which might give readers a misleading impression. Since the method was developed for company-internal purposes, a certain degree of experience in criticality assessment and the interpretation of results is assumed.
Building on ESSENZ [15,16] and SCARCE [21] offered great advantages, like their proven applicability and the solid methodological base [22,23,24]. On the other hand, it also held some challenges. The two methods assess the resource use on different levels (product and national level), as explained in Section 1. CS-ESSENZ supplies an assessment on the product level, based on company-specific data. Therefore, ESSENZ, which was recommended by the UNEP/SETAC task force for mineral resources [22,23,24], was chosen as the methodological orientation. While SCARCE supplied additional categories for the vulnerability dimension, all SCARCE indicators in the vulnerability dimension had to be newly developed (see Table 1) to suit the company-specific assessment. For all other categories, either the ESSENZ indicator was adjusted, a new indicator was developed, or the ESSENZ indicator was applied. Thus, the different levels of ESSENZ and SCARCE did not impact the development of CS-ESSENZ.
In the case of rare earth elements (REE) CS-ESSENZ supplies the results for all REEs together. A separate inspection of the REEs would supply more information and in practice should be preferred. However, this aggregated presentation of the results was chosen to maintain the coherence with ESSENZ [15,16]. Otherwise, a comparison of the results would not be possible.
Further methodological details are discussed in Section S6 of the Supplementary Materials.
5. Conclusions
CS-ESSENZ adds a company perspective to the criticality assessment and enables companies to review ESSENZ hotspots in their product system. As such, it enhances the assessment of company-specific criticality on the product level and generates additional information, complementing the ESSENZ results. The evaluation of the case study using CS-ESSENZ showed that 29 of the 58 hotspots identified using ESSENZ proved relevant to the specific company under review. The case study also analyzed how additional company-specific criticality aspects can be identified by applying this method. For instance, improvement potentials regarding the purchasing strategy of cobalt could be identified. These company-specific results are especially important for the improvement of criticality aspects within the supply chain because it reflects the actual supply chain of a company more precisely than global average data can do. Since both aspects—vulnerability and supply risk—are included, it is possible to measure the implications of the high supply risk of a specific material for the company and to set priorities.
This, therefore, generates an additional level of resource criticality assessment, contributing to the field of supply risk methods on the company level.
As pointed out by Schrijvers et al. [11] one of the decisive factors for the indicator selection and their definition is the data availability. Extensive data mining by companies could enable more precise indicator development (e.g., for the environmental and social dimensions).
Supplementary Materials
The following are available online at https://0-www-mdpi-com.brum.beds.ac.uk/article/10.3390/resources10060056/s1, Section S1: Background on ESSENZ, SCARCE, and CS-ESSENZ, Table S1: CS-ESSENZ target values criticality, Section S2: Case study, Table S2, Section S3: Results ESSENZ, Table S3, Figure S1: ESSENZ results—supply risk by element, Figure S2: ESSENZ results—physical availability, Figure S3: ESSENZ results—(non-)compliance with social standards, Figure S4: ESSENZ results—(non-)compliance with environmental standards, Section S4: Characterization factors for CS-ESSENZ, Table S4: CS-ESSENZ characterization factors for the case study, Section S5: Results for CS-ESSENZ, Table S5: Results for CS-ESSENZ, Table S6: Comparison of some CS-ESSENZ supply risk categories applying CS-ESSENZ to all elements, Figure S5: Results for the economic dimension of CS-ESSENZ scaled by element, Figure S6: CS-ESSENZ results for artisanal and small-scale mining, Figure S7: CS-ESSENZ results for human rights violations, Figure S8: CS-ESSENZ results for sensitivity of local biodiversity, Figure S9: CS-ESSENZ results for water scarcity, Section S6: Further points of discussion.
Author Contributions
Conceptualization, K.M.Y., V.B. and M.F.; methodology, K.M.Y., V.B. and M.F.; validation, K.M.Y., V.B. and M.F.; formal analysis, K.M.Y.; investigation, K.M.Y.; data curation, K.M.Y.; writing—original draft preparation, K.M.Y.; writing—review and editing, V.B. and M.F.; visualization, K.M.Y.; supervision, V.B. and M.F.; funding acquisition, V.B. and M.F. All authors have read and agreed to the published version of the manuscript.
Funding
This paper was partly prepared in the context of the Deutsche Forschungsgemeinschaft (DFG) project RessMob (Assessment of abiotic and biotic resources within the mobility sector—development of assessment criteria, methods, and concepts) (project number: FI 1622/6-1). We acknowledge support by the Open Access Publication Fund of TU Berlin.
Data Availability Statement
Publicly available datasets were analyzed in this study. The data sets for ESSENZ and SCARCE can be found here: ESSENZ Available online: https://www.see.tu-berlin.de/menue/forschung/daten_tools/essenz/parameter/en/ (accessed on 28 May 2021), SARCE Available online: https://www.see.tu-berlin.de/menue/forschung/daten_tools/scarce_method_enhancing_the_assessment_of_critical_resource_use_on_country_level/parameter/en/ (accessed on 28 May 2021).
Conflicts of Interest
The authors declare no competing interest.
References
- OECD. Global Material Resources Outlook to 2060: Economic Drivers and Environmental Consequences; OECD Publishing: Paris, France, 2018. [Google Scholar]
- Van Sark, W.; Brandsen, G.W.; Fleuster, M.; Hekkert, M.P. Analysis of the silicon market: Will thin films profit? Energy Policy 2007, 35, 3121–3125. [Google Scholar] [CrossRef] [Green Version]
- Global Trade Alert. Independent Monitoring of Policies that Affect World Commerce. Available online: https://www.globaltradealert.org (accessed on 3 April 2019).
- Global Trade Alert. Intervention 20447: China: 2015 Second Batch Export Quota on Non-Ferrous Metals. Available online: https://www.globaltradealert.org/intervention/20447/export-quota/china-2015-second-batch-export-quota-on-non-ferrous-metals (accessed on 1 December 2018).
- Ekins, P.; Hughes, N. Resource efficiency: Potential and Economic Implications: Summary for Policy-Makers; United Nations Environment Programme: Nairobi, Kenya, 2016; ISBN 9211587395. [Google Scholar]
- Dos Santos, M.; Bugajski-Hochriegl, P.; Böhme, K. Assessment of due Diligence Compliance Costs, Benefits and Related Effects on the Competitiveness of Selected Operators in Relation to the Responsible Sourcing of Selected Minerals from Conflicts-Affected Areas. Final Report; Publications Office: Luxembourg, 2014. [Google Scholar]
- Netherlands Environmental Assessment Agency PBL. Roads from Rio+20: Pathways to Achieve Global Sustainability Goals By 2050; Summary And Main Findings To The Full Report; PBL: Den Haag, The Netherlands, 2012; ISBN 9789078645986. [Google Scholar]
- EU. Roadmap to a Resource Efficient Europe. Eur. Crim. Law Rev. 2011, 1, 311–318. [Google Scholar] [CrossRef]
- Federal Ministry for the Environment; Nature Conservation; Building and Nuclear Safety German Resource Efficiency Programme II—Programme for the Sustainable Use and Conservation of Natural Resources 2016. Available online: www.bmub.de (accessed on 1 January 2021).
- European Commission. Study on the Review of the List of Critical Raw Materials: Criticality Assessment; European Commission: Brussels, Belgium, 2017. [Google Scholar]
- Schrijvers, D.; Hool, A.; Blengini, G.A.; Chen, W.-Q.; Dewulf, J.; Eggert, R.; van Ellen, L.; Gauss, R.; Goddin, J.; Habib, K.; et al. A review of methods and data to determine raw material criticality. Res. Conserv. Recycl. 2020, 155, 104617. [Google Scholar] [CrossRef]
- Cimprich, A.; Young, S.B.; Helbig, C.; Gemechu, E.D.; Thorenz, A.; Tuma, A.; Sonnemann, G. Extension of geopolitical supply risk methodology: Characterization model applied to conventional and electric vehicles. J. Clean. Prod. 2017, 162, 754–763. [Google Scholar] [CrossRef] [Green Version]
- Helbig, C.; Gemechu, E.D.; Pillain, B.; Young, S.B.; Thorenz, A.; Tuma, A.; Sonnemann, G. Extending the geopolitical supply risk indicator: Application of life cycle sustainability assessment to the petrochemical supply chain of polyacrylonitrile-based carbon fibers. J. Clean. Prod. 2016, 137, 1170–1178. [Google Scholar] [CrossRef]
- Gemechu, E.D.; Helbig, C.; Sonnemann, G.; Thorenz, A.; Tuma, A. Import-based Indicator for the Geopolitical Supply Risk of Raw Materials in Life Cycle Sustainability Assessments. J. Ind. Ecol. 2016, 20, 154–165. [Google Scholar] [CrossRef]
- Bach, V.; Berger, M.; Henßler, M.; Kirchner, M.; Leiser, S.; Mohr, L.; Rother, E.; Ruhland, K.; Schneider, L.; Tikana, L.; et al. Integrated method to assess resource efficiency—ESSENZ. J. Clean. Prod. 2016, 137, 118–130. [Google Scholar] [CrossRef] [Green Version]
- Bach, V.; Berger, M.; Finogenova, N.; Finkbeiner, M. Analyzing Changes in Supply Risks for Abiotic Resources over Time with the ESSENZ Method—A Data Update and Critical Reflection. Resources 2019, 8, 83. [Google Scholar] [CrossRef] [Green Version]
- Kolotzek, C.; Helbig, C.; Thorenz, A.; Reller, A.; Tuma, A. A company-oriented model for the assessment of raw material supply risks, environmental impact and social implications. J. Clean. Prod. 2018, 176, 566–580. [Google Scholar] [CrossRef]
- Bensch, S.; Kolotzek, C.; Helbig, C.; Thorenz, A.; Tuma, A. Decision Support System for the Sustainability Assessment of Critical Raw Materials in SMEs. In Proceedings of the 48th Hawaii International Conference on System Sciences (HICSS), Kauai, HI, USA, 5–8 January 2015; Bui, T.X., Sprague, R.H., Eds.; IEEE: Piscataway, NJ, USA, 2015; pp. 846–855, ISBN 978-1-4799-7367-5. [Google Scholar]
- Graedel, T.E.; Barr, R.; Chandler, C.; Chase, T.; Choi, J.; Christoffersen, L.; Friedlander, E.; Henly, C.; Jun, C.; Nassar, N.T.; et al. Methodology of Metal Criticality Determination. Environ. Sci. Technol. 2012, 46, 1063–1070. [Google Scholar] [CrossRef]
- Duclos, S.J.; Otto, J.P.; Konitzer, D.G. Design in an era of Constrained Resources. Mech. Eng. 2010, 132, 36–40. [Google Scholar] [CrossRef] [Green Version]
- Bach, V.; Finogenova, N.; Berger, M.; Winter, L.; Finkbeiner, M. Enhancing the assessment of critical resource use at the country level with the SCARCE method – Case study of Germany. Resour. Policy 2017, 53, 283–299. [Google Scholar] [CrossRef] [Green Version]
- Berger, M.; Sonderegger, T.; Alvarenga, R.; Bach, V.; Cimprich, A.; Dewulf, J.; Frischknecht, R.; Guinée, J.; Helbig, C.; Huppertz, T.; et al. Mineral resources in life cycle impact assessment: Part II—Recommendations on application-dependent use of existing methods and on future method development needs. Int. J. Life Cycle Assess 2020, 25, 798–813. [Google Scholar] [CrossRef] [Green Version]
- Sonderegger, T.; Berger, M.; Alvarenga, R.; Bach, V.; Cimprich, A.; Dewulf, J.; Frischknecht, R.; Guinée, J.; Helbig, C.; Huppertz, T.; et al. Mineral resources in life cycle impact assessment—Part I: A critical review of existing methods. Int. J. Life Cycle Assess 2020, 25, 784–797. [Google Scholar] [CrossRef]
- UNEP/SETAC Life Cycle Initiative. Global Guidance for Life Cycle Impact Assessment Indicators; UN Environment Programme: Nairobi, Kenya, 2017; Volume 2. [Google Scholar]
- Rhoades, S. The herfindahl-hirschman index. Fed. Reserve Bull. 1993, 79, 188–189. [Google Scholar]
- Hobbs, J.E. A transaction cost approach to supply chain management. Supp Chain Mnagmnt. 1996, 1, 15–27. [Google Scholar] [CrossRef]
- Stedman, A.; Green, K.P. Survey of Mining Companies 2018; Fraser Institute: Vancouver, BC, Canada, 2018. [Google Scholar]
- Nassar, N.T.; Graedel, T.E.; Harper, E.M. By-product metals are technologically essential but have problematic supply. Sci. Adv. 2015, 1, e1400180. [Google Scholar] [CrossRef] [Green Version]
- World Economic Forum; Global Alliance for Trade Facilitation. The Global Enabling Trade Report 2016; World Economic Forum: Geneva, Switzerland, 2016. [Google Scholar]
- Federal Ministry for Economic Affairs and Energy. Rohstoffe—Unverzichtbar Für Den Zukunftsstandort Deutschland. Available online: https://www.bmwi.de/Redaktion/DE/Dossier/rohstoffe-und-ressourcen.html (accessed on 14 February 2019).
- Vidal-Legaz, B.; Mancini, L.; Talens Peirò, L.; Ciupagea, C.; Pavel, C.; Dias, P.; Blengini, G.A.; Blagoeva, D.; Nita, V.; Marmier, A.; et al. Methodology for Establishing the EU List of Critical Raw Materials; Guidelines—Study; European Commission: Brussels, Belgium, 2017. [Google Scholar]
- World Bank Group. The Worldwide Governance Indicators. Available online: http://info.worldbank.org/governance/wgi/index.aspx#home (accessed on 25 March 2019).
- Kaufmann, D.; Kraay, A.; Mastruzzi, M. The Worldwide Governance Indicators: Methodology and Analytical Issues. Hague J. Rule Law 2011, 3, 220–246. [Google Scholar] [CrossRef]
- Brown, T.; Idoine, N.; Raycraft, E.; Shaw, R.; Deady, E.; Hobbs, S.; Bide, T.; MacKenzie, A. World Mineral Production 2011-15; British Geological Survey: Nottingham, UK, 2017; ISBN 0852728670. [Google Scholar]
- Federal Institute for Geosciences and Natural Resources. Volatilitätsmonitor 2014; Federal Institute for Geosciences and Natural Resources: Hanover, Germany, 2014. [Google Scholar]
- Graedel, T.E.; Allwood, J.; Birat, J.-P.; Buchert, M.; Hagelüken, C.; Reck, B.K.; Sibley, S.F.; Sonnemann, G. Recycling Rates of Metals: A Status Report; United Nations Environment Programme: Nairobi, Kenya, 2011; ISBN 978-92-807-3161-3. [Google Scholar]
- Federal Institute for Geosciences and Natural Resources. Raw materials. Available online: https://www.bgr.bund.de/DERA/DE/Rohstoffinformationen/Rohstoffe/rohstoffe_node.html (accessed on 14 February 2019).
- Angerer, G.; Karlsruhe Fraunhofer-Institut für System-und Innovationsforschung. Rohstoffe Für Zukunftstechnologien: Einfluss des Branchenspezifischen Rohstoffbedarfs in Rohstoffintensiven Zukunftstechnologien Auf Die Zukünftige Rohstoffnachfrage; Angerer, G., Erdmann, L., Marscheider-Weidemann, F., Scharp, M., Lüllmann, A., Eds.; Fraunhofer-IRB-Verlag: Stuttgart, Germany, 2009; ISBN 978-3-8396-0014-6. [Google Scholar]
- Marscheider-Weidemann, F.; Langkau, S.; Hummen, T.; Erdmann, L.; Tercero Espinoza, L.A.; Angerer, G.; Marwede, M.; Benecke, S. Rohstoffe für Zukunftstechnologien 2016: Auftragsstudie; DERA: Hannover, Germany, 2016; ISBN 978-3-943566-71-0. [Google Scholar]
- European Commission. Raw Materials Diplomacy—Internal Market, Industry, Entrepreneurship and SMEs—European Commission. Available online: https://ec.europa.eu/growth/sectors/raw-materials/specific-interest/international-aspects_en (accessed on 14 February 2019).
- European Commission. Directive 2011/65/EU of the European Parliament and the Council of the 8th of June 2018 on the Restriction of the Use of Certain Hazardous Substances in Electrical and Electronic Equipment; European Commission: Brussels, Belgium, 2018. [Google Scholar]
- Cucchiella, F.; D’Adamo, I.; Lenny Koh, S.C.; Rosa, P. Recycling of WEEEs: An economic assessment of present and future e-waste streams. Renew. Sustain. Energy Rev. 2015, 51, 263–272. [Google Scholar] [CrossRef] [Green Version]
- Apple. Apple Smelter and Refiner List 2017. Available online: https://www.apple.com/supplier-responsibility/pdf/Apple-Smelter-and-Refiner-List.pdf (accessed on 21 February 2019).
- Fairphone. Fairphone Suppliers Smelters and Refiners September 2018; Fairphone: Amsterdam, The Netherland, 2018. [Google Scholar]
- Jardim, E. From smart to sensless: The global impact of 10 years of smartphones. Available online: https://www.greenpeace.org/usa/wp-content/uploads/2017/03/FINAL-10YearsSmartphones-Report-Design-230217-Digital.pdf (accessed on 28 May 2021).
- British Geological Survey. Available online: https://www.bgs.ac.uk/data/home.html?src=topNav (accessed on 7 June 2019).
- Von Billerbeck, S.; Tansey, O. Enabling autocracy? Peacebuilding and post-conflict authoritarianism in the Democratic Republic of Congo. Eur. J. Int. Relat. 2019, 25, 698–722. [Google Scholar] [CrossRef]
- Foley, N.K.; Jaskula, B.W.; Piatak, N.M.; Schulte, R.F. Critical Mineral Resources of the United States—Economic and Environmental Geology and Prospects for Future Supply; U.S. Geological Survey Professional Paper 1802; Geological Survey: Reston, VA, USA, 2017; pp. E1–E32. [Google Scholar]
- Graedel, T.E.; Harper, E.M.; Nassar, N.T.; Reck, B.K. On the materials basis of modern society. Proc. Natl. Acad. Sci. USA 2015, 112, 6295–6300. [Google Scholar] [CrossRef] [PubMed] [Green Version]
- European Commission. Study on the EU’s List of Critical Raw Materials—Final Report; European Commission: Brussels, Belgium, 2020. [Google Scholar]
- Grishechkin, M.B.; Mozhevitina, E.N.; Khomyakov, A.V.; Zykova, M.P.; Avetisov, R.I.; Avetissov, I.K. Deep Tellurium Purification for the Production of Electronic and Photonic Materials. Russ. Microelectron. 2017, 46, 551–556. [Google Scholar] [CrossRef]
- Bandara, B.; de Silva, D.; Maduwanthi, B.; Warunasinghe, W. Impact of Food Labeling Information on Consumer Purchasing Decision: With Special Reference to Faculty of Agricultural Sciences. Procedia Food Sci. 2016, 6, 309–313. [Google Scholar] [CrossRef] [Green Version]
- Kyrdoda, Y.; Baltas, G.; Hammami, A. Analyzing Consumer Impulse Purchasing Behaviour Using Observational Data. Int. J. Food Beverage Manuf. Bus. Models 2018, 3, 16–28. [Google Scholar] [CrossRef]
- Wang, Y.; Yu, C. Social interaction-based consumer decision-making model in social commerce: The role of word of mouth and observational learning. Int. J. Inf. Manag. 2017, 37, 179–189. [Google Scholar] [CrossRef]
- Olshavsky, R.W.; Granbois, D.H. Consumer Decision Making-Fact or Fiction? J. Consum. Res. 1979, 6, 93. [Google Scholar] [CrossRef]
Figure 1.
Overview of CS-ESSENZ (company-specific ESSENZ method) and its relationships to ESSENZ (Integrated method to assess resource efficiency) and SCARCE (approach is to enhance the assessment of critical resource use at the country level).
Figure 1.
Overview of CS-ESSENZ (company-specific ESSENZ method) and its relationships to ESSENZ (Integrated method to assess resource efficiency) and SCARCE (approach is to enhance the assessment of critical resource use at the country level).

Figure 2.
Dimensions, sub-dimensions, and categories covered by CS-ESSENZ.

Figure 3.
Product system of a theoretical case study.

Figure 4.
ESSENZ results—supply risk by category.

Figure 5.
Criticality results of CS-ESSENZ scaled by category.


Table 1.
Overview of indicator adjustments in comparison to ESSENZ and SCARCE.
| CS-ESSENZ Category | ESSENZ | SCARCE | Modification for Application in CS-ESSENZ |
|---|---|---|---|
| Concentration of reserves | X | X | Modified based on ESSENZ indicator |
| Concentration of production | X | X | Modified based on ESSENZ indicator |
| Company concentration | X | X | Modified based on ESSENZ indicator |
| Occurrence of coproduction | X | X | According to ESSENZ, different input data |
| Political stability | X | X | Modified based on ESSENZ indicator |
| Demand growth | X | X | Modified based on ESSENZ indicator |
| Feasibility of exploration projects | X | X | Modified based on ESSENZ indicator |
| Price volatility | X | X | Derived from ESSENZ |
| Primary material use | X | X | Modified based on ESSENZ indicator |
| Mining capacity | X | X | Modified based on ESSENZ indicator |
| Trade barriers | X | X | Modified based on ESSENZ indicator |
| Economic importance | X | Newly developed indicator | |
| Dependence on imports | X | Newly developed indicator | |
| Purchasing strategy | X | Newly developed indicator | |
| Substitutability | X | Newly developed indicator | |
| Human rights violations | X | Derived from SCARCE | |
| Small-scale and artisanal mining | X | Derived from SCARCE | |
| Sensitivity of local biodiversity | X | Derived from SCARCE | |
| Water scarcity | X | Derived from SCARCE |
Table 2.
Overview of the categories assessing supply risk and vulnerability considered in CS-ESSENZ.
Table 2.
Overview of the categories assessing supply risk and vulnerability considered in CS-ESSENZ.
| Category | Description | Indicator |
|---|---|---|
| Supply Risk | ||
| Concentration of reserves | Reserve concentration based on reserves in supplying countries in relation to the global concentration | Herfindahl–Hirschman index (HHI) for the market share of each supplying company or country with regard to production or reserves divided by the HHI for all companies or countries [25] |
| Concentration of production | Concentration of production based on production in supplying countries in relation to the global concentration | Procurement data from the company |
| Company concentration | Company concentration of supplying companies in relation to the global concentration | List of strategic partners of the EU and Germany [30,31] |
| Occurrence of coproduction | Companion metals within host metal ore | Percentage of production as companion metal [28] |
| Political stability | Weighted governance stability of supplying countries | World governance indicator [32,33] |
| Demand growth | Increase in a company’s internal demand in comparison to global production trend | Percentage of a company’s internal demand growth divided by the percentage of global production trends, based on [34] |
| Feasibility of exploration projects | Political and societal impacts, influencing the opening of new mines in supplying countries | Policy perception indicator [27] of supplying countries |
| Price volatility | Unexpected variation of the price | Volatility of the price [35] |
| Primary material use | Primary material in products compared to global averages | Share of recycled content in products (internal production data) divided by the global average share of recycled content, based on [36] |
| Mining capacity | Overall mining time of a material in supplying countries considering current production | Ratio of reserves to annual production of supplying countries |
| Trade barriers | Material from supplying countries weighted by the degree of trade hindering circumstances in these countries | Average of sub-index B, C, and D of the enabling trade index [29] |
| Vulnerability | ||
| Economic importance | Importance of a material for a company to keep their turnover stable or increase it | Relevance for the functionality of the product (based on [37,38,39]) rated by the turnover generated with this product and divided by the total turnover of the company |
| Dependence on imports | Percentage of imported material | Procurement data from the company |
| Purchasing strategy | Amount of raw material with a politically secured procurement | List of strategic partners of the EU and Germany [30,40] |
| Substitutability | Technical, economic, geological, and political ability to substitute a material | Average of the two substitutability indices by the European Commission [10] and Vidal-Legaz et al. [31] |
Table 3.
Hotspots of elements in the categories under consideration.
| Crude Oil | Aluminum | Antimony | Beryllium | Lead | Cobalt | Iron | Gold | Copper | Nickel | Palladium | Platinum | REE | Silver | Zinc | Tin | |
|---|---|---|---|---|---|---|---|---|---|---|---|---|---|---|---|---|
| Political stability | X | X | X | X | X | X | X | X | X | X | ||||||
| Demand growth | X | X | X | X | ||||||||||||
| Mining capacity | X | X | ||||||||||||||
| Concentration of reserves | X | X | X | |||||||||||||
| Concentration of production | X | X | X | X | X | X | X | |||||||||
| Trade barriers | X | X | X | X | X | X | X | X | X | X | ||||||
| Feasibility of exploration projects | X | X | X | |||||||||||||
| Price volatility | X | X | X | X | X | X | ||||||||||
| Occurrence of coproduction | X | X | X | |||||||||||||
| Primary material use | X | X | X | X | X | X | X | X | X | X | ||||||
| Company concentration | X | X | X | X | X | X | ||||||||||
| (Non-)compliance with social standards | X | X | X | X | X | X | X | X | X | X | ||||||
| (Non-)compliance with environmental standards | X | X | X | X |
Table 4.
Comparison of ESSENZ and CS-ESSENZ results for supply risk.
| Category Element | Political Stability | Demand Growth | Mining Capacity | Concentration of Reserves | Concentration of Production | Trade Barriers | Feasibility of Exploration Projects | Price Volatility | Occurrence of Coproduction | Primary Material Use | Company Concentration |
|---|---|---|---|---|---|---|---|---|---|---|---|
| Crude oil | H/N | H/M | H/M | ||||||||
| Aluminum | H/M | H/N | H/H | ||||||||
| Antimony | H/S | H/M | H/S | ||||||||
| Beryllium | H/H | H/S | H/H | H/H | H/H | H/H | |||||
| Lead | H/M | H/M | |||||||||
| Cobalt | H/H | H/N | H/H | H/N | H/H | H/H | |||||
| Iron | H/S | H/S | |||||||||
| Gold | H/N | H/M | H/H | H/H | |||||||
| Copper | H/S | H/M | |||||||||
| Nickel | H/N | H/M | H/M | ||||||||
| Palladium | H/H | H/N | H/H | H/H | H/H | H/N | |||||
| Platinum | H/H | H/H | H/H | H/H | H/H | ||||||
| REE | H/H | H/M | H/H | H/N | |||||||
| Silver | H/H | H/H | H/H | H/H | |||||||
| Zinc | H/N | H/M | |||||||||
| Tin | H/H | H/H | H/N |
Publisher’s Note: MDPI stays neutral with regard to jurisdictional claims in published maps and institutional affiliations. |
© 2021 by the authors. Licensee MDPI, Basel, Switzerland. This article is an open access article distributed under the terms and conditions of the Creative Commons Attribution (CC BY) license (https://creativecommons.org/licenses/by/4.0/).
Share and Cite
MDPI and ACS Style
Yavor, K.M.; Bach, V.; Finkbeiner, M. Adapting the ESSENZ Method to Assess Company-Specific Criticality Aspects. Resources 2021, 10, 56. https://0-doi-org.brum.beds.ac.uk/10.3390/resources10060056
AMA Style
Yavor KM, Bach V, Finkbeiner M. Adapting the ESSENZ Method to Assess Company-Specific Criticality Aspects. Resources. 2021; 10(6):56. https://0-doi-org.brum.beds.ac.uk/10.3390/resources10060056
Chicago/Turabian StyleYavor, Kim Maya, Vanessa Bach, and Matthias Finkbeiner. 2021. "Adapting the ESSENZ Method to Assess Company-Specific Criticality Aspects" Resources 10, no. 6: 56. https://0-doi-org.brum.beds.ac.uk/10.3390/resources10060056
Note that from the first issue of 2016, this journal uses article numbers instead of page numbers. See further details here.