Article

Selective Collection of Municipal Waste in a Residential District with Multi-Family Buildings—Case Study from Poland

1
Faculty of Environmental Engineering, Geomatic and Energy Engineering, Kielce University of Technology, Al. Tysiąclecia Państwa Polskiego 7, 25-314 Kielce, Poland
2
Faculty of Management and Computer Modelling, Kielce University of Technology, Al. Tysiąclecia Państwa Polskiego 7, 25-314 Kielce, Poland
*
Authors to whom correspondence should be addressed.
Submission received: 29 June 2021 / Revised: 2 August 2021 / Accepted: 10 August 2021 / Published: 13 August 2021
(This article belongs to the Special Issue Municipal and Industrial Waste Management)

Abstract

:
Social and economic changes make it necessary to put in a great deal of conscious effort to shift towards a closed-loop economy, where waste provides a source of raw materials. The low level of selective collection of municipal waste poses a challenge in many countries, including Poland. One of the major causes of the problems in Poland lies in the fact that waste collection points (WCPs) do not have adequate waste containers. The paper aims to put forward a proposal to improve the operation of WCPs. Seeking for new solutions, it is necessary to account for the conditions under which the bodies responsible for waste management take their decisions. They have to comply with the legislation in force, and at the same time, choose the options that generate the lowest costs. The study concerned a typical residential district with housing in multi-family buildings. For two fill rate variants and four emptying schedules, the number of above-ground containers was calculated. Two variants: for above-ground containers (variant I) and for semi-underground containers (variant II), were compared in terms of operating costs and investment outlays. The proposed increase in the number of above-ground containers, and additionally providing semi-underground containers, will contribute to increased engagement of the local community in the selective collection of waste.

1. Introduction

In order to achieve enhanced sustainability and environmental standards, it will be necessary to alter the currently operating economic model. The linear model needs to be replaced with a circular model, which basically is intended to preserve resources in the economy for as long as possible at their highest possible value [1,2,3]. Waste management can play an important role in the shift towards a circular economy. However, the latter will require a great deal of changes, including product design, alternative consumption and business models [4]. One of the components of the waste management system is the collection and storage of waste [5]. The manner in which waste is collected and disposed of at the points of collection affects the cleanliness of residential areas and, ultimately, the living standard of residents [6]. Municipal waste is collected selectively because its morphological composition contains secondary raw materials. The recovery of secondary raw materials facilitates savings in natural resources, energy and reduction in the mass of landfilled waste [6,7]. The principles of selective collection of municipal waste in the EU are defined by Directive 2018/851 [8] and in Poland in legislation specified in [9,10,11,12,13]. According to [13], municipal waste is selectively collected. Waste is categorised into the following fractions:
  • paper, including cardboard and paper packaging waste;
  • glass, including glass packaging waste;
  • plastics and metals, including plastic or metal packaging waste and multi-material packaging waste;
  • biodegradable waste, particularly bio-waste.
The requirement of separate waste collection is fulfilled if the containers and bags ensure that the waste fraction intended for processing is protected against quality deterioration due to, e.g., weather conditions or unauthorized persons [13].
On average, 47.7% of municipal waste is collected selectively in the EU [14]. The highest percentage values are found in Germany, Slovenia, the Netherlands, and Belgium. The values amount to 66.7%, 59.2%, 56.9% and 54.7%, respectively [14]. In Poland, selectively collected municipal waste constitutes 34.1% of the total collected waste [14,15]. Similarly, selective collection remains an issue in the countries of Central Europe. Waste separation rates are as follows: 33.3% in the Czech Republic, 30.8% in Estonia, 38.5% in Slovakia 35.9% in Hungary, 31.5% in Bulgaria and 30.2% in Croatia. Romania, with 11.5% separation, has one of the lowest levels of separate collection in Europe [14].
In Poland, the low level of selective collection of municipal waste results from many years of negligence in the past, in terms of legal and organizational arrangements. Legislative solutions on municipal waste management, adopted at the turn of the century, have not been fully implemented. Changes are still needed, especially at the local community level [13].
Poland’s urban population constitutes 59.86% of 38,265 million inhabitants [15]. Almost a half of the population, namely 44.6%, live in multi-family housing [16]. The most common problems with the selective municipal waste collection system in urban neighborhoods include the following [17,18]:
  • improper segregation, or lack of segregation of waste;
  • contamination of the biodegradable or mixed fraction with construction and packaging waste;
  • disposal of bulky waste and scrap tires at waste collection points (WCPs) without respecting the scheduled collection dates for specific waste types;
  • disposal of hazardous waste (e.g., waste batteries or rechargeable batteries, expired medications, waste electrical or electronic equipment) in containers for municipal waste;
  • large waste volume due to unsquashed PET bottles or unflattened cardboard boxes, which in many cases makes the container capacities too low to hold the total waste amount until the pick-up time;
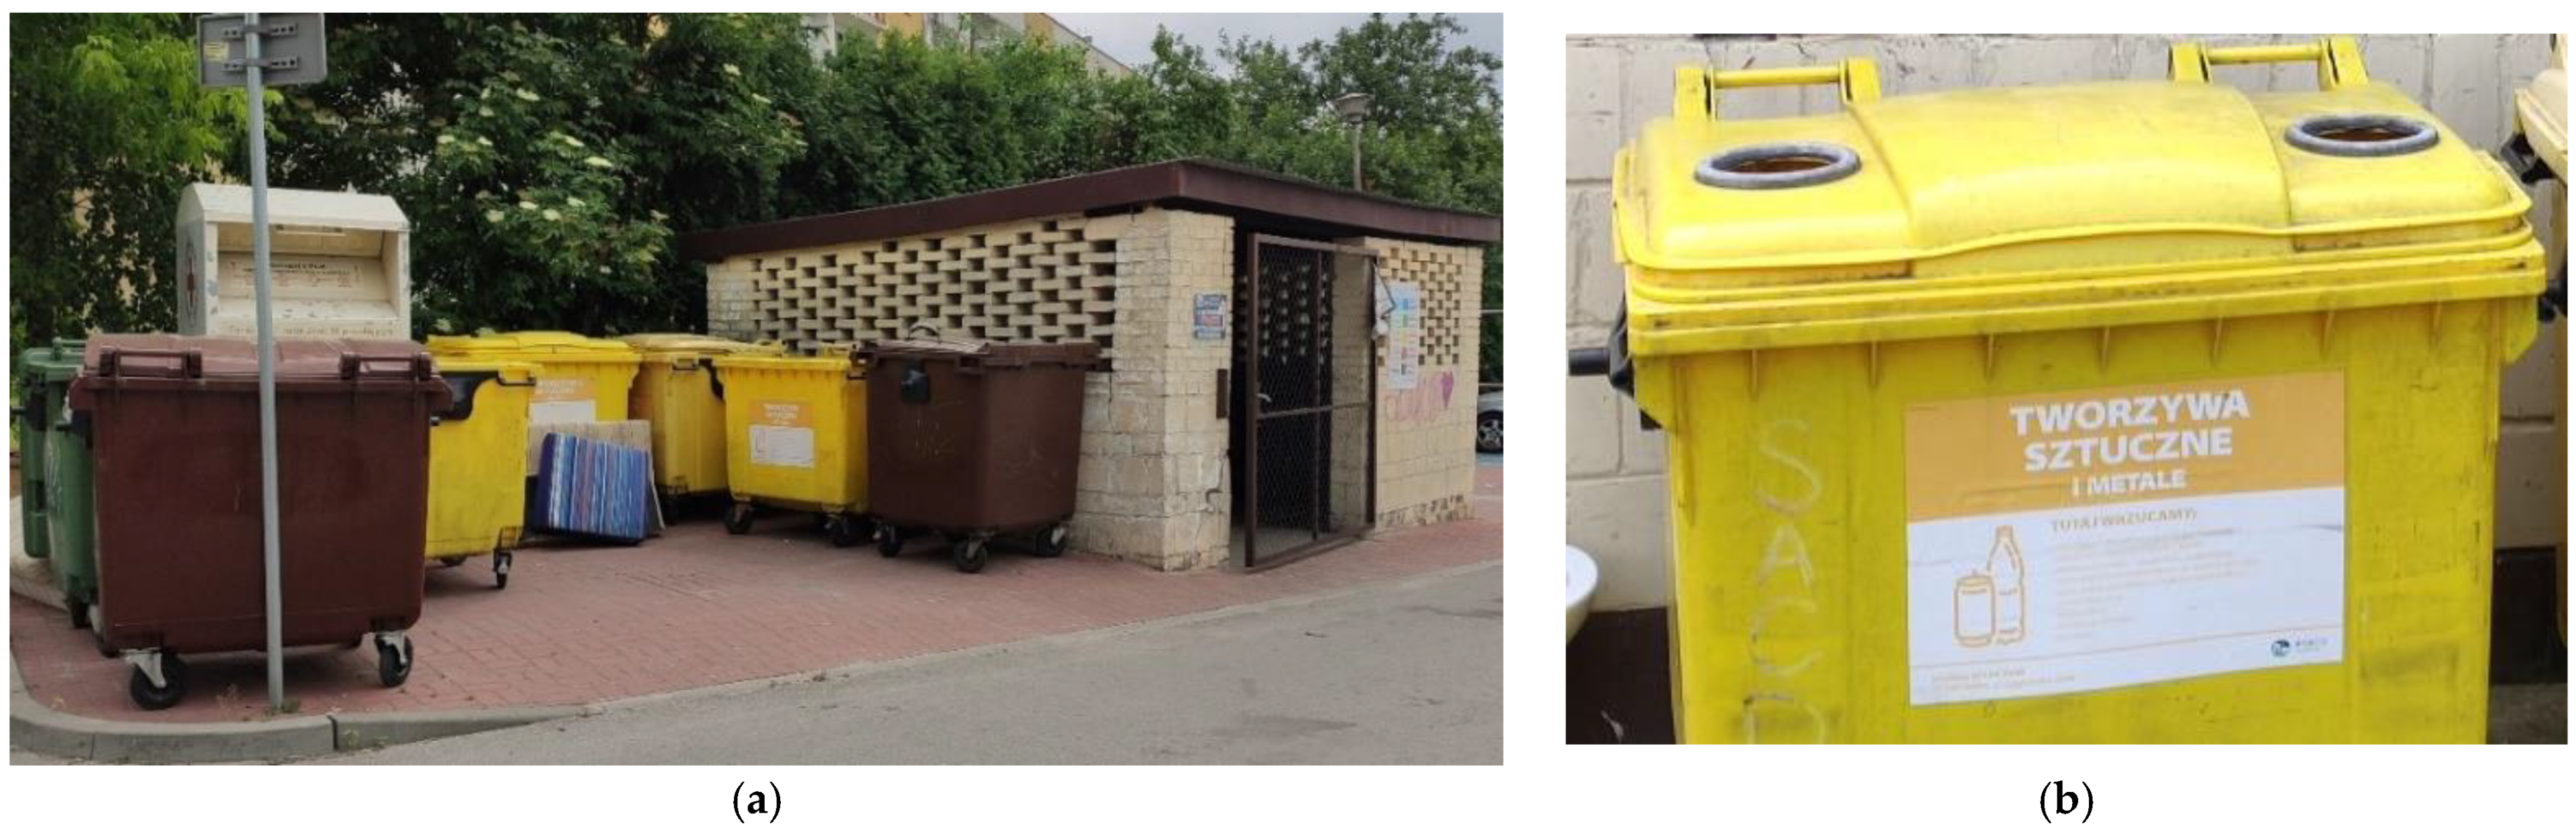
  • poor aesthetics and order maintenance in WCPs and their surroundings;
  • insufficient number of containers in WCPs;
  • waste collection containers located outside the shelters.
According to [13], starting in 2017, all communes in Poland should segregate municipal waste into five fractions: paper, glass, metals, plastics, and biodegradable waste, especially bio-waste. The number of waste fractions increased to include six categories starting from July 1, 2021, namely paper, glass, metals, plastics, multi-material packaging and bio-waste [19]. However, the regulation [19] says that multi-material packaging ought to be selectively collected together with metals and plastic fractions (Table 1). The task of properly operating the municipal waste management system was delegated to the communal authorities [13]. In accordance with the requirement mentioned above, the communes were obliged to equip the WCPs with an additional number of containers [20,21]. As a result, some new containers had to be placed outside bin shelters because of the lack of space.
The aim of the paper is to discuss selected issues related to the operation of the municipal waste collection in a residential district with multi-family buildings. The study was conducted for the Uroczysko district in the city of Kielce. The district provides a typical example illustrating problems with selective waste collection. The study includes the calculation of the number of above-ground containers with a capacity of 1.1 m3 for two variants of their fill rate, calculation of the number of semi-underground containers with a capacity determined by the number and type of fractions of municipal waste collected, selection of the number of containers, and comparison of investment and operating costs of the proposed solutions.

2. Materials and Methods

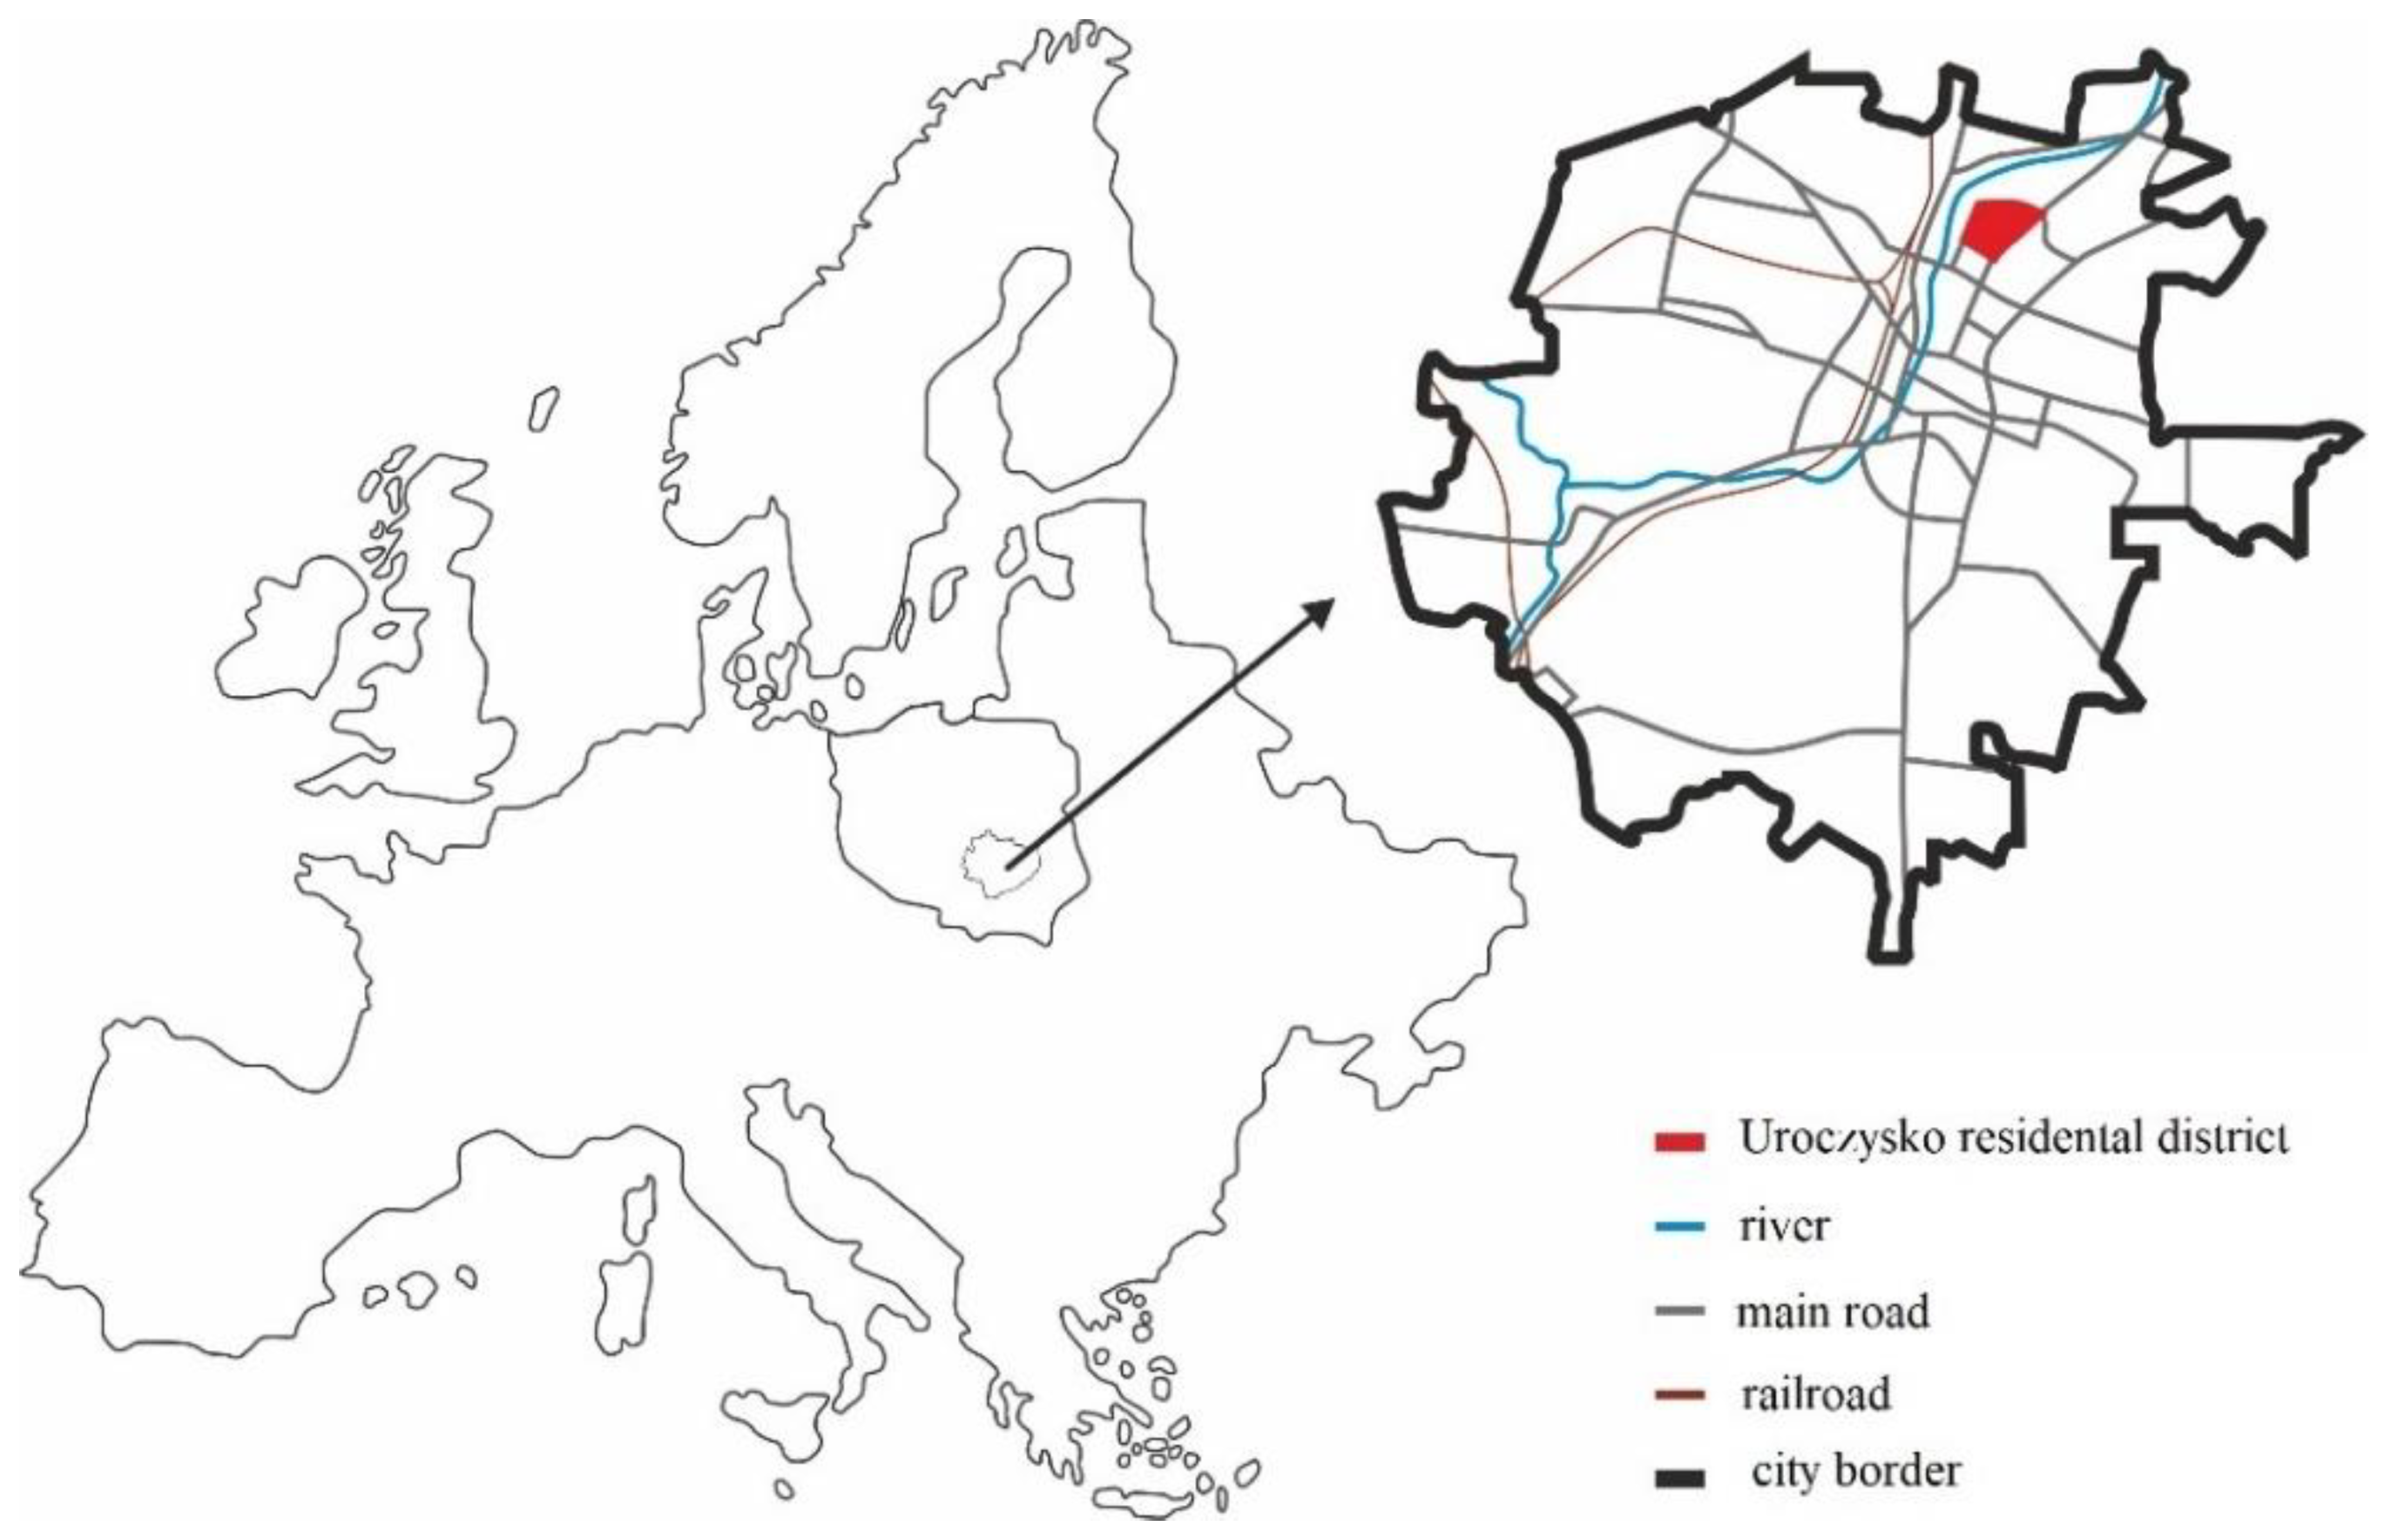
2.1. Characteristics of the City of Kielce

Kielce is the capital city of Świętokrzyskie Voivodeship, which is located in central Poland. The city and the surrounding localities constitute the Kielce Metropolitan Area (Figure 1).
Municipal waste in Kielce comes mainly from households and infrastructure facilities, i.e., schools, hospitals, hotels and shopping centers. Since 2013, 100% of Kielce inhabitants have been included in municipal waste collection. In 2019, 68,985.76 Mg of municipal waste was collected in Kielce. The majority of waste, namely 72.5%, was produced by households. The mass of municipal waste collected was 325 kg∙M−1∙a−1 [15]. In accordance with [8,11], in 2021 the communes are obliged to achieve at least 20% (by weight) level of preparation for re-use and recycling of municipal waste. The commune of Kielce has already achieved this target value. However, it will be difficult to obtain the 55% level of preparation for waste re-use and recycling required by 2025. Much effort will be necessary to reach this goal. Morphological composition of municipal waste from urban areas is shown in Table 2.

Residential District Characteristics

The Uroczysko district is located in the north-eastern part of Kielce (Figure 1). Uroczysko is mostly composed of tall, multi-family apartment blocks. The majority of the residential buildings are four-storey blocks, and a few buildings are ten- and eleven-storey high-rises. The Uroczysko district was built in the 1970s. The total number of residents is 6085, and the age structure shows the largest percentage of inhabitants are at post-productive age [24]. The district facilities include a primary school, a secondary school, a creche, two kindergartens, a medical center, and a post office [24]. In 2019, 87 businesses were registered, most of them shops, hairdressing salons or other firms that offer different services. The district has a well-developed network of internal roads connected to county roads. The district area covers a flat terrain.
Municipal waste collection in the district is carried out in accordance with the principles of the Municipal Waste Management System [25], stipulated in current legislation [8,9,10,11,12,13]. The data in [22] showed that the largest percentage fractions of municipal solid waste are biodegradable kitchen waste and plastic waste. Wood waste and hazardous waste are the smallest percentage fractions.
The Uroczysko district is managed by the Świętokrzyska Housing Association. The collection of municipal waste within the district is carried out in the WCPs [26]. Waste collection in educational institutions located in the district is carried out in separate containers, which are not covered by this study. The characteristics of the residential buildings with the number of inhabitants assigned to the WCPs are shown in Table 3.
Municipal waste is collected at the 26 WCPs with bin shelters (Figure 2a). The containers have access flaps with openings to allow collection of the target waste fraction (Figure 2b). Bin shelters can hold about six 1.1 m3 above-ground containers (type PA-1100). Other necessary above-ground containers are placed outside the bin shelters (Figure 3). On average, the distance between the residential building entrance and the WCP is 54.0 m.
The WCPs are equipped with above-ground containers for selective collection of mixed waste, paper, metals and plastics, glass and bio-waste. All above-ground containers are chipped so that data can be recorded to make it easier to control waste collection. The data include the following: location and weight of above-ground container, intended use of above-ground container and identification the truck that collected waste last time [28]. Some of the WCPs contain bell- shaped containers for glass collection. Additionally, metal containers, provided by the Polish Red Cross, for textile collection are often placed near the WCPs [29]. District residents can dispose of their waste electrical and electronic equipment into a special container that was set up by the shopping center. The container was provided by an external company responsible for utilization and recycling of electrical and electronic waste. The number of above-ground containers for municipal waste collection in the district as of 1 March 2020, is shown in Table 4.

2.2. Methods

Based on an on-site visit (8 March 2020; Table 4), and suggestions from the manager and the district inhabitants, it was concluded that the selective waste collection system should be modified. The modification must involve changes in the container number or type. The solutions proposed aim to improve selective municipal waste collection and engage residents in selective waste collection and disposal to a greater extent than before.

2.2.1. Number of Waste Containers

When choosing alternative number and types of municipal waste containers for a WCP, we must ensure that the container capacity of each fraction is sufficient. Whether it suffices depends on the amount of waste generated by the residents assigned to the WCP and how often waste is collected. The latter is determined by a waste collection schedule stating which containers should be emptied and when [30].
According to the Resolution in force [25], the schedule of waste collection from multi-family buildings is as follows:
  • twice a week—plastics and metals;
  • once a week—paper;
  • once every 2 weeks—glass;
  • once a week (from April to October) and once every 2 weeks (from November to March)—bio-waste;
  • every second day—mixed waste.
The number of above-ground containers for the current frequency of municipal waste collection from the district was calculated according to the following formulas.
Mass of the ith component of municipal waste generated by one inhabitant per day [30]:
m i = z i · W m
where: mi—mass of ith component of municipal waste, kg∙M−1·d−1; zi—content of ith component in municipal waste stream, %; Wm—mass index of municipal waste accumulation, kg∙M−1·d−1;
Volume of the waste component produced daily by one inhabitant [30]:
v i = m i ρ i
where: vi—volume of the ith waste component generated by a single resident a day, L∙M−1·d−1; ρibulk density of the ith component of municipal waste, kg∙L−1; ρpaper—0.09 kg∙L−1; ρmetals and plastics—0.06 kg∙L−1; ρglass—0.2 kg∙L−1; ρbio-waste—0.255 kg∙L−1; ρmixed waste—0.2 kg∙L−1 [22,30,31].
The number of days within which time the current number of above-ground containers will be filled [31] is expressed as follows:
t = n · V · k p v i · M
where: t—number of days within which time a given number of above-ground containers will be filled, d; n—number of above-ground containers, units.; V—above-ground container capacity, L; kp—the filling factor of the above-ground container; vi—volume of the ith waste component generated by a single resident a day, L∙M−1·d−1; M—number of residents.
The required number of above-ground containers for waste collection was calculated based on the formula [31]:
n i = v i · M · k w V · k p
where: ni—required number of above-ground containers for the collection of ith component of municipal waste, units; vi—volume of the ith waste component generated by a single resident a day, L∙M−1·d−1; M—number of residents; kw—waste disposal frequency factor; the number of days between waste collections was assumed for: paper—7 days; glass—14 days; plastics and metals—3 days; bio-waste -14 days; mixed waste—2 days; V—above-ground container capacity, 1100 L; kp—the filling factor of the above-ground container, assumed to be 1 according to [30] and 0.85 according to [31].

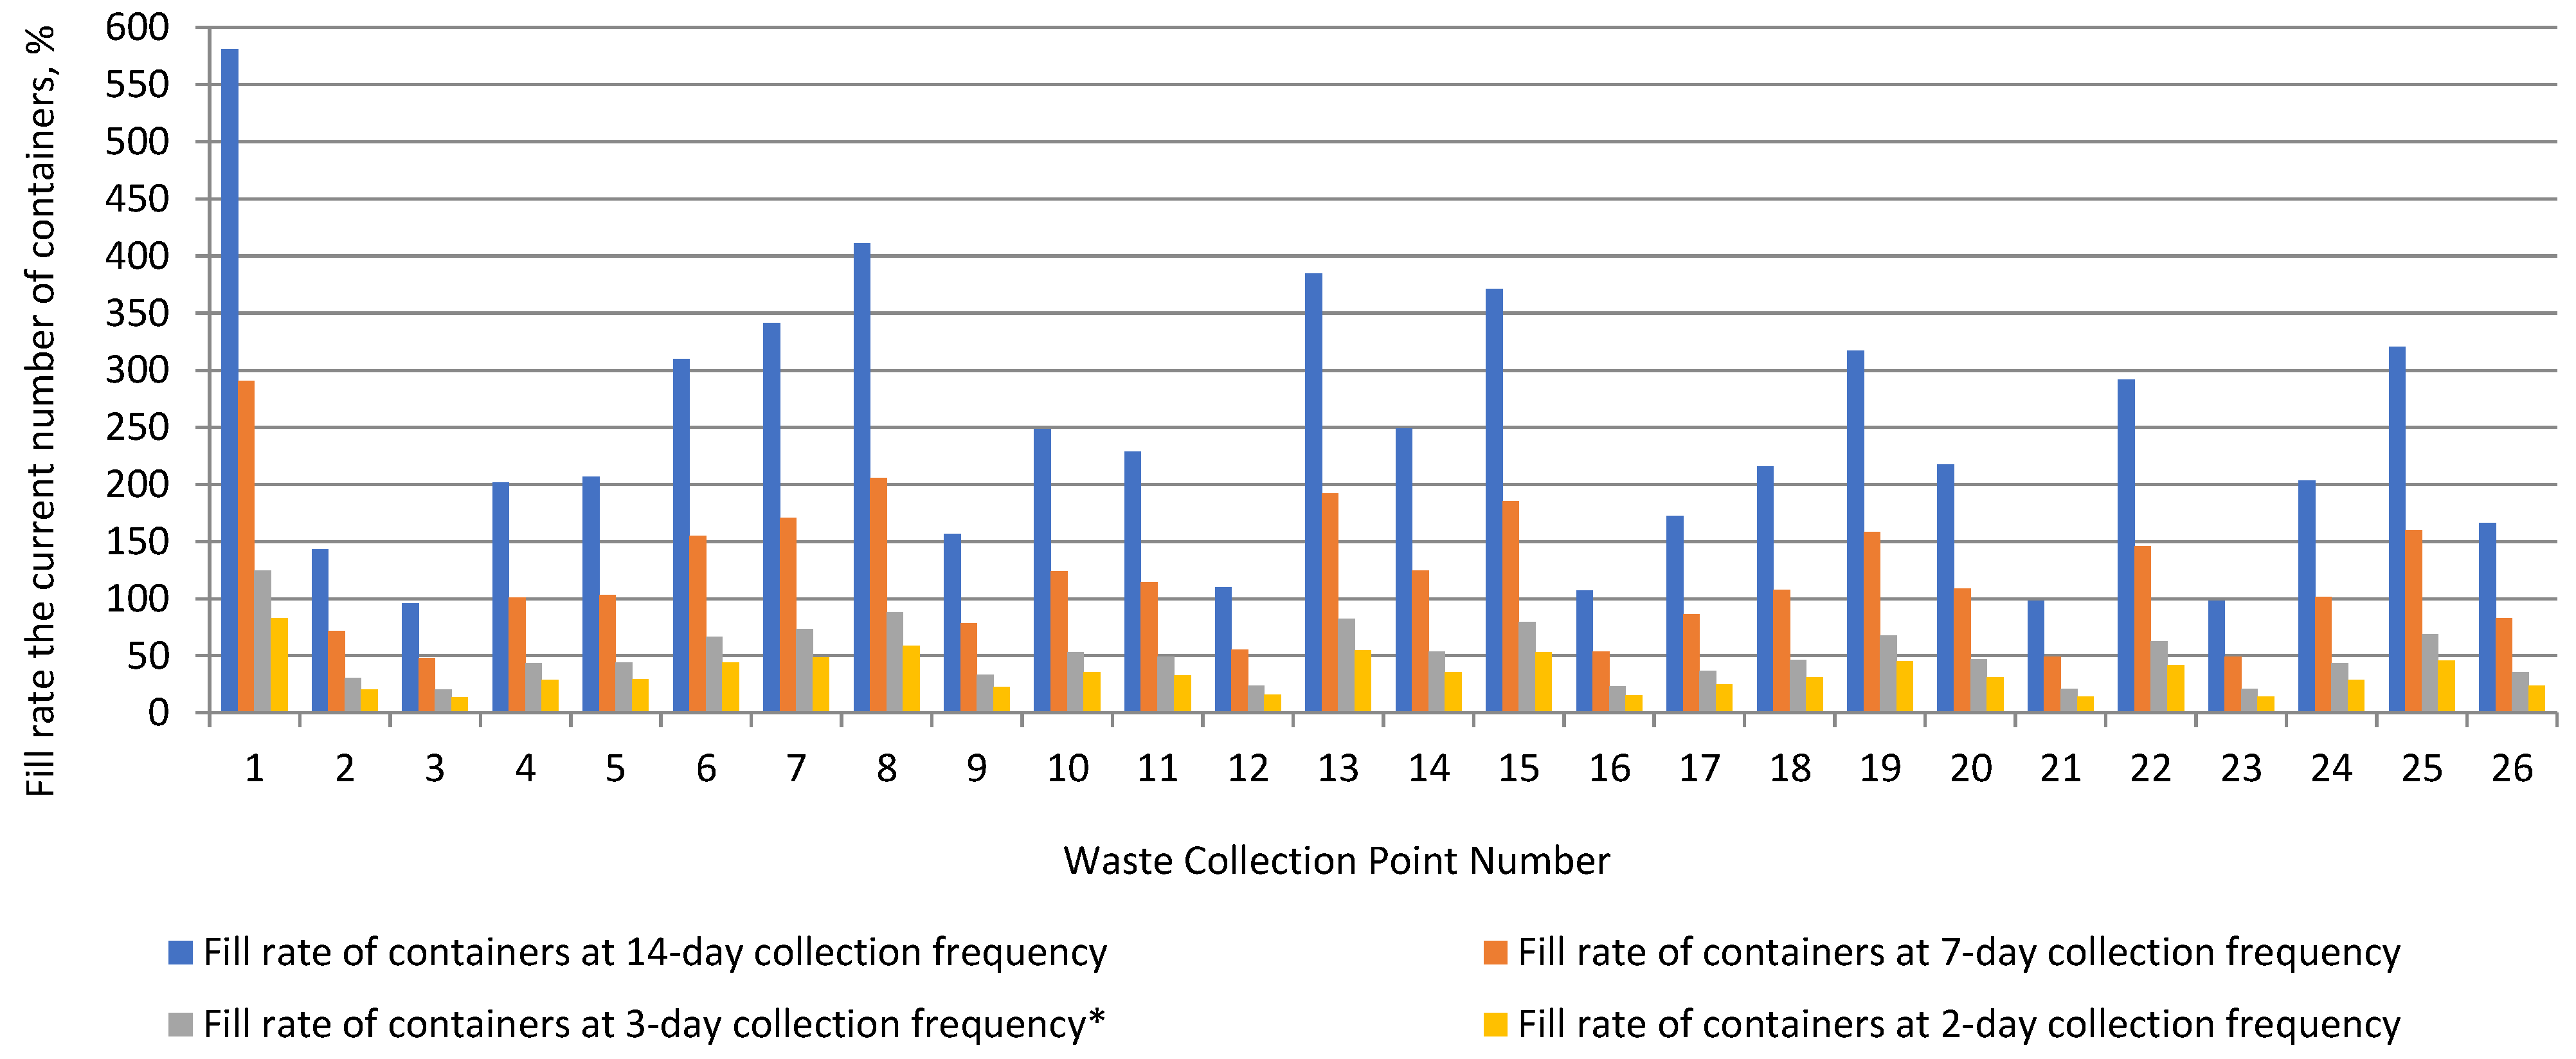
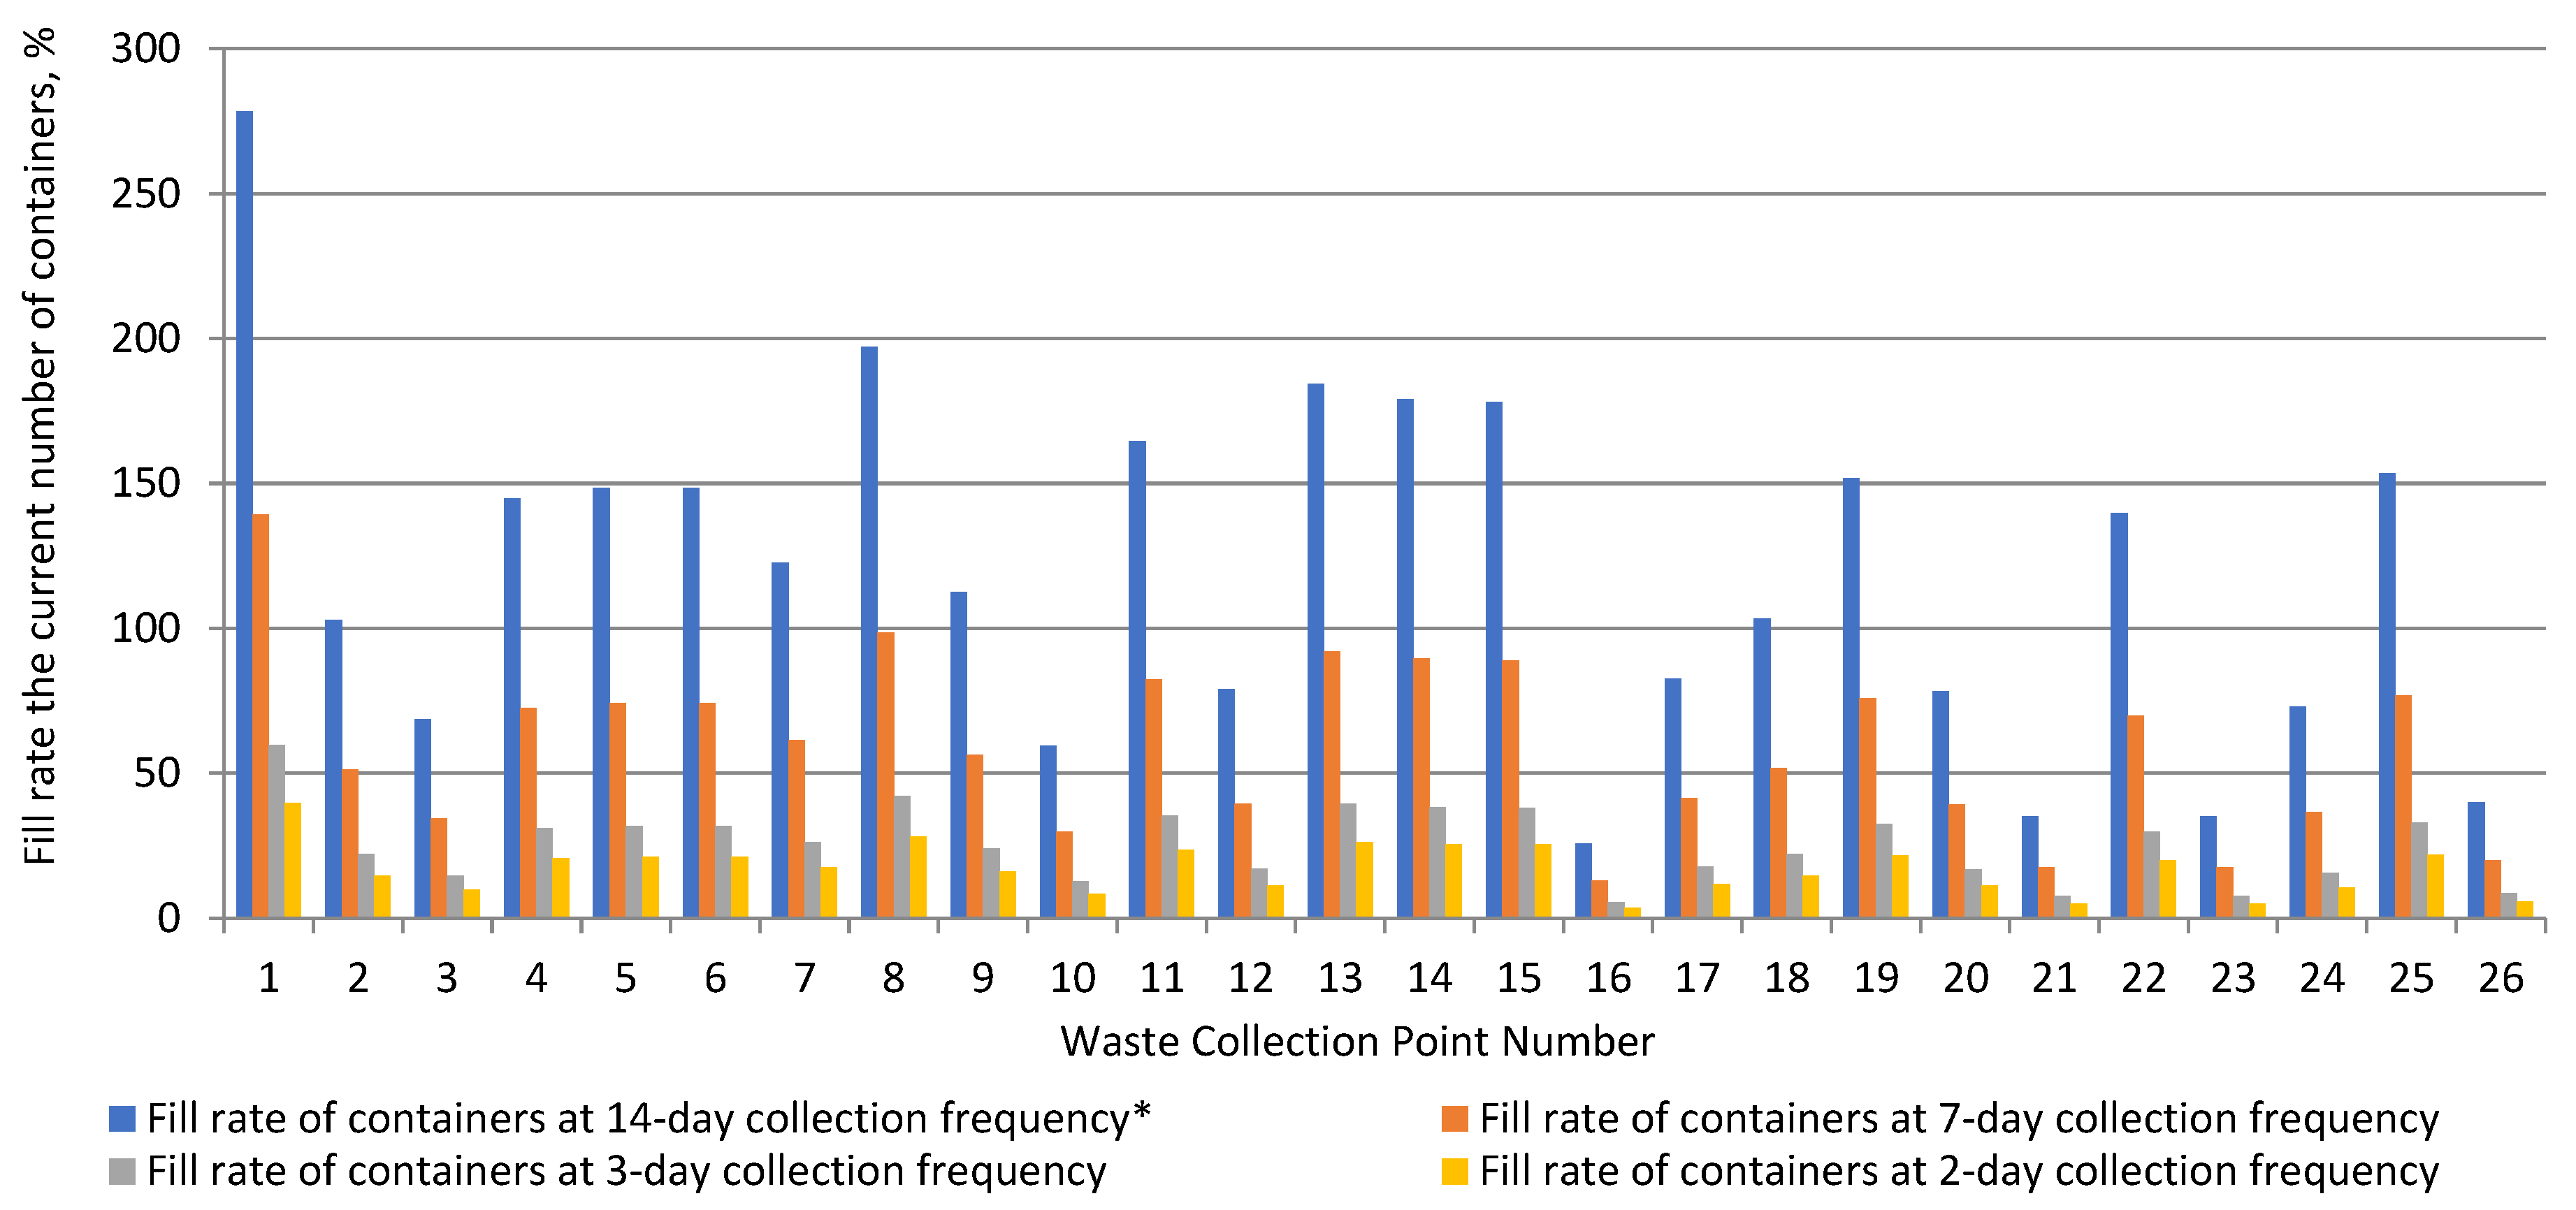
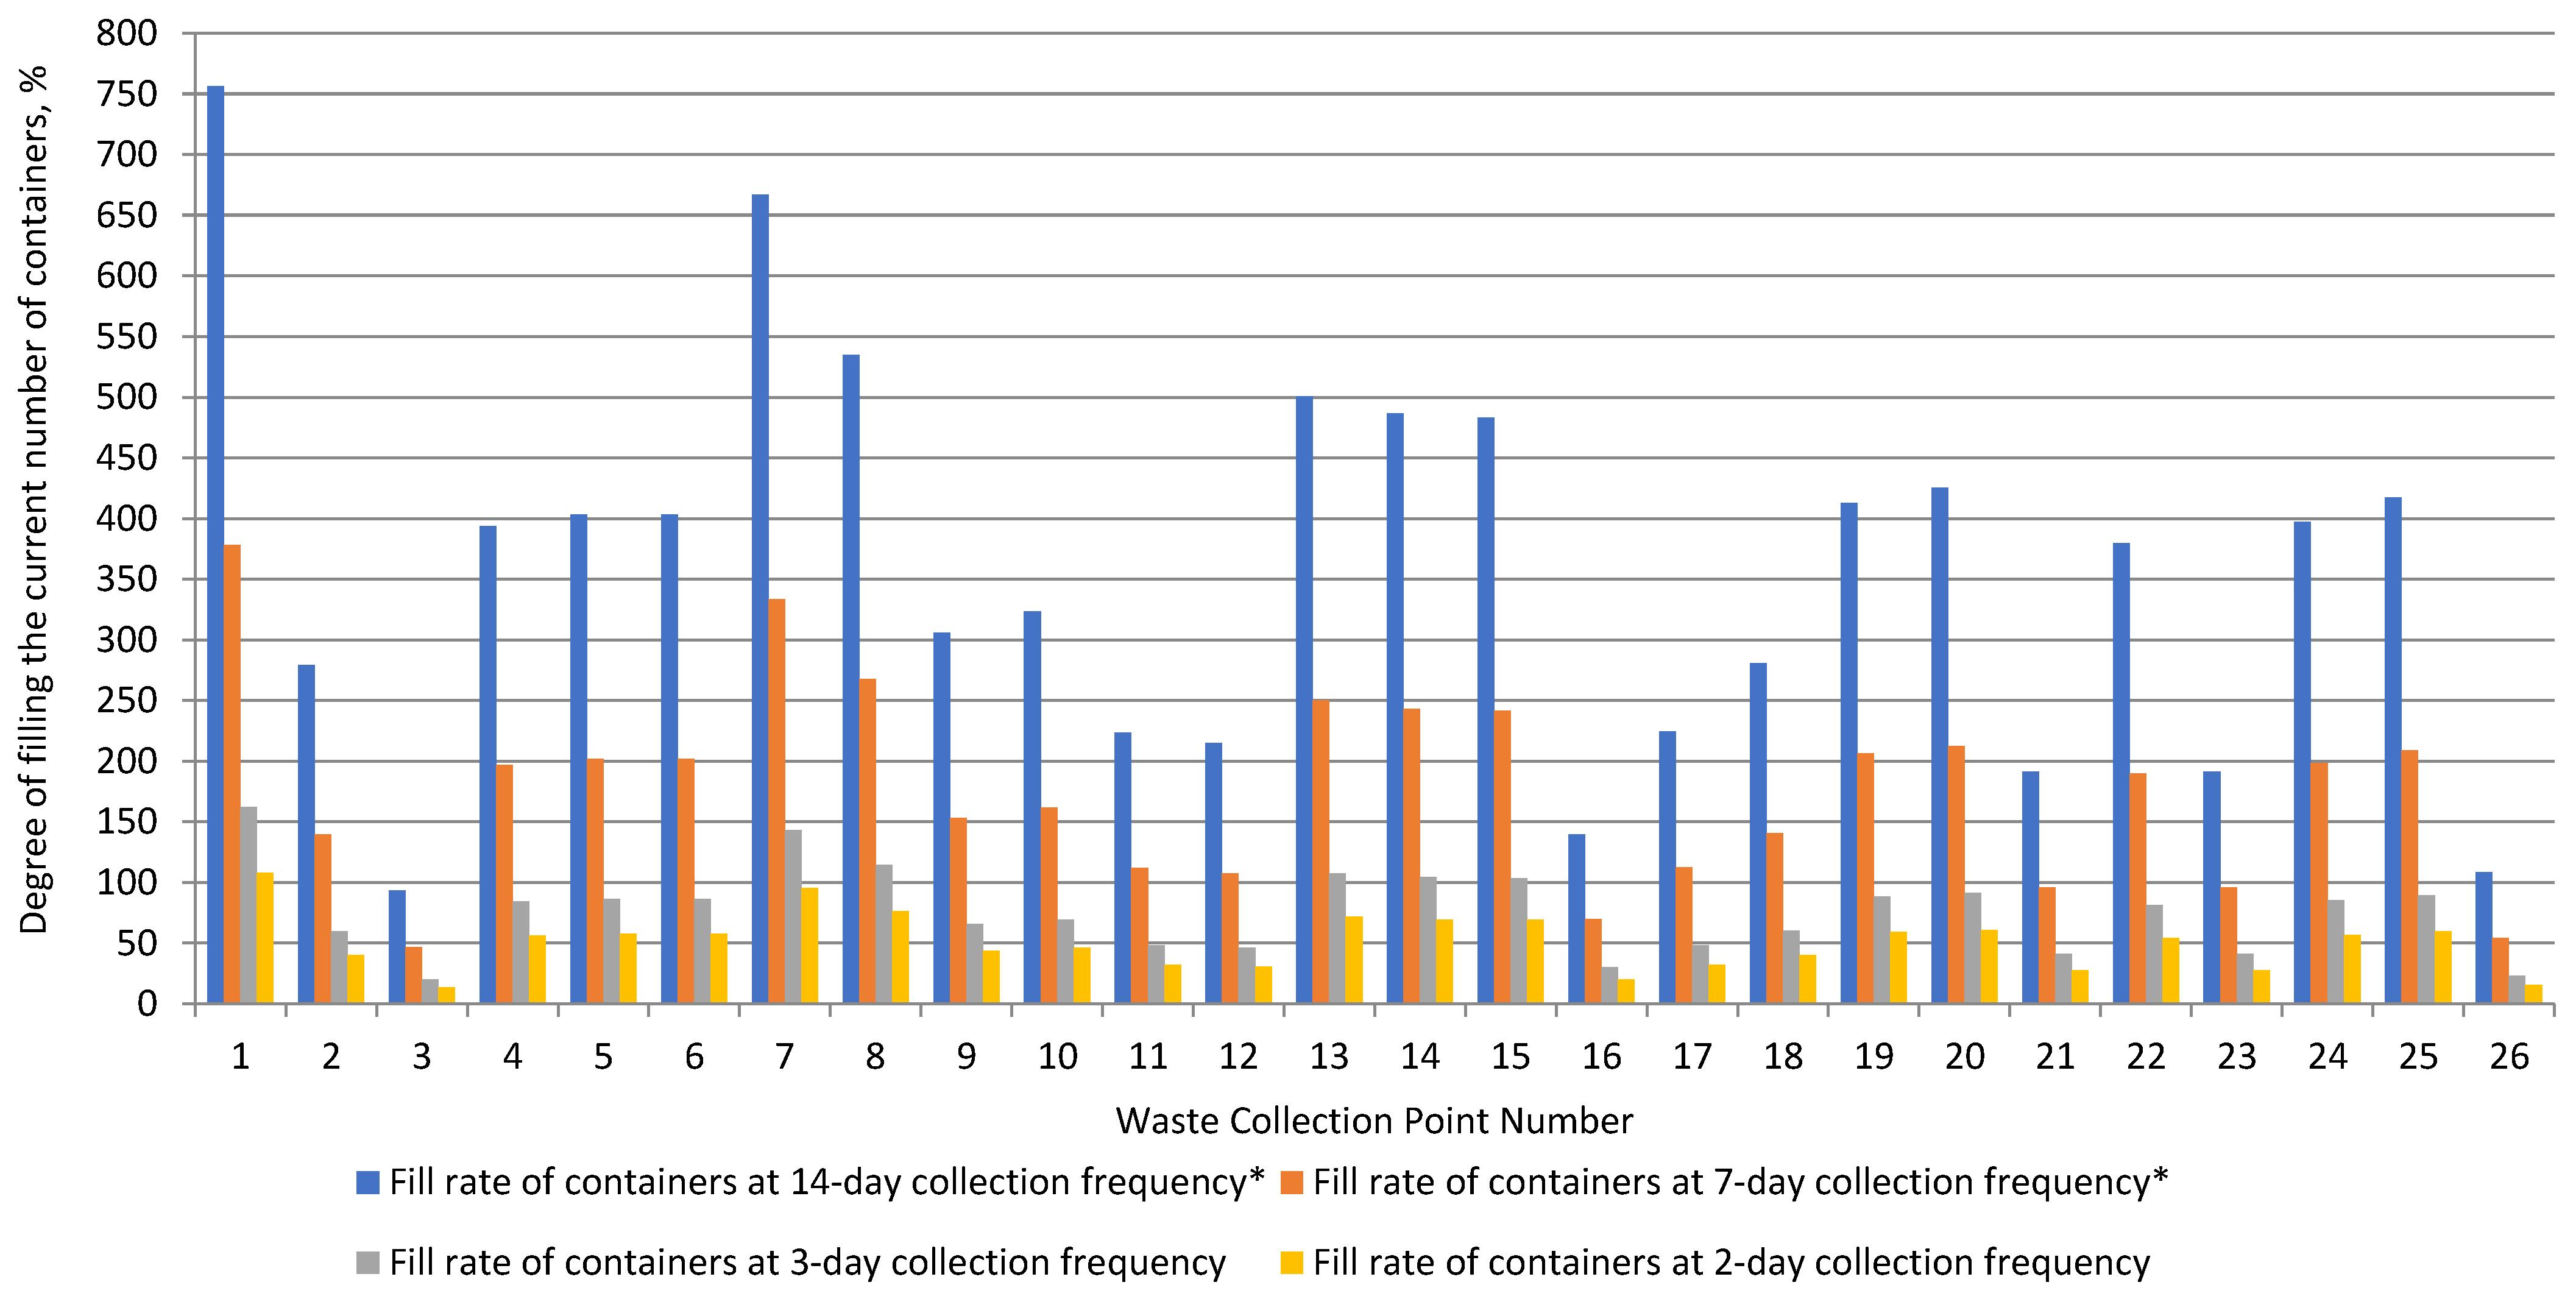
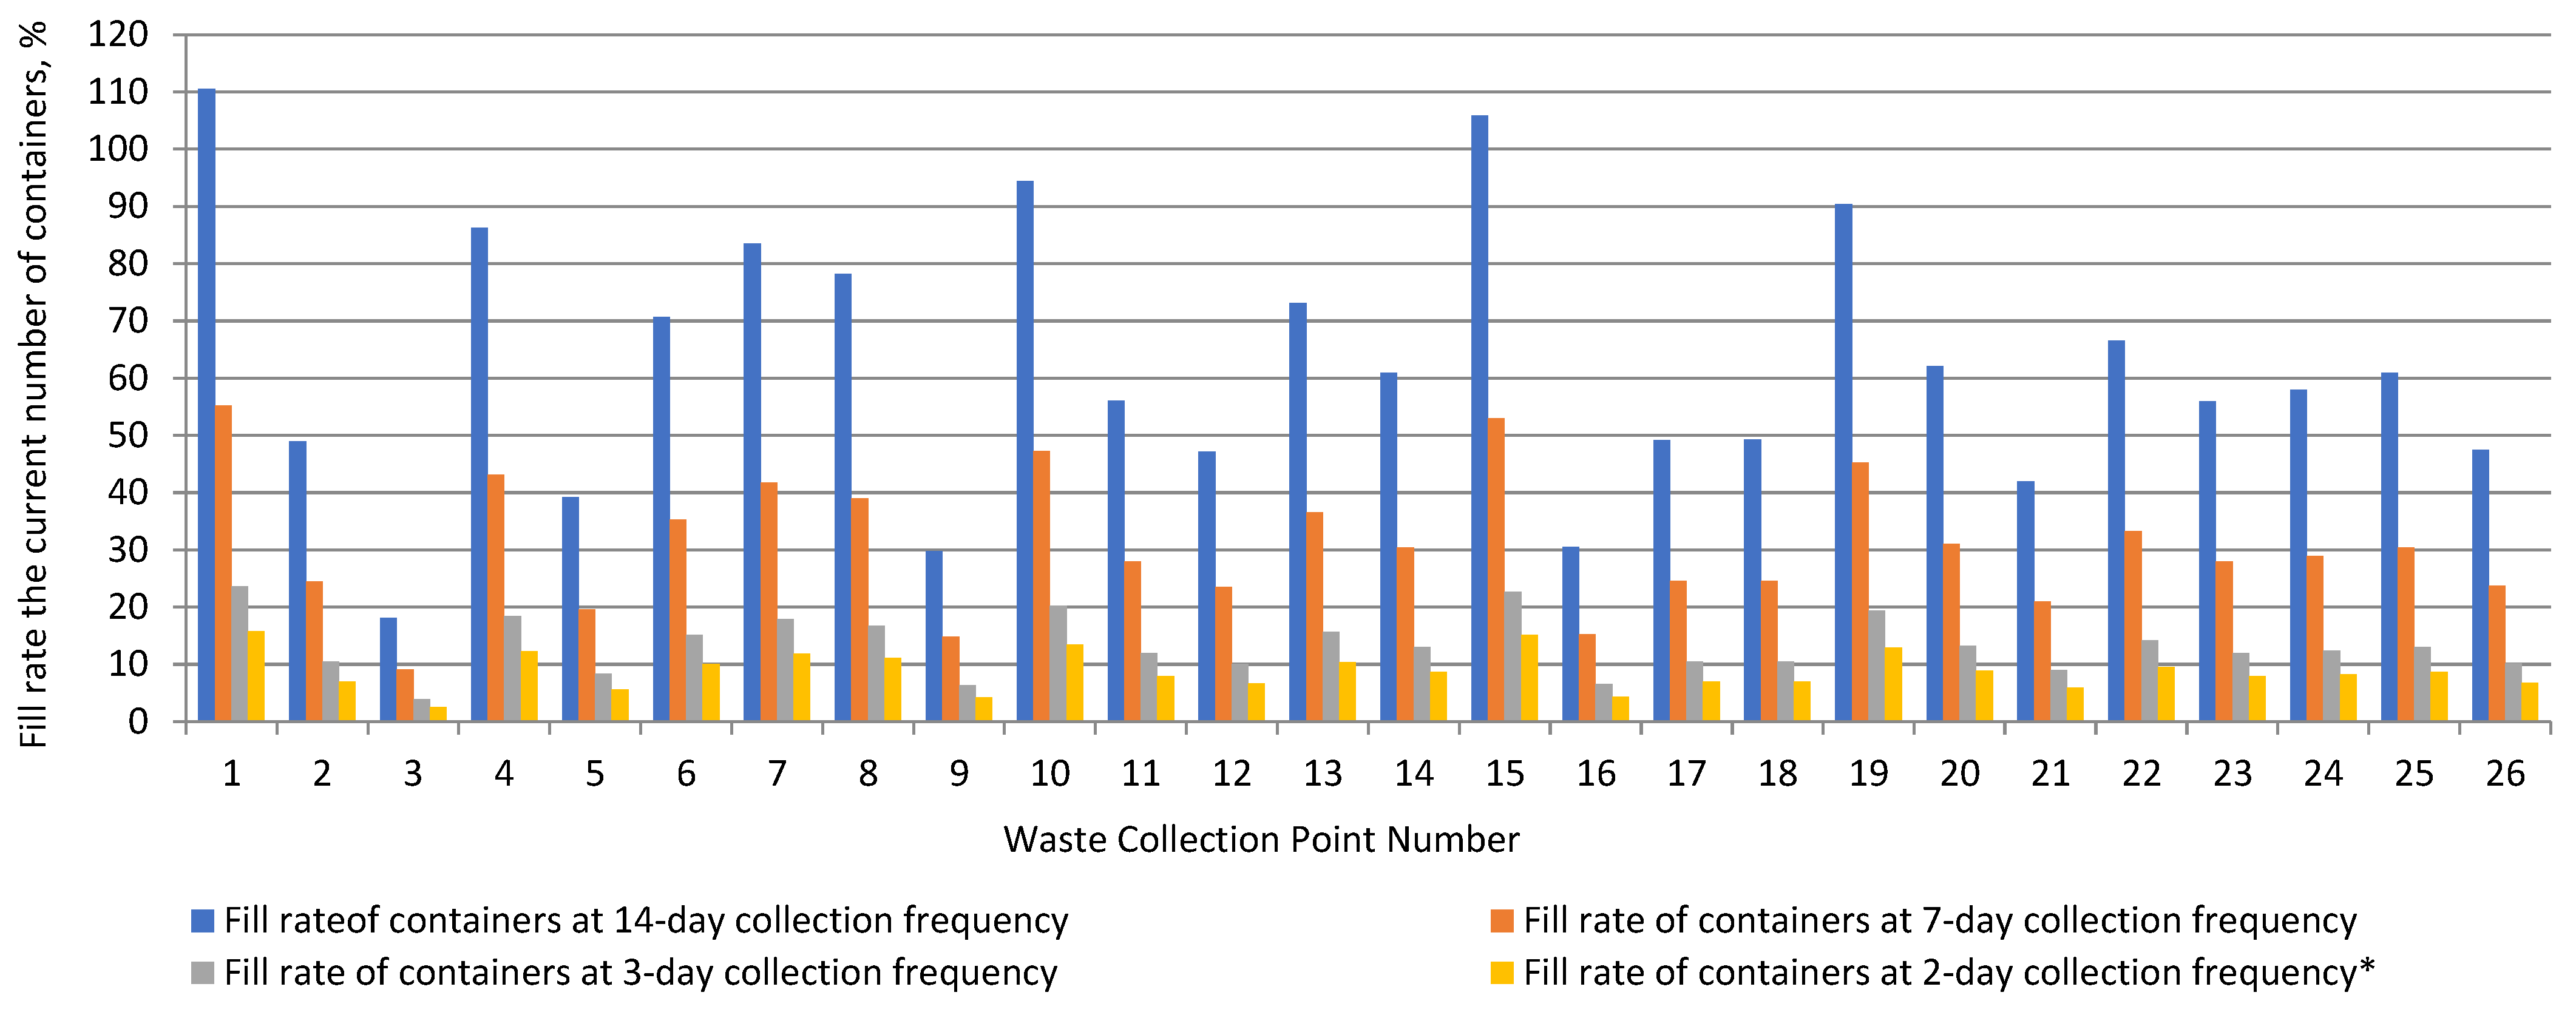
2.2.2. Fill Rate for the Above-Ground Containers

When the fill rate for the above-ground containers is determined, it is possible to estimate which variants of the waste collection frequency may result in the above-ground containers overflowing. The fill rate of the current number of above-ground containers was calculated on the basis of the formula [31]:
f c = ( k w · v i · M n · V ) · 100
where: fc—the fill rate of the above-ground container, %; vi—volume of the ith waste component generated by a single resident a day, dm3∙M−1·d−1; M—number of residents; n—number of above-ground containers, units; V—above-ground container capacity, L.

2.2.3. Semi-Underground System

The underground container system is not widely used in Poland. A wide range of underground containers are semi-underground containers. The above-ground part of such a container is one-third of its total height, while the remaining part is located under the ground surface. The underground section, in the form of a plastic inner container or a re-usable bag (“big bag”) made of polypropylene, is placed in a concrete well. Semi-underground containers are emptied using vehicles with a two-hook hydraulic vehicle crane system [32,33,34].
In order to improve the selective waste collection system in the Uroczysko district, a set of semi-underground containers is proposed. The replacement of the currently used bin shelters with semi-underground containers is justified by the following [6]:
  • they occupy far less space and space limitations are common in high rise developments;
  • they have higher usable capacity than surface containers;
  • due to waste compaction, the container capacity can be doubled;
  • they offer better aesthetic;
  • constant temperature conditions are maintained due to slower degradation of organic waste;
  • odour emissions are reduced, especially during the summer season;
  • maintenance requirements are reduced;
  • containers are protected against vandalism and animals.
The number of semi-underground containers was calculated based on Formula (4). While selecting the container capacity for a given waste fraction, the authors drew on the relevant experience of the Polskie Pojemiki company in this respect [35].

2.2.4. Municipal Waste Management in Terms of Efficiency—Selected Aspects

In a market economy, businesses have to use their resources effectively. As regards waste management, the system efficiency is of prime importance. That should be considered in relation to the fulfilment of criteria used to evaluate this process, i.e., [36]:
  • environmental issues, which include both reducing environmental pollution and the use of non-renewable resources;
  • economic—when designing a waste management project, the costs of investment, maintenance and amortisation of the installations, and of associated services, including waste collection and transport, should all be taken into consideration;
  • social, which include various obligations imposed on residents who generate waste, including the waste segregation practices recommended by the local administration.
In order to ensure efficiency and effectiveness of waste management, it is necessary to determine the effects of the activities carried out and to identify the directions of its future development paths. Successful municipal waste management translates into the life quality improvement for the community. That means financial criteria should not solely be taken into account, ethical or environmental ones are equally important to satisfy the needs of the local community [37]. Consequently, the costs of waste management need to be related to expected environmental benefits, and also acceptable for the members of the local community [36]. Currently, efforts are made to build a low-waste economy, also termed a circular economy, so environmental criteria are of primary importance in waste management practices.
An analysis of the status of municipal waste collection in the Uroczysko district shows that it is not fully implemented in accordance with current legislation and requires increased involvement of residents. However, the improvement options are rather limited as the residents are not inclined to segregate the waste they produce. This happens in spite of statutory obligations or educational campaigns.
We therefore investigate how to adjust the selective waste collection system to stimulate proper waste separation by the residents in the residential district under study. Adjustments could lead to a modernization of this field, improved waste separation by the residents and improved acceptance by the local community. However, such a system has a number of limitations, the most important of which are high costs and a need to designate an appropriate site for selective collection. It should be stressed that every decision-making process poses a risk of taking wrong decisions. With waste management, these may lead to financial losses, failure to meet target level of recovery or recycling, degradation of the environment, or lack of social acceptance.
Based on available data, this study gives the performance assessment of alternative selective waste collection system. A comparison of investment and operating costs was made for variants with above-ground containers and semi-underground ones.

3. Results and Discussion

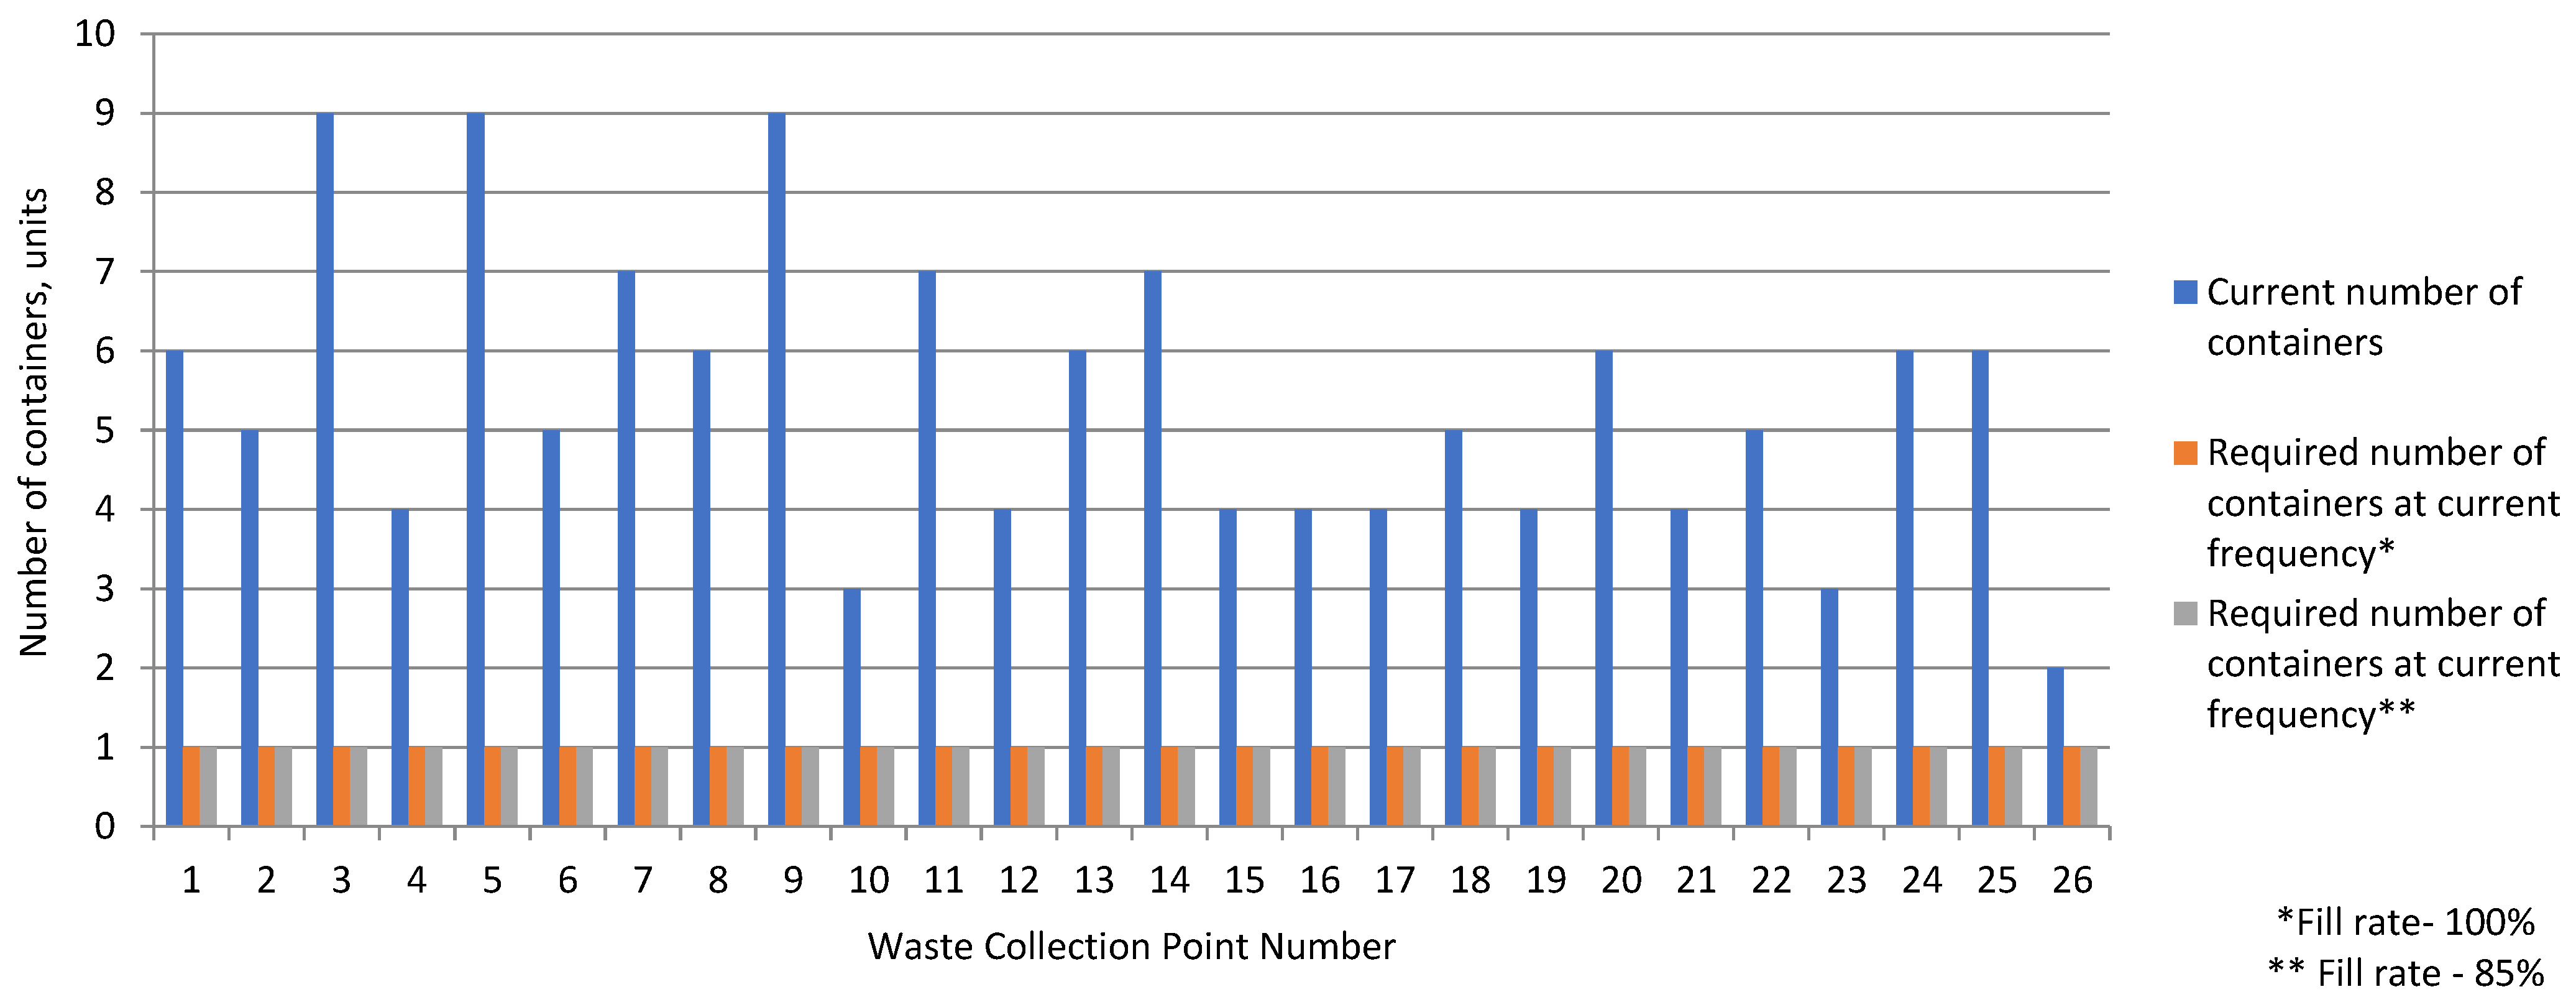
3.1. Number of Containers

In twelve WCPs, the current number of containers is lower than that calculated for container fill rates of 100% or 85% (Figure 3).
In 16 cases, the number of containers for the collection of metals and plastics is higher than the required number resulting from calculation. In the remaining WCPs, assuming 85% fill rate, a similar or the same number of containers was obtained (Figure 4).
Eight WCPs showed a higher number of required glass collection containers for both fill rate options. For two WCPs, the calculations produced a lower number of containers compared with the current state (Figure 5).
The number of containers for biodegradable waste collection was calculated for two existing variants of collection frequency—for the winter season (from November to March; 14-day collection interval) and for the summer season (from April to October; 7-day collection interval). In the summer season, the calculated required number of containers is approximately half the number determined for the winter season. For both frequency variants, the calculated number of containers in most of the WCPs is a higher than the actual number of containers (Figure 6).
The current number of containers for mixed waste collection in all the WCPs is higher than the calculated required number. For both variants of container fill rate, their calculated number is 1 unit (Figure 7). The present number of mixed waste containers is so high because the residents fail to segregate their waste. They put biodegradable waste into mixed waste containers.

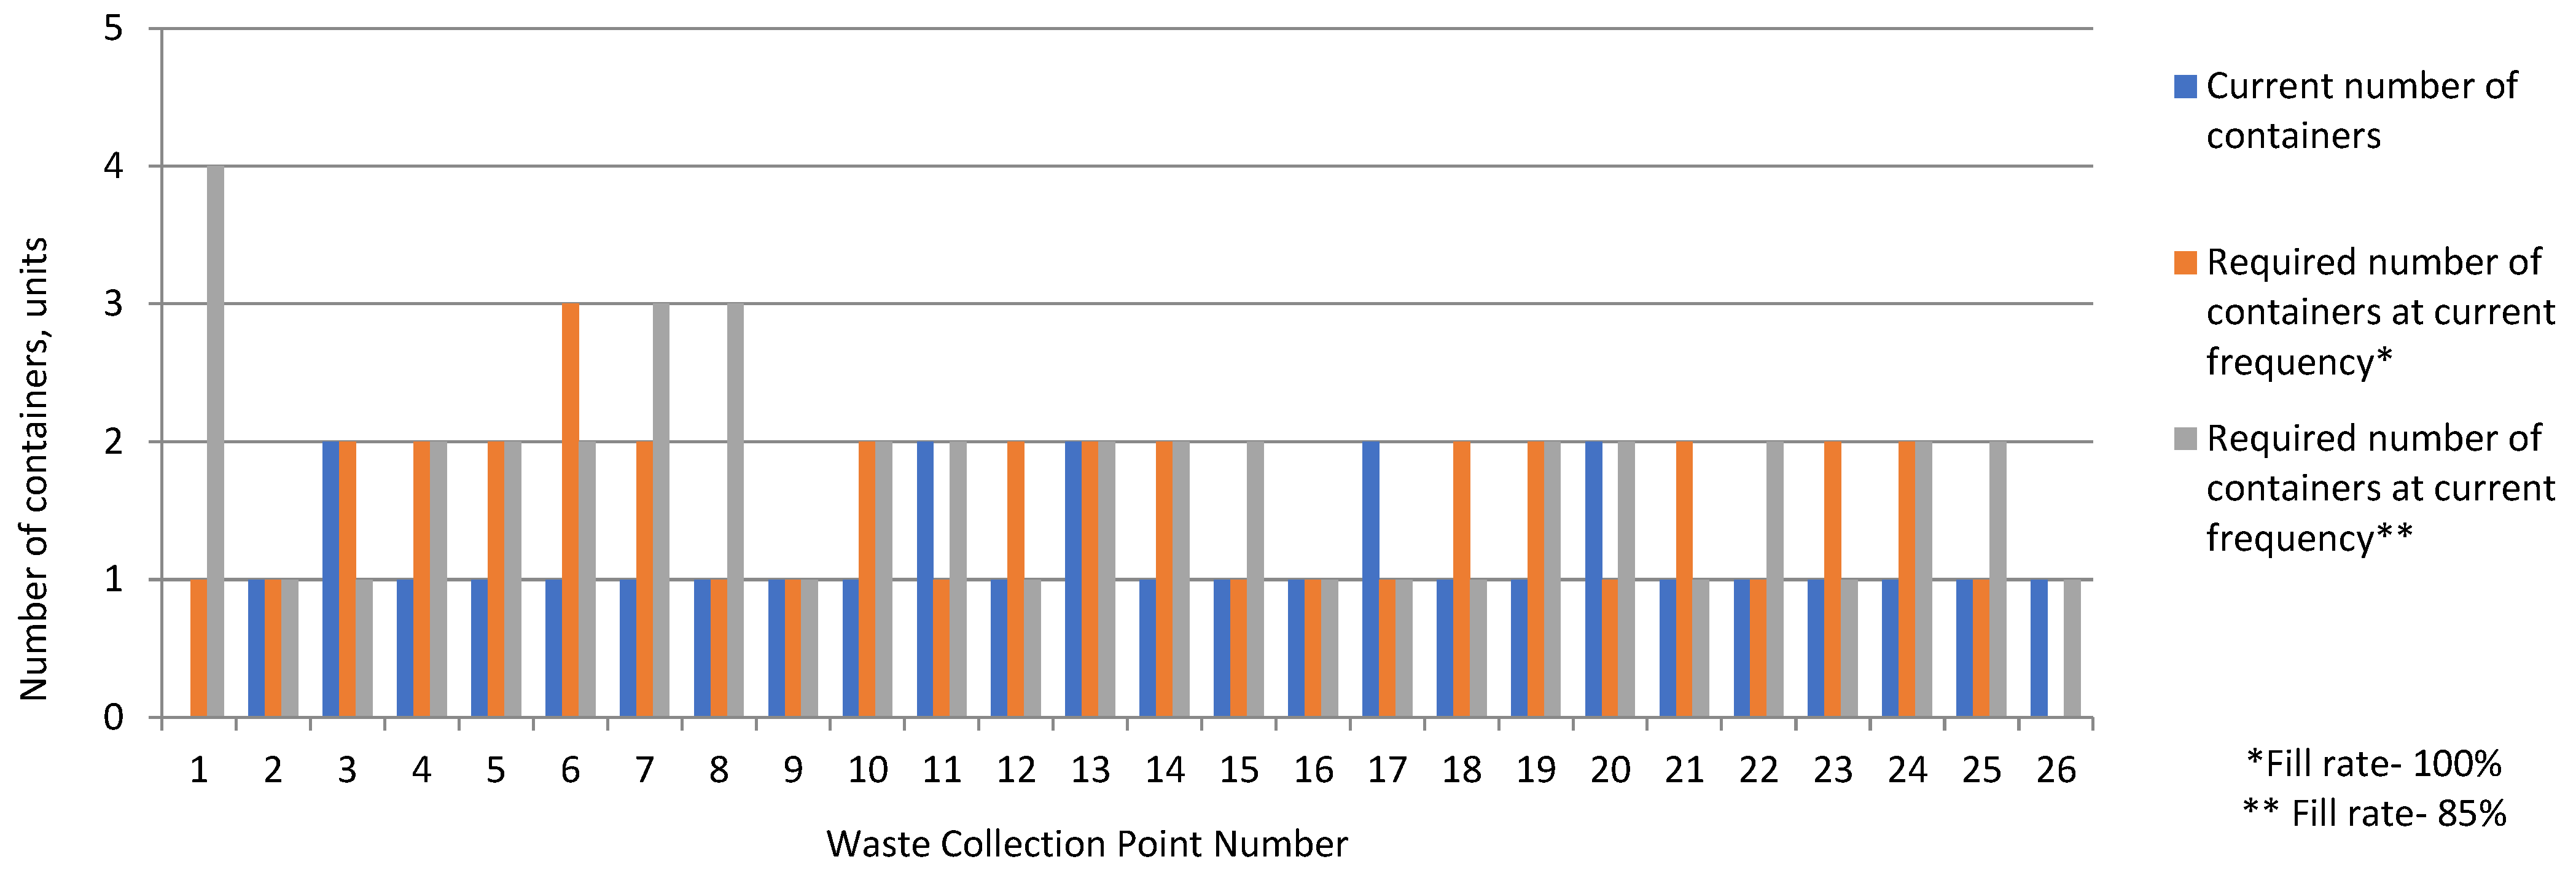
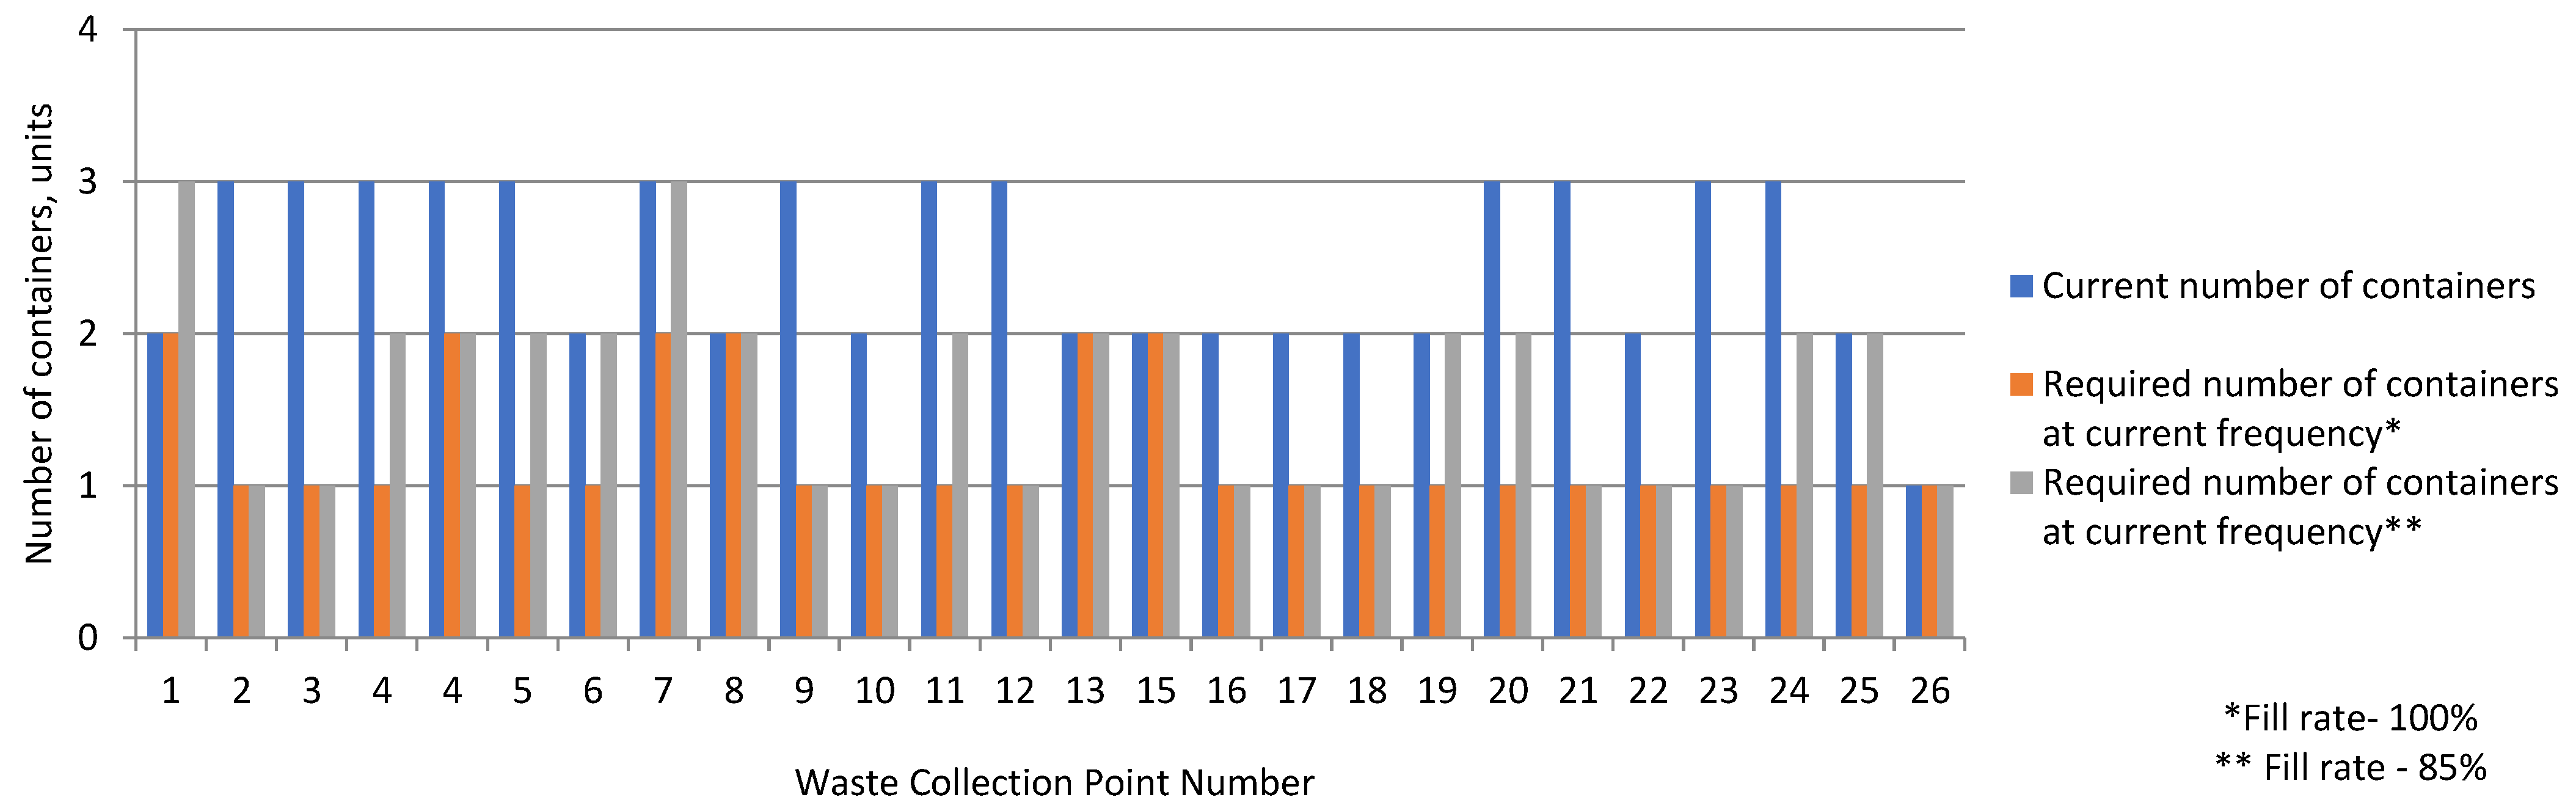
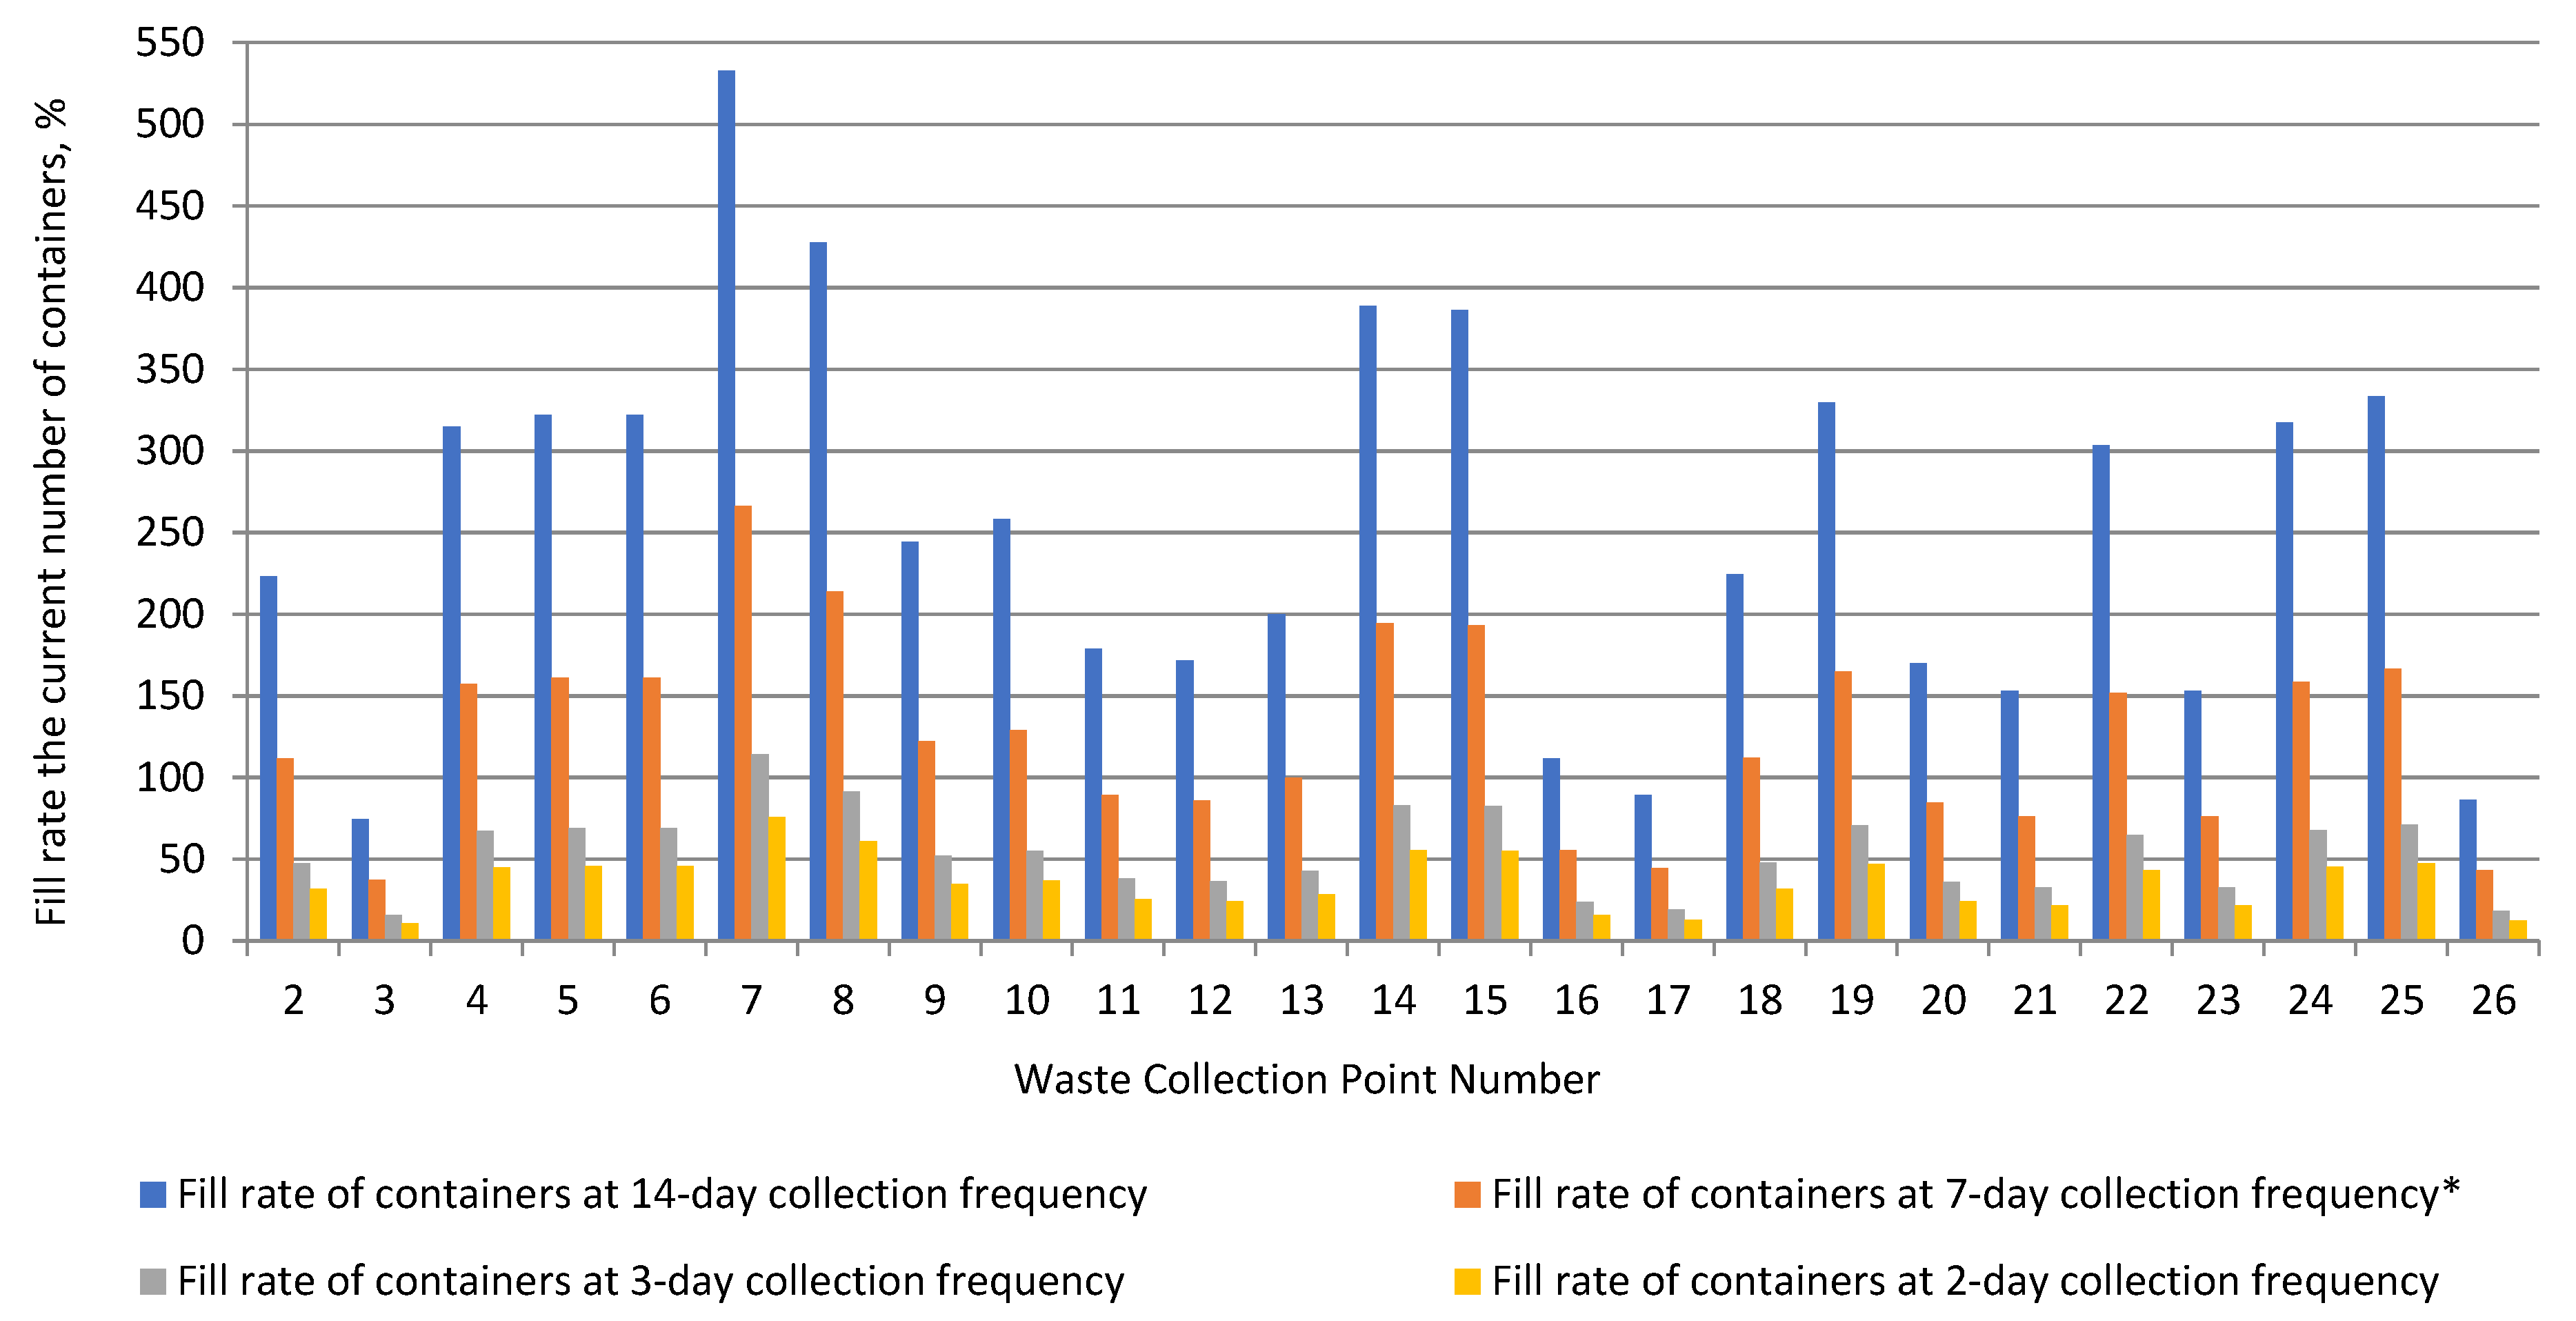
3.2. Fill Rate of Above-Ground 1.1 m3 Containers

For the present weekly emptying scheme, paper containers overflowed at 15 out of 26 WCPs. For the collection at 14-day time interval, paper containers also overflowed except for the WCP3, WCP17 and WCP26. With respect to other assumed collection frequency arrangements, paper containers did not overflow (Figure 8).
At current emptying every 3 days, containers for metals and plastics overflowed at WCP1. For container emptying every 7 days, and also every 14 days, containers overflowed at the majority of the WCPs (Figure 9).
When glass is collected every 14 days, containers overflowed at 16 WCPs. When the container emptying takes place every 7 days, containers did not overflow, except for WCP1 (Figure 10).
In the winter season, when bio-waste containers are emptied every 14 days, the containers overflowed at 25 WCPs. In the summer period, when the collection presently occurs every 7 days, overflowing concerns 21 WCPs. When bio-waste is collected every 2 days, overflowing is not found except for WCP1 (Figure 11).
Presently, the collection of mixed waste takes place every 2 days and the containers at all WCPs do not overflow. When the collection of mixed waste takes place every 14 days, the containers overflowed at two WCPs (Figure 12).

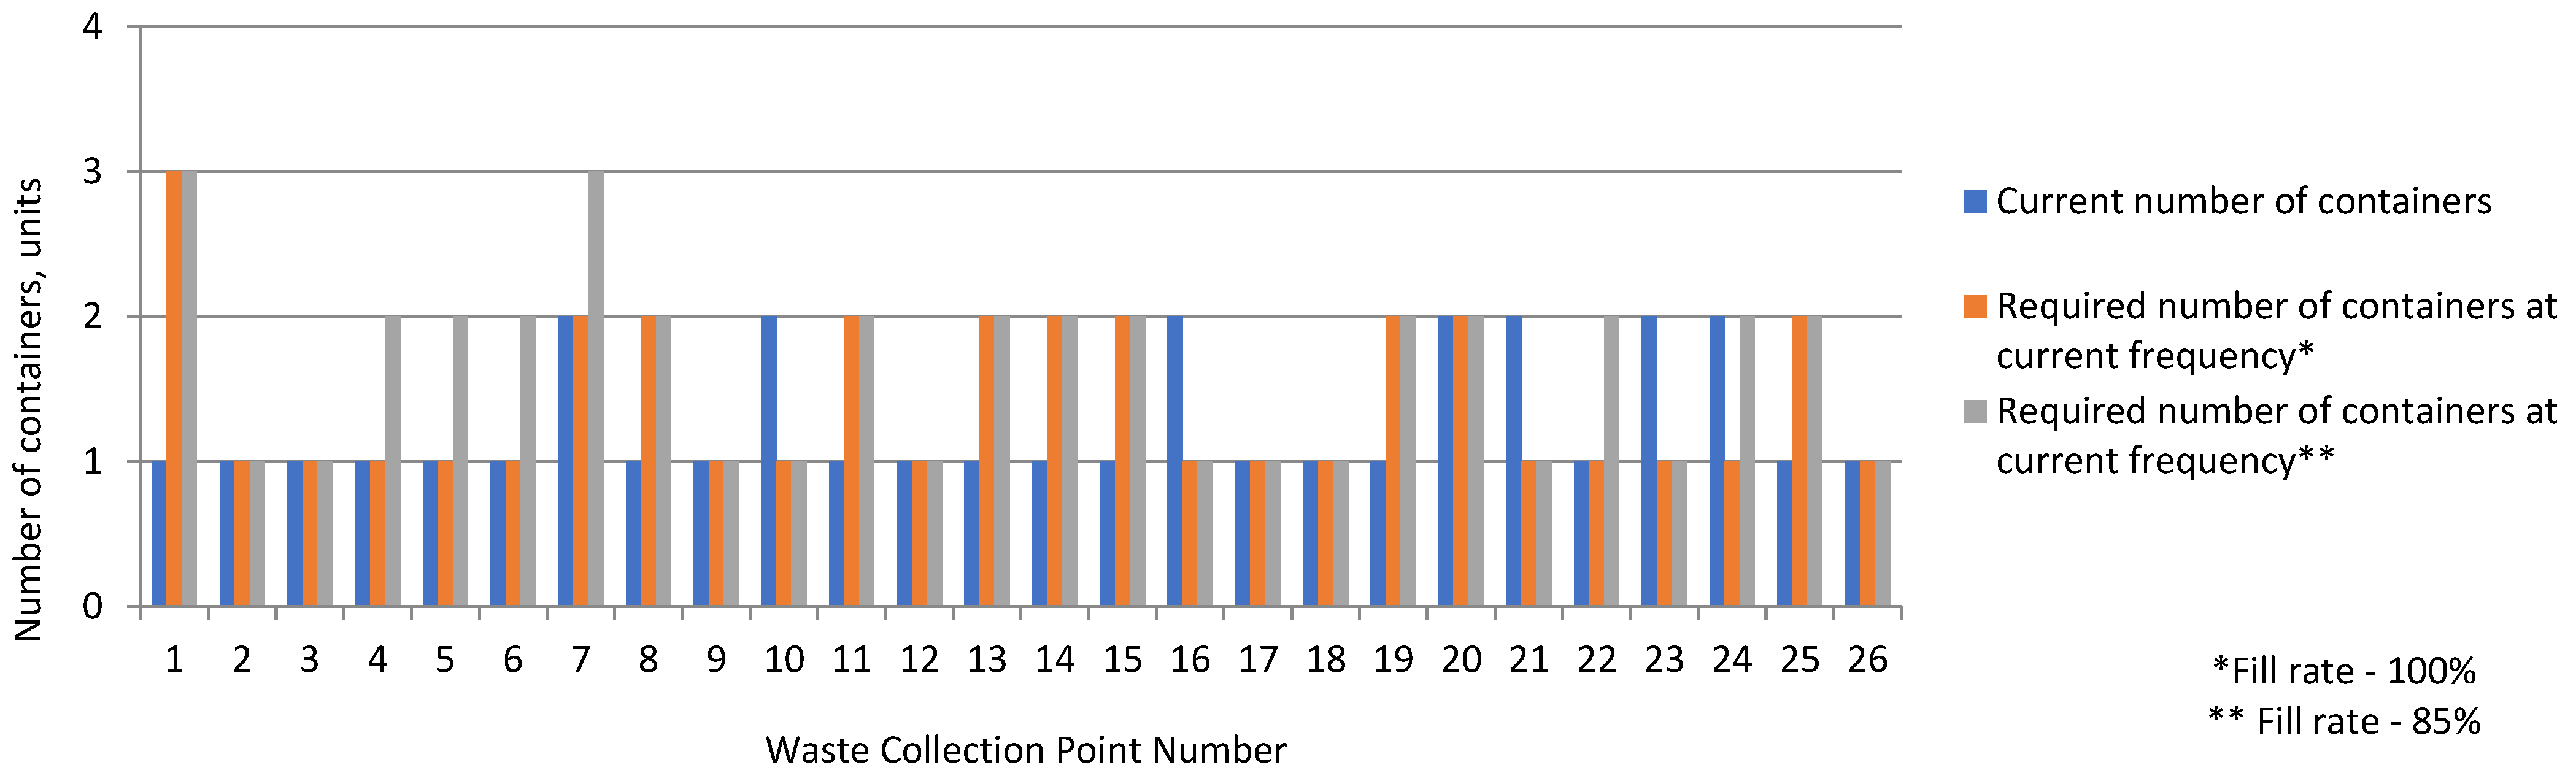
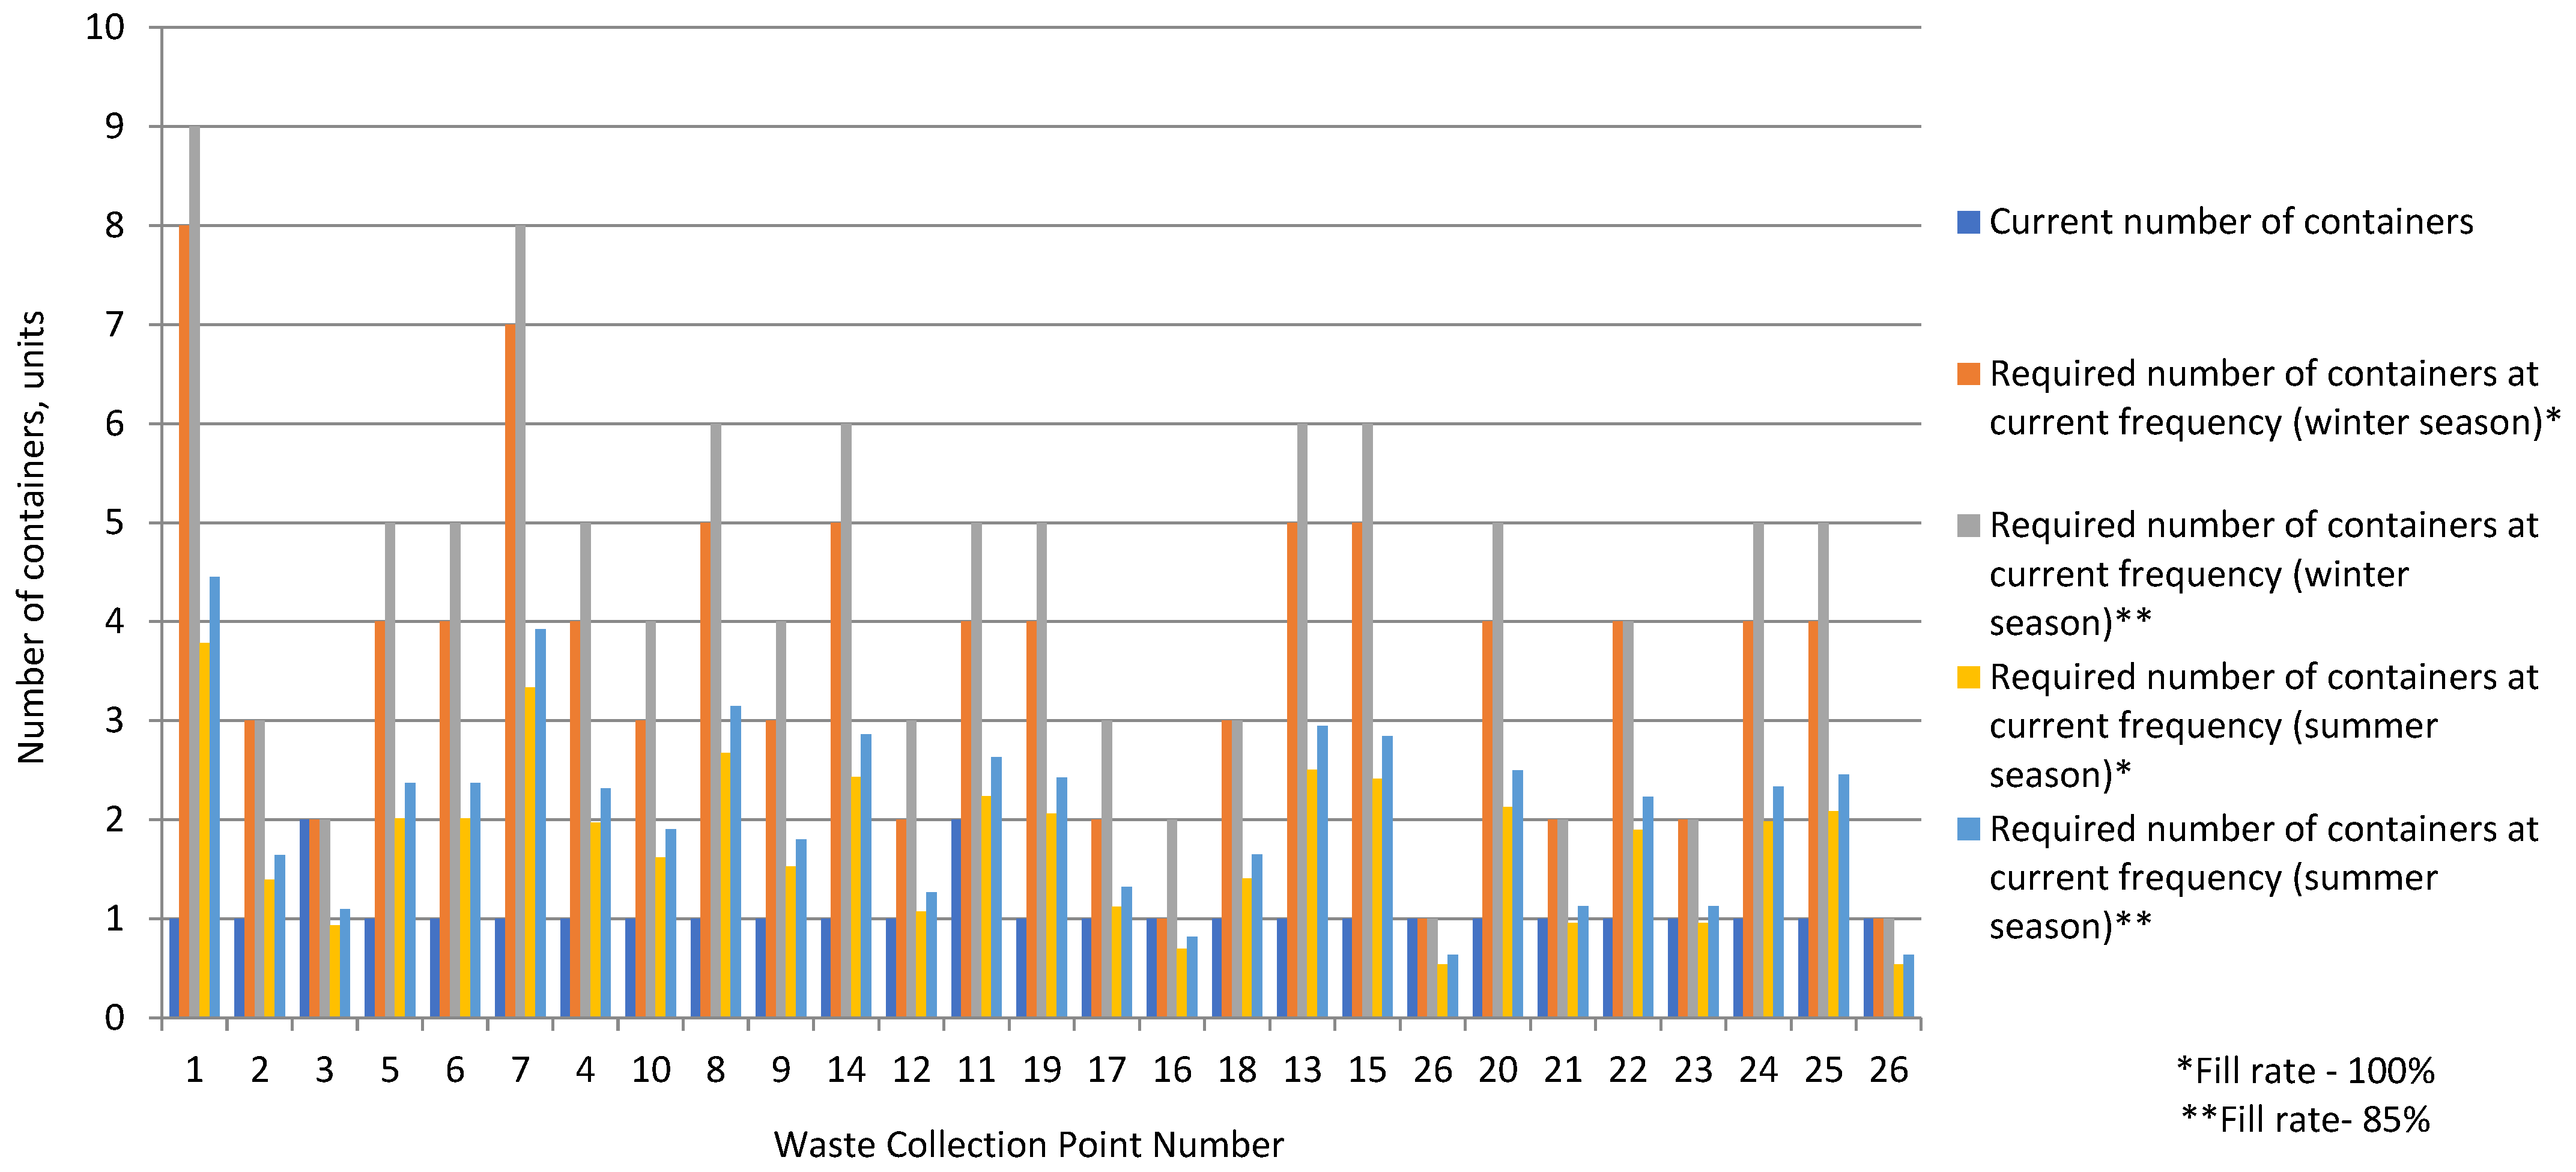
3.3. Selection of the Number of Above-Ground Containers with 1.1 m3 Capacity

The analysis of the current number of above-ground containers in the WCPs, of the results of the calculation of the required number of above-ground containers and the fill rate for different collection frequency variants, and the WCP condition assessment during the on-site visit, made it possible to determine a new number of above-ground containers for the collection of the five municipal waste fractions. A summary of the proposed number of above-ground containers is shown in Table 5. When determining the number of above-ground containers for the collection of paper, metals, plastics and glass in the WCPs, the results of the calculation of the required number of above-ground containers with their 85% fill rate were employed. The number of inhabitants, taken into account in all calculations, resulted from the declarations provided by the inhabitants for municipal waste management. This data, however, may not precisely reflect the actual number of people covered by the municipal waste collection system. The assumption of 85% fill rate of above-ground containers provides a spare capacity reserve. If a municipal waste stream grows, the strategy may ensure selective waste collection in above-ground containers.
The current number of above-ground containers assumed for bio-waste collection is rather small because efficiency of this waste fraction segregation is very low. During the on-site visit, it was found that the fill rate of above-ground containers for bio-waste collection was minimal. Bio-waste was generally disposed of by inhabitants into mixed waste above-ground containers. In addition, when calculating the required number of above-ground containers, the authors relied on the data concerning the morphological composition of municipal waste in the Świętokrzyskie Voivodeship cities (Table 2) rather than on the actual fraction share in segregated waste. As a result, it is proposed that the number of above-ground containers for bio-waste collection should remain unchanged for the time being. However, it should be noted that, as residents’ environmental awareness grows and the effectiveness of bio-waste segregation improves, the number of above-ground containers for bio-waste collection or collection frequency will have to increase.
As regards mixed waste collection, it is proposed to reduce the number of above-ground containers by half at each of the WCPs. During the on-site visit, it was found that the total capacity of the above-ground containers exceeded the actual capacity of the fraction to be disposed of. This is also justified by the fact that, with current mixed waste collection taking place every 2 days, the proposed number of bins should be sufficient to ensure that the entire waste stream can be collected. In addition, a reduction in the number of above-ground containers will ease the problem of insufficient WCP area to accommodate a set of above-ground containers for selective waste collection.
Comparing the current and proposed numbers of above-ground containers for the collection of municipal waste in the district, it was found that the number of above-ground containers for paper and glass collection should increase, whereas the number of above-ground containers for metals and plastics, and also for mixed waste, could be reduced (Figure 3, Figure 4 and Figure 5). It is recommended that the number of above-ground containers for bio-waste collection should remain unchanged. If their number proves too small to cover the residents’ needs, it may increase in the future.
In order to guarantee proper waste collection in the Uroczysko district, regular environmental inspections should be performed to check the actual fill rate of the above-ground containers and collection frequency. On that basis, it will be possible to adjust the number of above-ground containers to the degree of waste segregation.
In most WCPs, the total proposed number of above-ground containers is lower than the existing number. For WCP6, WCP7, WCP8, WCP19 and WCP15, the total number of above-ground containers will remain unchanged. The exception is WCP1, where a higher number of above-ground containers is recommended. This results from a relatively large number of inhabitants who use this collection point (Figure 4).

3.4. Number of Containers in the Semi-Underground System

The numbers of semi-underground containers suggested to replace above-ground containers are shown in Table 6. The following waste collection frequencies were adopted in the calculations: mixed waste—every 2 days, metals and plastics—every 14 days, glass—every 7 days, paper—every 14 days and bio-waste—every 2 days. It can be seen that the existing collection frequency was not altered. The semi-underground containers option will require 69 units of 5 m3 containers, 39 units of 3 m3 and 37 units of 1.5 m3. Most WCPs where semi-underground containers are to be installed will require five containers. In one case nine semi-underground containers will be required (WCP1). This is a consequence of the number of residents using this WCP.

3.5. Comparison of Investment and Operating Costs for Two Container Types for Selective Waste Collection

The aim of the analysis was to propose a change in the type of containers for selective collection of municipal waste. The analysis accounted for the local community needs, statutory requirements and performance of tasks by the local authorities in the area of concern. The proposed replacement of currently operated WCPs with semi-underground containers is intended to redesign and consolidate the municipal waste collection system. For the final choice of container type in the future, it is important to compare the investment and operating costs of the solutions.
A variant with semi-underground containers (Variant II) was proposed for the Uroczysko district and compared with the currently operating system (Variant I), i.e., WCPs. A reduction in the WCPs number was taken into consideration (Table 7). For the analysis, the materials provided by [27,35,38] were used.
The analysis employed universal criteria that should be met by the variant selected. They cannot be contradictory and they must be consistent, exhaustive and give adequate assessment [39]. Economic criteria that are usually considered include, among others, one-off investment costs and running operational, technical, environmental and community costs. The variants could be evaluated on the basis of available data. As a result, the investment and operating costs of the proposed solutions were used in the analysis.
The investment outlays amounted to a very high value for Variant II, i.e., 1,830,301.90 PLN, which constituted 84.02% of the total costs (Table 7). Semi-underground containers involve high costs because they are modern, innovative and must be produced from high-quality materials. With respect to operational costs for Variant II, annual costs of collection, transport, recovery and disposal of municipal waste were the highest, namely 327,210.00 PLN (15.02% of total costs). This is also the case for Variant I, for which municipal waste collection, transport, recovery and disposal were the most expensive. With the value of 705,840.50 PLN, however, they constituted 73.83% of total costs.
Investment outlays for Variant I amounted to 172,200.00 PLN (18.01% of total costs). This is explained by the fact that the extension concerned only two out of the 26 bin shelters located in the Uroczysko district. With Variant II, however, all indicated costs cover changes to 26, i.e., all, bin shelters. In both variants, the container insurance costs were the lowest: 15.00 PLN and 5200.00 PLN (0.002% and 0.239% of total costs, respectively). In the operating costs structure, the largest share, as was the case with the total costs structure, was taken by annual costs of collection, transport, recovery and disposal of municipal waste: over 90.05%—Variant I and over 94.02%—Variant II.
Having discussed quantitative (measurable) evaluation criteria, it is necessary to account for qualitative (non-measurable) criteria. They include functionality, modernity, comfort, environmental performance and aesthetics. With respect to those criteria, Variant II is unrivalled. The features of Variant II offer an advantage over any other solutions. The most important characteristics include high efficiency in a small space, a large part of the installation being hidden underground, ease of use (e.g., for people in wheelchairs), possibility of using reclaimed space (e.g., for parking, green areas or recreational use), flexibility of the solution, aesthetics and design. It is important that this solution builds flexibility into the system, because at some point it may be necessary to adapt quickly to changes resulting from national or European legislation, or rapid population growth.
Undoubtedly, Variant II provides many benefits. However, the investment generates high costs. It might be possible to co-fund the project from the EU’s Financial Perspective for 2021–2027 [40]. Within Objective 2: A greener, low-carbon Europe, a specific objective was identified: waste management and effective use of resources. The planned measures concern the prevention and reduction of waste generation, and the results should produce improvement in municipal waste management efficiency. Funding can be applied for under the European Fund for Infrastructure, Climate, Environment (FEnIKS), the European Fund for Eastern Poland (FEPW) and the Regional Operational Programme for the Świętokrzyskie Voivodeship.
In conclusion, further processing and possibilities of disposal, recycling and re-use of municipal waste depend on how the collection is organised. The target variant with semi-underground containers proposed in this study may be considered as a guideline for the construction of a modern, effective, environmentally and people-friendly waste management system, especially in the context of energy transformation within the European Green Deal. Generally, a well-designed municipal waste management system based on waste segregation must be embedded into the sustainable development concept and environmental protection principles. It should be remembered, however, that the system cannot operate without the participation of an educated local community. As a result, the effects of the investment outlays may be visible only sometime after the start of the project.

4. Conclusions

Waste management, especially municipal waste management, is one of the tools in the movement towards a closed-loop economy. Selective waste collection undoubtedly contributes to changing the consumption model. The five-container waste collection system currently operated in Poland requires not only the involvement of the system users but also adequately preparation of the WCPs. In an urban district with multi-family buildings, the residents face problems with selective collection resulting, among others, from insufficient number of above-ground containers. A solution could be to substitute above-ground containers in the WCPs with semi-underground containers. This investment will cost 1,830,301.90 PLN, which may not be a priority during the COVID-19 pandemic. A change in the number of containers is a cheaper option. Additionally, this can be done in stages. They could be adjusted to residents’ level of involvement in selective collection of municipal waste. The authors believe they will continue research into this subject. This will include the analysis of stages of the process of changing the number and type of containers.

Author Contributions

Conceptualization, J.L., D.M. and A.K.; methodology, J.L., D.M. and A.K.; software, J.L., D.M., A.K. and R.K.; formal analysis, J.L., D.M. and A.K.; investigation, J.L., D.M. and A.K.; resources, A.K and D.M.; writing—original draft preparation, J.L., D.M. and A.K.; writing—review and editing J.L., D.M.; visualization, J.L., A.K. and R.K. All authors have read and agreed to the published version of the manuscript.

Funding

The APC was funded by the Programme of the Polish Ministry of Science and Higher Education—the Regional Initiative of Excellence financed by the Polish Ministry of Science and Higher Education on the basis of the contract no 025/RID/2018/19 of 28 December 2018; the amount of funding: 12 million PLN.

Institutional Review Board Statement

Not applicable.

Informed Consent Statement

Not applicable.

Data Availability Statement

Not applicable.

Acknowledgments

The authors would like to thank Sławomir Kobiela, President of Polskie Pojemniki Sp. z o.o., for providing the data used to perform part of calculations in this study.

Conflicts of Interest

The authors declare no conflict of interest.

References

  1. Hosseinian, A.; Ylä-Mella, J.; Pongrácz, E. Current Status of Circular Economy Research in Finland. Resources 2021, 10, 1–16. [Google Scholar] [CrossRef]
  2. Raftowicz-Filipkiewicz, M. Circular economy—The challenge and necessity of sustainable development. Stud. Work. Fac. Econ. Manag. 2015, 40, 145–154. [Google Scholar]
  3. Alnajem, M.; Mostafa, M.M.; El Melegy, A.R. Mapping the first decade of circular economy research: A bibliometric network analysis. J. Ind. Prod. Eng. 2021, 38, 29–50. [Google Scholar]
  4. European Commission. Closing the Loop—An EU Action Plan for the Circular Economy; European Commission: Brussels, Belgium, 2015. [Google Scholar]
  5. Bień, B.; Bień, J.D. Collection and selective collection of municipal solid waste. Eng. Prot. Environ. 2010, 3, 173–183. [Google Scholar]
  6. Latosińska, J. Maintaining Cleanliness and Order in the Commune; Kielce University of Technology: Kielce, Poland, 2013; pp. 15–71. [Google Scholar]
  7. Alwaeli, M. Recykling surowców wtórnych z odpadów komunalnych. Arch. J. Waste Manag. Environ. Prot 2005, 1, 43–54. [Google Scholar]
  8. Directive (EU) 2018/851 of the European Parliament and of the Council of 30 May 2018 Amending Directive 2008/98/EC on Waste. Available online: http://data.europa.eu/eli/dir/2018/851/oj (accessed on 18 June 2021).
  9. Environmental Law (J.L. 2001 No. 62, item.627). Available online: https://isap.sejm.gov.pl/isap.nsf/download.xsp/WDU20010620627/U/D20010627Lj.pdf (accessed on 17 June 2021).
  10. Waste Act (J.L. 2013 No.0, item. 21). Available online: https://isap.sejm.gov.pl/isap.nsf/download.xsp/WDU20130000021/O/D20130021.pdf (accessed on 17 June 2021).
  11. Act on Maintaining Cleanliness and Order in Municipalities (J. L. 1996 No.132, item. 622). Available online: https://isap.sejm.gov.pl/isap.nsf/download.xsp/WDU19961320622/U/D19960622Lj.pdf (accessed on 20 June 2021).
  12. The Municipal Economy Act (J.L. 1997 No.9, item. 43). Available online: https://isap.sejm.gov.pl/isap.nsf/download.xsp/WDU19970090043/U/D19970043Lj.pdf (accessed on 20 June 2021).
  13. Regulation of the Minister of the Environment on the Detailed Method of Selective Collection of Selected Waste Fractions, (J. L. 2017, No.0, item.19). Available online: https://isap.sejm.gov.pl/isap.nsf/download.xsp/WDU20170000019/O/D20170019.pdf (accessed on 20 May 2021).
  14. Eurostat. Available online: https://ec.europa.eu/eurostat/databrowser/view/cei_wm011/default/table?lang=en (accessed on 22 June 2021).
  15. Bank Danych Lokalnych. Available online: https://bdl.stat.gov.pl/BDL/start (accessed on 22 June 2021).
  16. Polish Apartments against the Backdrop of Europe. How Poles Live? Available online: https://www.locja.pl/raport-rynkowy/jak-mieszkaja-europejczycy,108 (accessed on 22 June 2021).
  17. Nowak, Z. Uroczysko is not a garbage dump—Action for the 40th anniversary ŚSM. Our Uroczysko Inf. Mag. Swietokrz. Hous. Assoc. 2019, 4, 7–8. [Google Scholar]
  18. Komór, A. Note on the meeting of the residents of the Uroczysko district with the housing association regarding waste management, Kielce, Poland. Unpublished work. 28 February 2020. [Google Scholar]
  19. Regulation of the Minister of the Climate and Environment on the Method of Selective Collection of Selected Fractions of Waste, (J.L.2021, No.0, item.906). Available online: https://isap.sejm.gov.pl/isap.nsf/download.xsp/WDU20210000906/O/D20210906.pdf (accessed on 28 June 2021).
  20. Kleszcz, J. Attractive bin shelter. Recycling 2017, 2, 34–35. [Google Scholar]
  21. Krawczyk, B. Five factions a year later. Communal Rev. 2019, 2, 23–25. [Google Scholar]
  22. Waste Management Plan for the Świętokrzyskie Voivodeship 2016–2022. Available online: http://bip.sejmik.kielce.pl/dopobrania/2016/4741/uchwala.nr.XXV.356.2016.pdf (accessed on 20 April 2020).
  23. Szpadt, R. Prognoza zmian w zakresie gospodarki odpadami, Narodowy Fundusz Ochrony Środowiska i Gospodarki Wodnej, Minister Środowiska, Poland. Unpublished work. 2010. [Google Scholar]
  24. Urząd Miasta Kielce—Wydział Urbanistyki i Architektury—Biuro Planowania Przestrzennego. Available online: http://www.um.kielce.pl/organizacja-urzedu-miasta/wydzialy2019/wydzial-urbanistyki-i-architektury/ (accessed on 20 April 2020).
  25. Uchwała nr XXI/409/2019 Rady Miasta Kielce z Dnia 28 Listopada 2019 r. w Sprawie Regulaminu Utrzymania Czystości i Porządku na Terenie Miasta Kielce (Dziennik Urzędowy Województwa Świętokrzyskiego poz. 4716). Available online: http://www.um.kielce.pl/gfx/kielce2/userfiles/files/odpady_komunalne/prawo/styczen_2020/uchwala_nr_xxi_409_2019_rady_miasta_kielce_z_dnia_28_listopada_2019_r..pdf (accessed on 20 April 2020).
  26. Świetokrzyska Housing Association. Available online: www.ssmkielce.pl (accessed on 20 April 2020).
  27. Unpublished materials provided by Świętokrzyska Housing Association, Kielce, Poland. Unpublished work. 2020.
  28. Equipping the Property with a Container. Available online: http://www.um.kielce.pl/swiadczone-uslugi/wyposazenie-w-pojemnik (accessed on 21 April 2020).
  29. Polski Czerwony Krzyż. Available online: https://pck.pl/pomoc-i-opieka/tekstylia/ (accessed on 20 April 2020).
  30. Opęchowski, S. Rules for Determining the Number and Type of Containers for Municipal Waste Collection, Including Selective Collection, and the Frequency of Emptying Them; Guide; OBREM: Łódź, Poland, 2006; pp. 1–23. [Google Scholar]
  31. Makoudi, S.; Staszczak, J.; Klojzy-Kaczmarczyk, B. Verification of the System of Selective Collection of Municipal Waste in Multi-Ousing on the Example of a Model Area; Institute of Mineral and Energy Economy of the Polish Academy of Sciences: Cracow, Poland, 2014; Volume 87, pp. 149–162. [Google Scholar]
  32. Waste Containers. Available online: www.ese.com (accessed on 20 April 2020).
  33. Waste Containers. Available online: www.eco-market.pl (accessed on 22 June 2021).
  34. Brzezińska, N.; Trun, K. Waste goes underground—Underground waste management systems. Ind. Transp. Work. Mach. 2018, 4, 66–69. [Google Scholar]
  35. Company-Provided Materials by Polskie Pojemniki Sp. z o.o. Available online: http://ppbin.com/ (accessed on 22 June 2021).
  36. Ziora, J.; Pasko, B. Waste Management in the Face of New Challenges. Available online: https://www.silesia.org.pl/upload/files/Dominika/publikacja_Gospodarka_odpadami_w_obliczu_nowych_wyzwa___11_06_18_final.pdf (accessed on 10 June 2021).
  37. Wąsowicz, K.; Famielec, S.; Chełkowski, M. Municipal Waste Management in Modern Cities; Foundation of the University of Economics in Krakow, Technical University of Kraków: Krakow Poland, 2018; pp. 143–146. [Google Scholar]
  38. Unpublished materials provided by Górczyn Housing Cooperative in Gorzów Wielkopolski, Gorzów Wielkopolski, Poland. Unpublished work. 23 June 2021.
  39. Generowicz, A.; Iwanejko, R. Possibilities of conducting selective collection of municipal waste with a partially uncertain market situation—Technical foundations and possibilities of segregation solutions. J. Civil. Eng. Environ. Archit. JCEEA 2017, XXXIV, 183–197. [Google Scholar]
  40. European Funds Portal. Available online: https://www.funduszeeuropejskie.gov.pl/strony/o-funduszach/fundusze-na-lata-2021-2027/dowiedz-sie-wiecej-o-funduszach-europejskich-na-lata-2021-2027/ (accessed on 21 June 2021).
Figure 1. Kielce city and the Uroczysko district location on the map.
Resources 10 00083 g001
Figure 2. Example of waste collection point: (a)—WCP14; (b)—detail of container for metal and plastics.
Resources 10 00083 g002
Figure 3. Current and calculated number of above-ground containers for separate collection of paper.
Resources 10 00083 g003
Figure 4. Current and calculated number of above-ground containers for separate collection of metal and plastic fractions.
Resources 10 00083 g004
Figure 5. Current and calculated number of above-ground containers for separate collection of glass.
Resources 10 00083 g005
Figure 6. Current and calculated number of above-ground containers for selective collection of bio-waste fraction.
Resources 10 00083 g006
Figure 7. Current and calculated number of above-ground containers for selective collection of mixed waste fraction.
Resources 10 00083 g007
Figure 8. Fill rate in the current number of above-ground containers for separate collection of paper; Lack of the WCP1 on the list results from the absence of above-ground containers for paper collection at present. *—current frequency of waste collection.
Resources 10 00083 g008
Figure 9. Fill rate of the current number of above-ground containers for collection of metal and plastic fractions; *—current frequency of waste collection.
Resources 10 00083 g009
Figure 10. Fill rate of the current number of containers for glass collection; *—current frequency of waste collection.
Resources 10 00083 g010
Figure 11. Fill rate of the current number of above-ground containers for bio-waste collection; *—current frequency of waste collection; 14-day time interval—waste collection in winter; 7-day time interval—waste collection in summer.
Resources 10 00083 g011
Figure 12. Fill rate of the current number of above-ground containers for collection of the mixed waste fraction; *—current frequency of waste collection.
Resources 10 00083 g012
Table 1. Method of selective collection of municipal waste in Poland in accordance with [13,19].
Waste Fraction/Container Colour Coding Waste Types
Paper/bluePaper packaging, cardboard, paperboard, catalogues, leaflets, brochures, newspapers, magazines, school and office paper, printed sheets, notebooks and books, wrapping paper, paper bags and sacks
Glass/greenDrinks and food bottles and jars, cosmetics glass packaging
Metals and plastics/yellow Unscrewed and squashed plastic drinks bottles, bottle tops, plastic food packaging, multi-material packaging, cleaning product packaging, plastic bags, sacks, carrier bags, aluminium drinks and juice cans, food tins, aluminium foil, non-ferrous metals, bottle caps, jar tops and toys
Bio-degradable waste/brownVegetable and fruit waste, tree and bush branches, grass cuttings, leaves, flowers, sawdust and tree bark, food leftovers
Residual waste/blackUsed nappies; hygiene waste; other waste that cannot be placed in the other containers excluding hazardous waste
Table 2. Morphological composition of municipal waste from urban areas of the Świętokrzyskie Voivodeship, based on [22] *.
Type of WasteMorphological Composition of Municipal Waste, % Mass
Kitchen and garden waste35.33
Plastics11.30
Glass10.20
Paper and carboard9.96
Fraction < 10 mm6.72
Waste from green areas5.35
Other waste 4.90
Textiles4.15
Multi-material waste4.07
Mineral waste2.92
Bulky waste2.62
Metals1.47
Hazardous waste0.70
Wood0.32
* The obligatory document “The Waste Management Plan for the Świętokrzyskie Voivodeship”, which was adopted by Resolution No. XXV/356/16 by the Regional Assembly of The Świętokrzyskie Voivodeship of 27 July 2016. In [22] the authors used the information presented in [23].
Table 3. Summary of residential buildings and number of inhabitants assigned to the WCP on base [27].
WCP NumberNumber of InhabitantsNumber of Residential Buildings/Building Category
14823/low-rise + 1/high-rise
21781/low-rise
31191/low-rise
42511/high-rise
52571/high-rise
62571/high-rise
74251/high-rise
83413/low-rise
91952/low-rise
102062/low-rise
112853/low-rise
121371/low-rise
133192/low-rise
143103/low-rise
153083/low-rise
16891/low-rise
171432/low-rise
181792/low-rise
192631/low-rise + 1/high-rise
202713/low-rise
211221/high-rise
222422/high-rise
231221/high-rise
242533/low-rise
252623/low-rise
26691/low-rise
Table 4. Number of above-ground containers in the WCPs as of 1 March 2020 [27].
Number WCPNumber of Above-Ground Containers
Mixed WasteMetals and PlasticsGlassPaperBio-Waste
162101
2 *53111
393122
4 *43111
593111
652111
773211
862111
993111
1032211
1173122
1243111
1362121
14 *73111
1542111
1642211
17 *42121
1852111
1942111
20 *63221
2143211
2252111
23 *33211
24 *63211
2562111
2621111
Total14064333028
*—WCP to which an on-site visit was made.
Table 5. Current and proposed number of 1.1 m3 capacity above-ground containers.
WCP NumberMixed WasteMetals and PlasticsGlassBio-WastePaperTotal CNC *Total
PNC **
CNC *PNC **CNC *PNC **CNC *PNC **CNC *PNC **CNC *PNC **
163231311041014
25331111111117
395311122211710
44232121112109
595321211121512
653221211121010
774332311131414
863221211131111
99531111111159
10322121111297
1174321222221512
124231111111106
1363221211221210
1474321211121311
15422212111299
164221211111106
174221111121106
185321111111107
19422212111299
2063322211221410
214231211111116
225321121112109
233231211111106
2463322211121310
2563221211121110
26211111111165
Total20811210064566743434770454356
* CNC—current number of above-ground containers; ** PNC—proposed number of above-ground containers.
Table 6. Proposed number of semi-underground containers.
WCP Number Mixed WasteMetals and PlasticsPaperGlassBio-Waste
11 (3)1 (5) + 1 (3)1 (5) + 1 (3)1 (5) + 1 (3)2 (5)
21 (1.5)1 (3)1 (3)1 (3)1 (5)
31 (1.5)1 (3)1 (3)1 (3)1 (3)
41 (1.5)1 (5)1 (5)1 (5)1 (5)
51 (1.5)1 (5)1 (5)1 (5)1 (5)
61 (3)1 (5) + 1 (3)1 (5) + 1 (1.5)1 (5) + 1 (1.5)1 (5) + 1 (3)
71 (1.5)1 (5)1 (5)1 (5)1 (5)
81 (1.5)1 (5)1 (5)1 (3)1 (5)
91 (3)1 (5) + 1 (1.5)1 (5)1 (5)1 (5) + 1 (1.5)
101 (1.5)1 (5)1 (3)1 (3)1 (5)
111 (1.5)1 (5)1 (5)1 (5)1 (5) + 1 (1.5)
121 (1.5)1 (3)1 (3)1 (3)1 (3)
131 (1.5)1 (5)1 (5)1 (5)1 (5) + 1 (1.5)
141 (1.5)1 (5)1 (5)1 (5)1 (5)
151 (1.5)1 (3)1 (3)1 (3)1 (5)
161 (1.5)1 (1.5)1 (1.5)1 (1.5)1 (3)
171 (1.5)1 (3)1 (3)1 (3)1 (5)
181 (3)1 (5) + 1 (1.5)1 (5)1 (5)1 (5) + 1 (1.5)
191 (3)1 (5)1 (5)1 (5)1 (5) + 1 (1.5)
201 (1.5)1 (1.5)1 (1.5)1 (1.5)1 (1.5)
211 (1.5)1 (5)1 (5)1 (5)1 (5)
221 (1.5)1 (3)1 (3)1 (3)1 (3)
231 (1.5)1 (5)1 (5)1 (5)1 (5)
241 (1.5)1 (3)1 (3)1 (3)1 (3)
251 (1.5)1 (5)1 (5)1 (5)1 (5)
261 (1.5)1 (5)1 (5)1 (5)1 (5)
(5)—semi-underground container with a capacity of 5.0 m3; (3)—semi-underground container with a capacity of 3.0 m3; (1.5)—semi-underground container with a capacity of 1.5 m3.
Table 7. Investment and operating costs for the above-ground containers and semi-underground containers.
Variant I Above-Ground Containers Value of Costs
(in PLN)
Variant II Semi-Underground ContainersValue of Costs
(in PLN)
Costs of extending the bin shelters (currently costs relate to the extension of 2 shelters) a172,200.00Investment costs of semi-underground containers including installation f1,830,301.90
Annual costs of collection, transport, recovery and disposal of municipal waste (2020) b705,840.50Annual costs of collection, transport, recovery and disposal of municipal waste (2020) g327,210.00
Annual costs of cleaning above-ground containers and bin shelters (charged as part of a cleaning lump sum) c78,000.00Annual costs for cleaning and disinfecting semi-underground containers h15,600.00
Annual costs of insurance of bin shelters and above-ground containers (lump sum in property property insurance arranged by the Housing Association) d15.00Annual insurance costs for semi-underground containers i5200.00
Annual costs related to environmental education of the residents in proper municipal waste practices e0.00Annual costs related to environmental education of the residents in proper municipal waste practices e0.00
SUM56,055.50SUM2,178,311.90
a—based on [27]: 70,000 PLN + 23%VAT; b—based on [27]; c—based on [27]; cost components: 0.5 h × 23 PLN/hour × 26 WCPs × 22 days × 12 month = 78,000 PLN; d—based on [27]; e—materials for residents’ environmental education provided by the City Council; f—based on [35]; the values of investment outlays were calculated based on the price list of all container types and capacities for individual fractions and the following cost components: cost of container installation—950 PLN per a container; concrete block paved area, ranging 24–29 m2, for one WCP (cost of 1 m2 approx. 170 PLN); cost of container locks and keys—140 PLN per a container; 23%VAT should be added to the net cost, which gives a total gross cost per WCP; g,i—based on [38]; h—based on [35].
Publisher’s Note: MDPI stays neutral with regard to jurisdictional claims in published maps and institutional affiliations.

