
Financial and Social Factors Influencing the Use of Unconventional Water Systems in Single-Family Houses in Eight European Countries


Department of Infrastructure and Water Management, Rzeszow University of Technology, Powstańców Warszawy 6, 35-959 Rzeszów, Poland
*
Author to whom correspondence should be addressed.
Resources 2022, 11(2), 16; https://0-doi-org.brum.beds.ac.uk/10.3390/resources11020016
Submission received: 20 December 2021
/
Revised: 26 January 2022
/
Accepted: 27 January 2022
/
Published: 29 January 2022
Abstract
:A modern model of water management should take into account, first of all, its responsible consumption of both tap water and water from unconventional sources. With this in mind, a study was conducted to determine the financial efficiency of rainwater harvesting systems (RWHSs) and greywater recycling systems (GWRSs) in residential buildings located in eight European countries. At the first stage, volumetric reliability was determined for different tank capacities for actual precipitation data. An economic analysis was carried out for six variants in which rainwater and greywater were used in various combinations for toilet flushing, washing, and garden watering. The implementation of alternative water systems was found to be financially unprofitable in four cities: Warsaw, Bratislava, Budapest, and Stockholm. For these cities, the variant with the lowest life cycle cost (LCC) level was always Variant 0, with conventional installations. The opposite situation was observed in the other four locations (Lisbon, Madrid, Rome, and Prague), where Variant 0 was not found to be financially profitable for any of the calculation cases analyzed. Additionally, a survey was conducted to determine the effect of social aspects, which is often the greatest barrier to the implementation of new or unknown technologies. In most of the countries surveyed, rainwater is more acceptable to society as an alternative water source than greywater. For hygiene reasons, the use of these two systems for washing clothes was of greatest concern.
1. Introduction
For more than the last two decades, the world has faced severe environmental problems mainly caused by climate change, urbanization, and population growth. The condition of the environment is also influenced by the overexploitation of natural resources resulting from constantly growing demand for a variety of raw materials. Increasingly frequent attention is paid to the fact that responsible exploitation and protection of natural resources are key to the existence and development of future generations [1,2]. According to Yang et al., the current international efforts to mitigate the effects of climate change may depend primarily on the level of resource use and the level of emissions in industrialized and urbanized countries [3]. Sustainable management of natural resources can be achieved by implementing environmentally friendly technologies in all sectors of the economy. This also applies to the construction sector, which uses enormous amounts of water [4,5]. It is estimated that residential buildings alone make up about 10% of the total global water demand [6]. The increasing consumption of water means that, in many countries, it is scarce and, therefore, a very valuable commodity [7].
Urbanization and industrialization are seen as the main factors that increase the degree of environmental pollution [8] and deteriorate the quality and quantity of water resources [9,10]. In addition, the availability of water resources is also significantly affected by excessive and unsustainable use of water. It is observed, inter alia, in residential buildings, where more than 50% of fresh water is consumed for purposes that do not require it to be of potable quality. In addition, world population growth at the current level of 1.1% per year is expected to increase the human population to 9.7 billion by 2050 [11], and this, according to some forecasts, will result in a 55% increase in the world’s water demand [12]. As the population grows, more buildings will also be constructed over the coming decades. The consequences of this will be especially noticeable in regions where no sustainable model of water source use is applied, or the performance of the water supply system is insufficient [13].
Reliability of water supply, regarding its accessibility, quantity, and quality [14,15], as well as protection of water resources through their proper management, is essential to support all aspects of human life and economic development. Water consumption and its availability across Europe vary greatly. This is mainly due to climatic and natural conditions, habits and customs of the inhabitants, as well as economic and cultural conditions. In Europe, water resources per inhabitant are around 6879 m3/year [16], but in many regions, water resources are lower than half of this amount, for example, in Poland, Hungary, the Czech Republic, Malta, and Cyprus. Annual water resources in Spain, Italy, Belgium, and France are determined at around 2500 m3/inhabitant [16]. Scandinavian countries have the largest water resource on the European continent. Due to the unequal availability of water resources, in many European countries, there is a problem of water scarcity either permanently or periodically.
The law regulations in force in the European Union, especially the Water Framework Directive, require water to be managed in a sustainable manner [17]. Climate changes and the changing availability of freshwater resources in Europe should also be an impulse to protect them [18]. Recent history has shown that frequent extreme droughts and floods, which may be exacerbated by a changing climate, can place additional strain on water supplies in many European countries [19]. The sustainable management of water resources is, therefore, a key issue in Europe, and to achieve this, it is necessary to put in place mechanisms and strategies to ensure the responsible use of water. Taking this into account, it is incomprehensible why so many constraints exist in the implementation of alternative water sources in Europe, which was highlighted by Cipolletta et al. [20].
In the search for unconventional sources of water that can be used in buildings, special attention has been paid to rainwater that is slightly contaminated, especially coming from the roofs of buildings [21]. Rainwater is increasingly being perceived as a valuable resource rather than waste that should be disposed of as soon as possible [22]. The methods of its management in a given place are influenced by many factors, including technical, environmental, social, and political aspects [23,24]. A sustainable model of rainwater management should be based on its retention, infiltration, and, above all, economic use [25,26,27].
Rainwater can replace fresh water, both for consumption and for non-potable uses [28,29]. The possibilities of implementing rainwater harvesting systems (RWHSs) in buildings have been widely explored throughout the world. Researchers have considered different types of buildings, for example, office buildings [30,31], single-family homes [32,33], multistory residential buildings [34], university facilities [35], schools [36], dormitories [37], sports facilities [38], airports [39], petrol stations [40] and hospitals [41]. Treated rainwater is mainly used as non-potable water for toilet flushing [42,43], watering and irrigation [44,45], household cleaning, washing [46,47], and car washing [40]. In developing countries, and in regions where main water supply networks could not be designed, rainwater is a valuable source of drinking water [36].
Apart from rainwater, greywater also offers significant opportunities for saving tap water in buildings [48]. In addition, according to the idea of sustainable development, greywater recycling systems (GWRSs) reduce the burden on wastewater treatment plants and are seen as one of the fundamental elements of water source management [49]. Treated greywater is used mainly for toilet flushing and garden watering [50], and sometimes, in hybrid systems together with rainwater [51,52]. GWRSs are used in residential buildings [53], office buildings [54], schools and universities [55,56], and airports [57].
A literature review of research on RWHSs and GWRSs showed that this subject has, thus far, received limited interest in Europe. It can be seen that these systems are implemented quite rarely, and research into their performance and profitability of use has been conducted on a smaller scale than, for example, in Australia, Brazil, or Japan. The analysis of the research results published so far has shown that designing rainwater harvesting systems and greywater recycling systems is not an easy issue, because the effectiveness of these systems is influenced by many factors. The most important of these include the amount of rainfall, the type of building, and the related water demand, as well as the purchase price of water. Acceptance by society is also important. Therefore, research was carried out to determine the hydraulic and financial efficiency of alternative water systems located in eight European countries. Moreover, survey research was conducted in these countries, and its purpose was to learn about awareness and opinions among the public on the use of rainwater and wastewater as unconventional water sources. Considering that RWHSs and GWRSs are not very popular solutions in many European countries, this investigation is very important since public acceptance can be of decisive significance in the implementation of unconventional solutions in the construction industry. The financial analysis, for which the life cycle cost method was applied, reveals research results of scientific character but also practical. The research results presented in this paper may be useful to investors, designers, and decision makers, at an early stage of investment planning and developing water management strategies in urban areas. The novel contribution to the research published so far is the discovery of the hydraulic and financial aspects, as well as the social aspects of using alternative water systems and their comparison in different locations in Europe.
2. Materials and Methods
2.1. Installation Variants
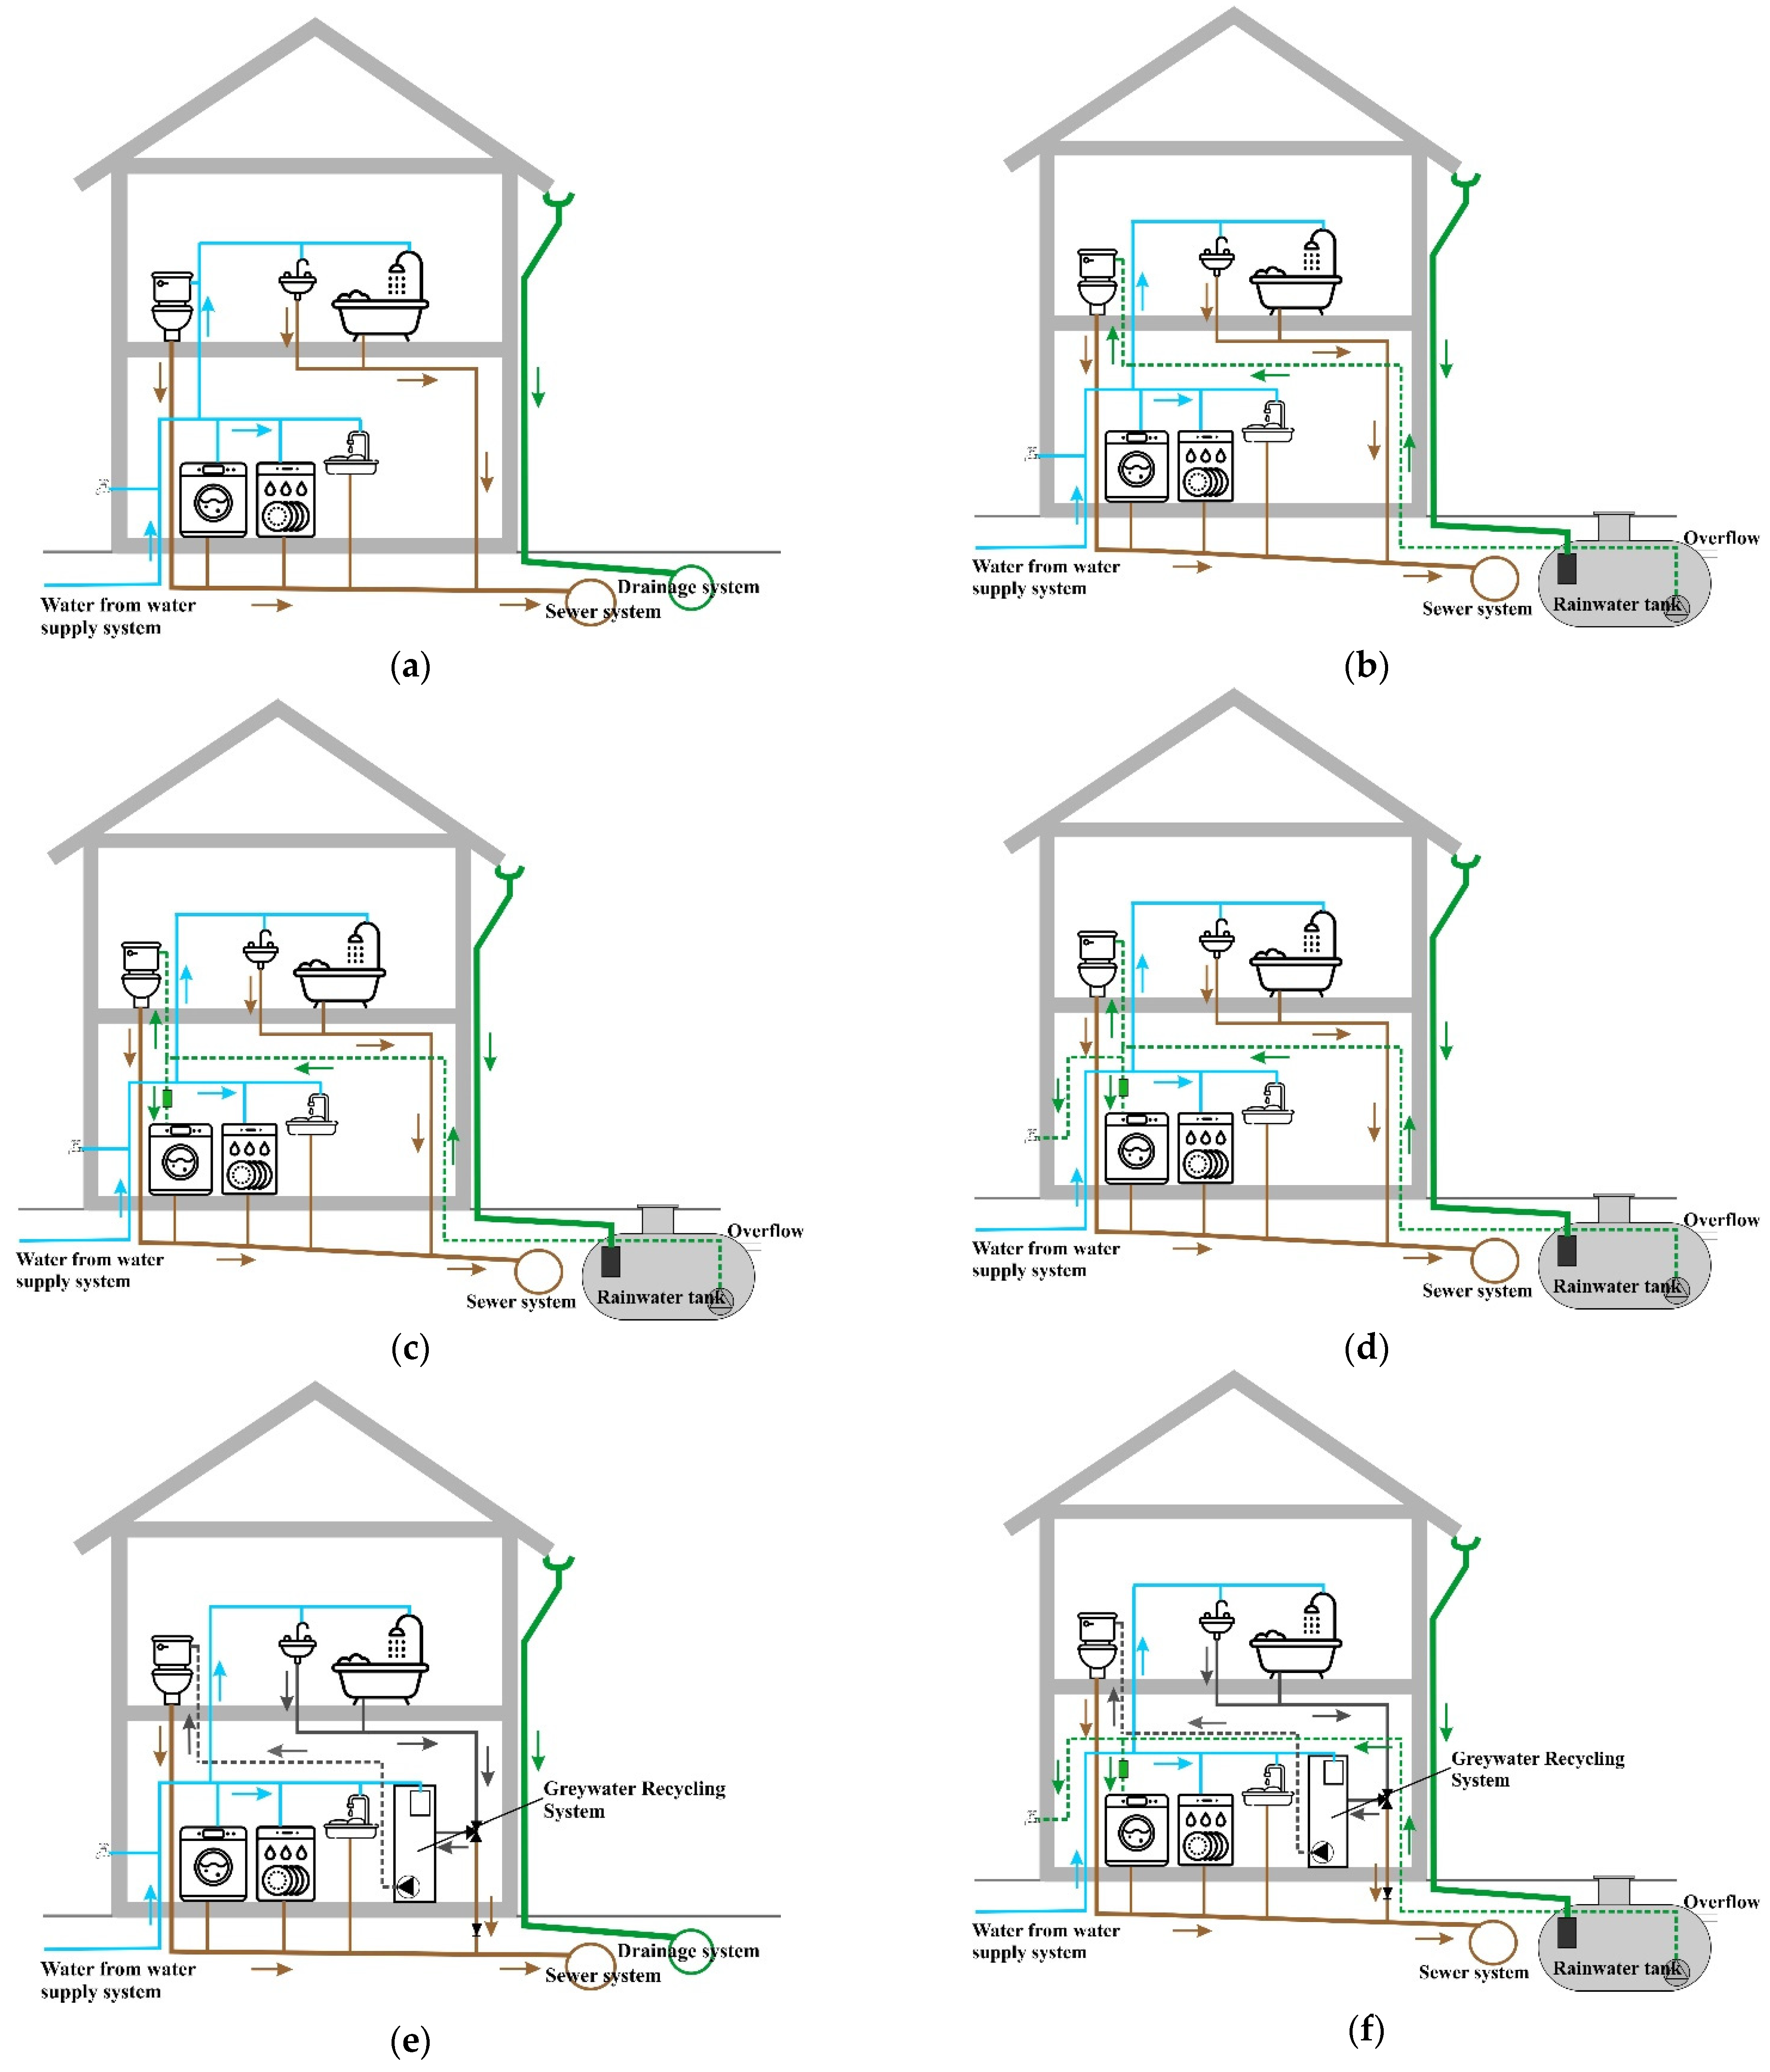
In this paper, there were selected water-saving scenarios that took into account the guidelines for human health and safety and the opinions of the society expressed in surveys conducted in selected European countries (Section 3.3). This research is based on the assumption that rainwater and greywater will be used in the analyzed buildings only as non-potable water. The RWHS was designed as an alternative water source for toilet flushing, washing, and garden watering, while GWRS was intended to be used only for toilet flushing. Survey research has shown that the respondents had the greatest concerns about using greywater for washing. Taking into account the content of certain substances in wastewater and their possible negative impact on vegetation in a garden, this wastewater was also not considered for garden watering. Environmental Protection Agency’s guidelines for the reuse of greywater recommend not to use treated wastewater for domestic use other than toilet flushing and subsurface irrigation. [58,59]. According to the discussion above, the following installation variants were accepted for testing:
- Variant 0—traditional solution of installations (Figure 1a);
- Variant 1—rainwater harvesting system implemented only for toilet flushing (Figure 1b);
- Variant 2—rainwater harvesting system implemented for toilet flushing and washing (Figure 1c);
- Variant 3—rainwater harvesting system implemented for toilet flushing, washing, and garden watering (Figure 1d);
- Variant 4—greywater recycling system implemented for toilet flushing (Figure 1e);
- Variant 5—rainwater harvesting system used for washing and garden watering and a greywater recycling system for toilet flushing (Figure 1f).
2.2. Model Descriptions
For research on RWHS efficiency, the simulation model by Słyś [60] was applied. In the model, the calculation algorithm based on the YAS operating rule was used. It is the same as recommended in the standard EN 16941-1:2018 [61]. The tanks used in the analyzed rainwater harvesting systems were closed. Therefore, the simulation model ignored the evaporation of water and precipitation onto the water surface in the tank. Thus, the daily balance equation that was used in the model assumed the form (1). The quantity of runoff It was calculated from Equation (2).
where ψ is runoff coefficient, and A is the roof area (m2).
Similar to the simulation models of other researchers [62,63], the quality of rainwater was not taken into account in the used model.
Daily demand for non-potable water D was estimated in terms of the number of inhabitants, unit water consumption for particular purposes, and the area of the garden. This demand was determined from Equation (3) for Variant 1, Equation (4) for Variant 2, and Equation (5) for Variant 3.
where Oc is the number of occupants; qt is water consumption for toilet flushing per day (dm3/person); qw is water consumption in washing machines per day (dm3/person); qg is water consumption for garden watering per day (dm3/m2); Gs is garden surface (m2).
The optimal tank capacity was adopted on the basis of the volumetric reliabilities Vr. It was assumed that the capacity of the tank would be optimal when its further increase in the calculations resulted in changes in volumetric reliability no more than 1%. Vr was determined from Equation (6).
where Vr is the volumetric reliability of RWHS (%); Yt is the yield from storage during time interval t (m3); Dt is the water demand during time interval t (m3).
The efficiency of greywater recycling systems results mainly from the water demand for non-potable uses and the amount of wastewater supplied to the tank in this system. In this study, it was assumed that greywater from bathing, or bathing, and handwashing would be fed to a treatment system, and then, the treated wastewater would be transported to toilets. These systems differ in the points at which greywater is collected and used. This was due to the different unit water consumptions for particular purposes in the cities under study. The efficiency of the greywater recycling system was calculated from Equation (7) or (8).
where YG1 is the greywater inflow to the tank for systems installed in Lisbon, Rome, Madrid, and Stockholm (dm3/day); YG2 is the greywater inflow to the tank for systems installed in Bratislava, Budapest, Prague, and Warsaw (dm3/day); qs is water consumption for showering or bathing per day (dm3/person); qh is water consumption for handwashing per day (dm3/person).
The number of occupants Oc and water consumption for bathing qs and washing hands qh determine the inflow of greywater to the tank. These are usually constant amounts, which change slightly under certain conditions. Due to the fact that greywater was used only for toilet flushing, its daily requirement was determined from Equation (3).
2.3. Life Cycle Cost Analysis
The life cycle cost methodology was used to determine the financial indicators of selected variants of the installations. This methodology takes into account the initial capital costs (ICCs) as well as utility costs (UCs) and disposal costs (DCs) [64]. In this paper, the LCC analysis was performed using Equation (9). DC costs were not included in the financial analysis. Such an assumption is consistent with the guidelines [65] as well as with the research of other authors [66].
where UCt—utility costs in a year t (EUR); T—the number of years of the system’s existence; r—constant discount rate.
2.4. Survey Research
The public opinion research was conducted with the use of questionnaires, sent mainly by the Internet. This method of obtaining the samples was chosen because it is flexible and allows collecting a large amount of information. Personal surveys are expensive and very time consuming [67]. An online questionnaire was prepared in Google Form in Polish (research conducted in Poland) and English (research conducted in other seven countries) and was sent to the respondents in 2019. A similar test method was chosen, for example, by [68,69]. The questionnaire consisted of 10 questions: 4 general and 6 concerning the possibilities of saving water and rainwater and greywater systems (Figure 2). Taking into account the research subject, the statistical units for the research sample were chosen in a deliberate way. The survey results were developed in the Statistical Package for Social Sciences (SPSS). It is a common tool for statistical analysis, in medical and social research, as well as technical sciences [70]. The survey results enabled the calculation of non-measurable statistical features; therefore, the significance of differences between qualitative variables was determined using the Pearson test (chi-squared test) of independence. Its value was calculated using Equation (10). In statistical tests, the significance index was assumed to be lower than 0.05. This assumption is the same as in other publications, for example, [71].
where Oi—observed value; Ei—expected value.
2.5. Case Study
Research on the possibility of using rainwater and greywater was conducted for single-family homes located in eight European cities. These were the capitals of the following countries: Poland, The Czech Republic, Slovakia, Hungary, Spain, Italy, Sweden, and Portugal. The research focused mainly on small buildings because more than 34% of Europeans live in single-family houses. In Poland, Hungary, and Slovakia, it is over 50% [72].
2.5.1. The Data Used in RWHS Hydraulic Model
A simulation study of an RWHS model was carried out using historical daily precipitation data measured at meteorological stations located in the analyzed cities. They were 10-year precipitation data (2003–2012), whose annual sums are summarized in Table 1. It was decided to use this period for the study because the length of a precipitation series of 10 years or more leads to results similar to those for longer time series, which is confirmed by the research of other scientists [73,74].
The efficiency of systems using rainwater is mainly determined by parameters such as roof area, rainfall, tank capacity, and demand for water of lower quality [75]. These parameters were included in the efficiency analysis of rainwater harvesting systems located in different cities. The research was carried out using the data shown in Table 2. The roof area in houses is usually between 100 m2 and 200 m2; hence, an average roof size of 150 m2 was used in the calculations. The volumetric reliability of rainwater tanks was calculated for common tanks of sizes ranging from 1 m3 to 21 m3 offered by European producers. The demand for rainwater resulted from the assumed water saving scenarios.
The amount of water used for watering green spaces depends on the type of soil and frequency of rainfall [76]. When analyzing these conditions and the literature data available, the unit irrigation water demand, along with the frequency and period during the year when this procedure was performed for the buildings under study [77,78,79], was adopted. It was assumed that in Warsaw, Prague, Bratislava, Budapest, and Stockholm, gardens would be watered for four months from June to September, whereas in Madrid, Lisbon, and Rome, watering gardens would also occur in May. Taking into account the density of buildings in the largest European cities and the availability of space for domestic gardens, the average area of green space for watering with rainwater was determined.
2.5.2. Input Data for GWRS Calculations
The optimum efficiency of greywater recycling systems should be designed considering the peak capacity treatment rate, demand for greywater, and habits of the users of the installation [80]. It is advisable that the retention time of treated wastewater is minimized by storing only the amount needed for immediate use. Keeping untreated greywater should be avoided, while treated wastewater is most often stored in a tank for one day. Taking these guidelines into account, a greywater recycling system was designed with the assumption that the performance of this system results only from the treated greywater demand, and the excess of greywater will be directed to the sewer system. Therefore, GWRSs were selected to ensure the constant performance of the system, which was established on the basis of the need for treated greywater. Table 3 contains the data used for these calculations.
2.5.3. Data Used in the LCC Analysis
The financial analysis takes into account the expenditure incurred for the execution of the traditional water and sewage installation in a building (ICC0). Additionally, options 1, 2, and 3 include the costs of RWHS, whereas option 4 indicates the costs of installing GWRS. Option 5 includes installation costs for both alternative solutions.
In all of the options of the installations under study, utility costs were calculated. These were the fees incurred each year for the purchase of tap water and the costs of discharging sanitary sewage into the network. Additionally, in cities where fees for the discharge of rainwater to the sewage system were enforced, they were included in the calculations. Unit prices were established for these services on the basis of information provided by water companies from the selected European cities. Operating costs of variants of installations with unconventional water sources also included charges for electricity consumed during pumping of rainwater and greywater from tanks to their use points. These options also took into account the costs of replacing pumps and filters, in line with the manufacturers’ recommendations. The GWRS, which was used in this study, is a professional solution with advanced cleaning and disinfection methods. The cost of the rainwater harvesting systems was dependent on the tank capacity. On the basis of volumetric reliability, rainwater harvesting systems intended for small buildings and offered by European producers were selected with capacities from 1 m3 to 11 m3. A discount rate of 5% was adopted in the research, similarly to other researchers [81,82,83]. The financial analysis also takes into account the annual increase in unit prices. To account for the service life of currently used installation materials, the length of the LCC analysis was determined as T = 30 years. The data used to calculate the LCC costs are presented in Table 4 and Table 5.
3. Results and Discussion
3.1. Efficiency of Systems with Rainwater
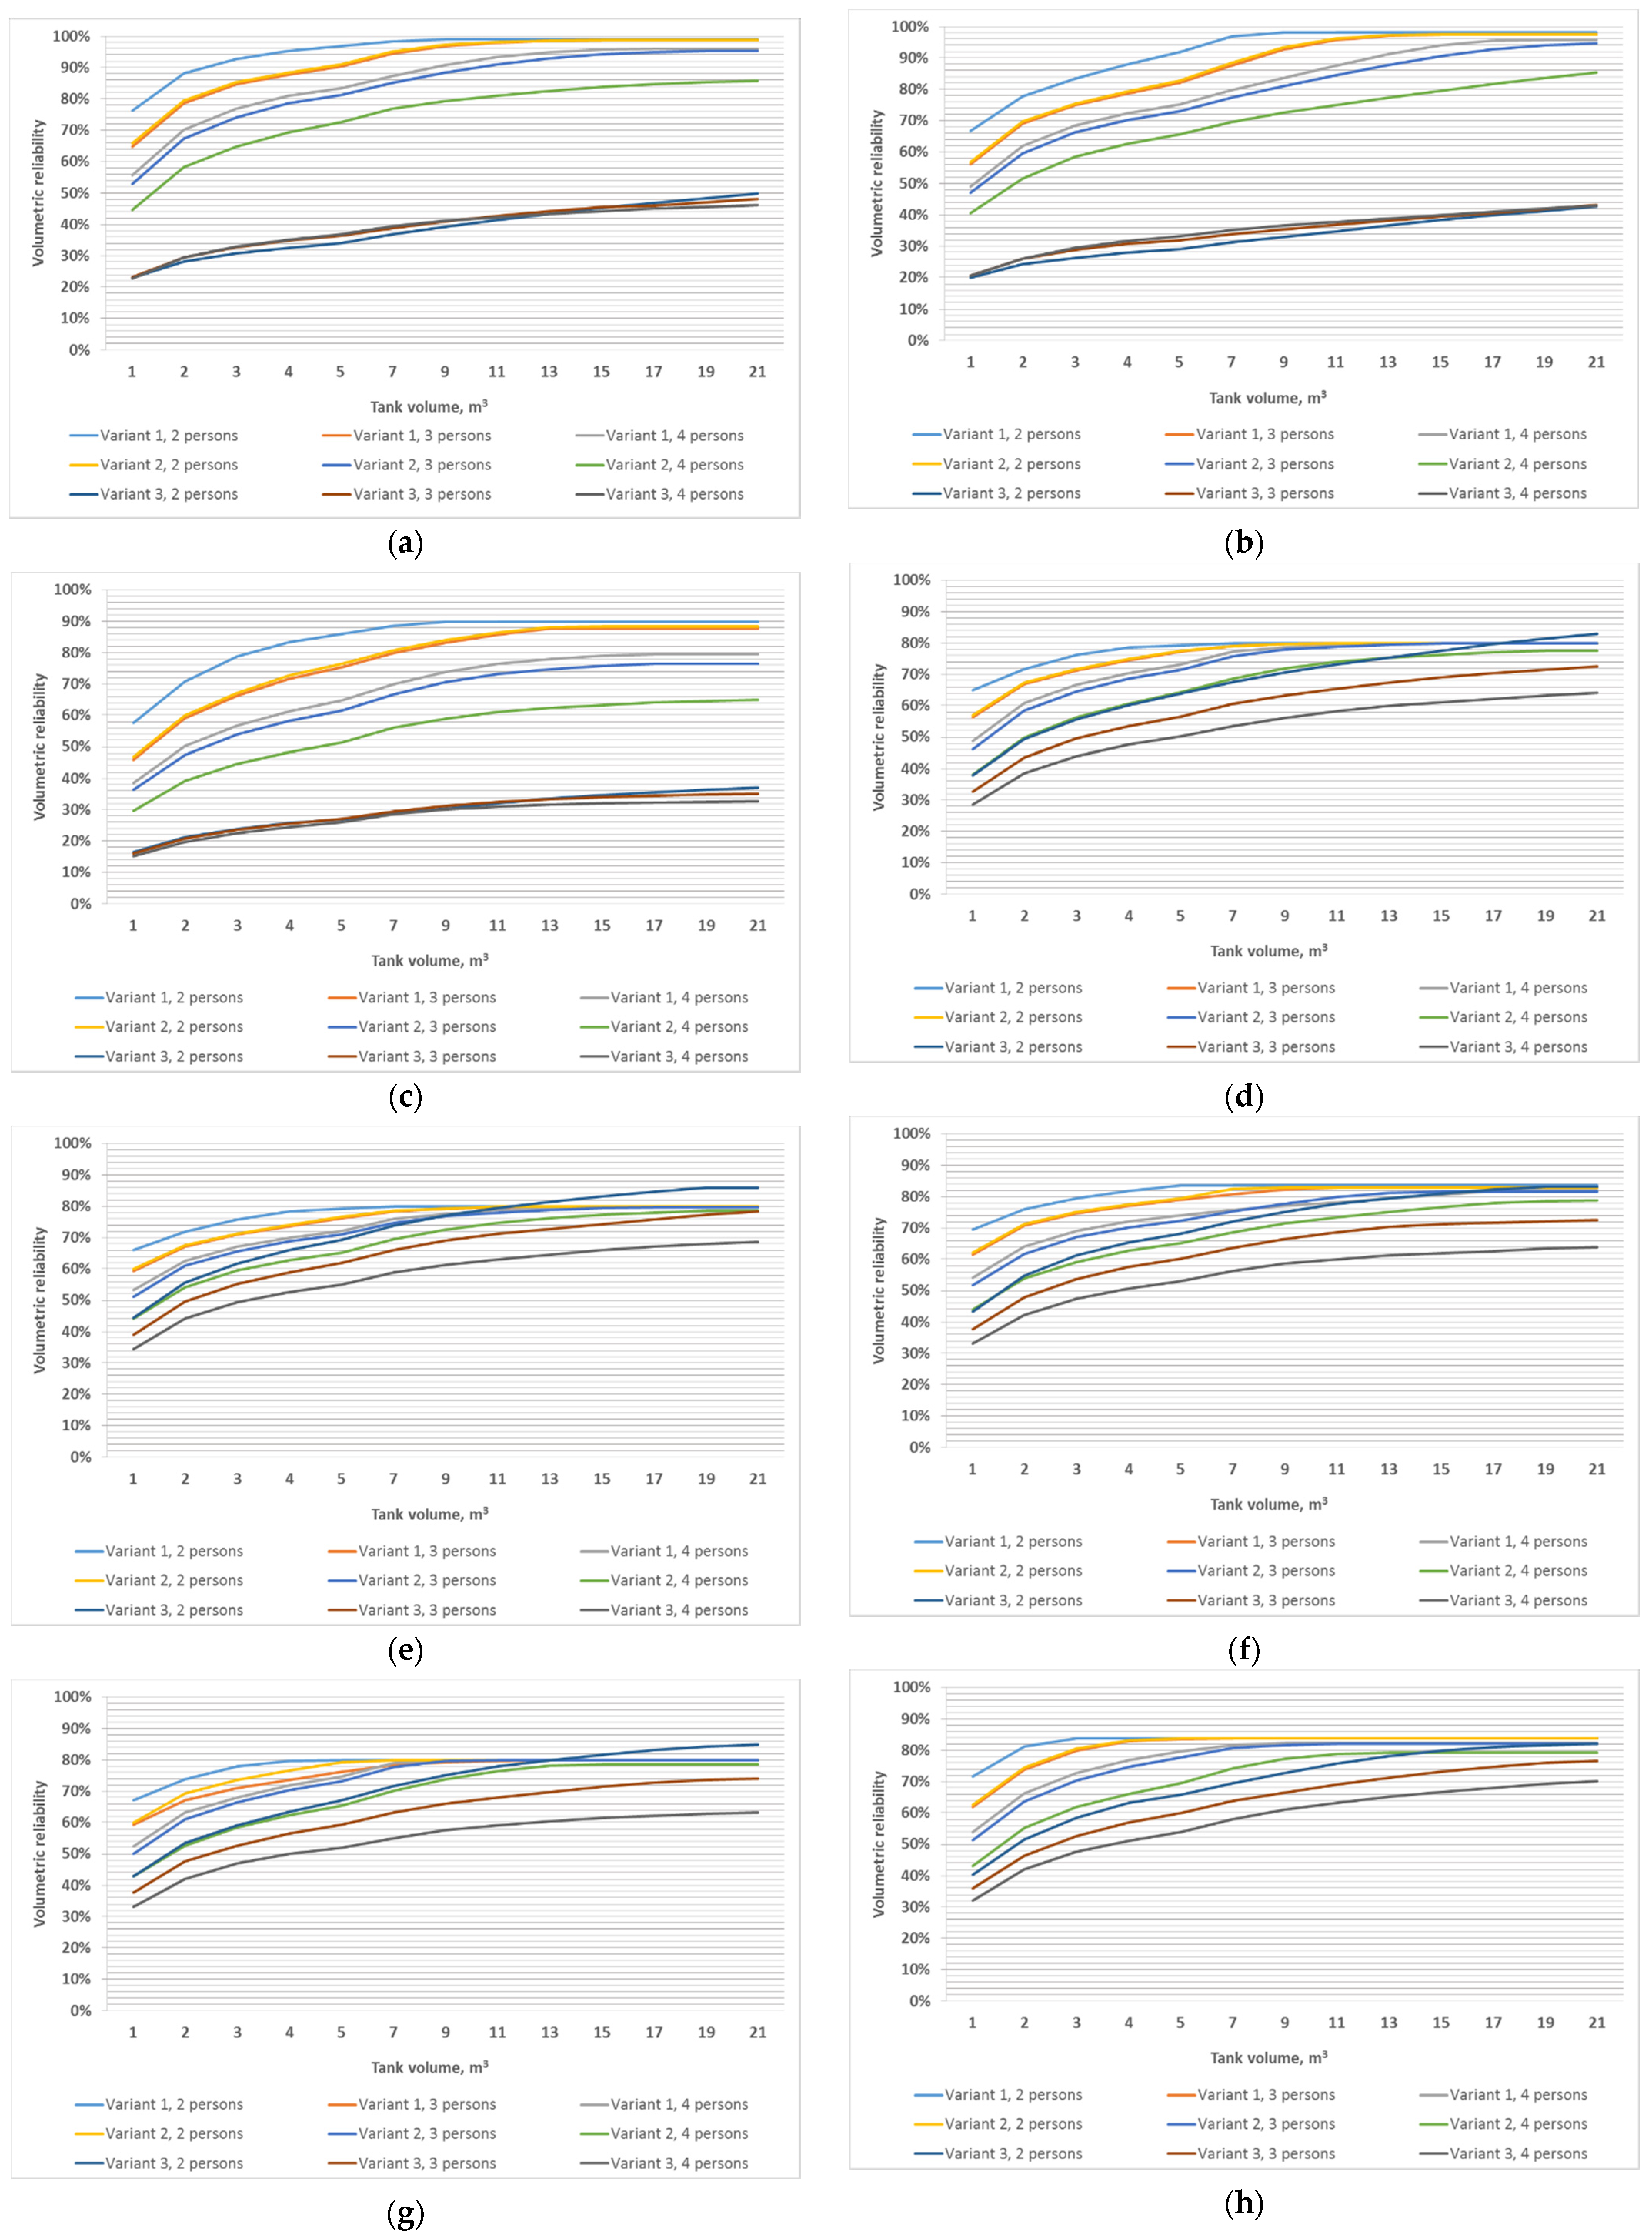
The research carried out on the simulation model allowed us to determine the efficiency of rainwater harvesting systems located in the chosen cities in Europe. The main purpose of these analyses was to calculate the volumetric reliability for the considered tanks, which made it possible to establish the optimal tank capacity for the adopted installation variants. The results of this part of the research are shown in Figure 3.
The research results for Variant 1, in which rainwater was used for toilet flushing, showed that the highest volumetric reliability at a level of 99% was obtained in Rome (Figure 3a) for 7 m3 tank capacity (two persons). A larger number of people causes an increase in the required tank capacity to 13 m3 (three persons) and 15 m3 (four persons) along with a slight decrease in volumetric reliability. A similar trend in the graphs was obtained for the RWHS located in Lisbon (Figure 3b). An increase in the tank capacity results in a sharp increase in volumetric reliability, ranging from 67% (tank volume 1 m3) to 98% (tank volume 9 m3) for two persons. In the case of the rainwater harvesting system installed in Madrid (Figure 3c), the highest value of Vr was 90%, with a toilet flushing requirement of 70 dm3/day. The optimal tank capacity was 9 m3. With a greater water demand, the efficiency of the RWHS was lower by 2% and 11%, for the optimal tanks of 13 m3 (three persons) and 15 m3 (four persons), respectively. A slightly lower efficiency of the rainwater harvesting system, amounting to a maximum of 84%, was observed for systems located in Prague and Budapest, which is shown in Figure 3f,h. In these two cases, the level of Vr for different rainwater demands was very similar. Only differences in optimal tank capacity for the maximum Vr values were observed. In Prague, the capacity was 5, 11, and 17 m3 for two, three, and four persons, respectively. In turn, in Budapest, it was 3, 5, and 7 m3. In analyzing the results of the research for RWHS located in Bratislava (Figure 3d), Warsaw (Figure 3e), and Stockholm (Figure 3g), no significant differences were observed. The maximum level of volumetric reliability for these locations was 80%. For the next two cities, Bratislava and Warsaw, the highest RWHS efficiency was obtained for a 7 m3 tank (qt = 70 dm3) and for qt = 140 dm3/day (four persons) for a 13 m3 tank. The maximum Vr for the RWHS located in Stockholm was observed for a 5 m3 tank (two persons). However, in the case when the installation is used by four persons, the optimal capacity of the tank is 9 m3.
In Variant 2, rainwater for toilet flushing and washing was used. Rainwater demand was 102 dm3, 153 dm3, and 204 dm3 per day, for two, three, and four persons, respectively. In the analysis of the results of the research for Rome (Vr = 99%), Lisbon (Vr = 97%), and Madrid (Vr = 88%), similar trends were observed in the graphs as for Variant 1, but the maximum Vr was obtained for larger tank capacities. Larger differences were also observed for Variant 2 in the levels of Vr between the RWHSs used for two and four persons, compared with those for Variant 1. The results of the research for rainwater harvesting systems located in Bratislava, Warsaw, and Stockholm show that the highest Vr levels in Variant 2 (80%) were similar to those obtained in Variant 1. This was especially noticeable in cases where the RWHS was used by two persons. Differences in volumetric reliability values between these two variants can be observed in the situation of using installation by three and four persons. It results from higher demand for water in Variant 2.
Variant 3 assumed the use of rainwater in the analyzed houses for toilet flushing, washing, and watering gardens. In contrast to Variant 1 (rainwater for toilet flushing) and Variant 2 (rainwater for toilet flushing and washing), in Variant 3, RWHSs located in Lisbon, Rome, and Madrid were characterized by lower levels of Vr. In Madrid, the volumetric reliability value was 37% (two persons), 35% (three persons), and 33% (four persons). Overall, for these three locations, no significant variation in Vr was observed between installations serving different numbers of users. The location of an RWHS in Lisbon or Rome would allow an efficiency level of around 45%. In this case, the effect of the number of residents on RWHS efficiency was also small. For the remaining four cities, the results of the research were similar. Where the installation was used by two persons, the maximum value of volumetric reliability for these cities ranged from 82% to 86%. An increase in the number of people to four resulted in a decrease in Vr of between 7% and 12%, depending on the location.
Taking into account the research results obtained for all the European locations under study, it was found that Variant 1 and Variant 2 were mainly influenced by the periods in a year without precipitation, which, in turn, significantly limited the supply of rainwater to the tank. Such variability of rainwater inflow is caused by different climatic conditions in the analyzed countries. The highest level of Vr was achieved for RWHS installed in Rome and Lisbon, and it was 99% and 98%, respectively. Such high efficiency of these systems is influenced by high annual rainfall and warm winters during which rainwater flows from the roof to the reservoir. Madrid had the lowest annual rainfall of all the cities considered, but nevertheless, volumetric reliability was around 90%. This level of Vr was mainly caused by the fact that rainwater flows into the tank for about 10 months a year. In the other five locations, where winters are longer and annual precipitation is at an average level, the differences in the value of volumetric reliability were not significant. In the case of Variant 3, it was found that the demand for water used for watering gardens had a decisive influence on the results. For the rainwater harvesting systems implemented in Rome, Madrid, and Lisbon, the amount of water used for this purpose accounted for between 75% and 86% of the daily rainwater requirement, depending on the number of occupants. For other cities, this proportion ranged from 61% to 75%. This effect was most noticeable for locations where, due to climatic conditions, large amounts of water are used in gardens to water plants.
3.2. Financial Efficiency of the Analyzed Variants of the Installation
The financial analysis shows that the selection of the appropriate investment variant has a decisive impact on the total costs incurred during the lifetime of the water and sewer system in the residential buildings under study. The results of the LCC calculations obtained for various installation usage conditions indicate that the profitability of using particular alternative water systems in the chosen European cities is determined by the number of occupants and the prices of tap water and wastewater discharged into the sewage system.
The highest LCC costs were obtained for the building located in Lisbon (Table 6). The research results for this location showed that Variant 0 was not profitable in any of the analyzed calculation cases. This is due to very high 30-year operating costs in this variant, which significantly exceeded the costs of options of installations with unconventional water systems, despite the fact that it is necessary to incur higher financial outlays for these installations. Regardless of the number of people, Variant 5, with 11 m3 tank capacity, was found to be the best option. The LCC costs for this variant, depending on the number of people, were approximately EUR 21,000–43,000 lower than for the traditional variant, despite the fact that the investment costs in Variant 5 were five times higher than in Variant 0.
In the case of Madrid, Variant 0 was also not the most profitable investment, and it had the highest LCC costs for three or four persons (Table 7). When the installation served two users, the least profitable option was Variant 4, in which the alternative water source was only GWRS, and the most profitable was Variant 3, which used rainwater for toilet flushing, washing, and watering gardens. Similar to the case of Lisbon for three and four occupants, it was found that the financially optimal solution was the installation with both an RWHS and a GWRS (Variant 5). Such a hybrid system made it possible to achieve the highest water savings, which, in turn, resulted in the lowest operating costs in the 30-year analysis period. For this location, a tank volume of 9 m3 is optimal from the financial point of view.
Variant 3, in which an RWHS was implemented for toilet flushing, washing, and watering gardens, was also found to be the option with the lowest level of LCC costs for the buildings located in Prague (Table 8) and Rome (Table 9). For both cities, the lowest LCC costs were obtained for a rainwater tank with a capacity of 7 m3, regardless of the number of occupants. The highest value of the LCC costs for all the calculation cases for these locations was found for the variant in which the only additional source of water was greywater (Variant 4).
Similar research results were obtained for the systems located in Bratislava (Table 10), Budapest (Table 11), Warsaw (Table 12), and Stockholm (Table 13). For these cities, the solution with the lowest LCC level was always Variant 0, with conventional installations. The number of users of the system had no significant impact on the results or the profitability hierarchy of particular variants. The largest differences in the amount of LCC costs were found in a comparison of Variant 0 with Variants 4 and 5, in which a greywater reuse system was implemented. This was due to the high capital expenditure that must be incurred when applying this system. In the case of these locations, the implementation of unconventional water sources in single-family houses was found to be entirely unprofitable since the water savings obtained over the period of 30 years did not cover the capital expenditure and operating costs related to the replacement of filters and pumps in the RWHS and GWRS. Comparing the two systems, it can be inferred that much more favorable financial parameters were obtained for variants with RWHS. The difference in the amount of LCC costs between Variant 3 and Variant 4 was over 50%.
The results of the financial analysis for all the cities under study show that the implementation of alternative water sources in houses is profitable only for locations where the unit prices of tap and wastewater are high (Madrid, Prague, and Rome) or significantly increasing annually (Lisbon, Portugal). The situation was different for other cities, where the use of alternative water sources was unprofitable because, in these locations, unit prices and their annual increase were lower, resulting in lower annual operating costs.
3.3. Public Opinion in Selected European Countries
In total, 485 respondents participated in the survey. Table 14 presents demographic data concerning the studied group of respondents. The percentage of the Poles and the Czechs in the research group was the highest and amounted to 14% and 13.4%, respectively. The fewest respondents came from Portugal (11%) and Hungary (11%). Men made up a slightly larger proportion of the research group (51%) in most of the countries. No statistically significant differences between countries were observed (χ2 = 1.74, p = 0.973). People aged up to 35 years old constituted the largest age group (41%). People between 35 and 45 years old constituted 37% of the respondents, and over 45 years old, 22%. Similar distributions were observed among respondents in Italy, Poland, and Portugal. On the other hand, the largest group of respondents in Slovakia, Hungary, and Spain were in the range of 35–45 years. In the Czech Republic, the numbers of people aged up to 35 and between 35 and 45 years were similar. The statistical analysis did not show any significant differences in terms of age between the analyzed countries (χ2 = 9.82, p = 0.776). The majority of respondents, both in terms of the total number of respondents and in the breakdown by country, had higher education (χ2 = 3.87, p = 0.793). In terms of place of residence, the majority of the respondents were people living in cities, and this was the case both for the total number of respondents and for particular countries. The chi-squared test also did not show any statistically significant differences (χ2 = 6.34, p = 0.500). Considering the above, it can be concluded that the groups in the analyzed countries were very similar to each other, in terms of age, sex, place of residence, and education.
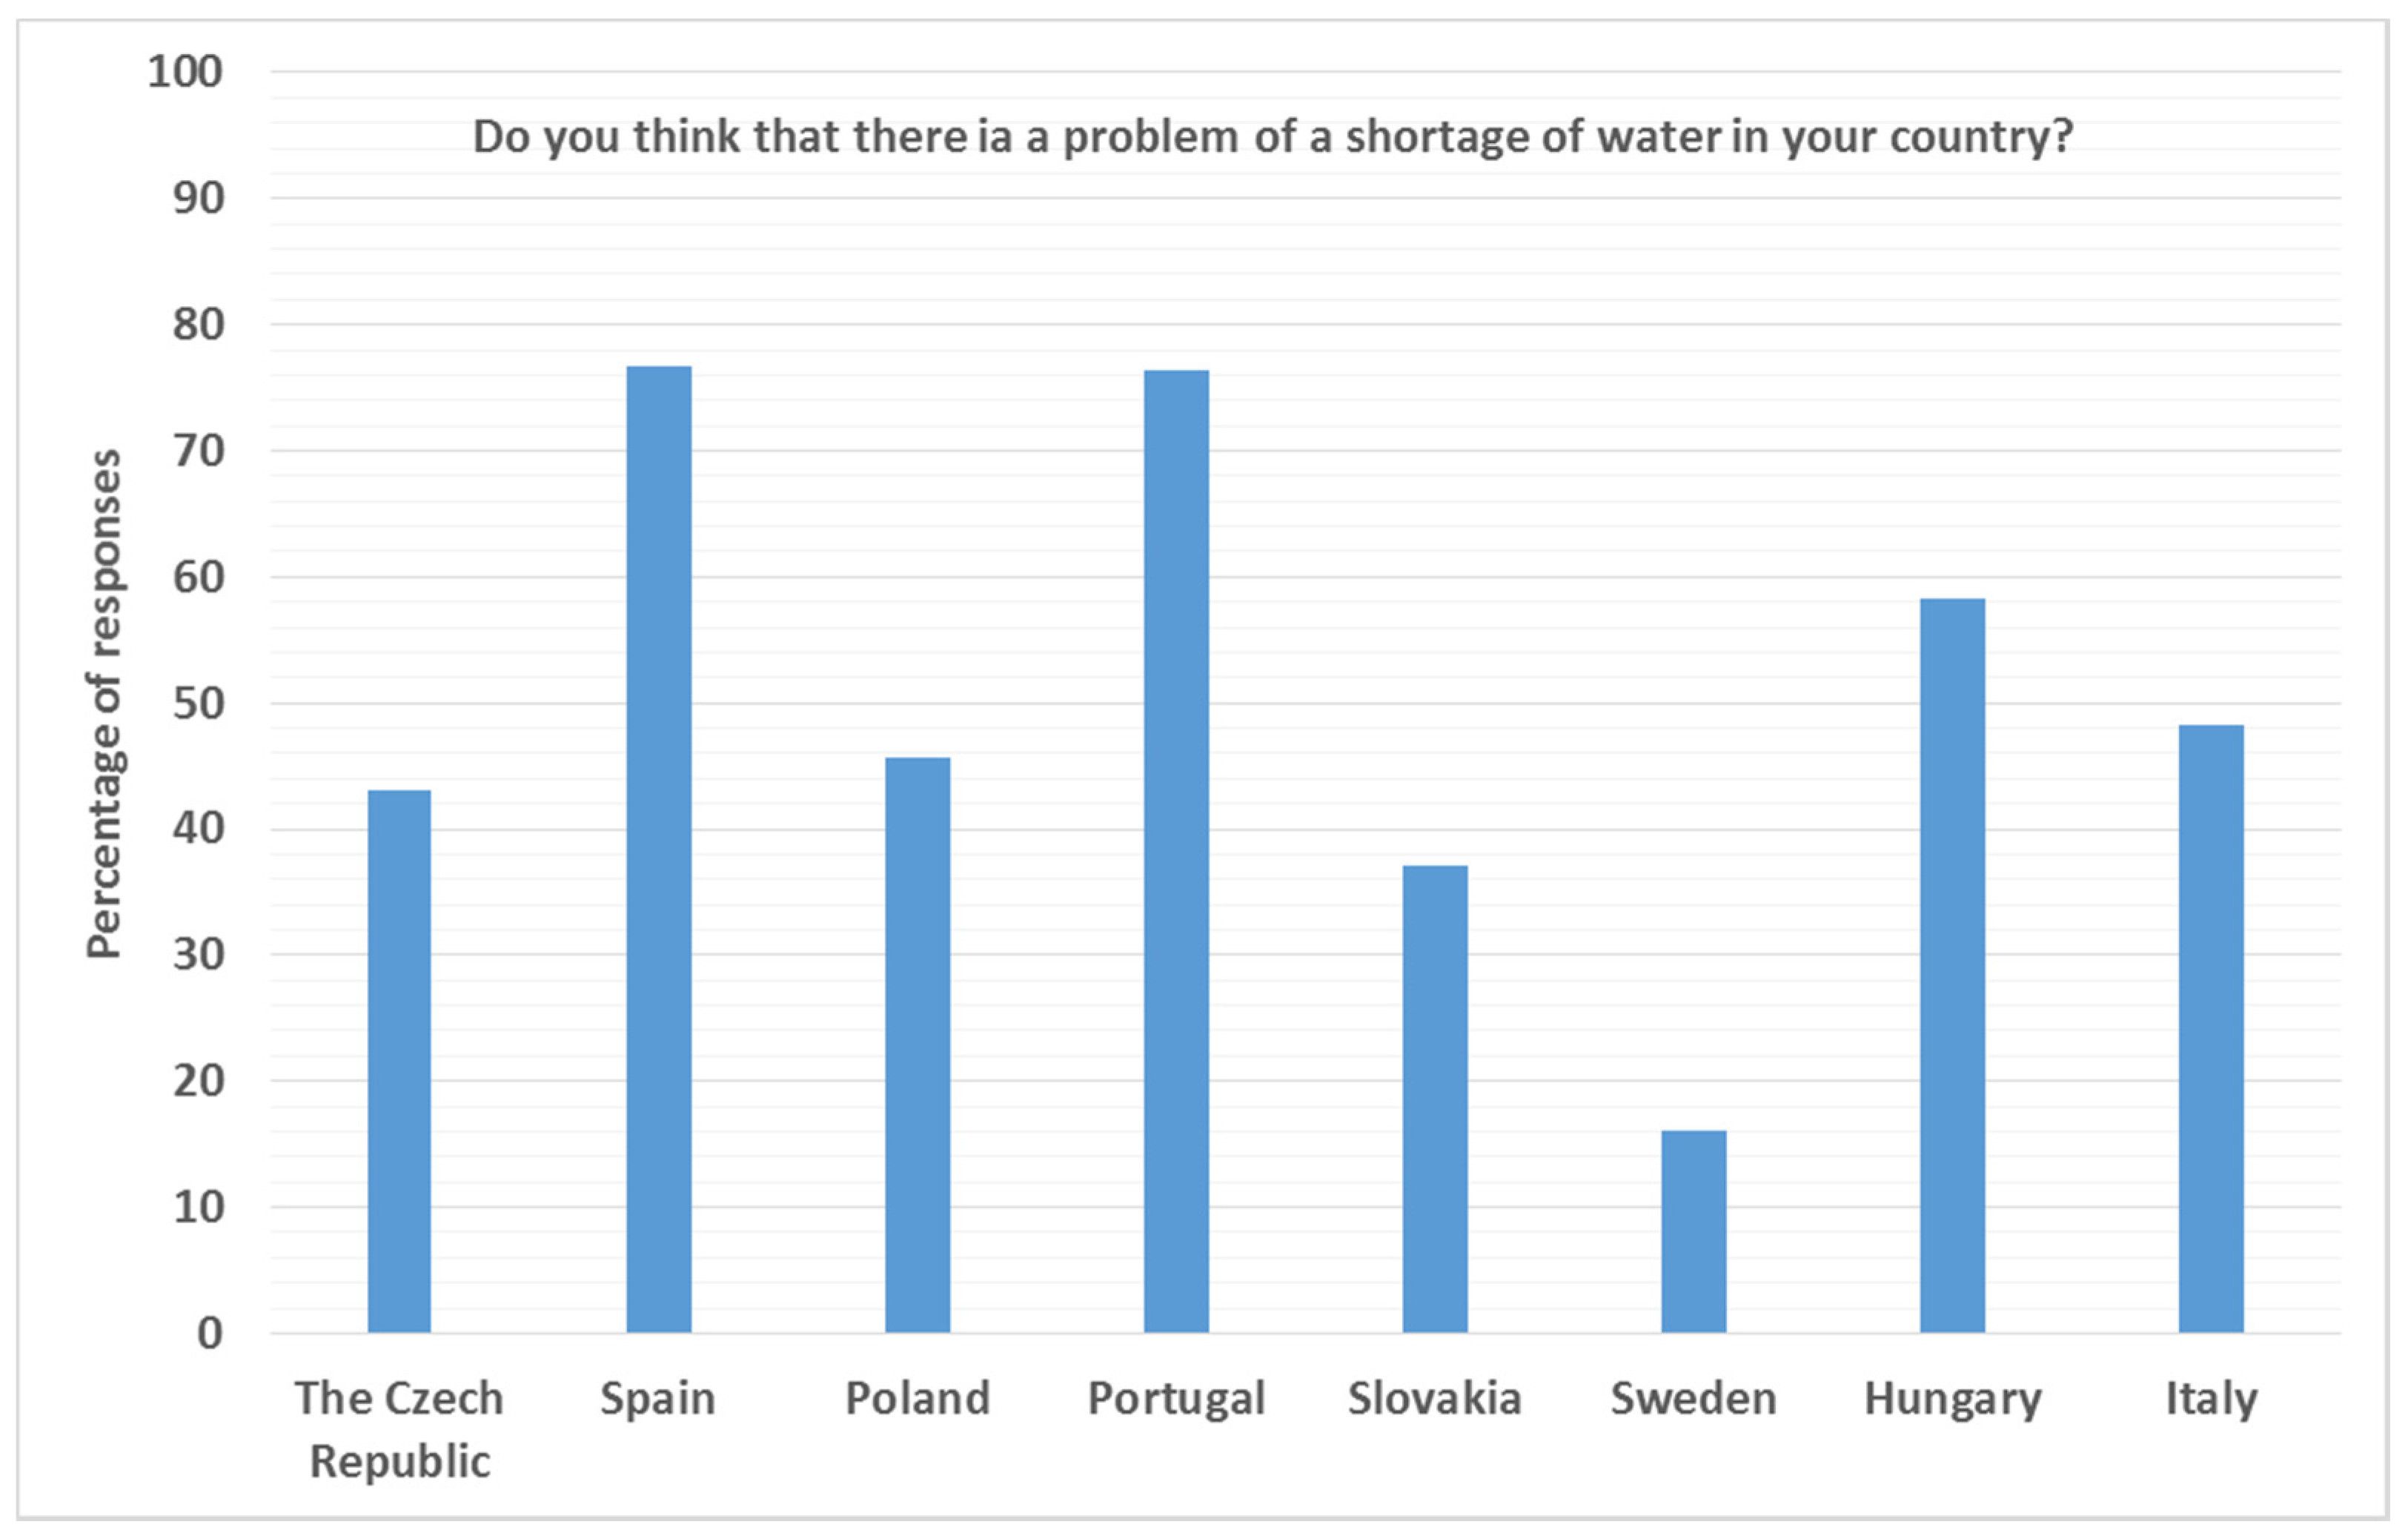
The next questions in the survey allowed us to learn about the respondents’ level of knowledge regarding the possibilities of protecting water resources by implementing alternative water systems in buildings. To the question “Do you think that there is a problem of a shortage of drinking water in your country?”, more than half of the respondents answered yes. Figure 4 shows these results broken down by country. The respondents from Portugal (76%) and Spain (76%) most often answered affirmatively, while the Swedish and the Slovaks indicated this least frequently. The differences in the answers are statistically significant (χ2 = 63.40, p < 0.001).
Other main questions of the survey are as follows: The respondents were asked if they had concerns about using these sources, and if so, for what purposes (clothes washing, toilet flushing, watering gardens, and household cleaning). The next two questions were related to the willingness to use the rainwater harvesting system and greywater recycling system in their homes. If the respondents did not want to use such systems, they could indicate the reasons for this: high investment costs and hygiene considerations. Multiple-choice responses were possible in answers to these questions.
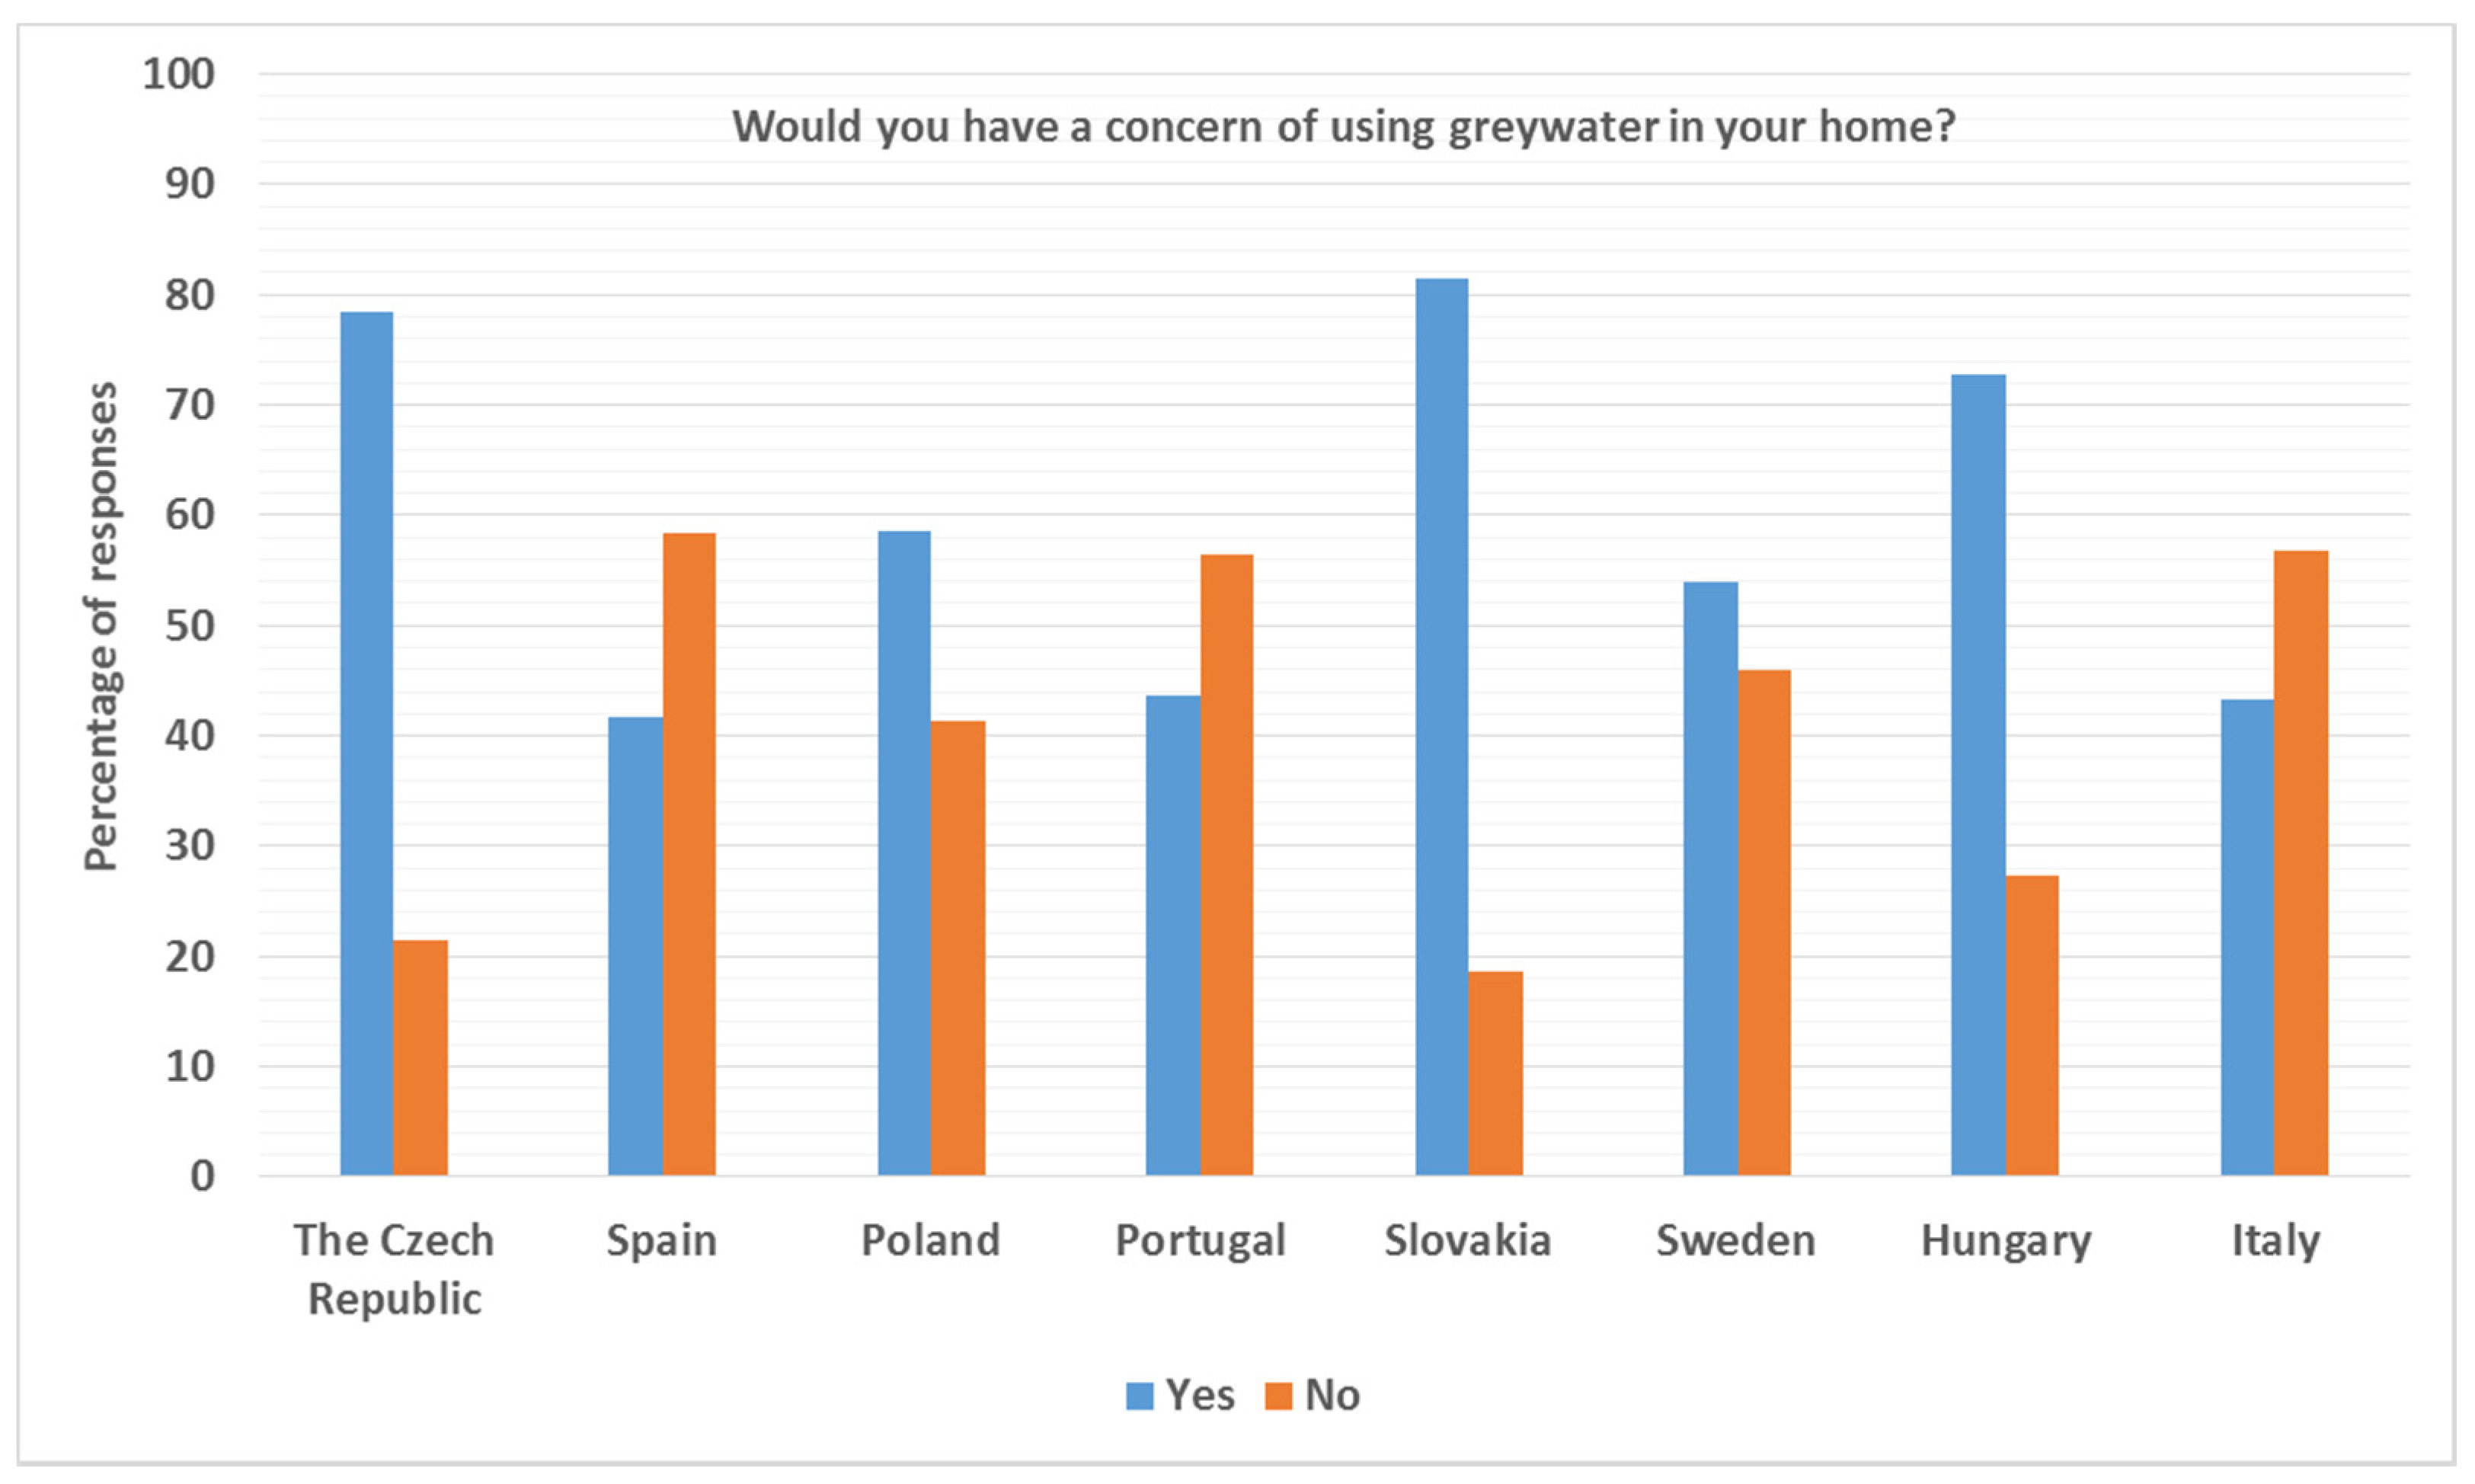
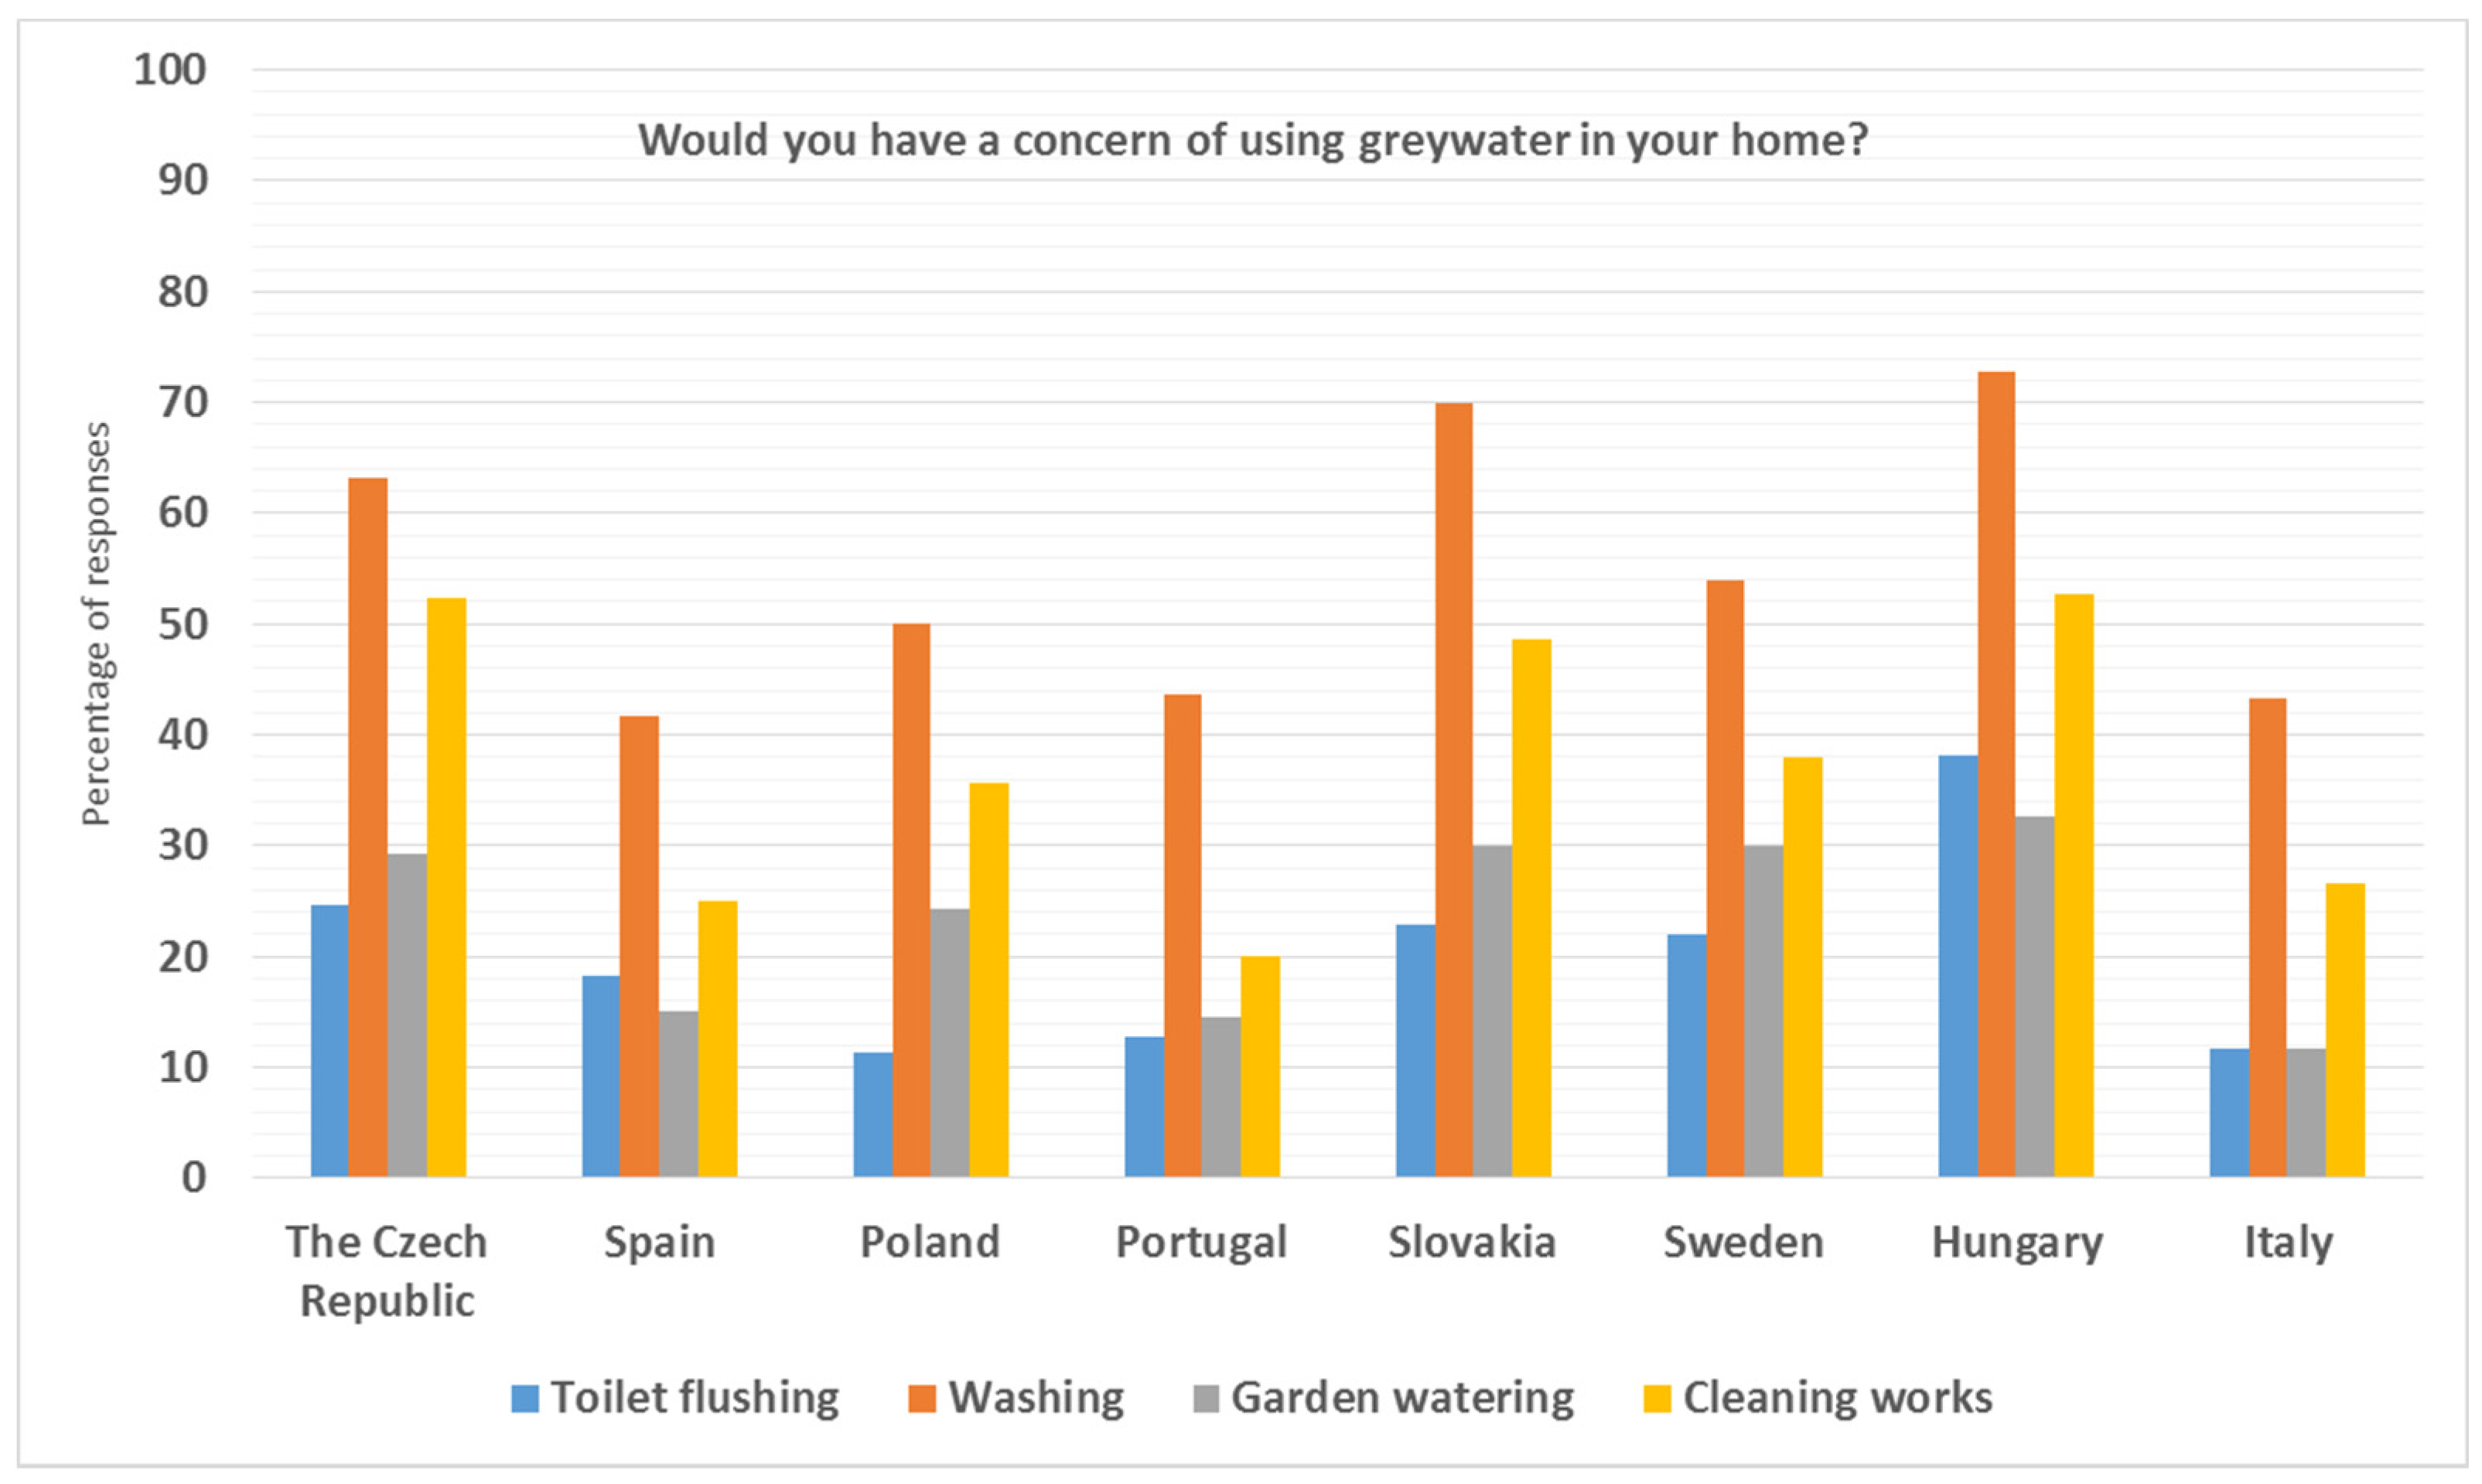
The analysis of the total number of respondents (Figure 5) showed that over 60% were afraid of using greywater in their homes (60%). The highest levels of concern were found among people in Hungary, Slovakia, and the Czech Republic, while those in Italy, Portugal, and Spain showed the lowest levels of concern. The Pearson test showed that the differences were statistically significant (χ2 = 48.63, p < 0.001). The respondents indicated the highest levels of concern regarding the use of greywater for washing (55%) and household cleaning (38%) and the lowest for watering gardens (24%) and toilet flushing (20%). These answers are presented in detail in Figure 6.
The answers to the question about willingness to use a GWRS in respondents’ houses showed that 47% of them expressed such willingness. This was indicated most frequently by the Spaniards (55%), the Italians (65%), and the Poles (56%). The Swedes (38%) and the Hungarians (27%) indicated it least frequently. The differences are statistically significant (χ2 = 24.19, p = 0.001). Hygiene considerations were the main reason for the lack of interest in the implementation of GWRS, as indicated by 2/5 of the respondents. Chi-square analysis showed differences between respondents from particular countries in the frequency at which they indicated hygiene reasons. They were most often given by persons from Hungary (60%), Sweden (52%), Slovakia (49%), and The Czech Republic (42%), and least by the Portuguese (29%), the Spaniards (27%), and the Italians (28%).
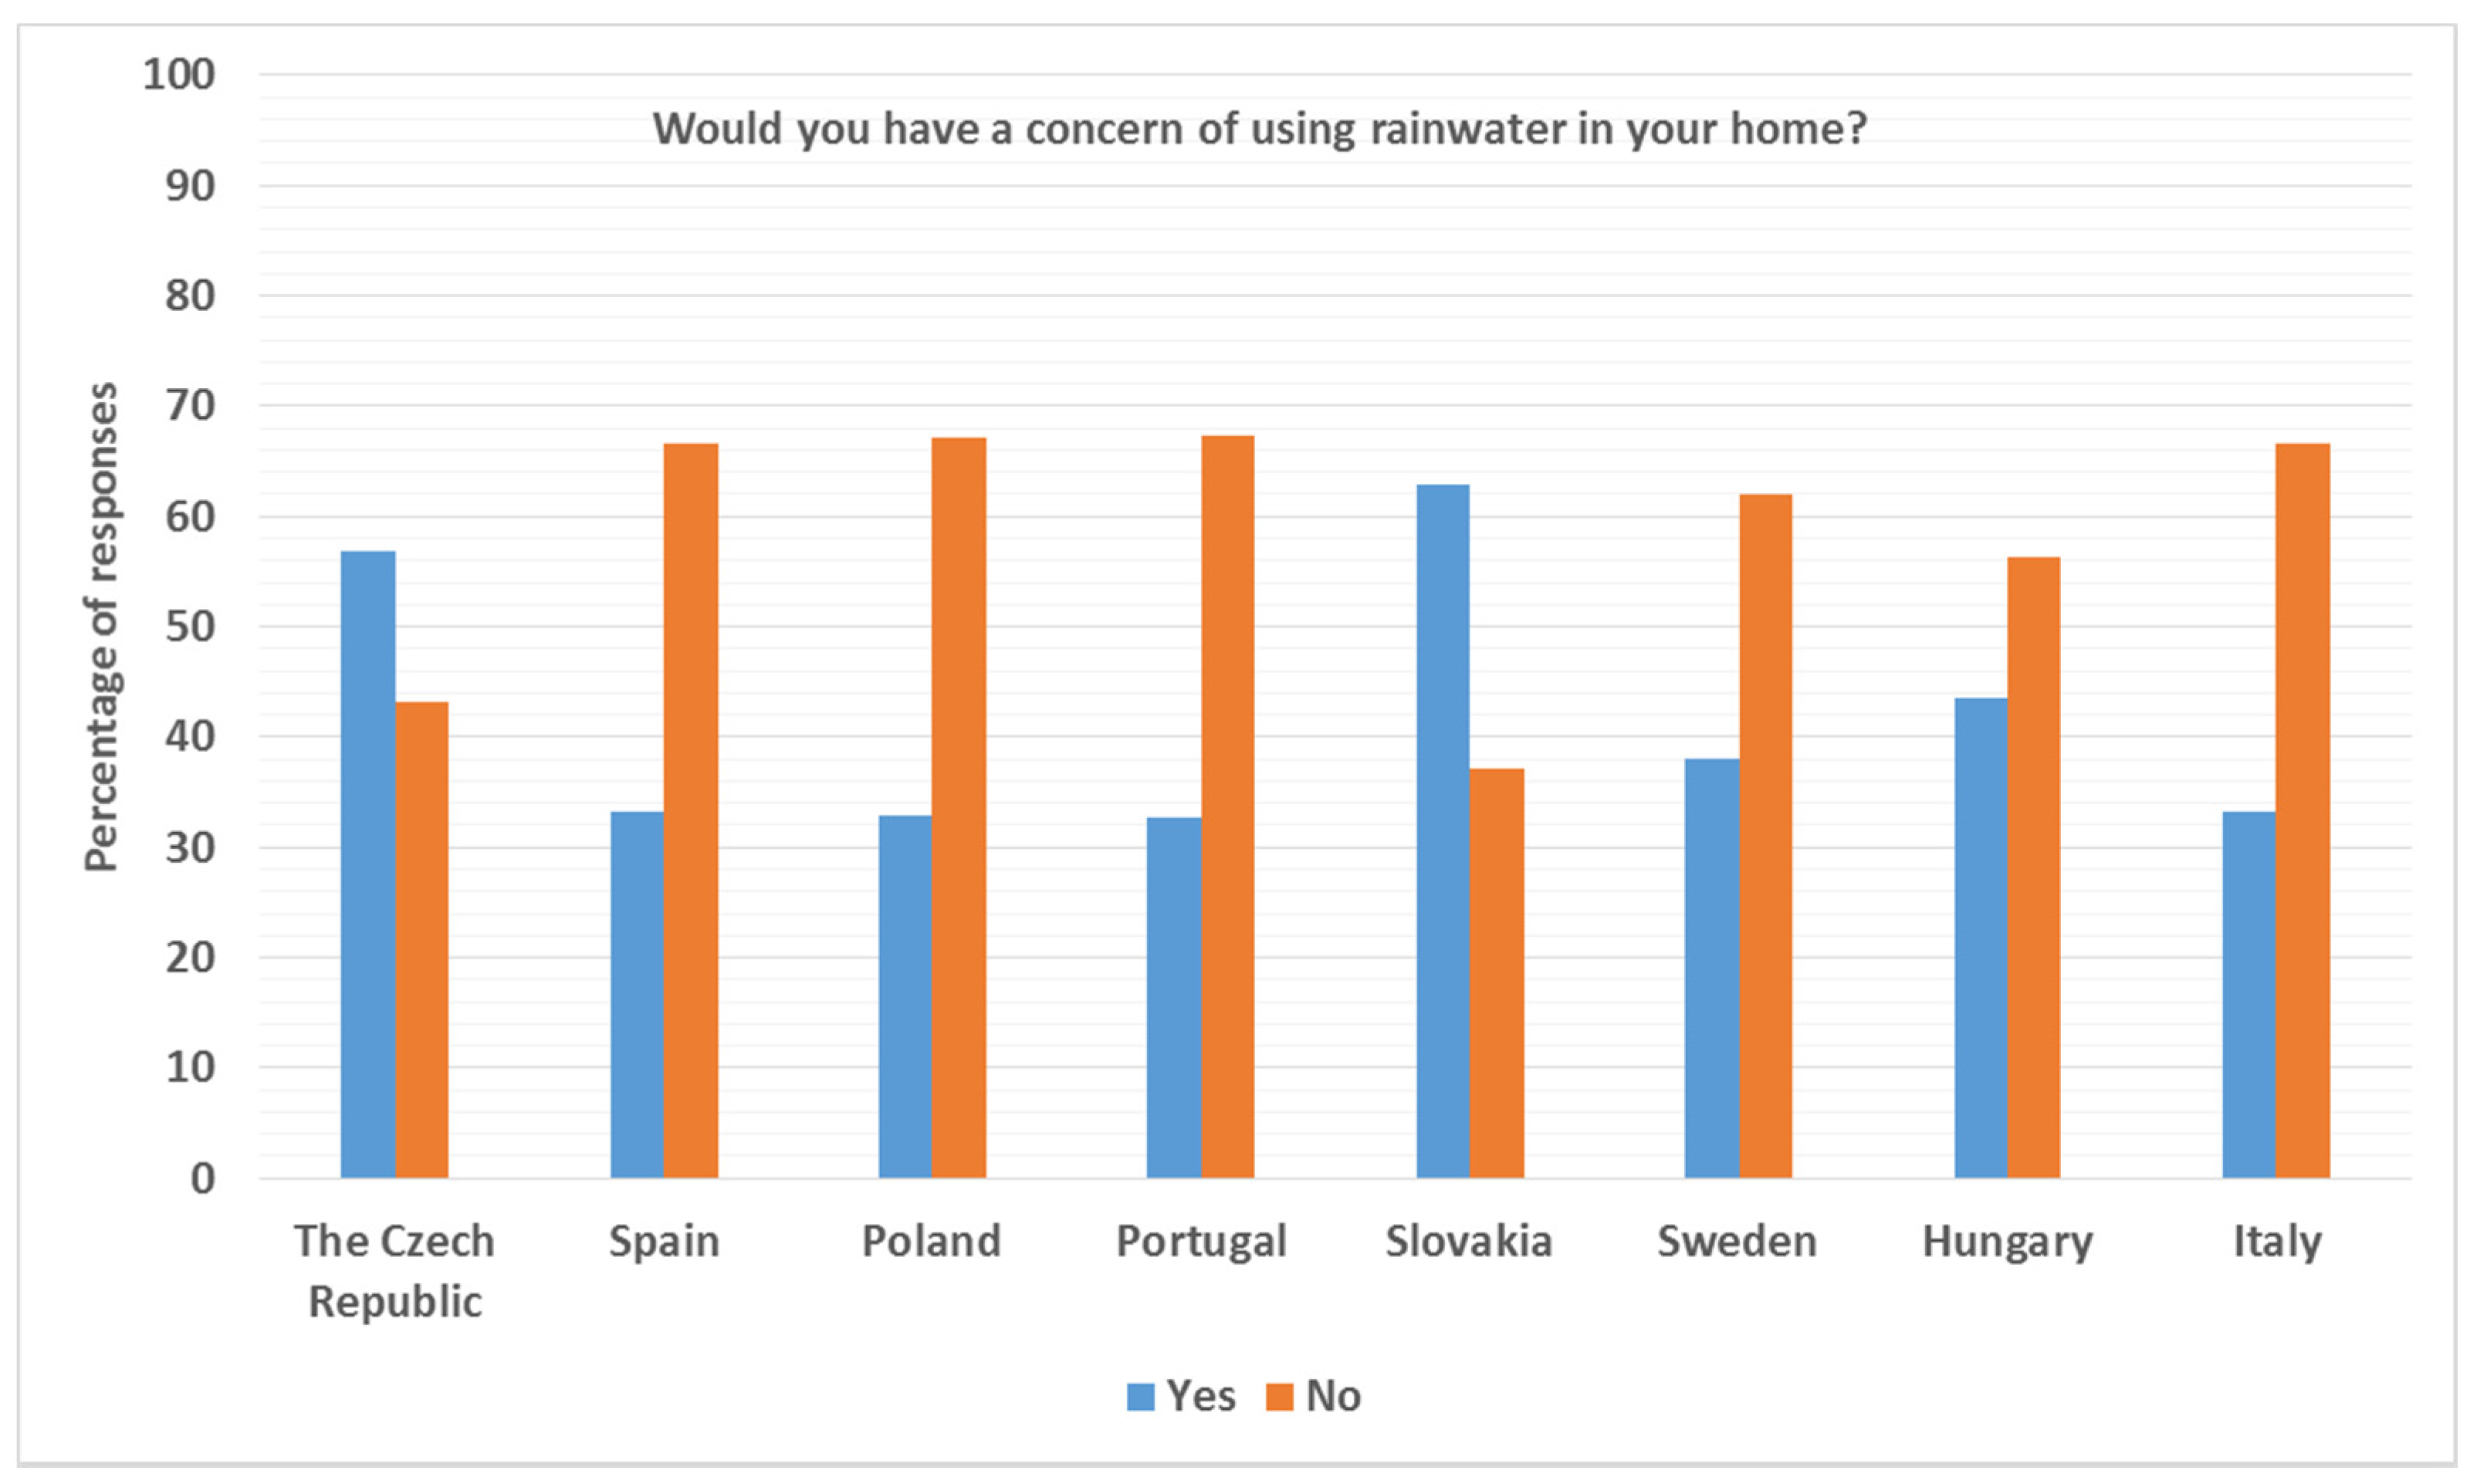
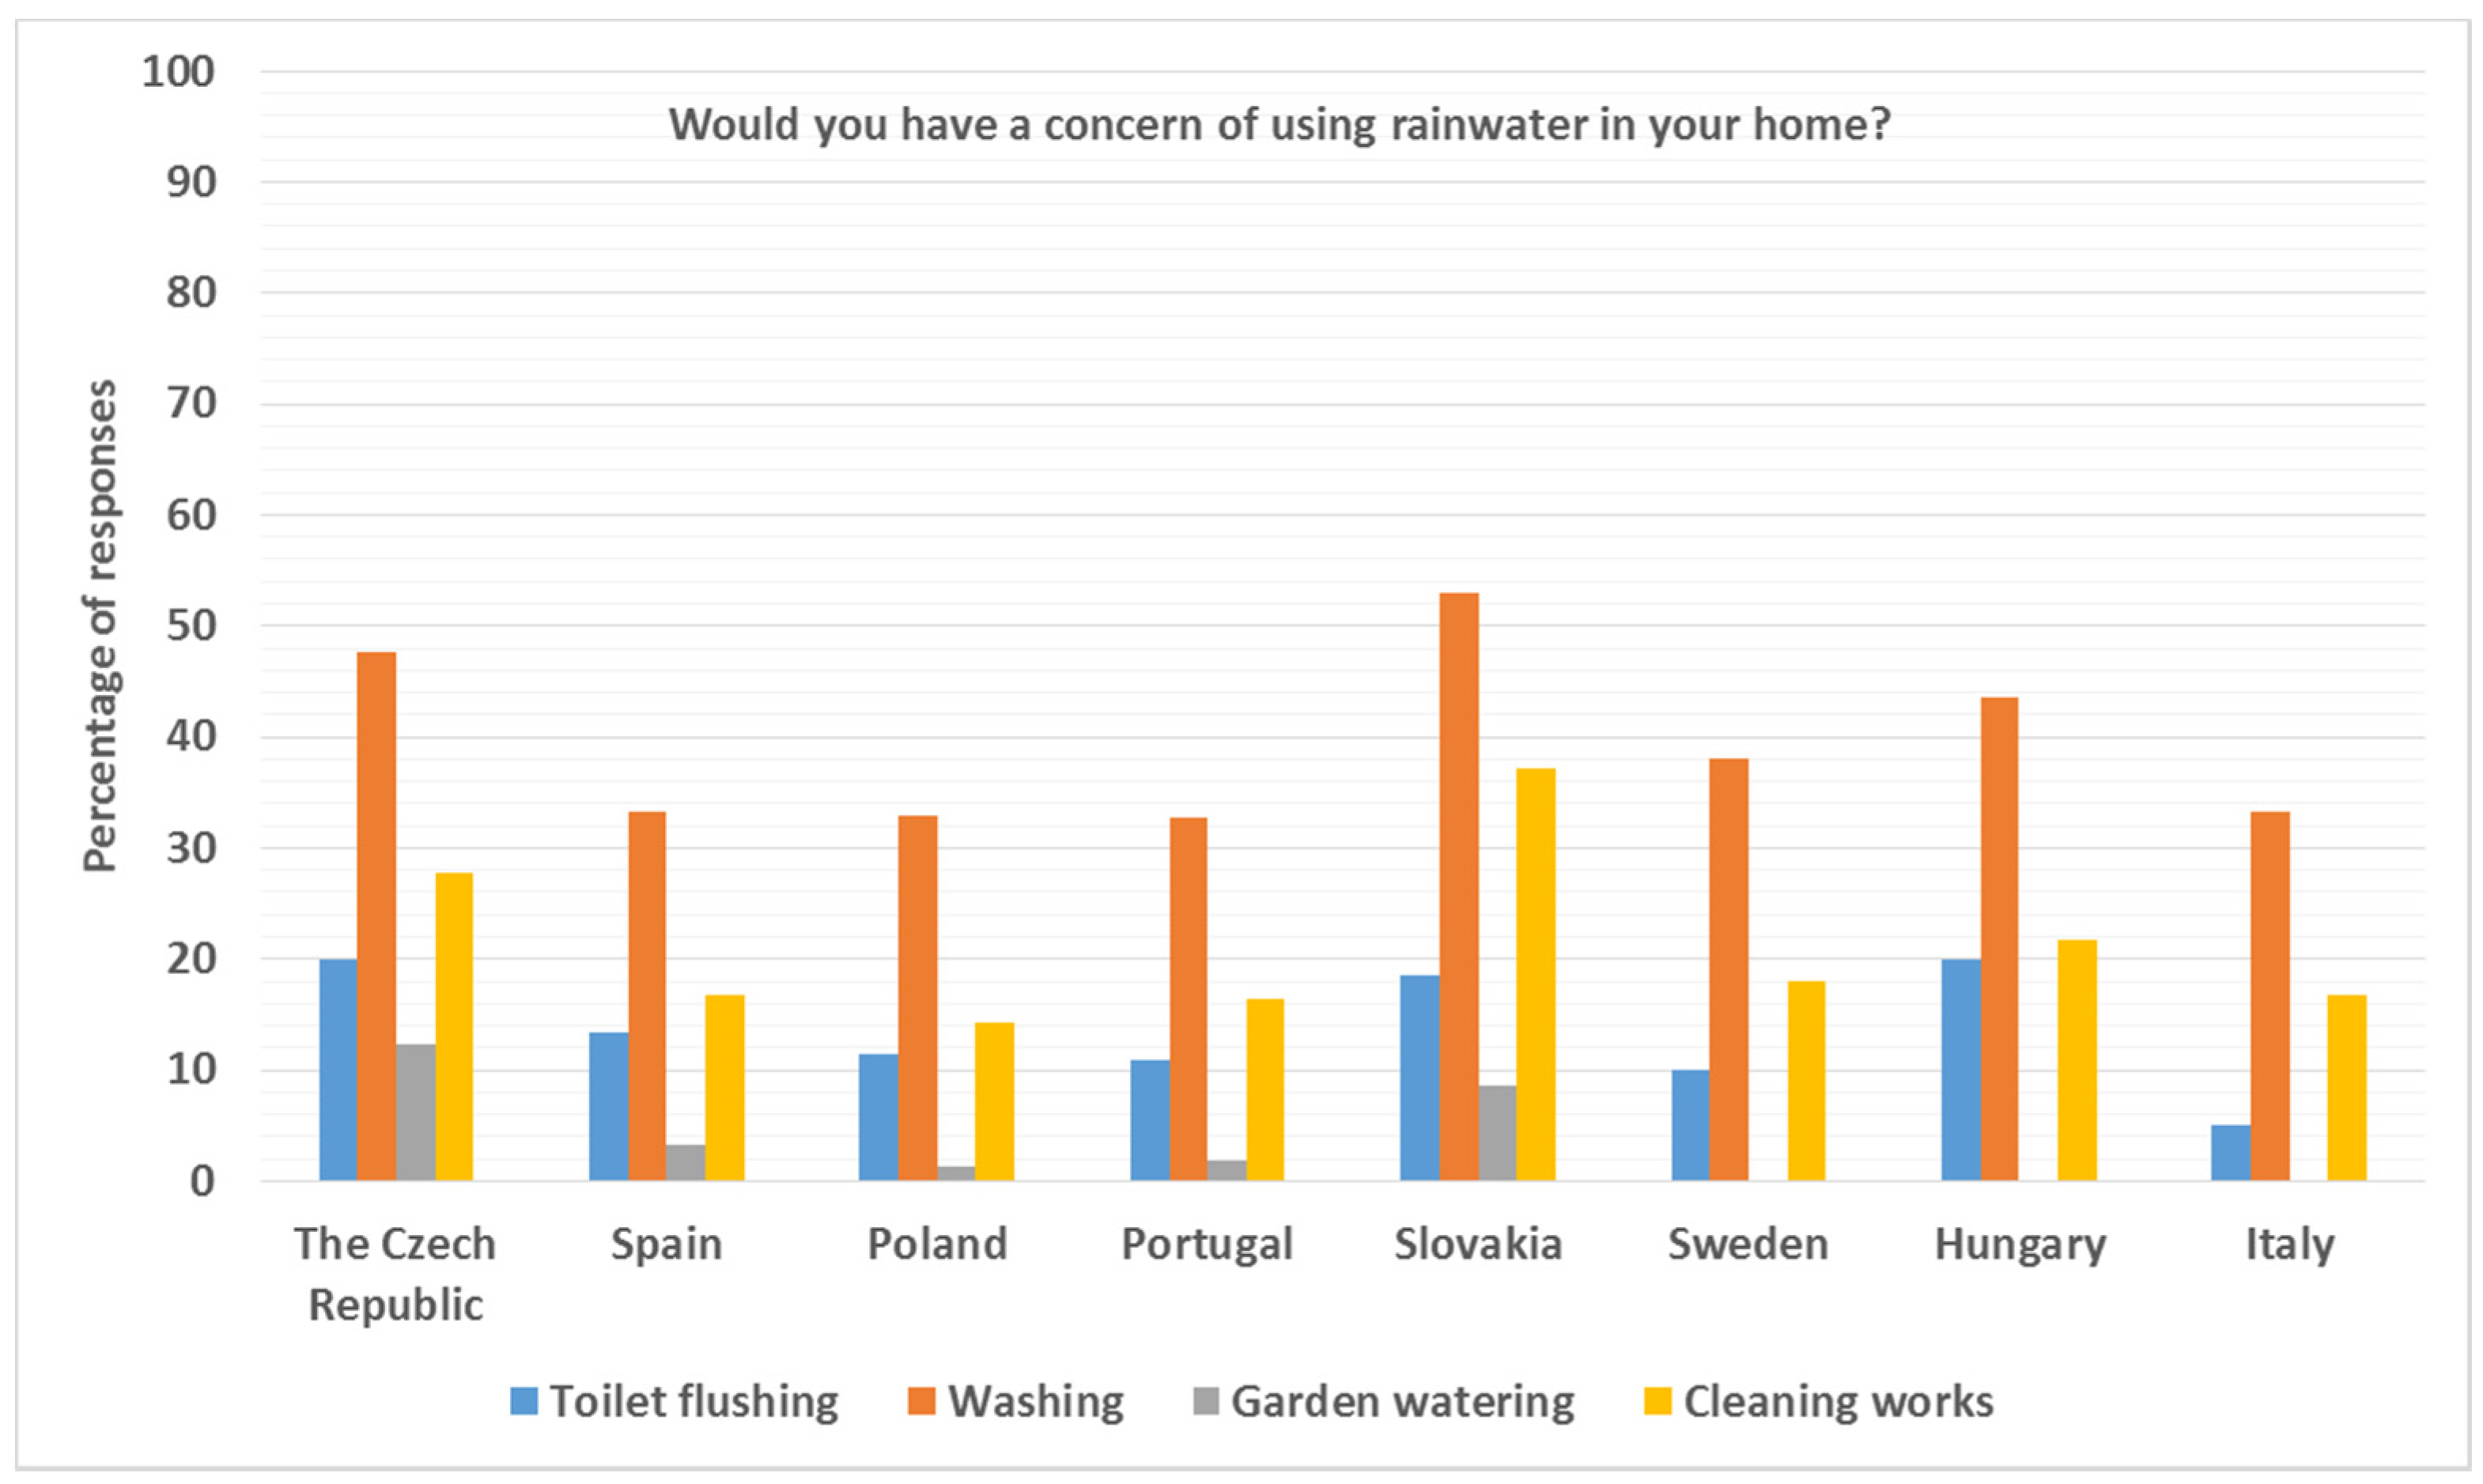
The research results showed also that 58% of all respondents had no concerns to use rainwater in their houses. Participants from Hungary, The Czech Republic, and Slovakia had the greatest concerns, with 44%, 57%, and 63% of respondents, respectively. The analysis with the chi-squared test showed that the differences are statistically significant (χ2 = 26.81, p < 0.001). Figure 7 illustrates this in detail. The highest levels of concern (Figure 8) were indicated by the respondents in the use of rainwater for washing (40%) and household cleaning (21%), while less frequently for toilet flushing (14%).
For the next question, the respondents were asked to express their opinions on their willingness to install a system with rainwater (RWHS) in their homes. It was shown that 67% of respondents would use such a solution. This was most frequently indicated by the Poles and least often by the Hungarians (56%). There were no statistically significant differences in the responses of respondents from different countries (χ2 = 13.40, p = 0.063). Among the total number of respondents who did not want to use RWHS, the same percentages indicated reasons for increased capital expenditure and hygiene considerations.
The final question of the survey was “Would a subsidy for installing these systems encourage you to use them in your home?” Over three-quarters of the respondents said “yes”. The chi-squared test showed that the differences are statistically insignificant.
4. Conclusions
For many years, human activity has resulted in overexploitation of natural resources, including water resources. As a result, there are problems with access to water in many regions of the world, both in terms of quantity and quality. Unfortunately, this affects the standard of living of many people and, in extreme cases, results in their death. Increasingly frequent water shortages, caused not by excessive exploitation alone, but also by growing demand, climate change, and intensification of urbanization, also limit economic development. This problem is observed by both scientists and politicians. As a result, water strategies have been implemented in many regions, and their purpose is sustainable management of the available water resources.
Therefore, this study was carried out to determine the cost effectiveness of rainwater harvesting systems and greywater recycling systems in single-family houses located in eight different European countries. In this research, the life cycle cost methodology was used, which allowed establishing the whole costs of six installation variants incurred over a long period of time. In addition, in these countries, questionnaire surveys were also conducted to learn about public opinion regarding the implementation of unconventional water systems.
The results of the financial analysis showed that the LCC methodology was an appropriate tool to evaluate and compare different investment options, and also to support the decision-making process. The obtained financial indicators for each installation variant made it possible to choose the optimal solution that could bring benefits in the long term. The research also confirmed that the adoption of a solution based only on initial investment expenditures may lead to the wrong decisions because, in many cases, these expenditures constitute an insignificant part of the costs resulting from the operation of the facility for several decades. Moreover, it was observed that the amount of LCC costs of the analyzed installation variants, and thus, the selection of the optimal variant was largely influenced by technical parameters and climatic conditions, as well as the prices of tap water and wastewater discharged to the sewer system. It should also be noted that, when comparing the variants of installations with greywater recycling system and rainwater harvesting system, the second performs much better because the capital expenditures for its implementation are much lower than those required for the execution of an installation with recycled greywater.
Survey results have shown that residents of regions where water resources are lower and water shortages appear are more positively inclined toward the implementation of unconventional water systems in buildings. Their greater awareness of the possibilities of saving water and favor of alternative solutions may result from information campaigns conducted in these countries in recent years and law regulations promoting these systems, and sometimes, requiring the use of such solutions. In most of the cases studied, the use of both rainwater and greywater for washing raised the highest levels of concern among the respondents. This was due to hygiene reasons. Overall, it can be concluded that rainwater is more acceptable to society as an alternative water source than greywater.
As this research revealed, for many respondents, apart from hygiene reasons, increased capital expenditures also constitute barriers to implementing these systems. The vast majority (75%) of all respondents indicated co-financing as a good incentive for them to implement these systems in their homes.
This research and, above all, its results are scientific and practical. Despite the fact that they were about case studies, they can be a valuable guide for investors, designers, and leaders who develop water and wastewater strategies. Co-financing could also provide an additional incentive to use unconventional water systems, especially in situations when their implementation is currently not profitable. These solutions would become more common if societies, through appropriate campaigns, were informed about the environmental and financial benefits that can be obtained from the use of rainwater and greywater.
Author Contributions
Conceptualization, A.S.; methodology, A.S. and D.S.; software, D.S.; validation, A.S.; formal analysis, A.S.; investigation, A.S.; resources, A.S.; data curation, A.S.; writing—original draft preparation, A.S.; writing—review and editing, A.S. and D.S.; visualization, A.S. All authors have read and agreed to the published version of the manuscript.
Funding
This research received no external funding.
Institutional Review Board Statement
Not applicable.
Informed Consent Statement
Not applicable.
Acknowledgments
The authors would like to thank all those who responded to the survey.
Conflicts of Interest
The authors declare no conflict of interest.
References
- Urbaniec, K.; Mikulčić, H.; Rosen, M.A.; Duić, N. A holistic approach to sustainable development of energy, water and environment system. J. Clean. Prod. 2017, 155, 1–11. [Google Scholar] [CrossRef] [Green Version]
- López-Morales, C.; Rodríguez-Tapia, L. On the economic analysis of wastewater treatment and reuse for designing strategies for water sustainability: Lessons from the Mexico Valley Basin. Resour. Conserv. Recycl. 2019, 40, 1–12. [Google Scholar] [CrossRef]
- Yang, L.; Wang, Y.; Wang, R.; Klemeš, J.J.; de Almeida, C.; Jin, M.; Zheng, X.; Qiao, Y. Environmental-social-economic footprints of consumption and trade in the Asia-Pacific region. Nat. Commun. 2020, 11, 4490. [Google Scholar] [CrossRef] [PubMed]
- Mikulčić, H.; Baleta, J.; Klemeš, J.J. Sustainability through combined development of energy, water and environment systems. J. Clean. Prod. 2020, 251, 119727. [Google Scholar] [CrossRef]
- Mannan, M.; Al-Ghamdi, S.G. Environmental impact of water-use in buildings: Latest developments from a life-cycle assessment perspective. J. Environ. Manag. 2020, 261, 110198. [Google Scholar] [CrossRef] [PubMed]
- Bocanegra-Martínez, A.; Ponce-Ortega, J.M.; Nápoles-Rivera, F.; Serna-González, M.; Castro-Montoya, A.J.; El-Halwagi, M.M. Optimal design of rainwater collecting systems for domestic use into a residential development. Resour. Conserv. Recycl. 2014, 84, 44–56. [Google Scholar] [CrossRef]
- Klemeš, J.J. Industrial water recycle/reuse. Curr. Opin. Chem. Eng. 2012, 1, 238–245. [Google Scholar] [CrossRef]
- Sarabi, S.E.; Han, Q.; Romme, A.G.L.; de Vries, B.; Wendling, L. Key Enablers of and Barriers to the Uptake and Implementation of Nature-Based Solutions in Urban Settings: A Review. Resources 2019, 8, 121. [Google Scholar] [CrossRef] [Green Version]
- Salvadore, E.; Bronders, J.; Batelaan, O. Hydrological modelling of urbanized catchments: A review and future directions. J. Hydrol. 2015, 529, 62–81. [Google Scholar] [CrossRef]
- Vörösmarty, C.J.; Green, P.; Salisbury, J.; Lammers, R.B. Global water resources: Vulnerability from climate change and population growth. Science 2000, 289, 284–288. [Google Scholar] [CrossRef] [Green Version]
- United Nations, Department of Economic and Social Affairs, Population Division. World Population Prospects 2019. 2019. Available online: https://population.un.org/wpp/Publications/Files/WPP2019_Highlights.pdf (accessed on 20 November 2021).
- United Nations World Water Assessment Programme (WWAP). The United Nations World Water Development Report 2015: Water for a Sustainable World. Paris, UNESCO. 2015. Available online: https://www.unwater.org/publications/world-water-development-report-2015/ (accessed on 20 November 2021).
- Jussah, O.; Orabi, M.O.; Sušnik, J.; Bichai, F.; Zevenbergen, C. Assessment of the potential contribution of alternative water supply systems in two contrasting locations: Lilongwe, Malawi and Sharm El-Sheikh, Egypt. J. Water Clim. Chang. 2020, 11, 130–149. [Google Scholar] [CrossRef]
- Tchórzewska-Cieślak, B.; Papciak, D.; Pietrucha-Urbanik, K.; Pietrzyk, A. Safety analysis of tap water biostability. Archit. Civ. Eng. Environ. 2018, 11, 149–154. [Google Scholar] [CrossRef] [Green Version]
- Pietrucha-Urbanik, K.; Tchorzewska-Cieslak, B.; Papciak, D.; Skrzypczak, I. Analysis of chemical stability of tap water in terms of required level of technological safety. Arch. Environ. Prot. 2017, 4, 3–12. [Google Scholar] [CrossRef] [Green Version]
- EEA. Use of Freshwater Resources in Europe 2002–2014; European Environment Agency: København, Denmark, 2017; ISBN 978-3-944280-57-8.
- Directive 2000/60/EC. Directive 2000/60/EC of the European Parliament and of the Council of 23 October 2000 Establishing a Framework for Community Action in the Field of Water Policy; European Environment Agency: København, Denmark, 2000.
- EEA. Water Resources Across Europe—Confronting Water Stress: An Updated Assessment; European Environment Agency: København, Denmark, 2021; ISBN 978-92-9480-391-7.
- Koutroulis, A.G.; Papadimitriou, L.V.; Grillakis, M.G.; Tsanis, I.K.; Wyser, K.; Betts, R.A. Freshwater vulnerability under high end climate change. A pan-European assessment. Sci. Total Environ. 2018, 613, 271–286. [Google Scholar] [CrossRef] [PubMed]
- Cipolletta, G.; Ozbayram, E.G.; Eusebi, A.L.; Akyola, C.; Malamis, S.; Mino, E.; Fatone, F. Policy and legislative barriers to close water-related loops in innovative small water and wastewater systems in Europe: A critical analysis. J. Clean. Prod. 2021, 288, 125604. [Google Scholar] [CrossRef]
- Şahin, N.; Manioğlu, G. Water conservation through rainwater harvesting using different building forms in different climatic regions. Sustain. Cities Soc. 2019, 44, 367–377. [Google Scholar] [CrossRef]
- Zdeb, M.; Zamorska, J.; Papciak, D.; Słyś, D. The quality of rainwater collected from roofs and the possibility of its economic use. Resources 2020, 9, 12. [Google Scholar] [CrossRef] [Green Version]
- Kordana, S.; Słyś, D. An analysis of important issues impacting the development of stormwater management systems in Poland. Sci. Total Environ. 2020, 727, 138711. [Google Scholar] [CrossRef]
- Kordana-Obuch, S.; Starzec, M. Statistical Approach to the Problem of Selecting the Most Appropriate Model for Managing Stormwater in Newly Designed Multi-Family Housing Estates. Resources 2020, 9, 110. [Google Scholar] [CrossRef]
- Li, Y.; Li, H.X.; Huang, J.; Liu, C. An approximation method for evaluating flash flooding mitigation of sponge city strategies—A case study of Central Geelong. J. Clean. Prod. 2020, 257, 120525. [Google Scholar] [CrossRef]
- Zeleňáková, M.; Repel, A.; Vranayová, Z.; Kaposztasová, D.; Abd-Elhamid, H.F. Impact of land use changes on surface runoff in urban areas—case study of Myslavsky Creek Basin in Slovakia. Acta Montan. Slovaca 2019, 24, 129–139. Available online: https://actamont.tuke.sk/pdf/2019/n2/5zelenakova.pdf (accessed on 20 November 2021).
- Pochwat, K. The use of artificial neural networks for analyzing the sensitivity of a retention tank. E3S Web Conf. 2018, 45, 00066. [Google Scholar] [CrossRef] [Green Version]
- Fewkes, A. The technology, design and utility of rainwater catchment systems. In Water Demand Management; Butler, D., Memon, F.A., Eds.; IWA Publishing: London, UK, 2006; ISBN 1843390787. [Google Scholar]
- Campisano, A.; Butler, D.; Ward, S.; Burns, M.J.; Friedler, E.; DeBusk, K.; Fisher-Jeffes, L.N.; Ghisi, E.; Rahman, A.; Furumai, H.; et al. Urban rainwater harvesting systems: Research, implementation and future perspectives. Water Res. 2017, 115, 195–209. [Google Scholar] [CrossRef]
- Yan, X.; Ward, S.; Butler, D.; Daly, B. Performance assessment and life cycle analysis of potable water production from harvested rainwater by a decentralized system. J. Clean. Prod. 2018, 172, 2167–2173. [Google Scholar] [CrossRef] [Green Version]
- Ward, S.; Memon, F.A.; Butler, D. Performance of a large building rainwater harvesting system. Water Res. 2012, 46, 5127–5134. [Google Scholar] [CrossRef]
- Severis, R.; da Silva, F.A.; Wahrlich, J.; Skoronski, E.; Simioni, F. Economic analysis and risk-based assessment of the financial losses of domestic rainwater harvesting systems. Resour. Conserv. Recycl. 2019, 146, 206–217. [Google Scholar] [CrossRef]
- Słyś, D.; Stec, A. Centralized or Decentralized Rainwater Harvesting Systems: A Case Study. Resources 2020, 9, 5. [Google Scholar] [CrossRef] [Green Version]
- Stephan, A.; Stephan, L. Life cycle water, energy and cost analysis of multiple water harvesting and management measures for residential buildings in a Mediterranean climate. Sustain. Cities Soc. 2017, 32, 584–603. [Google Scholar] [CrossRef]
- Cardoso, R.; Blanco, C.; Duarte, J. Technical and financial feasibility of rainwater harvesting systems in public buildings in Amazon, Brazil. J. Clean. Prod. 2020, 260, 121054. [Google Scholar] [CrossRef]
- Lee, M.; Kim, M.; Kim, Y.; Han, M. Consideration of rainwater quality parameters for drinking purposes: A case study in rural Vietnam. J. Environ. Manag. 2017, 200, 400–406. [Google Scholar] [CrossRef]
- Stec, A.; Zeleňáková, M. An Analysis of the Effectiveness of Two Rainwater Harvesting Systems Located in Central Eastern Europe. Water 2019, 11, 458. [Google Scholar] [CrossRef] [Green Version]
- Zaizen, M.; Urakawa, T.; Matsumoto, Y.; Takai, H. The collection of rainwater from dome stadiums in Japan. Urban Water 1999, 1, 355–359. [Google Scholar] [CrossRef]
- Neto, R.; Calijuri, M.; Carvalho, I.; Santiago, A. Rainwater treatment in airports using slow sand filtration followed by chlorination: Efficiency and costs. Resour. Conserv. Recycl. 2012, 65, 124–129. [Google Scholar] [CrossRef]
- Ghisi, E.; Tavares, D.; Rocha, V. Rainwater harvesting in petrol stations in Brasilia: Potential for potable water savings and investment feasibility analysis. Resour. Conserv. Recycl. 2009, 54, 79–85. [Google Scholar] [CrossRef]
- Lade, O.; Oloke, D. Performance evaluation of a rainwater harvesting system: A case study of University Collage Hospital, Ibdan City, Nigeria. Curr. Appl. Sci. Technol. 2017, 25, 1–14. [Google Scholar] [CrossRef]
- Słyś, D.; Stec, A.; Zelenakova, M. A LCC analysis of rainwater management variants. Ecol. Chem. Eng. S 2012, 19, 359–372. [Google Scholar] [CrossRef]
- Kaposztasova, D.; Vranayova, Z.; Markovic, G.; Purcz, P. Rainwater Harvesting, Risk Assessment and Utilization in Kosice-City, Slovakia. Procedia Eng. 2014, 89, 1500–1506. [Google Scholar] [CrossRef] [Green Version]
- Rahman, A.; Snook, C.; Haque, M.; Hajani, E. Use of design curves in the implementation of a rainwater harvesting system. J. Clean. Prod. 2020, 261, 121292. [Google Scholar] [CrossRef]
- Unami, K.; Mohawesh, O.; Sharifi, E.; Takeuchi, J.; Fujihara, M. Stochastic modelling and control of rainwater harvesting systems for irrigation during dry spells. J. Clean. Prod. 2015, 88, 185–195. [Google Scholar] [CrossRef]
- Morales-Pinzón, T.; Lurueña, R.; Gabarrell, X.; Gasol, C.M.; Rieradevall, J. Financial and environmental modelling of water hardness—Implications for utilizing harvested rainwater in washing machines. Sci. Total Environ. 2014, 470, 1257–1271. [Google Scholar] [CrossRef]
- Imteaz, M.A.; Adeboye, O.B.; Rayburg, S.; Shanableh, A. Rainwater harvesting potential for southwest Nigeria using daily water balance model. Resour. Conserv. Recycl. 2012, 62, 51–55. [Google Scholar] [CrossRef]
- Hyde, K. An evaluation of the theoretical potential and practical opportunity for using recycled greywater for domestic purposes in Ghana. J. Clean. Prod. 2013, 60, 195–200. [Google Scholar] [CrossRef]
- Marleni, N.; Gray, S.; Sharma, A.; Burn, S.; Muttil, N. Impact of water management practice scenarios on wastewater flow and contaminant concentration. J. Environ. Manag. 2015, 151, 461–471. [Google Scholar] [CrossRef] [PubMed]
- Penn, R.; Schutze, M.; Friedler, E. Modelling the effects of on-site greywater reuse and low flush toilets on municipal sewer systems. J. Environ. Manag. 2013, 114, 72–83. [Google Scholar] [CrossRef] [PubMed]
- Wanjiru, E.; Xia, X. Sustainable energy-water management for residential houses with optimal integrated grey and rain water recycling. J. Clean. Prod. 2018, 170, 1151–1166. [Google Scholar] [CrossRef] [Green Version]
- Oviedo-Ocaña, E.R.; Dominguez, I.; Ward, S.; Rivera-Sanchez, M.L.; Zaraza-Peña, J.M. Financial feasibility of end-user designed rainwater harvesting and greywater reuse systems for high water use households. Environ. Sci. Pollut. Res. 2017, 25, 19200–19216. [Google Scholar] [CrossRef] [PubMed] [Green Version]
- Jeong, H.; Broesicke, O.; Drew, B.; Crittenden, J. Life cycle assessment of small-scale greywater reclamation systems combined with conventional centralized water systems for the City of Atlanta, Georgia. J. Clean. Prod. 2018, 174, 333–342. [Google Scholar] [CrossRef]
- Hendrickson, T.P.; Nguyen, M.; Sukardi, M.; Miot, A.; Horvath, A.; Nelson, K. Life-cycle energy use and greenhouse gas emissions of a building-scale wastewater treatment and nonpotable reuse system. Environ. Sci. Technol. 2015, 49, 10303–10311. [Google Scholar] [CrossRef]
- Laaffat, J.; Aziz, F.; Ouazzani, N.; Mandi, L. Biotechnological approach of greywater treatment and reuse for landscape irrigation in small communities. Saudi J. Biol. Sci. 2019, 26, 83–90. [Google Scholar] [CrossRef]
- Shamabadi, N.; Bakhtiari, H.; Kochakian, N.; Farahani, M. The Investigation and Designing of an Onsite Grey Water Treatment Systems at Hazrat-e-Masoumeh University, Qom, Iran. Energy Procedia 2015, 74, 1337–1346. [Google Scholar] [CrossRef] [Green Version]
- Couto, E.; Calijuri, M.; Assemany, P.; Santiago, A.; Lopes, L. Greywater treatment in airports using anaerobic filter followed by UV disinfection: An efficient and low cost alternative. J. Clean. Prod. 2015, 106, 372–379. [Google Scholar] [CrossRef]
- Environment Protection Authority Victoria (EPA). About Greywater. 2020. Available online: https://www.epa.vic.gov.au/forcommunity/environmental-information/water/about-wastewater/about-greywater (accessed on 20 November 2021).
- Environment Protection Authority Victoria (EPA). How to Manage Your Own Sewerage System. 2020. Available online: https://www.epa.vic.gov.au/for-community/environmental-information/water/about-wastewater/how-to-manage-your-own-septic-system (accessed on 20 November 2021).
- Słyś, D. Potential of rainwater utilization in residential housing in Poland. Water Environ. J. 2009, 23, 318–325. [Google Scholar] [CrossRef]
- EN 16941-1:2018; On-Site Non-Potable Water Systems-Part 1: Systems for the Use of Rainwater. European Committee for Standardization: Brussels, Belgium, 2018.
- Palla, A.; Gnecco, I.; Lanza, L.G.; La Barbera, P. Performance analysis of domestic rainwater harvesting systems under various European climate zones. Resour. Conserv. Recycl. 2012, 62, 71–80. [Google Scholar] [CrossRef]
- Silva, C.; Sousa, V.; Carvalho, N. Evaluation of rainwater harvesting in Portugal: Application to single-family residences. Resour. Conserv. Recycl. 2015, 94, 21–34. [Google Scholar] [CrossRef]
- ISO/DIS 15686-5.2; Buildings and Constructed Assets-Service Life Planning. Part 5: Life Cycle Costing. International Organization for Standardization: London, UK, 2008.
- DOE G 413.3-21A 6-6-2018; Life Cycle Cost Handbook. In Guidance for Life Cycle Cost Estimation and Analysis; Office of Acquisition and Project Management, U.S. Department of Energy: Washington, DC, USA, 2014.
- Rahman, A.; Keane, J.; Imteaz, A.M. Rainwater harvesting in greater Sydney: Water savings, reliability and economic benefits. Resour. Conserv. Recycl. 2012, 61, 16–21. [Google Scholar] [CrossRef]
- Jones, T.L.; Baxter, M.A.J.; Khanduja, V. A quick guide to survey research. Ann. R. Coll. Surg. Engl. 2013, 95, 5–7. [Google Scholar] [CrossRef] [PubMed]
- Gaspari, J.; Antonini, E.; Marchi, L.; Vodola, V. Energy Transition at Home: A Survey on the Data and Practices That Lead to a Change in Household Energy Behavior. Sustainability 2021, 13, 5268. [Google Scholar] [CrossRef]
- Kordana-Obuch, S.; Starzec, M.; Słyś, D. Assessment of the Feasibility of Implementing Shower Heat Exchangers in Residential Buildings Based on Users’ Energy Saving Preferences. Energies 2021, 14, 5547. [Google Scholar] [CrossRef]
- Ong, M.; Puteh, F. Quantitative Data Analysis: Choosing Between SPSS, PLS and AMOS in Social Science Research. Int. Interdiscip. J. Sci. Res. 2017, 3, 14–25. [Google Scholar]
- Garcia-Cuerva, L.; Berglund, E.; Binder, A. Public perceptions of water shortages, conservation behaviors, and support for water reuse in the U.S. Resour. Conserv. Recycl. 2016, 113, 106–115. [Google Scholar] [CrossRef] [Green Version]
- Eurostat. Living Conditions in Europe. 2019. Available online: https://ec.europa.eu/eurostat/statistics-explained/index.php?title=Living_conditions_in_Europe_-_housing (accessed on 20 November 2021).
- Zhang, S.; Jing, X.; Yue, T.; Wang, Y. Performance assessment of rainwater harvesting systems: Influence of operating algorithm, length and temporal scale of rainfall time series. J. Clean. Prod. 2020, 253, 120044. [Google Scholar] [CrossRef]
- Ghisi, E.; Cardoso, K.A.; Rupp, R.F. Short-term versus long-term rainfall time series in the assessment of potable water savings by using rainwater in houses. J. Environ. Manag. 2012, 100, 109–119. [Google Scholar] [CrossRef] [PubMed]
- Lopes, V.; Marques, G.; Dornelles, F.; Medellin-Azuara, J. Performance of rainwater harvesting systems under scenarios of non-potable water demand and roof area typologies using a stochastic approach. J. Clean. Prod. 2017, 148, 304–313. [Google Scholar] [CrossRef]
- Zhang, S.; Zhang, J.; Jing, X.; Wang, Y.; Wang, Y.; Yue, T. Water saving efficiency and reliability of rainwater harvesting systems in the context of climate change. J. Clean. Prod. 2018, 196, 1341–1355. [Google Scholar] [CrossRef]
- Liuzzo, L.; Notaro, V.; Freni, G. A reliability analysis of a rainfall harvesting system in southern Italy. Water 2016, 8, 18. [Google Scholar] [CrossRef] [Green Version]
- Domènech, L.; Saurí, D. A comparative appraisal of the use of rainwater harvesting in single and multi-family buildings of the Metropolitan Area of Barcelona (Spain): Social experience, drinking water savings and economic costs. J. Clean. Prod. 2011, 19, 598–608. [Google Scholar] [CrossRef]
- Dz. U. 2002 nr 8 poz. 70; Rozporządzenie Ministra Infrastruktury z Dnia 14 Stycznia 2002 r. w Sprawie Przeciętnych Norm Zużycia Wody; RMI: Warsaw, Poland, 2002.
- BS 8525-1:2010; Grey Water Systems. Part 1: Code of Practice. BSI: London, UK, 2015.
- Morales-Pinzón, T.; Lurueña, R.; Rieradevall, J.; Gasol, C.M.; Gabarrell, X. Financial feasibility and environmental analysis of potential rainwater harvesting systems: A case study in Spain. Resour. Conserv. Recycl. 2012, 69, 130–140. [Google Scholar] [CrossRef]
- Roebuck, R.M.; Oltean-Dumbrava, C.; Tait, S. Whole life cost performance of domestic rainwater harvesting systems in the United Kingdom. Water Environ. J. 2011, 25, 355–365. [Google Scholar] [CrossRef]
- Rahman, A.; Dbais, J.; Imteaz, M. Sustainability of rainwater harvesting systems in multistorey residential buildings. Am. J. Appl. Sci. 2010, 3, 889–898. [Google Scholar] [CrossRef] [Green Version]
Figure 1.
Diagrams of analyzed variants of installations in single-family houses. (a) Variant 0, (b) Variant 1, (c) Variant 2, (d) Variant 3, (e) Variant 4, (f) Variant 5.
Figure 1.
Diagrams of analyzed variants of installations in single-family houses. (a) Variant 0, (b) Variant 1, (c) Variant 2, (d) Variant 3, (e) Variant 4, (f) Variant 5.

Figure 2.
The questionnaire survey questions.

Figure 3.
Efficiency of rainwater harvesting systems located in different cities in Europe: (a) Rome, (b) Lisbon, (c) Madrid, (d) Bratislava, (e) Warsaw, (f) Prague, (g) Stockholm, and (h) Budapest.
Figure 3.
Efficiency of rainwater harvesting systems located in different cities in Europe: (a) Rome, (b) Lisbon, (c) Madrid, (d) Bratislava, (e) Warsaw, (f) Prague, (g) Stockholm, and (h) Budapest.

Figure 4.
Affirmative answers to the question about the problem of water deficits in the respondent’s country.
Figure 4.
Affirmative answers to the question about the problem of water deficits in the respondent’s country.

Figure 5.
Answers to the question about concerns of using greywater in respondent’s house.

Figure 6.
Affirmative answers indicating the respondents’ concerns regarding the use of greywater in homes, broken down by particular purposes.
Figure 6.
Affirmative answers indicating the respondents’ concerns regarding the use of greywater in homes, broken down by particular purposes.

Figure 7.
Answers to the question about concerns of using rainwater in respondent’s house.

Figure 8.
Affirmative answers indicating the respondents’ concerns regarding the use of rainwater in homes, broken down by particular purposes.
Figure 8.
Affirmative answers indicating the respondents’ concerns regarding the use of rainwater in homes, broken down by particular purposes.


Table 1.
Annual precipitation.
| Country/City | Rainfall R (mm) | ||||||||||
|---|---|---|---|---|---|---|---|---|---|---|---|
| 2003 | 2004 | 2005 | 2006 | 2007 | 2008 | 2009 | 2010 | 2011 | 2012 | Average | |
| The Czech Republic/Prague | 309 | 477 | 486 | 480 | 487 | 476 | 646 | 452 | 524 | 672 | 501 |
| Hungary/Budapest | 838 | 688 | 711 | 515 | 295 | 784 | 831 | 370 | 614 | 670 | 631 |
| Italy/Rome | 635 | 679 | 322 | 673 | 740 | 894 | 539 | 656 | 700 | 1033 | 687 |
| Poland/Warsaw | 545 | 519 | 514 | 482 | 593 | 547 | 653 | 789 | 601 | 537 | 578 |
| Portugal/Lisbon | 850 | 446 | 853 | 375 | 672 | 665 | 1029 | 741 | 581 | 719 | 693 |
| Slovakia/Bratislava | 326 | 529 | 536 | 568 | 557 | 573 | 583 | 770 | 475 | 561 | 548 |
| Spain/Madrid | 414 | 466 | 423 | 359 | 486 | 290 | 424 | 314 | 213 | 271 | 366 |
| Sweden/Stockholm | 545 | 658 | 536 | 564 | 430 | 646 | 614 | 523 | 470 | 502 | 549 |
Table 2.
Data used in the RWHS simulation model.
| Parameter | Value |
|---|---|
| Number of occupants (Oc) | 2, 3, 4 |
| Runoff coefficient ψ | 0.9 |
| Garden area Ga (m2) | 250 |
| Water consumption for toilet flushing per day qt (dm3/person) | 35 |
| Water consumption in washing machine per day qw (dm3/person) | 16 |
| Water consumption for garden watering in Lisbon, Madrid, and Rome (dm3/m2/day) | 2.5 |
| Water consumption for garden watering in Bratislava, Warsaw, Budapest, Stockholm, and Prague (dm3/m2/day) | 1.25 |
Table 3.
Data for GWRS efficiency calculations.
| Parameter | Value |
|---|---|
| Number of occupants (Oc) | 2, 3, 4 |
| Water consumption for toilet flushing per day qt (dm3/person) | 35 |
| Water consumption for showering or bathing per day qs (dm3/person) | 30 (Warsaw, Prague, Bratislava, Budapest) 42 (Stockholm, Madrid) 70 (Lisbon, Rome) |
| Water consumption for handwashing per day qh (dm3/person) | 10 |
Table 4.
Financial outlays incurred for the implementation of the analyzed variants of the installation.
Table 4.
Financial outlays incurred for the implementation of the analyzed variants of the installation.
| The Financial Outlays of Analyzed Solutions | Value |
|---|---|
| The sanitary systems INV0 | EUR 2500 |
| GWRS INVGWRS | EUR 5500 |
| RWHS INVRWHS_1 m3 | EUR 2216 |
| RWHS INVRWHS_2 m3 | EUR 2259 |
| RWHS INVRWHS_3 m3 | EUR 2313 |
| RWHS INVRWHS_4 m3 | EUR 2421 |
| RWHS INVRWHS_5 m3 | EUR 2569 |
| RWHS INVRWHS_7 m3 | EUR 2729 |
| RWHS INVRWHS_9 m3 | EUR 3106 |
| RWHS INVRWHS_11 m3 | EUR 3647 |
Table 5.
Unit prices and their annual growth adopted for LCC analysis.
| City | The Unit Price of Tap Water and Sewage Discharge to the Network, EUR/m3 | The Annual Increase in the Water and Sewage Prices, % | The Unit Price of Electricity, EUR/kWh | The Annual Increase in Electricity Price, % | The Unit Price of the Rainwater Discharge to the Drainage System |
|---|---|---|---|---|---|
| Bratislava | 2.23 | 2 | 0.15 | 2 | - |
| Budapest | 2.94 | 2 | 0.11 | - | |
| Lisbon | 2.26 | 20 | 0.23 | - | |
| Madrid | 3.16 | 12 | 0.25 | - | |
| Prague | 3.49 | 9 | 0.16 | - | |
| Rome | 3.50 | 6 | 0.22 | 0.23 EUR/m3 | |
| Stockholm | 2.30 | 4 | 0.20 | 38.76 EUR/year/house | |
| Warsaw | 2.31 | 4 | 0.14 | - |
Table 6.
Results of LCC analysis for a building located in Lisbon (green color—the lowest value of LCC, red color—the highest value of LCC).
Table 6.
Results of LCC analysis for a building located in Lisbon (green color—the lowest value of LCC, red color—the highest value of LCC).
| Persons | Variant | Life Cycle Cost LCC, EUR | |||||||
|---|---|---|---|---|---|---|---|---|---|
| Tank Volume (m3) | |||||||||
| 1 | 2 | 3 | 4 | 5 | 7 | 9 | 11 | ||
| 2 | 0 | 186,193 | |||||||
| 1 | 180,552 | 179,202 | 178,510 | 178,071 | 177,721 | 177,235 | 177,462 | 178,003 | |
| 2 | 178,512 | 176,118 | 175,127 | 174,539 | 174,040 | 173,156 | 172,588 | 172,631 | |
| 3 | 177,667 | 175,073 | 173,933 | 173,196 | 172,647 | 171,713 | 171,045 | 170,592 | |
| 4 | 181,038 | ||||||||
| 5 | 171,912 | 169,319 | 168,179 | 167,442 | 166,893 | 165,959 | 165,291 | 164,837 | |
| 3 | 0 | 259,379 | |||||||
| 1 | 251,499 | 249,055 | 248,014 | 247,426 | 246,877 | 246,043 | 245,425 | 245,369 | |
| 2 | 249,161 | 245,722 | 243,886 | 242,899 | 242,251 | 241,217 | 240,600 | 240,195 | |
| 3 | 248,464 | 244,876 | 242,990 | 241,954 | 241,306 | 240,322 | 239,704 | 239,250 | |
| 4 | 247,891 | ||||||||
| 5 | 236,378 | 232,790 | 230,854 | 229,867 | 229,220 | 228,235 | 227,618 | 227,213 | |
| 4 | 0 | 332,028 | |||||||
| 1 | 322,407 | 319,167 | 317,530 | 316,643 | 316,095 | 315,110 | 314,493 | 314,039 | |
| 2 | 319,821 | 215,735 | 313,302 | 311,868 | 310,872 | 309,639 | 308,872 | 308,467 | |
| 3 | 319,224 | 315,038 | 312,556 | 311,072 | 310,076 | 308,893 | 308,125 | 307,771 | |
| 4 | 314,188 | ||||||||
| 5 | 300,785 | 296,600 | 294,117 | 292,633 | 291,637 | 290,454 | 289,687 | 289,332 | |
Table 7.
Results of LCC analysis for a building located in Madrid (green color—the lowest value of LCC, red color—the highest value of LCC).
Table 7.
Results of LCC analysis for a building located in Madrid (green color—the lowest value of LCC, red color—the highest value of LCC).
| Persons | Variant | Life Cycle Cost LCC, EUR | |||||||
|---|---|---|---|---|---|---|---|---|---|
| Tank Volume (m3) | |||||||||
| 1 | 2 | 3 | 4 | 5 | 7 | 9 | 11 | ||
| 2 | 0 | 51,004 | |||||||
| 1 | 50,372 | 49,618 | 49,203 | 49,030 | 49,037 | 49,033 | 49,340 | 49,881 | |
| 2 | 49,739 | 48,633 | 48,054 | 47,694 | 47,513 | 47,298 | 47,394 | 47,724 | |
| 3 | 49,411 | 48,165 | 47,539 | 47,131 | 46,927 | 46,595 | 46,503 | 46,646 | |
| 4 | 52,581 | ||||||||
| 5 | 50,366 | 49,120 | 48,517 | 48,109 | 47,906 | 47,573 | 47,482 | 47,601 | |
| 3 | 0 | 66,330 | |||||||
| 1 | 65,018 | 63,866 | 63,310 | 62,926 | 62,746 | 62,484 | 62,579 | 62,886 | |
| 2 | 64,385 | 62,998 | 62,185 | 61,754 | 61,456 | 60,936 | 60,798 | 61,011 | |
| 3 | 64,151 | 62,694 | 61,857 | 61,355 | 61,034 | 60,444 | 60,282 | 60,471 | |
| 4 | 64,923 | ||||||||
| 5 | 62,145 | 60,688 | 59,851 | 59,349 | 59,005 | 58,438 | 58,276 | 58,442 | |
| 4 | 0 | 81,656 | |||||||
| 1 | 79,852 | 78,512 | 77,769 | 77,314 | 77,064 | 76,614 | 76,522 | 76,759 | |
| 2 | 79,290 | 77,692 | 76,784 | 76,236 | 75,892 | 75,208 | 75,069 | 75,235 | |
| 3 | 79,079 | 77,481 | 76,573 | 75,978 | 75,587 | 74,856 | 74,717 | 74,907 | |
| 4 | 77,255 | ||||||||
| 5 | 74,079 | 72,481 | 71,574 | 70,978 | 70,564 | 69,833 | 69,718 | 69,807 | |
Table 8.
Results of LCC analysis for a building located in Prague (green color—the lowest value of LCC, red color—the highest value of LCC).
Table 8.
Results of LCC analysis for a building located in Prague (green color—the lowest value of LCC, red color—the highest value of LCC).
| Persons | Variant | Life Cycle Cost LCC, EUR | |||||||
|---|---|---|---|---|---|---|---|---|---|
| Tank Volume (m3) | |||||||||
| 1 | 2 | 3 | 4 | 5 | 7 | 9 | 11 | ||
| 2 | 0 | 20,298 | |||||||
| 1 | 21,196 | 21,067 | 21,024 | 21,067 | 21,161 | 21,321 | 21,698 | 22,239 | |
| 2 | 20,625 | 20,302 | 20,205 | 20,216 | 20,278 | 20,319 | 20,686 | 21,227 | |
| 3 | 19,591 | 18,707 | 18,244 | 18,008 | 17,929 | 17,766 | 17,895 | 18,232 | |
| 4 | 25,120 | ||||||||
| 5 | 23,813 | 22,929 | 22,466 | 22,230 | 22,151 | 21,988 | 22,117 | 22,454 | |
| 3 | 0 | 27,145 | |||||||
| 1 | 27,428 | 27,083 | 26,976 | 26,987 | 27,049 | 27,079 | 27,435 | 27,976 | |
| 2 | 26,846 | 26,286 | 26,017 | 25,953 | 25,971 | 25,937 | 26,174 | 26,597 | |
| 3 | 25,995 | 24,929 | 24,369 | 24,132 | 24,032 | 23,837 | 23,955 | 24,313 | |
| 4 | 30,595 | ||||||||
| 5 | 28,846 | 27,769 | 27,209 | 26,983 | 26,883 | 26,687 | 26,806 | 27,164 | |
| 4 | 0 | 33,989 | |||||||
| 1 | 33,831 | 33,324 | 33,098 | 33,045 | 33,085 | 33,073 | 33,320 | 32,807 | |
| 2 | 33,324 | 32,538 | 32,172 | 31,978 | 31,921 | 31,823 | 31,963 | 32,342 | |
| 3 | 32,646 | 31,536 | 30,954 | 30,696 | 30,564 | 30,347 | 30,498 | 30,899 | |
| 4 | 36,063 | ||||||||
| 5 | 34,121 | 33,011 | 32,429 | 32,171 | 32,050 | 31,833 | 31,973 | 32,374 | |
Table 9.
Results of LCC analysis for a building located in Rome (green color—the lowest value of LCC, red color—the highest value of LCC).
Table 9.
Results of LCC analysis for a building located in Rome (green color—the lowest value of LCC, red color—the highest value of LCC).
| Persons | Variant | Life Cycle Cost LCC, EUR | |||||||
|---|---|---|---|---|---|---|---|---|---|
| Tank Volume (m3) | |||||||||
| 1 | 2 | 3 | 4 | 5 | 7 | 9 | 11 | ||
| 2 | 0 | 32,336 | |||||||
| 1 | 32,695 | 32,431 | 32,366 | 32,415 | 32,523 | 32,644 | 33,011 | 33,552 | |
| 2 | 32,190 | 31,728 | 31,564 | 31,563 | 31,612 | 31,624 | 31,922 | 32,433 | |
| 3 | 32,012 | 31,451 | 31,208 | 31,118 | 31,097 | 30,950 | 31,060 | 31,373 | |
| 4 | 37,380 | ||||||||
| 5 | 36,457 | 35,896 | 35,653 | 35,563 | 35,543 | 35,406 | 35,505 | 35,819 | |
| 3 | 0 | 43,218 | |||||||
| 1 | 43,042 | 42,560 | 42,377 | 42,376 | 42,425 | 42,426 | 42,714 | 43,216 | |
| 2 | 42,577 | 41,818 | 41,505 | 41,356 | 41,355 | 41,307 | 41,506 | 41,899 | |
| 3 | 42,438 | 41,630 | 41,278 | 41,098 | 41,048 | 40,892 | 40,991 | 41,324 | |
| 4 | 47,002 | ||||||||
| 5 | 45,623 | 44,814 | 44,472 | 44,283 | 44,233 | 44,076 | 44,186 | 44,509 | |
| 4 | 0 | 54,099 | |||||||
| 1 | 53,566 | 52,866 | 52,584 | 52,484 | 52,513 | 52,475 | 52,684 | 53,086 | |
| 2 | 53,091 | 52,124 | 51,693 | 51,474 | 51,384 | 51,227 | 51,426 | 51,838 | |
| 3 | 52,972 | 51,975 | 51,524 | 51,286 | 51,186 | 50,970 | 51,109 | 51,472 | |
| 4 | 56,618 | ||||||||
| 5 | 54,892 | 53,896 | 53,445 | 53,206 | 53,107 | 52,890 | 53,030 | 53,392 | |
Table 10.
Results of LCC analysis for a building located in Bratislava (green color—the lowest value of LCC, red color—the highest value of LCC).
Table 10.
Results of LCC analysis for a building located in Bratislava (green color—the lowest value of LCC, red color—the highest value of LCC).
| Persons | Variant | Life Cycle Cost LCC, EUR | |||||||
|---|---|---|---|---|---|---|---|---|---|
| Tank Volume (m3) | |||||||||
| 1 | 2 | 3 | 4 | 5 | 7 | 9 | 11 | ||
| 2 | 0 | 6836 | |||||||
| 1 | 9283 | 9288 | 9318 | 9414 | 9557 | 9713 | 10089 | 10415 | |
| 2 | 9181 | 9140 | 9156 | 9238 | 9364 | 9513 | 9882 | 10197 | |
| 3 | 8986 | 8818 | 8752 | 8781 | 8876 | 8974 | 9301 | 9606 | |
| 4 | 13,847 | ||||||||
| 5 | 15,398 | 15,230 | 15,164 | 15,193 | 15,285 | 15,385 | 15,711 | 16,210 | |
| 3 | 0 | 8604 | |||||||
| 1 | 10,940 | 10,894 | 10,910 | 10,989 | 11,115 | 11,262 | 11,632 | 12,171 | |
| 2 | 10,846 | 10,739 | 10,715 | 10,774 | 10,889 | 10,996 | 11,344 | 11,876 | |
| 3 | 10,707 | 10,517 | 10,435 | 10,457 | 10,547 | 10,634 | 10,958 | 11,459 | |
| 4 | 15,333 | ||||||||
| 5 | 16,836 | 16,644 | 16,565 | 16,587 | 16,677 | 16,764 | 17,090 | 17,589 | |
| 4 | 0 | 10,372 | |||||||
| 1 | 12,634 | 12,542 | 12,529 | 12,593 | 12,710 | 12,825 | 13,187 | 13,719 | |
| 2 | 12,556 | 12,409 | 12,354 | 12,389 | 12,479 | 12,566 | 12,892 | 13,393 | |
| 3 | 12,448 | 12,240 | 12,150 | 12,160 | 12,251 | 12,337 | 12,659 | 13,153 | |
| 4 | 16,817 | ||||||||
| 5 | 18,217 | 17,960 | 17,837 | 17,820 | 17,880 | 17,922 | 18,224 | 18,703 | |
Table 11.
Results of LCC analysis for a building located in Budapest (green color—the lowest value of LCC, red color—the highest value of LCC).
Table 11.
Results of LCC analysis for a building located in Budapest (green color—the lowest value of LCC, red color—the highest value of LCC).
| Persons | Variant | Life Cycle Cost LCC, EUR | |||||||
|---|---|---|---|---|---|---|---|---|---|
| Tank Volume (m3) | |||||||||
| 1 | 2 | 3 | 4 | 5 | 7 | 9 | 11 | ||
| 2 | 0 | 7462 | |||||||
| 1 | 9803 | 9781 | 9820 | 9928 | 10,076 | 10,236 | 10,613 | 11,154 | |
| 2 | 9674 | 9603 | 9597 | 9679 | 9822 | 9982 | 10,359 | 10,900 | |
| 3 | 9441 | 9246 | 9147 | 9162 | 9258 | 9341 | 9645 | 10,116 | |
| 4 | 14,378 | ||||||||
| 5 | 13,542 | 13,304 | 13,152 | 13,059 | 13,007 | 12,929 | 12,852 | 12,787 | |
| 3 | 0 | 9475 | |||||||
| 1 | 11,677 | 11,601 | 11,595 | 11,675 | 11,815 | 11,975 | 12,352 | 12,893 | |
| 2 | 11,550 | 11,412 | 11,370 | 11,416 | 11,520 | 11,636 | 12,003 | 12,536 | |
| 3 | 11,372 | 11,146 | 11,037 | 11,039 | 11,111 | 11,173 | 11,478 | 11,951 | |
| 4 | 16,062 | ||||||||
| 5 | 15,144 | 14,875 | 14,712 | 14,606 | 14,531 | 14,432 | 14,360 | 14,293 | |
| 4 | 0 | 11,488 | |||||||
| 1 | 13,592 | 13,469 | 13,438 | 13,492 | 13,603 | 13,737 | 14,107 | 14,648 | |
| 2 | 13,475 | 13,280 | 13,208 | 13,238 | 13,319 | 13,386 | 13,706 | 14,221 | |
| 3 | 13,330 | 13,079 | 12,957 | 12,956 | 13,026 | 13,060 | 13,343 | 13,817 | |
| 4 | 17,745 | ||||||||
| 5 | 16,772 | 16,477 | 16,301 | 16,193 | 16,113 | 15,988 | 15,895 | 15,828 | |
Table 12.
Results of LCC analysis for a building located in Warsaw (green color—the lowest value of LCC, red color—the highest value of LCC).
Table 12.
Results of LCC analysis for a building located in Warsaw (green color—the lowest value of LCC, red color—the highest value of LCC).
| Persons | Variant | Life Cycle Cost LCC, EUR | |||||||
|---|---|---|---|---|---|---|---|---|---|
| Tank Volume (m3) | |||||||||
| 1 | 2 | 3 | 4 | 5 | 7 | 9 | 11 | ||
| 2 | 0 | 7779 | |||||||
| 1 | 10,197 | 10,203 | 10,233 | 10,327 | 10,470 | 10,625 | 11,002 | 11,543 | |
| 2 | 10,067 | 10,044 | 10,065 | 10,147 | 10,274 | 10,415 | 10,787 | 11,324 | |
| 3 | 9753 | 9562 | 9494 | 9519 | 9603 | 9685 | 9996 | 10,483 | |
| 4 | 14,753 | ||||||||
| 5 | 16,129 | 15,938 | 15,869 | 15,894 | 15,979 | 16,061 | 16,372 | 16,861 | |
| 3 | 0 | 9967 | |||||||
| 1 | 12,246 | 12,218 | 12,237 | 12,319 | 12,446 | 12,587 | 12,957 | 13,493 | |
| 2 | 12,109 | 12,022 | 12,015 | 12,080 | 12,200 | 12,313 | 12,659 | 13,186 | |
| 3 | 11,878 | 11,654 | 11,573 | 11,594 | 11,676 | 11,744 | 12,057 | 12,553 | |
| 4 | 16,641 | ||||||||
| 5 | 17,953 | 17,729 | 17,648 | 17,669 | 17,751 | 17,818 | 18,129 | 18,628 | |
| 4 | 0 | 12,156 | |||||||
| 1 | 14,331 | 14,258 | 14,258 | 14,330 | 14,452 | 14,567 | 14,925 | 15,452 | |
| 2 | 14,196 | 14,064 | 14,021 | 14,075 | 14,176 | 14,263 | 14,585 | 15,088 | |
| 3 | 14,021 | 13,785 | 13,691 | 13,709 | 13,788 | 13,856 | 14,172 | 14,673 | |
| 4 | 18,528 | ||||||||
| 5 | 19,794 | 19,559 | 19,464 | 19,482 | 19,562 | 19,629 | 19,945 | 20,446 | |
Table 13.
Results of LCC analysis for a building located in Stockholm (green color—the lowest value of LCC, red color—the highest value of LCC).
Table 13.
Results of LCC analysis for a building located in Stockholm (green color—the lowest value of LCC, red color—the highest value of LCC).
| Persons | Variant | Life Cycle Cost LCC, EUR | |||||||
|---|---|---|---|---|---|---|---|---|---|
| Tank Volume (m3) | |||||||||
| 1 | 2 | 3 | 4 | 5 | 7 | 9 | 11 | ||
| 2 | 0 | 10,406 | |||||||
| 1 | 11,942 | 11,945 | 11,973 | 12,069 | 12,217 | 12,377 | 12,754 | 13,295 | |
| 2 | 11,819 | 11,782 | 11,798 | 11,878 | 12,002 | 12,157 | 12,534 | 13,075 | |
| 3 | 11,533 | 11,366 | 11,307 | 11,341 | 11,433 | 11,531 | 11,856 | 12,350 | |
| 4 | 17,380 | ||||||||
| 5 | 17,909 | 17,741 | 17,682 | 17,717 | 17,808 | 17,907 | 18,232 | 18,723 | |
| 3 | 0 | 13,470 | |||||||
| 1 | 14,873 | 14,845 | 14,864 | 14,948 | 15,073 | 15,214 | 15,584 | 16,120 | |
| 2 | 14,750 | 14,649 | 14,630 | 14,688 | 14,799 | 14,897 | 15,251 | 15,792 | |
| 3 | 14,535 | 14,342 | 14,280 | 14,308 | 14,402 | 14,484 | 14,811 | 15,307 | |
| 4 | 20,143 | ||||||||
| 5 | 20,610 | 20,417 | 20,353 | 20,383 | 20,477 | 20,561 | 20,886 | 21,382 | |
| 4 | 0 | 16,533 | |||||||
| 1 | 17,842 | 17,753 | 17,701 | 17,809 | 17,926 | 18,034 | 18,402 | 18,943 | |
| 2 | 17,719 | 17,590 | 17,542 | 17,582 | 17,678 | 17,753 | 18,064 | 17,560 | |
| 3 | 17,559 | 17,354 | 17,283 | 17,315 | 17,411 | 17,500 | 17,823 | 18,324 | |
| 4 | 22,905 | ||||||||
| 5 | 23,332 | 23,129 | 23,056 | 23,088 | 23,184 | 23,273 | 23,596 | 24,097 | |
Table 14.
General information about the surveyed groups of respondents.
| Country | Number of Respondents | |||||||||
|---|---|---|---|---|---|---|---|---|---|---|
| Total | Gender | Age | Education | Place of Living | ||||||
| Female | Male | <35 Yrs Old | 35–45 Yrs Old | ≥45 Yrs Old | Secondary | Higher | Village | City | ||
| The Czech Republic | 65 | 33 | 32 | 25 | 25 | 14 | 19 | 44 | 30 | 35 |
| Spain | 60 | 29 | 31 | 20 | 27 | 13 | 16 | 44 | 21 | 39 |
| Poland | 70 | 34 | 36 | 33 | 27 | 10 | 19 | 51 | 27 | 43 |
| Portugal | 55 | 27 | 28 | 23 | 18 | 14 | 14 | 41 | 23 | 32 |
| Slovakia | 70 | 34 | 36 | 27 | 24 | 18 | 15 | 55 | 19 | 51 |
| Sweden | 50 | 22 | 28 | 19 | 20 | 11 | 8 | 42 | 17 | 33 |
| Hungary | 55 | 25 | 30 | 22 | 23 | 10 | 14 | 41 | 22 | 33 |
| Italy | 60 | 33 | 27 | 27 | 16 | 17 | 16 | 44 | 22 | 38 |
Publisher’s Note: MDPI stays neutral with regard to jurisdictional claims in published maps and institutional affiliations. |
© 2022 by the authors. Licensee MDPI, Basel, Switzerland. This article is an open access article distributed under the terms and conditions of the Creative Commons Attribution (CC BY) license (https://creativecommons.org/licenses/by/4.0/).
Share and Cite
MDPI and ACS Style
Stec, A.; Słyś, D. Financial and Social Factors Influencing the Use of Unconventional Water Systems in Single-Family Houses in Eight European Countries. Resources 2022, 11, 16. https://0-doi-org.brum.beds.ac.uk/10.3390/resources11020016
AMA Style
Stec A, Słyś D. Financial and Social Factors Influencing the Use of Unconventional Water Systems in Single-Family Houses in Eight European Countries. Resources. 2022; 11(2):16. https://0-doi-org.brum.beds.ac.uk/10.3390/resources11020016
Chicago/Turabian StyleStec, Agnieszka, and Daniel Słyś. 2022. "Financial and Social Factors Influencing the Use of Unconventional Water Systems in Single-Family Houses in Eight European Countries" Resources 11, no. 2: 16. https://0-doi-org.brum.beds.ac.uk/10.3390/resources11020016
Note that from the first issue of 2016, this journal uses article numbers instead of page numbers. See further details here.