
A New Concept of Crisis Water Management in Urban Areas Based on the Risk Maps of Lack of Water Supply in Response to European Law

Department of Water Supply and Sewerage Systems, Faculty of Civil, Environmental Engineering and Architecture, Rzeszow University of Technology, Al. Powstancow Warszawy 6, 35-959 Rzeszow, Poland
Resources 2022, 11(2), 17; https://0-doi-org.brum.beds.ac.uk/10.3390/resources11020017
Submission received: 6 November 2021
/
Revised: 14 January 2022
/
Accepted: 28 January 2022
/
Published: 3 February 2022
Abstract
:The paper presents issues related to ensuring the safety of water supply, based on the analysis and assessment of the risk of the lack of water supply to consumers using risk maps, in accordance with the current global trend recommended by guidelines and procedures, compliance with which should be a priority activity in the struggle against adverse events, related to the functioning of every collective water supply system (CWSS). The work contribution is the development of an original methodology of risk analysis and assessment for the needs of mapping the risk of a lack of water supply in the normal operation of the water supply network, as well as during a crisis. The presented methods take into account the quantitative aspect of the lack of water supply, with the possibility of extending the proposed solutions with a qualitative aspect. The article will contribute to the development of knowledge in the area of analysis and assessment of the risk of a water supply failure in PsDyW, and will determine new standards in its graphical presentation. It is a response to the World Health Organization (WHO) requirements of providing protection for the critical infrastructure and ensuring access to water for all citizens in the European Union.
1. Introduction
Most people in the European Union (EU) have access to high-quality drinking water, especially if we compare European countries to other regions of the world. This is due to a long tradition of drinking water management, but also to a large extent due to European environmental legislation and funding. Over the last decade in the international law, especially at the United Nations (UN) level, the right to safe drinking water and sanitation was accepted. In the UN General Assembly Resolution 64/292 and the Human Rights Council we can find the right to safe and clean drinking water and sanitation is a human right that is essential for the full enjoyment of life and all human rights [1]. At European level, the Parliamentary Assembly of the Council of Europe has stated that access to water must be recognized as a fundamental human right, because water is essential to life on Earth and is a common good that belongs to all mankind [2]. Access to drinking water is and should be an undoubted priority for the leaders of states and should constitute their safety as one of the basic needs in the daily functioning of citizens. Drinking water is undoubtedly a priority for many Europeans. It was the subject of the first in the history European citizens’ initiative “Right2Water”, which collected over 1.8 million signatures and received a positive response from the Commission. The initiative was submitted to the Commission in December 2013 and its main demand was that “EU institutions and Member States should be obliged to ensure the right to water and sanitation” and that “the EU should step up efforts to achieve universal access to water and sanitation”. In its reply, the Commission asked Member States to do their utmost to ensure that everyone has access to a minimum demand of water supply. It is coherent with the UN’s 2030 agenda, especially with Goal 6 of the UN Sustainable Development, and is related to the goal of universal and equitable access to safe drinking water at an affordable price. The Commission has also committed to making a review of the Directive 98/83/EC [3]. The outcome of this work has been fed into the Commission’s Regulatory Fitness and Performance Program (REFIT) [4]. The proposal of a new Directive with all the changes (in 2003, 2009 and 2015) aims to help Member States manage drinking water in an economical and sustainable way and to reduce energy consumption and unnecessary water loss. Another legal act relating to water management is the Water Framework Directive 2000/60/EC [5] establishing a framework for Community action by Member States in the field of water policy. The related legal act is the Directive of the European Parliament and of the Council of 14 March 2007 establishing an Infrastructure for Spatial Information in the European Community (INSPIRE) [6], which requires by necessity the public to have access to understandable information about the environment at the national level. The fact that access to safe drinking water and sanitation is inextricably linked to the right to life, human dignity and the requirement to ensure a fair standard of living, has also been noticed by the World Health Organization (WHO). It was confirmed by the opening words of the 4th edition of the WHO guidelines on the quality of drinking water, recommending the creation and implementation of water safety plans (WSP) [7]: the most effective means of consistently ensuring the safety of a drinking-water supply is through the use of a comprehensive risk assessment and risk management approach that encompasses all steps in the water supply from catchment to consumer. In these guidelines, such approaches are termed water safety plans (WSPs).
In previous centuries, threats that resulted in the lack of water supply were caused mainly by the forces of nature, but with technological progress and increasing anthropogenic activity, it has become inevitable to analyze safety in a different way. All attempts to reduce by humans the negative effects of adverse events, in terms of quality and quantity, consisted mainly in understanding the phenomena and processes that were believed to be their source. Most often, these were ex-post attempts, i.e., when an event occurred and when we saw its negative effects. In safety engineering, activities are mainly aimed at counteracting these predictable events and minimizing the effects of adverse events. This action is based on the implementation of the requirements contained in standards, guidelines, the use of appropriate methods, techniques of risk analysis and the use of good engineering practice in the field of project management in order to ensure the safety of the water supply.
The main purpose of the study is to present the proprietary methodology of risk analysis and assessment for the purpose of creating risk maps of lack of water supply during a crisis, taking into account the quantitative aspect and the possibility of extending the proposed solutions with a qualitative aspect. Based on the existing knowledge in the studied area, a method was developed to bring new standards in the analyses and assessments of water supply safety. The practical aspect of the work is the possibility of using the results of the risk analysis and assessment to develop fast reaction plans, when a lack of water supply occurs. The proposed method can complement the WHO guidelines, as well as meet the expectations related to crisis management, which can be found in the white paper—“Adapting to climate change: towards a European framework for action” [8].
2. Materials and Methods
2.1. Risk of Lack of Water Supply in Normal Exploitation of the Water Network
The main source of drinking water supply to the population is the collective water supply system (CWSS). This system belongs to the critical infrastructure (CI) and it is one of the main systems securing basic life needs. Legal regulations related to the safe operation of the water supply system have been established by the WHO. In Poland, legal regulations include the act on collective water supply and sewage disposal [9], the regulation by the minister of health on the quality of water intended for human consumption [10] and the act on crisis management [11]. The requirements for all CWSS consist mainly in securing the water consumer’s needs, i.e., providing water in good quality, in the appropriate amount, under the right pressure and at any time of the day or night [12,13]. Water supply system failures are the main reasons for the loss of safety by water consumers, resulting in no or limited water supply [14,15,16]. Failures may arise as a result of random events or as a result of human activity, but most often they are the sum of several factors. The safety of the functioning of the CWSS belonging to CIs is ensured, when the system operator complies with the safety requirements, legal regulations and standards [17,18,19,20,21,22,23]. Moreover, in order to increase the safety of the water supply, the recommendations aimed to counteract water supply failures and their negative effects on the system operator. The aforementioned activities are the basis for ensuring the safety of water supply to recipients. They should be part of the actions taken by water companies every day. These actions should include [24,25,26,27,28,29,30,31].
- The requirements of the spatial development plan,
- -
- Demarcation of controlled zones,
- Application of standards and guidelines at the design stage
- -
- In accordance with the best available technique (BAT),
- -
- Selection of designers and their office with a quality system certificate,
- -
- Using computer simulation to conduct reliability analyses,
- Executive and investor supervision,
- -
- Verification of material specification,
- -
- Testing the effectiveness of cathodic protection,
- Renting a construction company with a certificate,
- Monitoring, detection and localization of leaks in the water supply network,
- -
- Methods of observing the routes of the water supply,
- -
- Methods related to pressure and flow measurement,
- -
- Acoustic methods,
- Proper organization and equipping with modern equipment of repair brigades,
- Making risk analyses and assessments, analyses of the reliability and safety of the functioning of the water supply network,
- Water quality monitoring,
- -
- Biofilm monitoring in the network, e.g., using biosensors,
- -
- Use of the multi-barrier system,
- -
- Developing a water safety plan (WSP).
Risk, as a measure of safety, is directly related to the loss of water supply safety. The specialized scientific literature clearly shows the trend that quantitative and qualitative methods of risk analysis and assessment are the basis for managing the safety of water systems, and thus the safety of its operation.
In terms of functioning of the CWSS, the risk of lack of water or its limitation, as a result of an undesirable event is inherent in both the producer and the water consumer. In the case of a water producer, it entails financial outlays that the enterprise incurs at the time of the undesirable event. In relation to the water consumer, the risk is related to the loss of the safety of water supply due to the inconvenience related to the interruption in water supply, lack of it and possible loss of health or life as a result of consuming poor-quality water.
Therefore, the risk is a measure of the loss of safety and must be interpreted as the probability of the occurrence of an undesirable event and the negative effects caused by them.
Before starting to map the risk, the risk level should be estimated using one of the common risk analysis methods. For this purpose, a matrix method was selected, belonging to the group of quantitative-qualitative risk analyses.
Regarding the mathematical aspect, in its simplest form, the risk “r” is defined as a function of two parameters: the probability of the occurrence of the undesirable event “P” and its negative consequences “C” [30,32,33]:
Using formula (1), the numerical value of the risk is obtained. The next step is to categorize the risk according to the one available category.
Research related to the municipal infrastructure risk analysis, has shown that its size (except the probability and the consequences parameter) is influenced by the protection parameter “O”, which is inversely proportional to the risk size, or the vulnerability parameter “V”. The numerical risk assessment is the product of the parameters listed below [34,35]:
or
where:
P—point weight related to the probability of a given representative adverse event occurrence,
C—point weight related to the number of losses,
O—point weight related to the protection of the system against threats,
V—point weight related to vulnerability.
In the field of municipal infrastructure, a four-parameter matrix can be used, which takes into account the number of inhabitants exposed to losses, as a result of an infrastructure failure (e.g., water supply or sewage system). The four-parameter risk matrix can be determined according to the formula 4 [30,35]:
where:
P—point weight related to the probability of a given representative adverse event occurrence,
C—point weight related to the amount of losses,
N—point weight related to the number of inhabitants affected by the risk,
O—point weight related to the protection of municipal infrastructure against extraordinary threats.
To determine the risk associated with the failure of the water supply network, formula 5 has been proposed [30,34]:
where:
I—point weight related to the failure intensity λ,
S—point weight related to the type of water supply network,
U—point weight related to the inconvenience of damage repair,
O—point weight related to the protection of the water supply network from the undesirable event.
In the case of very extensive CWSS in large urban agglomerations, a five-parameter risk estimation matrix can be used according to formula 6 [30,34]:
where:
P—point weight related to the probability of a given representative adverse event occurrence,
C—point weight related to the amount of losses,
N—point weight related to the number of inhabitants affected by the risk,
O—point weight related to the protection of municipal infrastructure against extraordinary threats.
E—point weight related to risk exposure.
2.2. A New Concept of Risk Analysis Based on Risk Maps of Lack of Water Supply in a Crisis—Assumptions of the Method
With a view to supporting water supply safety, the safety management process should contain risk maps developed for crisis conditions. These maps would complement, and at the same time supplement, emergency plans for the provision of drinking water to the public. A crisis is defined as a: period of difficulties, dangers or threats to priority values. With the ever-increasing demands of water utility users, there is a constant need to ensure water supply in a qualitative and quantitative sense. An incidental event, such as contamination of source water, has many negative consequences, i.e., exceeding the quality standards of drinking water, which may result in the suspension of water supply to all its consumers. These events are rare, but as the literature proves, they cannot be avoided. Crisis prevention, and thus reducing the risk of lack of water supply, as a result of adverse events triggering crisis situations, is associated with the estimation of the risk value or the use of a multi-barrier system. This system is designed to ensure a high level of safety in the water supply system to people by means of countermeasures for each type of threat, the so-called barriers [35]. The multi-barrier system is an effective way of protecting water consumers against its poor quality. One of the eight barriers that make up the system is the provision of water from alternative water sources [36].
This section may be divided into subheadings. It should provide a concise and precise description of the experimental results, their interpretation, as well as the experimental conclusions that can be drawn.
The first stage of research in the development of risk maps is the logistic analysis of the city’s emergency supply of drinking water. The following activities were proposed to be performed under the above-mentioned analysis:
- Water balance in a crisis,
- Summary of the efficiency of alternative water sources, including water intakes in the city, public wells,
- Risk maps of lack of water supply in a crisis.
The analysis of emergency water supply can be an additional component of WSP and can ensure an increase in the safety of water supply from the point of view of water consumers.
The next stage of research is the visualization of the obtained results of the risk analysis of a lack of water supply in a crisis. This visualization can be presented as a risk map. To be able to obtain the risk maps, the following elements have been proposed as a research area during the process (risk mapping):
- The adopted definition of risk and its measure,
- Description of risk parameters,
- Map/scheme of the water supply area in crisis conditions, divided into zones,
- Location and summary of the efficiency of public wells, as alternative sources of water supply,
- Computer software, that allows the visualization of the obtained results of risk analysis of lack of water supply in a crisis (e.g., CAD software).
To estimate the risk of lack of water supply in a crisis, the definition of risk was proposed as a function of two parameters:
Therefore, it is proposed that the risk of lack of water supply in a crisis should be determined on the basis of a two-parameter risk matrix in accordance with formula 8:
where:
Pj—point weight related to the probability of an undesirable event, that may trigger a crisis,
ΔQi—point weight related to deficiency of water supply from alternative water sources per capita and expressed as a percentage.
Table 1 and Table 2 propose descriptive-point scale criteria for individual risk parameters based on author research and studies.
Using formula (8), a two-parameter risk matrix in a numerical form was obtained and presented in Table 3.
For particular risk values, the scales and the corresponding levels of risk were proposed in Table 4.
The matrix proposal and the criteria of the descriptive-point scale can be modified depending on the needs of the CWSS operator.
2.3. Expected Map Users
The users of the developed risk maps may be various organizations and various departments of the water supply companies. The information presented on the maps should be adapted to the individual needs of the recipient.
Potential risk maps users:
- Repair brigades—very useful from the point of view of the operation of the water supply network in the analyzed water supply area; necessary when planning renovation works when selecting pipes with the highest probability of failure; in the process of safety management, primarily when taking actions to reduce losses after the occurrence of a specific undesirable event; useful when optimizing the allocation of funds, which basis should be risk maps,
- Crisis management units—useful from the point of view of responding to incidental events, such as technical disasters, incidental water contamination or terrorist attacks.
3. Results
3.1. Research Object
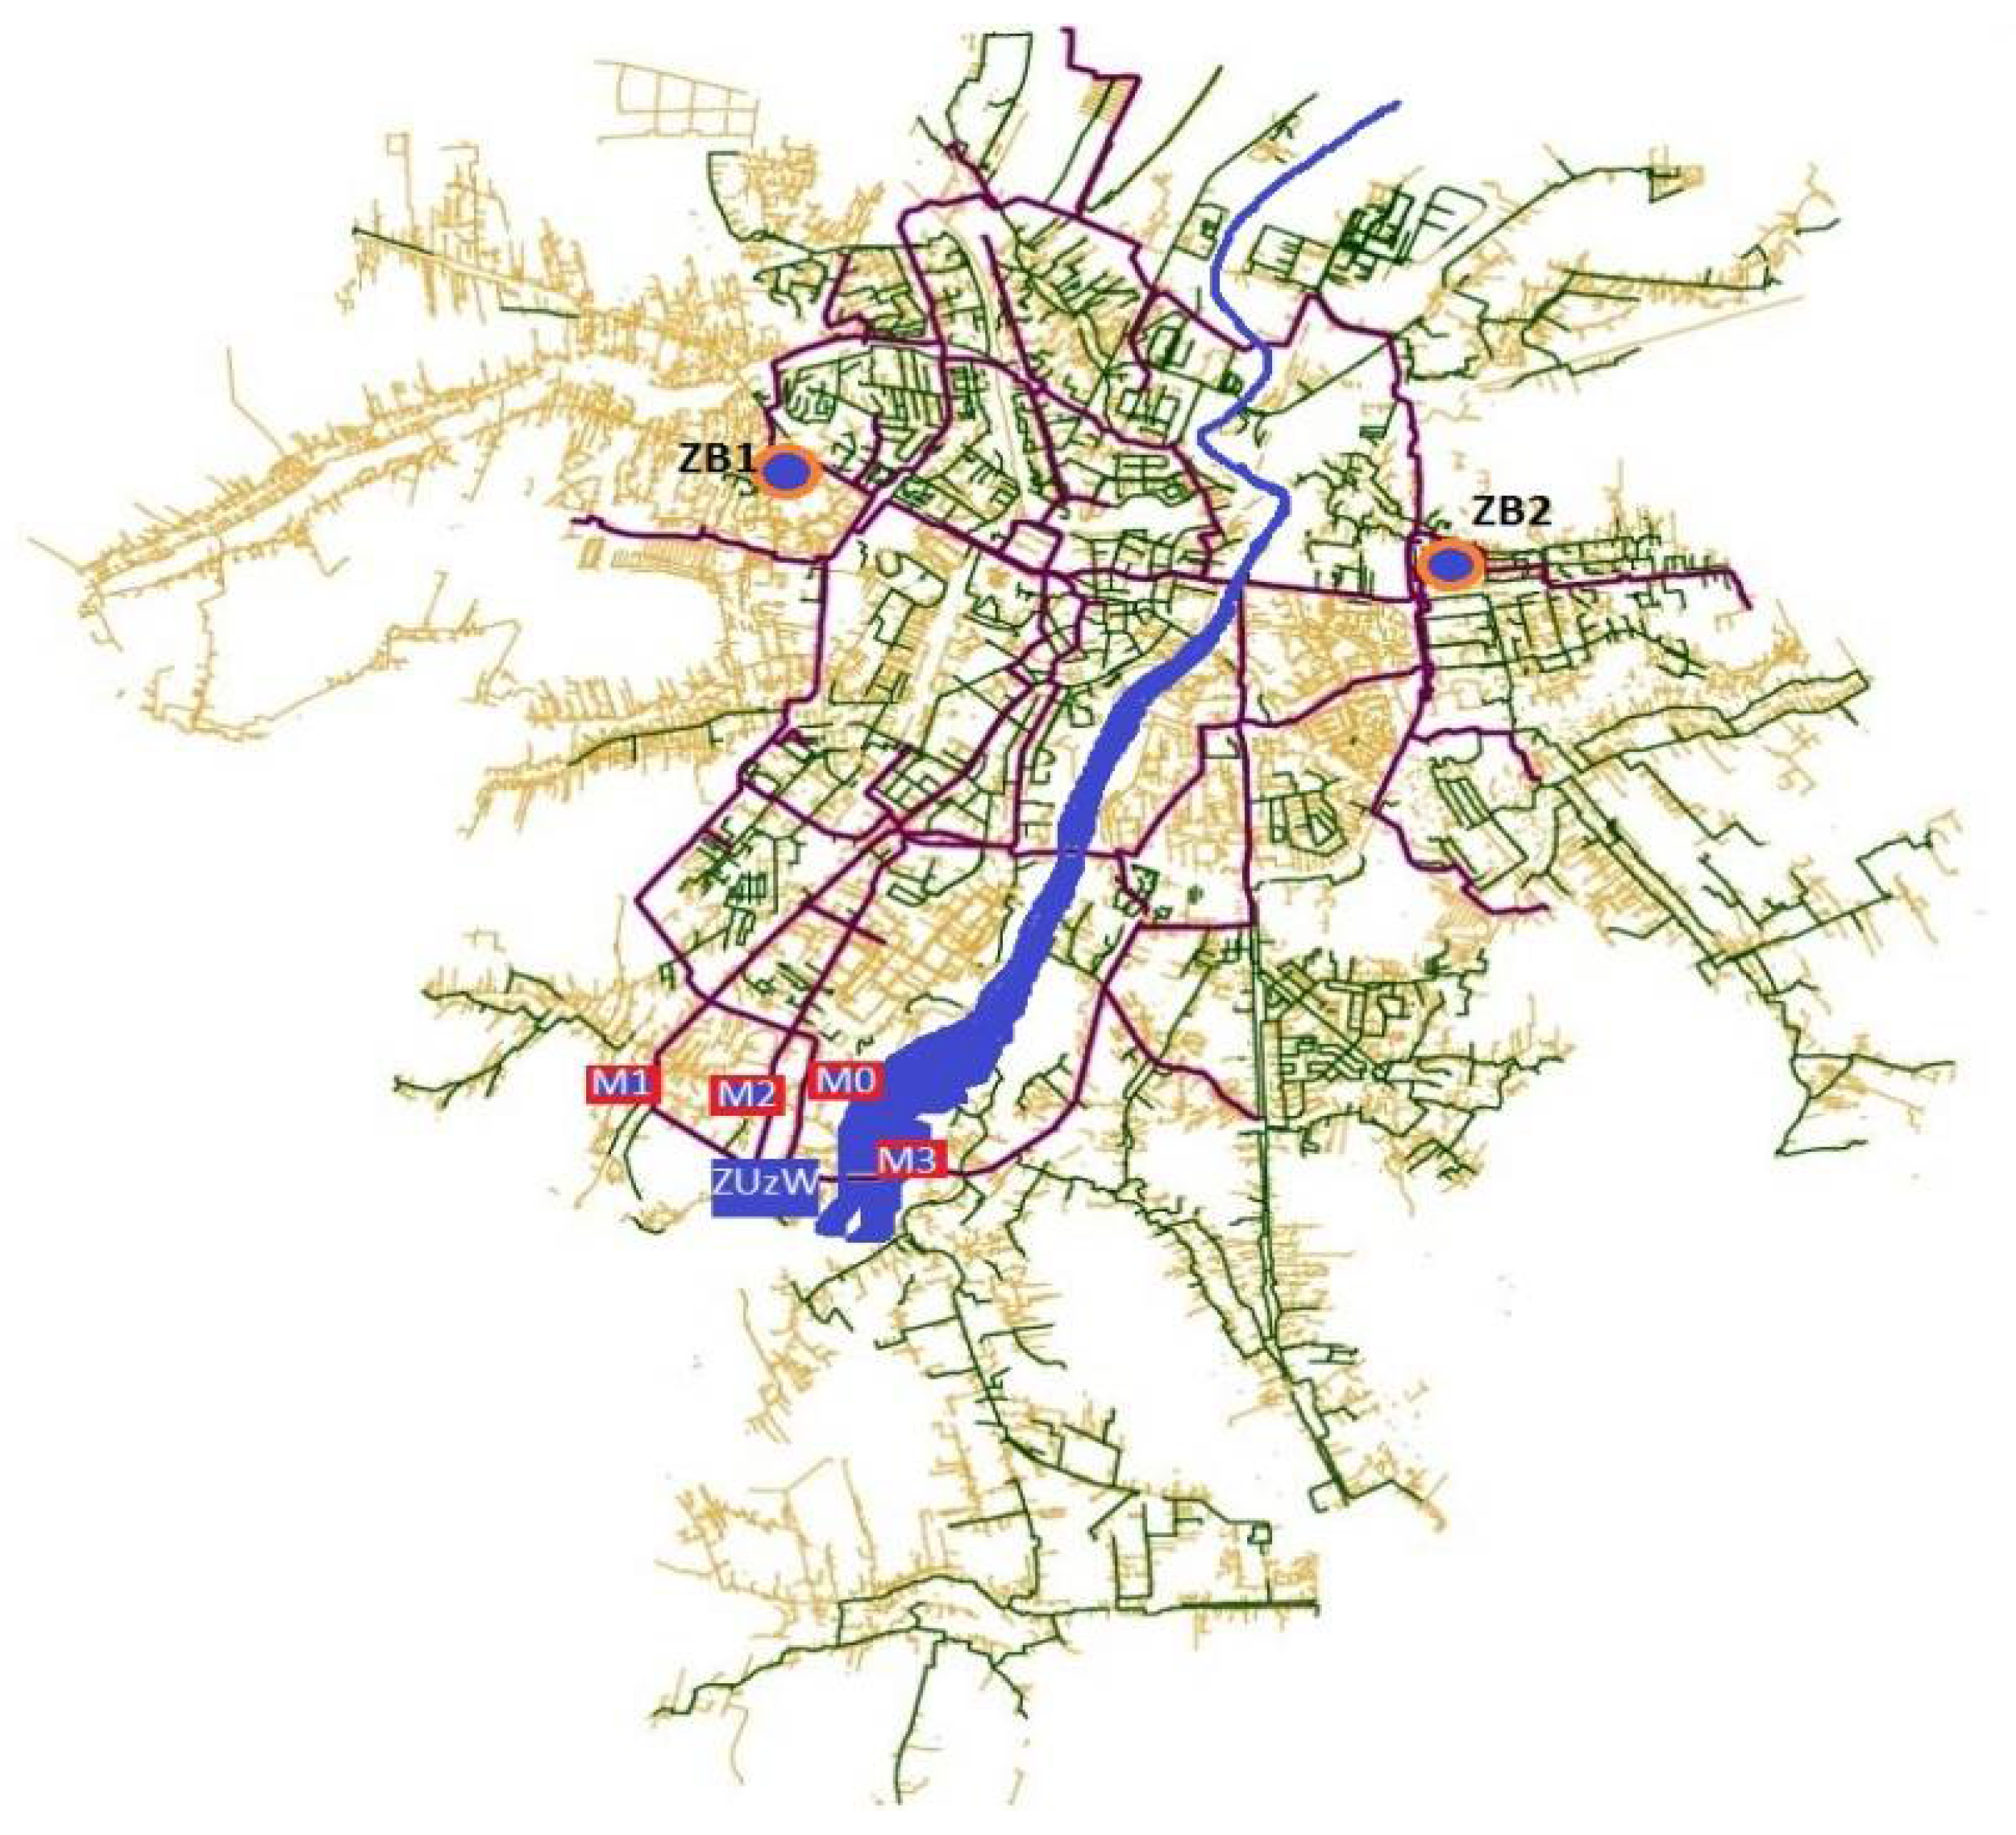
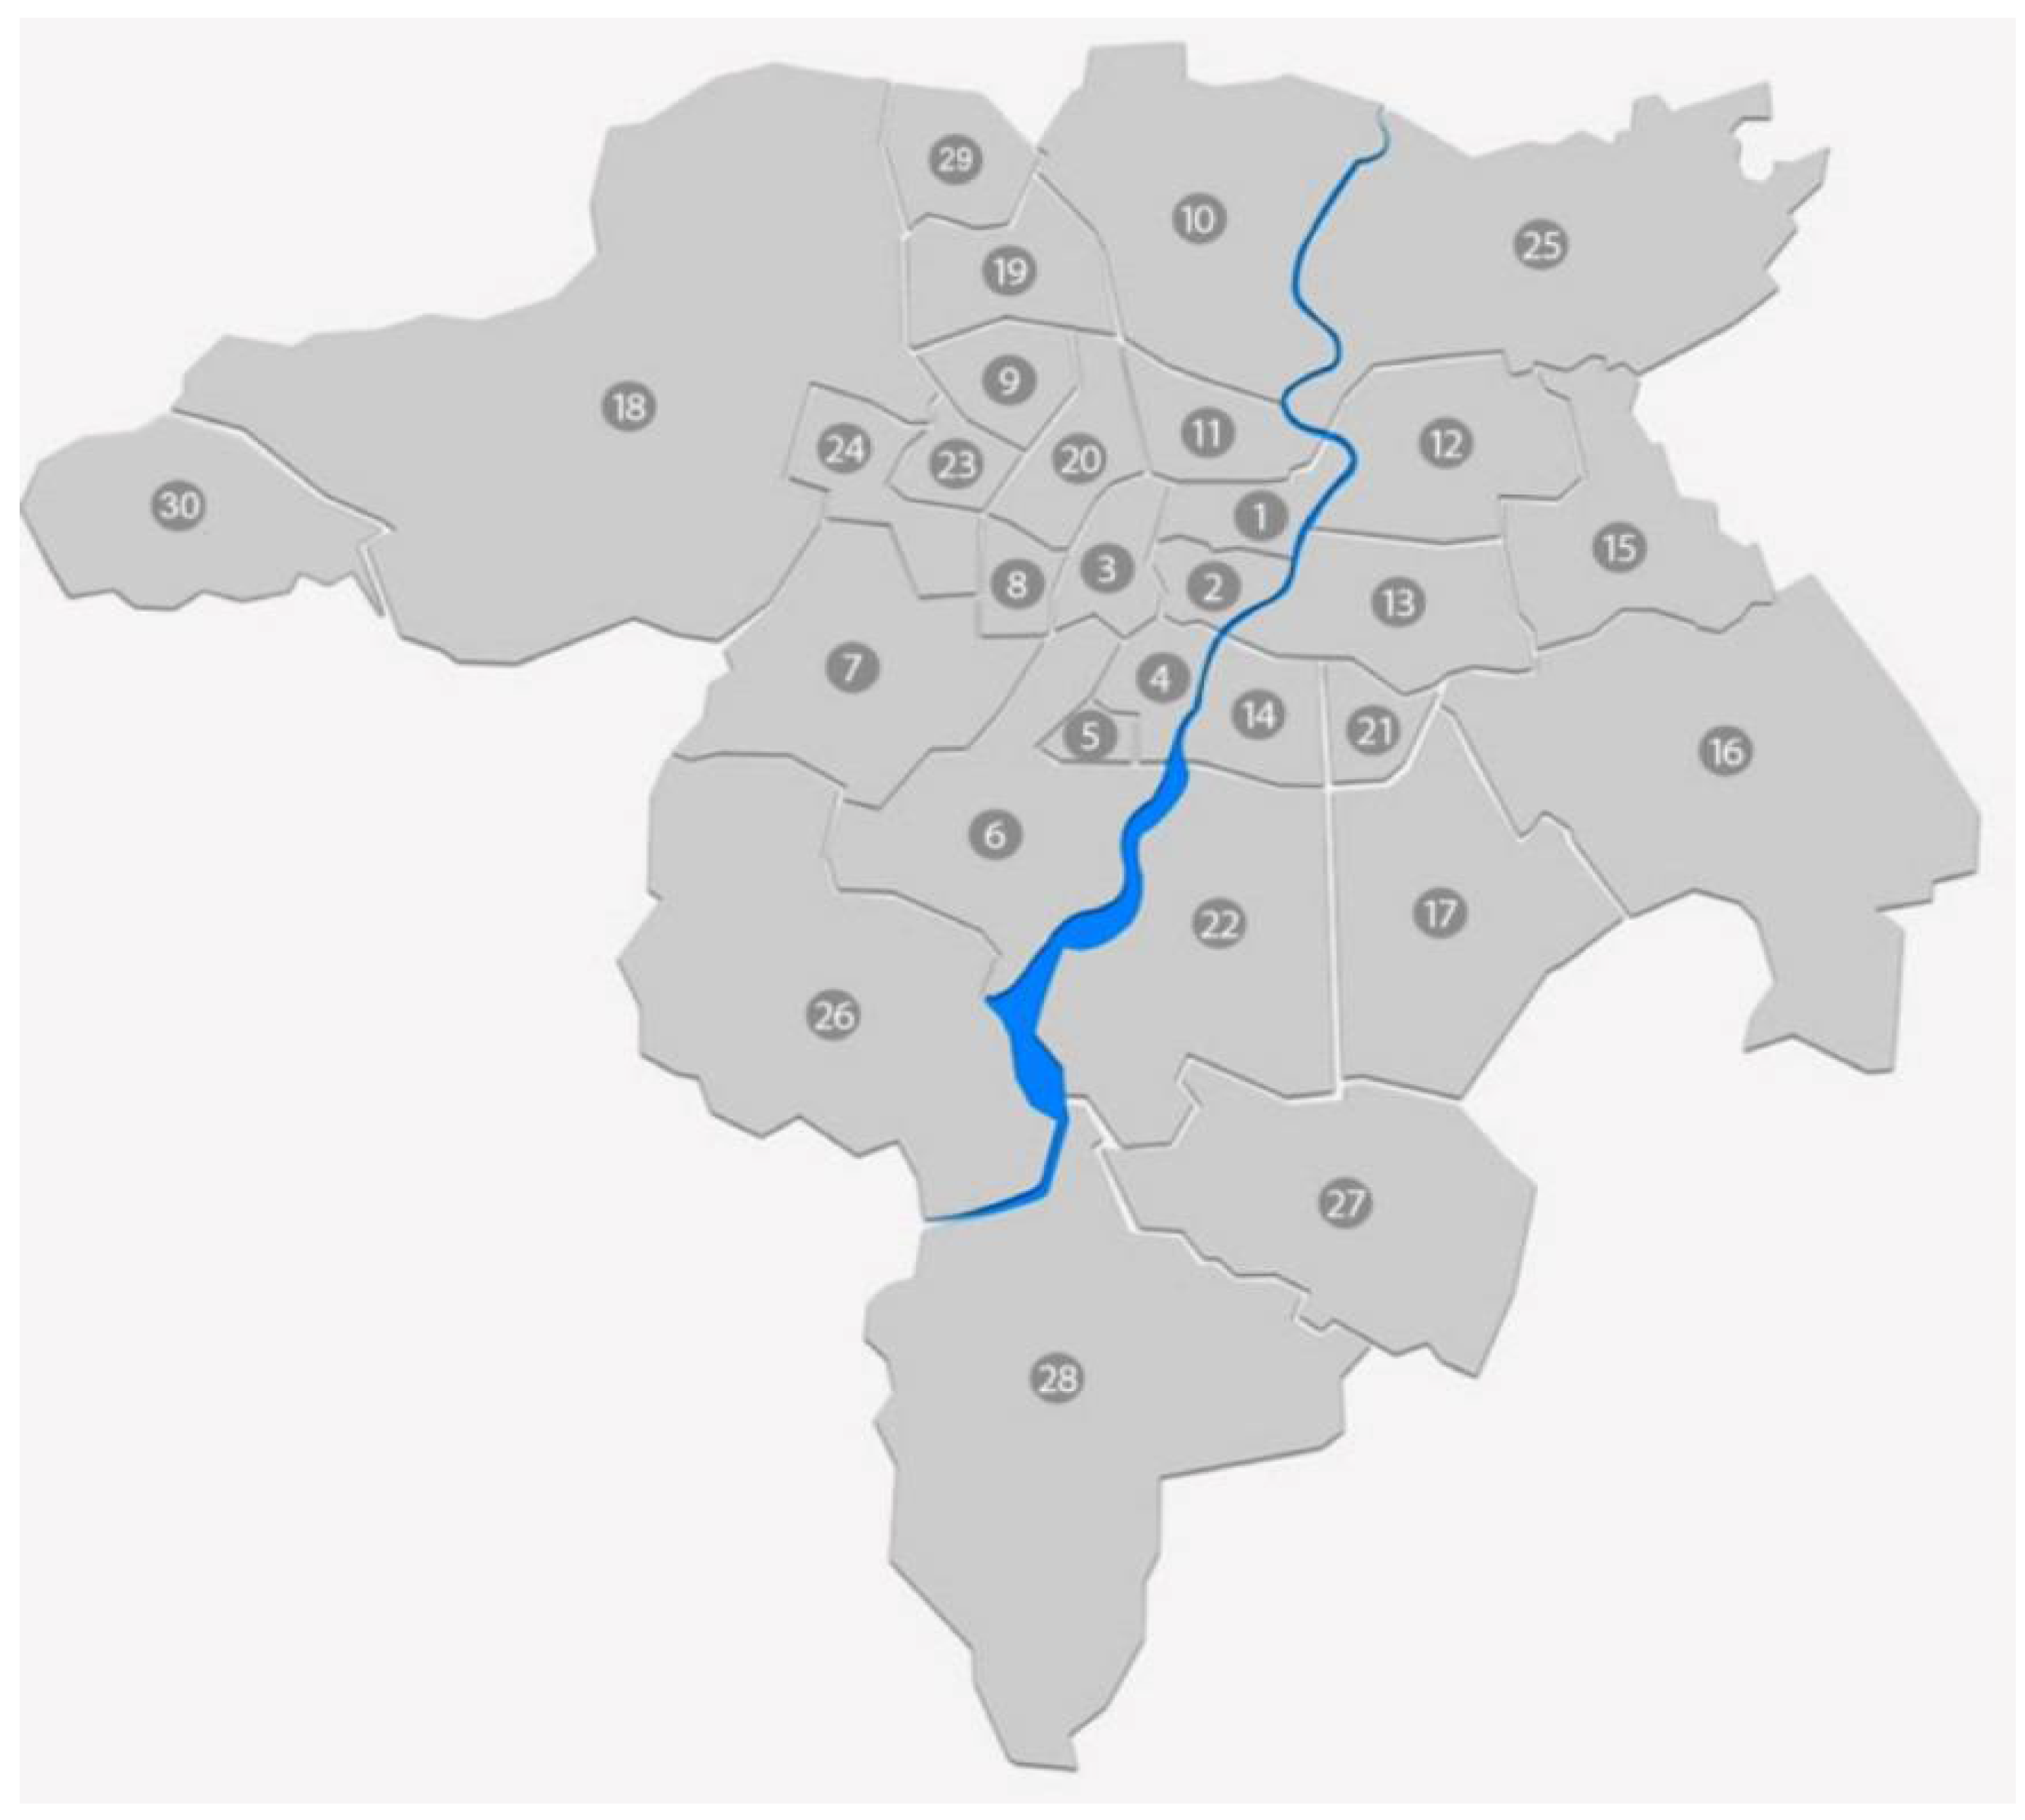
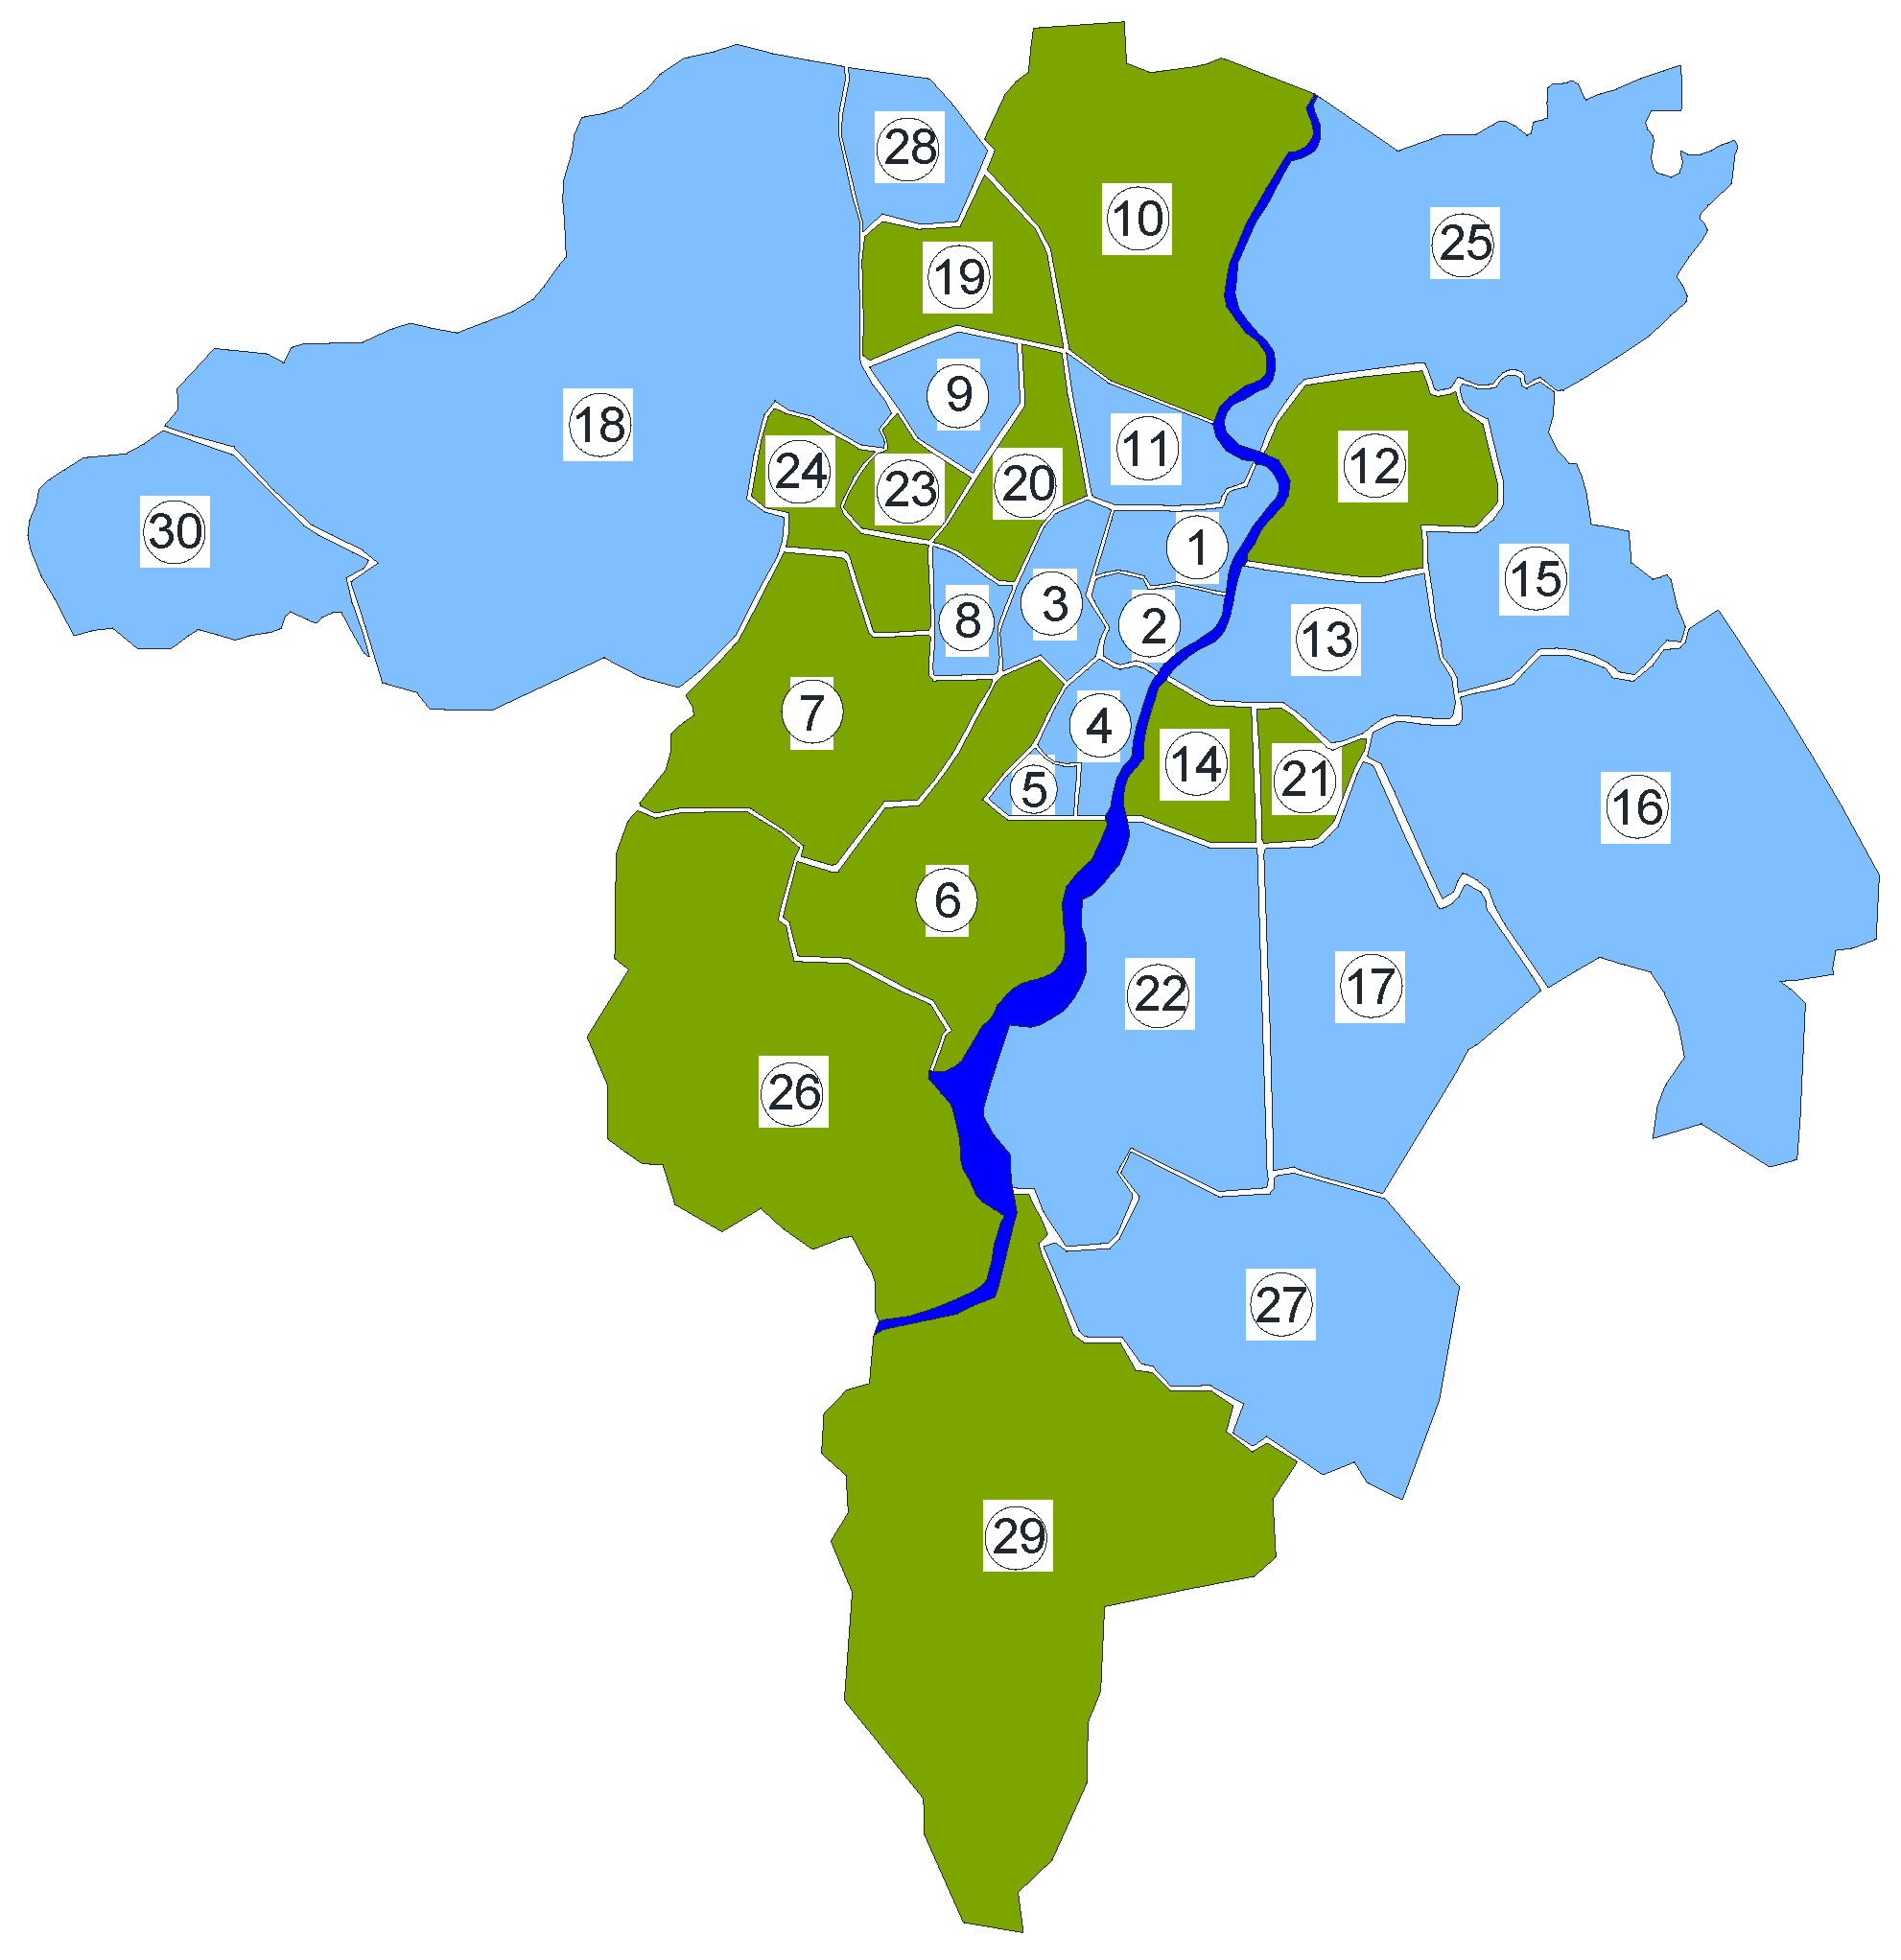
The research object is the water distribution subsystem of one of the largest cities in southeastern Poland. The analyzed city is the capital of the Podkarpackie Province. It is the seat of local and provincial authorities, as well as government and judiciary institutions. It plays the role of an important center of the aviation, commercial and service and construction industries. According to the data from 1 January 2021, the city had 197,863 inhabitants. The analyzed water supply network works in a closed system in 80%. The network cooperates with two groups of clean water tanks: ZB1 and ZB2, located in the eastern and western parts of the city. The whole water supply network consists of four main water mains transporting water from the second-degree pumping station located on the water treatment plant ZUzW (Figure 1) and Figure 2 shows the city divided into particular zones.
During the occurrence of a crisis in the analyzed area of supply, it is important to coordinate the whole activities of representatives of state authorities, local government units, specialist services, business entities, water supply companies and the inhabitants themselves, in order to minimize its negative consequences. The act on crisis management [11] introduces the obligation to develop a crisis response plan at the national, voivodeship levels.
3.2. Water Balance in a Crisis
When a crisis occurs, the following water consumption standards can be adopted:
- -
- With the necessary water supply, the amount of water per person per day was assumed as 15 L/P·d,
- -
- With a minimum amount of water supply, the amount of water per one person per day was assumed as 7.5 L/P·d,
- -
- For livestock, the necessary and minimum amount of water supply is respectively:
- Cattle: 60 L/head and 40 L/pcs,
- Pigs: 20 L/head and 10 L/pcs,
- Sheep, goats: 6 L/head and 4 L/pcs,
- Poultry: 0.3 ÷ 1.0 L/animal and 0.2–0.5 L/pcs,
- Horses: 40 L/pcs. and 25 L/pcs.
In the paper, for the development of risk maps, calculations of the emergency water supply balance were performed also for:
- -
- 2.5 L/P·d—the amount of water related to human physiology,
- -
- 30 L/P·d—the required amount of water in a crisis,
- -
- 50 L/P·d—the recommended amount of water in a crisis.
The balance was prepared for particular zones, taking into account the number of inhabitants in each of them (data obtained from the Department of Citizens’ Affairs of the analyzed city). The results of water balance calculations were presented in Table 5.
The presented calculations refer to persons who are permanently checked in. Additionally, persons staying temporarily, who do not have their registered residence permit, e.g., students, persons staying illegally (about 5%) should be additionally provided for calculations. When the crisis occurs, emergency supplies for the city may be dug and drilled wells located in the city. These wells are owned by business entities and public utilities. Table 6 summarizes the efficiency values of public wells in zones in the analyzed city.
3.3. Risk Maps of Lack of Water Supply in a Crisis—Location of Public Wells as Alternative Water Intakes
To present the risk of lack of water supply in a crisis graphically, it is necessary to calculate for each zone of the city, the percentage coverage of water demand in crisis conditions from public wells located in each zone, per one inhabitant of the city. The next step is to determine the percentage of lack of water supply per capita in order to cover the minimum, necessary and required water demand. These calculations are the basis for determining the risk of lack of water supply in a crisis in accordance with the methodology proposed in point 2.2. Table 7 summarizes the necessary calculations. The green color shows the surplus of water from public wells for the minimum water demand per capita. The pink color indicates a 100% lack of water, caused by the lack of public wells in the given zones.
In accordance with the proposed methodology for determining the risk of water supply in a crisis, presented in point 2.2 of this study, the value of risk was estimated for each zone of the analyzed city. First, the risk of a lack of water supply for all zones was estimated.
Based on the expert’s knowledge and own studies based on the results of the graphic visualization of the main network failure analysis in the program GeoMedia Professional (management tool for map generation and the analysis of geographic information-spatial data), a 2-point weight was assigned to those zones, where the probability of an adverse event resulting in a crisis was the highest. A point weight of 1 for parameter P was assigned to the remaining zones, assuming that the probability of such an event is 1 time in 20 years. Table 7 presents the obtained calculations.
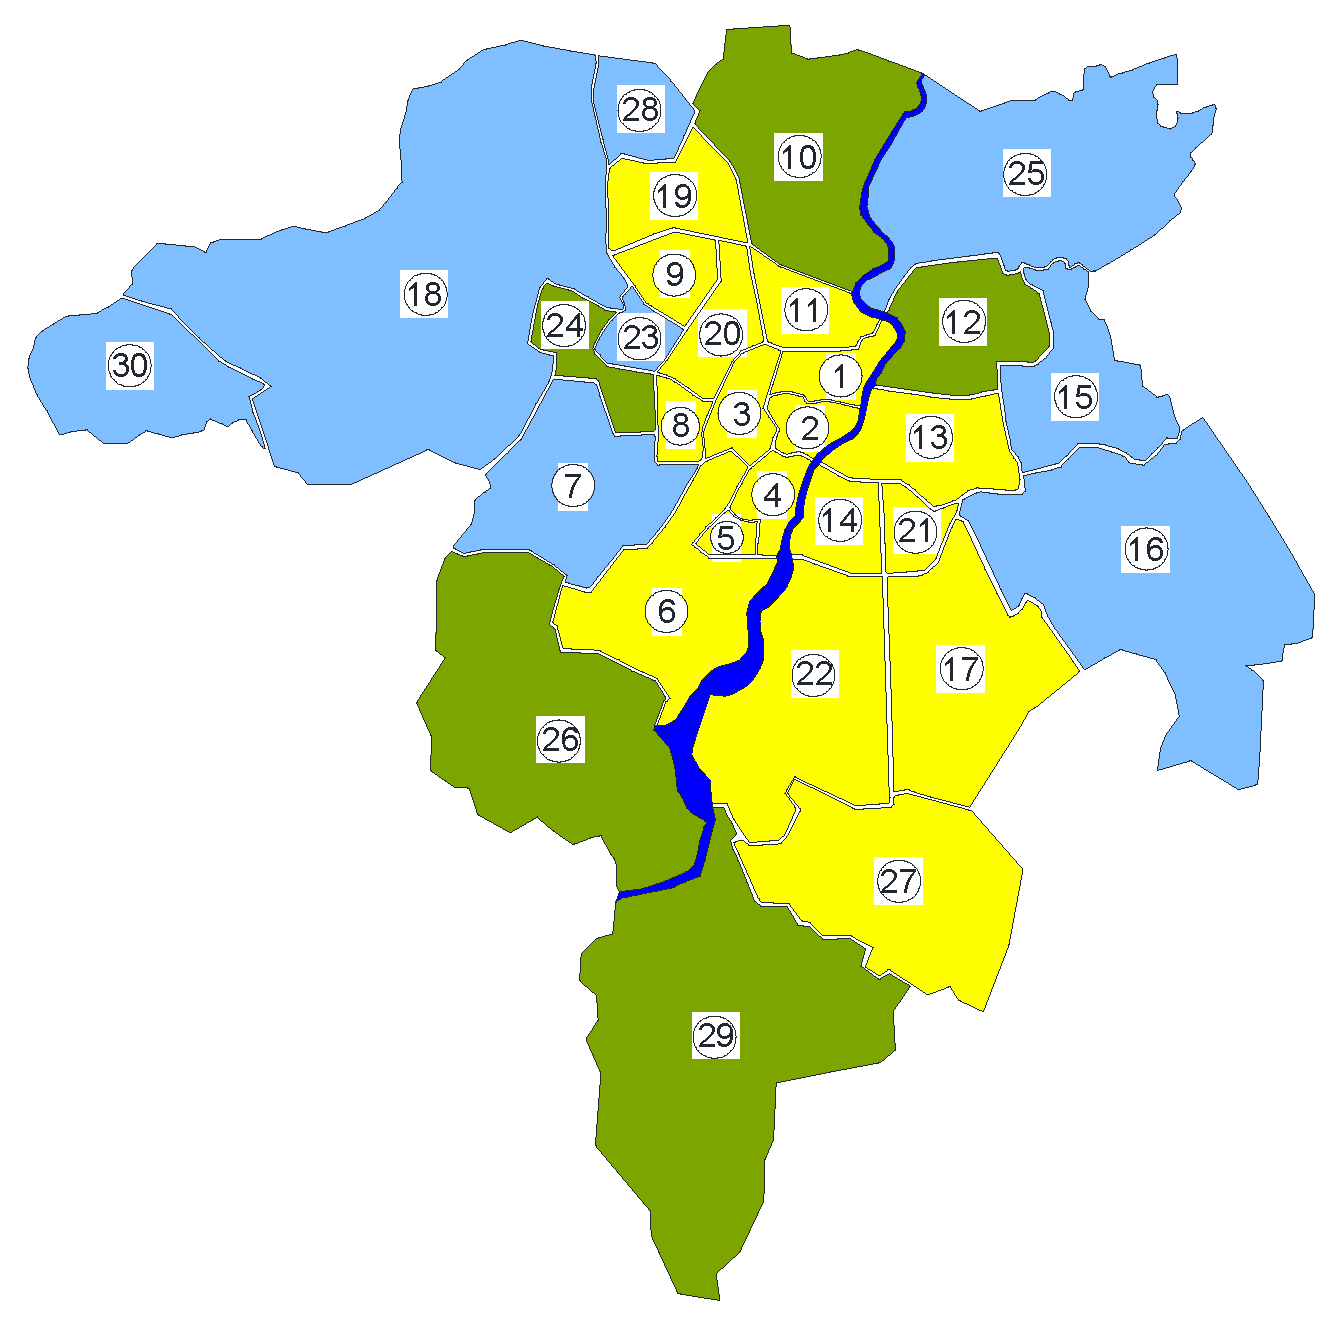
Figure 3 shows the risk map of a lack of water supply in a crisis, assuming a water demand of 2.5 L/P·d.
The next part of the work was to estimate the risk of lack of water supply in a crisis for the remaining four characteristic values of water demand in special conditions, i.e., 7.5, 15, 30 and 50 L/P·d. The calculation method is the same as in the example of 2.5 L/P·d. When the risk value was estimated, the value of the P parameter was left unchanged (as in Table 8), while the point weights of the ΔQ parameter were assigned, respectively, on the basis of the criteria proposed in Table 2 and calculations presented in Table 7.
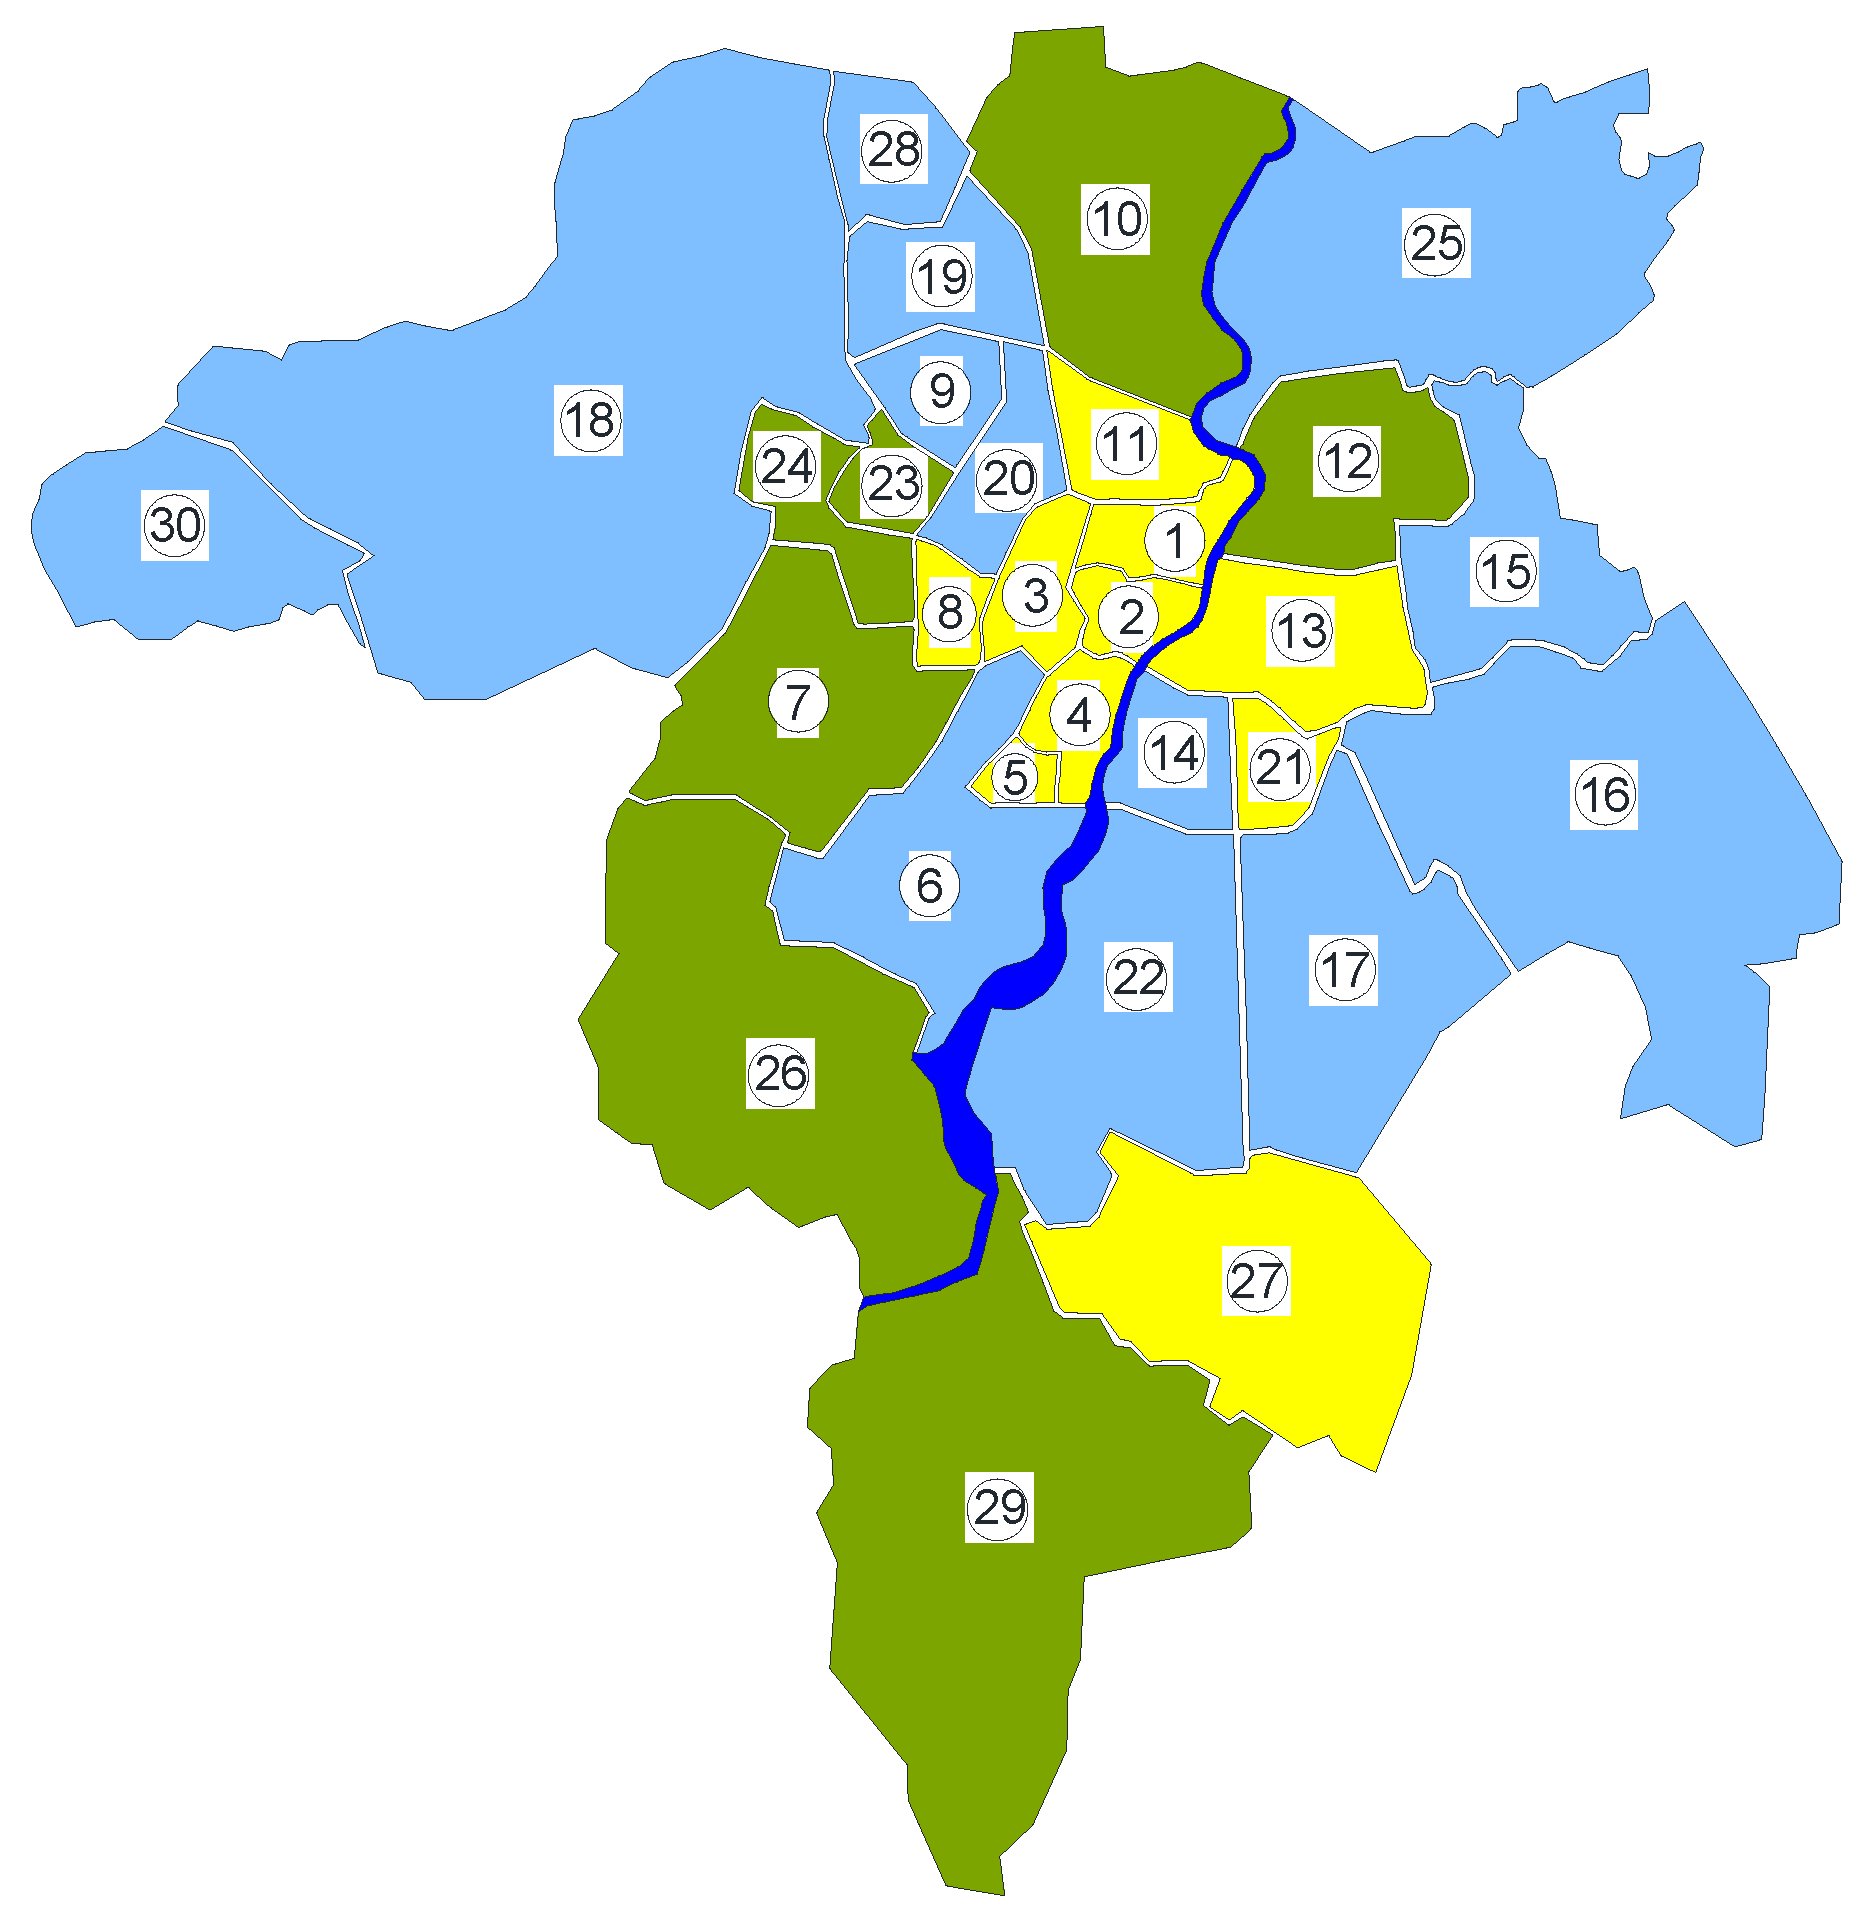
Figure 4 shows the risk map of a lack of water supply in a crisis, assuming a water demand of 7.5 L/P·d.
Figure 5 shows the risk map of a lack of water supply in a crisis, assuming a water demand of 15 L/P·d.
Figure 6 shows the risk map of a lack of water supply in a crisis, assuming a water demand of 30 L/P·d.
Figure 7 shows the risk map of a lack of water supply in a crisis, assuming a water demand of 50 L/P·d.
3.4. Location of Public Wells as Alternative Water Intakes
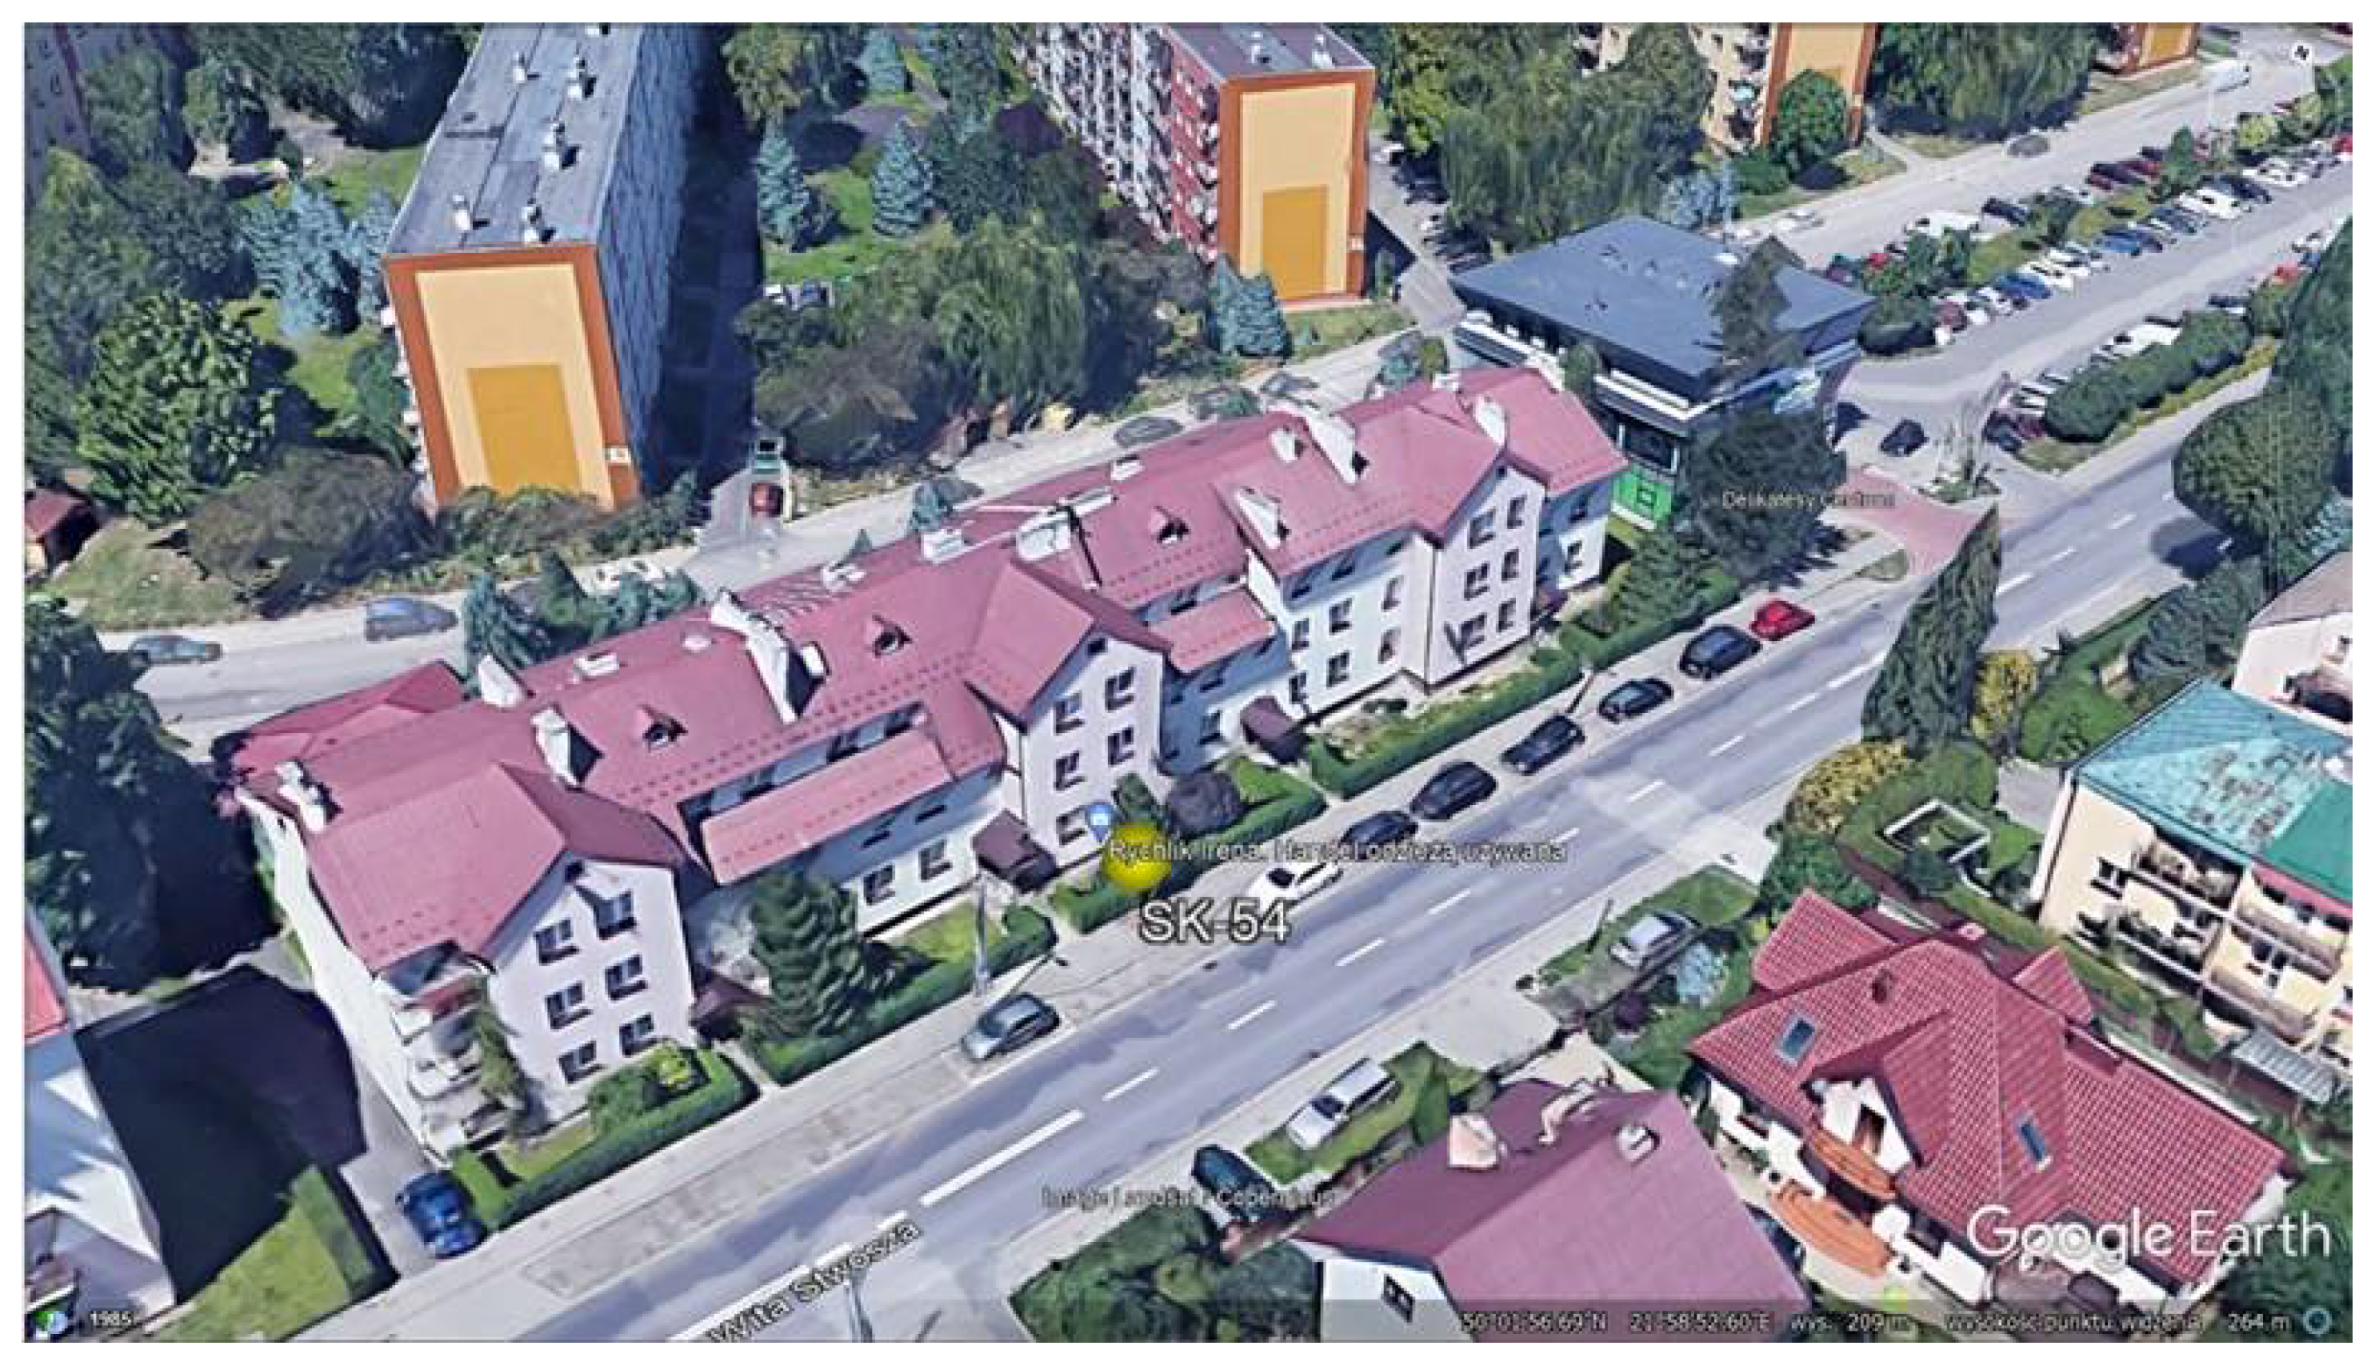
To increase the sense of safety of water consumers when a crisis appears, i.e., to make a city resident aware of where in the immediate vicinity is an alternative water intake (a public well), it is helpful to use a tool such as Google Earth and include such visualization on the public water company’s website. The first step in creating the map was to create the thematic map “Wells” in the GEOMEDIA program. The next step was to create a file with the kml extension and export the data for spatial visualization in the Google Earth Pro web browser, with a local digital map in the background.
4. Discussion
The presented maps of the risk of water supply in a crisis are a tool for developing emergency plans for providing people with water under special conditions. Maps support the selection of zones to which the barrel trucks or transport with water bottles should be directed in the first place in order to ensure adequate water demand per inhabitant. They indicate areas with the greatest risk of lack of water supply. During a crisis, i.e., when the water supply system is shut down, water in the supply area should be provided by emergency wells. In the case of an insufficient number of wells or their unfavorable position, water should be provided in alternative ways. Emergency wells should be intended for water supply in special conditions to the population residing in areas not covered by the water supply system. Wells should provide at least the minimum amount of water—7.5 L/P·d. The analysis shows that emergency wells cover 48.4% of the minimum water demand in crisis conditions. It follows that one should additionally use other, on-site water intakes. The analysis of the possibility of using alternative water sources should be the main activity of local authorities and services responsible for the supply of drinking water, which would increase the level of safety of its supply. It should also be noted that GIS applications are also used in the analysis and assessment of the risk of lack of water supply. GIS applications are a tool supporting the risk visualization process and undoubtedly fit into the current standards in the field of municipal water supply management.
In accordance with the recommendations of the WHO and the guidelines presented by them regarding the implementation of WSP by water companies, the proposed method and the model comply with the applicable standards for ensuring the safety of water supply, recommended by WHO. Currently, there is no obligation to implement WSPs, but Directive (EU) 2020/2184 of the European Parliament and of the Council of 16 December 2020 on the quality of water intended for human consumption, introduces such an obligation for the EU countries. According to the Directive mentioned above, risk assessment and risk management in the supply system should be performed by 12 January 2029 by the European Members. The proposed model is an alternative to the currently used methods of supplying people with water in a crisis, i.e., water bottles. In the era of widespread digitization and automation, the vision of a blackout also becomes real. One of its negative effects may be the immobilization of the water supply and thus the suspension of the supply of water from the network. For this reason, the analyses carried out on the basis of the proposed model become purposeful.
5. Conclusions
The main purpose of the study was to develop a crisis management methodology based on risk maps of the lack or limitation of water supply to recipients in a crisis. The concept of risk maps is used in various areas of life, e.g., in crisis management—flood risk maps. However, in the analyses and assessments of the safety of water supply, taking into account the applicable right to access to water, especially in a crisis, there is a need to fill the gap and develop risk maps of lack of water supply at the time of a crisis. The developed methodology for visualizing the risk of lack or limitation of water supply in the form of risk maps allows multi-faceted analysis and risk assessment, taking into account adverse events occurring during the operation of the water distribution subsystem. The implementation of the proposed solutions focuses on ensuring the required level of safety for water consumers, taking into account the quantitative aspect of the risk. The methodology of risk mapping can be used to analyze the functioning of the entire water supply network, ensuring the safety of water supply as part of water safety plans. The proposed method can be successfully used in any CWSS, at the same time contributing to the improvement of the relationship between the water producer and the water consumer. Risk maps of lack of water supply in a crisis and a detailed analysis of an emergency water supply along with a graphical visualization of the nearest, emergency water intake points (made with the use of GIS and Google Earth software) are a milestone in ensuring the safety of water supply from the point of view of water consumers. Providing this type of map, for example on the company’s website, will enable the water consumer to consciously choose a water abstraction point closest to his place of residence. A risk mapping approach to ensuring the safety of water supply to consumers will impact the quality and reliability of the water supply services provided by the company. The solutions proposed in the work meet the requirements of European legislation related to providing every EU citizen with access to drinking water and ensuring an adequate level of water supply safety.
Funding
This research received no external funding.
Institutional Review Board Statement
Not applicable.
Informed Consent Statement
Not applicable.
Data Availability Statement
The data presented in this study are a part of Ph.D. dissertation.
Acknowledgments
I would like to thank the reviewers for their feedback, which helped to improve the quality of the manuscript.
Conflicts of Interest
The author declares no conflict of interest.
References
- Amnesty International. Available online: https://amnesty.org.pl/ (accessed on 23 October 2021).
- Resolution 1693 (2009) of Parliamentary Assembly. Water: A strategic challenge for the Mediterranean Basin. Available online: http://assembly.coe.int/nw/xml/XRef/Xref-XML2HTML-en.asp?fileid=17786&lang=en (accessed on 23 October 2021).
- Directive (EU) 2020/2184 of The European Parliament and of the Council of 16 December 2020 on the Quality of Water Intended for Human Consumption (European Union Directive). Available online: https://eur-lex.europa.eu/legal-content/EN/TXT/PDF/?uri=CELEX:32020L2184&from=EN (accessed on 23 October 2021).
- An Official Website of the European Union. Available online: https://ec.europa.eu/info/law/law-making-process/evaluating-and-improving-existing-laws/refit-making-eu-law-simpler-less-costly-and-future-proof_en (accessed on 23 October 2021).
- Water Framework Directive (WFD) 2000/60/EC: Directive 2000/60/EC of the European Parliament and of the Council of 23 October 2000 Establishing a Framework for Community Action in the Field of Water Policy. Available online: https://eur-lex.europa.eu/legal-content/EN/TXT/?uri=CELEX:32000L0060.pdf (accessed on 23 October 2021).
- Directive 2007/2/EC of the European Parliament and of the Council of 14 March 2007 Establishing an Infrastructure for Spatial Information in the European Community (INSPIRE). Available online: https://eur-lex.europa.eu/legal-content/EN/ALL/?uri=CELEX:32007L0002.pdf (accessed on 23 October 2021).
- World Health Organization. Water Safety Manual: Step-by-Step Risk Management for Drinking-Water Suppliers; World Health Organization: Geneva, Switzerland, 2009. [Google Scholar]
- European Environment Agency. Available online: https://www.eea.europa.eu/policy-documents/white-paper-adapting-to-climate (accessed on 23 October 2021).
- Polish Legal Act of 7 June 2001 on Collective Water Supply and Collective Sewage Disposal (Dz.U. z 2001 r. nr 72, poz. 747) with Subsequent Changes. Available online: https://isap.sejm.gov.pl/isap.nsf/DocDetails.xsp?id=WDU20010720747.pdf (accessed on 23 October 2021).
- Polish Legal Act of 7 December 2017: Regulation of the Minister of Health on the Quality of Water Intended for Human Consumption. Available online: http://isap.sejm.gov.pl/isap.nsf/download.xsp/WDU20170002294/O/D20172294.pdf (accessed on 23 October 2021).
- Polish Legal Act of 26 April 2007 on Crisis Management (Dz.U. z 2007 r. nr 89, poz. 590) with Subsequent Changes. Available online: http://isap.sejm.gov.pl/isap.nsf/DocDetails.xsp?id=WDU20070890590.pdf (accessed on 23 October 2021).
- Pitkänen, T.; Juselius, T.; Isomäki, E.; Miettinen, I.T.; Valve, M.; Kivimäki, A.L.; Lahti, K.; Hänninen, M.L. Drinking Water Quality and Occurrence of Giardia in Finnish Small Groundwater Supplies. Resources 2015, 4, 637–654. [Google Scholar] [CrossRef]
- Luczaj, J.; Masarik, K. Groundwater Quantity and Quality Issues in a Water-Rich Region: Examples from Wisconsin, USA. Resources 2015, 4, 323–357. [Google Scholar] [CrossRef]
- Szpak, D.; Boryczko, K.; Żywiec, J.; Piegdoń, I.; Tchórzewska-Cieślak, B.; Rak, J. Risk Assessment of Water Intakes in South-Eastern Poland in Relation to the WHO Requirements for Water Safety Plans. Resources 2021, 10, 105. [Google Scholar] [CrossRef]
- Żywiec, J.; Boryczko, K.; Kowalski, D. Analysis of the Negative Daily Temperatures Influence on the Failure Rate of the Water Supply Network. Resources 2021, 10, 89. [Google Scholar] [CrossRef]
- Tchórzewska-Cieślak, B.; Pietrucha-Urbanik, K.; Kuliczkowska, E. An Approach to Analysing Water Consumers’ Acceptance of Risk-Reduction Costs. Resources 2020, 9, 132. [Google Scholar] [CrossRef]
- Słyś, D.; Pochwat, K.; Czarniecki, D. An Analysis of Waste Heat Recovery from Wastewater on Livestock and Agriculture Farms. Resources 2020, 9, 3. [Google Scholar] [CrossRef] [Green Version]
- Shuang, Q.; Liu, H.J.; Porse, E. Review of the Quantitative Resilience Methods in Water Distribution Networks. Water 2019, 11, 1189. [Google Scholar] [CrossRef] [Green Version]
- Kaushal, S.S.; McDowell, W.H.; Wollheim, W.M.; Newcomer Johnson, T.A.; Mayer, P.M.; Belt, K.T.; Pennino, M.J. Urban Evolution: The Role of Water. Water 2015, 7, 4063–4087. [Google Scholar] [CrossRef]
- Zdeb, M.; Zamorska, J.; Papciak, D.; Słyś, D. The Quality of Rainwater Collected from Roofs and the Possibility of Its Economic Use. Resources 2020, 9, 12. [Google Scholar] [CrossRef] [Green Version]
- Michaud, D.; Apostolakis, G.E. Methology for ranking elements in water supply networks. J. Infrastruct. Syst. 2006, 12, 230–242. [Google Scholar] [CrossRef]
- Proszak-Miąsik, D.; Bukowska, M.; Nowak, K.; Rabczak, S. Astronomical and Meteorological Conditions of a Solar System Operation. IOP Conf. Ser. Mater. Sci. Engineering 2017, 245, 052058. [Google Scholar] [CrossRef]
- Szpak, D. Method for determining the probability of a lack of water supply to consumers. Energies 2020, 13, 5361. [Google Scholar] [CrossRef]
- Boryczko, K.; Rak, J. Method for assessment of water supply diversification. Resources 2020, 9, 87. [Google Scholar] [CrossRef]
- Żywiec, J.; Piegdoń, I.; Tchórzewska-Cieślak, B. Failure analysis of the water supply network in the aspect of climate changes on the example of the central and eastern europe region. Sustainability 2019, 11, 6886. [Google Scholar] [CrossRef] [Green Version]
- Byleveld, P.M.; Deere, D.; Davison, A. Water safety plans: Planning for adverse events and communicating with consumers. J. Water Health 2008, 6, 1–9. [Google Scholar] [CrossRef] [PubMed] [Green Version]
- Fewtrell, L.; Bartram, J. Quality: Guidelines, Standards and Health-Assessment of Risk and Risk Management for Water Related Infectious Disease; IWA Publishing (on behalf of WHO): London, UK, 2001. [Google Scholar]
- Grey-Gardner, R. Implementing risk management for water supplies: A catalyst and incentive for change. Rangel. J. CSIRO Publ. 2008, 30, 149–156. [Google Scholar] [CrossRef] [Green Version]
- Hrudey, S.E.; Hrudey, E.J. Safe Drinking Water: Lessons from Recent Outbreaks in Affluent Nations; International Water Association Publishing: New York, NY, USA, 2004. [Google Scholar]
- Rak, J.; Tchórzewska-Cieślak, B. Ryzyko w eksploatacji systemów zbiorowego zaopatrzenia w wodę; Wydawnictwo Seidel-Przywecki Sp. z o.o.: Warszawa, Poland, 2013. [Google Scholar]
- Kutyłowska, M.; Kowalski, D. Application of regression methods for classification of sewers’ damages. Appl. Water Sci. 2021, 11, 156. [Google Scholar] [CrossRef]
- Apostolakis, G.; Kaplan, S. Pitfalls in risk calculations. Reliab. Eng. 1981, 2, 135–145. [Google Scholar] [CrossRef]
- Kaplan, S.; Garrick, B.J. On the quantative definition of risk. Risk Anal. 1981, 1, 11–27. [Google Scholar] [CrossRef]
- Tchórzewska-Cieślak, B. Metody Analizy i Oceny Ryzyka Awarii Podsystemu Dystrybucji Wody; Oficyna Wydawnicza Politechniki Rzeszowskiej: Rzeszów, Poland, 2011. [Google Scholar]
- Rak, J.; Tchórzewska-Cieślak, B.; Studziński, J. Bezpieczeństwo Systemów Zbiorowego Zaopatrzenia w Wodę; Instytut Badań Systemowych PAN: Warszawa, Poland, 2013. [Google Scholar]
- Boryczko, K.; Piegdoń, I.; Szpak, D.; Żywiec, J. Risk assessment of lack of water supply using the hydraulic model of the water supply. Resources 2021, 10, 43. [Google Scholar] [CrossRef]
Figure 1.
Scheme of the water supply network generated in the program GEOMEDIA Professional (purple color—main network, green—distribution network, yellow—water supply connections; own study).
Figure 1.
Scheme of the water supply network generated in the program GEOMEDIA Professional (purple color—main network, green—distribution network, yellow—water supply connections; own study).

Figure 2.
Division of the analyzed city into particular zones.

Figure 3.
Risk map of lack of water supply in a crisis for a water demand of 2.5 L/P·d.

Figure 4.
Risk map of lack of water supply in a crisis for a water demand of 7.5 L/P·d.

Figure 5.
Risk map of lack of water supply in a crisis for a water demand of 15 L/P·d.

Figure 6.
Risk map of lack of water supply in a crisis for a water demand of 30 L/P·d.

Figure 7.
Risk map of lack of water supply in a crisis for a water demand of 50 L/P·d.

Figure 8.
Map of the location of public wells—zone No. 8 (SK—dug well).

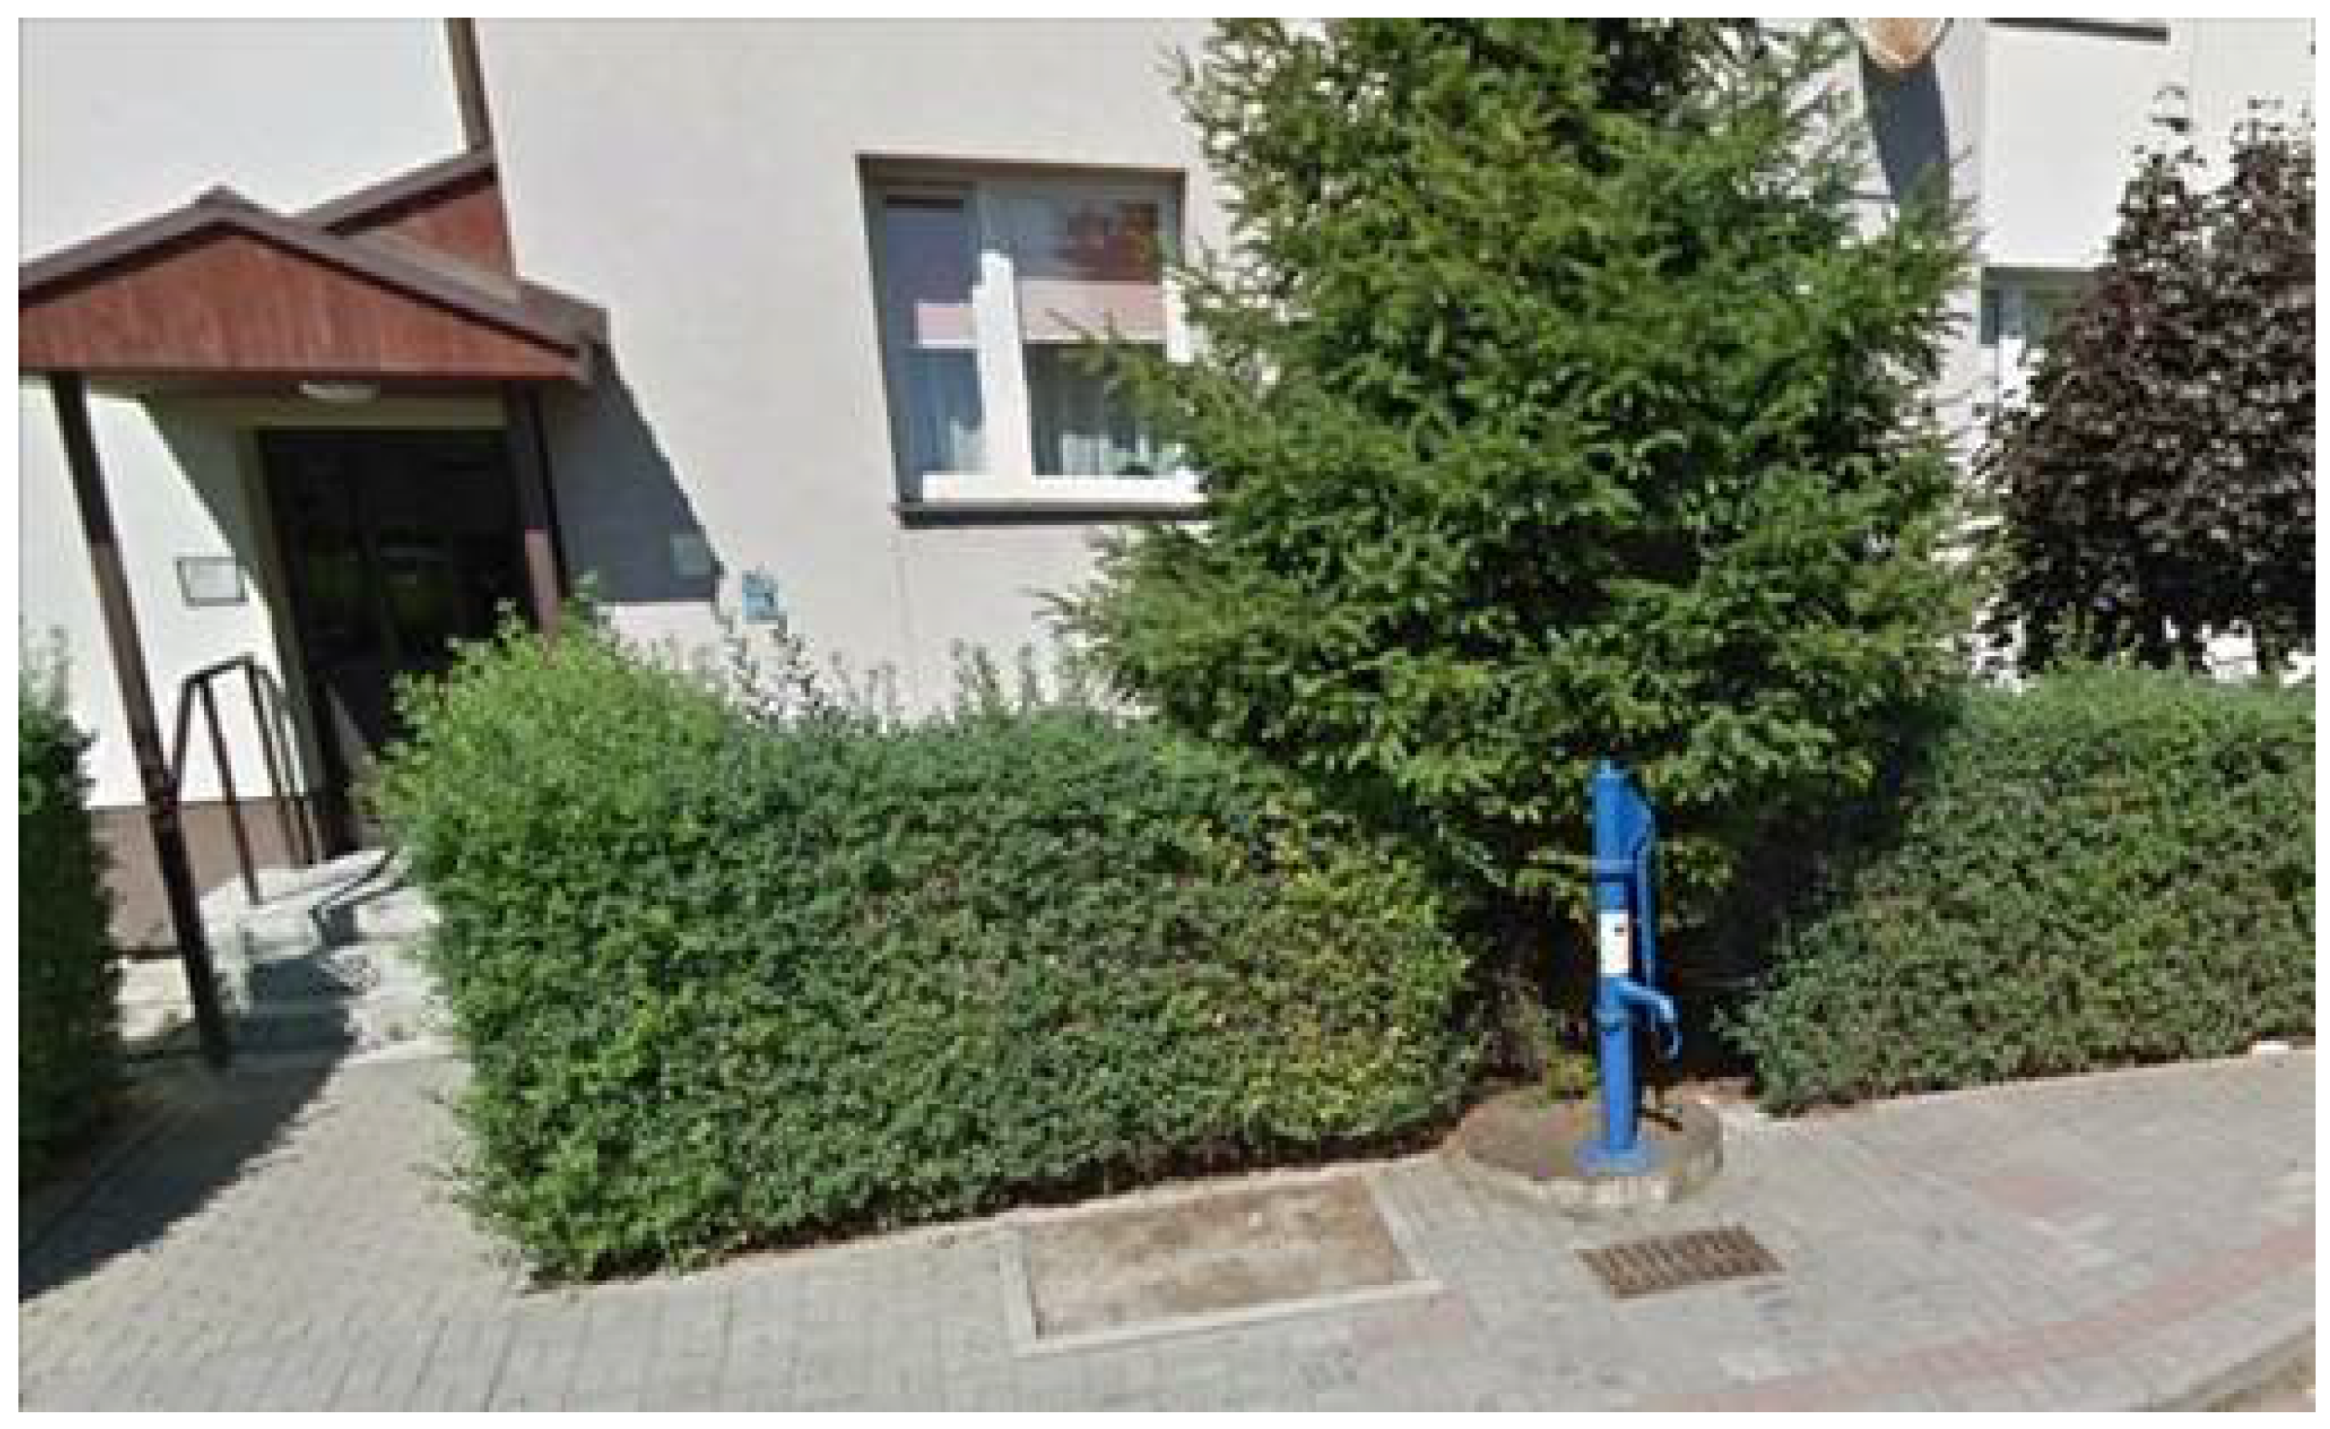
Figure 9.
Public well SK 54—zone No. 8 (SK—dug well).


Table 1.
Descriptive-point scale criteria for the parameter Pj; i = 1, 2, 3, 4, 5.
| Point Weight | Description for Parameter P |
|---|---|
| 1 | Incredibly, once in 20 years; P < 5 × 10⁻⁶ |
| 2 | Unlikely to happen, once in 5 years; P = 5 × 10⁻⁶ ÷ 2 × 10⁻⁵ |
| 3 | Quite likely, once a year; P = 2 × 10⁻⁵ ÷ 2 × 10⁻⁴ |
| 4 | Probably, once a month; P = 10−4 ÷ 10−3 |
| 5 | Very likely, once a week; P > 10−3 |
Table 2.
Descriptive-point scale criteria for the parameter ΔQi; i = 1, 2, 3, 4, 5.
| Point Weight | Description for Parameter ΔQ |
|---|---|
| 1 | Water supply excess |
| 2 | 0.5 ÷ 25 |
| 3 | 26 ÷ 50 |
| 4 | 51 ÷ 80 |
| 5 | 81 ÷ 100 |
Table 3.
Two-parameter matrix for estimating the risk of lack of water supply in a crisis.
| ΔQ—Water Supply Deficiency | P—Probability | ||||
|---|---|---|---|---|---|
| 1 | 2 | 3 | 4 | 5 | |
| 1 | 1 | 2 | 3 | 4 | 5 |
| 2 | 2 | 4 | 6 | 8 | 10 |
| 3 | 3 | 6 | 9 | 12 | 15 |
| 4 | 4 | 8 | 12 | 16 | 20 |
| 5 | 5 | 10 | 15 | 20 | 25 |
Table 4.
Proposed categories for the value of risk of lack of water supply in a crisis.
| Risk Level | The Risk Value |
|---|---|
| Accepted | 1 ≤ r ≤ 3 |
| Tolerable | 4 ≤ r ≤ 6 |
| Controlled | 8 ≤ r ≤ 10 |
| Intolerable | 12 ≤ r ≤ 16 |
| Unacceptable | 20 ≤ r ≤ 25 |
Table 5.
Balance of water demand in crisis conditions for the population of the analyzed city (own study).
Table 5.
Balance of water demand in crisis conditions for the population of the analyzed city (own study).
| Zone | Number of Registered Persons | Amount of Water, L/d | ||||
|---|---|---|---|---|---|---|
| 2.5 L/P·d | 7.5 L/P·d | 15 L/P·d | 30 L/P·d | 50 L/P·d | ||
| 1 | 4377 | 10.94 | 32.83 | 65.66 | 131.31 | 218.85 |
| 2 | 3358 | 8.40 | 25.19 | 50.37 | 100.74 | 167.90 |
| 3 | 4897 | 12.24 | 36.73 | 73.46 | 146.91 | 244.85 |
| 4 | 7530 | 18.83 | 56.48 | 112.95 | 225.90 | 376.50 |
| 5 | 4524 | 11.31 | 33.93 | 67.86 | 135.72 | 226.20 |
| 6 | 8604 | 21.51 | 64.53 | 129.06 | 258.12 | 430.20 |
| 7 | 3262 | 8.16 | 24.47 | 48.93 | 97.86 | 163.10 |
| 8 | 6876 | 17.19 | 51.57 | 103.14 | 206.28 | 343.80 |
| 9 | 11,322 | 28.31 | 84.92 | 169.83 | 339.66 | 566.10 |
| 10 | 4850 | 12.13 | 36.38 | 72.75 | 145.50 | 242.50 |
| 11 | 8791 | 21.98 | 65.93 | 131.87 | 263.73 | 439.55 |
| 12 | 3986 | 9.97 | 29.90 | 59.79 | 119.58 | 199.30 |
| 13 | 10,344 | 25.86 | 77.58 | 155.16 | 310.32 | 517.20 |
| 14 | 13,910 | 34.78 | 104.33 | 208.65 | 417.30 | 695.50 |
| 15 | 6106 | 15.27 | 45.80 | 91.59 | 183.18 | 305.30 |
| 16 | 7059 | 17.65 | 52.94 | 105.89 | 211.77 | 352.95 |
| 17 | 8350 | 20.88 | 62.63 | 125.25 | 250.50 | 417.50 |
| 18 | 9685 | 24.21 | 72.64 | 145.28 | 290.55 | 484.25 |
| 19 | 10,622 | 26.56 | 79.67 | 159.33 | 318.66 | 531.10 |
| 20 | 5318 | 13.30 | 39.89 | 79.77 | 159.54 | 265.90 |
| 21 | 4167 | 10.42 | 31.25 | 62.51 | 125.01 | 208.35 |
| 22 | 12,706 | 31.77 | 95.30 | 190.59 | 381.18 | 635.30 |
| 23 | 7716 | 19.29 | 57.87 | 115.74 | 231.48 | 385.80 |
| 24 | 5718 | 14.30 | 42.89 | 85.77 | 171.54 | 285.90 |
| 25 | 2323 | 5.81 | 17.42 | 34.85 | 69.69 | 116.15 |
| 26 | 3529 | 8.82 | 26.47 | 52.94 | 105.87 | 176.45 |
| 27 | 2549 | 6.37 | 19.12 | 38.24 | 76.47 | 127.45 |
| 28 | 959 | 2.40 | 7.19 | 14.39 | 28.77 | 47.95 |
| 29 | 6008 | 15.02 | 45.06 | 90.12 | 180.24 | 300.40 |
| 30 | 626 | 1.57 | 4.70 | 9.39 | 18.78 | 31.30 |
| Sum | 190,072 | 475.18 | 1425.54 | 2851.08 | 5702.16 | 9503.60 |
Table 6.
Comparison of the efficiency of public wells in particular zones in the analyzed city (own study).
Table 6.
Comparison of the efficiency of public wells in particular zones in the analyzed city (own study).
| Zone | Number of Wells | Wells Efficiency, Cubic Meter/d | |||
|---|---|---|---|---|---|
| Drilled | Dug | Drilled | Dug | Sum | |
| 1 | 4 | 7 | 27.2 | 4 | 31.2 |
| 2 | 6 | 1 | 26 | 0.2 | 26.2 |
| 3 | 9 | 1 | 31.4 | 0.2 | 31.6 |
| 4 | 9 | 4 | 81.9 | 1.5 | 83.4 |
| 5 | 4 | 2 | 29.8 | 0.8 | 30.6 |
| 6 | 7 | 8 | 38.3 | 8.4 | 46.7 |
| 7 | 2 | 0 | 5 | 0 | 5 |
| 8 | 8 | 3 | 66.9 | 2.5 | 69.4 |
| 9 | 6 | 1 | 23.9 | 0.2 | 24.1 |
| 10 | 0 | 5 | 0 | 1.5 | 1.5 |
| 11 | 12 | 2 | 66 | 0.8 | 66.8 |
| 12 | 1 | 6 | 0.2 | 3.2 | 3.4 |
| 13 | 12 | 2 | 46.9 | 0.4 | 47.3 |
| 14 | 10 | 1 | 56.4 | 0.6 | 57 |
| 15 | 0 | 0 | 0 | 0 | 0 |
| 16 | 1 | 1 | 2.5 | 0.2 | 2.7 |
| 17 | 3 | 0 | 16.5 | 0 | 16.5 |
| 18 | 0 | 0 | 0 | 0 | 0 |
| 19 | 10 | 0 | 44.1 | 0 | 44.1 |
| 20 | 6 | 1 | 24.5 | 0.6 | 25.1 |
| 21 | 5 | 2 | 30.7 | 0.8 | 31.5 |
| 22 | 3 | 1 | 17.2 | 0.2 | 17.4 |
| 23 | 7 | 0 | 14.7 | 0 | 14.7 |
| 24 | 2 | 0 | 2.7 | 0 | 2.7 |
| 25 | 0 | 0 | 0 | 0 | 0 |
| 26 | 0 | 0 | 0 | 0 | 0 |
| 27 | 1 | 0 | 10.5 | 0 | 10.5 |
| 28 | 0 | 0 | 0 | 0 | 0 |
| 29 | 0 | 0 | 0 | 0 | 0 |
| 30 | 0 | 0 | 0 | 0 | 0 |
| Sum | 128 | 48 | 663.3 | 26.1 | 689.4 |
Table 7.
The percentage of coverage of the characteristic water demand in crisis conditions from public wells.
Table 7.
The percentage of coverage of the characteristic water demand in crisis conditions from public wells.
| Zone | Number of Registered Persons in the City | Wells Efficiency, Cubic Meter/d | Q of Well per Capita, L/P·d | Coverage of Water Demand per Capita, % | Coverage of Water Demand per Capita, % | Coverage of Water Demand per Capita, % | Coverage of Water Demand per Capita, % | Coverage of Water Demand per Capita, % | ΔQ Water Deficiency per Capita, % | ΔQ Water Deficiency per Capita, % | ΔQ Water Deficiency per Capita, % | ΔQ Water Deficiency per Capita, % | ΔQ Water Deficiency per Capita, % |
|---|---|---|---|---|---|---|---|---|---|---|---|---|---|
| 2.5 | 7.5 | 15 | 30 | 50 | 2.5 | 7.5 | 15 | 30 | 50 | ||||
| Sum | L/P·d | L/P·d | L/P·d | L/P·d | L/P·d | L/P·d | L/P·d | L/P·d | L/P·d | L/P·d | |||
| 1 | 4377 | 31.2 | 7.13 | 285.13 | 95.04 | 47.52 | 23.76 | 14.26 | −185.13 | 4.96 | 52.48 | 76.24 | 85.74 |
| 2 | 3358 | 26.2 | 7.80 | 312.09 | 104.03 | 52.02 | 26.01 | 15.60 | −212.09 | −4.03 | 47.98 | 73.99 | 84.40 |
| 3 | 4897 | 31.6 | 6.45 | 258.12 | 86.04 | 43.02 | 21.51 | 12.91 | −158.12 | 13.96 | 56.98 | 78.49 | 87.09 |
| 4 | 7530 | 83.4 | 11.08 | 443.03 | 147.68 | 73.84 | 36.92 | 22.15 | −343.03 | −47.68 | 26.16 | 63.08 | 77.85 |
| 5 | 4524 | 30.6 | 6.76 | 270.56 | 90.19 | 45.09 | 22.55 | 13.53 | −170.56 | 9.81 | 54.91 | 77.45 | 86.47 |
| 6 | 8604 | 46.7 | 5.43 | 217.11 | 72.37 | 36.18 | 18.09 | 10.86 | −117.11 | 27.63 | 63.82 | 81.91 | 89.14 |
| 7 | 3262 | 5 | 1.53 | 61.31 | 20.44 | 10.22 | 5.11 | 3.07 | 38.69 | 79.56 | 89.78 | 94.89 | 96.93 |
| 8 | 6876 | 69.4 | 10.09 | 403.72 | 134.57 | 67.29 | 33.64 | 20.19 | −303.72 | −34.57 | 32.71 | 66.36 | 79.81 |
| 9 | 11,322 | 24.1 | 2.13 | 85.14 | 28.38 | 14.19 | 7.10 | 4.26 | 14.86 | 71.62 | 85.81 | 92.90 | 95.74 |
| 10 | 4850 | 1.5 | 0.31 | 12.37 | 4.12 | 2.06 | 1.03 | 0.62 | 87.63 | 95.88 | 97.94 | 98.97 | 99.38 |
| 11 | 8791 | 66.8 | 7.60 | 303.95 | 101.32 | 50.66 | 25.33 | 15.20 | −203.95 | −1.32 | 49.34 | 74.67 | 84.80 |
| 12 | 3986 | 3.4 | 0.85 | 34.12 | 11.37 | 5.69 | 2.84 | 1.71 | 65.88 | 88.63 | 94.31 | 97.16 | 98.29 |
| 13 | 10,344 | 47.3 | 4.57 | 182.91 | 60.97 | 30.48 | 15.24 | 9.15 | −82.91 | 39.03 | 69.52 | 84.76 | 90.85 |
| 14 | 13,910 | 57 | 4.10 | 163.91 | 54.64 | 27.32 | 13.66 | 8.20 | −63.91 | 45.36 | 72.68 | 86.34 | 91.80 |
| 15 | 6106 | 0 | 0.00 | 0.00 | 0.00 | 0.00 | 0.00 | 0.00 | 100.00 | 100.00 | 100.00 | 100.00 | 100.00 |
| 16 | 7059 | 2.7 | 0.38 | 15.30 | 5.10 | 2.55 | 1.27 | 0.76 | 84.70 | 94.90 | 97.45 | 98.73 | 99.24 |
| 17 | 8350 | 16.5 | 1.98 | 79.04 | 26.35 | 13.17 | 6.59 | 3.95 | 20.96 | 73.65 | 86.83 | 93.41 | 96.05 |
| 18 | 9685 | 0 | 0.00 | 0.00 | 0.00 | 0.00 | 0.00 | 0.00 | 100.00 | 100.00 | 100.00 | 100.00 | 100.00 |
| 19 | 10,622 | 44.1 | 4.15 | 166.07 | 55.36 | 27.68 | 13.84 | 8.30 | −66.07 | 44.64 | 72.32 | 86.16 | 91.70 |
| 20 | 5318 | 25.1 | 4.72 | 188.79 | 62.93 | 31.47 | 15.73 | 9.44 | −88.79 | 37.07 | 68.53 | 84.27 | 90.56 |
| 21 | 4167 | 31.5 | 7.56 | 302.38 | 100.79 | 50.40 | 25.20 | 15.12 | −202.38 | −0.79 | 49.60 | 74.80 | 84.88 |
| 22 | 12,706 | 17.4 | 1.37 | 54.78 | 18.26 | 9.13 | 4.56 | 2.74 | 45.22 | 81.74 | 90.87 | 95.44 | 97.26 |
| 23 | 7716 | 14.7 | 1.91 | 76.21 | 25.40 | 12.70 | 6.35 | 3.81 | 23.79 | 74.60 | 87.30 | 93.65 | 96.19 |
| 24 | 5718 | 2.7 | 0.47 | 18.89 | 6.30 | 3.15 | 1.57 | 0.94 | 81.11 | 93.70 | 96.85 | 98.43 | 99.06 |
| 25 | 2323 | 0 | 0.00 | 0.00 | 0.00 | 0.00 | 0.00 | 0.00 | 100.00 | 100.00 | 100.00 | 100.00 | 100.00 |
| 26 | 3529 | 0 | 0.00 | 0.00 | 0.00 | 0.00 | 0.00 | 0.00 | 100.00 | 100.00 | 100.00 | 100.00 | 100.00 |
| 27 | 2549 | 10.5 | 4.12 | 164.77 | 54.92 | 27.46 | 13.73 | 8.24 | −64.77 | 45.08 | 72.54 | 86.27 | 91.76 |
| 28 | 959 | 0 | 0.00 | 0.00 | 0.00 | 0.00 | 0.00 | 0.00 | 100.00 | 100.00 | 100.00 | 100.00 | 100.00 |
| 29 | 6008 | 0 | 0.00 | 0.00 | 0.00 | 0.00 | 0.00 | 0.00 | 100.00 | 100.00 | 100.00 | 100.00 | 100.00 |
| 30 | 626 | 0 | 0.00 | 0.00 | 0.00 | 0.00 | 0.00 | 0.00 | 100.00 | 100.00 | 100.00 | 100.00 | 100.00 |
Table 8.
Estimation of risk of lack of water in a crisis for a water demand of 2.5 L/P·d.
| Zone | Point Weight of Parameter P | Point Weight of Parameter ΔQ | The Risk of Lack of Water Supply in a Crisis rsk | |
|---|---|---|---|---|
| Risk Value | Risk Level | |||
| 1 | 1 | 1 | 1 | Accepted |
| 2 | 1 | 1 | 1 | Accepted |
| 3 | 1 | 1 | 1 | Accepted |
| 4 | 1 | 1 | 1 | Accepted |
| 5 | 1 | 1 | 1 | Accepted |
| 6 | 2 | 1 | 2 | Accepted |
| 7 | 2 | 3 | 6 | Tolerable |
| 8 | 1 | 1 | 1 | Accepted |
| 9 | 1 | 2 | 2 | Accepted |
| 10 | 2 | 5 | 10 | Controlled |
| 11 | 1 | 1 | 1 | Accepted |
| 12 | 2 | 4 | 8 | Controlled |
| 13 | 1 | 1 | 1 | Accepted |
| 14 | 2 | 1 | 2 | Accepted |
| 15 | 1 | 5 | 5 | Tolerable |
| 16 | 1 | 5 | 5 | Tolerable |
| 17 | 1 | 2 | 2 | Accepted |
| 18 | 1 | 5 | 5 | Tolerable |
| 19 | 2 | 1 | 2 | Accepted |
| 20 | 2 | 1 | 2 | Accepted |
| 21 | 2 | 1 | 2 | Accepted |
| 22 | 1 | 3 | 3 | Accepted |
| 23 | 2 | 2 | 4 | Tolerable |
| 24 | 2 | 5 | 10 | Controlled |
| 25 | 1 | 5 | 5 | Tolerable |
| 26 | 2 | 5 | 10 | Controlled |
| 27 | 1 | 1 | 1 | Accepted |
| 28 | 1 | 5 | 5 | Tolerable |
| 29 | 2 | 5 | 10 | Controlled |
| 30 | 1 | 5 | 5 | Tolerable |
Publisher’s Note: MDPI stays neutral with regard to jurisdictional claims in published maps and institutional affiliations. |
© 2022 by the author. Licensee MDPI, Basel, Switzerland. This article is an open access article distributed under the terms and conditions of the Creative Commons Attribution (CC BY) license (https://creativecommons.org/licenses/by/4.0/).
Share and Cite
MDPI and ACS Style
Piegdoń, I. A New Concept of Crisis Water Management in Urban Areas Based on the Risk Maps of Lack of Water Supply in Response to European Law. Resources 2022, 11, 17. https://0-doi-org.brum.beds.ac.uk/10.3390/resources11020017
AMA Style
Piegdoń I. A New Concept of Crisis Water Management in Urban Areas Based on the Risk Maps of Lack of Water Supply in Response to European Law. Resources. 2022; 11(2):17. https://0-doi-org.brum.beds.ac.uk/10.3390/resources11020017
Chicago/Turabian StylePiegdoń, Izabela. 2022. "A New Concept of Crisis Water Management in Urban Areas Based on the Risk Maps of Lack of Water Supply in Response to European Law" Resources 11, no. 2: 17. https://0-doi-org.brum.beds.ac.uk/10.3390/resources11020017
Note that from the first issue of 2016, this journal uses article numbers instead of page numbers. See further details here.