Article

Estimation of Mining and Landfilling Activities with Associated Overburden through Satellite Data: Germany 2000–2010

1
Railway Systems Business Unit, Hitachi, Tokyo 101-8608, Japan
2
Graduate School of Environmental Studies, Nagoya University, Nagoya 464-8601, Japan
3
School of Forestry & Environmental Studies, Yale University, New Haven, CT 06511, USA
4
Faculty of Civil and Environmental Engineering, Technical University of Darmstadt, Darmstadt 64287, Germany
*
Author to whom correspondence should be addressed.
Submission received: 3 June 2019 / Revised: 3 July 2019 / Accepted: 9 July 2019 / Published: 16 July 2019
(This article belongs to the Special Issue Ecological Management: Natural Resources and Human Interaction)

Abstract

:
Despite ever-increasing material extraction on the global scale, very few studies have focused on the relationship between mining activities, overburden, and landfilling. This is mainly due to the lack of statistical data. Yet, large mining activities cause environmental strain to the natural environment, and are often cause of irreversible alterations to the natural landscape. To circumvent this problem, we develop a methodology that employs the digital elevation model and land cover to detect and analyze mining and landfilling site over time. We test our methodology with the case of Germany for the years 2000–2010. We then confront our results with statistically available data, to verify whether this methodology can be applied to other countries. Results from the analysis of satellite data give 15.3 Pg of extracted materials and 7.8 Pg of landfilled materials, while statistics report 29.4 Pg and 1.8 Pg, respectively. This large difference was likely due to the different frequency of recording, where satellite data was updated after 10 years, while statistics were reported yearly. The analysis of the anthropogenic disturbance with spatial information can effectively contribute to observe, analyze, and quantify mining activities, overburden, and landfills, and can thus provide policy makers with useful and practical information regarding resource usage and waste management.

1. Introduction

1.1. Material Stock and Flow Analysis and Anthropogenic Disturbance

The global resource extraction, in-use stock, and waste flows are growing faster than ever, with concerns regarding the depletion of natural resourses in the name of economic development [1,2,3,4]. Material stocks are essential to the development of societies as they support economic activities and provide essential services, yet to continue to operate they require a continuous input of materials for their maintenance and replacement [5,6]. Moreover, this continuous maintenance inflow is associated to a roughly equivalent amount of resources which are removed in the form of waste [3]. Understanding the long-term global dynamics of stocks and flows of materials is essential to achieve the decoupling of the economy and material consumption [7,8], and this topic is being investigated by many researchers qualitatively and quantitatively tracking material flows to develop databases and indicators [4,9,10,11]. The accounting of material stock and flow also plays important roles to monitor the decoupling of natural resource use and environmental impacts from economic growth [12]. The material stock of nations and cities are accounted for employing different methodologies, such as statistical reports [13,14], or material inventories [15,16,17]. The rapid urban development experienced by many countries in the 20th century has been putting unprecedented pressure on the natural environment, public health, and air quality of many large urban areas [1,18,19]. Moreover, despite efforts in ensuring high construction standards, the overall trend of the construction lifespan is shortening over time [20,21], hence contributing to the increase of the overall yearly throughput of materials [22]. Research to understand the environmental impacts associated with material extraction and waste flows is thus essential for making sustainable management plans at both the city and national scale [23,24]. Moreover, having a clear understanding of the scale of national and local waste flows is an important issue for regional planners and politicians [25].
However, compared to the number of studies on material stock, inflows, and outflows, only a handful of publications have focused on the anthropogenic disturbance of upstream and downstream material flows. Anthropogenic disturbance is defined as all the mining, soil excavation, infrastructural and urban development, cut and fill operations, and waste landfill, which cause large-scale disturbance to the flora, fauna, and landscape of the ecosystem, altering often irreversibly the local environment and topography [9,18,26,27,28]. Any soil and mineral moved to allow the initiation of mining operations or construction project, but not used for any economic purposes, is defined as overburden (In the past these flows were defined as ‘hidden flows’, but more recent publications and material flow manuals refer to them as ‘overburden’) [9,11,29]. This kind of material flow is primarily associated with open-pit mines, but can be found, albeit to a much lesser extent, in nearly all construction activities [23,30]. Overburden and its associated anthropogenic disturbance are increasing on the global scale, yet, as noted by Bringezu and colleagues [18], there is not yet a standard common framework to systematically account for it. The total material requirement (TMR), defined as “the total mass of primary materials extracted from nature to support human activities” [31] can show potential environmental impacts associated with natural resource extraction and use, yet it cannot indicate specific environmental pressures that cause destructive and irreversible effects on the natural environment [32]. It is thus fundamental to develop a framework for estimating the material overburden through the monitoring of domestic extraction.

1.2. Digital Elevation Model Applications in Industrial Ecology

Digital elevation models (DEMs) have been used for the analysis and modeling of environmental, ecological, and hydrological phenomenon, and to monitor the evolution of the natural environment [27,33,34,35,36,37,38,39,40,41]. Researchers have employed DEMs, which are digitalized models of the earth’s surface, to investigate a wide array of spatial problems. DEMs have been used in a variety of research fields such as geography, geology, and geomorphology to estimate the soil and earth movements, which are caused by natural phenomena such as landslides, slope failures, and mountain stream debris outflows [42,43,44]. Despite DEMs being valuable and useful for many research fields, the accuracy of DEMs cannot be neglected and there is research on qualifying the DEMs error [45,46,47,48,49].
In the field of material flow analysis (MFA), DEMs have been applied to calculate the total material requirement of residential buildings in a suburban area, with the inclusion of the overburden which was excavated in the construction site [28]. They have also been used in time-series to generate the total material requirement for a variety of mining areas [27,30]. Moreover, DEMs have found application in estimating the demolition waste from non-residential buildings at a city scale [50]. One of the most useful applications of DEMs is in the estimation of material overburden and land change of open mines, which is possible through the comparison of different timeframes and statistics of mining activities [51].

1.3. Objective

This study aims to clarify the dynamics of anthropogenic disturbance and quantify the overburden of mining activities by presenting a novel methodology which relies on remote sensing techniques. This methodology can quantify used and unused material extraction, as well as land restoration activities (i.e., pit filling) and distribute this information spatially. To test our methodology, we applied it to the German mining sector, and crossed our results with both top-down and bottom-up accounts to check for their validity. Furthermore, we evaluated our results against the Japanese mining sector, to identify commonalities and differences between the two countries which have very different geographical, economic, and historical characteristics.
This novel methodology can be especially useful in countries with poor statistics, as it does not rely on national reporting, but on satellite images. As it is difficult to have an accurate and reliable database regarding mining in developing countries, our methodology permits a rapid quantification of metal ores, overburden, and landfill activities regardless of their geographic location. This is a first step in creating a standardized methodology to systematically account for material overburden, as raised by Bringezu and colleagues [18]. This study contributes to the sustainable management of mining activities, as well as to the quantification of one of the most underreported data of the mining sector.

2. Method and Data

Germany is a highly industrialized country and has been the subject of much research related to material consumption, material efficiency, and material stock and flow analysis [3,9,16,18,52,53,54].
We employed a top-down and bottom-up method as originally applied by Yoshida and colleagues [51] to qualitatively understand the overburden of German mining activities. In the top-down method, the Global Material Flows Database [55], the Environmental Waste Management Record [56], and the Waste and Recycling Management Record [57] were used for accounting used materials, unused materials, waste materials, and landfill materials between 2000 and 2010. In the bottom-up method, we employed satellite data from the SRTM (Shuttle Radar Topography Mission), ASTER GDEM (advanced space-borne thermal emission and reflection radiometer, global digital elevation model) [58], ALOS (Global 25 m resolutions PALSAR-2/PALSAR/JERS-1 Mosaic and forest/non-forest map) [59], and CORINE (coordination of information on the environment) [60] to calculate the mass of materials moved in currently operating mining in Germany. We then compared the results of total material extraction and final landfill disposals calculated through the two methodologies.

2.1. Top-Down Methodology: Global Material Flows Database and Federal Statistics

The Global Material Flows Database and the Federal Statistics of Germany were used for accounting the mass of used, unused, waste, and landfill materials (Table 1).
The Global Material Flows Database [55] was compiled as a collaborative project amongst the Vienna University of Economics and Business (WU), the Commonwealth Scientific and Industrial Research Organization (CSIRO), the Institute of Social Ecology Vienna (SEC), Austria, Nagoya University, and University of Sydney’s Integrated Sustainability Analysis (ISA), and can be used for a variety of policy-oriented analyses of the economy and their environmental interactions. The database covers more than 300 different materials aggregated into 13 categories of material flows from 1970 to 2017 in more than 150 countries. In order to account for the mining activities of the entire country, we selected used and unused material of industrial minerals, ores, construction minerals, and coal from 2000 to 2010.
The Federal Statistical Office of Germany (DSTATIS) is the leading provider of high-quality statistical information of Germany, and we used its environmental waste record for accounting for the total waste generation. Data on landfilling activities was retrieved through the German Environmental Agency. For both datasets, we selected municipal waste, mining material, waste from production and trade, construction and demolition waste, and waste from treatment plants.

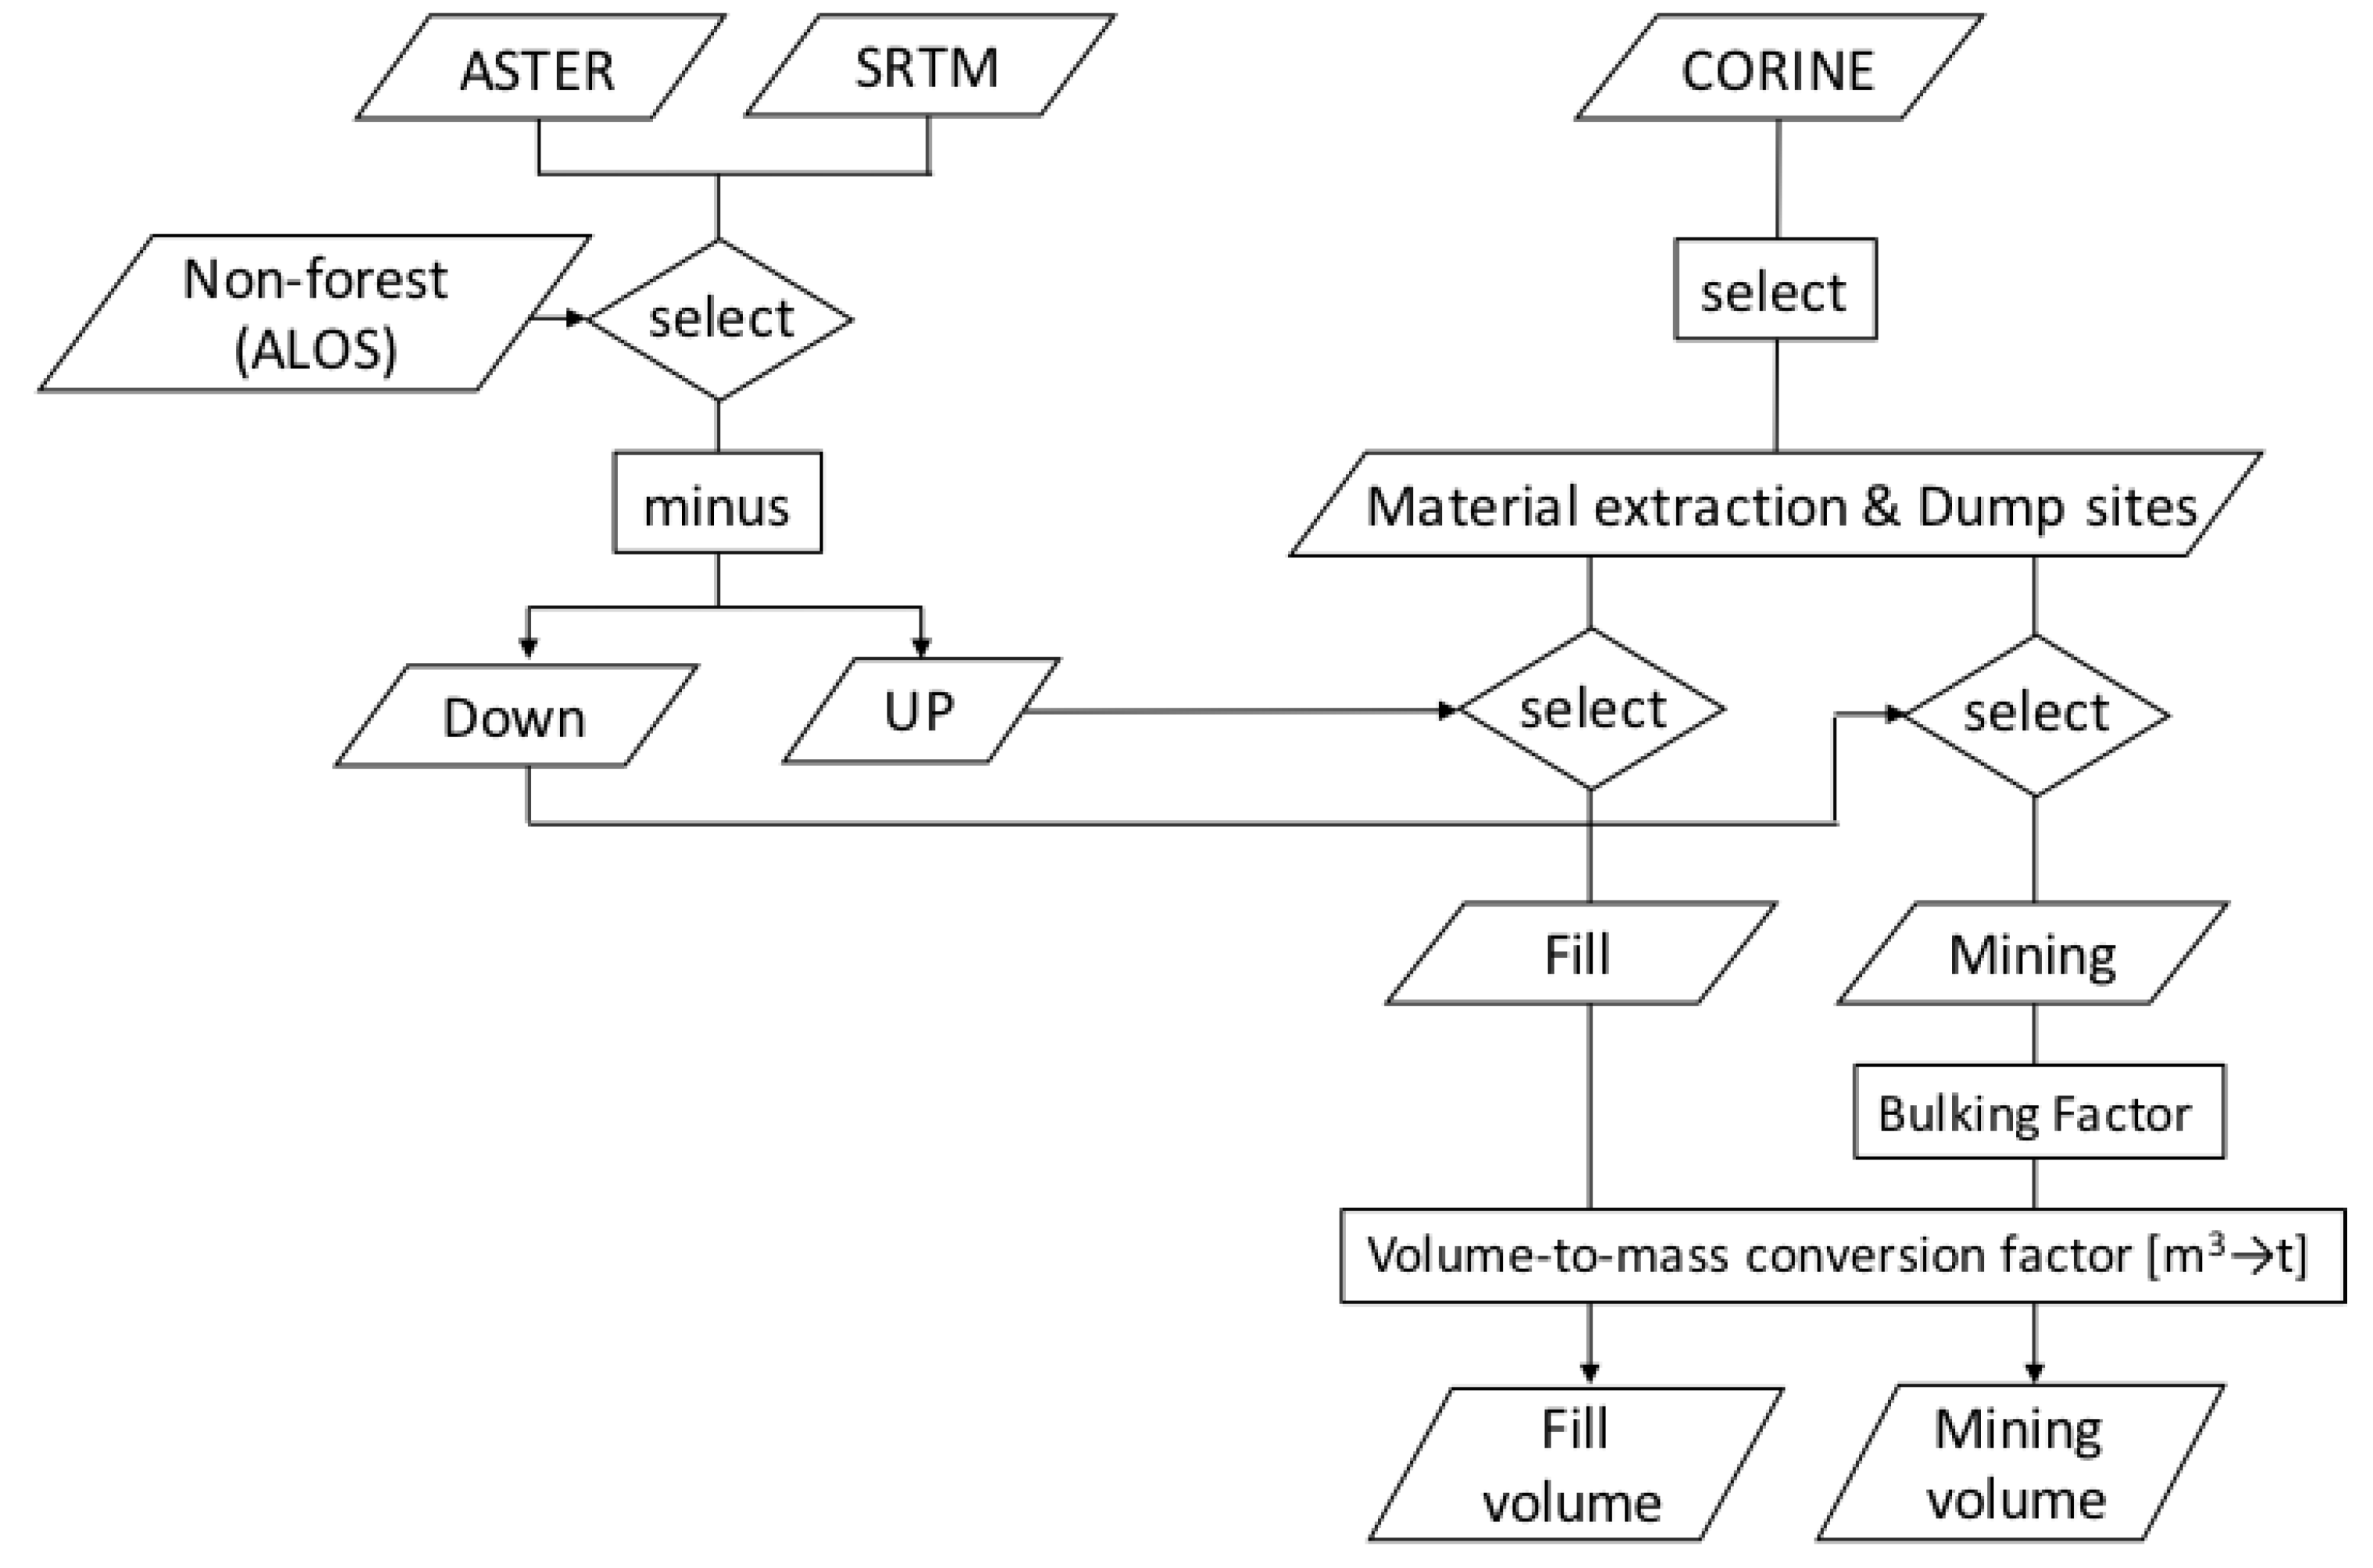
2.2. Bottom-Up Method: Digital Elevation Model and Land Cover

In the bottom-up method we used DEMs, specifically ASTER GDEM and SRTM, for quantifying the mass of transferred materials, while CORINE and non-forest map were used for detecting mining and filling sites (Table 2 and Figure 1) [61]. We investigated the dynamics of anthropogenic activities by measuring the area, depth, and volume of mining sites and landfills through the comparison of DEMs for different time frames. DEMs also enabled the distribution of mining activities in space, thereby allowing the observation of the environmental pressure and its evolution over time [27,30].
DEMs for the entire world are now available online, created from stereo pairs or triplets of optical images or data from synthetic aperture radar. ASTER GDEM and SRTM are raster datasets: Digitized grids of cells of a fixed spatial resolution, with each cell having a value that represents the elevation from sea level of the terrain in that cell. We calculated the elevation change due to material extraction and fill by using the Minus Tool of the ArcGIS computer application, which can subtract the value of the SRTM from the value of the ASTER GDEM on a cell-by-cell basis [62]. The SRTM represents the bare ground elevation, while the ASTER GDEM includes all objects that lie on the ground surface (e.g., trees). Therefore, the elevation changes by the Minus Tool include not only material extraction and fill, but also trees of forested area.
In order to eliminate the calculation error caused by the trees on the ground surface, we used CORINE and non-forest map to exclude the forested area from the ASTER GDEM. Non-forest map is produced through the classification of the intensity of backscattering in a 25 m2 resolution PALSAR-2/PALSAR mosaic, and the determination of forest is done according to the Food and Agriculture Organization of the United Nations (FAO)’s definition (i.e., a natural forest which has an area larger than 5000 m2 (0.5 ha) with at least 84% occupation in the mesh) [63].
CORINE covers most of Europe in 44 classes with high spatial resolution, and it is based on satellite data such as Landsat-5 (MSS/TM), Landsat-7 (ETM), Spot-4/5, IRS P6 LISS (III) and RapidEye, and high spatial resolution satellite imagery data [60]. This data was already used by some countries to semi-automatically determine the land cover by using GIS integration and generalization.
Mineral extraction sites (open-pit extraction of construction material or other minerals), dump sites (public, industrial or mine dump sites) and construction sites (construction development, soil or bedrock excavation, earthworks) were selected according to the CORINE land cover to specifically identify mining and filling sites. Note that the CORINE data cannot distinguish between landfill and backfill sites (i.e., sites which accommodate generic materials coming from a variety of waste streams, and sites which are refilled with the material dug out of it, respectively).
The following Equations (1) and (2) are used in the bottom-up method.
D E =   W × B × ( V t , i V t 2 , i )
where DE denotes the total domestic extraction, V t , i is the volume in 2010 at place i (ASTER GDEM), and V t 2 , i is the volume in 2000 at place i (SRTM), W is the mass-to-volume conversion factor (1.9 t/m3), and B is the bulking factor (1.65).
F =   W × ( V t , i V t 2 , i )
where F denotes the total filled materials, V t , i is the volume in 2010 at place i (ASTER GDEM), and V t 2 , i is the volume in 2010 at place i (SRTM), W is the mass-to-volume conversion factor (1.6 t/m3).
The mining volume through the bottom-up method is reported in the natural condition, which is compressed by its own weight (i.e., bank volume), while the fill volume is reported after the excavation (i.e., loose volume). In order to compare these results with the Global Material Flows Database, Environmental Waste Management Record, and Waste and Recycling Management, which are reported in mass units (i.e., tonnes), we applied a mass-to-volume conversion factor (1.9 t/m3) and a bulking factor (1.65) to mining volume, and mass-to-volume conversion factor (1.6 t/m3) to the filling volume.

3. Results

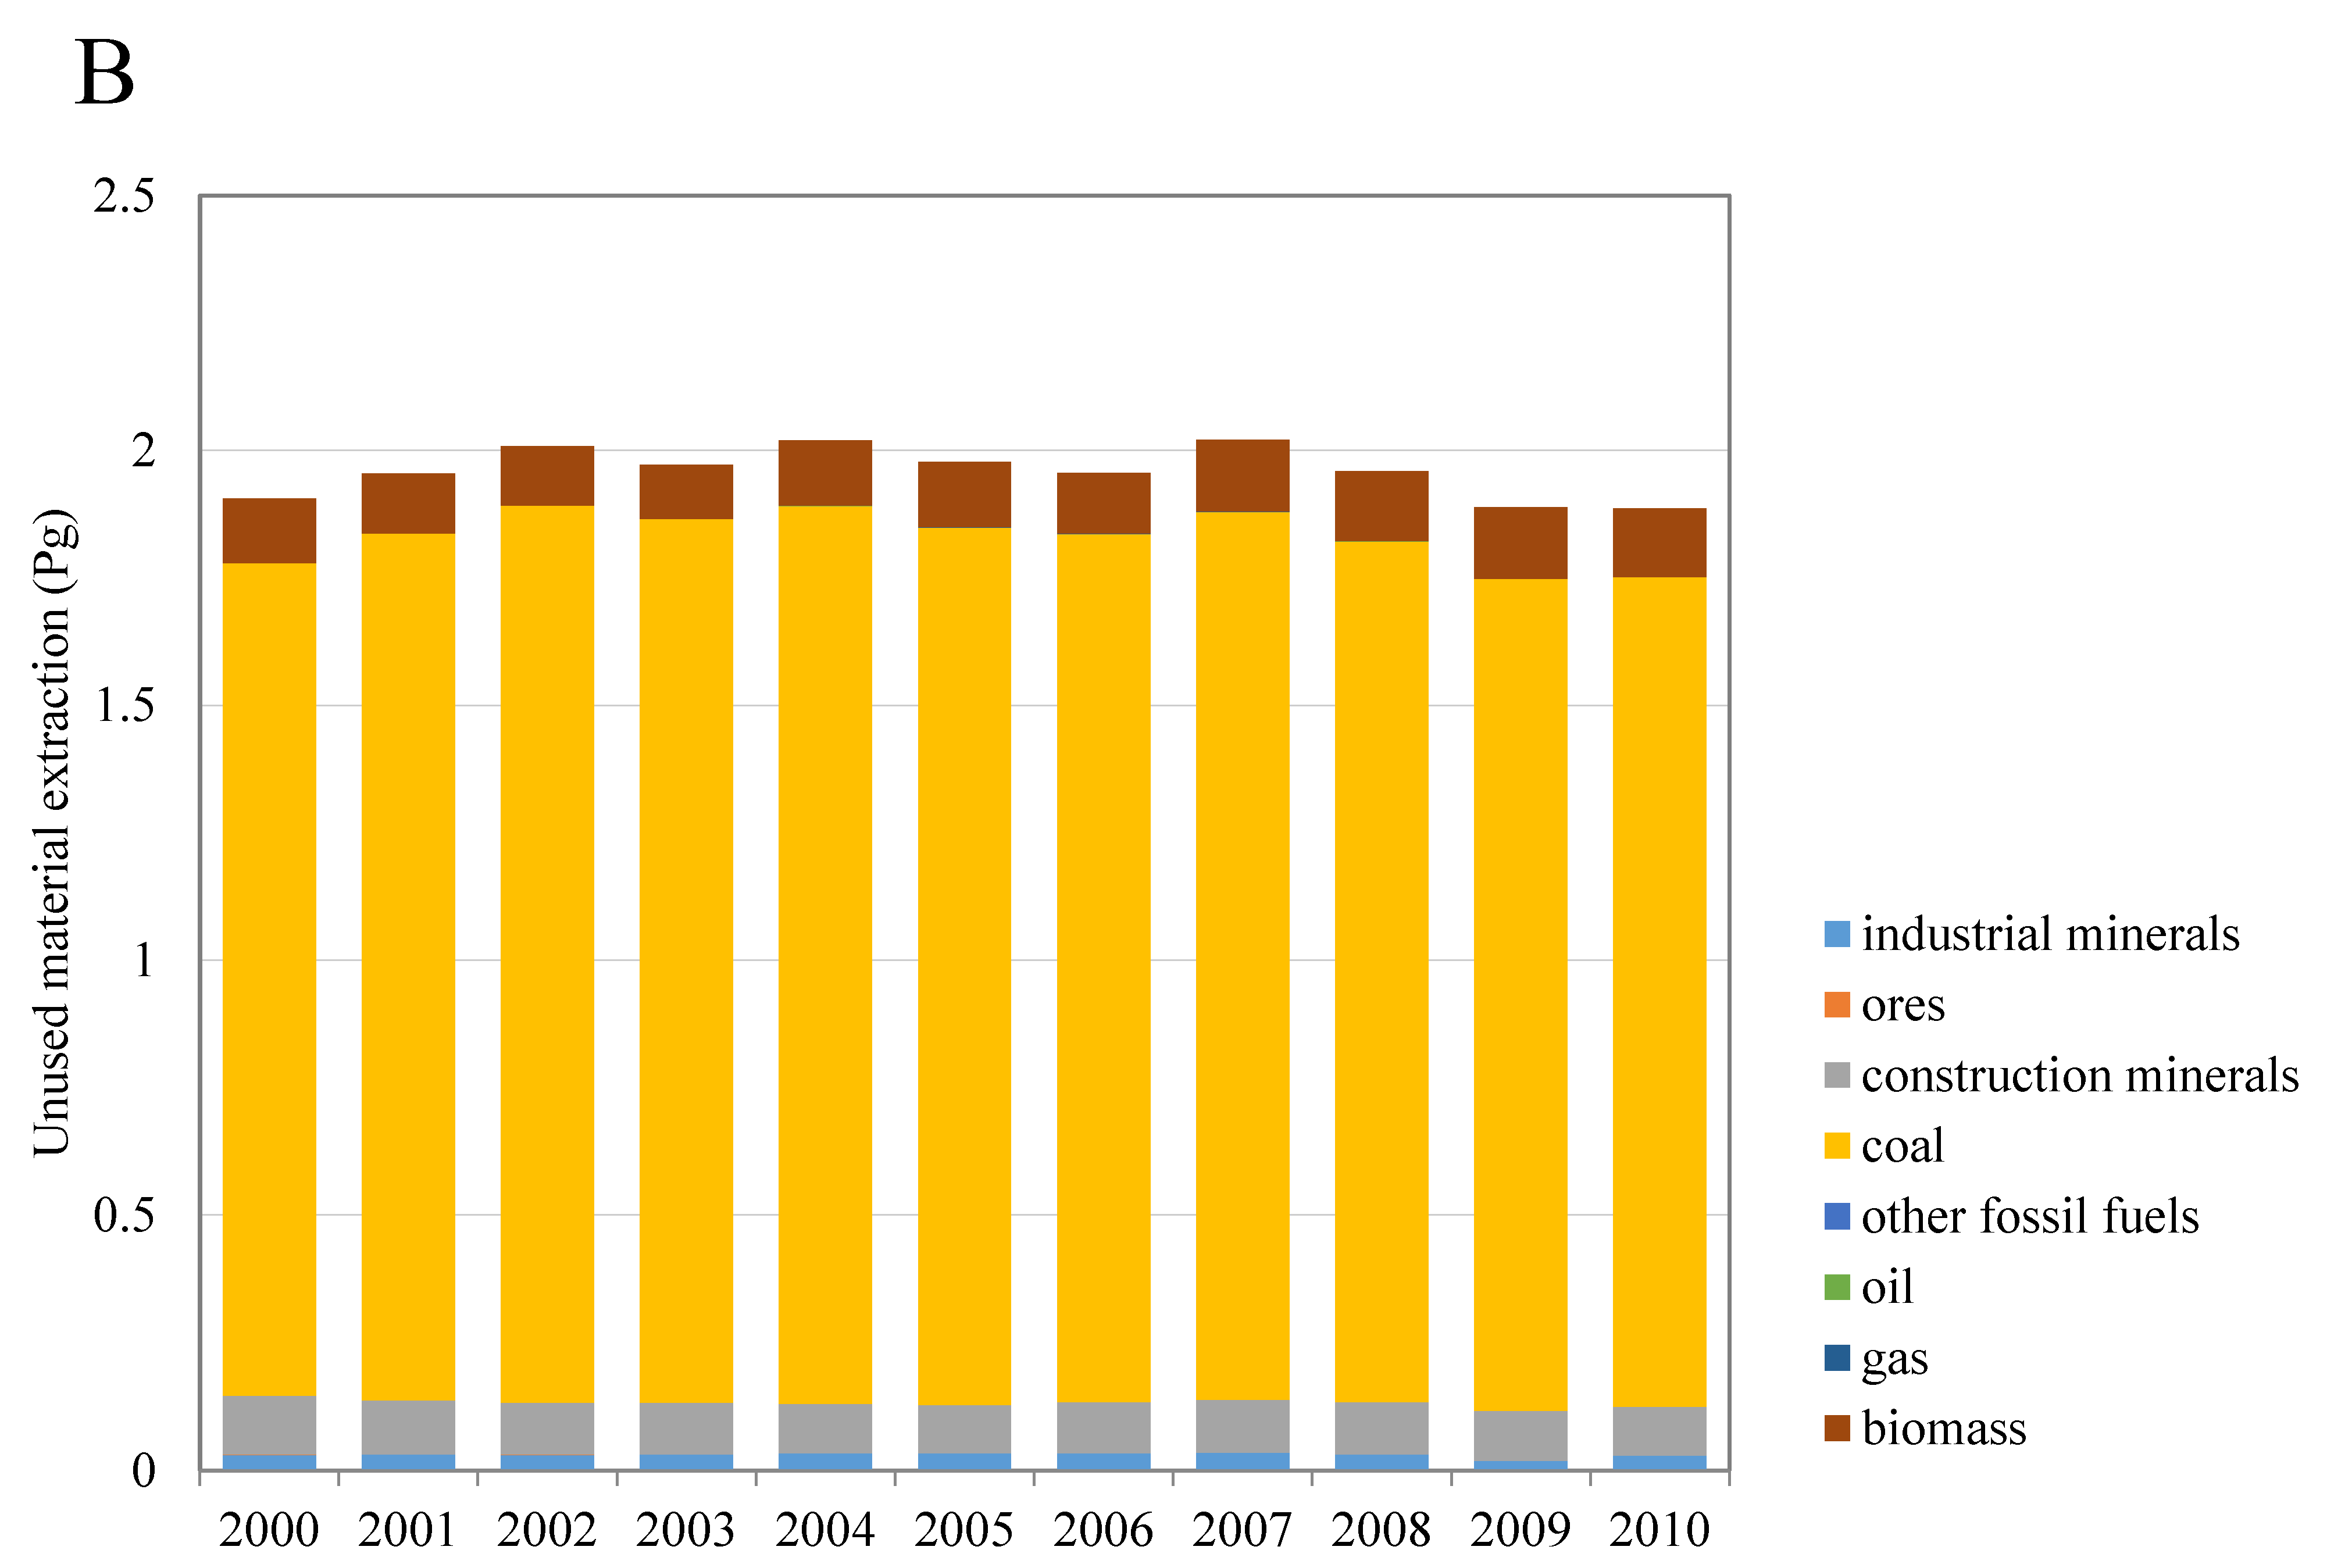
3.1. Top-Down Method: Domestic Used and Unused Material Extraction

Results from the top-down methodology show that over time extraction had a slight decrease, going from about 1.2 Pg in 2000 to 1.0 Pg in 2010 (Figure 2A) (note: 1 Pg = 1015 g = 1 Gt). From 2000 to 2010, the total cumulative mass of used material extraction of Germany was 12.1 Pg, while the total cumulative mass of industrial minerals, ores, construction minerals, and coal reached 9.32 Pg. The first largest extracted material, namely construction minerals, occupied a constant share, approximately 60%, for the whole duration of our period of study. After construction minerals, the second largest extracted material was coal, which accounted for about 200 Tg in each year. The remainder of the DE consists of industrial minerals, ores, other fossil fuels, oil, gas, other biomass, biomass forestry, biomass food, biomass feed, and biomass animals.
With regard to unused extraction, over the 10 years studied the trend remained fairly constant at about 1.9 Pg (Figure 2B). The total cumulative domestic unused extraction was 21.5 Pg, while industrial minerals, ores, construction minerals, and coal tallied to 20.1 Pg. It is notable that 92.7% of the total material overburden consisted of coal, which achieved 16.6 Pg in a decade. The average ratio of German domestic extraction against overburden was 1:1.8, which means that to obtain 1 t of useful materials it has been necessary to remove 1.8 t of overburden.

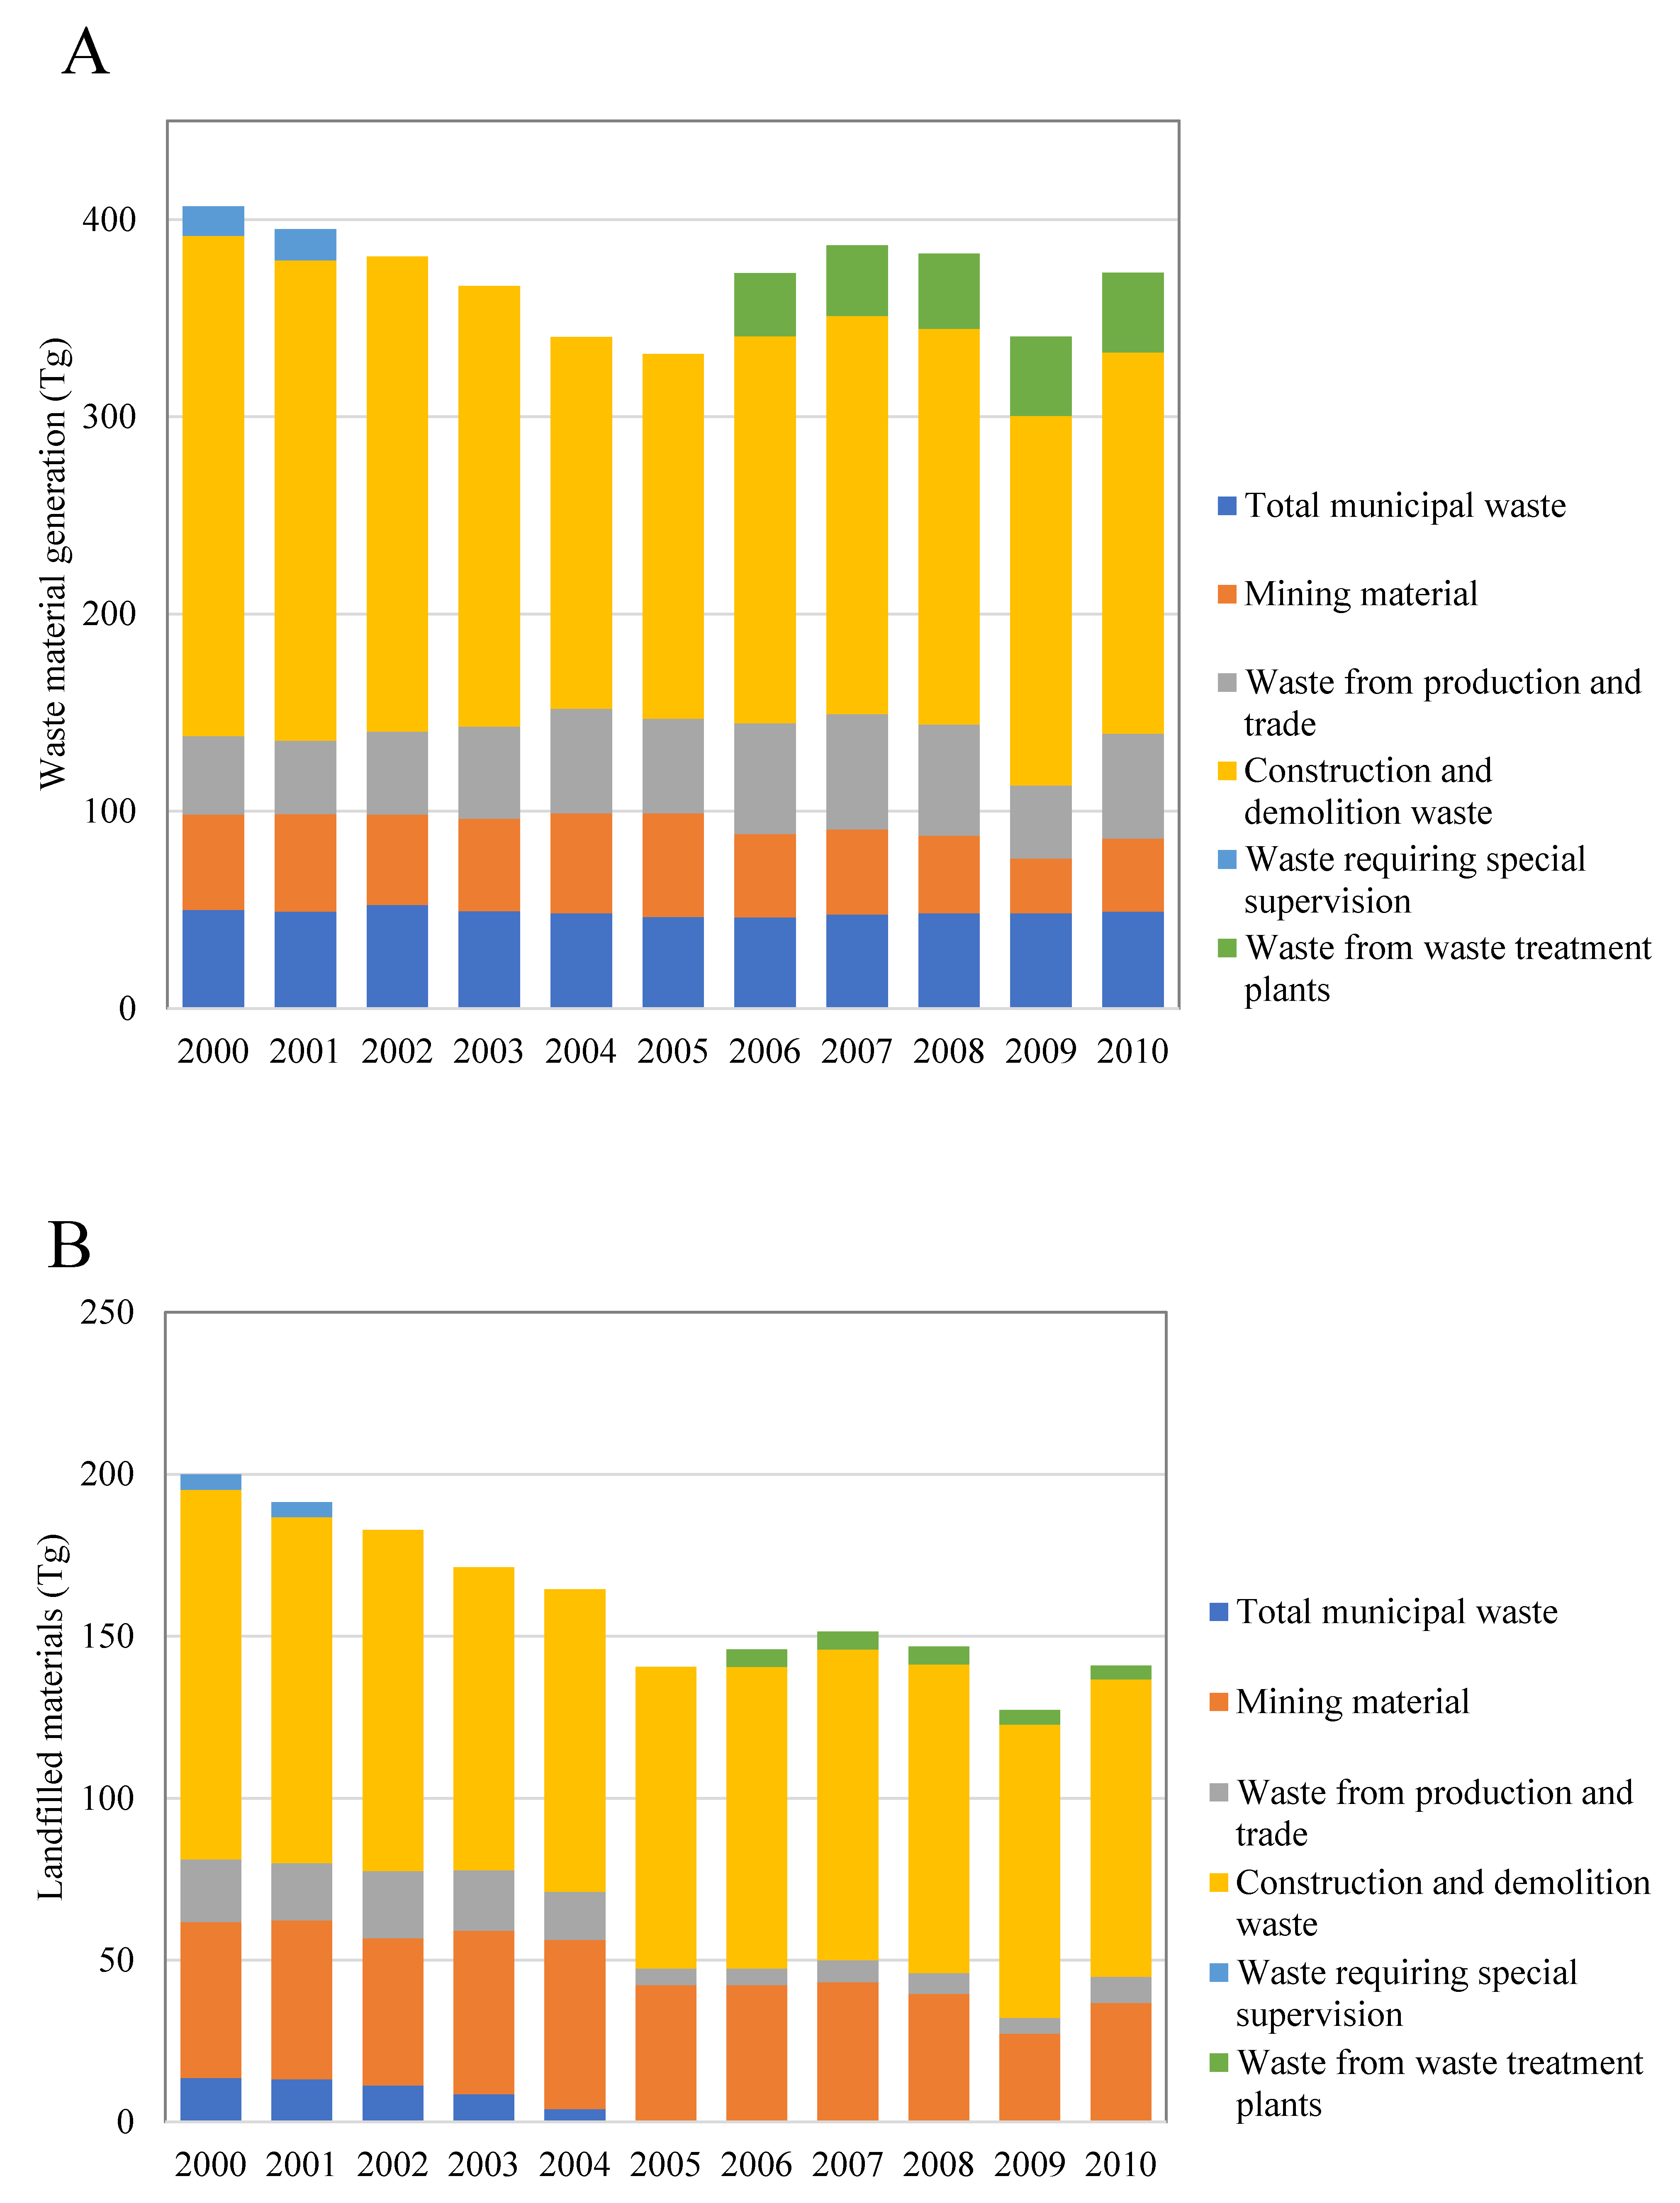
3.2. Top-Down Methodology: Waste Disposal and Fill

From 2000 to 2010, the yearly value of generated waste materials was 375 Tg (Figure 3A), cumulatively totaling 4.1 Pg over a period of 10 years. Of this a total of 1.8 Pg was landfilled, albeit with a decreasing trend (Figure 3B). Waste coming from buildings and infrastructures was disposed in landfills as construction and demolition waste (C&DW), while waste coming from consumers was collected and landfilled as municipal waste. Waste flows were dominated by construction minerals, which had a share of over 50% of the total waste materials throughout the whole study period. However, waste of construction minerals decreased from 254 Tg in 2000 to 193 Tg in 2010. These were composed of soil and stone, rubble, road breaking, construction site waste, construction gypsum plasters. The majority of soil and sand was used to backfill the void made by mining activities, which on average was 73.6 Tg per year.

3.3. Bottom-Up Method: Material Extraction and Fill

The results of the bottom-up method show that, over a period of 10 years, the total mass of used and unused material extraction accounted for 15.3 Pg, while the total mass of filled material was 7.76 Pg (Table 3). The mining and filling area achieved 570 million m2 and 390 million m2. The used material include coal, ores, construction minerals, and industrial minerals.
Figure 4 displays the change of ground elevation in Lusatia lignite mining district, where yellow-red colors represent an elevation decrease (−104 m to 0 m), while azure to blue indicate an elevation increase (0 m to +196 m) due to landfill. The elevation change by mining is measured in natural condition (bank yard), i.e., compressed by own weight, since the elevation raise generated by landfill is measured in loose condition (loose yard).
Mining and landfill sites are distributed throughout Germany (Figure 5). More than 70% of the domestic extraction is occupied by construction minerals such as gravel, soil, and sand, which are characterized by low commercial value and are widely available throughout the country (cf. Figure 2A). Construction minerals are abundantly extracted throughout Germany in order to meet the demand for construction activities in each urbanized area [51].
In addition to mining sites, landfilling sites are also widely distributed throughout Germany (Figure 5). Construction and demolition waste accounted for more than 60% of landfilled material and, due to its low commercial value, it results unsuitable for long distance transportation, and results hence filled at the closest disposal site (cf., Figure 3B).

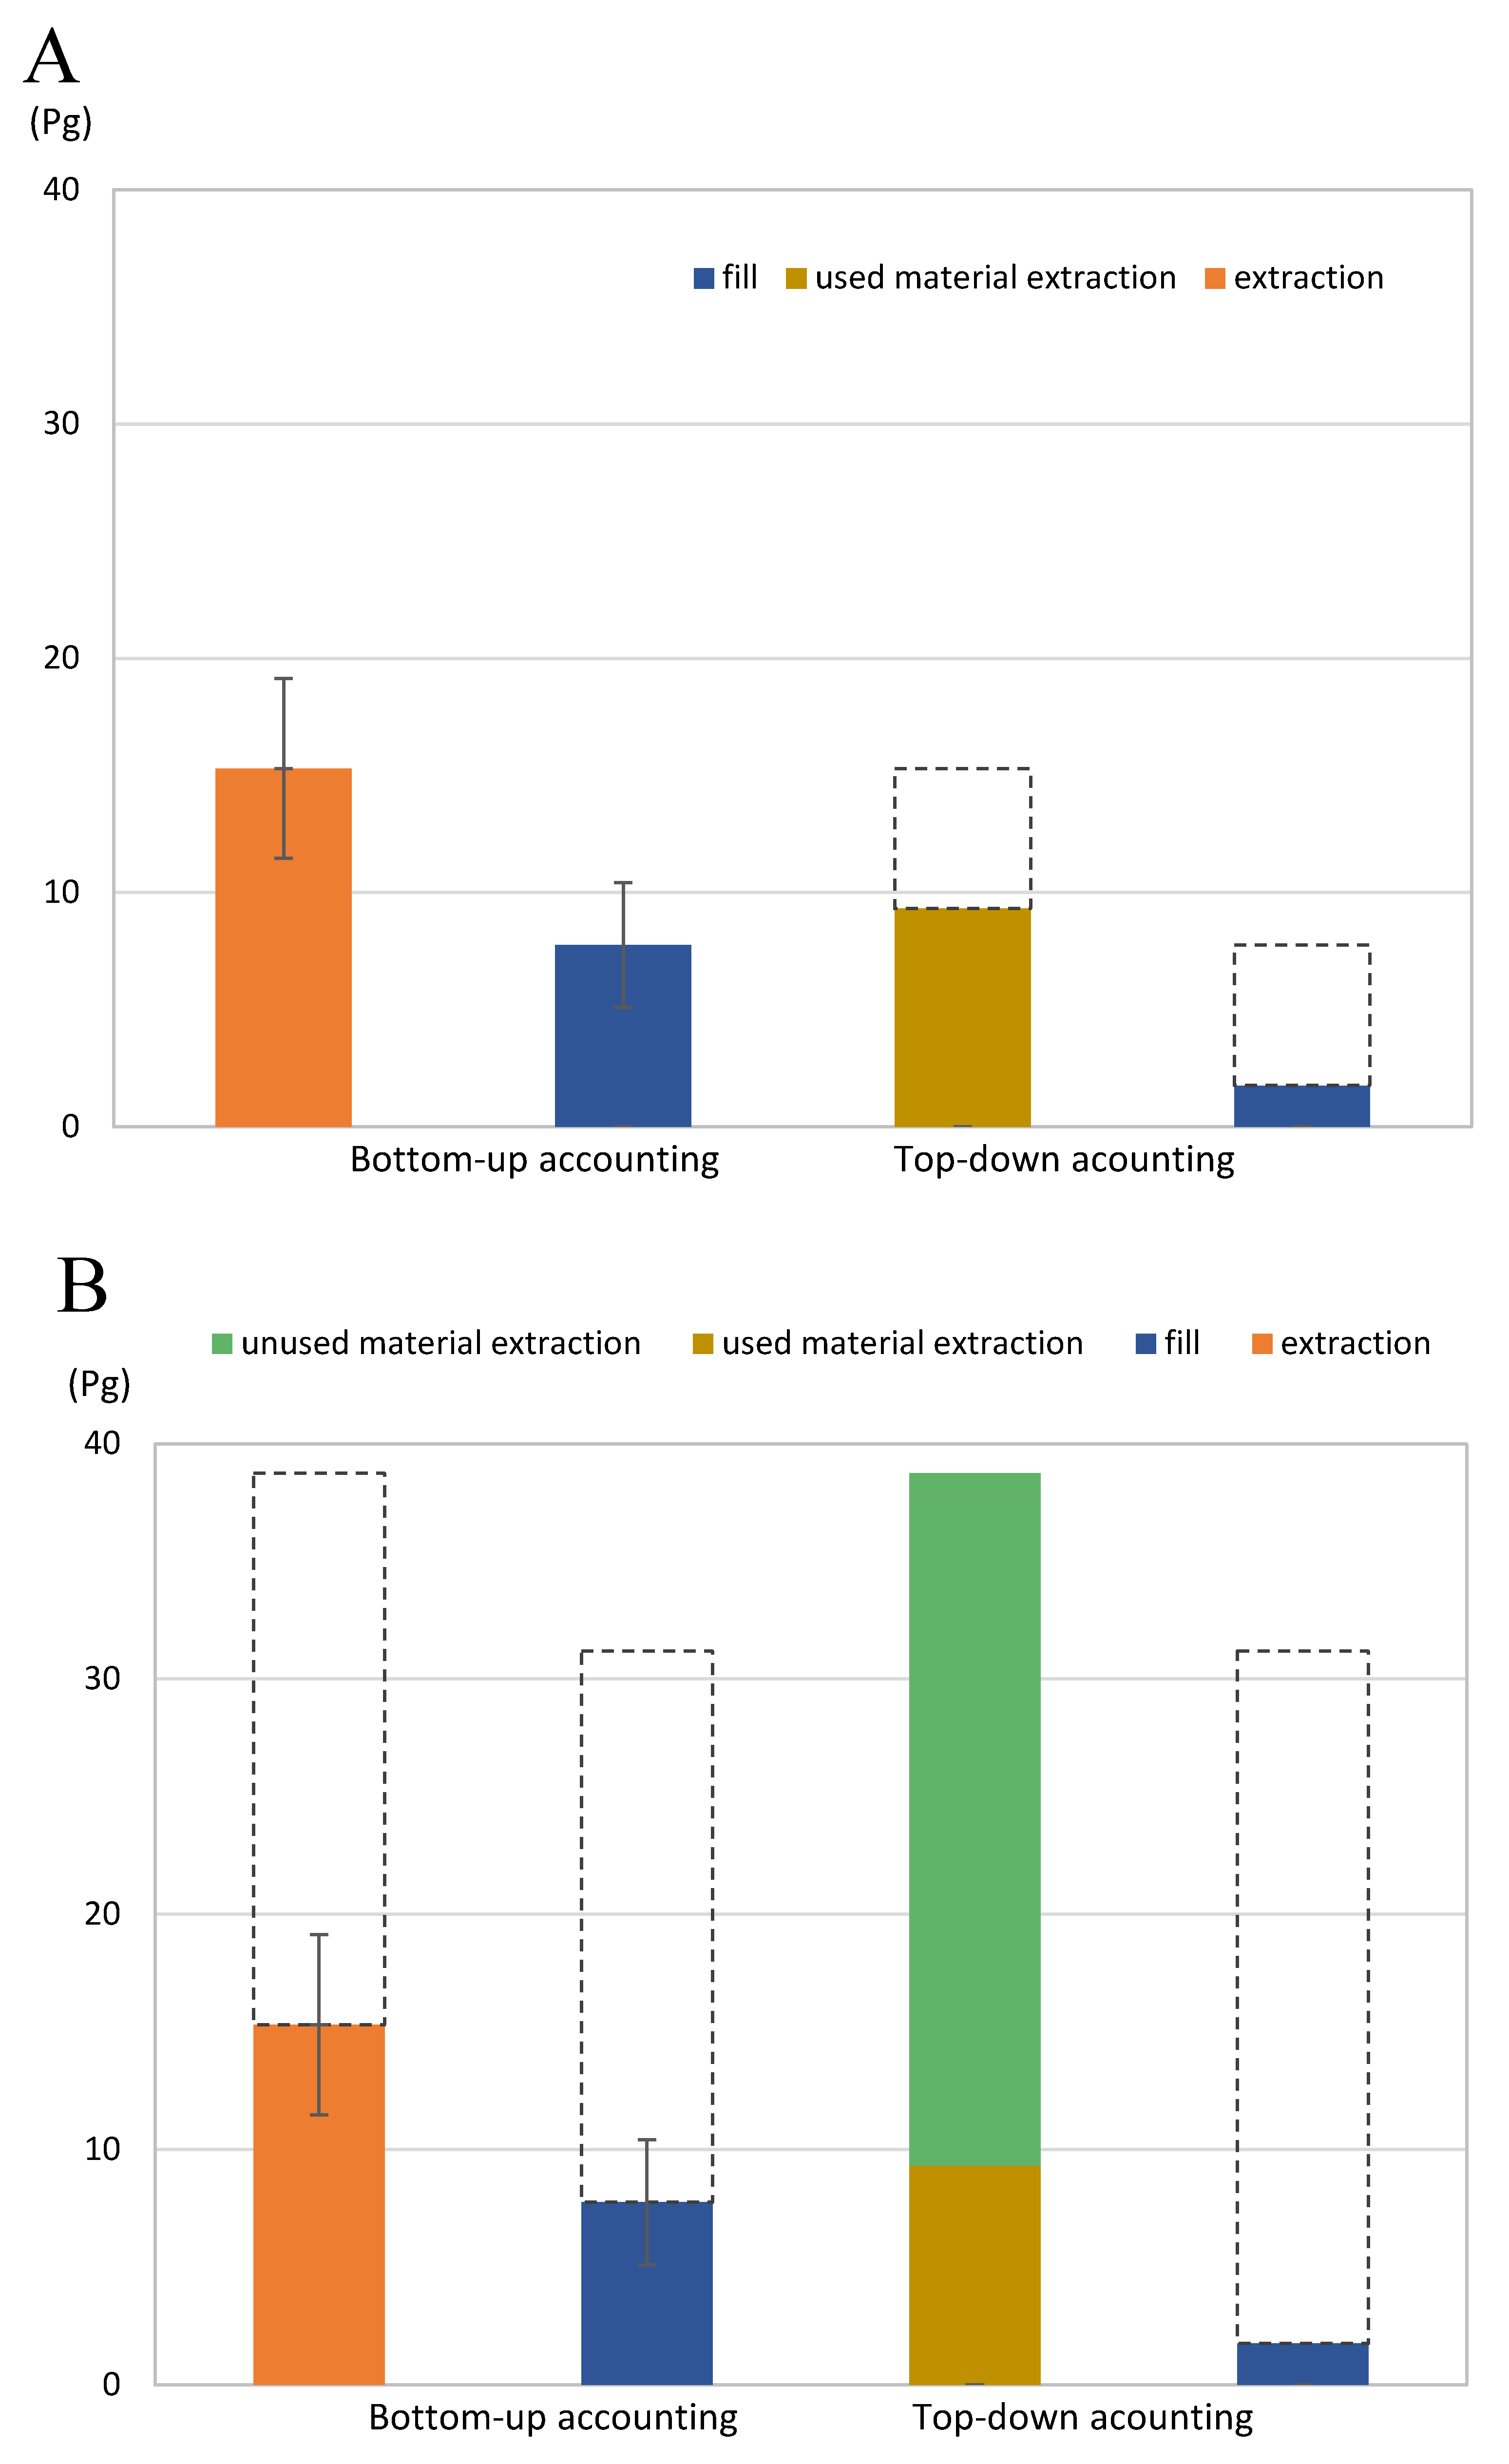
3.4. Top-Down and Bottom-Up Result Comparison

In this study, we employed two different and complementing methodologies, namely bottom-up and top-down accounting, to analyze material flows relative to mining activities, overburden, and landfill between 2000 and 2010 in Germany.
The cumulative result of the bottom-up method, which is based on a DEM, accounted for 15.3 Pg of extracted minerals and 7.8 Pg of landfilled materials. Conversely, the top-down method, which is based on statistical reports, reported an extraction of 29.4 Pg and landfill activities for 1.8 Pg (Figure 6).

4. Discussion

4.1. Estimation of Overburden by Comparing Results of Top-Down and Bottom-Up Methods

The gap between the bottom-up and top-down accounting for extraction, 15.3 Pg and 29.4 Pg respectively, is 14.1 Pg (cf., Figure 6). To estimate the amount of unused extraction for the bottom-up method, we can subtract from 15.3 Pg the amount of reported used extraction from the top-down method (9.3 Pg), which results in 6.0 Pg (Figure 7A).
This method of estimation of unused materials has been already been tested for the case of Japan [51]. As proved by the mining and landfilling activity distribution displayed in Figure 5, there are many instances where these two kinds of sites are adjacent to each other. This is done, in most cases, to have a convenient place to treat and dispose mining overburden. Therefore, the difference of 6.0 Pg in landfilling activities could be assumed being the material overburden coming from mines. This assumption is confirmed by being practically equivalent to the difference between extracted and used materials as discussed earlier.
Conversely, according to the top-down accounting, 20.1 Pg of unused material were extracted between 2000 and 2010, while our estimation of overburden from the bottom-up method is 6.0 Pg. Which number represent the German domestic overburden correctly?
This difference between the two methodologies has three possible explanations but, as we will see later, one is the predominant (Figure 7B). Firstly, the use of the land cover dataset, CORINE and non-forest map. The thematic accuracy of the CORINE dataset is approximately 85%, which could potentially be missing several mining and landfill sites. Since the ASTER GDEM includes the elevation of trees on the ground surface, we used non-forest map to exclude the forest area. This could underestimate the material extraction and fill in case a landfilled area was covered with trees. Secondly, the vertical accuracy of the DEMs can easily influence the results of the bottom-up accounting. The overall vertical accuracy shows RMS (route mean square) error of 9.34 m and 4.01 m for ASTER GDEM and SRTM, estimated by using GPS benchmarks [49]. The error bars of the results of bottom-up accounting show their estimates of volumetric change, 3.9 Pg and 2.7 Pg for material extraction and fill (Figure 7). However, despite these two limitations, it is difficult to justify the absence of 14.1 Pg. This is especially true as two different studies, conducted by Sugimoto et al. [64] and Yoshida et al. [51], confirmed that the methodological accuracy of the volume calculated through DEMs does not exceed 17%.
The third, and most likely cause for this difference, is to be ascribed to the temporal gap between the DEMs. SRTM and ASTER GDEM are recorded only in 2000 and 2010. Mining and landfilling activities happening within this temporal gap are thus not recorded and missing from our estimation. Moreover, the official German statistics does not consider unused extraction as part of the landfilling activities. This is a technical problem caused by the recording lag rather than an intrinsic limitation of the methodology, as if the frequency of the records would be much higher (e.g., 6 months), it would be possible to achieve much more robust results.

4.2. Geographical Changes of the German Landscape

Comparing the anthropogenic disturbance caused by mining activities in two industrialized countries, namely Germany and Japan, we find some similarities and differences. Based on the bottom-up accounting, in Japan between 1987 and 2005 the total area and volume of mining is 170 × 106 m2 and 5.8 × 10⁹ m3 from 1987 to 2005 [51], while the German total area and volume of mining is 570 × 106 m2 and 4.8 × 10⁹ m3 from 2000 to 2010. The volume per area (m3/m2) of Japanese and German mining is thus 34 m3/m2 and 8.5 m3/m2, respectively. More than 70% of the Japanese land is covered by mountain and hillocks, and 60% of all mining sites are located in mountainous areas [30]. If Japan were to rely on large open pit mines, it would be necessary to fell forests and move large amount of overburden in steep areas. For this reason, in Japan it is much more common than in Germany to encounter underground mines. In the case of the large-scale mining activities of non-metallic minerals used for construction, the typical ratio encountered in Japan for mined volume per unit of area is 57–61 m3/m2 [64,65].
The German mining sector has always played a major role in the German economy, and the gross electricity generation in Germany in 2016 accounted for 40% by coal-fired power plants [66]. Coal is extracted in open pit mines that are wide and shallow, as confirmed by the mining volume per unit of area (8.45 m3/m2), and many environmental and social impacts are related to the huge demand of coal in Germany, while mining and landfilling activities find fierce opposition in local communities [67,68,69]. The consistent amount of materials transferred to and from mining and landfilling sites causes large-scale anthropogenic disturbance to the natural ecosystem, local communities, and alter the natural topography. It should also be considered that environmental impacts are not limited to the amount of materials which enter the economy, but also to the large amount of overburden caused by mines [18,24,27].
Larger overburden has typically been accused of negatively influencing the natural environment, on the other hand the impact of lakes in former open-pit mines and backfilled mines on the landscape is unique to the Anthropocene [70]. Backfilled materials have been contributing to land reclamation, redevelopment for economic purposes, and restoration of the natural environment [71]. Additionally, some exhausted open pit mines located in flat land became semi-artificial lakes which are now supporting the local aquatic ecosystem and environment [72]. The analysis of geographical changes can contribute to reduce land use conflict by landfilling of waste materials, tailing, and waste rock that generate environmental impact [67], assesses the stress on the local ecosystem, and not only makes a comparison of different countries in a common framework, but also gives us insightful information that contributes to the sustainable management of mining and landfilling sites.

5. Conclusions

The transfer of materials between the ecosphere and the socio-economic sphere is increasing more rapidly than ever, and the dynamics of material flows and stocks in the anthroposphere have been explored by many researchers. Nonetheless, the MFA research regarding the environmental impacts of upstream and downstream flows with spatially explicit information is limited, especially in countries with poor statistics.
We employed a methodology that uses DEMs and land cover data to geographically analyze the extraction and landfill materials in mining and landfill sites, using Germany as a case study.
A special feature of this methodology is that it permits tracing material flows from cradle to grave. That allows for the estimation of the overburden, a flow that goes mostly unrecorded but is on the same order of magnitude, or even greater, than the amount of materials that are recorded as mined. Research on the anthropogenic disturbance with geographical analysis can be divided into two parts, locating the target areas and measuring geographical changes. In this study, we utilized four types of independent data, CORINE and non-forest map for locating mining and landfilling sites, SRTM and ASTER GDEM for estimating the mass and volume of materials which have been excavated and landfilled. This allowed for the discovery of the dynamics of anthropogenic disturbance and its relevance to material flows of Germany between 2000 and 2010. The total area and mass of mining activities is 570 km2 and 15.3 Pg, while the total area and mass of landfilling activities is 390 km2 and 7.8 Pg. We also discussed overburden, which is typically disregarded from mining reports because of its lack of economic value. Overburden can cause serious adverse effects on the environment, however, if properly managed, it can be actually useful for land restoration. The mass of backfilled overburden accounted between 6.0 Pg and 20.1 Pg, depending on the methodology that was adopted. Understanding the dynamics of anthropogenic disturbance and its relevance to the upstream and downstream of material flows can provide useful information for delivering sustainable mining policies as well as for the management of resource extraction and waste.

Author Contributions

Conceptualization, K.Y. and H.T.; methodology, K.Y.; software, K.Y.; validation, K.Y.; formal analysis, K.Y. and A.M.; investigation, K.Y. and L.S.; resources, H.T., K.O. and L.S.; data curation, K.Y. and A.M.; writing—original draft preparation, K.Y.; writing—review and editing, A.M.; visualization, K.Y.; supervision, H.T. and L.S.; project administration, H.T. and L.S.; funding acquisition, H.T. and K.O.

Funding

This research was financially supported by the Environment Research and Technology Development Fund (2-1711) of the Ministry of the Environment, Japan and Grants-in-Aid for Scientific Research B (26281056), Research Fellow of JSPS, Japan.

Conflicts of Interest

The authors declare no conflict of interest.

References

  1. Krausmann, F.; Wiedenhofer, D.; Lauk, C.; Haas, W.; Tanikawa, H.; Fishman, T.; Miatto, A.; Schandl, H.; Haberl, H. Global socioeconomic material stocks rise 23-fold over the 20th century and require half of annual resource use. Proc. Natl. Acad. Sci. USA 2017, 114, 1880–1885. [Google Scholar] [CrossRef] [PubMed] [Green Version]
  2. Schandl, H.; Fischer-Kowalski, M.; West, J.; Giljum, S.; Dittrich, M.; Eisenmenger, N.; Geschke, A.; Lieber, M.; Wieland, H.; Schaffartzik, A.; et al. Global Material Flows and Resource Productivity: Forty Years of Evidence. J. Ind. Ecol. 2018, 22, 827–838. [Google Scholar] [CrossRef]
  3. Schandl, H.; Miatto, A. On the importance of linking inputs and outputs in material flow accounts. The Weight of Nations report revisited. J. Clean. Prod. 2018, 204, 334–343. [Google Scholar] [CrossRef]
  4. Miatto, A.; Schandl, H.; Fishman, T.; Tanikawa, H. Global Patterns and Trends for Non-Metallic Minerals used for Construction. J. Ind. Ecol. 2017, 21, 924–937. [Google Scholar] [CrossRef]
  5. Tanikawa, H.; Fishman, T.; Okuoka, K.; Sugimoto, K. The Weight of Society over Time and Space: A Comprehensive Account of the Construction Material Stock of Japan, 1945–2010. J. Ind. Ecol. 2015, 19, 778–791. [Google Scholar] [CrossRef]
  6. Wiedenhofer, D.; Steinberger, J.K.; Eisenmenger, N.; Haas, W. Maintenance and Expansion: Modeling Material Stocks and Flows for Residential Buildings and Transportation Networks in the EU25. J. Ind. Ecol. 2015, 19, 538–551. [Google Scholar] [CrossRef] [Green Version]
  7. Wiedmann, T.O.; Schandl, H.; Lenzen, M.; Moran, D.; Suh, S.; West, J.; Kanemoto, K. The material footprint of nations. Proc. Natl. Acad. Sci. USA 2015, 112, 6271–6276. [Google Scholar] [CrossRef]
  8. Martinico-Perez, M.F.G.; Schandl, H.; Fishman, T.; Tanikawa, H. The Socio-Economic Metabolism of an Emerging Economy: Monitoring Progress of Decoupling of Economic Growth and Environmental Pressures in the Philippines. Ecol. Econ. 2018, 147, 155–166. [Google Scholar] [CrossRef]
  9. Adriaanse, A.; Bringezu, S.; Hammond, A.; Moriguchi, Y.; Rodenburg, E.; Rogich, D.; Schütz, H. Resource Flows: The Material Basis of Industrial Economies; World Resources Institute: Washington, DC, USA, 1997; ISBN 1-56973-209-4. [Google Scholar]
  10. Fischer-Kowalski, M.; Krausmann, F.; Giljum, S.; Lutter, S.; Mayer, A.; Bringezu, S.; Moriguchi, Y.; Schütz, H.; Schandl, H.; Weisz, H. Methodology and Indicators of Economy-wide Material Flow Accounting. J. Ind. Ecol. 2011, 15, 855–876. [Google Scholar] [CrossRef]
  11. Matthews, E.; Amann, C.; Bringezu, S.; Fischer-Kowalski, M.; Hüttler, W.; Kleijn, R.; Moriguchi, Y.; Ottke, C.; Rodenburg, E.; Rogich, D. The Weight of Nations: Material Outflows from Industrial Economies; Hutter, C., Ed.; World Resources Institute: Washington, DC, USA, 2000. [Google Scholar]
  12. Fishman, T.; Schandl, H.; Tanikawa, H.; Walker, P.; Krausmann, F. Accounting for the Material Stock of Nations. J. Ind. Ecol. 2014, 18, 407–420. [Google Scholar] [CrossRef] [Green Version]
  13. Müller, D.B. Stock dynamics for forecasting material flows—Case study for housing in The Netherlands. Ecol. Econ. 2006, 59, 142–156. [Google Scholar] [CrossRef]
  14. Krausmann, F.; Gaugl, B.; West, J.; Schandl, H. The metabolic transition of a planned economy: Material flows in the USSR and the Russian Federation 1900 to 2010. Ecol. Econ. 2016, 124, 76–85. [Google Scholar] [CrossRef]
  15. Fishman, T.; Schandl, H.; Tanikawa, H. Stochastic Analysis and Forecasts of the Patterns of Speed, Acceleration, and Levels of Material Stock Accumulation in Society. Environ. Sci. Technol. 2016, 50, 3729–3737. [Google Scholar] [CrossRef]
  16. Ortlepp, R.; Gruhler, K.; Schiller, G. Material stocks in Germany’s non-domestic buildings: A new quantification method. Build. Res. Inf. 2016, 44, 840–862. [Google Scholar] [CrossRef]
  17. Schandl, H.; Schulz, N. Changes in the United Kingdom’s natural relations in terms of society’s metabolism and land-use from 1850 to the present day. Ecol. Econ. 2002, 41, 203–221. [Google Scholar] [CrossRef]
  18. Bringezu, S.; Schütz, H.; Steger, S.; Baudisch, J. International comparison of resource use and its relation to economic growth: The development of total material requirement, direct material inputs and hidden flows and the structure of TMR. Ecol. Econ. 2004, 51, 97–124. [Google Scholar] [CrossRef]
  19. Kennedy, C.; Cuddihy, J.; Engel-Yan, J. The Changing Metabolism of Cities. J. Ind. Ecol. 2007, 11, 43–59. [Google Scholar] [CrossRef]
  20. Cao, Z.; Liu, G.; Duan, H.; Xi, F.; Liu, G.; Yang, W. Unravelling the mystery of Chinese building lifetime: A calibration and verification based on dynamic material flow analysis. Appl. Energy 2019, 238, 442–452. [Google Scholar] [CrossRef]
  21. Miatto, A.; Schandl, H.; Tanikawa, H. How important are realistic building lifespan assumptions for material stock and demolition waste accounts? Resour. Conserv. Recycl. 2017, 122, 143–154. [Google Scholar] [CrossRef]
  22. Aksözen, M.; Hassler, U.; Kohler, N. Reconstitution of the dynamics of an urban building stock. Build. Res. Inf. 2017, 45, 239–258. [Google Scholar] [CrossRef]
  23. Douglas, I.; Lawson, N. The Human Dimensions of Geomorphological Work in Britain. J. Ind. Ecol. 2000, 4, 9–33. [Google Scholar] [CrossRef]
  24. Hashimoto, S.; Tanikawa, H.; Moriguchi, Y. Where will large amounts of materials accumulated within the economy go?—A material flow analysis of construction minerals for Japan. Waste Manag. 2007, 27, 1725–1738. [Google Scholar] [CrossRef]
  25. Kohler, N.; Hassler, U. The building stock as a research object. Build. Res. Inf. 2002, 30, 226–236. [Google Scholar] [CrossRef] [Green Version]
  26. Hashimoto, S.; Moriguchi, Y. Proposal of six indicators of material cycles for describing society’s metabolism: From the viewpoint of material flow analysis. Resour. Conserv. Recycl. 2004, 40, 185–200. [Google Scholar] [CrossRef]
  27. Ross, M.R.V.; McGlynn, B.L.; Bernhardt, E.S. Deep Impact: Effects of Mountaintop Mining on Surface Topography, Bedrock Structure, and Downstream Waters. Environ. Sci. Technol. 2016, 50, 2064–2074. [Google Scholar] [CrossRef] [Green Version]
  28. Tanikawa, H.; Imura, H. Quantification and evaluation of total material requirement related to the urban construction: Case study for residential development. Proc. Jpn. Soc. Civ. Eng. 2001, 2001, 35–48. [Google Scholar] [CrossRef]
  29. Eurostat. Economy-Wide Material Flow Accounts Handbook; Publications Office of the European Union: Luxemburg, 2018. [Google Scholar]
  30. Yoshida, K.; Fishman, T.; Okuoka, K.; Tanikawa, H. Material stock’s overburden: Automatic spatial detection and estimation of domestic extraction and hidden material flows. Resour. Conserv. Recycl. 2017, 123, 165–175. [Google Scholar] [CrossRef]
  31. European Environment Agency. Developments in Indicators: Total Material Requirement (TMR). Available online: https://www.eea.europa.eu/publications/signals-2000/page017.html (accessed on 29 April 2019).
  32. Bringezu, S.; Schütz, H. Total Material Requirement of the European Union; European Environment Agency: Copenhagen, Denmark, 2001. [Google Scholar]
  33. Baltensweiler, A.; Walthert, L.; Ginzler, C.; Sutter, F.; Purves, R.S.; Hanewinkel, M. Terrestrial laser scanning improves digital elevation models and topsoil pH modelling in regions with complex topography and dense vegetation. Environ. Model. Softw. 2017, 95, 13–21. [Google Scholar] [CrossRef]
  34. Rueda, A.; Noguera, J.M.; Martínez-Cruz, C. A flooding algorithm for extracting drainage networks from unprocessed digital elevation models. Comput. Geosci. 2013, 59, 116–123. [Google Scholar] [CrossRef]
  35. Reddy, G.P.O.; Kumar, N.; Sahu, N.; Singh, S.K. Evaluation of automatic drainage extraction thresholds using ASTER GDEM and Cartosat-1 DEM: A case study from basaltic terrain of Central India. Egypt. J. Remote Sens. Space Sci. 2018, 21, 95–104. [Google Scholar] [CrossRef]
  36. Wilkes, P.; Lau, A.; Disney, M.; Calders, K.; Burt, A.; Gonzalez de Tanago, J.; Bartholomeus, H.; Brede, B.; Herold, M. Data acquisition considerations for Terrestrial Laser Scanning of forest plots. Remote Sens. Environ. 2017, 196, 140–153. [Google Scholar] [CrossRef]
  37. Yadav, B.; Hatfield, K. Stream network conflation with topographic DEMs. Environ. Model. Softw. 2018, 102, 241–249. [Google Scholar] [CrossRef]
  38. Saunders, W. Preparation of DEMs for use in environmental modeling analysis. In Proceedings of the ESRI User Conference, Austin, TX, USA, 1 January 2000; pp. 24–30. [Google Scholar]
  39. Pandey, A.; Himanshu, S.K.; Mishra, S.K.; Singh, V.P. Physically based soil erosion and sediment yield models revisited. CATENA 2016, 147, 595–620. [Google Scholar] [CrossRef]
  40. Ruiz-Arias, J.A.; Tovar-Pescador, J.; Pozo-Vázquez, D.; Alsamamra, H. A comparative analysis of DEM-based models to estimate the solar radiation in mountainous terrain. Int. J. Geogr. Inf. Sci. 2009, 23, 1049–1076. [Google Scholar] [CrossRef]
  41. Van Niel, K.P.; Laffan, S.W.; Lees, B.G. Effect of error in the DEM on environmental variables for predictive vegetation modelling. J. Veg. Sci. 2004, 15, 747–756. [Google Scholar] [CrossRef]
  42. Borga, M.; Dalla Fontana, G.; Da Ros, D.; Marchi, L. Shallow landslide hazard assessment using a physically based model and digital elevation data. Environ. Geol. 1998, 35, 81–88. [Google Scholar] [CrossRef]
  43. Wu, S.; Li, J.; Huang, G. An evaluation of grid size uncertainty in empirical soil loss modeling with digital elevation models. Environ. Model. Assess. 2005, 10, 33–42. [Google Scholar] [CrossRef]
  44. Chen, H.X.; Zhang, L.M.; Gao, L.; Zhu, H.; Zhang, S. Presenting regional shallow landslide movement on three-dimensional digital terrain. Eng. Geol. 2015, 195, 122–134. [Google Scholar] [CrossRef]
  45. Holmes, K.W.; Chadwick, O.A.; Kyriakidis, P.C. Error in a USGS 30-meter digital elevation model and its impact on terrain modeling. J. Hydrol. 2000, 233, 154–173. [Google Scholar] [CrossRef]
  46. Wechsler, S.P.; Kroll, C.N. Quantifying DEM Uncertainty and its Effect on Topographic Parameters. Photogramm. Eng. Remote Sens. 2006, 72, 1081–1090. [Google Scholar] [CrossRef] [Green Version]
  47. Deng, Y.; Wilson, J.P.; Bauer, B.O. DEM resolution dependencies of terrain attributes across a landscape. Int. J. Geogr. Inf. Sci. 2007, 21, 187–213. [Google Scholar] [CrossRef]
  48. Mukherjee, S.; Joshi, P.K.; Mukherjee, S.; Ghosh, A.; Garg, R.D.; Mukhopadhyay, A. Evaluation of vertical accuracy of open source Digital Elevation Model (DEM). Int. J. Appl. Earth Obs. Geoinf. 2013, 21, 205–217. [Google Scholar] [CrossRef]
  49. Tachikawa, T.; Kaku, M.; Iwasaki, A.; Gesch, D.B.; Oimoen, M.J.; Zhang, Z.; Danielson, J.J.; Krieger, T.; Curtis, B.; Haase, J.; et al. Aster Global Digital Elevation Model. Version 2—Summary of Validation Results; NASA: Washington, DC, USA, 2011; p. 27. [Google Scholar]
  50. Kleemann, F.; Lehner, H.; Szczypińska, A.; Lederer, J.; Fellner, J. Using change detection data to assess amount and composition of demolition waste from buildings in Vienna. Resour. Conserv. Recycl. 2017, 123, 37–46. [Google Scholar] [CrossRef]
  51. Yoshida, K.; Okuoka, K.; Tanikawa, H. Anthropogenic Disturbance by Domestic Extraction of Construction Minerals in Japan. J. Ind. Ecol. 2018, 22, 145–154. [Google Scholar] [CrossRef]
  52. Schebek, L.; Schnitzer, B.; Blesinger, D.; Köhn, A.; Miekley, B.; Linke, H.J.; Lohmann, A.; Motzko, C.; Seemann, A. Material stocks of the non-residential building sector: The case of the Rhine-Main area. Resour. Conserv. Recycl. 2017, 123, 24–36. [Google Scholar] [CrossRef]
  53. Schiller, G.; Gruhler, K.; Ortlepp, R. Quantification of anthropogenic metabolism using spatially differentiated continuous MFA. Chang. Adapt. Socio Ecol. Syst. 2017, 3, 119. [Google Scholar] [CrossRef]
  54. Schiller, G.; Müller, F.; Ortlepp, R. Mapping the anthropogenic stock in Germany: Metabolic evidence for a circular economy. Resour. Conserv. Recycl. 2017, 123, 93–107. [Google Scholar] [CrossRef]
  55. UN Environment International Resource Panel. Global Material Flows Database. Available online: http://www.resourcepanel.org/global-material-flows-database (accessed on 22 April 2019).
  56. Federal Environmental Agency. Environmental Waste Management Record. Available online: https://www.umweltbundesamt.de/daten/ressourcen-abfall/abfallaufkommen#textpart-8 (accessed on 27 April 2019).
  57. Germany Federal Statistical Office. Waste and Recycling Management Record. Available online: https://www.destatis.de/GPStatistik/receive/DESerie_serie_00000202 (accessed on 18 March 2019).
  58. United States Geological Survey. Earth Explorer. Available online: https://earthexplorer.usgs.gov/ (accessed on 15 March 2019).
  59. Japan Aerospace Exploration Agency. Alos World 3D. Available online: https://www.eorc.jaxa.jp/ALOS/aw3d/index.htm (accessed on 11 April 2019).
  60. Copernicus. CORINE Land Cover. Available online: https://land.copernicus.eu/pan-european/corine-land-cover (accessed on 22 March 2019).
  61. Ministry of Economy, Trade, and Industry (METI) of Japan. Features of Aster Gdem. Available online: https://ssl.jspacesystems.or.jp/ersdac/GDEM/E/2.html (accessed on 19 June 2019).
  62. ESRI. ArcGIS Pro Minus. Available online: https://pro.arcgis.com/en/pro-app/tool-reference/3d-analyst/minus.htm (accessed on 20 June 2019).
  63. Japan Aerospace Exploration Agency. Global PALSAR-2/PALSAR/JERS-1 Mosaic and Forest/Non-Forest Map. Available online: https://www.eorc.jaxa.jp/ALOS/en/palsar_fnf/fnf_index.htm (accessed on 28 February 2019).
  64. Sugimoto, K.; Kuroiwa, K.; Okuoka, K.; Tanikawa, H. Anthropogenic disturbance estimation based on surface elevation change using DEM. Environ. Sci. 2015, 28, 153–161. [Google Scholar]
  65. Kawahara, K.; Tanaka, Y. Quantitative estimation of artificially changed landform in Mt. Buko. Proceedings of the General Meeting of the Association of Japanese Geographers. J. STAGE 2010. [Google Scholar] [CrossRef]
  66. Federal Ministry for Economic Affairs and Energy of Germany. Annual Economic Report 2018. Available online: https://www.bmwi.de/Redaktion/DE/Publikationen/Wirtschaft/jahreswirtschaftsbericht-2018.html (accessed on 18 March 2019).
  67. Augiseau, V.; Barles, S. Studying construction materials flows and stock: A review. Resour. Conserv. Recycl. 2017, 123, 153–164. [Google Scholar] [CrossRef]
  68. Burlakovs, J.; Kriipsalu, M.; Klavins, M.; Bhatnagar, A.; Vincevica-Gaile, Z.; Stenis, J.; Jani, Y.; Mykhaylenko, V.; Denafas, G.; Turkadze, T.; et al. Paradigms on landfill mining: From dump site scavenging to ecosystem services revitalization. Resour. Conserv. Recycl. 2017, 123, 73–84. [Google Scholar] [CrossRef] [Green Version]
  69. Di Noi, C.; Ciroth, A. Environmental and Social Pressures in Mining. Results from a Sustainability Hotspots Screening. Resources 2018, 7, 80. [Google Scholar] [CrossRef]
  70. Blanchette, M.L.; Lund, M.A. Pit lakes are a global legacy of mining: An integrated approach to achieving sustainable ecosystems and value for communities. Curr. Opin. Environ. Sustain. 2016, 23, 28–34. [Google Scholar] [CrossRef]
  71. European Environment Agency. Land Recycling in Europe. Approaches to Measuring Extent and Impacts; European Environment Agency: Copenhagen, Denmark, 2016; p. 51. [Google Scholar]
  72. Wirth, P.; Černič Mali, B.; Fischer, W. Problems and potentials of post-mining regions. In Post-Mining Regions in Central Europe—Problems, Potentials, Possibilities; Oekom Verlag: Munich, Germany, 2012; pp. 14–31. [Google Scholar]
Figure 1. Flow-chart of the bottom-up methodology.
Resources 08 00126 g001
Figure 2. Results of top-down accounting for mining activities in German for years 2000–2010. (A) The trend of used material extraction. (B) The trend of unused material extraction, i.e., overburden.
Resources 08 00126 g002aResources 08 00126 g002b
Figure 3. Results of top-down accounting for waste generation and landfill activities in Germany for the years 2000–2010. (A) Waste material generation. (B) Landfilled material.
Resources 08 00126 g003
Figure 4. Ground image with elevation change by extraction and fill, Lusatia lignite mining district, Brandenburg and Northeastern Saxony.
Resources 08 00126 g004
Figure 5. Distribution of extraction and fill sites.
Resources 08 00126 g005
Figure 6. Comparison of results of bottom-up accounting and top-down accounting.
Resources 08 00126 g006
Figure 7. Comparison of bottom-up accounting and top-down accounting. (A) Estimation of overburden by comparing extraction and used materials. (B) Estimation of backfilled overburden by comparing extraction and used and unused material.
Resources 08 00126 g007
Table 1. Statistical data of used, unused, waste, and landfill materials.
TypeData SourceAgencyTarget PeriodTarget Material
Used materialGlobal Material Flows DatabaseUN Environment International Resource Panel Global Material Flows Database2000–2010Industrial minerals, ores, construction minerals, coal
Unused material
Waste materialEnvironmental Waste Management RecordFederal Statistics Office of Germany (DSTATIS)Municipal waste, mining material, waste from production and trade, construction and demolition waste, waste from treatment plants
Landfilled materialWaste and Recycling ManagementGerman Environmental Agency
Table 2. Dataset of bottom-up method; DEMs and land cover.
TypeDatasetAgencyAcquisition DateResolution (m)DEMs Vertical Accuracy (m)Feature
DEMsSRTMNASA20009010 m11 days STS-99 mission in 2000 produced by NASA
ASTER GDEMNASA, JAXA2010307–14 mJoint operation of NASA and Japan which covers 80% of the earth
LandcoverALOSJAXA200910-World’s first 10 m resolution map of the global forest and non-forest area
CORINEEEA2006100-Combination of several satellite’s data that covers most areas of Europe
Table 3. Total mass of material extraction and fill for Germany for years 2000–2010 (bottom-up methodology).
TypeMass (Pg)Area (Mm2)
Extraction15.3570
Fill7.76390

