
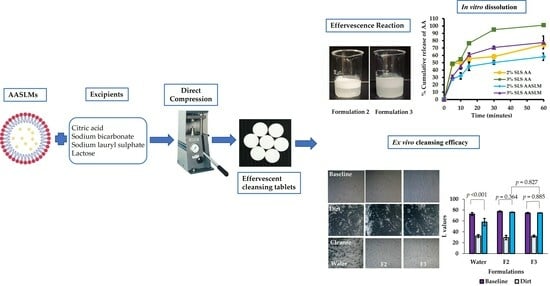
Development of Effervescent Cleansing Tablets Containing Asiatic-Acid-Loaded Solid Lipid Microparticles

 ,
,  , and
, and 
Abstract
:
1. Introduction
2. Materials and Methods
2.1. Materials
2.2. Methods
2.2.1. Preparation of Asiatic-Acid-Loaded Solid Lipid Microparticles (AASLMs)
Morphological Analysis
Determination of Drug Entrapment Efficiency (%EE)
2.2.2. Selection of Effervescent Agents’ Ratio
2.2.3. Study of Powder Blend before Compression
Compatibility Study
Angle of Repose
Bulk Density
Tapped Density
Carr’s Index
Hausners’ Ratio
2.2.4. Production of Effervescent Cleansing Tablets Using Direct Compression Technique
2.2.5. Characterization of Effervescent Tablets
Physical Appearance
Measurement of Diameter and Thickness of Tablets
Measurement of Tablet Hardness
Measurement of Weight Variation of Tablets
Measurement of Tablet Friability
Measurement of Moisture Contents of Tablets
Determination of Effervescence Time of Tablets
Measurement of pH of Tablets
Determination of % Label Amount of Asiatic Acid (AA)
2.2.6. Measurement of In Vitro Dissolution Test
2.2.7. Ex Vivo Cleansing Efficacy Study
Preparation of Ex Vivo Porcine Skin
Preparation of Model Dirt
Preparation of Porcine Skin and Application of Model Dirt
2.2.8. Stability Study
2.2.9. Statistical Analysis
3. Results and Discussion
3.1. Characterization of Solid Lipid Microparticles
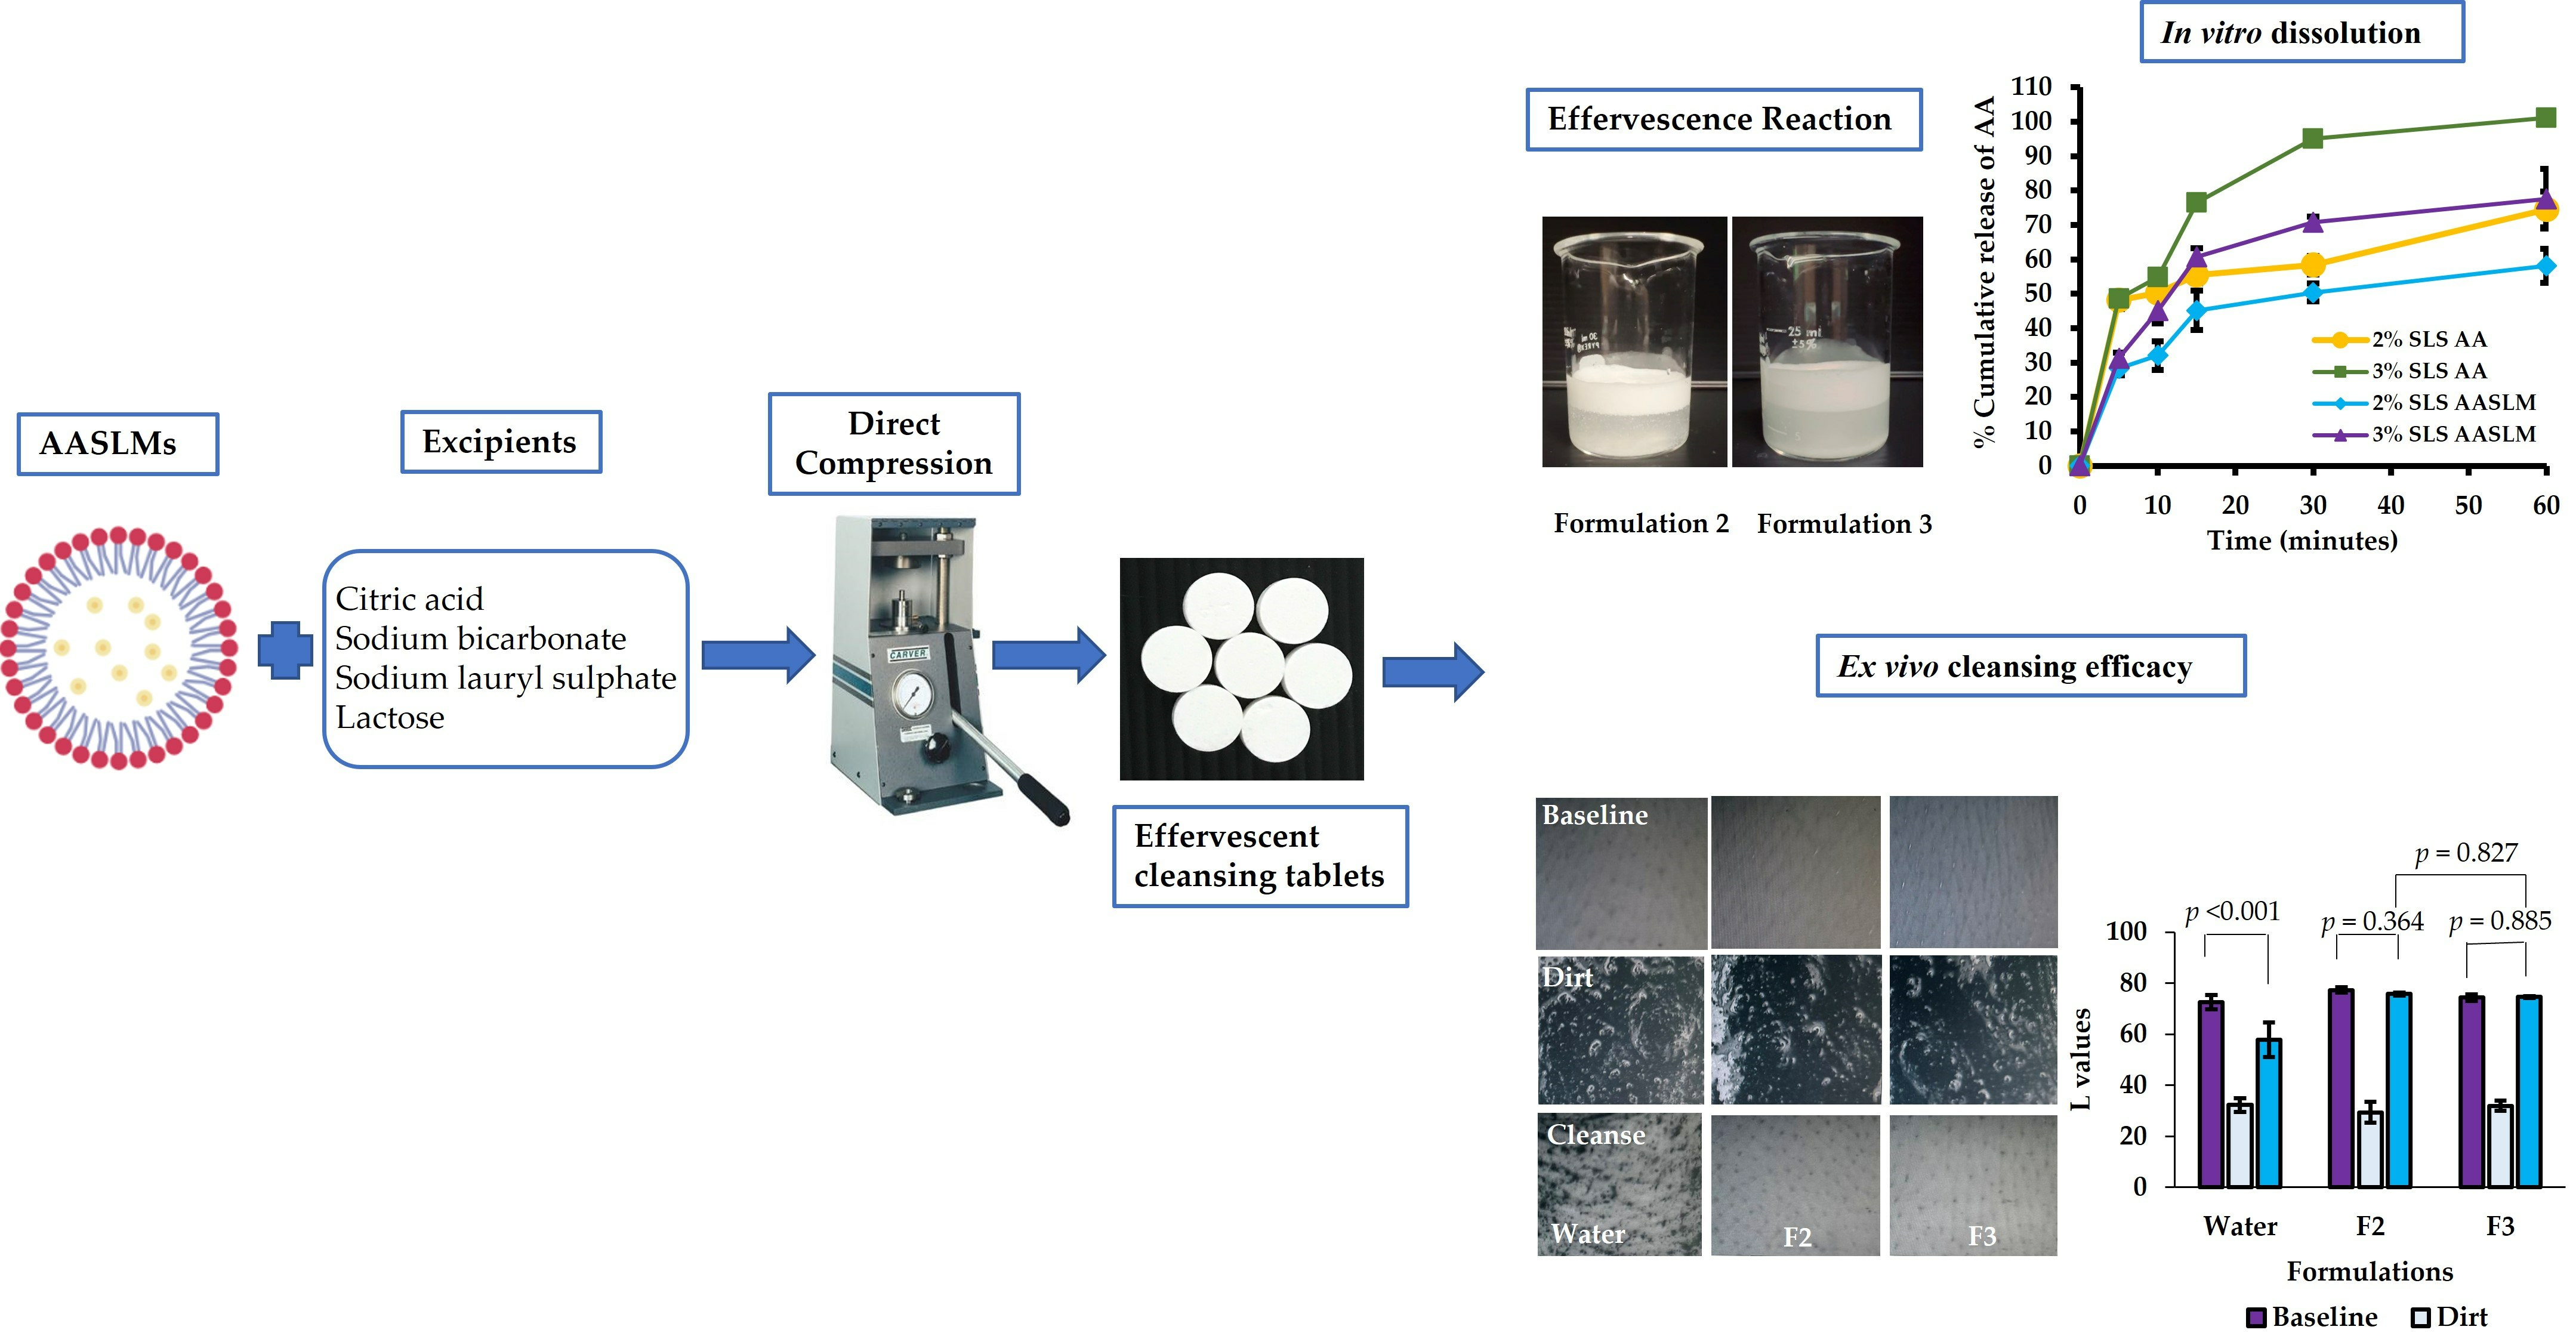
3.1.1. Morphological Analysis
3.1.2. Determination of Drug Entrapment Efficiency (%EE)
3.2. Selection of Acid and Base Ratio
3.3. Precompression Study Results
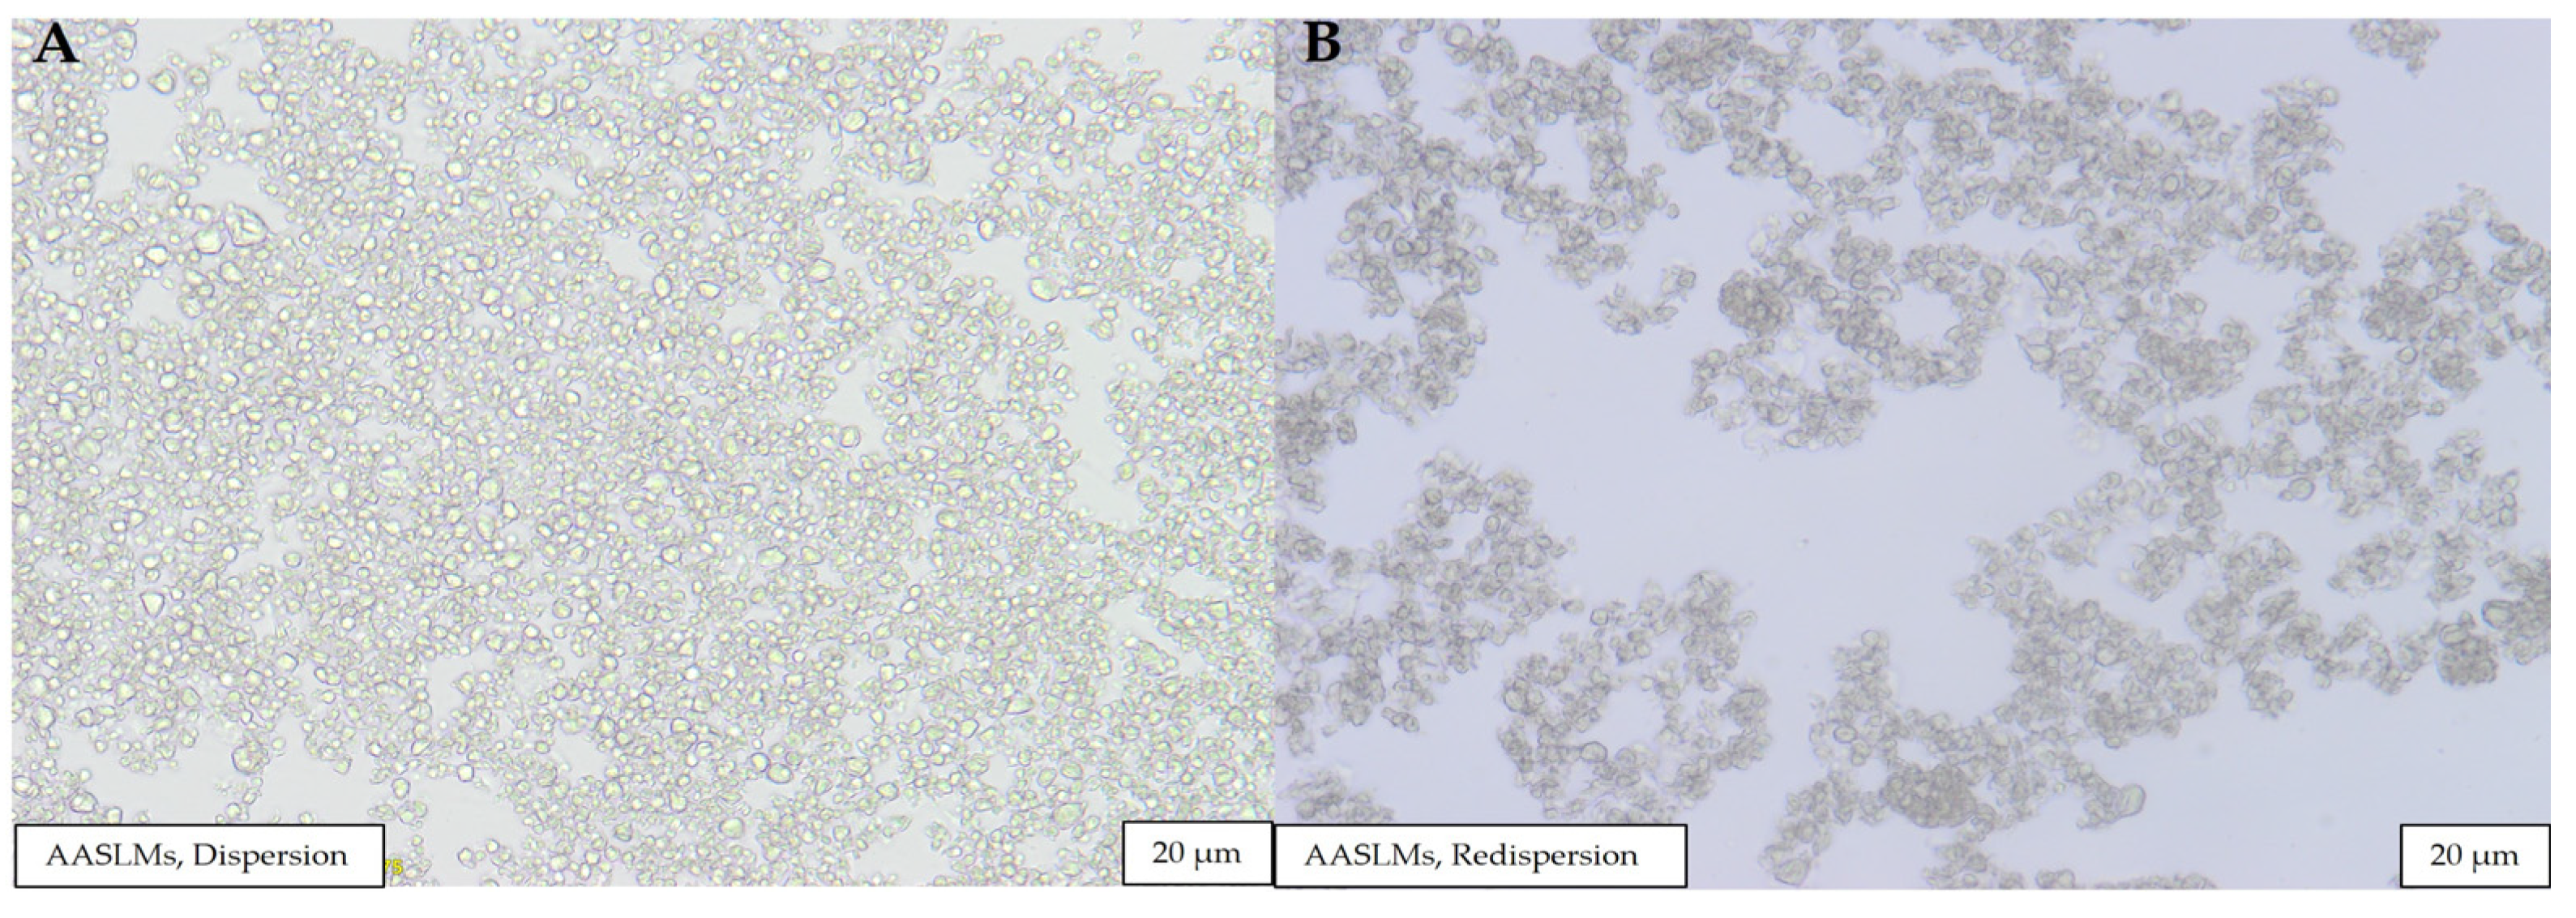
3.3.1. Compatibility of Drug and Excipient according to FTIR
3.3.2. Angle of Repose
3.3.3. Carr’s Index
3.3.4. Hausner’s Ratio
3.3.5. Moisture Content before Compression
3.4. Physicochemical Properties of Effervescent Cleansing Tablets
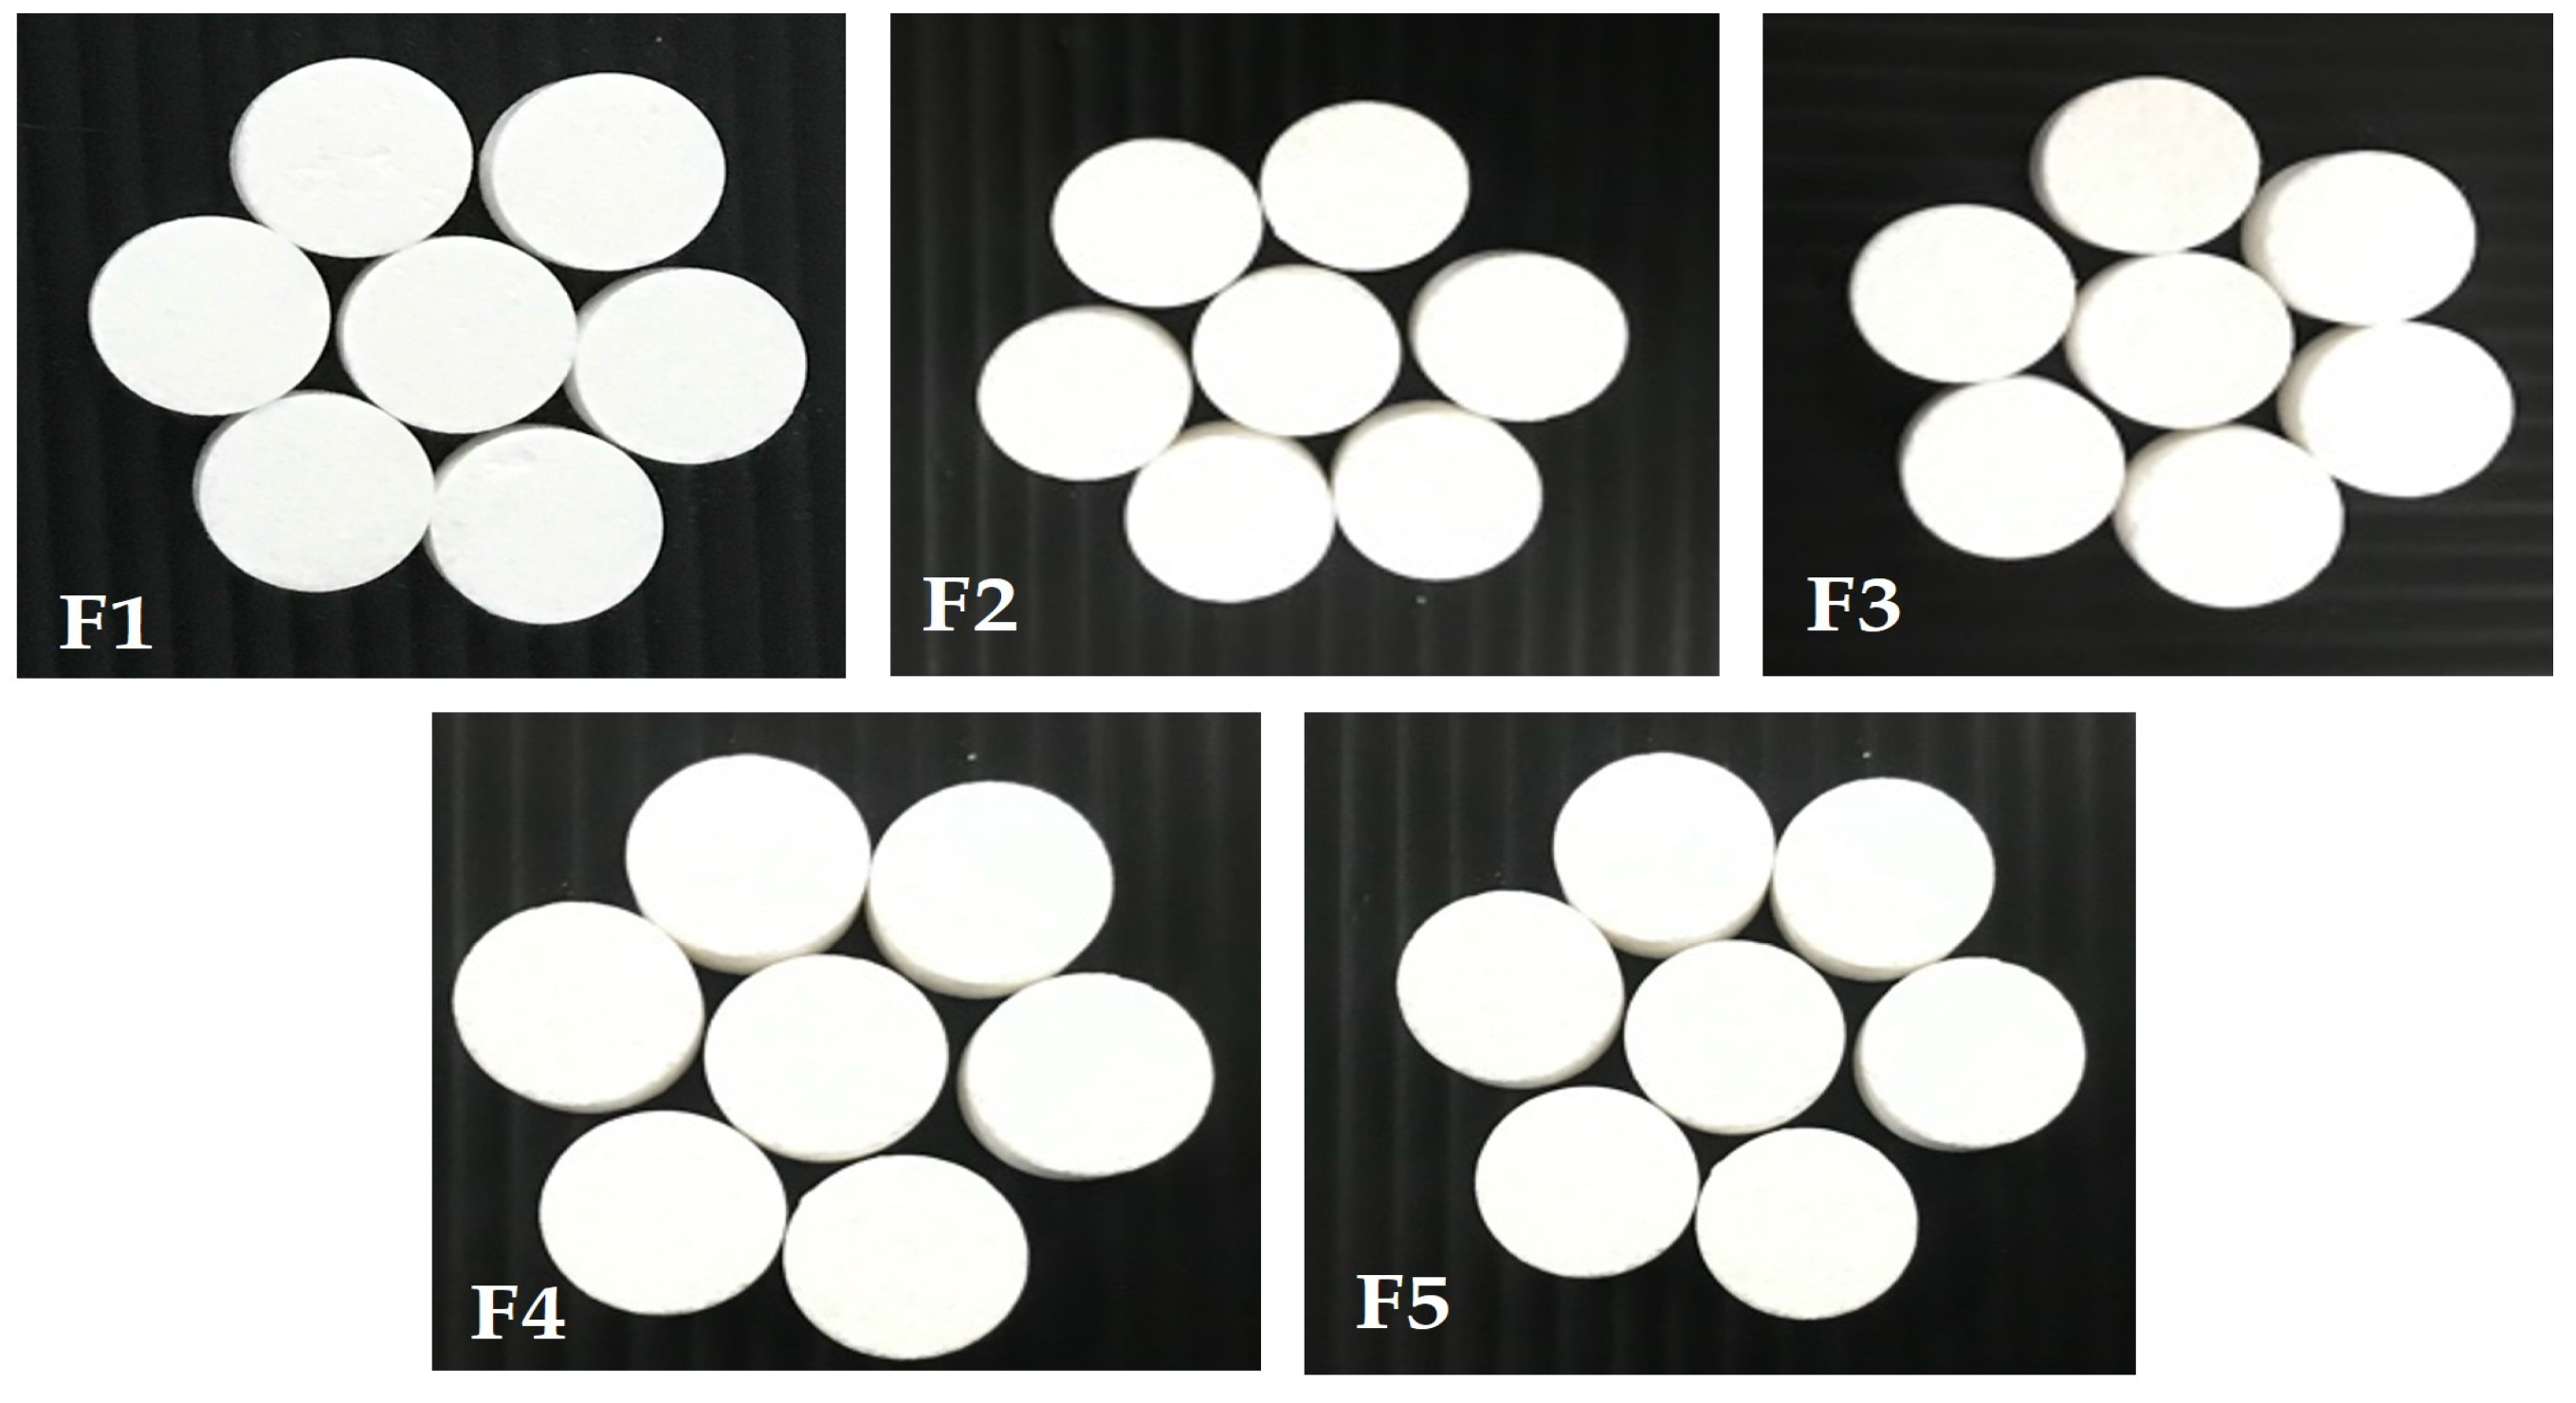
3.4.1. Physical Appearance of Tablets
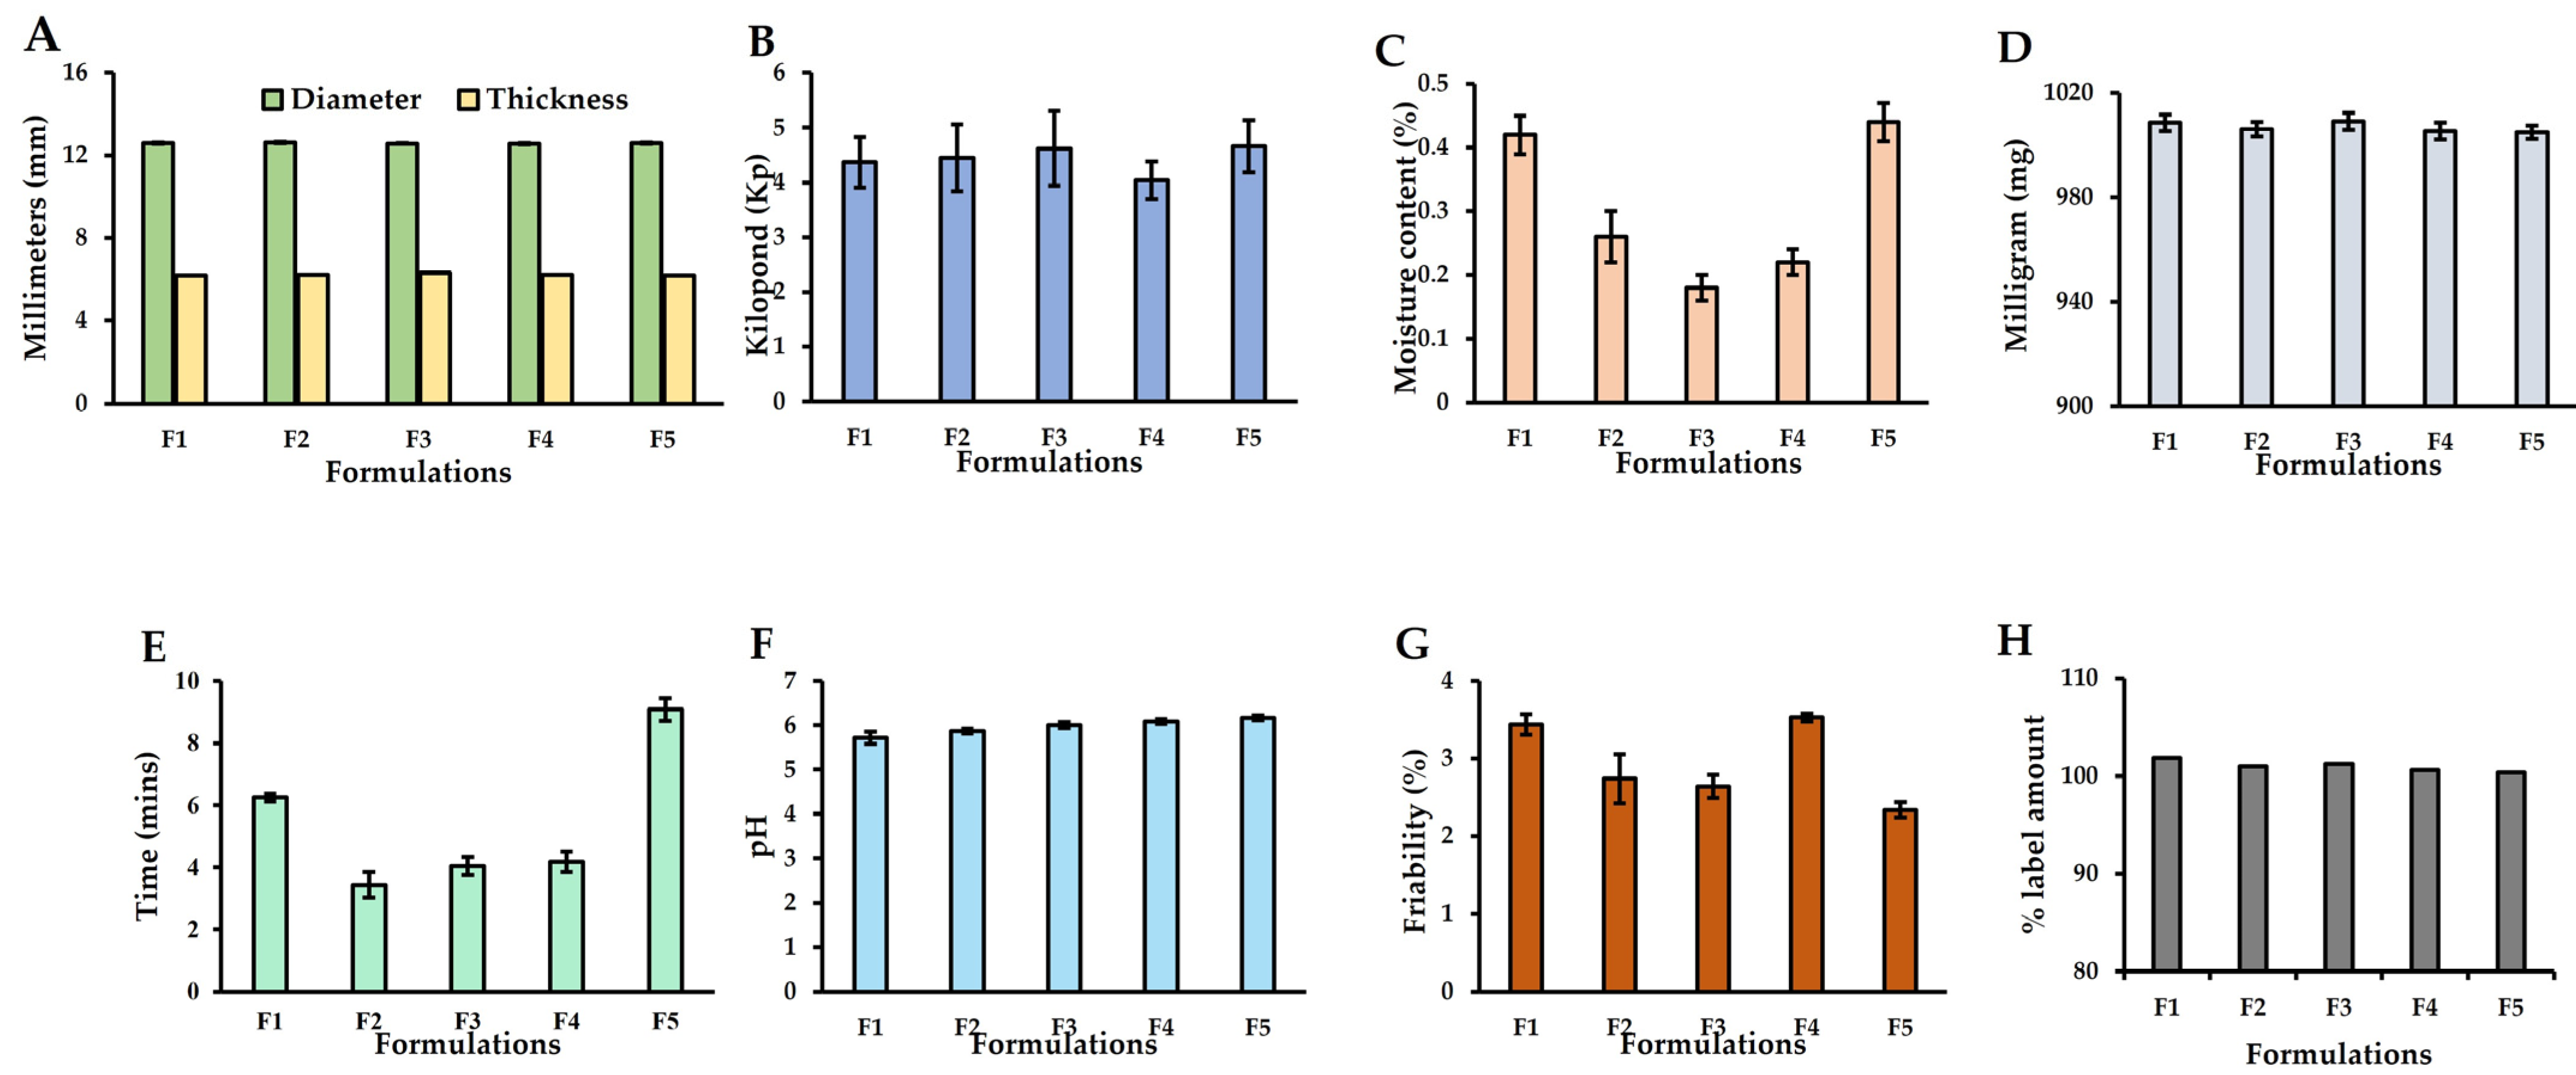
3.4.2. Diameter and Thickness
3.4.3. Hardness of Tablets
3.4.4. Moisture Content of AASLM Tablets
3.4.5. Weight Variation
3.4.6. Effervescence Time
3.4.7. pH Measurement
3.4.8. Friability
3.4.9. % Label Amount of AA according to HPLC
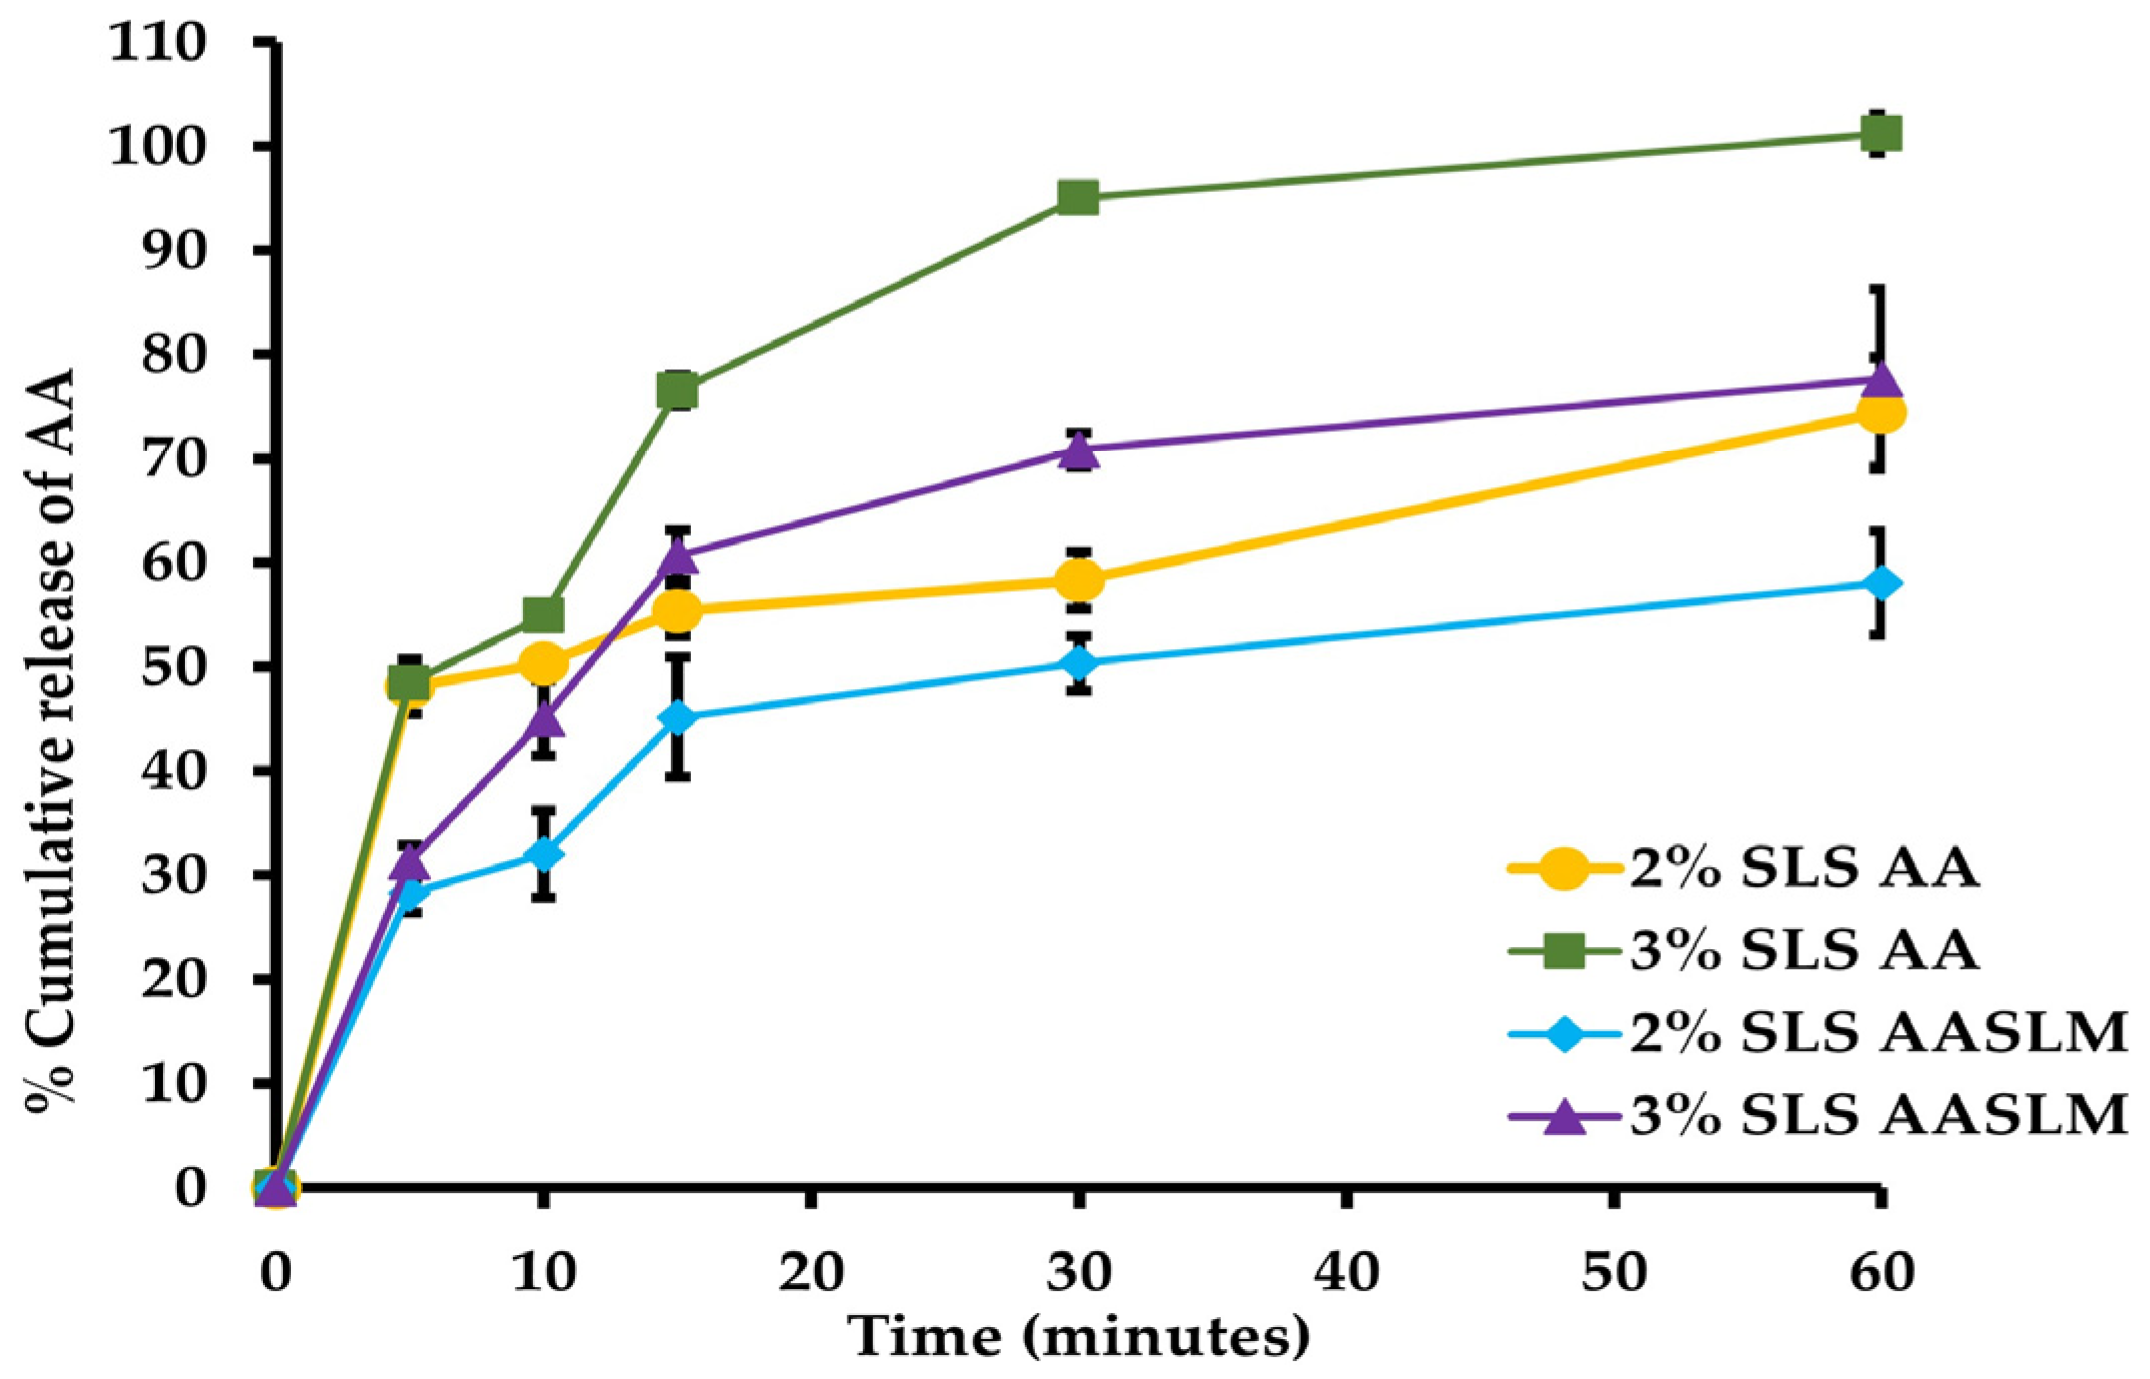
3.5. In Vitro Dissolution of AASLMs Tablets
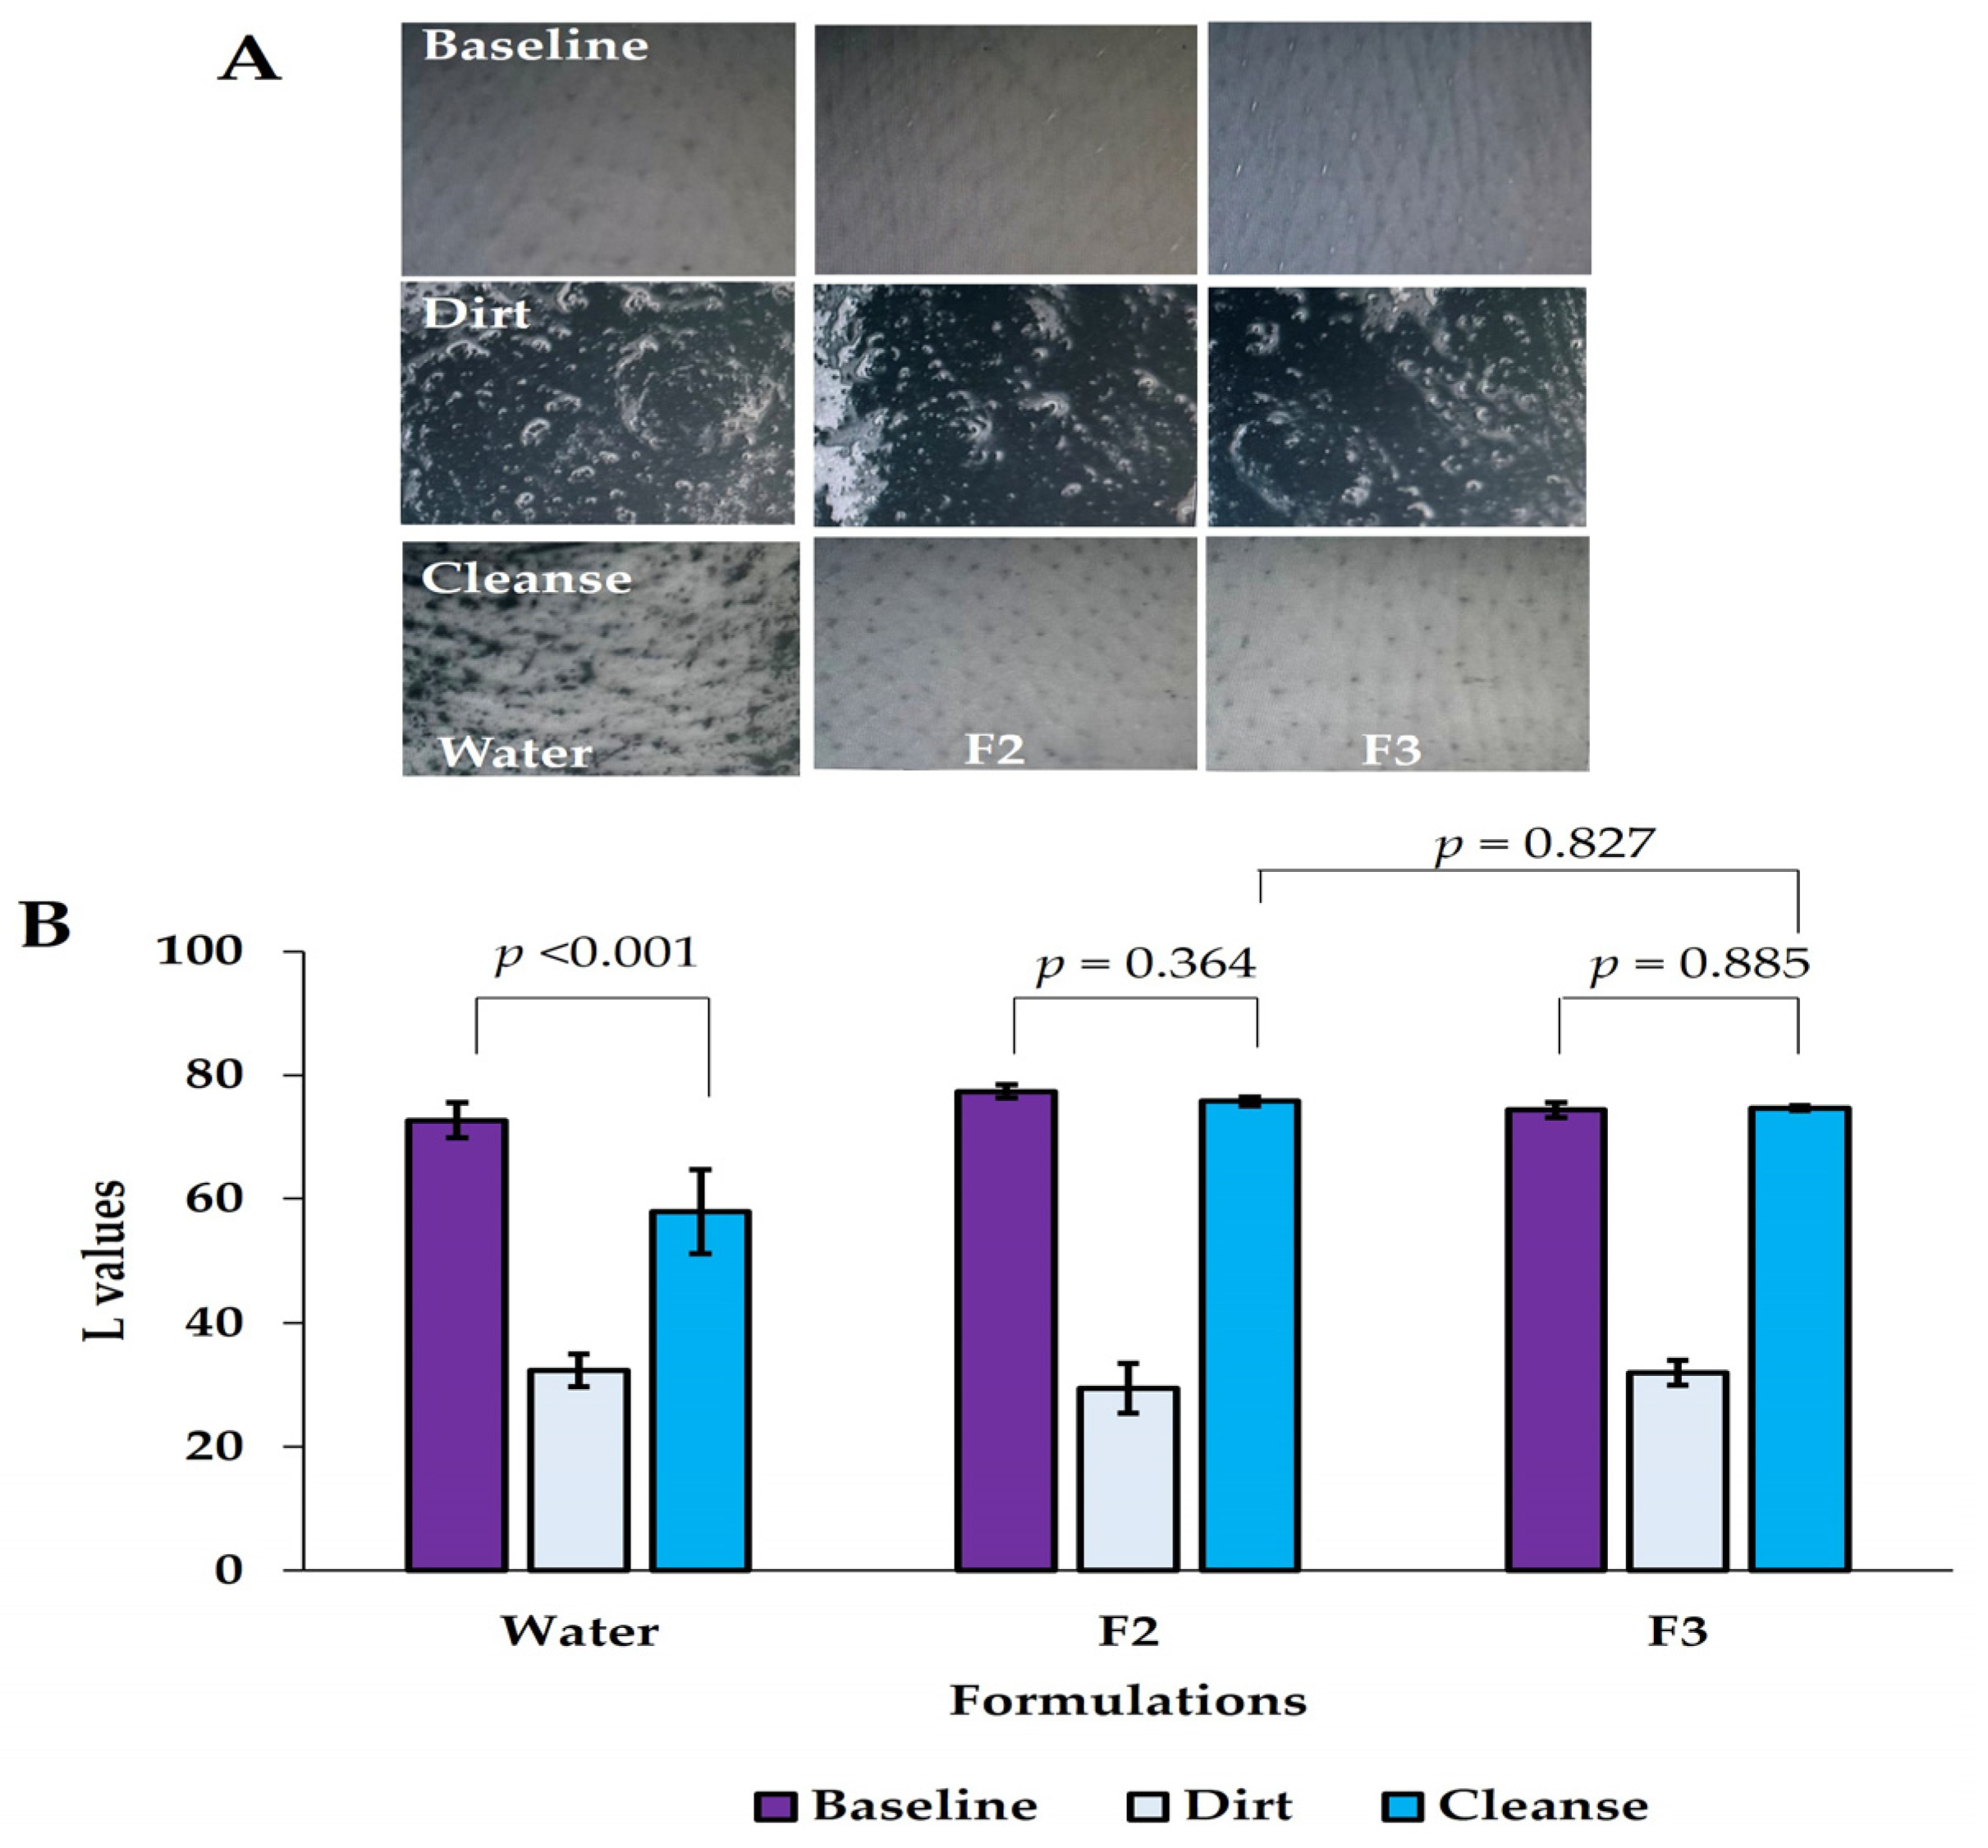
3.6. Cleansing Efficacy Study
3.7. Stability Studies
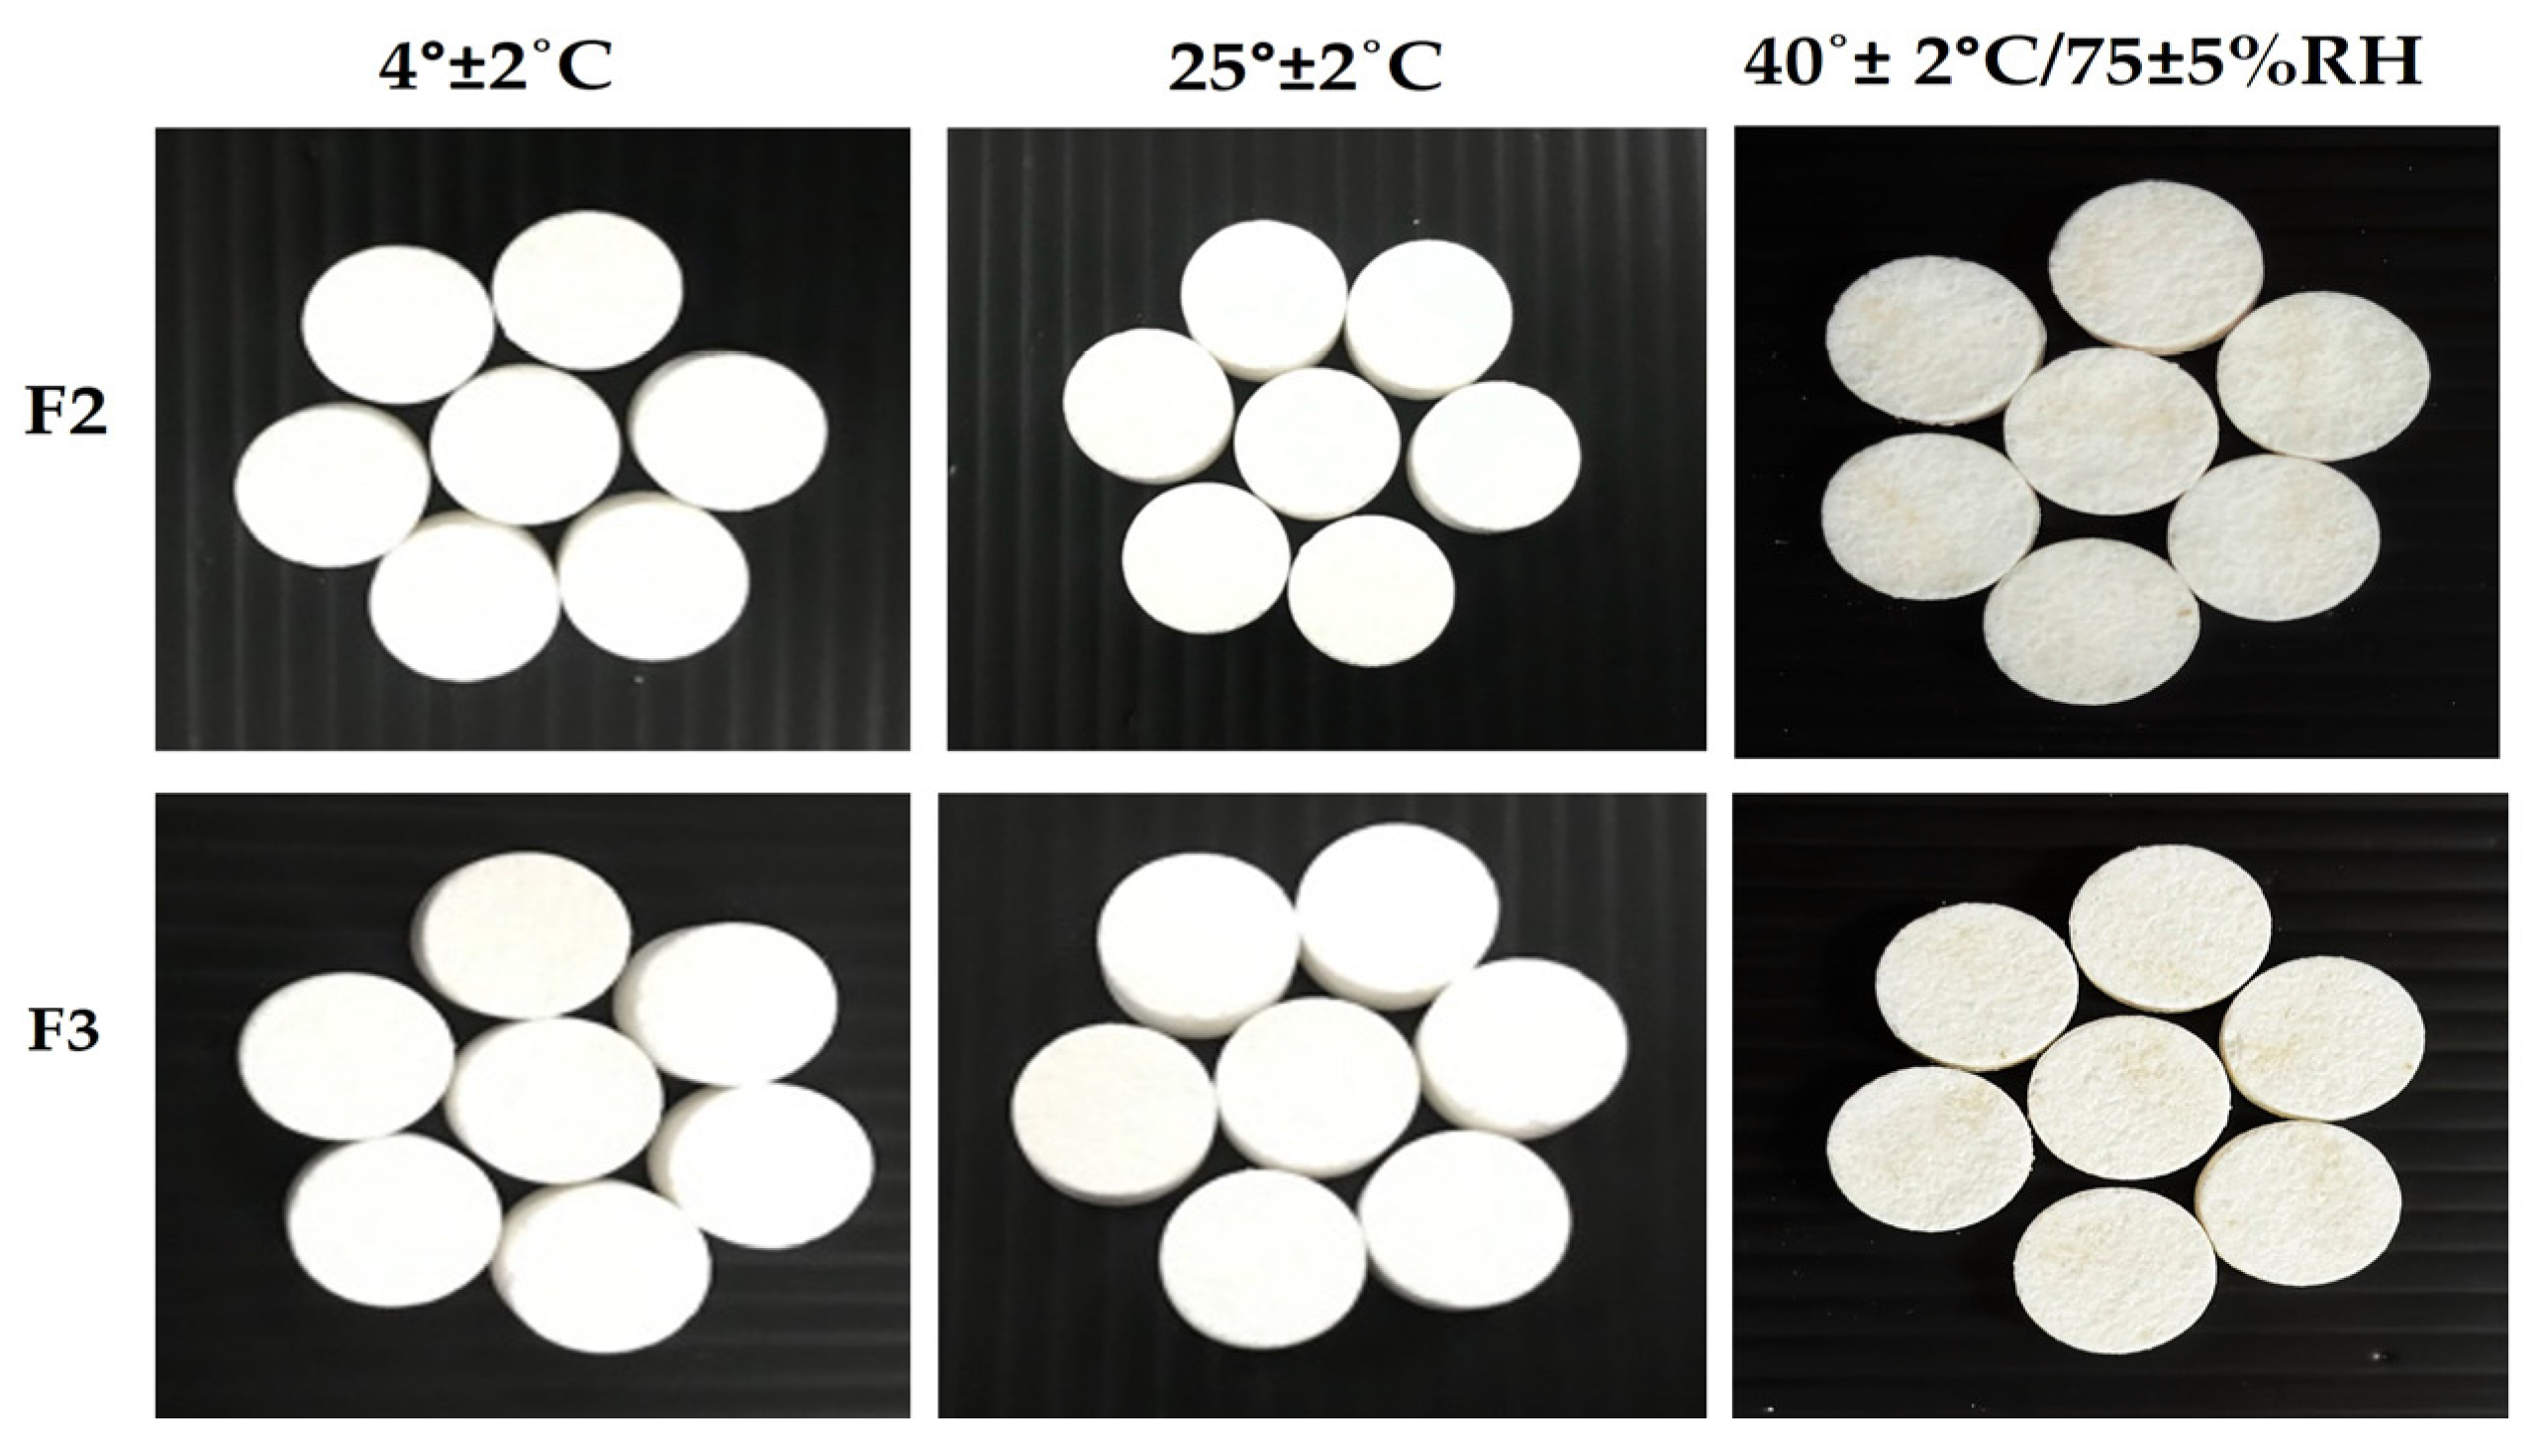
3.7.1. Physical Appearance
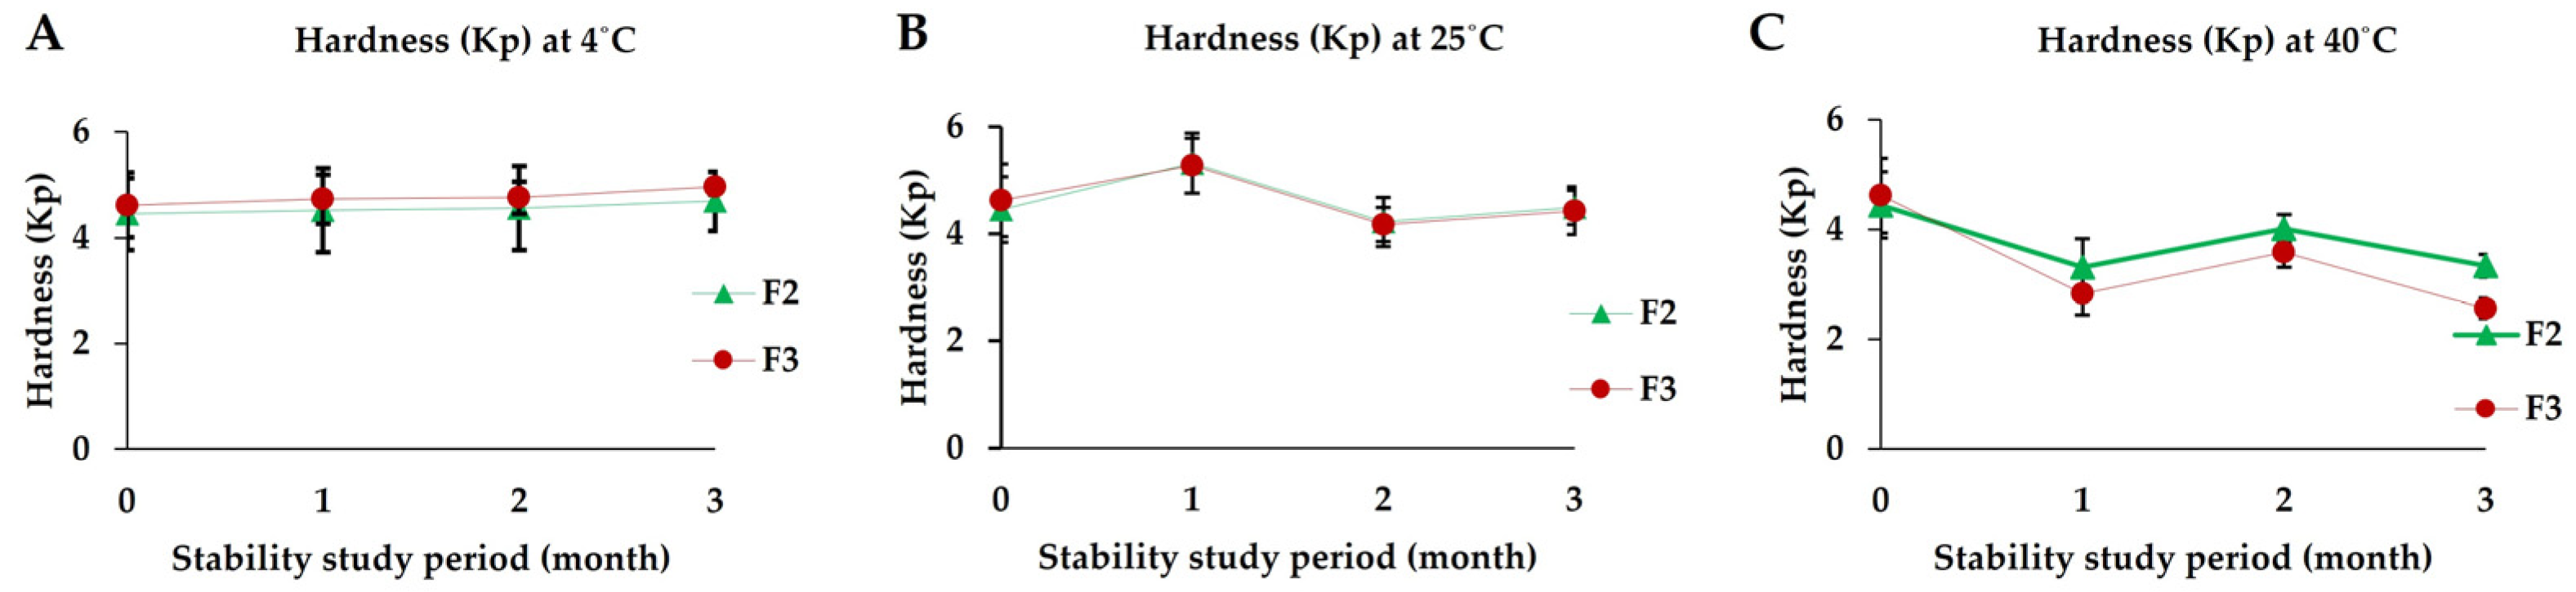
3.7.2. Hardness
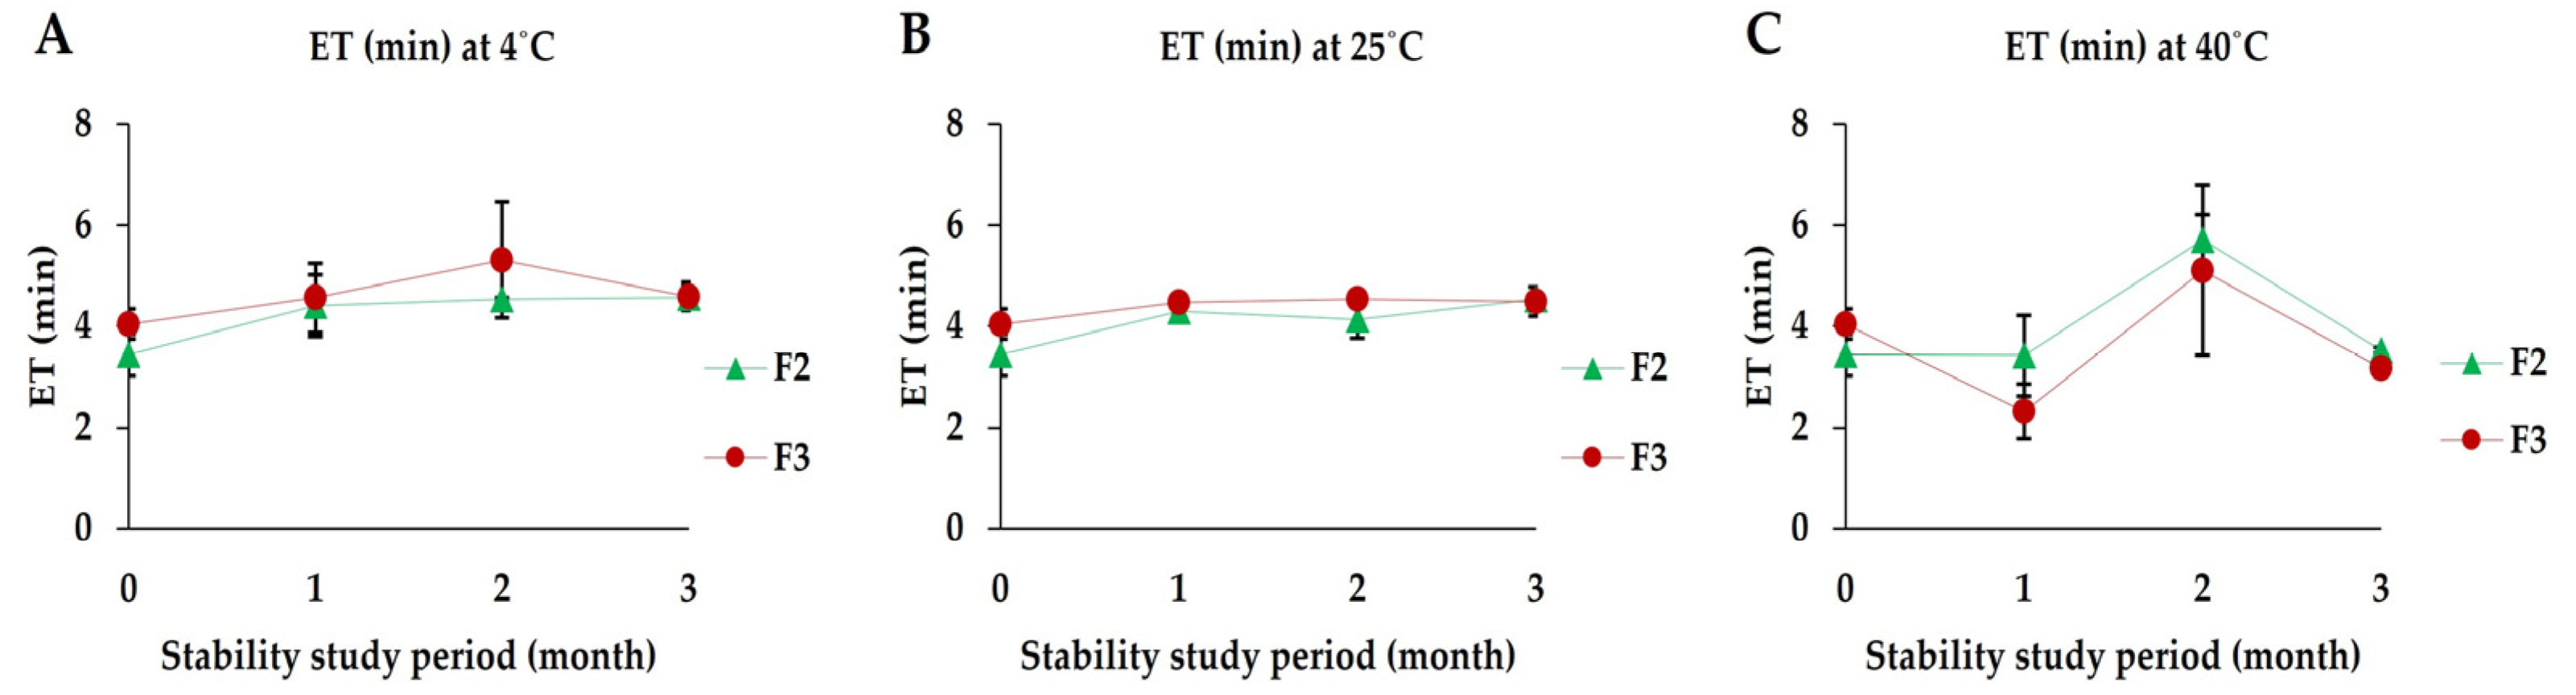
3.7.3. Effervescence Time
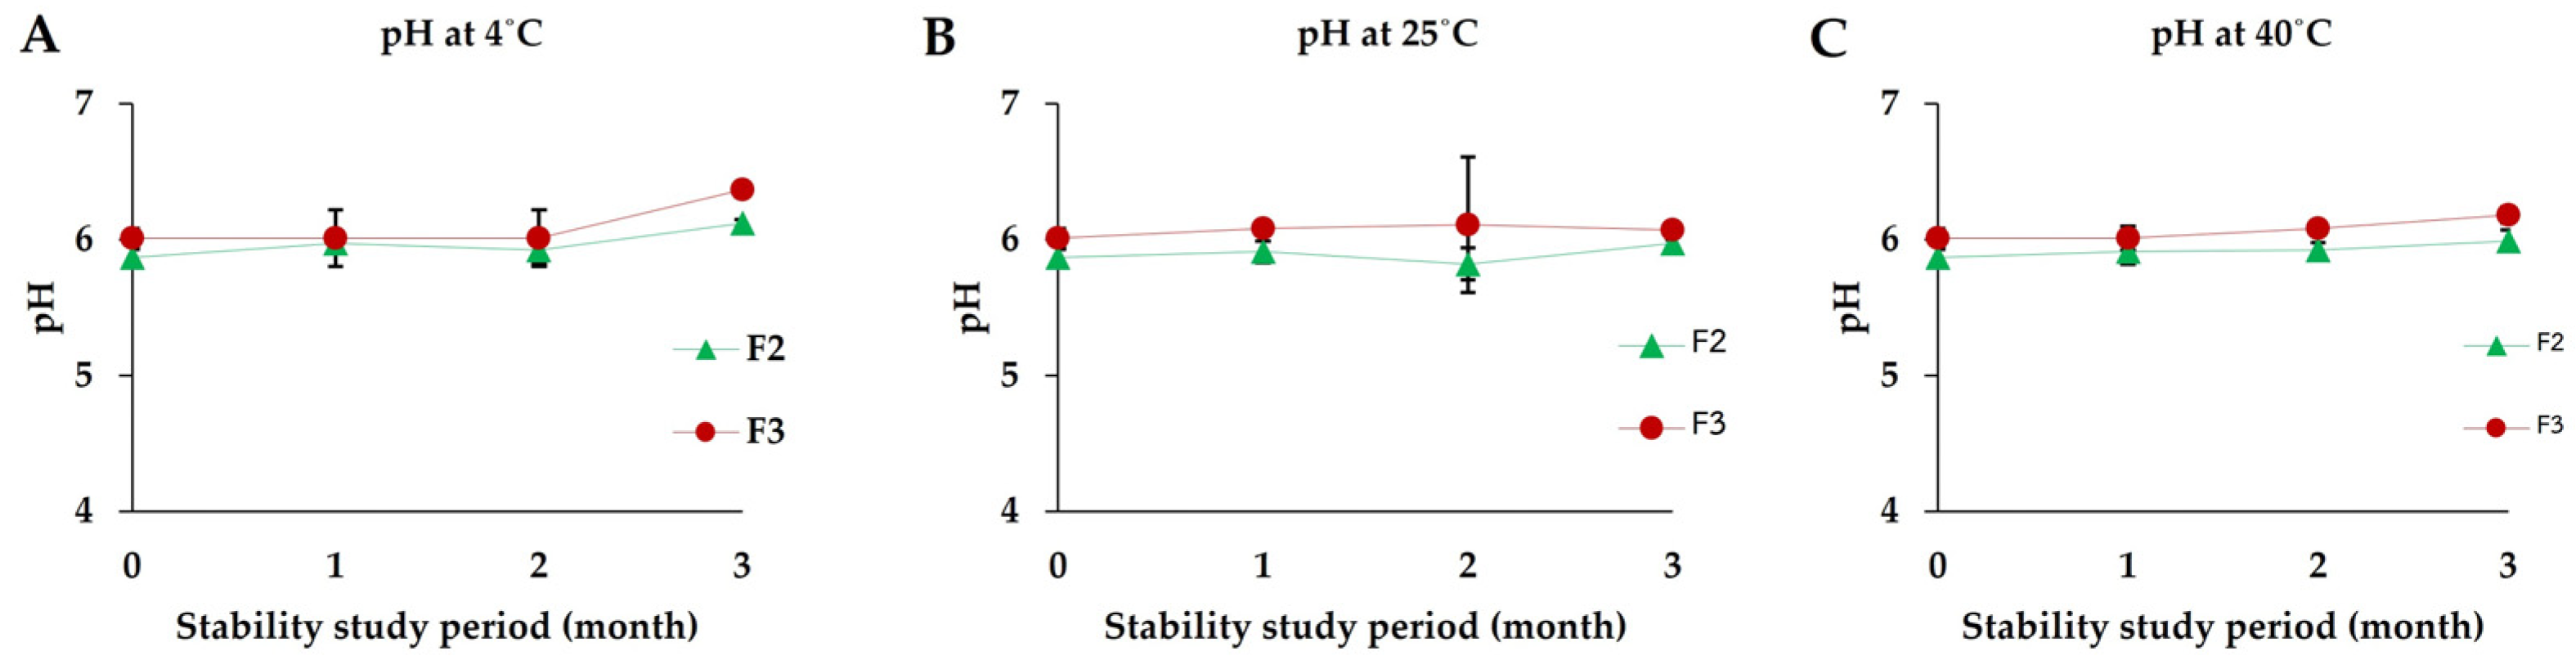
3.7.4. pH
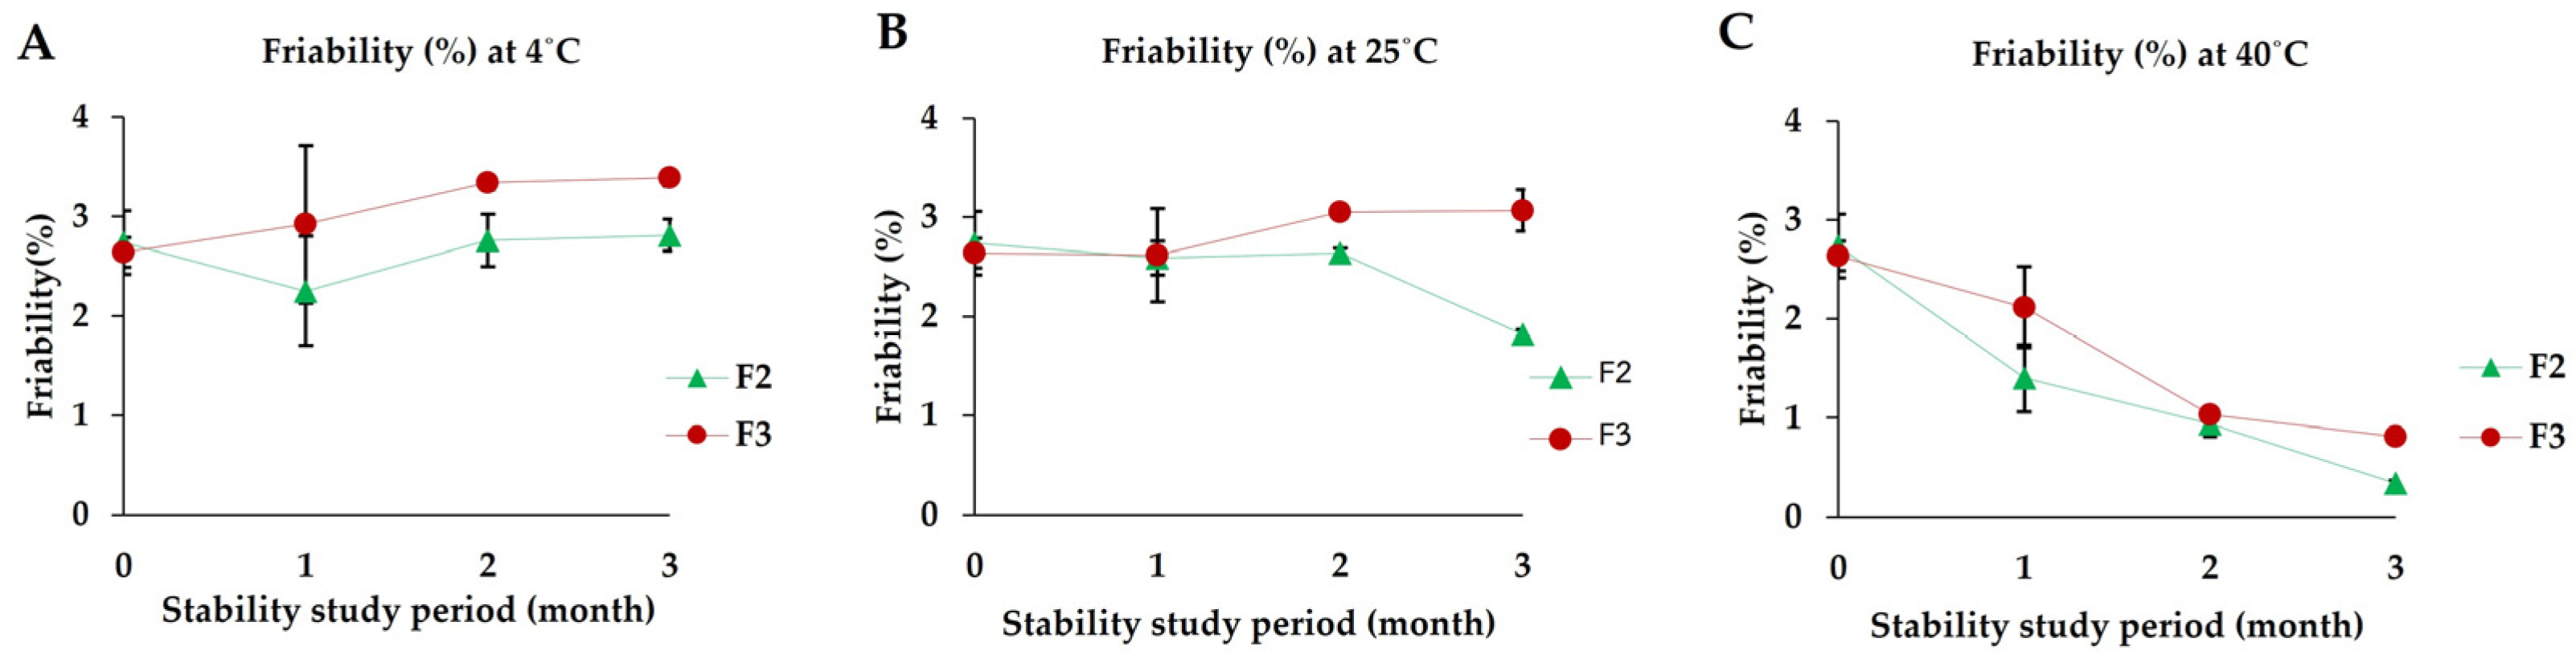
3.7.5. Friability
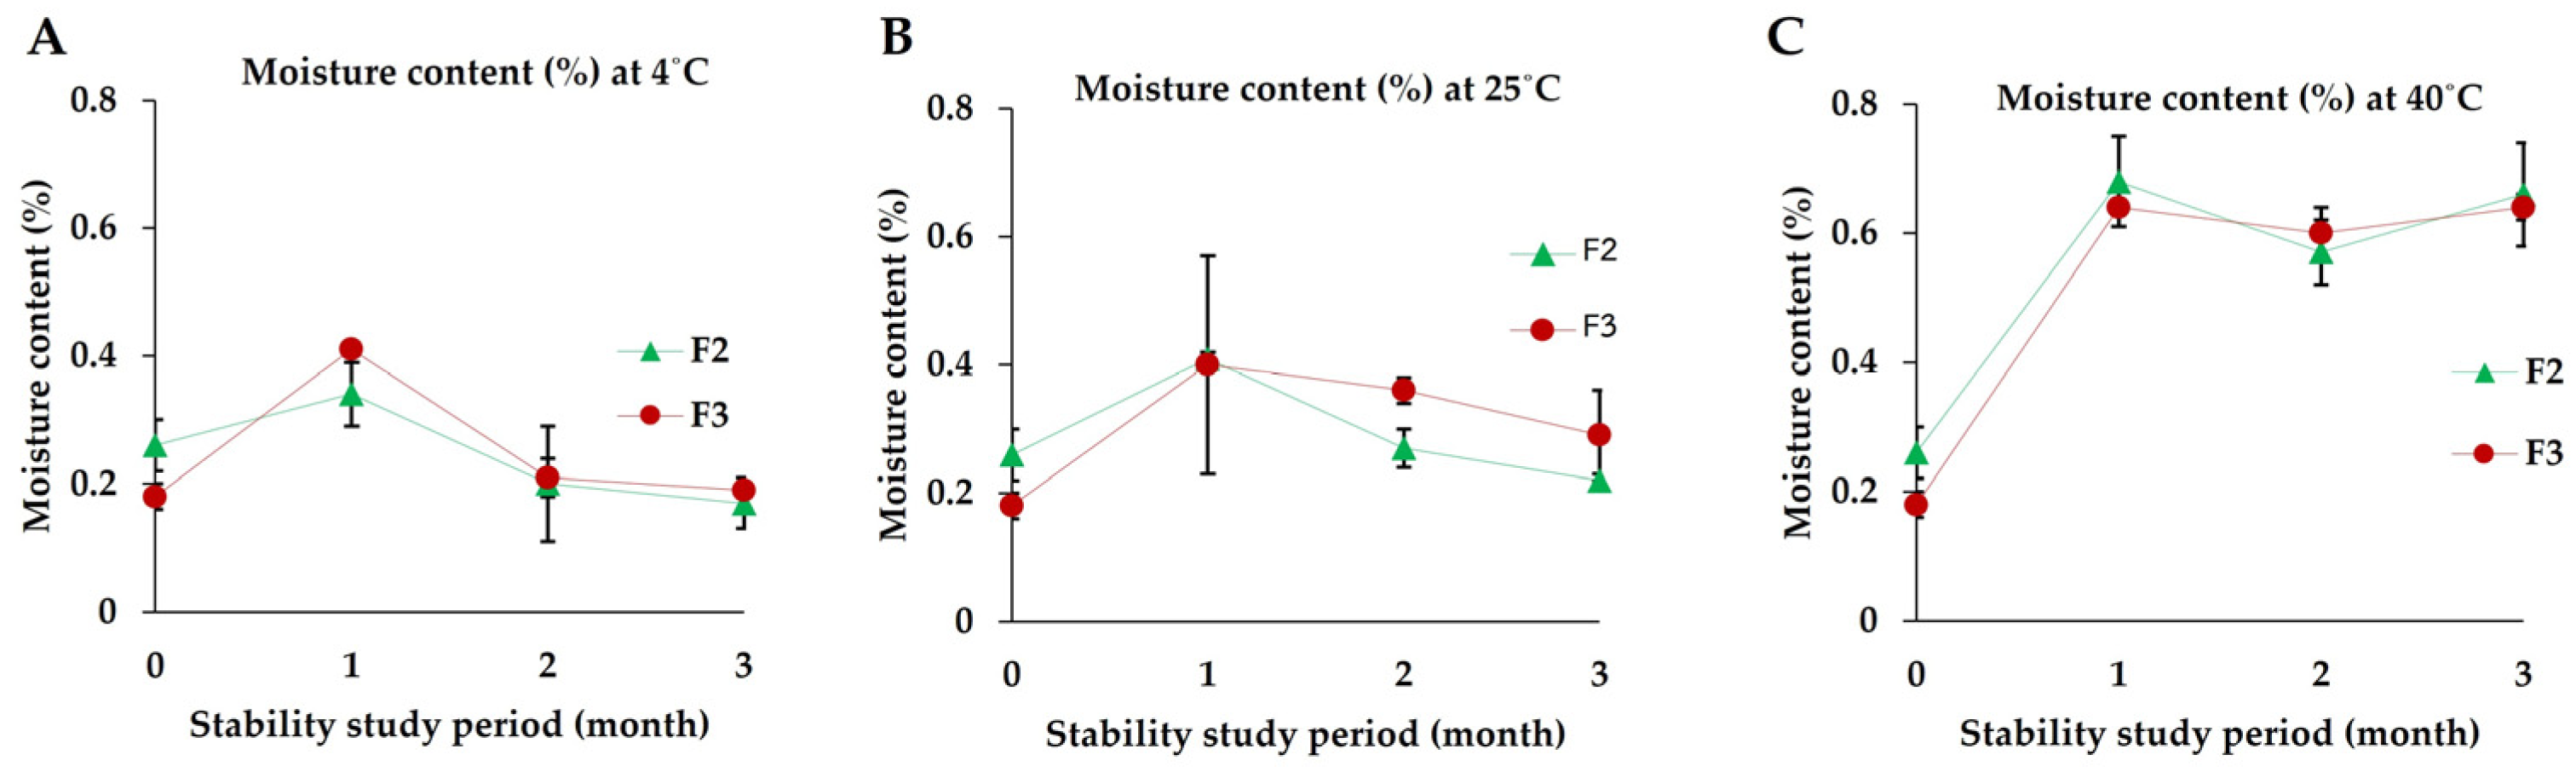
3.7.6. Moisture Content
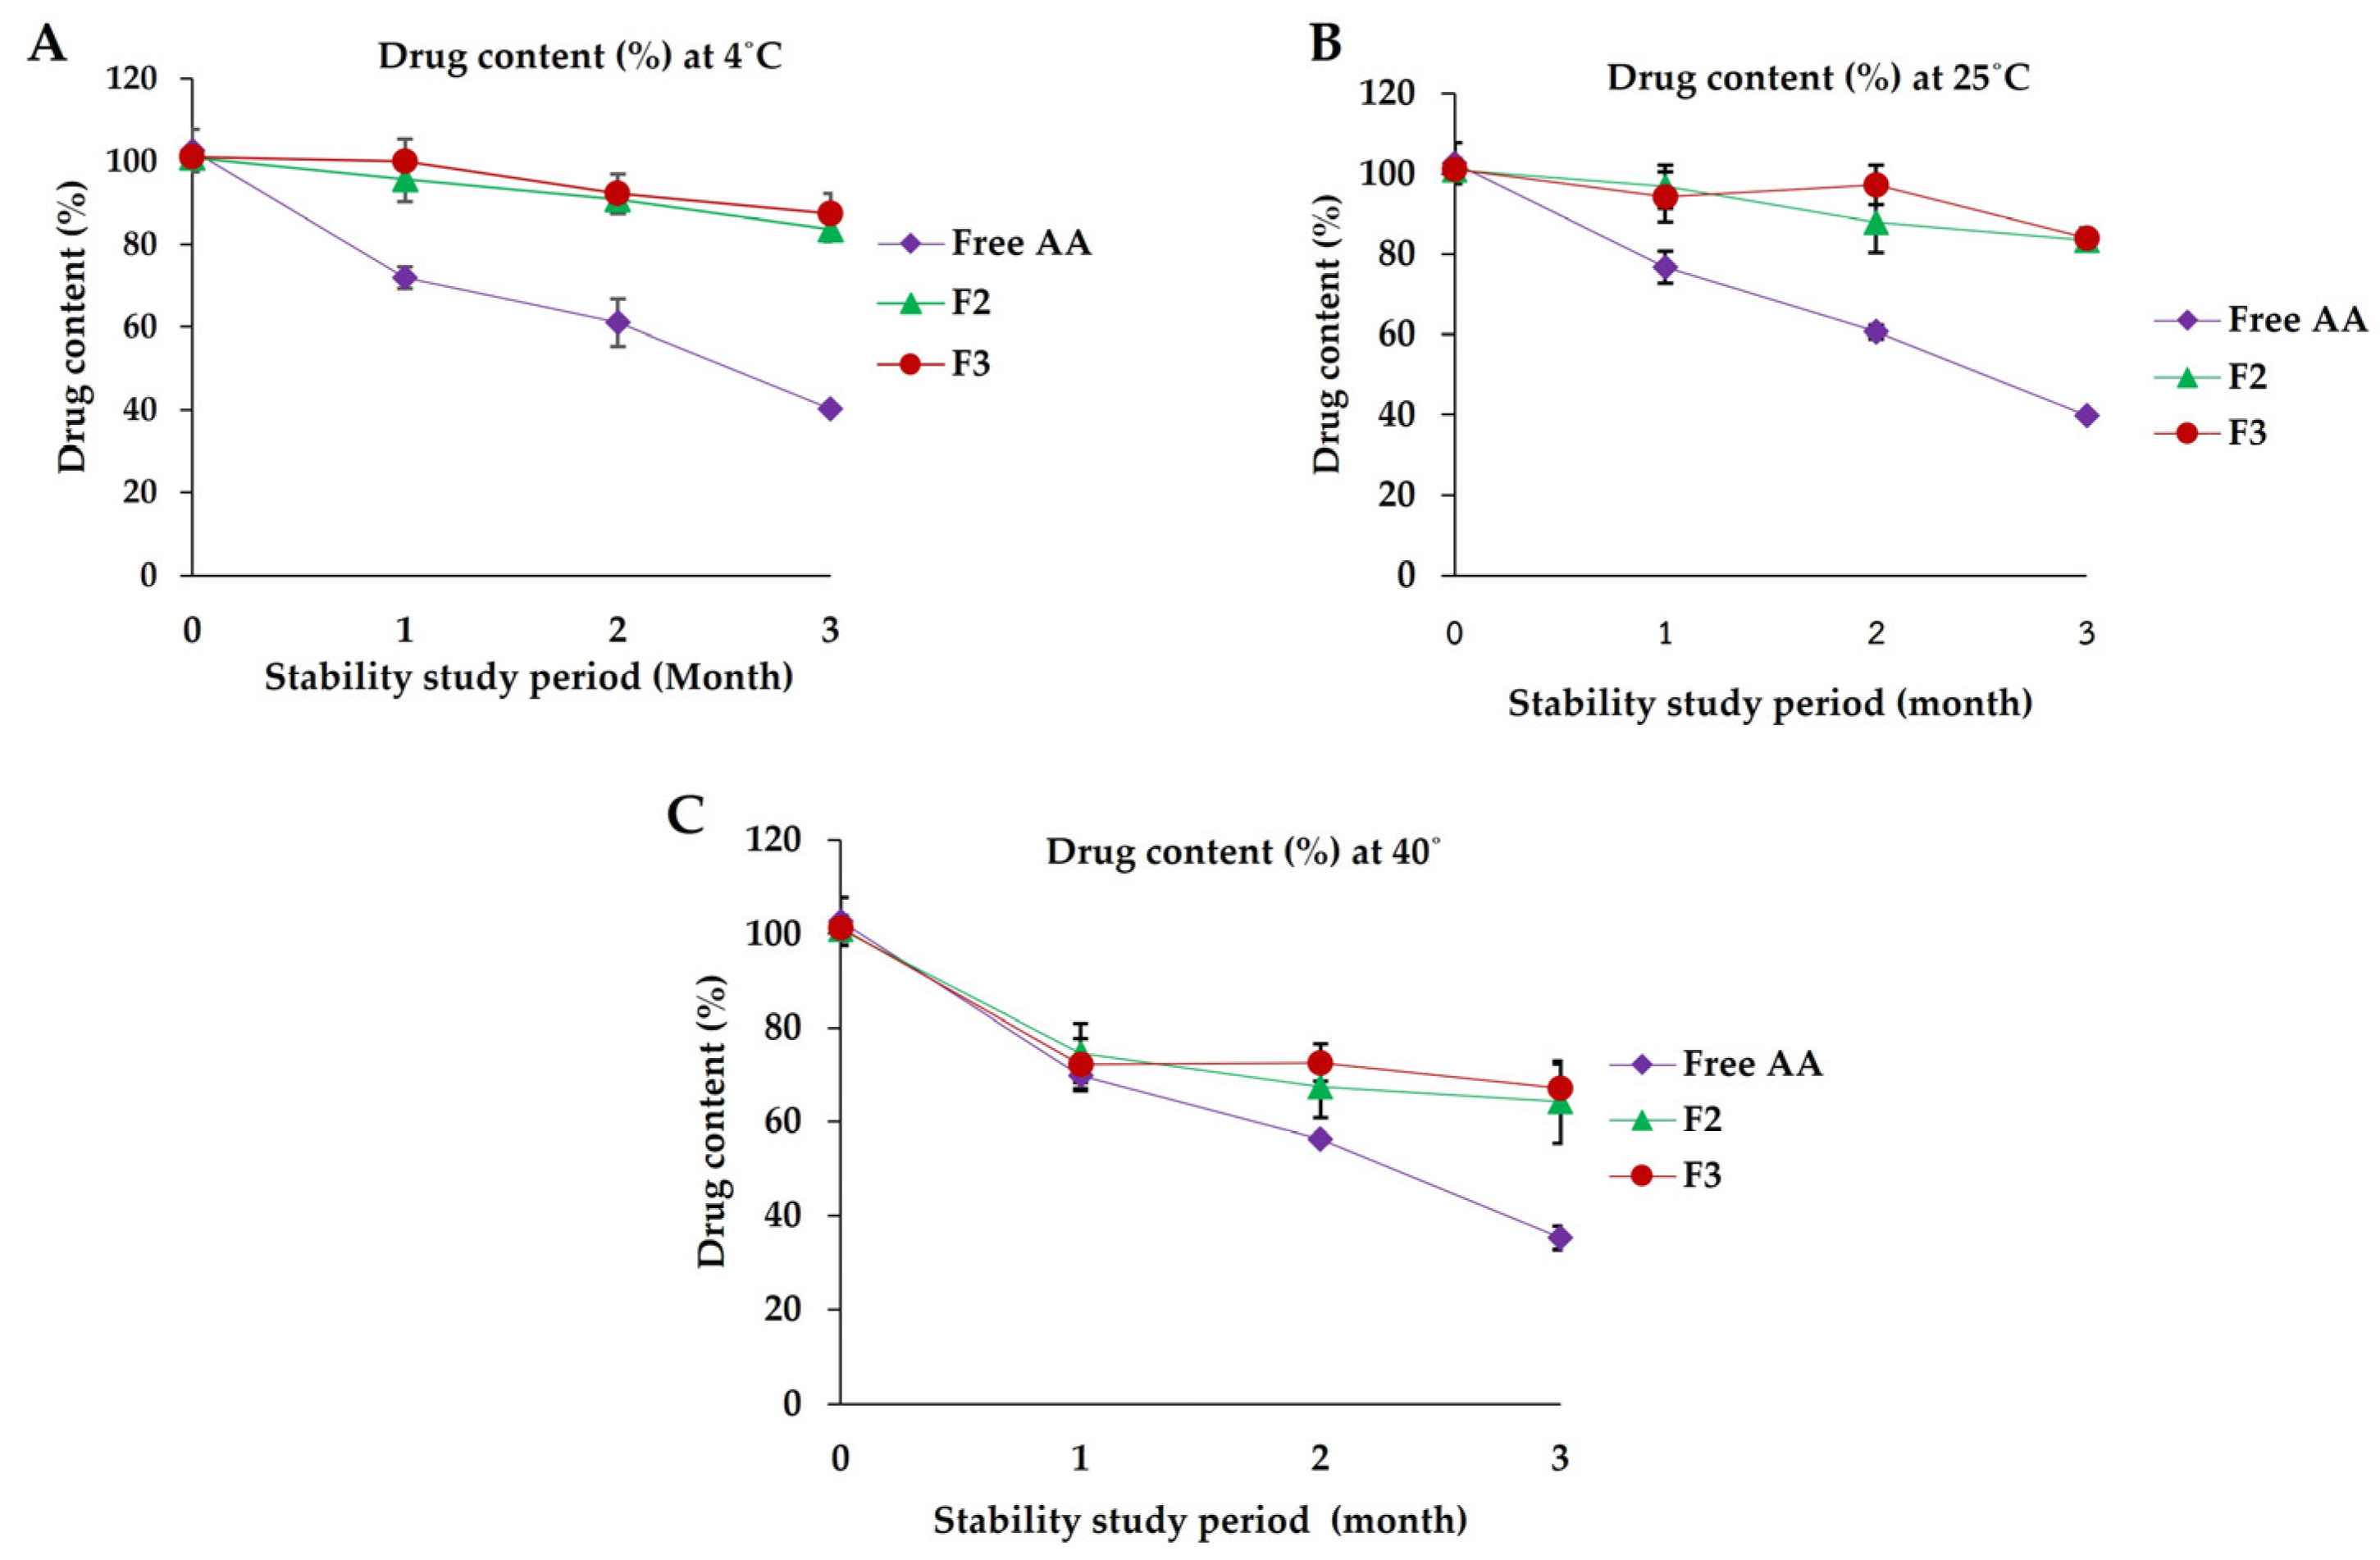
3.7.7. Drug Content
4. Conclusions
Author Contributions
Funding
Institutional Review Board Statement
Informed Consent Statement
Data Availability Statement
Acknowledgments
Conflicts of Interest
References
- Li, Z. Modern Mild Skin Cleansing. J. Cosmet. Dermatol. Sci. Appl. 2020, 10, 85–98. [Google Scholar] [CrossRef]
- Walters, R.M.; Mao, G.; Gunn, E.T.; Hornby, S. Cleansing formulations that respect skin barrier integrity. Dermatol. Res. Pract. 2012, 2012, 495917. [Google Scholar] [CrossRef]
- Draelos, Z.; Hornby, S.; Walters, R.M.; Appa, Y. Hydrophobically modified polymers can minimize skin irritation potential caused by surfactant-based cleansers. J. Cosmet. Dermatol. 2013, 12, 314–321. [Google Scholar] [CrossRef] [PubMed]
- Mijaljica, D.A.-O.X.; Spada, F.A.-O.; Harrison, I.A.-O. Skin Cleansing without or with Compromise: Soaps and Syndets. Molecules 2022, 27, 2010. [Google Scholar] [CrossRef] [PubMed]
- Mukhopadhyay, P. Cleansers and their role in various dermatological disorders. Indian J. Dermatol. 2011, 56, 2–6. [Google Scholar] [CrossRef] [PubMed]
- Khan, A.; Iqbal, Z.; Rehman, Z.; Nasir, F.; Khan, A.; Ismail, M.; Roohullah; Mohammad, A. Application of SeDeM Expert system in formulation development of effervescent tablets by direct compression. Saudi Pharm. J. 2014, 22, 433–444. [Google Scholar] [CrossRef]
- Ananthapadmanabhan, K.P.; Moore, D.J.; Subramanyan, K.; Meyer, F. Cleansing without compromise: The impact of cleansers on the skin barrier and the technology of mild cleansing. Dermatol Ther. 2004, 1, 16–25. [Google Scholar] [CrossRef] [PubMed]
- Johnson, A.; Ananthapadmanabhan, K.P.; Hawkins, S.; Nole, G. Bar Cleansers. Cosmet. Dermatol. Prod. Proced. 2015, 2, 81–95. [Google Scholar]
- Kuehl, B.L.; Fyfe, K.S.; Shear, N.H. Cutaneous cleansers. Skin Therapy Lett. 2013, 8, 1–4. [Google Scholar]
- Nix, D.H. Factors to consider when selecting skin cleansing products. J. Wound Ostomy Cont. Nurs. 2000, 27, 260–268. [Google Scholar] [CrossRef]
- Fore-Pfliger, J. The epidermal skin barrier: Implications for the wound care practitioner, part II. Adv. Skin Wound Care 2004, 17, 480–488. [Google Scholar] [CrossRef] [PubMed]
- Huang, J.; Tu, T.; Wang, W.; Zhou, G.; Zhang, W.; Wu, X.; Liu, W.A.-O. Asiatic Acid Glucosamine Salt Alleviates Ultraviolet B-induced Photoaging of Human Dermal Fibroblasts and Nude Mouse Skin. Photochem. Photobiol. 2020, 96, 124–138. [Google Scholar] [CrossRef] [PubMed]
- Lv, J.; Sharma, A.; Zhang, T.; Wu, Y.; Ding, X. Pharmacological Review on Asiatic Acid and Its Derivatives: A Potential Compound. SLAS Technol. 2018, 23, 111–127. [Google Scholar] [CrossRef] [PubMed]
- Nagoor Meeran, M.F.; Goyal, S.N.; Suchal, K.; Sharma, C.; Patil, C.R.; Ojha, S.K. Pharmacological Properties, Molecular Mechanisms, and Pharmaceutical Development of Asiatic Acid: A Pentacyclic Triterpenoid of Therapeutic Promise. Front. Pharmacol. 2018, 9, 892. [Google Scholar] [CrossRef]
- Park, K.A.-O. Pharmacological Effects of Centella asiatica on Skin Diseases: Evidence and Possible Mechanisms. Evid. Based Complement. Alternat. Med. 2021, 2021, 5462633. [Google Scholar] [CrossRef]
- Moon, G.A.-O.; Lee, Y.; Kim, E.-K.; Chung, K.-H.; Lee, K.-J.; An, J.H. Immunomodulatory and Anti-inflammatory Effects of Asiatic Acid in a DNCB-Induced Atopic Dermatitis Animal Model. Nutrients 2021, 13, 2448. [Google Scholar] [CrossRef]
- Bylka, W.; Znajdek-Awiżeń, P.; Studzińska-Sroka, E.; Brzezińska, M. Centella asiatica in cosmetology. Postepy Dermatol. Alergol. 2013, 30, 46–49. [Google Scholar] [CrossRef]
- Mook-Jung, I.; Shin, J.E.; Yun, S.H.; Huh, K.; Koh, J.Y.; Park, H.K.; Jew, S.S.; Jung, M.W. Protective effects of asiaticoside derivatives against beta-amyloid neurotoxicity. J. Neurosci. Res. 1999, 58, 417–425. [Google Scholar] [CrossRef]
- Yuan, C.; Jin, Z.; Xu, X. Inclusion complex of astaxanthin with hydroxypropyl-β-cyclodextrin: UV, FTIR, 1H NMR and molecular modeling studies. Carbohydr. Polym. 2012, 89, 492–496. [Google Scholar] [CrossRef]
- Garanti, T.A.-O.; Alhnan, M.A.-O.; Wan, K.A.-O. RGD-decorated solid lipid nanoparticles enhance tumor targeting, penetration and anticancer effect of asiatic acid. Nanomedicine 2020, 15, 1567–1583. [Google Scholar] [CrossRef]
- Umeyor, E.C.; Kenechukwu, F.C.; Ogbonna, J.D.; Chime, S.A.; Attama, A. Preparation of novel solid lipid microparticles loaded with gentamicin and its evaluation in vitro and in vivo. J. Microencapsul. 2012, 29, 296–307. [Google Scholar] [CrossRef] [PubMed]
- Gugu, T.H.; Chime, S.A.; Attama, A.A. Solid lipid microparticles: An approach for improving oral bioavailability of aspirin. AJPS 2015, 10, 425–432. [Google Scholar] [CrossRef]
- Scalia, S.; Young, P.M.; Traini, D. Solid lipid microparticles as an approach to drug delivery. Expert Opin. Drug Deliv. 2015, 12, 583–599. [Google Scholar] [CrossRef] [PubMed]
- Advankar, A.; Maheshwari, R.; Tambe, V.; Todke, P.; Raval, N.; Kapoor, D.; Tekade, R. Specialized tablets: Ancient history to modern developments. In Drug Delivery Systems; Academic Press: Cambridge, MA, USA, 2019; pp. 615–664. [Google Scholar] [CrossRef]
- Aslani, A.; Fattahi, F. Formulation, characterization and physicochemical evaluation of potassium citrate effervescent tablets. Adv. Pharm. Bull. 2013, 3, 217–225. [Google Scholar] [CrossRef] [PubMed]
- Aslani, A.; Jahangiri, H. Formulation, characterization and physicochemical evaluation of ranitidine effervescent tablets. Adv. Pharm. Bull. 2013, 3, 315–322. [Google Scholar] [CrossRef]
- Rosch, M.; Lucas, K.A.-O.; Al-Gousous, J.; Pöschl, U.; Langguth, P. Formulation and Characterization of an Effervescent Hydrogen-Generating Tablet. Pharmaceuticals 2021, 14, 1327. [Google Scholar] [CrossRef]
- Abe, H.; Yasui, S.; Kuwata, A.; Takeuchi, H. Improving powder flow properties of a direct compression formulation using a two-step glidant mixing process. Chem. Pharm. Bull. 2009, 57, 647–652. [Google Scholar] [CrossRef]
- Wolska, E.; Sznitowska, M. Technology of stable, prolonged-release eye-drops containing Cyclosporine A, distributed between lipid matrix and surface of the solid lipid microspheres (SLM). Int. J. Pharm. 2013, 441, 449–457. [Google Scholar] [CrossRef]
- Sznitowska, M.; Wolska, E.; Baranska, H.; Cal, K.; Pietkiewicz, J. The effect of a lipid composition and a surfactant on the characteristics of the solid lipid microspheres and nanospheres (SLM and SLN). Eur. J. Pharm. Biopharm. 2017, 110, 24–30. [Google Scholar] [CrossRef]
- Chimombe, T.; Mukhopadhyay, S.; Veroniaina, H.; Han, L.; Xu, X.; Juan, T.; Wu, Z. Orally disintegrating tablets: Formulation, preparation, evaluation and recent advances: A review. World J. Pharm. Pharm. Sci. 2019, 9, 304–328. [Google Scholar]
- Rahimpour, Y.; Javadzadeh, Y.; Hamishehkar, H. Solid lipid microparticles for enhanced dermal delivery of tetracycline HCl. Colloids Surf. B: Biointerfaces 2016, 145, 14–20. [Google Scholar] [CrossRef] [PubMed]
- Rojek, B.; Wesolowski, M. FTIR and TG analyses coupled with factor analysis in a compatibility study of acetazolamide with excipients. Spectrochim. Acta A Mol. Biomol. Spectrosc. 2019, 208, 285–293. [Google Scholar] [CrossRef] [PubMed]
- Iqbal, N.; Agrawal, A.; Kumar, J. Development of effervescent tablet formulation for rapid control of mosquito problem in early stages from different breeding sites. Arab. J. Chem. 2021, 14, 103082. [Google Scholar] [CrossRef]
- Amidon, G.; Secreast, P.; Mudie, D. Particle, Powder, and Compact Characterization. In Pharmaceutical Theory and Practice; Academic Press: Cambridge, MA, USA, 2009; pp. 163–186. [Google Scholar] [CrossRef]
- Zhao, F.; Li, M.; Meng, L.; Yu, J.; Zhang, T. Characteristics of Effervescent Tablets of Lactobacilli Supplemented with Chinese Ginseng (Panax ginseng C.A. Meyer) and Polygonatum sibiricum. Appl. Sci. 2020, 10, 3194. [Google Scholar] [CrossRef]
- Vogl, J.; Ostermann, M. On the measurement of the moisture content in different matrix materials. Accredit. Qual. 2006, 11, 356–362. [Google Scholar] [CrossRef]
- European Pharmacopoeia, 5th ed.; Council of Europe: Strasbourg, France, 2005; Volume 1.
- Hill, S.; Varker, A.S.; Karlage, K.; Myrdal, P.B. Analysis of drug content and weight uniformity for half-tablets of 6 commonly split medications. J. Manag. Care Pharm. 2009, 15, 253–261. [Google Scholar] [CrossRef]
- Tiwari, R.; Chanda, S.; Mundkinajeddu, D.; Murli, B.; Agarwal, A. HPLC method validation for simultaneous estimation ofmadecassoside, asiaticoside and asiatic acid in Centella asiatica. J. Chem. Pharm. Res. 2010, 2, 223–229. [Google Scholar]
- Wu, C.L.; Kuo, Y.H.; Lee, C.L.; Hsu, Y.W.; Pan, T.M. Synchronous high-performance liquid chromatography with a photodiode array detector and mass spectrometry for the determination of citrinin, monascin, ankaflavin, and the lactone and acid forms of monacolin K in red mold rice. J. AOAC Int. 2011, 94, 179–190. [Google Scholar] [CrossRef]
- Li, M.; Wang, Q.; Chen, N.; Yao, S.; Sun, X.; Quan, P.; Chen, Y.A.-O. Probing Pharmaceutical Strategies to Promote the Skin Delivery of Asiatic Acid from Hydrogels: Enhancement Effects of Organic Amine Counterions, Chemical Enhancers, and Microneedle Pretreatment. Pharmaceutics 2022, 14, 2532. [Google Scholar] [CrossRef]
- Bhoyar, P.K.; Biyani, D.M. Formulation and In vitro Evaluation of Sustained Release Dosage Form with Taste Masking of Metformin Hydrochloride. Indian J. Pharm. Sci. 2010, 72, 184–190. [Google Scholar] [CrossRef]
- Kim, E.A.; Park, J.S.; Kim, M.S.; Jeong, M.Y.; Park, H.J.; Choi, J.H.; Seo, J.H.; Choi, Y.S.; Kang, M.J. High-Payload Nanosuspension of Centella asiatica Extract for Improved Skin Delivery with No Irritation. Int. J. Nanomed. 2021, 16, 7417–7432. [Google Scholar] [CrossRef] [PubMed]
- Davies, D.J.; Heylings, J.R.; McCarthy, T.J.; Correa, C.M. Development of an in vitro model for studying the penetration of chemicals through compromised skin. Toxicol. Vitr. 2015, 29, 176–181. [Google Scholar] [CrossRef] [PubMed]
- Schrader, K.; Rohr, M. Methods for measuring the skin-cleansing effect of surfactants in comparison with skin roughness and compatibility. Clin. Dermatol. 1996, 14, 57–65. [Google Scholar] [CrossRef] [PubMed]
- Elsner, P.; Seyfarth, F.; Sonsmann, F.; John, S.M.; Diepgen, T.; Schliemann, S. Development of a standardized procedure for testing the efficacy of workplace cleansers. Contact Dermat. 2014, 70, 35–43. [Google Scholar] [CrossRef] [PubMed]
- Tulina, D.A.-O.; Béguin, A.; Pong, H.; Cabarbas, M.D.M.; Klokol, D.; Chan, M.K.S.; Wong, M.B.F. Evaluation of the in vivo cosmetic efficacy of the MF3 blue cell serum gel. One- and two-month test results. J. Cosmet. Dermatol. 2018, 17, 193–202. [Google Scholar] [CrossRef]
- Bajaj, S.; Singla, D.; Sakhuja, N. Stability Testing of Pharmaceutical Products. J. Appl. Pharm. Sci. 2012, 2, 129–138. [Google Scholar] [CrossRef]
- Momoh, M.A.; Ossai, E.C.; Chidozie, O.E.; Precscila, O.O.; Kenechukwu, F.C.; Ofokansi, K.O.; Attama, A.A.; Olobayo, K.O. A new lipid-based oral delivery system of erythromycin for prolong sustain release activity. Mater. Sci. Eng. C 2019, 97, 245–253. [Google Scholar] [CrossRef]
- Lambros, M.; Tran, T.H.; Fei, Q.; Nicolaou, M. Citric Acid: A Multifunctional Pharmaceutical Excipient. Pharmaceutics 2022, 14, 972. [Google Scholar] [CrossRef]
- Stahl, H. Effervescent: Dosage manufacturing. Pharm. Technol. Eur. 2003, 15, 25–28. [Google Scholar]
- Sun, H.; Wang, X.A.-O.; Wang, J.; Shi, G.; Chen, L. Influence of the formula on the properties of a fast dispersible fruit tablet made from mango, Chlorella, and cactus powder. Food Sci. Nutr. 2019, 8, 479–488. [Google Scholar] [CrossRef]
- Chinnasamy, V.; Sreekumar, A. Preparation, Thermo-Physical Studies and Corrosion Analysis of Stable Capric Acid/Cetyl Alcohol Binary Eutectic Phase Change Material for Cold Thermal Energy Storage. Energy Technol. 2018, 6, 397–405. [Google Scholar] [CrossRef]
- Karekar, P.; Vyas, V.; Shah, M.; Sancheti, P.; Pore, Y. Physicochemical investigation of the solid dispersion systems of etoricoxib with poloxamer 188. Pharm. Dev. Technol. 2009, 14, 373–379. [Google Scholar] [CrossRef] [PubMed]
- Liao, S.; Ma, Q.; An, G.; Zhang, N.; Wang, J.; Xu, C.; Cui, B.; She, X.; Fan, R.; Yongcong, S.; et al. Preparation and evaluation of solid dispersion of asiatic acid with PVPK 30. Dig. J. Nanomater. Biostructures 2013, 8, 685–690. [Google Scholar]
- Song, Y.; Wang, L.; Yang, P.; Wenslow, R.M., Jr.; Tan, B.; Zhang, H.; Deng, Z. Physicochemical characterization of felodipine-kollidon VA64 amorphous solid dispersions prepared by hot-melt extrusion. J. Pharm. Sci. 2013, 102, 1915–1923. [Google Scholar] [CrossRef] [PubMed]
- Badria, F.A.-O.; Fayed, H.A.; Ibraheem, A.K.; State, A.F.; Mazyed, E.A. Formulation of Sodium Valproate Nanospanlastics as a Promising Approach for Drug Repurposing in the Treatment of Androgenic Alopecia. Pharmaceutics 2020, 12, 866. [Google Scholar] [CrossRef]
- Crouter, A.; Briens, L. The effect of moisture on the flowability of pharmaceutical excipients. AAPS PharmSciTech. 2014, 15, 65–74. [Google Scholar] [CrossRef]
- Dun, J.; Osei-Yeboah, F.; Boulas, P.; Lin, Y.; Sun, C.C. A systematic evaluation of dual functionality of sodium lauryl sulfate as a tablet lubricant and wetting enhancer. Int. J. Pharm. 2018, 552, 139–147. [Google Scholar] [CrossRef]
- Mahmood, Z. Formulation design and evaluation of Cefuroxime axetil 125 mg immediate release tablets using different concentration of sodium lauryl sulphate as solubility enhancer. Braz. J. Pharm. Sci. 2014, 50, 11. [Google Scholar]
- Alshora, D.H.; Ibrahim, M.A.; Zayed, G.; Al Rwashed, M.A.; Abou-Taleb, H.A.; Ali, M.F. The role of sodium lauryl sulfate on formulation of directly compressed tablets containing simvastatin and aspirin: Effect on drugs dissolution and gastric mucosa. Saudi Pharm. J. 2022, 30, 635–645. [Google Scholar] [CrossRef]
- Korting, H.C.; Kober, M.; Mueller, M.; Braun-Falco, O. Influence of repeated washings with soap and synthetic detergents on pH and resident flora of the skin of forehead and forearm. Results of a cross-over trial in health probationers. Acta Derm. Venereol. 1987, 67, 41–47. [Google Scholar] [CrossRef]
- Weller, R.; Price, R.J.; Ormerod, A.D.; Benjamin, N.; Leifert, C. Antimicrobial effect of acidified nitrite on dermatophyte fungi, Candida and bacterial skin pathogens. J. Appl. Microbiol. 2001, 90, 648–652. [Google Scholar] [CrossRef]
- Puttarak, P.; Brantner, A. Biological Activities and Stability of a Standardized Pentacyclic Triterpene Enriched Centella asiatica Extract. Nat. Prod. Sci. 2016, 22, 20. [Google Scholar] [CrossRef]
- Shaw, D. Drugs Acting on the Gastrointestinal Tract, 7th ed.; APA Publication Manual; American Psychological Association: Washington, DC, USA, 2017; pp. 404–416. [Google Scholar] [CrossRef]
- Alizadeh, M.N.; Shayanfar, A.; Jouyban, A. Solubilization of drugs using sodium lauryl sulfate: Experimental data and modeling. J. Mol. Liq. 2018, 268, 410–414. [Google Scholar] [CrossRef]
- Kale, K.; Hapgood, K.; Stewart, P. Drug agglomeration and dissolution—What is the influence of powder mixing? Eur. J. Pharm. Biopharm. 2009, 72, 156–164. [Google Scholar] [CrossRef]
- Lachiver, E.D.; Abatzoglou, N.; Cartilier, L.; Simard, J.-S. Agglomeration tendency in dry pharmaceutical granular systems. Eur. J. Pharm. Biopharm. 2006, 64, 193–199. [Google Scholar] [CrossRef]
- Pavlovska, G.; Tanevska, S. Influence of temperature and humidity on the degradation process of ascorbic acid in vitamin C chewable tablets. J. Therm. Anal. Calorim. 2013, 111, 1971–1977. [Google Scholar] [CrossRef]
- Betti, M.; Hrynets, Y.; Bhattacherjee, A. Nonenzymatic Browning Reactions: Overview. In Reference Module in Food Science; Elsevier: Amsterdam, The Netherlands, 2017. [Google Scholar] [CrossRef]
- Bobo, G.; Arroqui, C.; Merino, G.; Vírseda, P. Antibrowning Compounds for Minimally Processed Potatoes: A Review. Food Rev. Int. 2019, 36, 1–18. [Google Scholar] [CrossRef]
- Win Yee, L.; Cheun, C.; Wong, C.W. Inhibition of enzymatic browning in sweet potato (Ipomoea batatas (L.)) with chemical and natural anti-browning agents. J. Food Process. 2019, 43, e14195. [Google Scholar] [CrossRef]
- Ali, H.M.; El-Gizawy, A.M.; El-Bassiouny, R.E.; Saleh, M.A. The role of various amino acids in enzymatic browning process in potato tubers, and identifying the browning products. Food Chem. 2016, 192, 879–885. [Google Scholar] [CrossRef]
- Hamdan, N.; Lee, C.A.-O.; Wong, S.A.-O.; Fauzi, C.; Zamri, N.M.A.; Lee, T.A.-O. Prevention of Enzymatic Browning by Natural Extracts and Genome-Editing: A Review on Recent Progress. Molecules 2022, 27, 1101. [Google Scholar] [CrossRef]
- Bellucci, E.R.B.; Bis-Souza, C.V.; Domínguez, R.; Bermúdez, R.A.-O.; Barretto, A.C.d.S. Addition of Natural Extracts with Antioxidant Function to Preserve the Quality of Meat Products. Biomolecules 2022, 12, 1506. [Google Scholar] [CrossRef]
- Mohd Sabee, M.M.S.; Uyen Thanh, N.; Ahmad, N.; Abdul Hamid, Z. Plastics Packaging for Pharmaceutical Products. In Reference Module in Materials Science and Materials Engineering; Elsevier: Amsterdam, The Netherlands, 2021. [Google Scholar] [CrossRef]
- Meisner, M.; Duda, P.; Szulc-Musioł, B.; Sarecka-Hujar, B. Characteristics of Commercial Effervescent Tablets Using Selected Pharmacopeial and Novel Analytical Methods. Appl. Sci. 2023, 13, 3171. [Google Scholar] [CrossRef]
- Pagire, S.; Seaton, C.; Paradkar, A. Improving Stability of Effervescent Products by Co-Crystal Formation: A Novel Application of Crystal Engineered Citric Acid. Cryst. Growth Des. 2020, 20, 4839–4844. [Google Scholar] [CrossRef]
- Jones, F.R.; Foreman, J. The response of aerospace composites to temperature and humidity. In Polymer Composites in the Aerospace Industry; Woodhead Publishing: Sawston, UK, 2015; pp. 335–369. [Google Scholar] [CrossRef]


| Code | Citric Acid | Sodium Bicarbonate | AASLMs | SLS | Lactose |
|---|---|---|---|---|---|
| B1 | 100 | 87.45 | 50 | 5 | 757.55 |
| B2 | 100 | 109.31 | 50 | 5 | 735.69 |
| B3 | 100 | 131.18 | 50 | 5 | 713.82 |
| B4 | 100 | 87.45 | 50 | 10 | 752.55 |
| B5 | 100 | 109.31 | 50 | 10 | 730.69 |
| B6 | 100 | 131.18 | 50 | 10 | 708.82 |
| B7 | 100 | 87.45 | 50 | 20 | 742.55 |
| B8 | 100 | 109.31 | 50 | 20 | 720.69 |
| B9 | 100 | 131.18 | 50 | 20 | 698.82 |
| B10 | 100 | 87.45 | 50 | 30 | 732.55 |
| B11 | 100 | 109.31 | 50 | 30 | 710.69 |
| B12 | 100 | 131.18 | 50 | 30 | 688.82 |
| B13 | 100 | 87.45 | 50 | 40 | 722.55 |
| B14 | 100 | 109.31 | 50 | 40 | 700.69 |
| B15 | 100 | 131.18 | 50 | 40 | 678.82 |
| B16 | 100 | 87.45 | 50 | 50 | 712.55 |
| B17 | 100 | 109.31 | 50 | 50 | 690.69 |
| B18 | 100 | 131.18 | 50 | 50 | 668.82 |
| Angle of Repose (Degree) | Carr’s Index (%) | Hausner’s Ratio | Type of Flow |
|---|---|---|---|
| 25–30 | ≤10 | 1.00–1.11 | Excellent |
| 31–35 | 11–15 | 1.12–1.18 | Good |
| 36–40 | 16–20 | 1.19–1.25 | Fair |
| 41–45 | 21–25 | 1.26–1.34 | Passable |
| 46–55 | 26–31 | 1.35–1.45 | Poor |
| 56–65 | 32–37 | 1.46–1.59 | Very poor |
| >66 | >38 | >1.60 | Extremely poor |
| Code | Citric Acid | Sodium Bicarbonate | AASLMs | SLS | Lactose |
|---|---|---|---|---|---|
| F1 | 10 | 13.12 | 5 | 1 | 70.88 |
| F2 | 10 | 13.12 | 5 | 2 | 69.88 |
| F3 | 10 | 13.12 | 5 | 3 | 98.88 |
| F4 | 10 | 13.12 | 5 | 4 | 67.88 |
| F5 | 10 | 13.12 | 5 | 5 | 66.88 |
| Code | Effervescence Time | pH | Hardness |
|---|---|---|---|
| B1 | 3.03 ± 0.37 | 5.03 ± 0.02 | 3.50 ± 0.28 |
| B2 | 2.20 ± 0.08 | 5.43 ± 0.01 | 3.33 ± 0.47 |
| B3 | 2.10 ± 0.03 | 5.71 ± 0.02 | 3.10 ± 0.67 |
| B4 | 5.51 ± 0.09 | 5.10 ± 0.20 | 3.64 ± 0.52 |
| B5 | 5.33 ± 0.06 | 5.66 ± 0.10 | 3.80 ± 0.80 |
| B6 | 3.45 ± 0.05 | 5.85 ± 0.04 | 3.04 ± 0.30 |
| B7 | 4.09 ± 0.29 | 5.23 ± 0.02 | 3.33 ± 0.25 |
| B8 | 3.52 ± 0.43 | 5.51 ± 0.02 | 3.65 ± 0.53 |
| B9 | 3.18 ± 0.18 | 5.86 ± 0.19 | 3.43 ± 0.31 |
| B10 | 4.38 ± 0.15 | 5.08 ± 0.04 | 4.35 ± 0.45 |
| B11 | 4.37 ± 0.03 | 5.92 ± 0.03 | 4.45 ± 0.21 |
| B12 | 3.01 ± 0.42 | 6.03 ± 0.02 | 4.45 ± 0.70 |
| B13 | 4.23 ± 0.12 | 5.11 ± 0.02 | 3.73 ± 0.10 |
| B14 | 4.08 ± 0.36 | 5.59 ± 0.04 | 3.80 ± 0.08 |
| B15 | 3.12 ± 0.09 | 6.08 ± 0.01 | 3.85 ± 0.10 |
| B16 | 6.52 ± 0.06 | 5.10 ± 0.02 | 4.10 ± 0.74 |
| B17 | 5.38 ± 0.13 | 5.66 ± 0.07 | 4.35 ± 0.75 |
| B18 | 5.32 ± 0.12 | 6.10 ± 0.09 | 4.40 ± 0.28 |
| Code | AOR | CI | HR | MCBC |
|---|---|---|---|---|
| F1 | 16.07 ± 0.45 | 8.15 ± 2.57 | 1.08 ± 0.03 | 0.27 ± 0.09 |
| F2 | 17.89 ± 0.24 | 10.75 ± 1.86 | 1.11 ± 0.02 | 0.18 ± 0.08 |
| F3 | 18.04 ± 0.80 | 11.26 ± 2.19 | 1.11 ± 0.02 | 0.28 ± 0.10 |
| F4 | 16.99 ± 1.04 | 10.29 ± 3.56 | 1.10 ± 0.04 | 0.38 ± 0.03 |
| F5 | 17.55 ± 1.29 | 9.04 ± 2.24 | 1.09 ± 0.02 | 0.34 ± 0.09 |
Disclaimer/Publisher’s Note: The statements, opinions and data contained in all publications are solely those of the individual author(s) and contributor(s) and not of MDPI and/or the editor(s). MDPI and/or the editor(s) disclaim responsibility for any injury to people or property resulting from any ideas, methods, instructions or products referred to in the content. |
© 2023 by the authors. Licensee MDPI, Basel, Switzerland. This article is an open access article distributed under the terms and conditions of the Creative Commons Attribution (CC BY) license (https://creativecommons.org/licenses/by/4.0/).
Share and Cite
Mang Sung Thluai, L.; Titapiwatanakun, V.; Ruksiriwanich, W.; Boonpisuttinant, K.; Chutoprapat, R. Development of Effervescent Cleansing Tablets Containing Asiatic-Acid-Loaded Solid Lipid Microparticles. Cosmetics 2023, 10, 148. https://0-doi-org.brum.beds.ac.uk/10.3390/cosmetics10060148
Mang Sung Thluai L, Titapiwatanakun V, Ruksiriwanich W, Boonpisuttinant K, Chutoprapat R. Development of Effervescent Cleansing Tablets Containing Asiatic-Acid-Loaded Solid Lipid Microparticles. Cosmetics. 2023; 10(6):148. https://0-doi-org.brum.beds.ac.uk/10.3390/cosmetics10060148
Chicago/Turabian StyleMang Sung Thluai, Lucy, Varin Titapiwatanakun, Warintorn Ruksiriwanich, Korawinwich Boonpisuttinant, and Romchat Chutoprapat. 2023. "Development of Effervescent Cleansing Tablets Containing Asiatic-Acid-Loaded Solid Lipid Microparticles" Cosmetics 10, no. 6: 148. https://0-doi-org.brum.beds.ac.uk/10.3390/cosmetics10060148