
Meta-Analysis and Analytical Methods in Cosmetics Formulation: A Review
 ,
,  and
and 
Abstract
:
1. Introduction
1.1. Industry Overview
1.2. The Importance of Instrumental Techniques in Cosmetics R&D
1.3. Meta-Analysis of Cosmetics
1.4. Literature Review Methodology
1.5. Structure of the Review
2. Analytical Methods in Cosmetics
3. Chromatographic Analysis
3.1. Liquid Chromatography
3.2. Gas Chromatography

| Ingredient | Sample | Method | Detection | Reference/Year |
|---|---|---|---|---|
| Allergens | Baby oil, lip balm, olive cream, deodorant, face mask, face lotion, shampoo, and toothpaste. | DB-WAX (30 m × 0.32 mm i.d., 0.5 μm) | FID | [61]/2015 |
| Allergens | Perfumes and essential oils | Column: Watercol 1460 (10 m × 0.10 mm, 0.08 μm); Watercol1910 (15 m × 0.10 mm, 0.08 μm) | FID-TCD MS | [62]/2020 |
| Allergens | Perfume | Column: DB-1 (60 m × 0.25 mm, 0.25 μm); DB-1 (20 m × 0.18 mm, 0.18 μm); DB-5 (60 m × 0.25 mm, 0.25 μm); DB-17 (30 m × 0.25 mm, 0.25 μm); DB-17 (20 m × 0.18 mm, 0.18 μm); Delta-3 (30 m × 0.25 mm, 0.25 μm) | MS | [63]/2003 |
| Allergens | Moisturizing cream, moisturizing lotion, anti-wrinkle cream, hand cream, sunscreen, and after-sun cream. | Column capillary HP5 (30 m × 0.25 mm i.d., 0.25 μm) | MS | [64]/2010 |
| Allergens | Perfumes, post-depilation mousse, deodorant, and cream samples (body creams, sun creams, and hand creams) | DB-VRX (20 m × 0.18 mm, 1 μm) | MS | [65]/2010 |
| Preservatives | Makeup remover gel, mouthwash solution, and hair gel. | HP-5MS (30 m × 0.25 mm i.d., 0.1 μm). | MS | [66]/2009 |
| Preservatives | Emulsion, body lotion, and body cream. | DB-5MS (30 m × 0.25 mm i.d., 0.25 μm) | MS | [67]/2010 |
| Preservatives | Bath gel, baby cream, body lotion, nail strengthening cream, shower gel, shampoos, conditioners, and deodorants. | Columns: RtxR 5 amine (30 m × 0.25 mm × 0.5 μm); RxiR-5Sil MS (20 m × 0.18 mm × 0.36 μm); SLBTM-5ms (20 m × 0.18 mm × 0.36 μm); 190-91S HP5-MS (30 m × 0.25 mm × 0.25 μm) | MS/MS | [68]/2013 |
| Preservatives | Body creams, baby creams, moisturizing cream, deodorants, sunscreen, baby after-sun, moisturizing lotion, makeup, and eye makeup remover. | TG-5 SILMS (30 m × 0.25 mm i.d., 0.25 μm) | MS/MS | [69]/2014 |
| Phthalates and Parabens | Hair sprays, perfumes, deodorants, creams, and lotions | HP-5MS (30 m × 0.25 mm i.d., 0.25 μm). | MS | [44]/2007 |
| Solvents and Actives | Nail products | Restek Rtx® 5 amine (30 m × 0.25 mm, 0.5 μm) Phenomenex ZB-SemiVolatiles (30 m × 0.25 mm, 0.25 μm). | MS | [22]/2016 |
| Solvents | Nail products | HP-INNOWax (30 m × 0.32 mm i.d., 0.25 μm); Restek Rtx-225 column (30 m × 0.32 mm i.d., 0.25 μm) | FID MS | [70]/2011 |
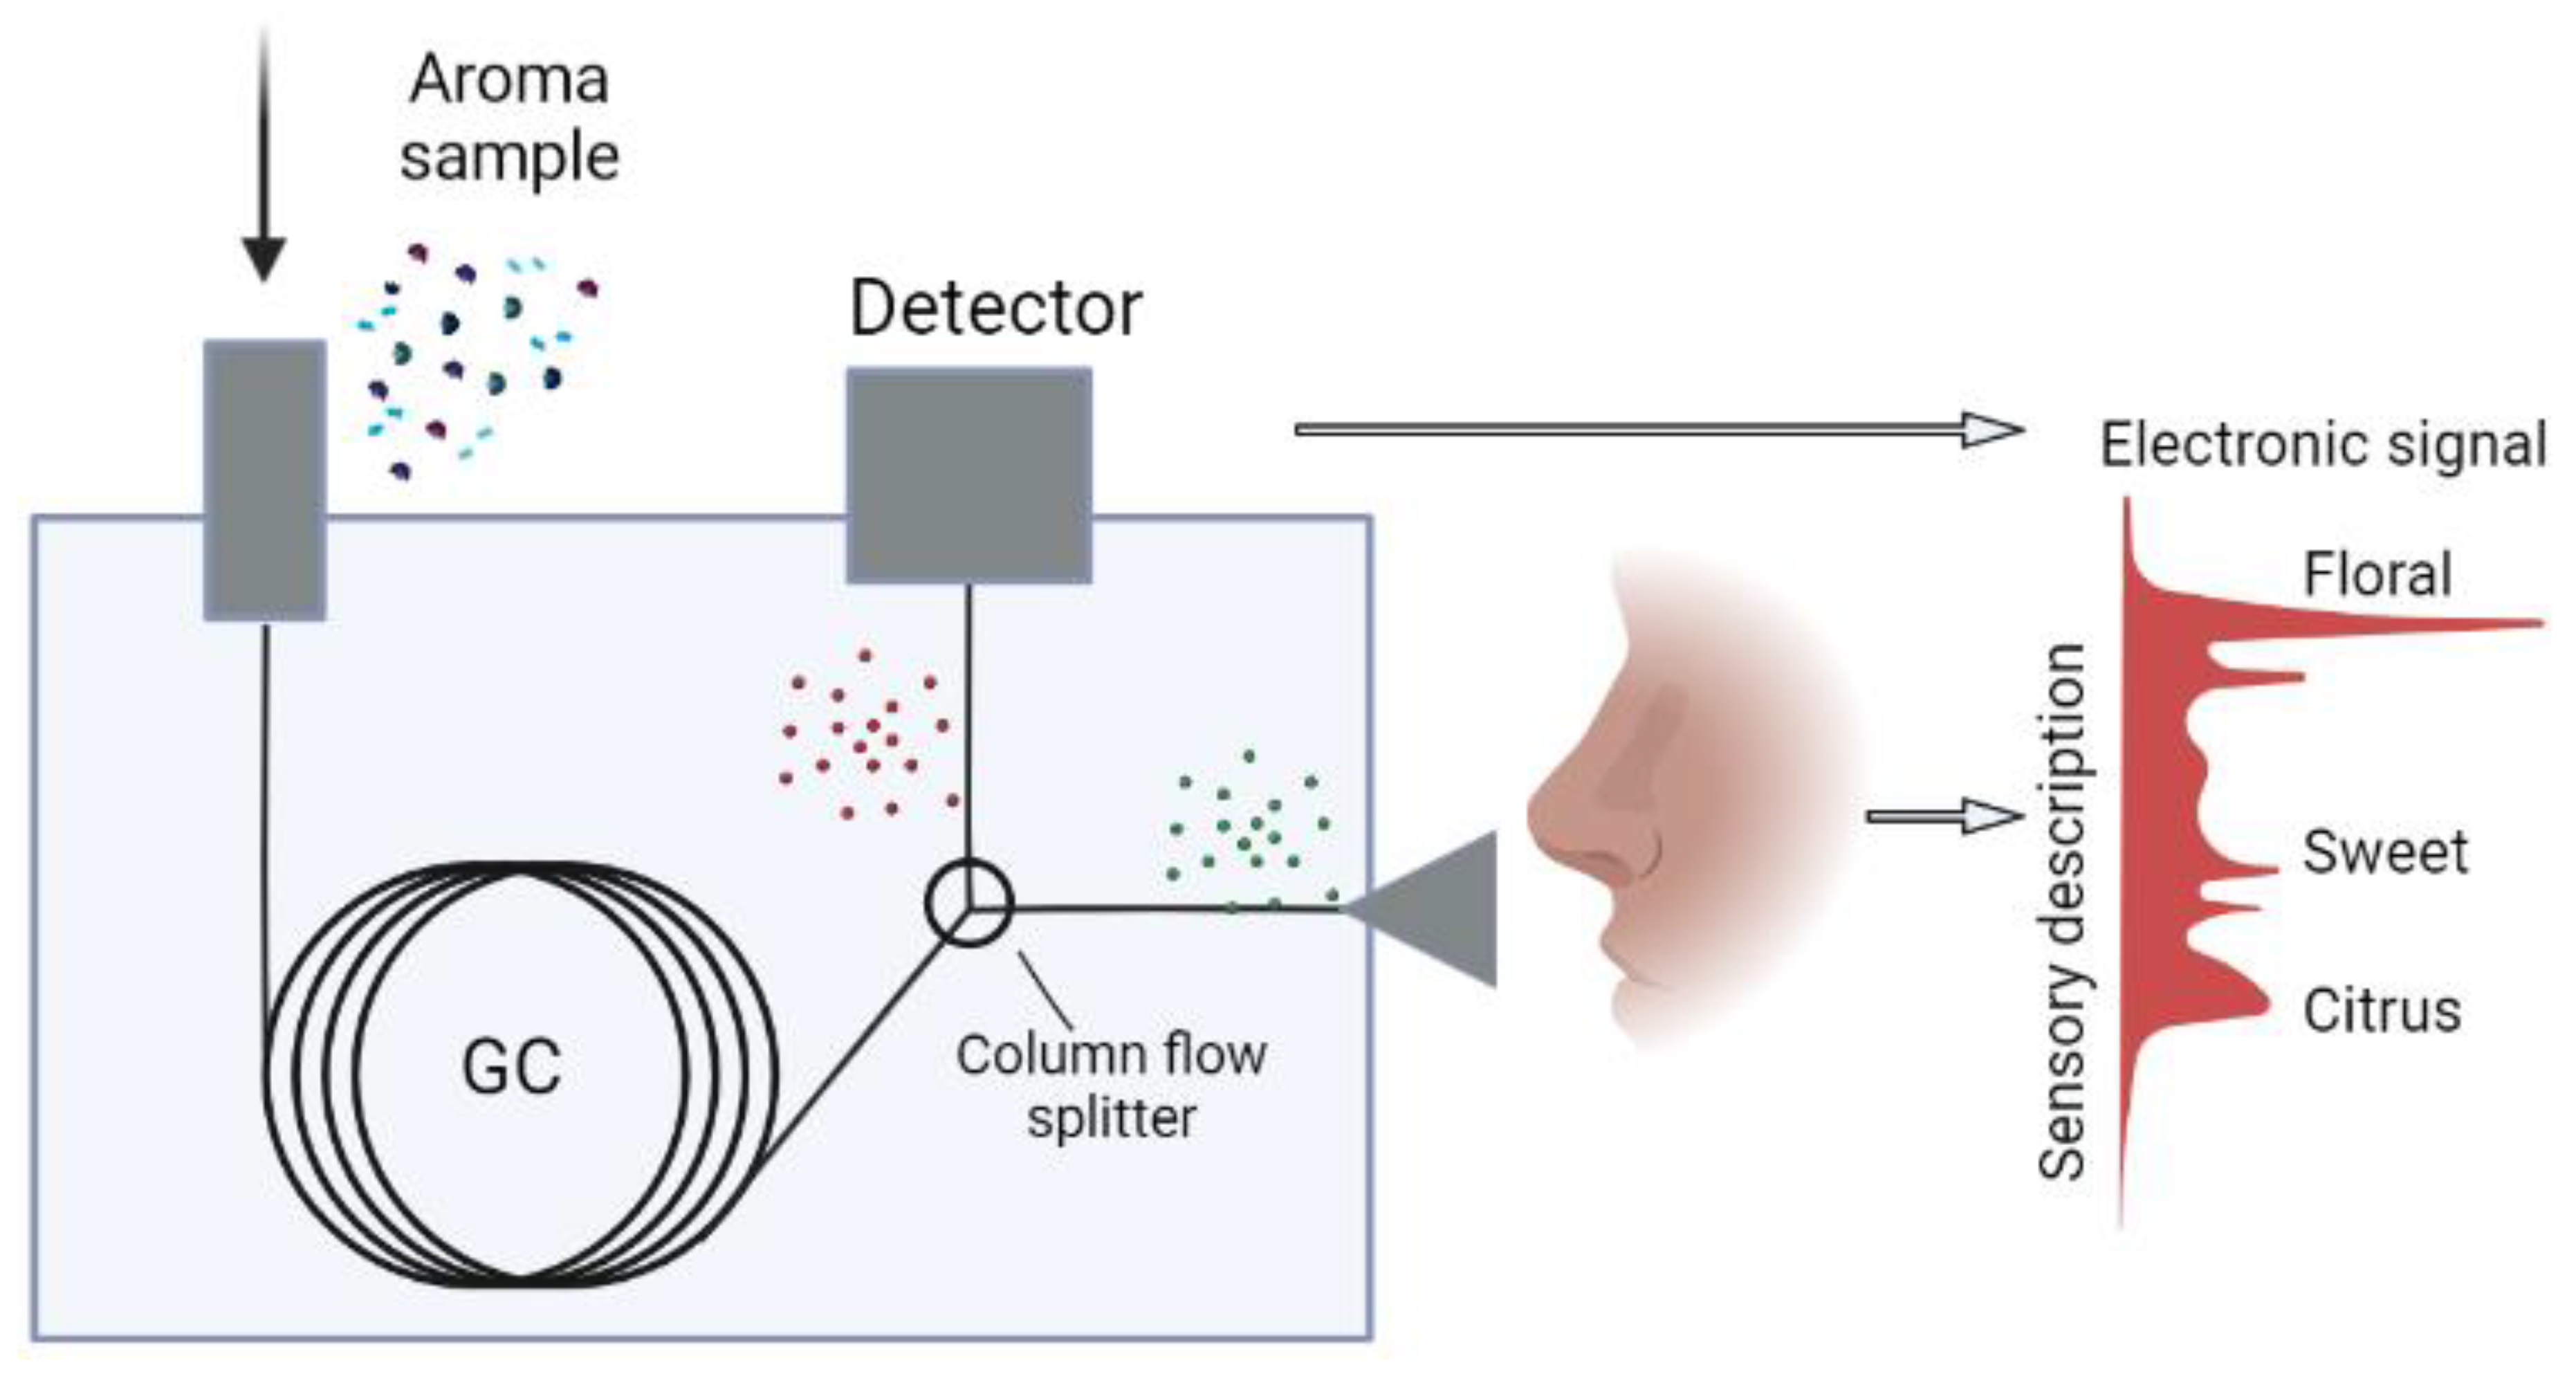
4. Olfactometry and Electronic Nose
- Sample preparation;
- Component separation;
- Detection of olfactorily active compounds;
- Interpretation of results.
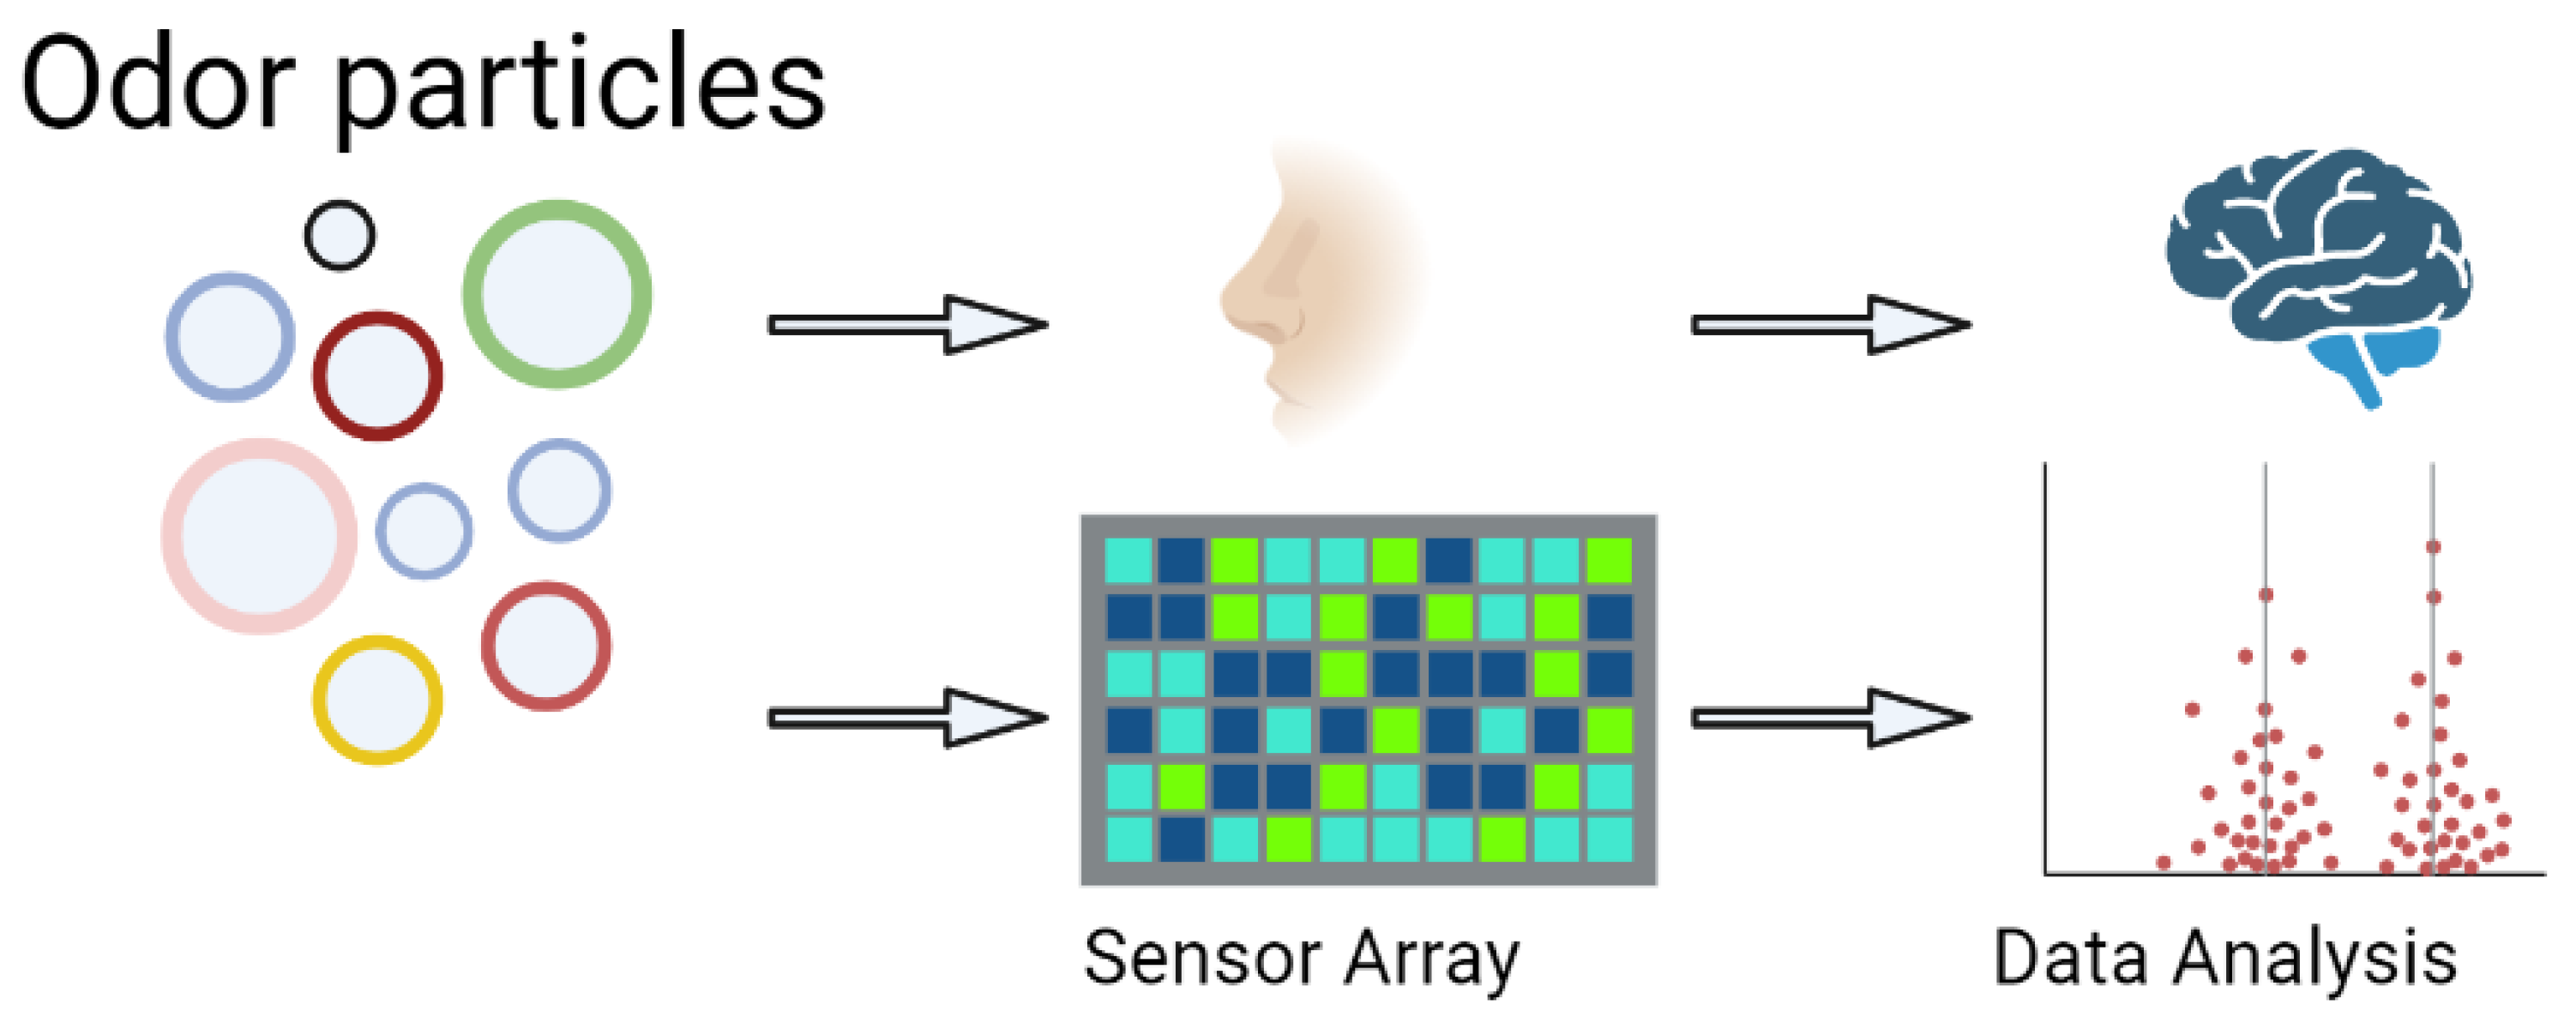
4.1. Electronic Nose
4.2. Importance of Olfactometric Analyses in the Cosmetic Industry
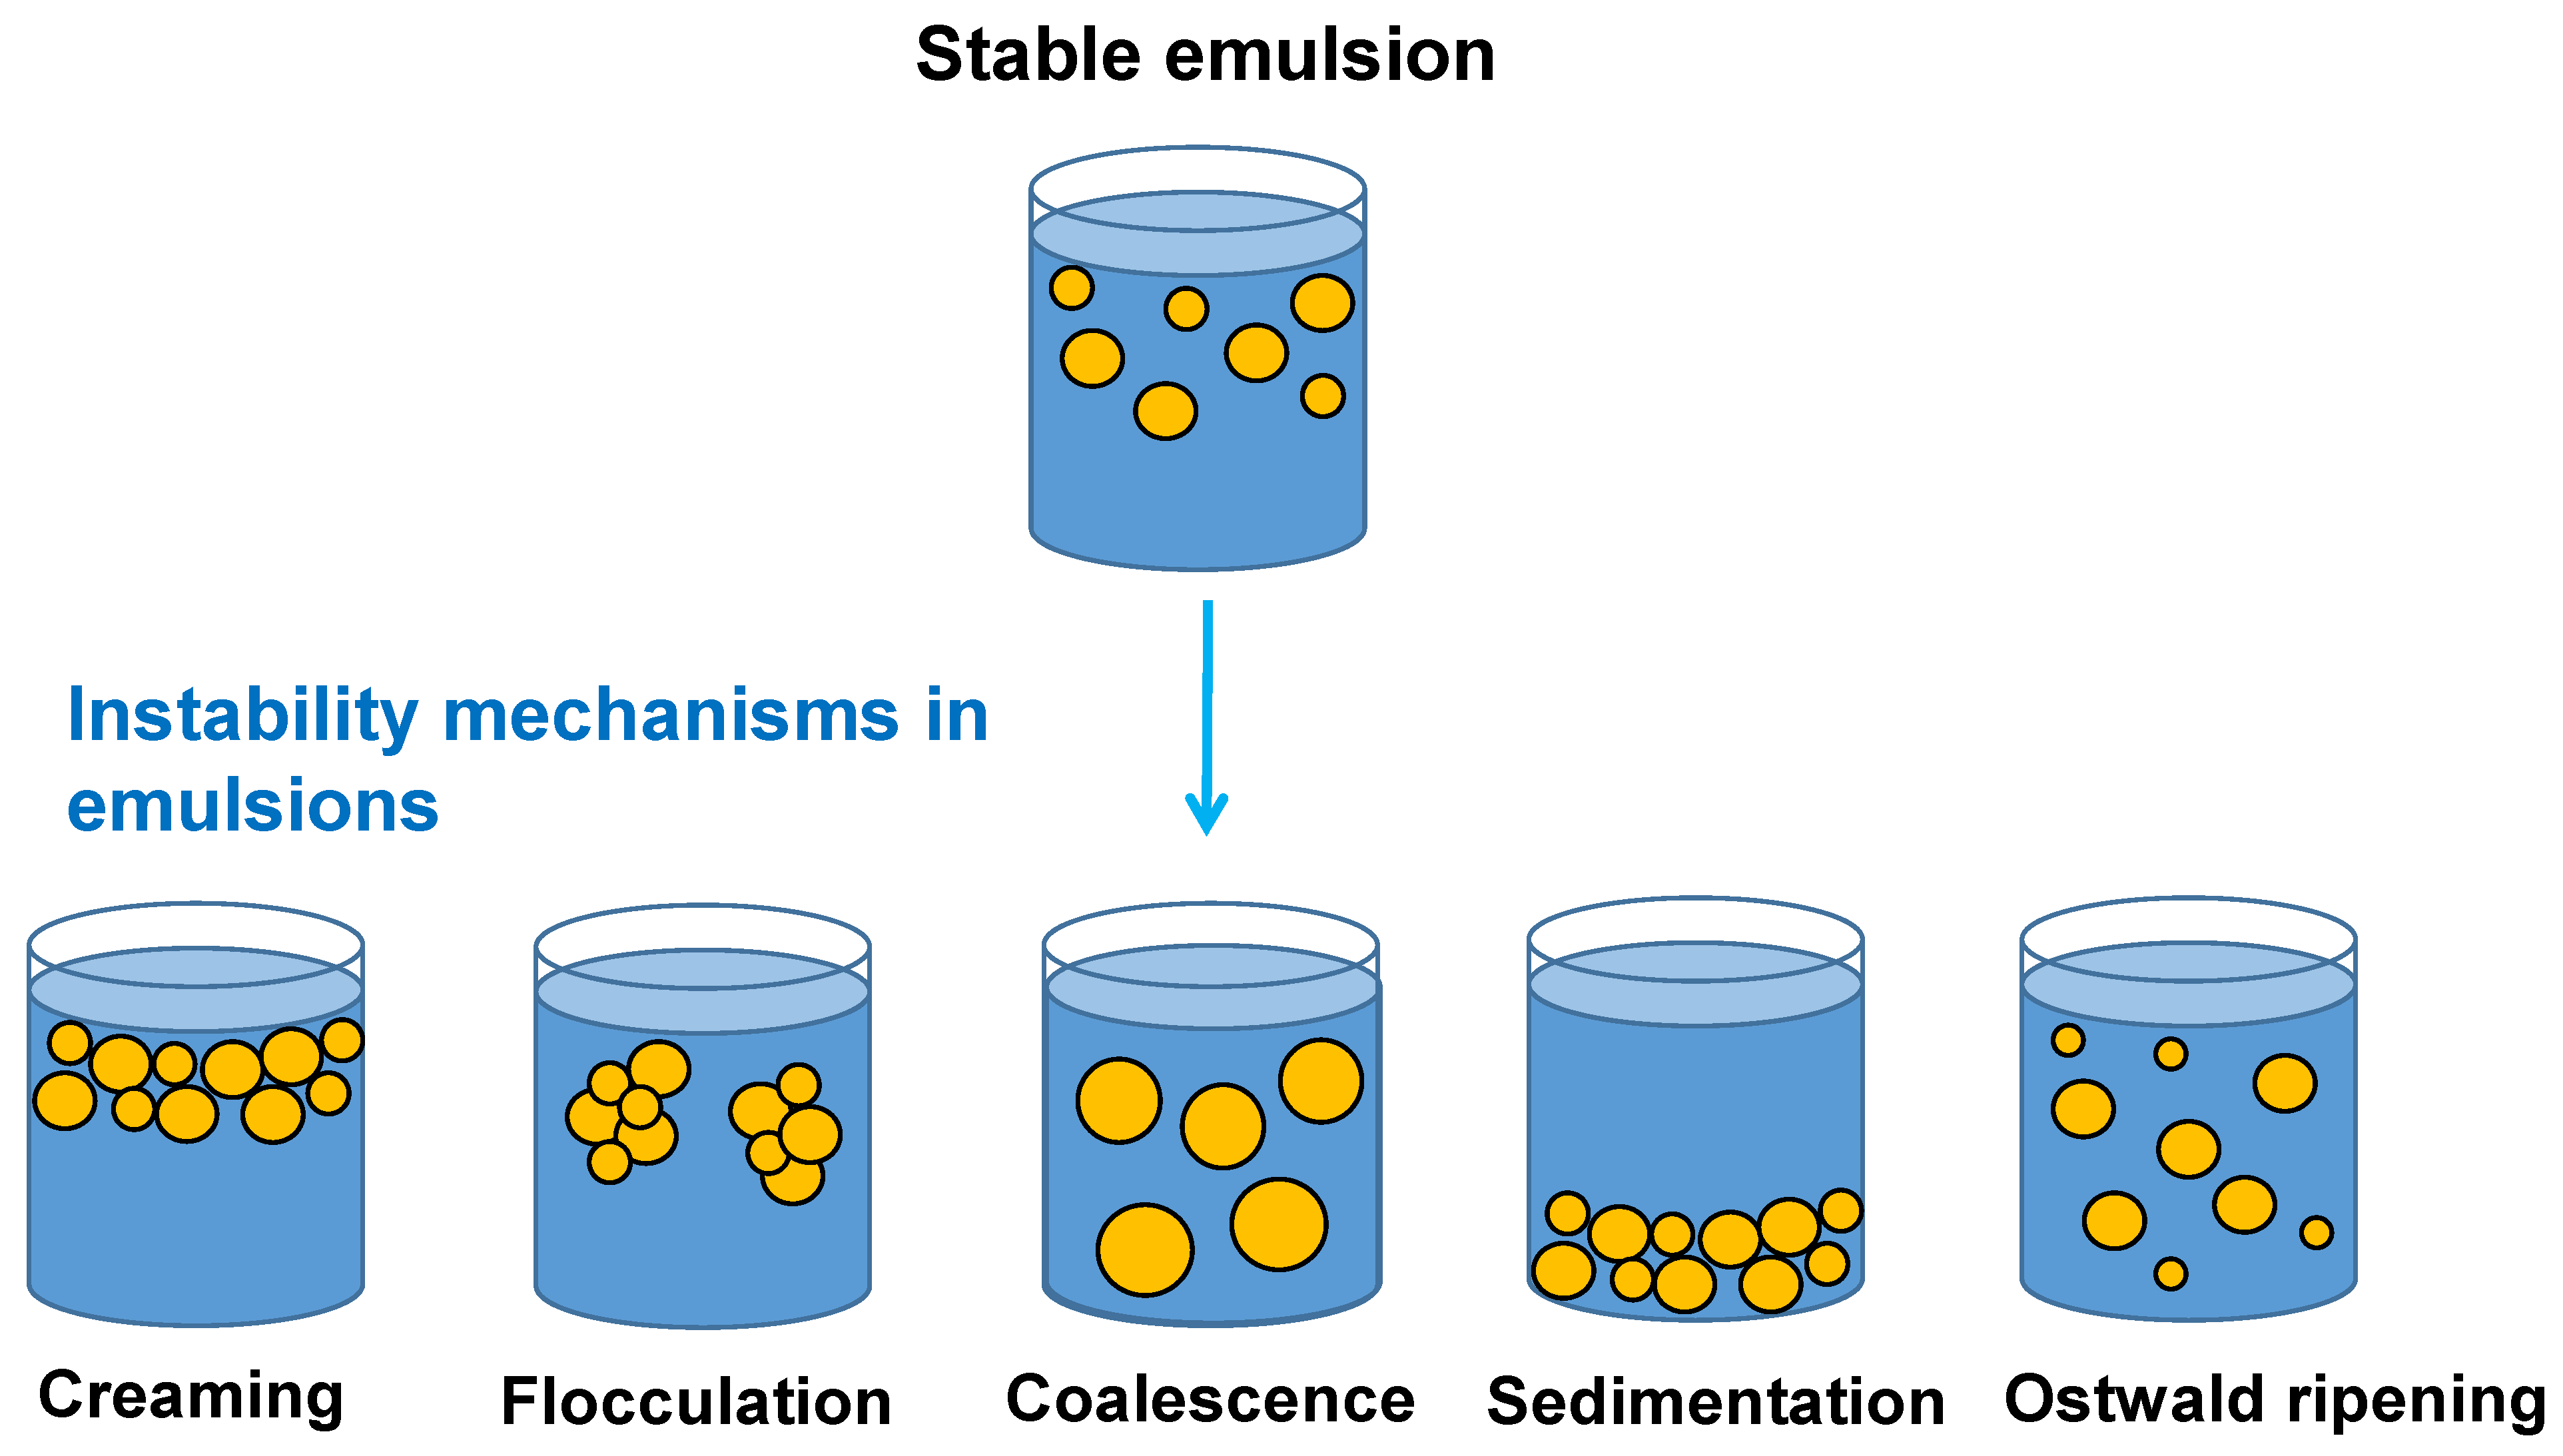
5. Characterization and Evaluation of Cosmetic Products’ Stability
- Droplet size;
- Surfactant concentration;
- Physicochemical formulation of the system (e.g., HLD value);
- Viscosity of the external phase and the type of thickener or polymer used;
- Concentration of the internal phase.
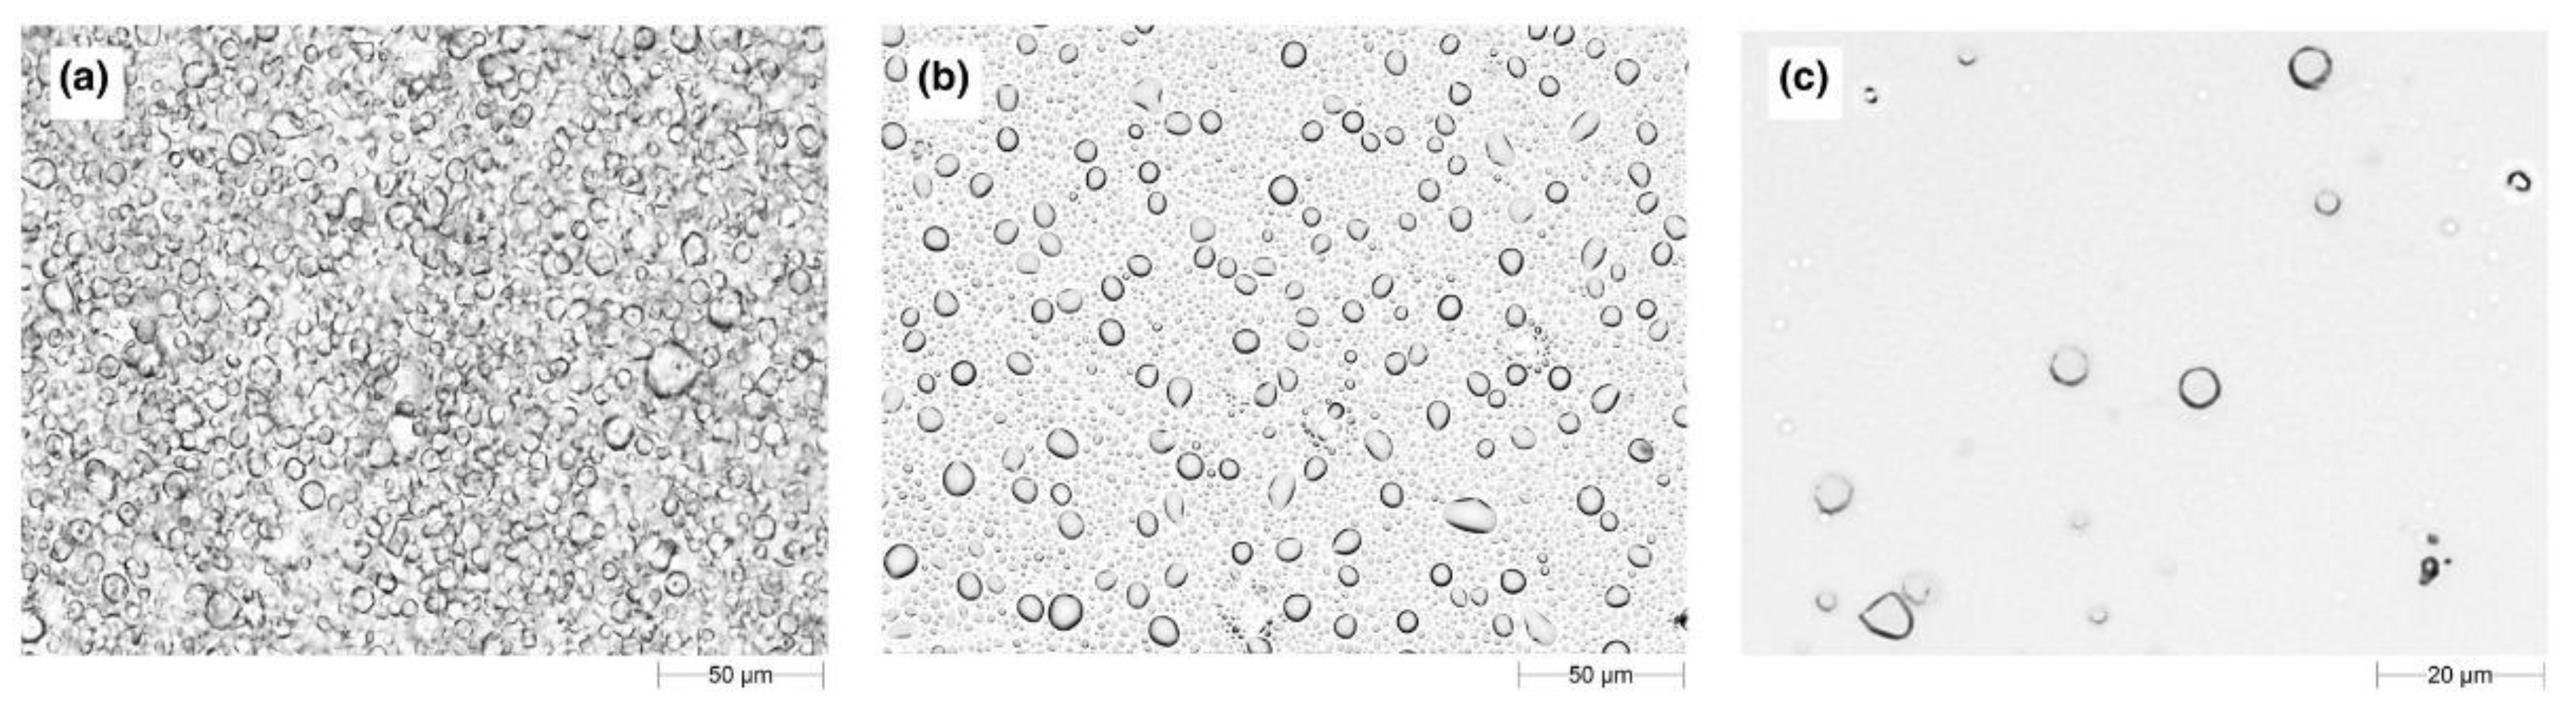
5.1. Droplet Size
5.2. Zeta Potential
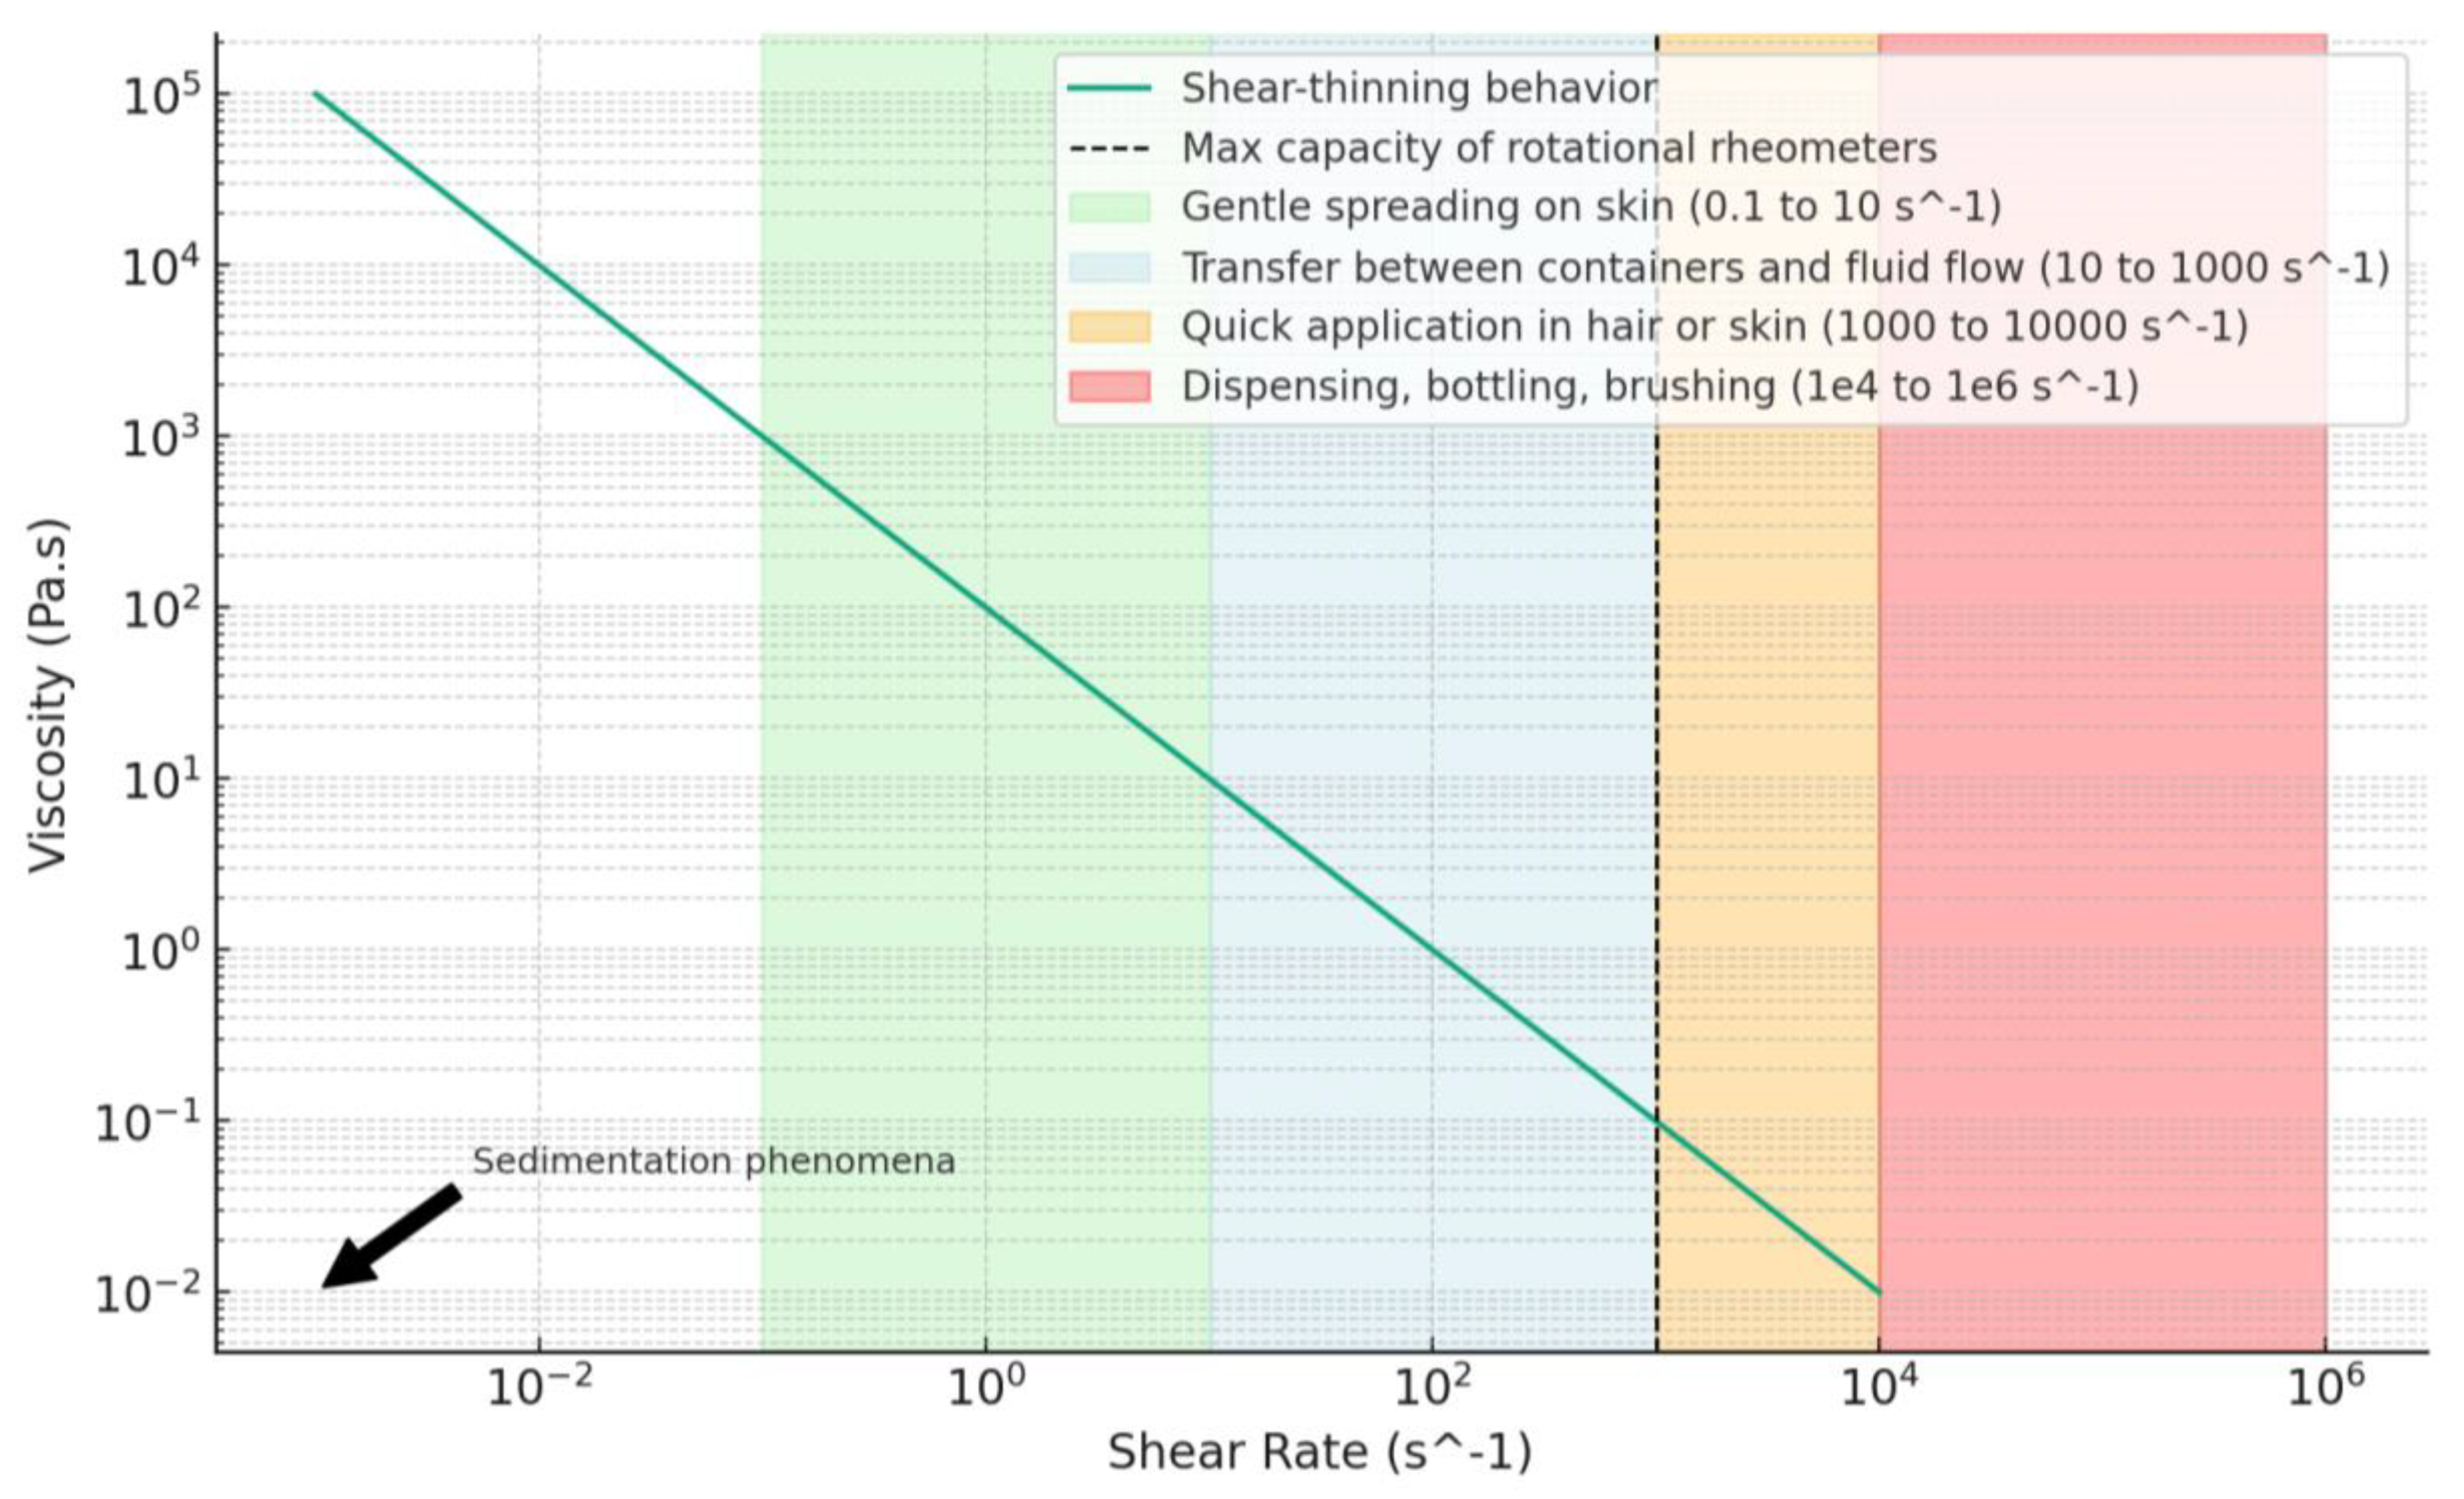
5.3. Viscosity
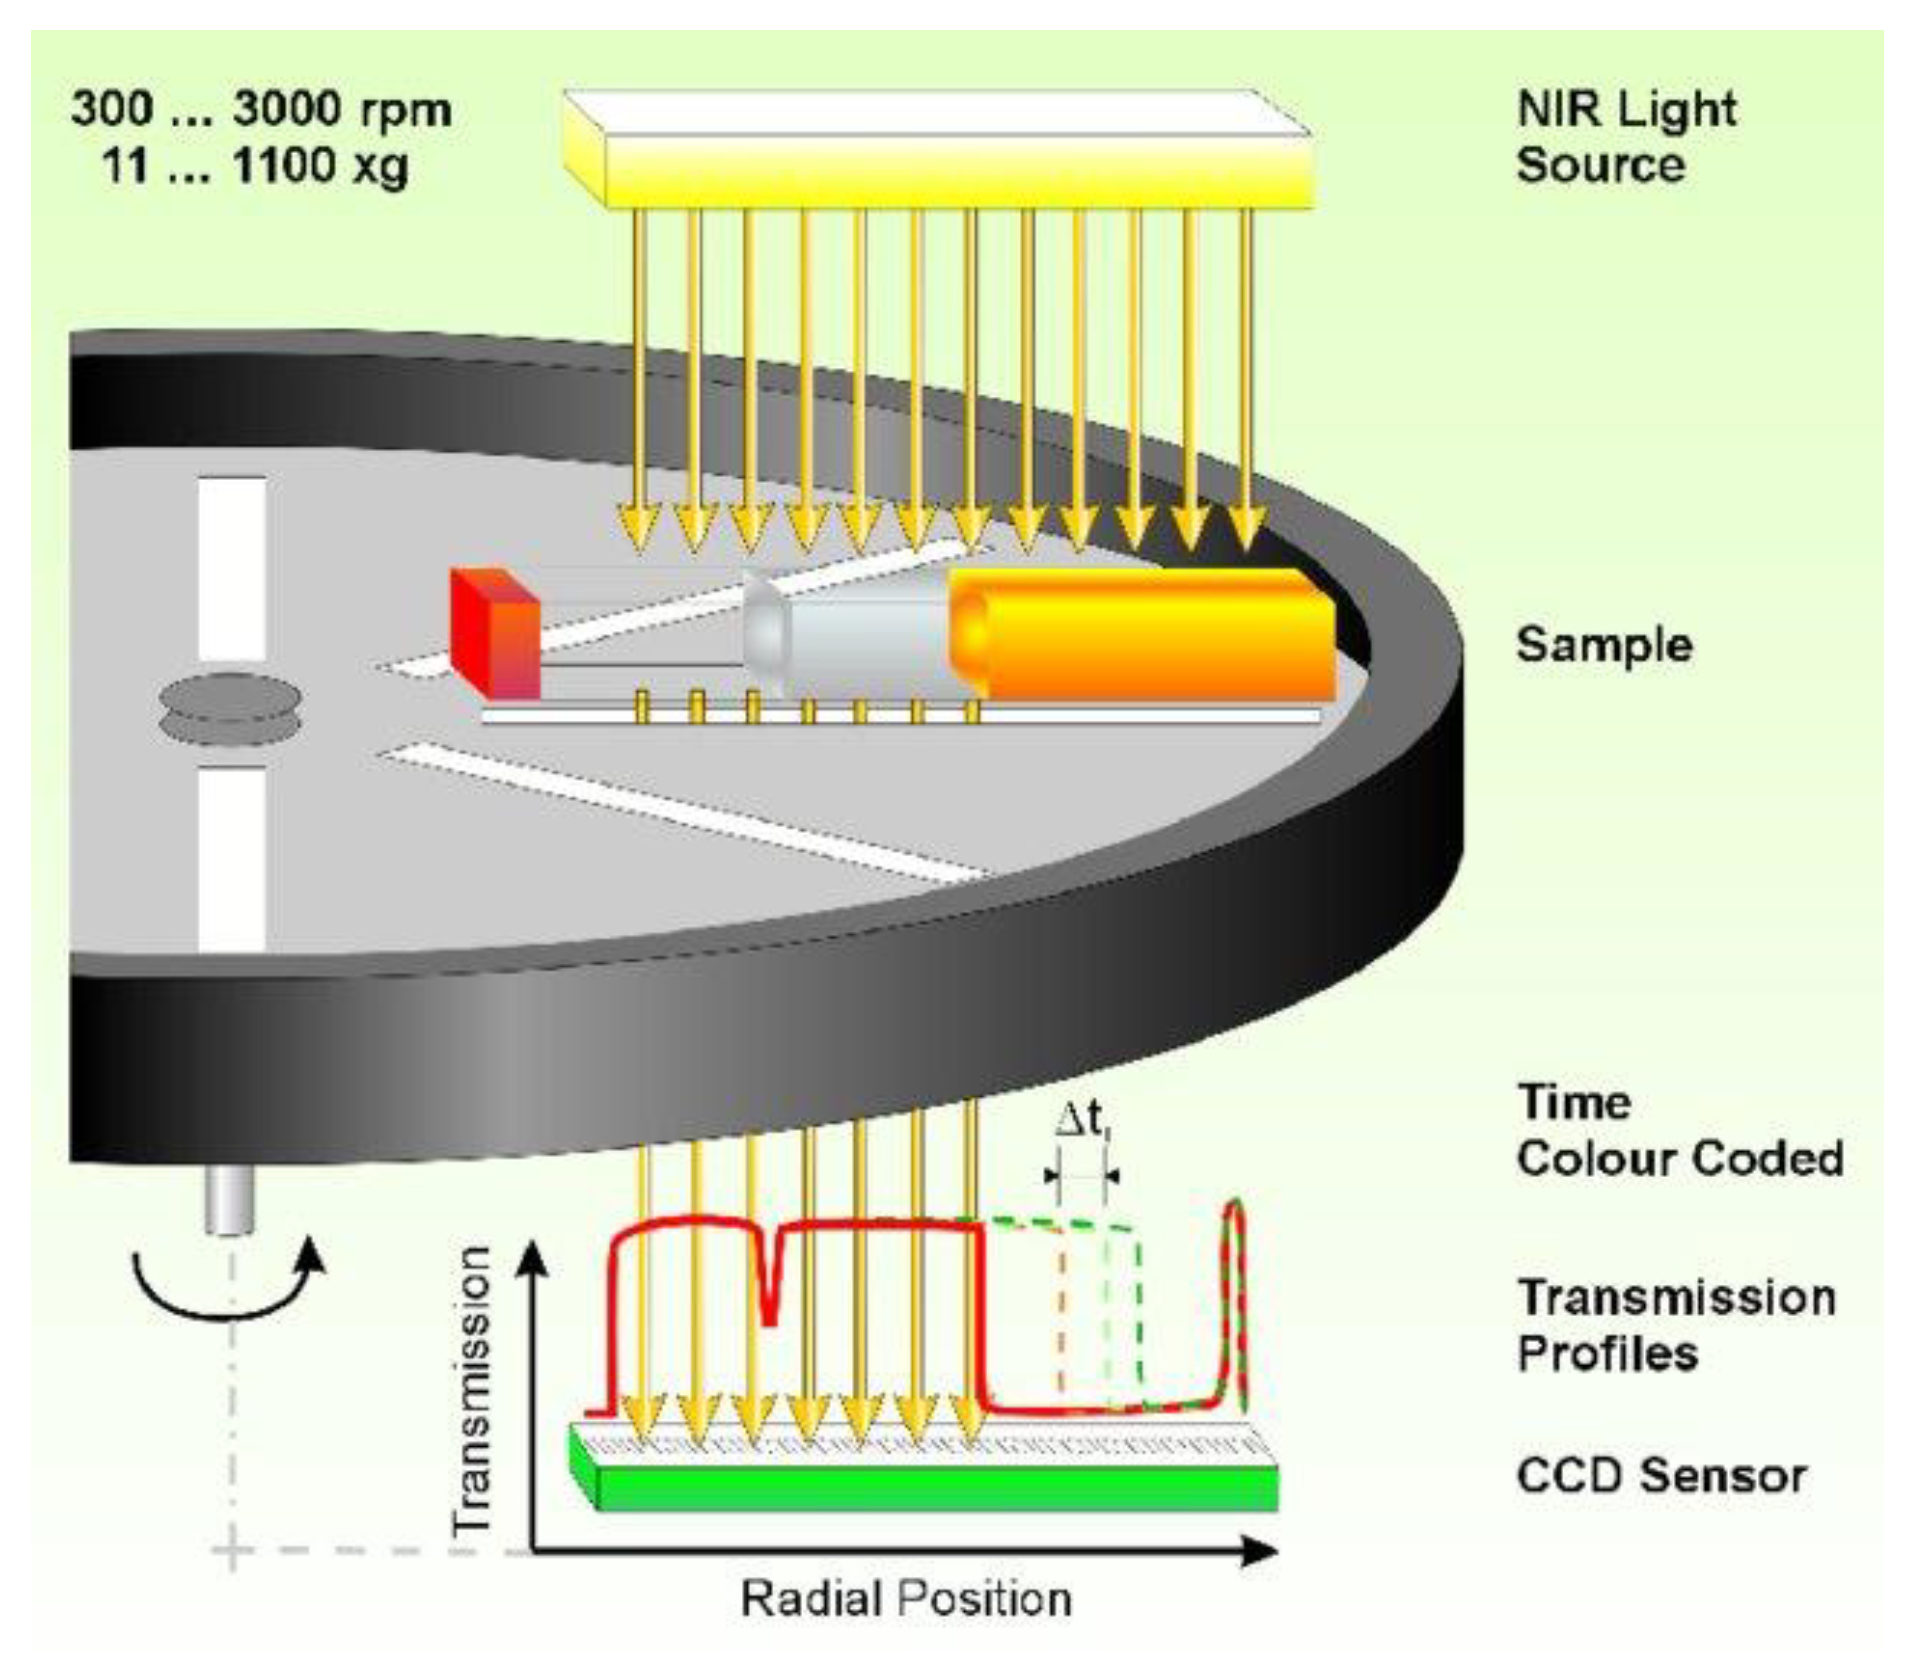
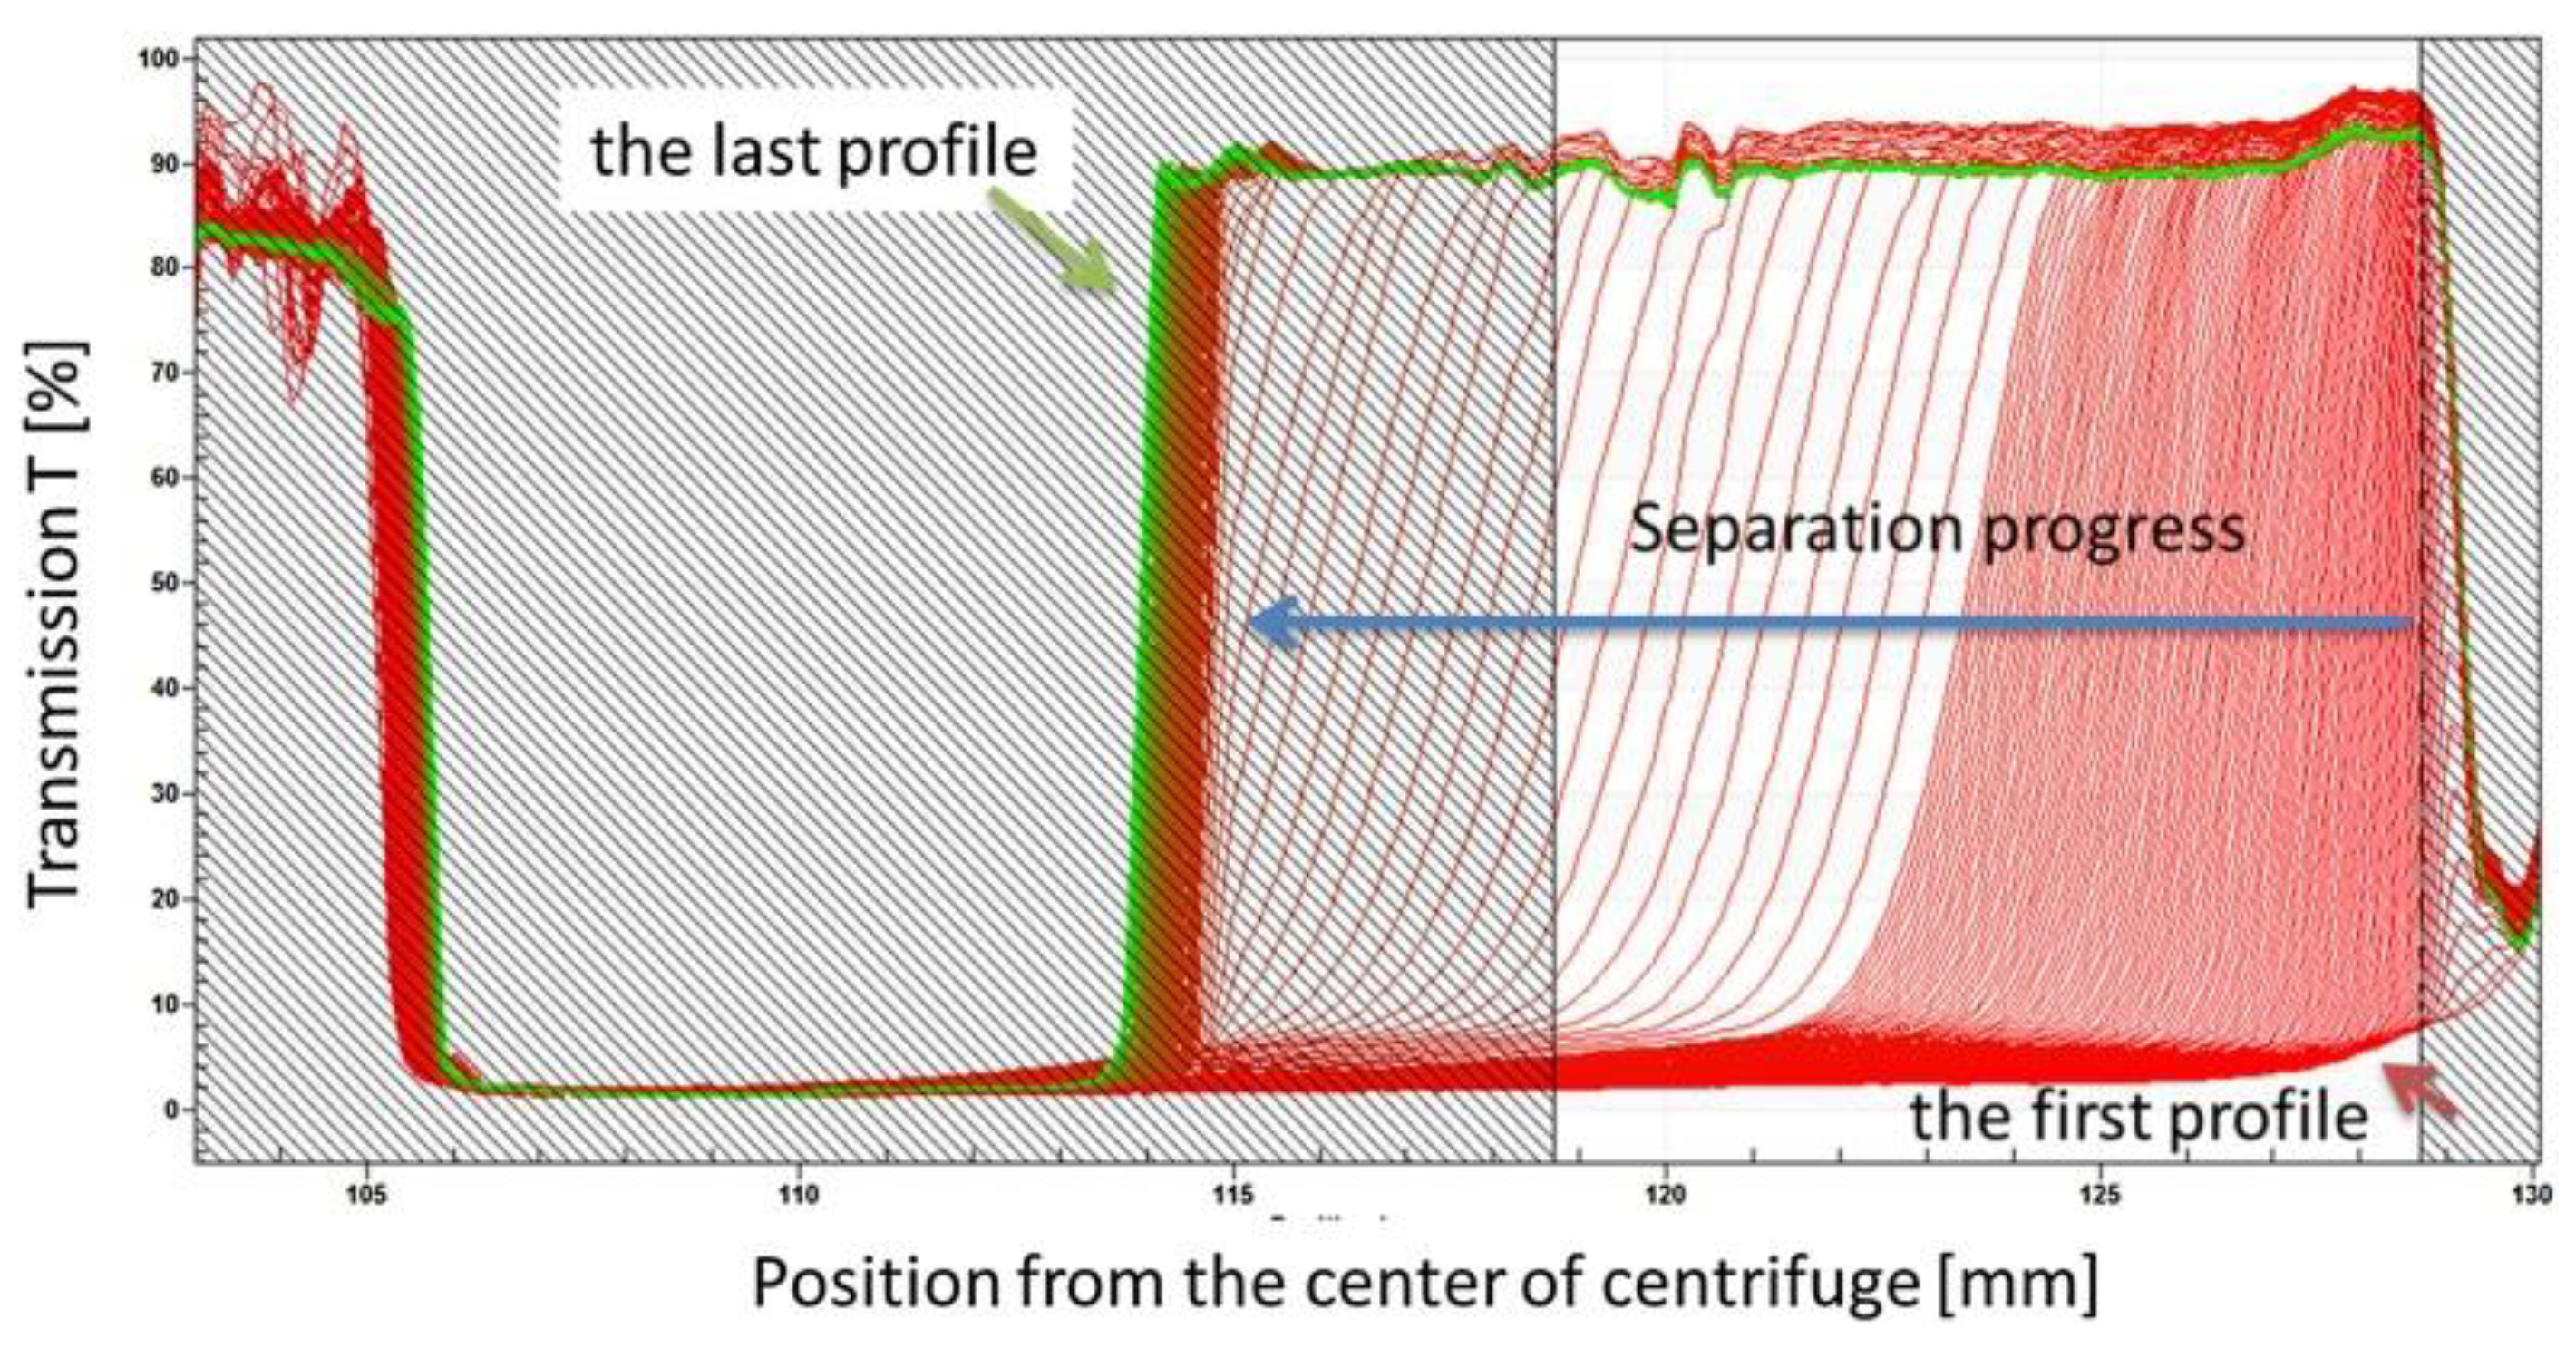
5.4. Analytical Centrifugation
| Instrument | Cell Type | Data Acquisition | Detection | Frequency | Gravitational Force | Continuous Phase | Particle Size |
|---|---|---|---|---|---|---|---|
| LUMiSizer | Cell | Transmission | STEP | 300–4000 rpm | 6–2300 g | Water, organic solvents | 10–100 μm |
| CPS DC (CPS DC24000 UHR) | Disc | Transmission | Turbidity | 500–24,000 rpm | 15–30,000 g | Water, organic solvents | 3.0 nm–10 μm |
| Brookhaven BI-DCP | Disc | Transmission | Turbidity | 500–15,000 rpm | 15–13,000 g | Water, organic solvents | 10 nm–30 μm |
| Beckman XLI | Cell | Volume | Interference | 1000–60,000 rpm | 70–250,000 g | Water, organic solvents | 1.0 nm–2.0 μm |
| AUC-UV-Vis | Cell | Transmission | UV-Vis | 1000–60,000 rpm | 70–250,000 g | Water, organic solvents | 1.0 nm–2.0 μm |

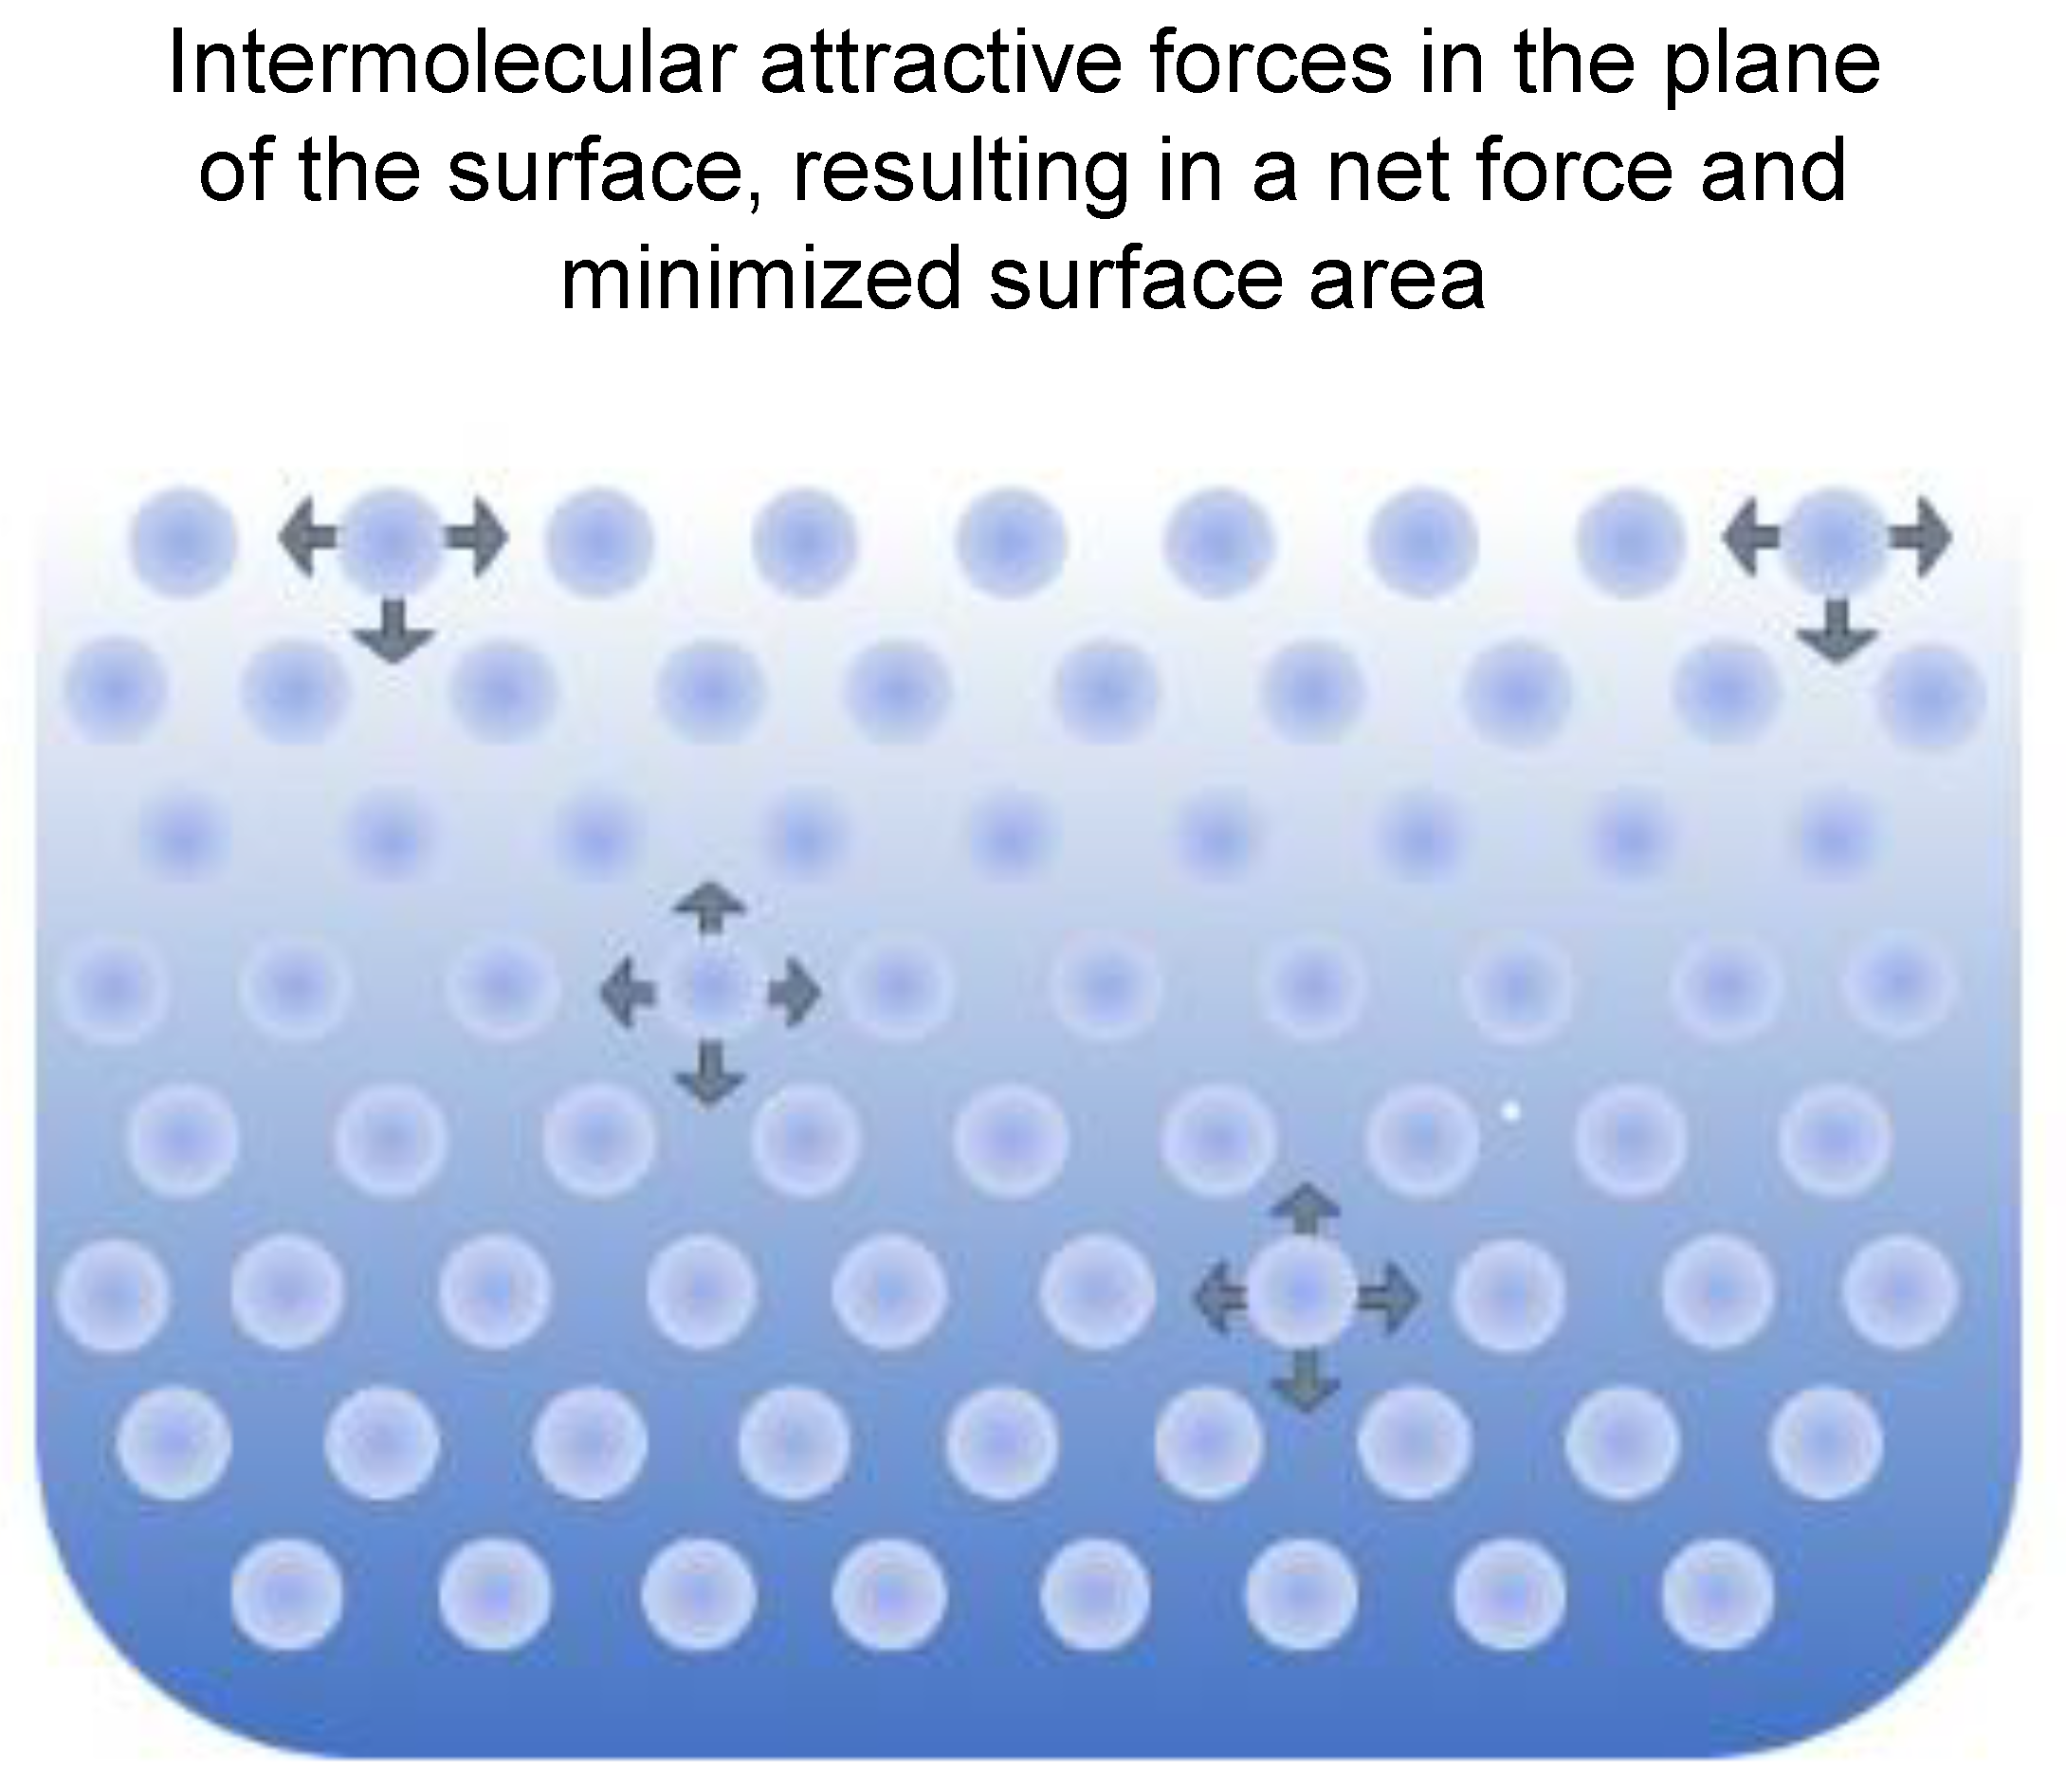
5.5. Surface and Interfacial Tension
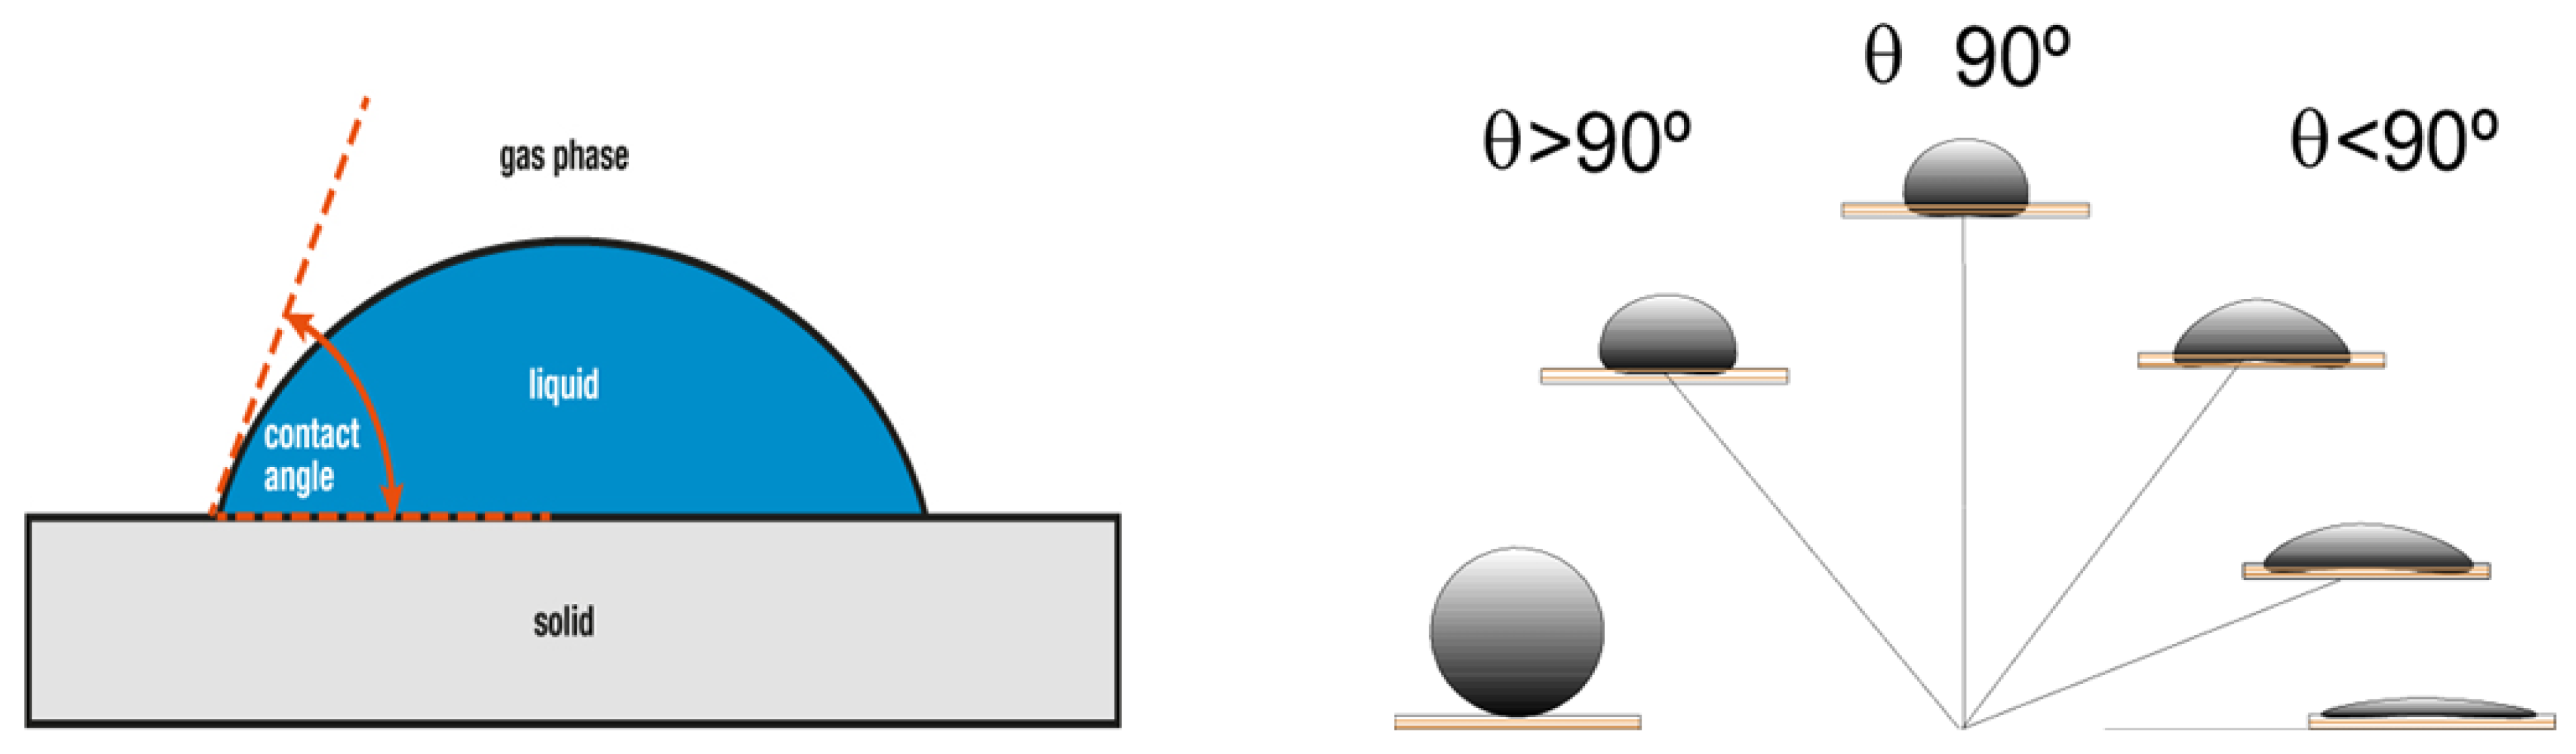
5.6. Contact Angle
6. Rheology
6.1. Principles of Rheology
6.2. Applications of Rheology in Cosmetics
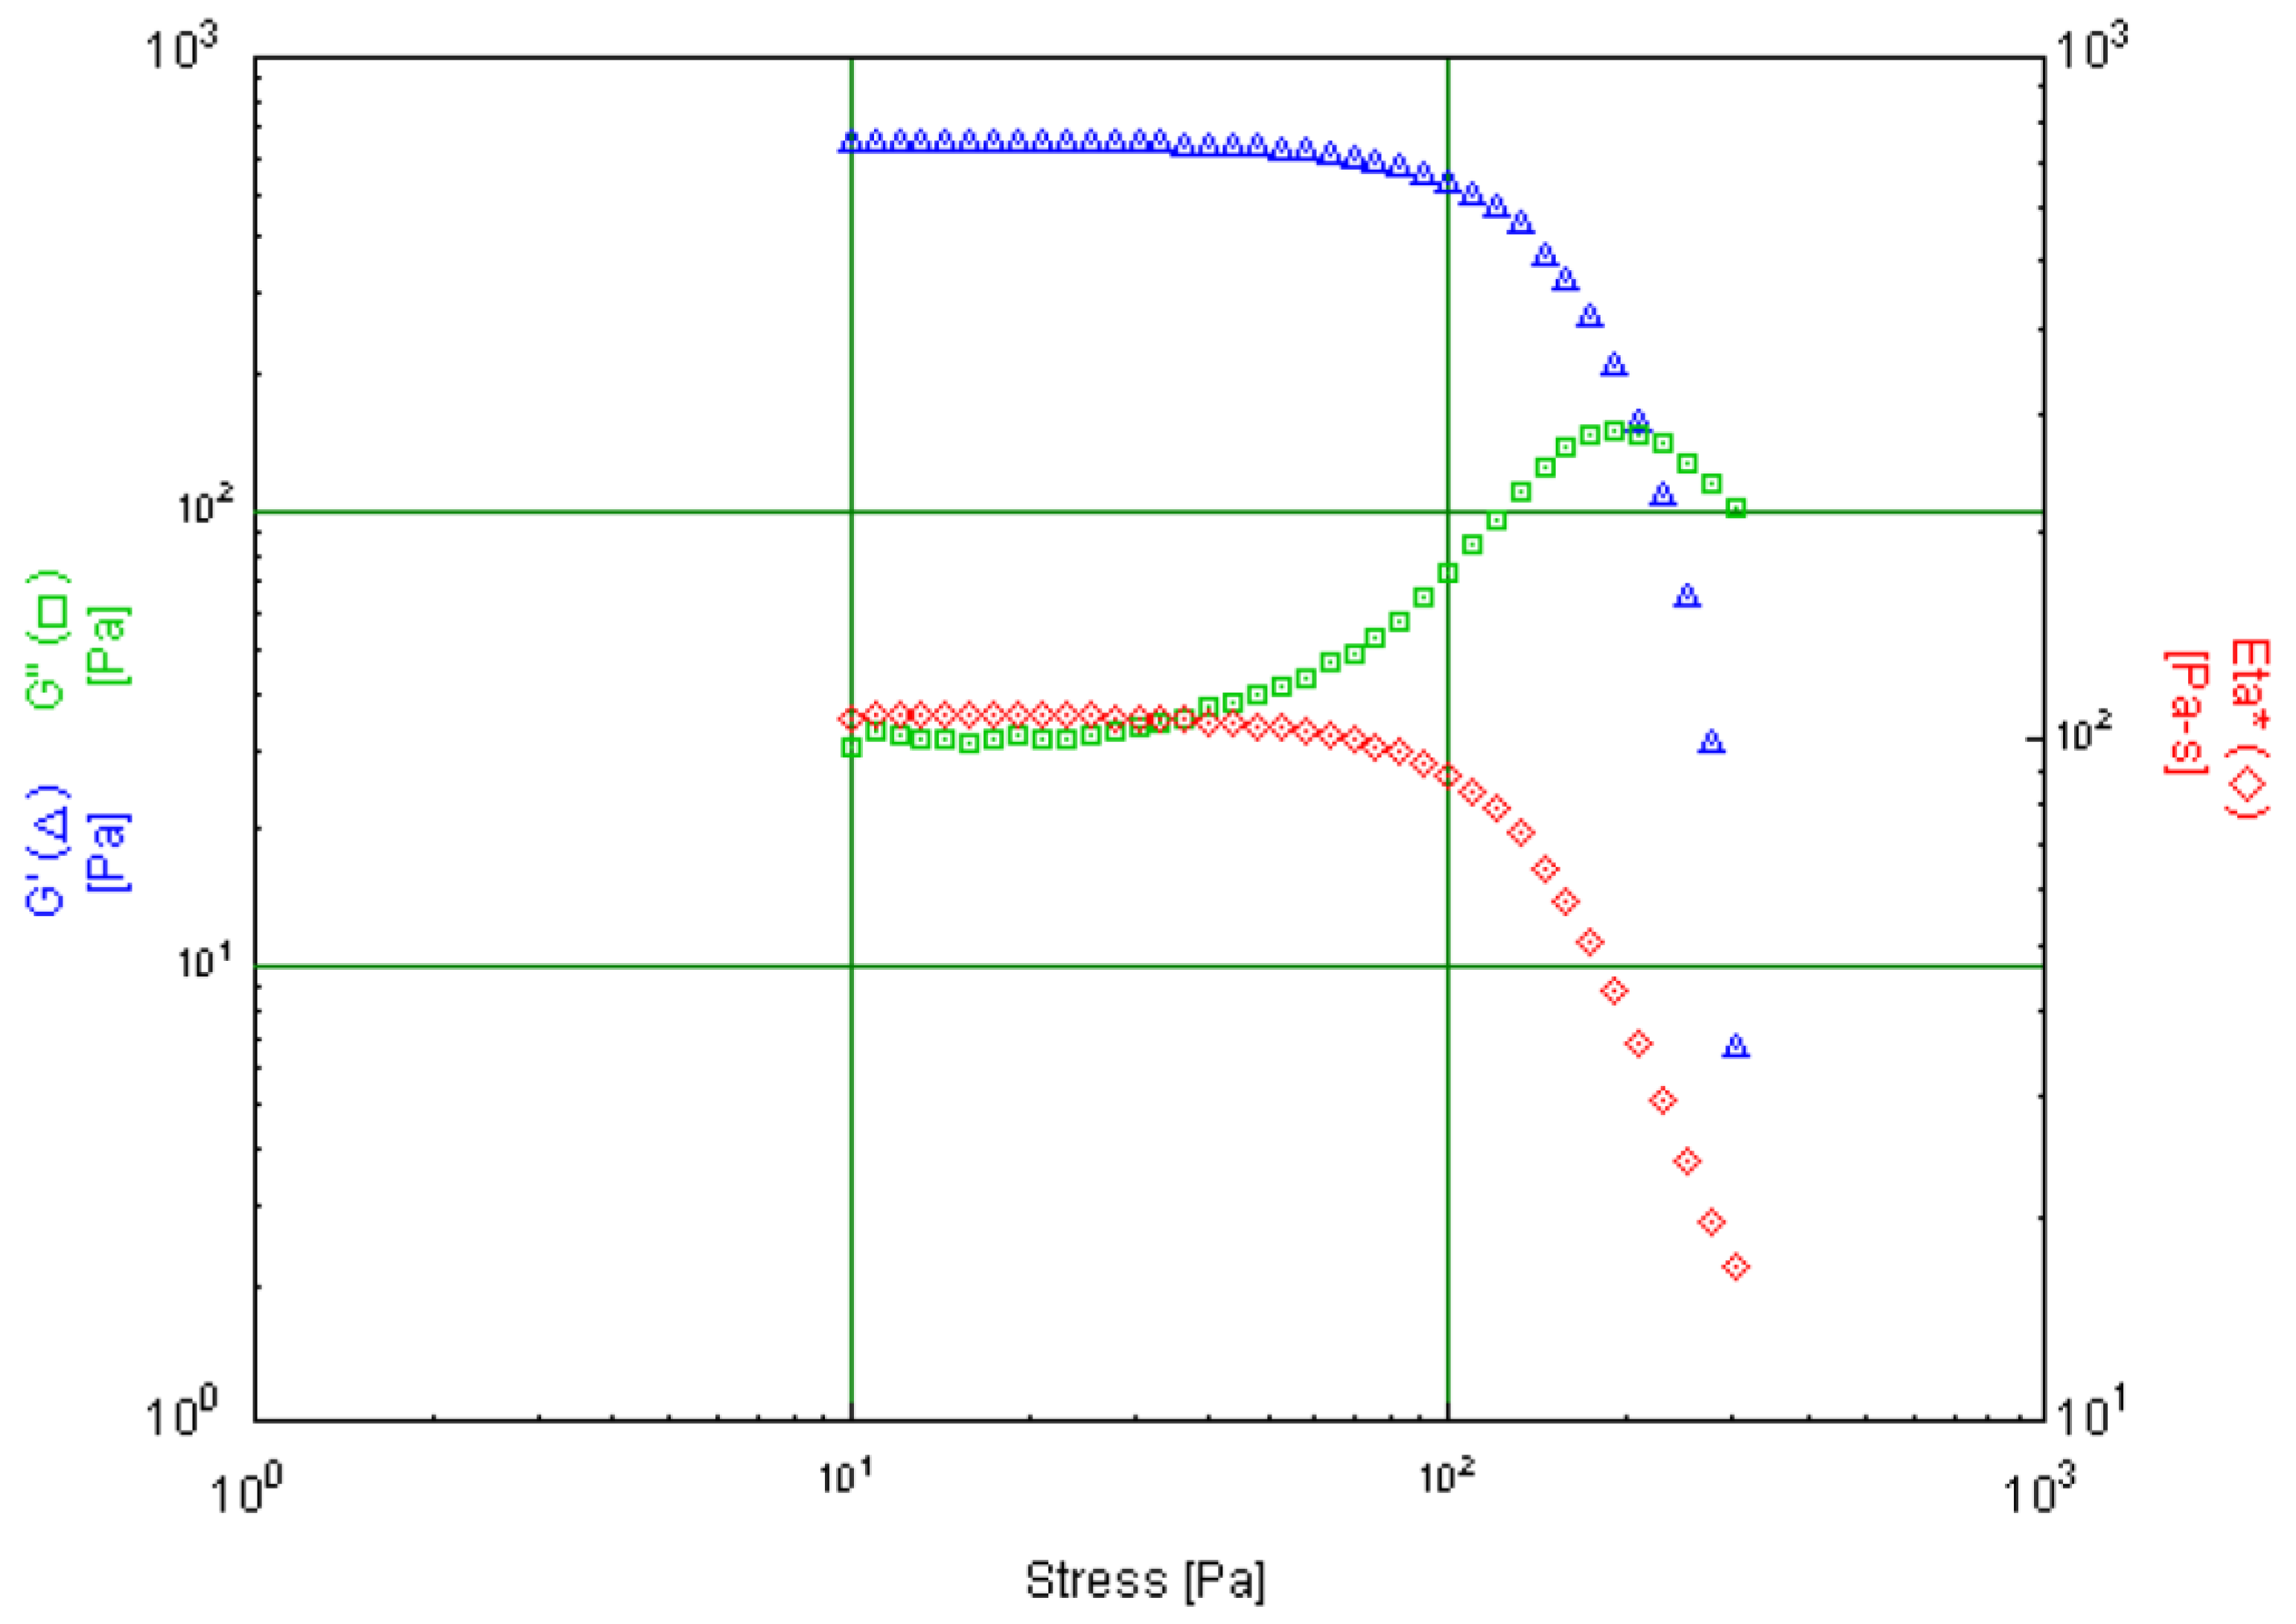
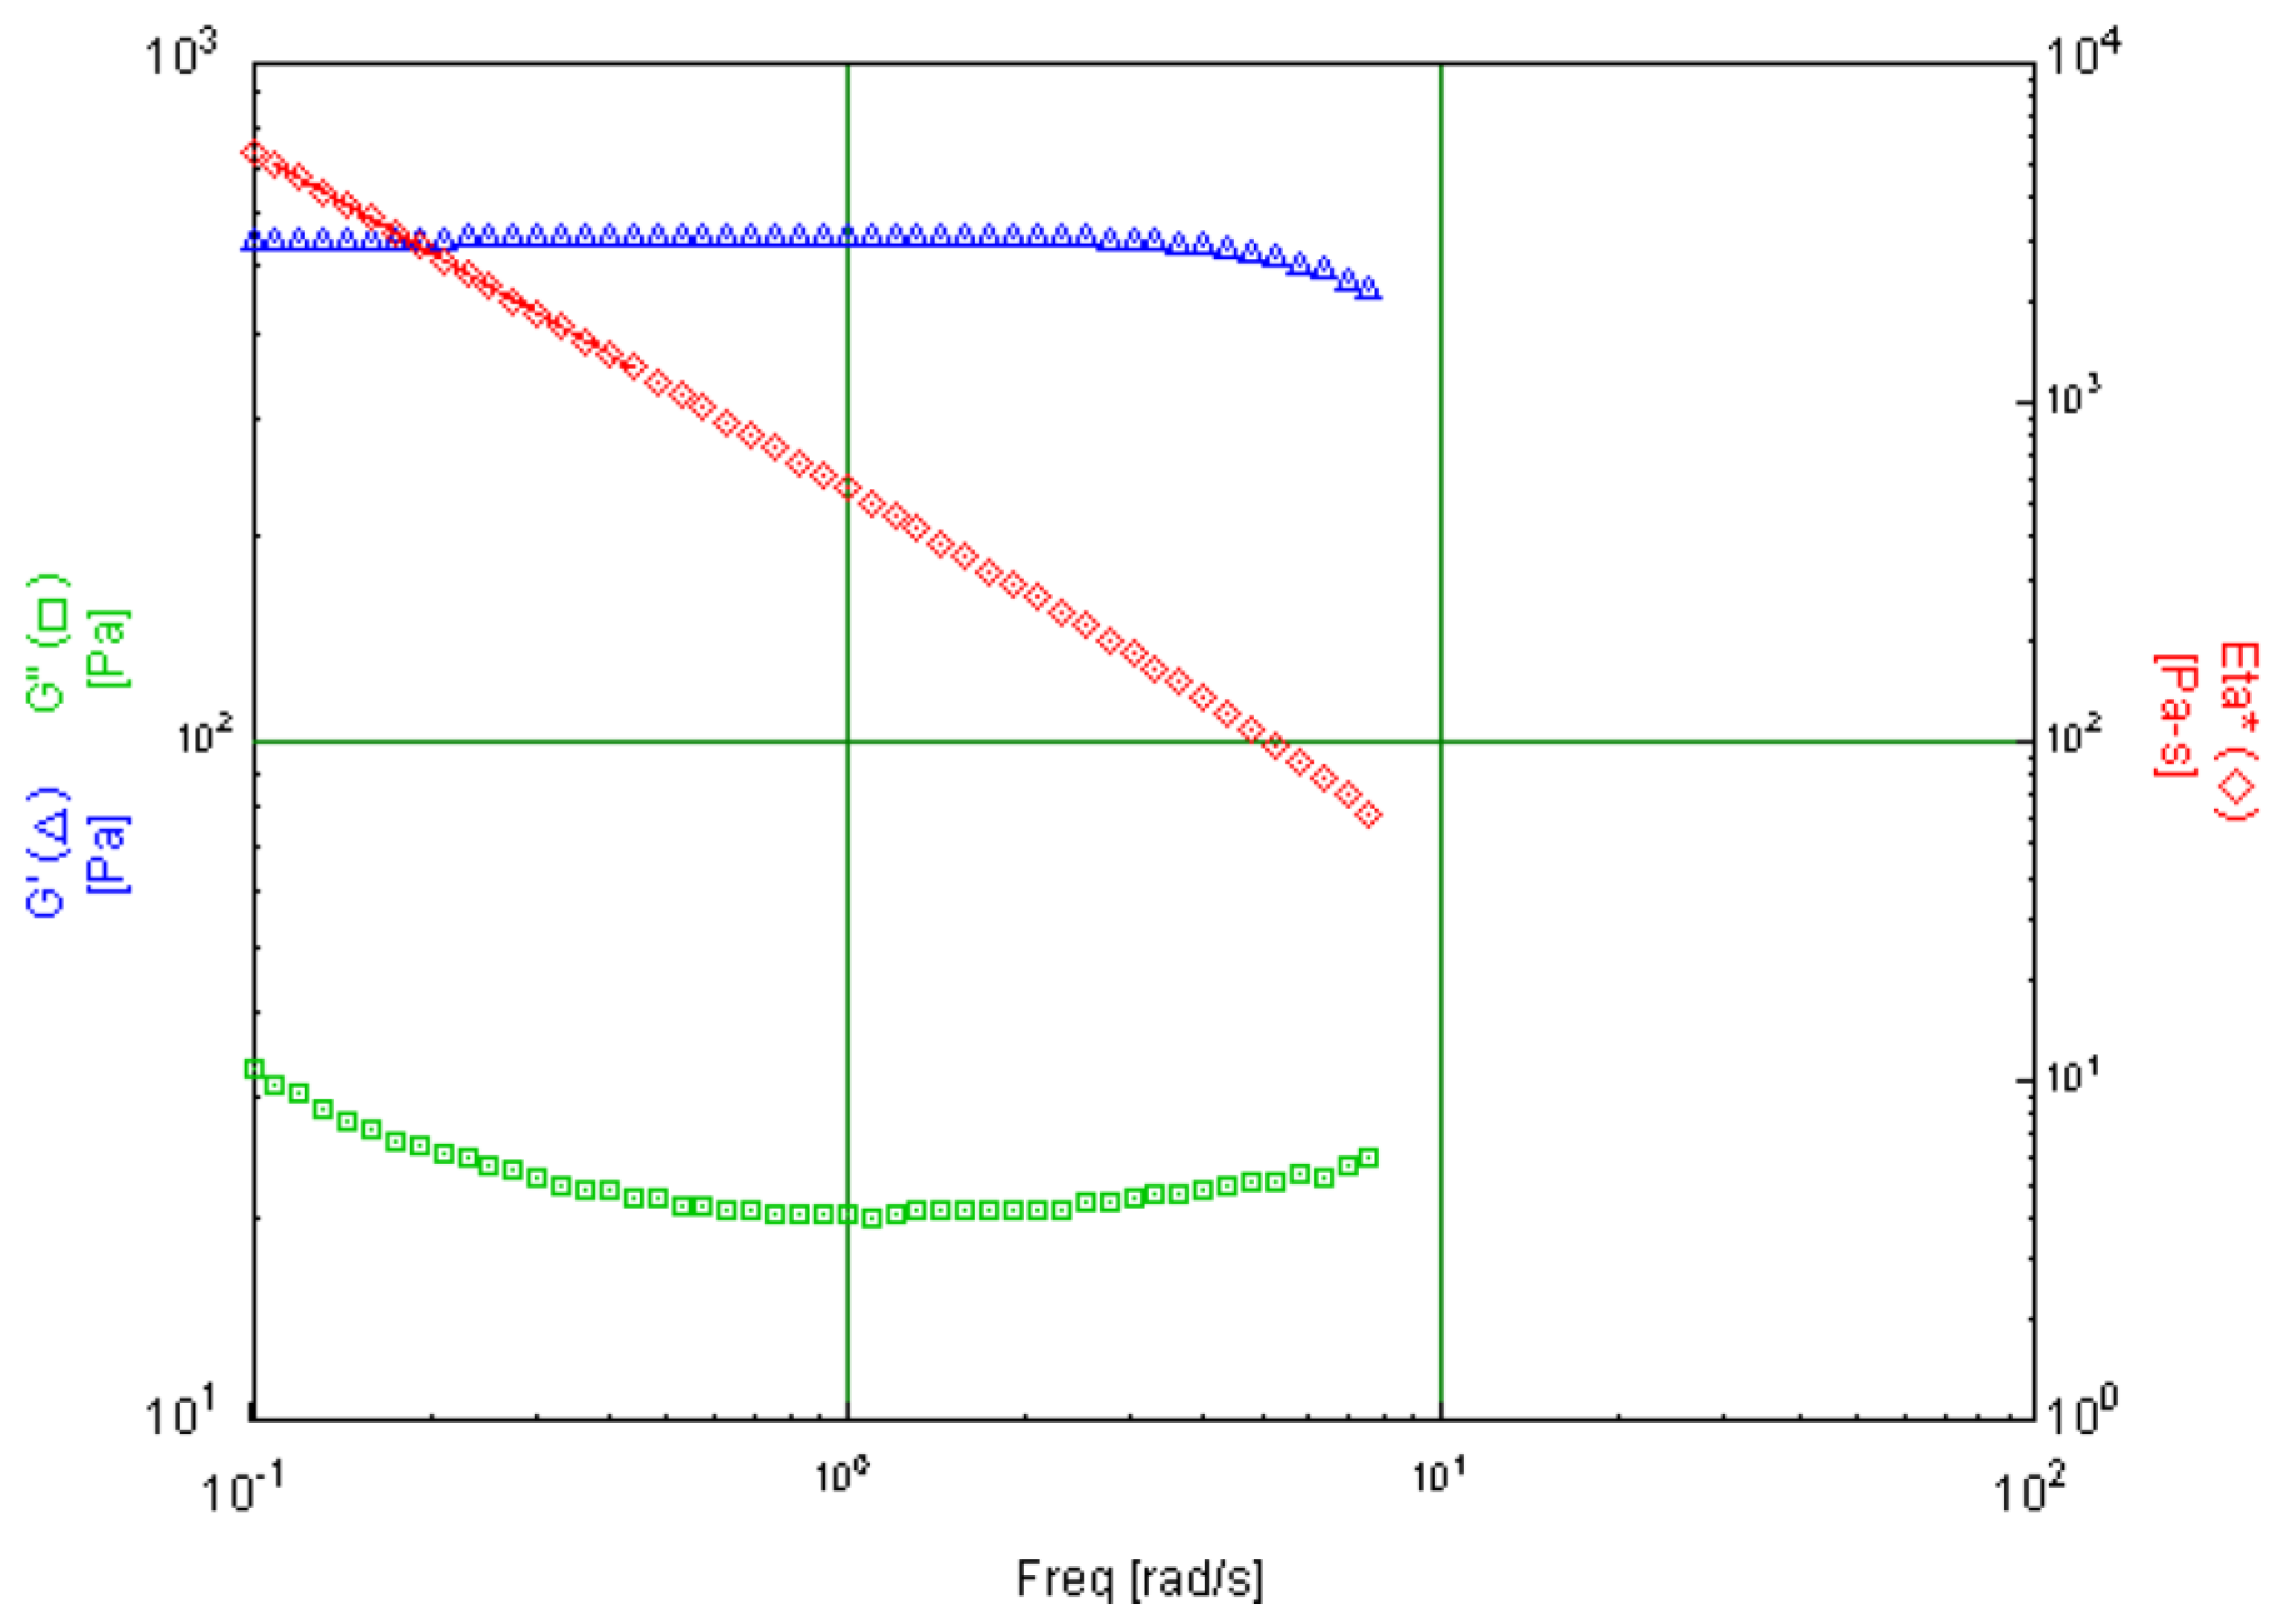
6.3. Applications of Dynamic and Oscillatory Rheology Measurements in Cosmetics
6.4. Discussion of Specific Cases
7. Colorimetric Analysis in Cosmetics
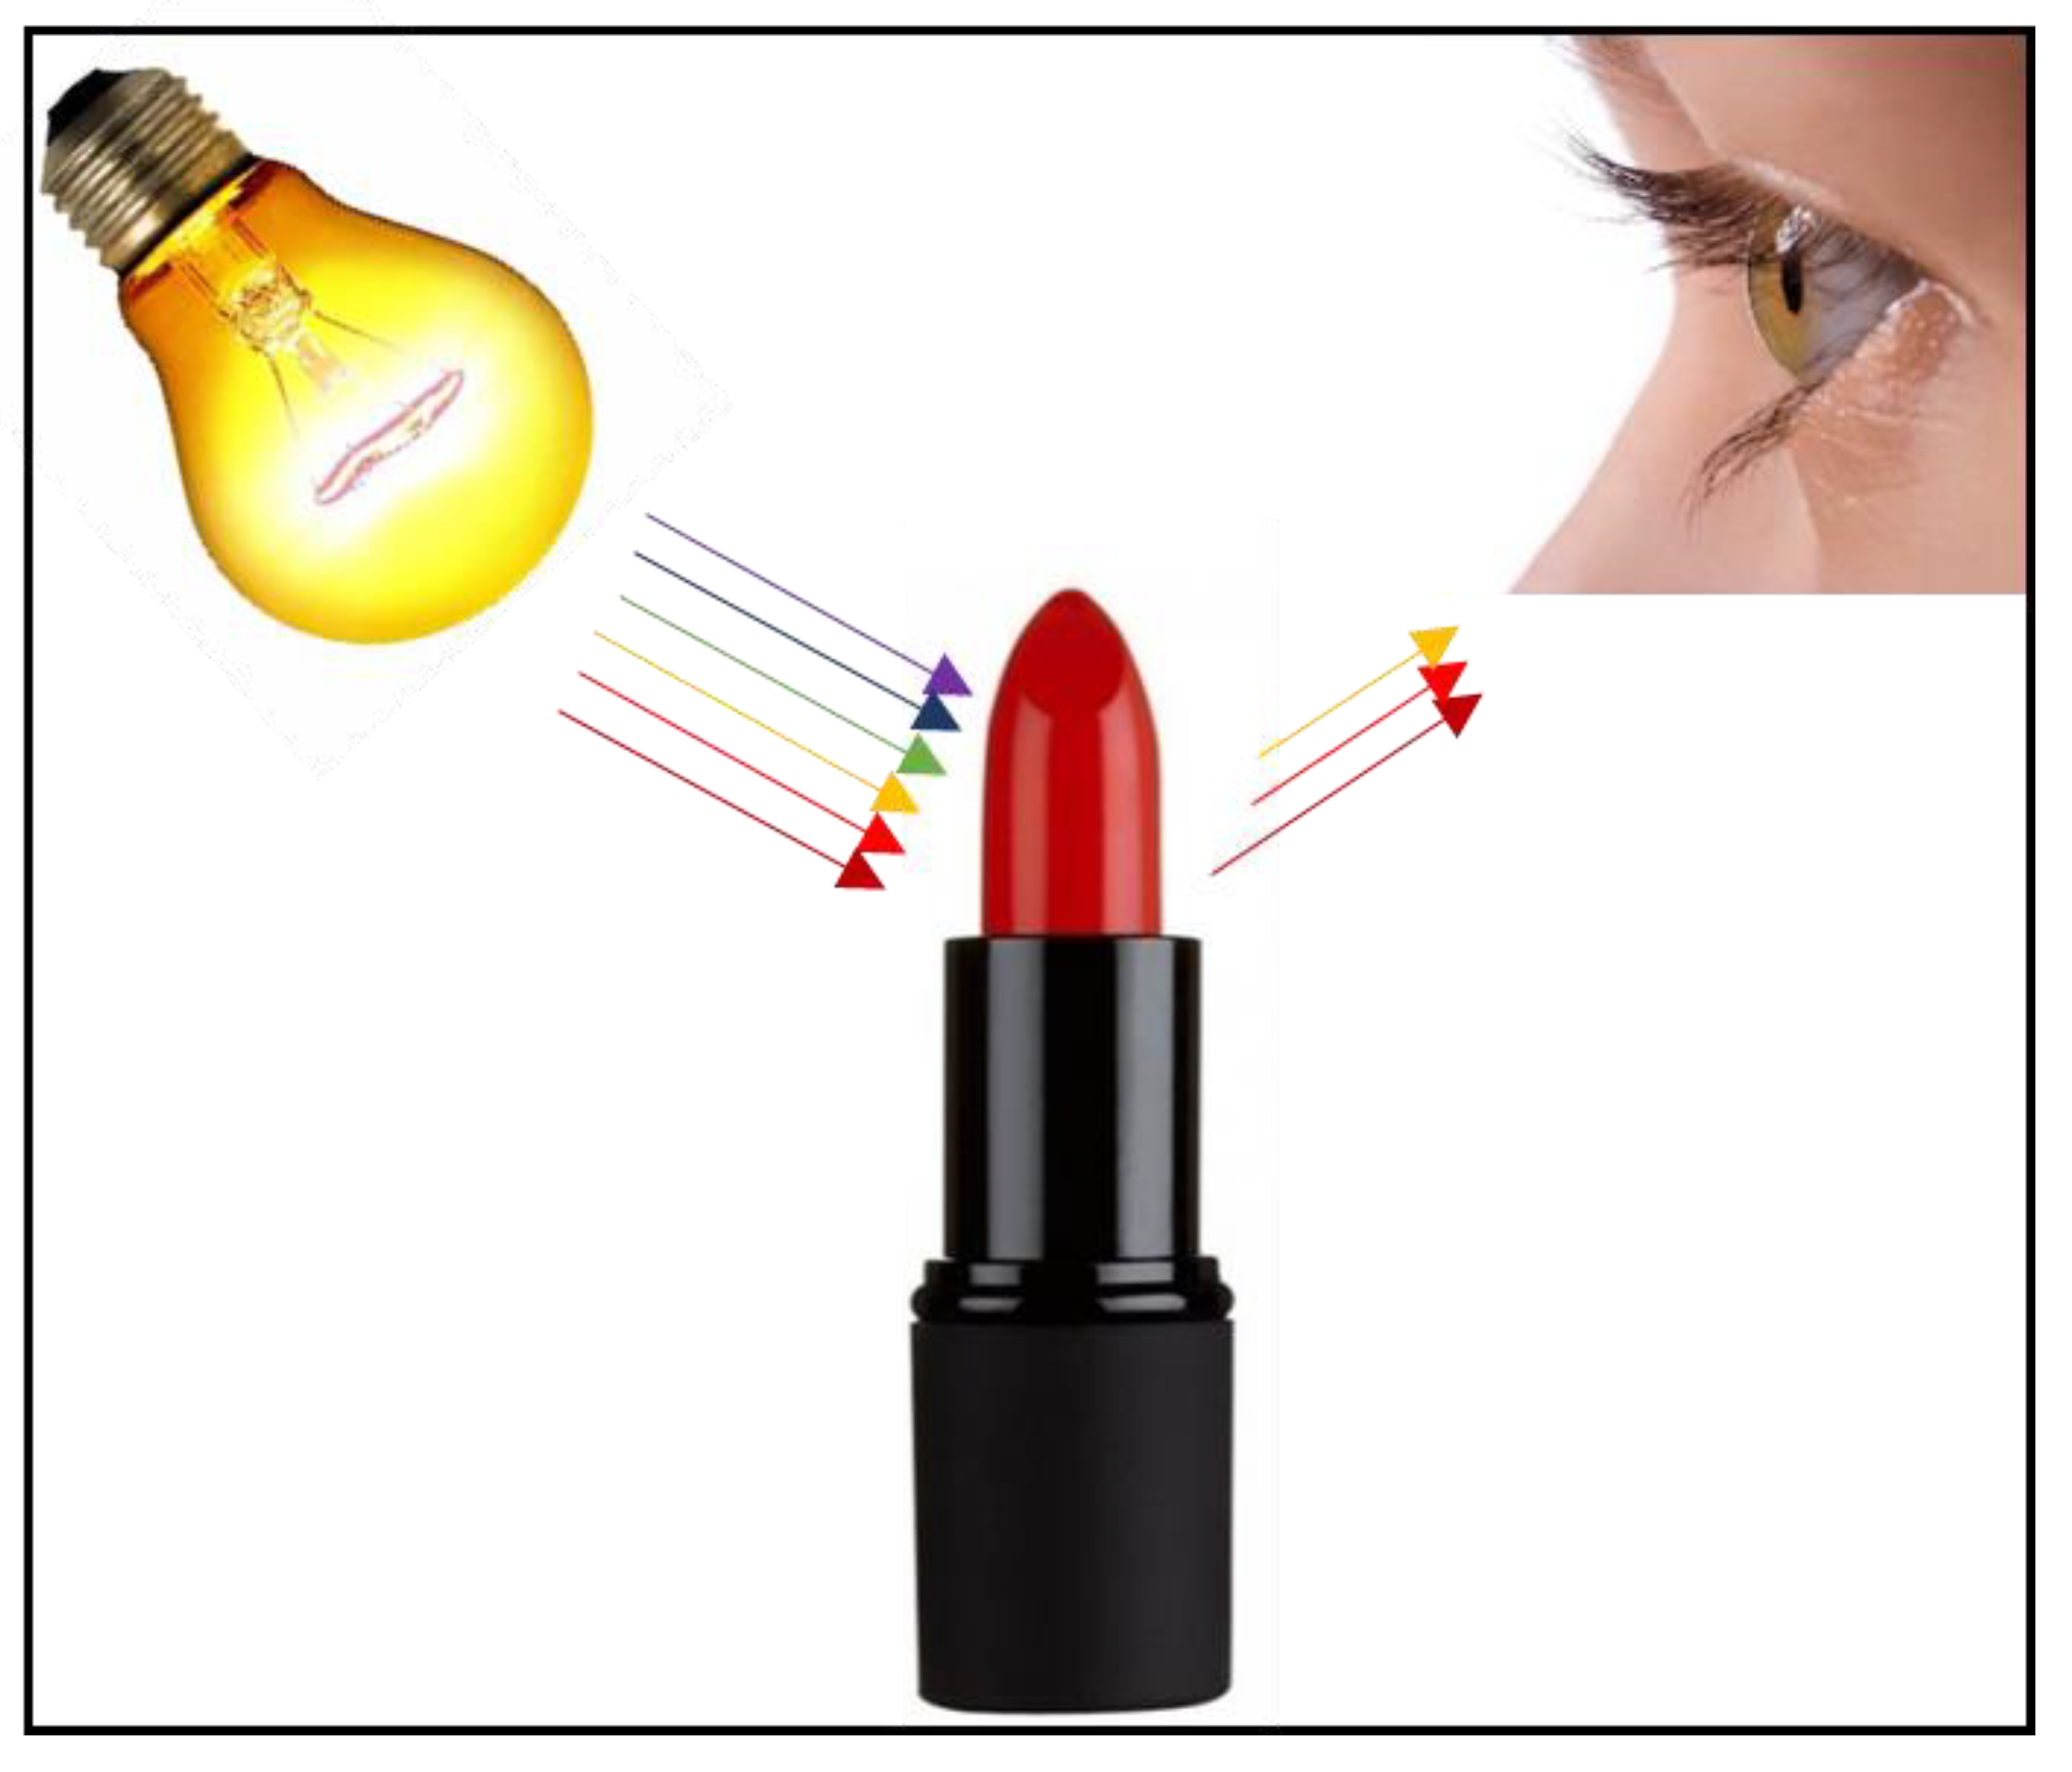
7.1. Color and Its Conformational Elements
7.2. The Metric of Color
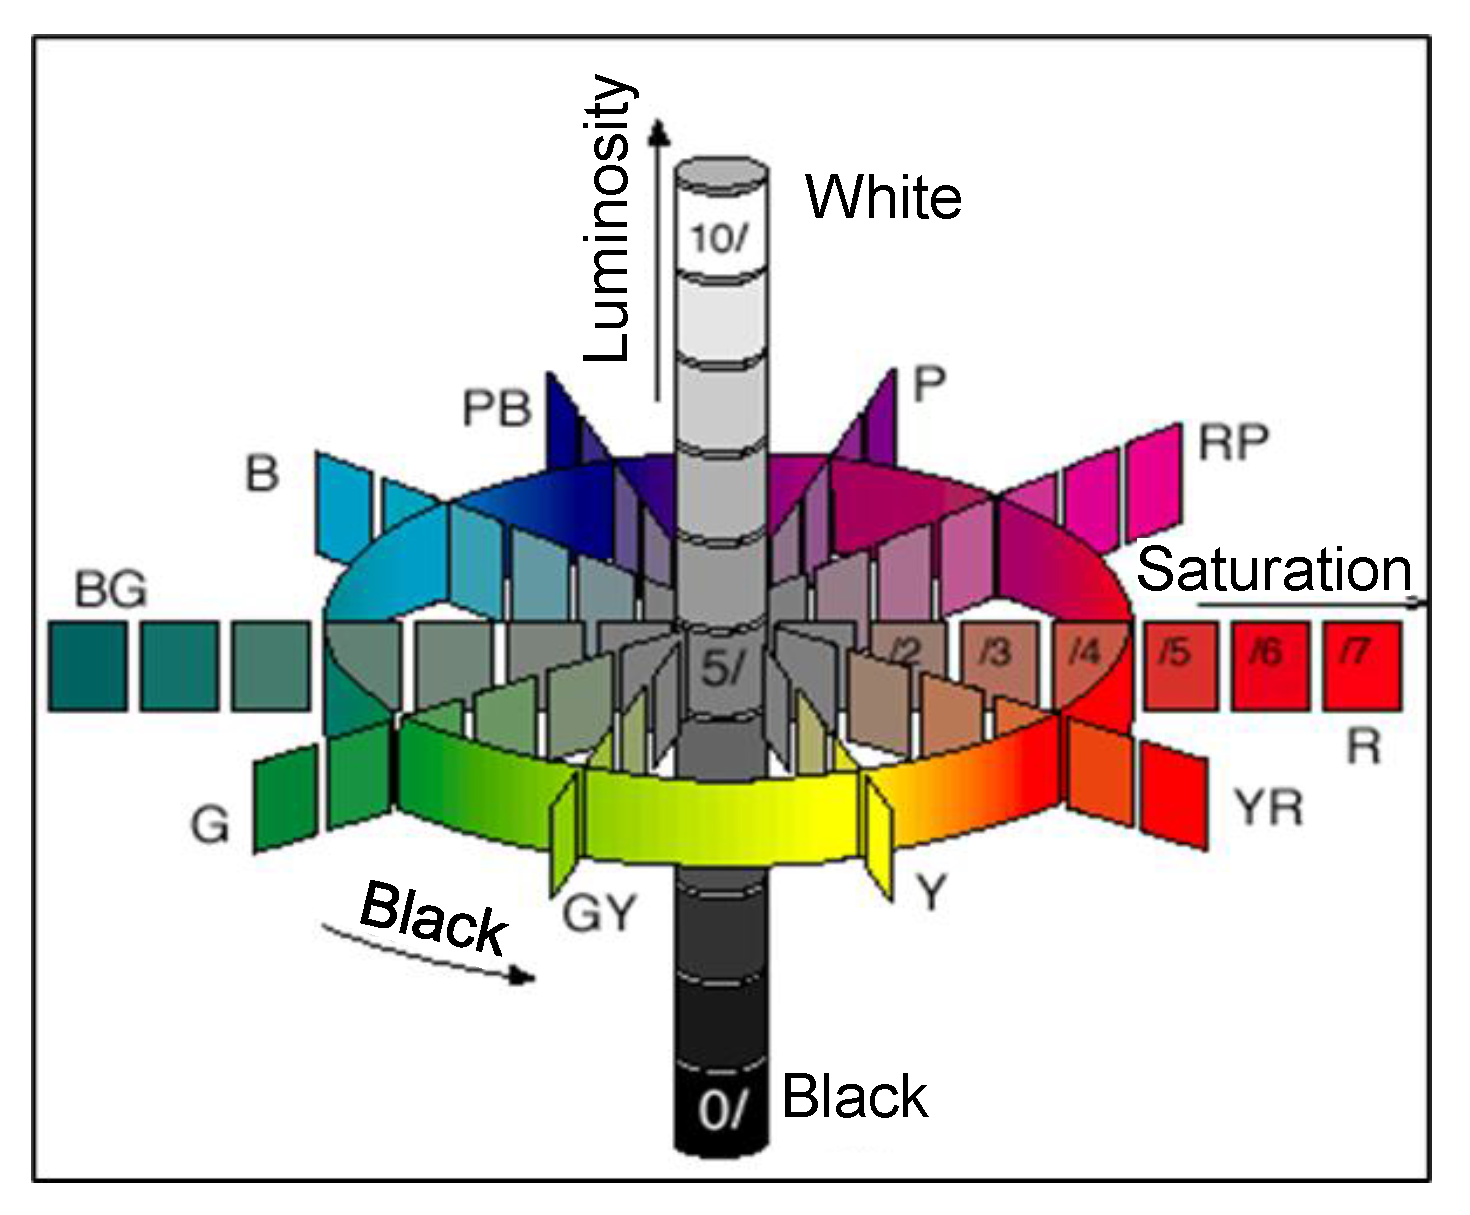
7.2.1. Munsell Color System
7.2.2. CIE Color Systems
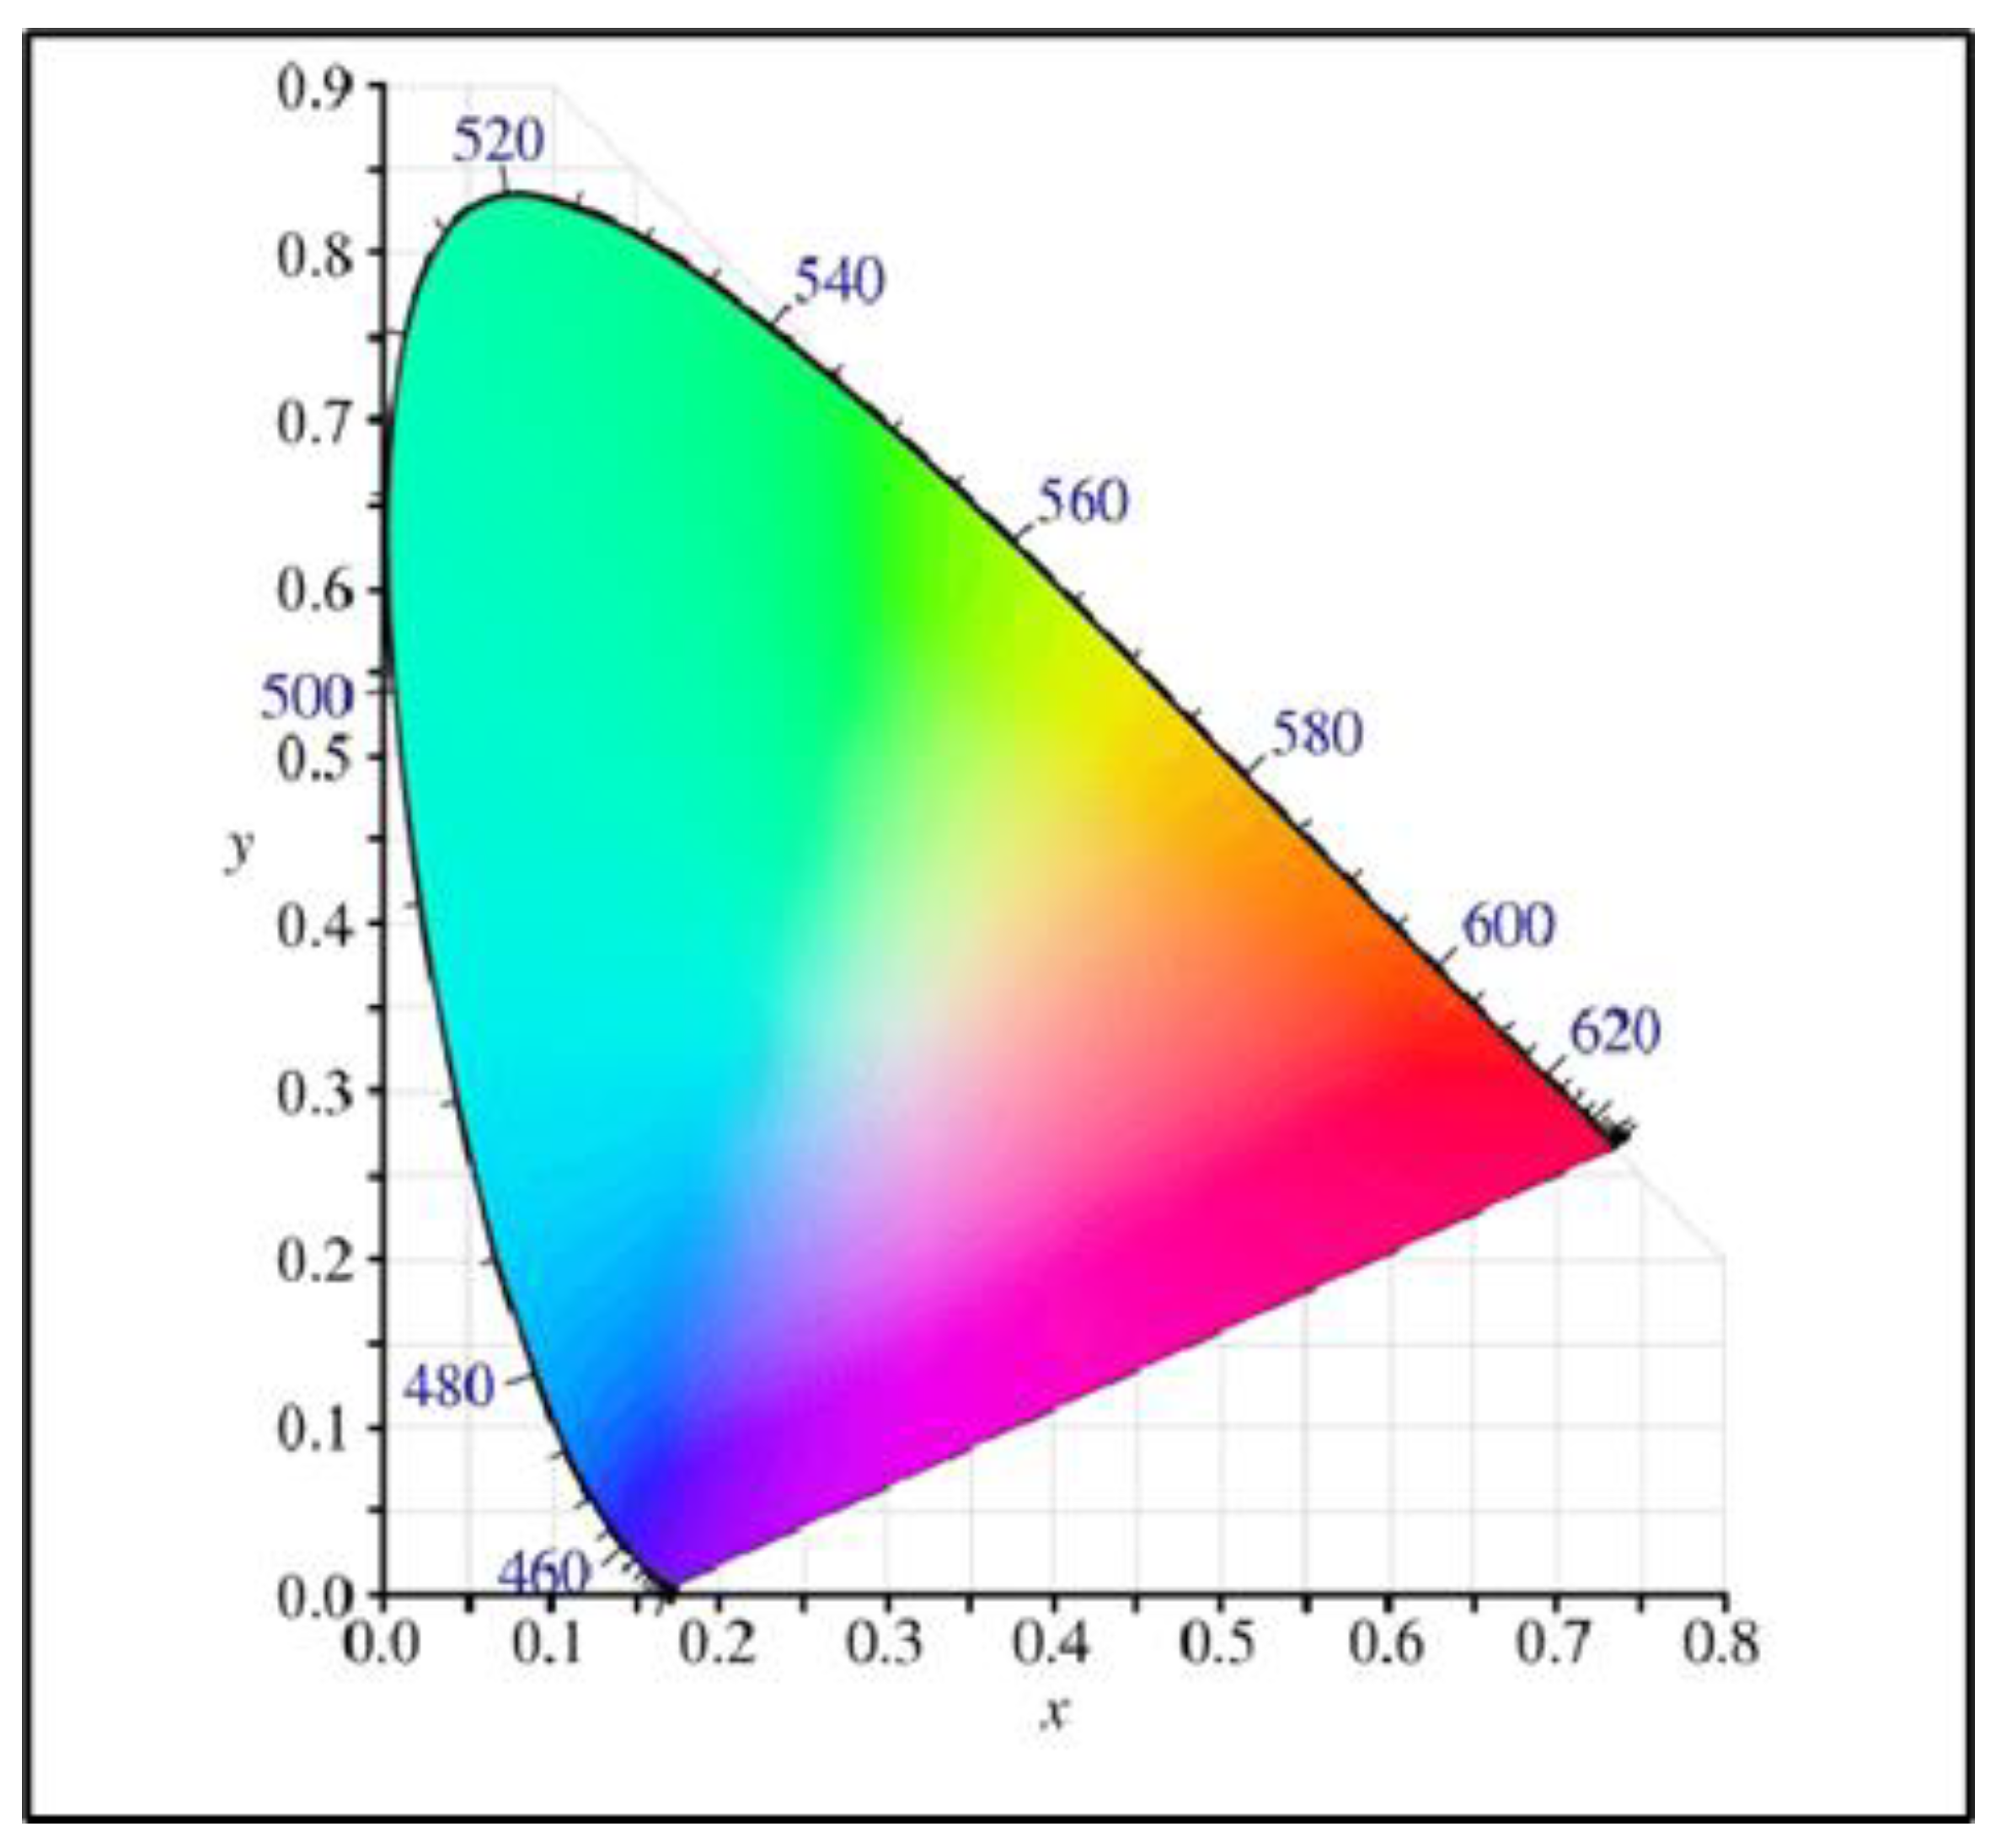
CIE 1931
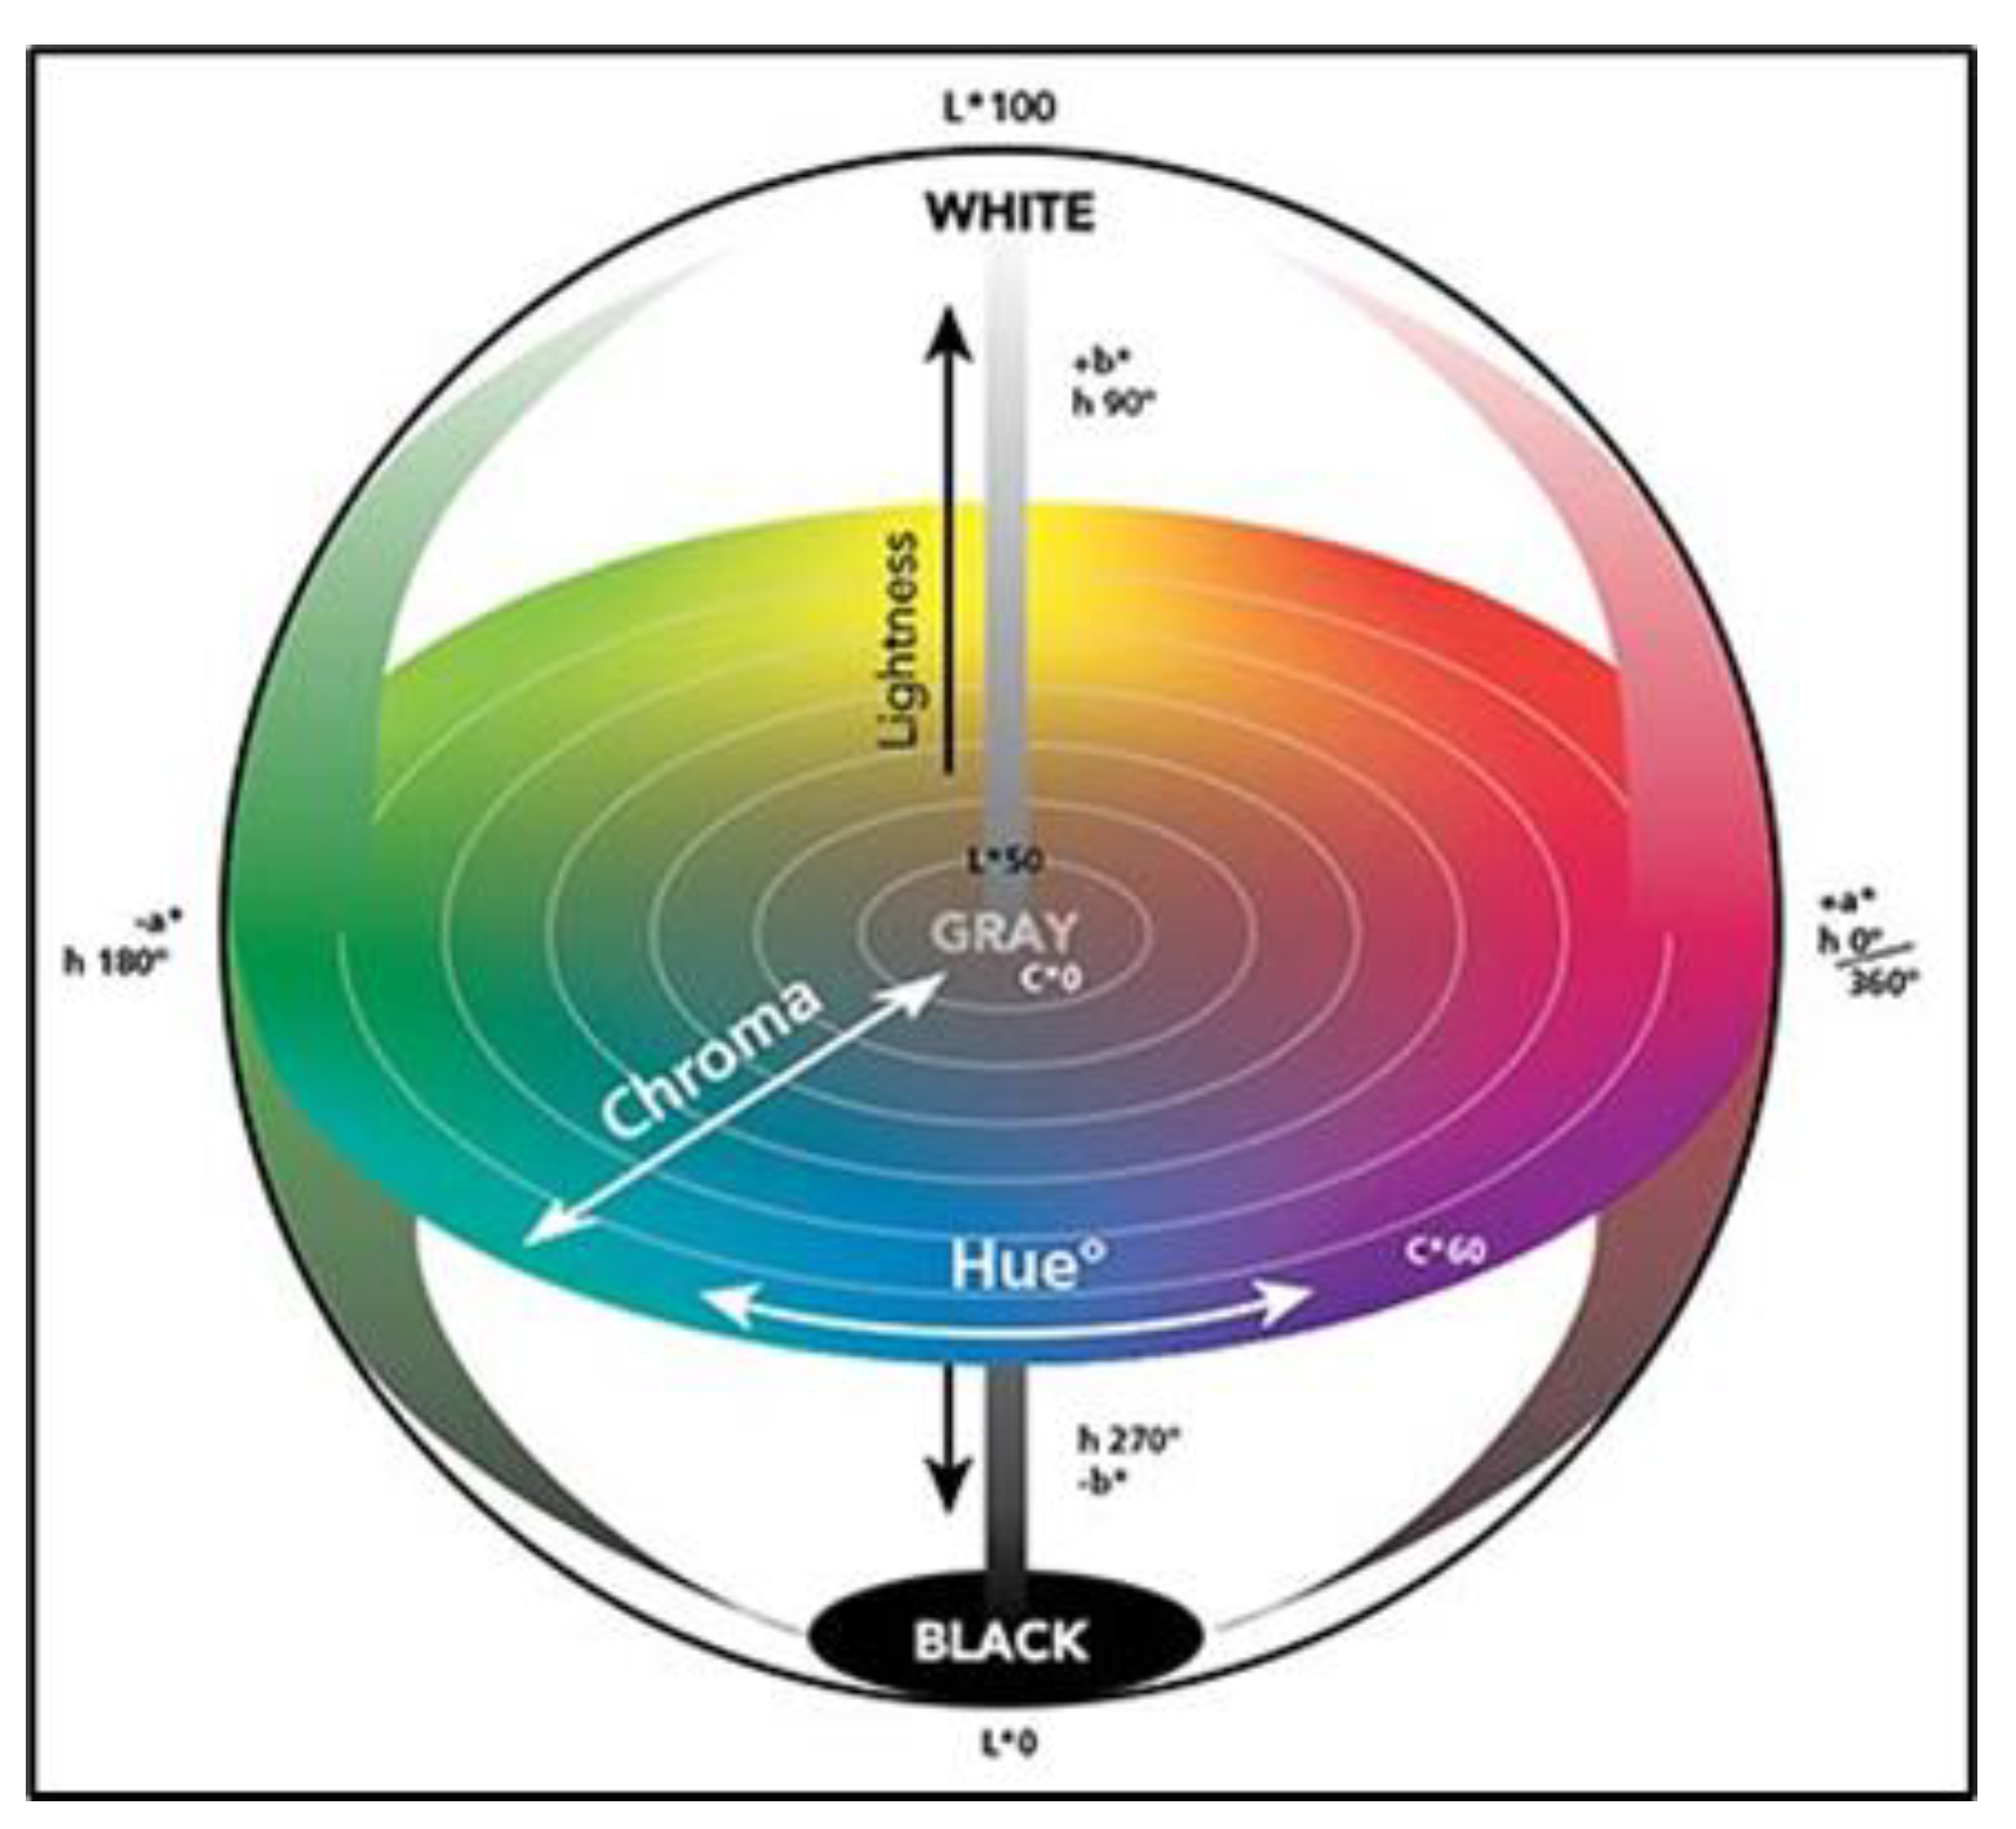
CIELAB 1976
7.3. Color Measuring Techniques in the Cosmetic Industry
| Instrument Type | Principle of Measurement | Type of Cosmetic Measured | Reference |
|---|---|---|---|
| Spectrophotometer | Measures the intensity of light at specific wavelengths. The data are then compared against known standards to quantify color in products. | All types of colored cosmetics | [214,218,219] |
| Colorimeter | Compares the color of a sample against a standard. t quantifies color based on the CIE Lab* color space, calculating differences in lightness (L*), red-green (a*), and yellow-blue (b*) coordinates. | Powders, creams, and lotions | [9,218] |
| Reflectance Spectrophotometer | Measures the amount of light reflected from the surface of a product. By analyzing the spectrum of the reflected light, it determines how the product’s color will appear under different lighting conditions. | Foundations and powders | [214,218] |
| Digital Camera Imaging | Captures and analyzes images to determine color properties. These images are then analyzed using software to assess color properties like hue, saturation, and brightness, offering a comprehensive color profile. | Any visible cosmetic product | [216,217] |
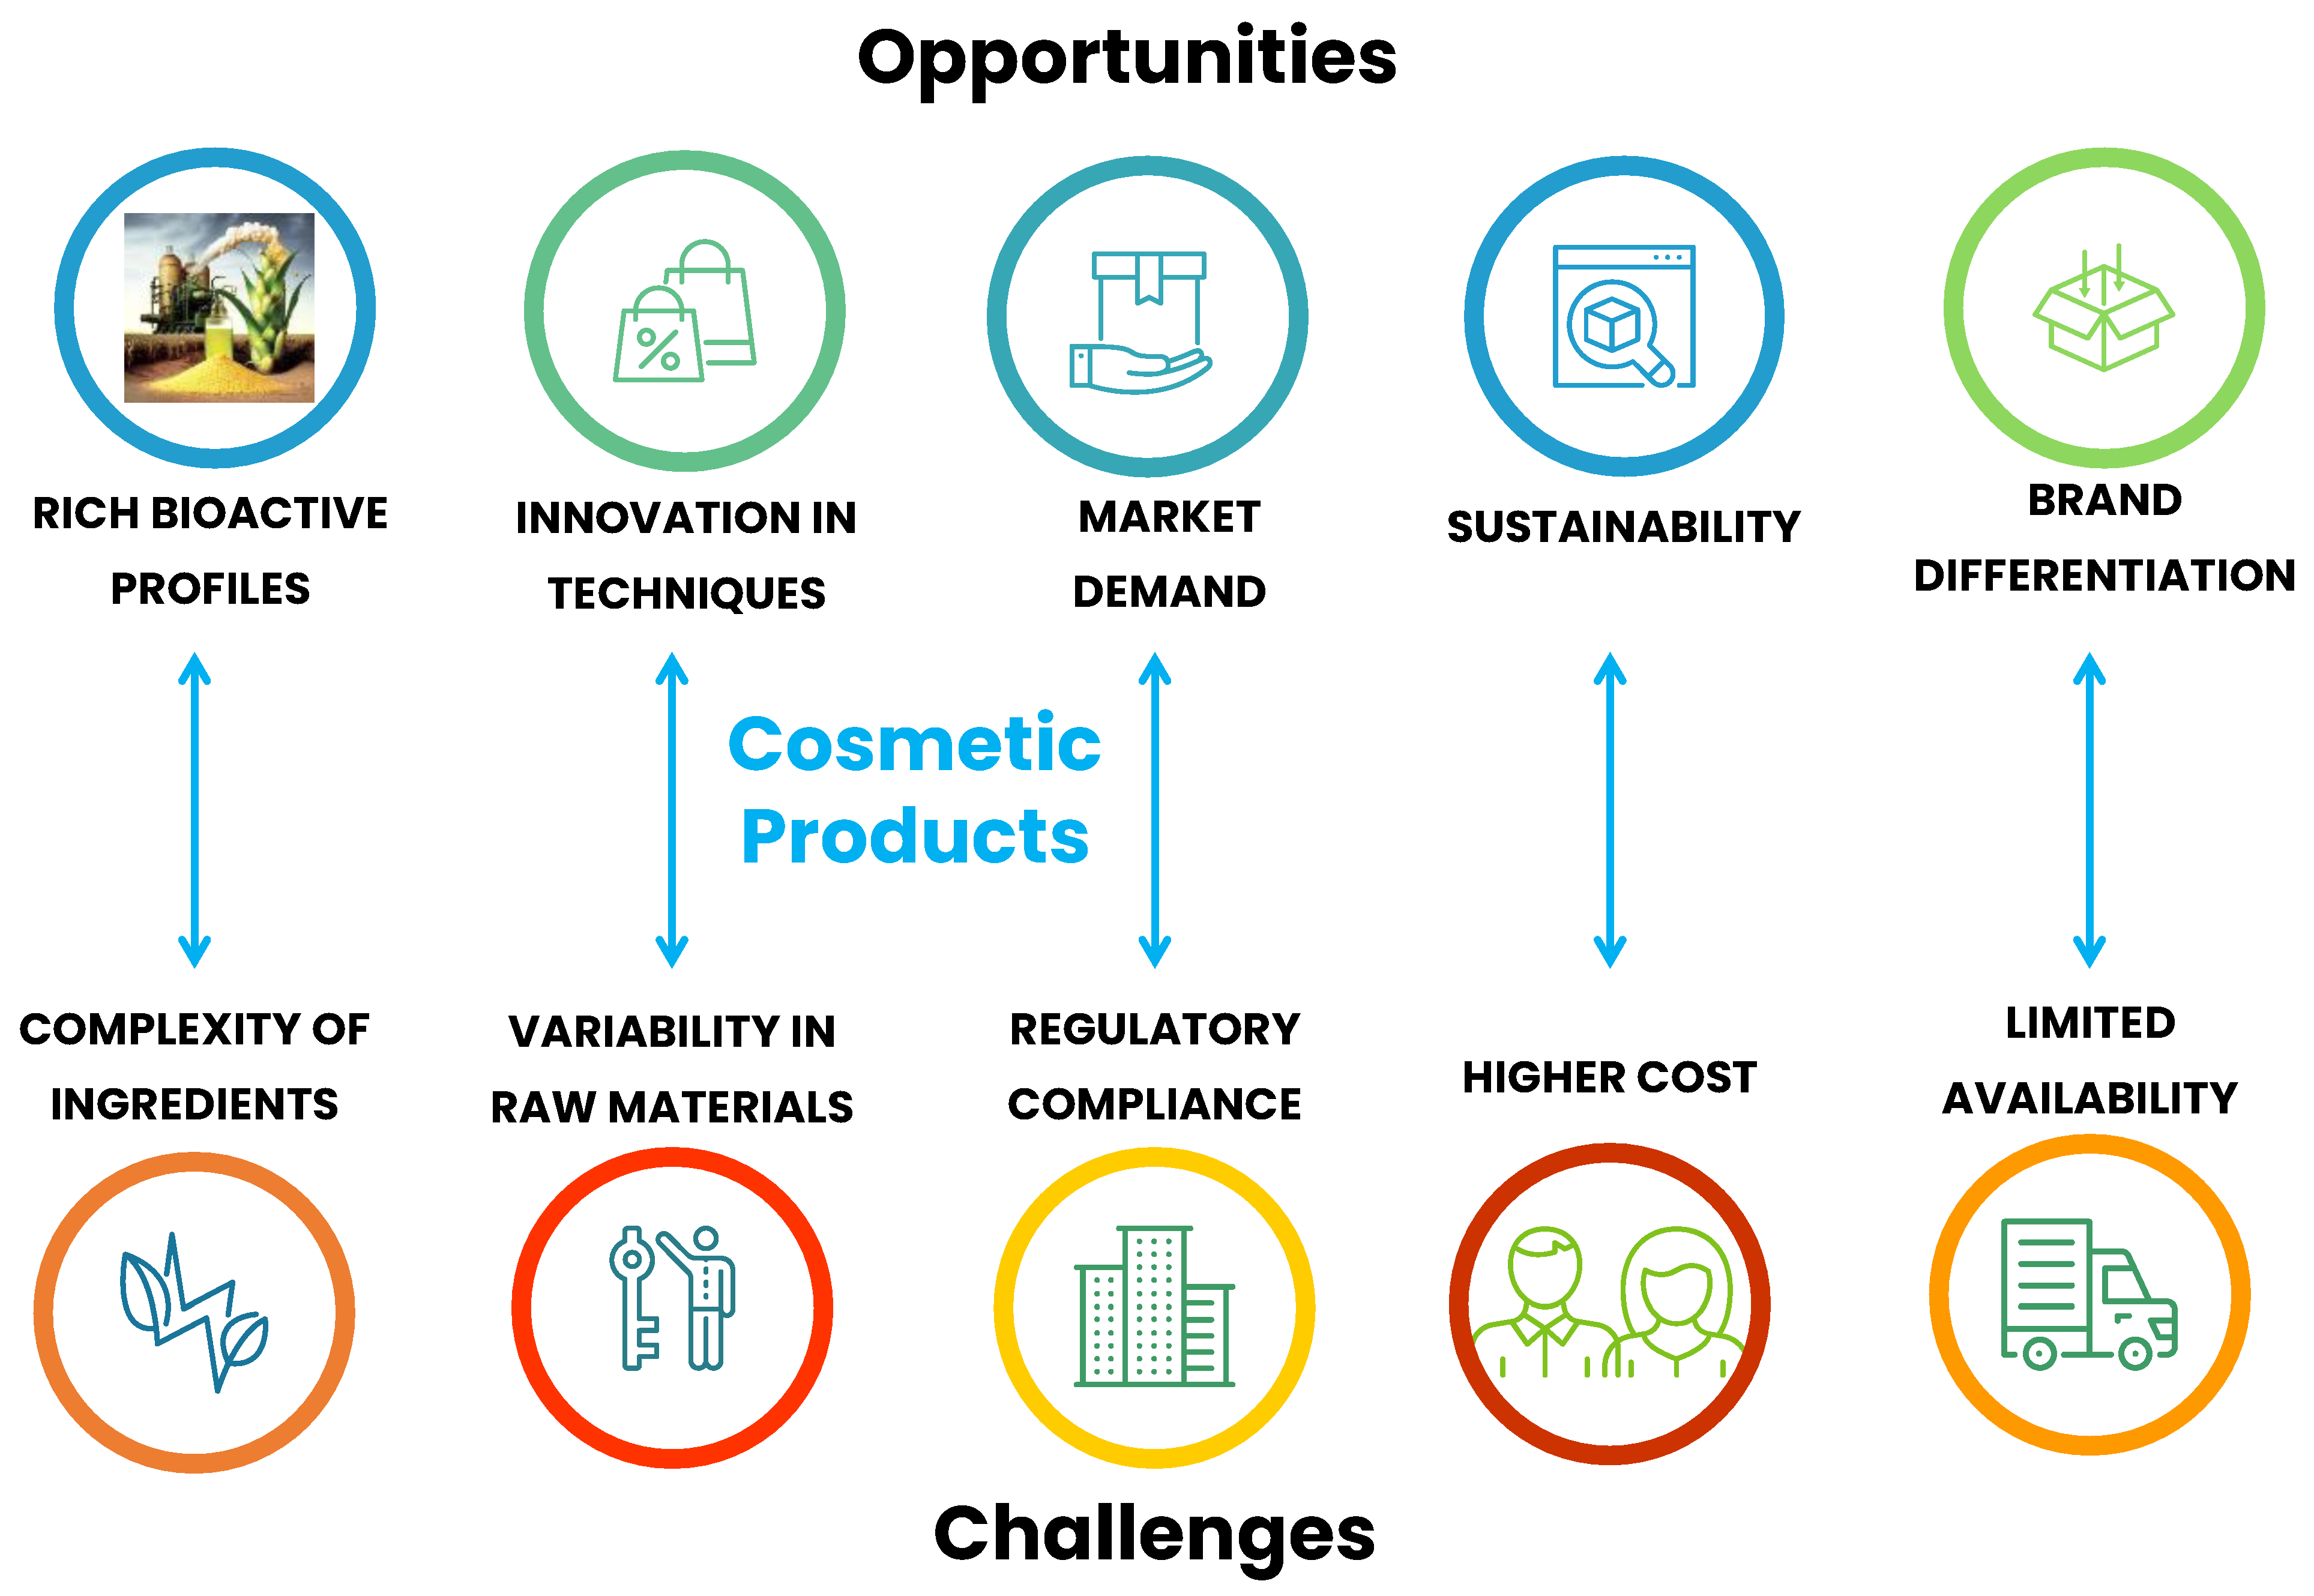
8. Challenges and Opportunities of Using Meta-Analysis in the Formulation of Cosmetics with Biobased Products
8.1. Challenges
8.2. Opportunities
9. Conclusions and Perspectives
Funding
Conflicts of Interest
References
- Kumar, S. Exploratory Analysis of Global Cosmetic Industry: Major Players, Technology and Market Trends. Technovation 2005, 25, 1263–1272. [Google Scholar] [CrossRef]
- Ribechini, E.; Modugno, F.; Pérez-Arantegui, J.; Colombini, M.P. Discovering the Composition of Ancient Cosmetics and Remedies: Analytical Techniques and Materials. Anal. Bioanal. Chem. 2011, 401, 1727–1738. [Google Scholar] [CrossRef] [PubMed]
- Salager, J.-L.; Marquez, R.; Bullon, J.; Forgiarini, A. Formulation in Surfactant Systems: From-Winsor-to-HLDN. Encyclopedia 2022, 2, 778–839. [Google Scholar] [CrossRef]
- Poucher, W.A. Poucher’s Perfumes, Cosmetics and Soaps—Volume 1, 9th ed.; Springer: New Delhi, India, 1991; ISBN 0751404799. [Google Scholar]
- Dini, I.; Laneri, S. The New Challenge of Green Cosmetics: Natural Food Ingredients for Cosmetic Formulations. Molecules 2021, 26, 3921. [Google Scholar] [CrossRef] [PubMed]
- Statista Beauty & Personal Care. Available online: https://0-www-statista-com.brum.beds.ac.uk/outlook/cmo/beauty-personal-care/worldwide (accessed on 9 September 2023).
- Otto, S.; Strenger, M.; Maier-Nöth, A.; Schmid, M.; Otto, S.; Strenger, M.; Schmid, M. Food Packaging and Sustainability—Consumer Perception vs. Correlated Scientific Facts. J. Clean. Prod. 2021, 298, 126733. [Google Scholar] [CrossRef]
- Ortiz, M.S.; Alvarado, J.G.; Zambrano, F.; Marquez, R. Surfactants Produced from Carbohydrate Derivatives: A Review of the Biobased Building Blocks Used in Their Synthesis. J. Surfactants Deterg. 2022, 25, 147–183. [Google Scholar] [CrossRef]
- Mildau, G. Chapter 4—General Review of Official Methods of Analysis of Cosmetics. In Analysis of Cosmetic Products, 2nd ed.; Salvador, A., Chisvert, A.B.T.-A., Eds.; Elsevier: Boston, MA, USA, 2018; pp. 67–83. ISBN 978-0-444-63508-2. [Google Scholar]
- Mohamed, H.M. Green, Environment-Friendly, Analytical Tools Give Insights in Pharmaceuticals and Cosmetics Analysis. TrAC Trends Anal. Chem. 2015, 66, 176–192. [Google Scholar] [CrossRef]
- Luengo, G.S.; Fameau, A.-L.; Léonforte, F.; Greaves, A.J. Surface Science of Cosmetic Substrates, Cleansing Actives and Formulations. Adv. Colloid Interface Sci. 2021, 290, 102383. [Google Scholar] [CrossRef]
- Sajinčič, N.; Gordobil, O.; Simmons, A.; Sandak, A. An Exploratory Study of Consumers’ Knowledge and Attitudes about Lignin-Based Sunscreens and Bio-Based Skincare Products. Cosmetics 2021, 8, 78. [Google Scholar] [CrossRef]
- Singh, M.; Sharma, S.; Khokra, S.L.; Ram Kumar Sahu, R.J. Preparation and Evaluation of Herbal Cosmetic Cream. Pharmacologyonline 2011, 2, 1258–1264. [Google Scholar]
- Salager, J.-L.; Antón, R.E.; Bullón, J.; Forgiarini, A.; Marquez, R. How to Use the Normalized Hydrophilic-Lipophilic Deviation (HLDN) Concept for the Formulation of Equilibrated and Emulsified Surfactant-Oil-Water Systems for Cosmetics and Pharmaceutical Products. Cosmetics 2020, 7, 57. [Google Scholar] [CrossRef]
- Final Amended Report on the Safety Assessment of Methylparaben, Ethylparaben, Propylparaben, Isopropylparaben, Butylparaben, Isobutylparaben, and Benzylparaben as Used in Cosmetic Products. Int. J. Toxicol. 2008, 27, 1–82. [CrossRef]
- Calvo, F.; Gómez, J.M.; Ricardez-Sandoval, L.; Alvarez, O. Integrated Design of Emulsified Cosmetic Products: A Review. Chem. Eng. Res. Des. 2020, 161, 279–303. [Google Scholar] [CrossRef]
- Celeiro, M.; Garcia-Jares, C.; Llompart, M.; Lores, M. Recent Advances in Sample Preparation for Cosmetics and Personal Care Products Analysis. Molecules 2021, 26, 4900. [Google Scholar] [CrossRef] [PubMed]
- Singh, B.; Sharma, R.A. Plant Terpenes: Defense Responses, Phylogenetic Analysis, Regulation and Clinical Applications. 3 Biotech 2015, 5, 129–151. [Google Scholar] [CrossRef]
- Narloch, I.; Wejnerowska, G. An Overview of the Analytical Methods for the Determination of Organic Ultraviolet Filters in Cosmetic Products and Human Samples. Molecules 2021, 26, 4780. [Google Scholar] [CrossRef]
- Liberati, A.; Altman, D.G.; Tetzlaff, J.; Mulrow, C.; Gøtzsche, P.C.; Ioannidis, J.P.A.; Clarke, M.; Devereaux, P.J.; Kleijnen, J.; Moher, D. The PRISMA Statement for Reporting Systematic Reviews and Meta-Analyses of Studies That Evaluate Health Care Interventions: Explanation and Elaboration. Ann. Intern. Med. 2009, 151, W-65. [Google Scholar] [CrossRef]
- Miller, J.M. Chromatography: Concepts and Contrasts; John Wiley & Sons: Hoboken, NJ, USA, 2005; ISBN 978-0-471-98059-9. [Google Scholar]
- Zhou, W.; Wang, P.G.; Wittenberg, J.B.; Rua, D.; Krynitsky, A.J. Simultaneous Determination of Cosmetics Ingredients in Nail Products by Fast Gas Chromatography with Tandem Mass Spectrometry. J. Chromatogr. A 2016, 1446, 134–140. [Google Scholar] [CrossRef]
- Rastogi, S.C. Analysis of Fragrances in Cosmetics by Gas Chromatography–Mass Spectrometry. J. High Resolut. Chromatogr. 1995, 18, 653–658. [Google Scholar] [CrossRef]
- Sahu, P.K.; Ramisetti, N.R.; Cecchi, T.; Swain, S.; Patro, C.S.; Panda, J. An Overview of Experimental Designs in HPLC Method Development and Validation. J. Pharm. Biomed. Anal. 2018, 147, 590–611. [Google Scholar] [CrossRef]
- Fukuda, Y.; Morikawa, Y.; Matsumoto, I. Ion-Exchange Chromatographic Separation of N-Nitrosodiethanolamine in Cosmetics. Available online: https://0-pubs-acs-org.brum.beds.ac.uk/doi/pdf/10.1021/ac00236a013 (accessed on 30 July 2023).
- Lim, D.S.; Lim, S.K.; Kim, M.K.; Kwon, Y.C.; Roh, T.H.; Choi, S.M.; Yoon, S.; Kim, H.S.; Lee, B.-M. Formation and Inhibition of N-Nitrosodiethanolamine in Cosmetics under pH, Temperature, and Fluorescent, Ultraviolet, and Visual Light. J. Toxicol. Environ. Health A 2018, 81, 241–253. [Google Scholar] [CrossRef] [PubMed]
- Suárez-Hernández, L.A.; Camacho-Ruíz, R.M.; Arriola-Guevara, E.; Padilla-Camberos, E.; Kirchmayr, M.R.; Corona-González, R.I.; Guatemala-Morales, G.M. Validation of an Analytical Method for the Simultaneous Determination of Hyaluronic Acid Concentration and Molecular Weight by Size-Exclusion Chromatography. Molecules 2021, 26, 5360. [Google Scholar] [CrossRef] [PubMed]
- Salvador, A.; Chisvert, A. An Environmentally Friendly (“Green”) Reversed-Phase Liquid Chromatography Method for UV Filters Determination in Cosmetics. Anal. Chim. Acta 2005, 537, 15–24. [Google Scholar] [CrossRef]
- Schakel, D.J.; Kalsbeek, D.; Boer, K. Determination of Sixteen UV Filters in Suncare Formulations by High-Performance Liquid Chromatography. J. Chromatogr. A 2004, 1049, 127–130. [Google Scholar] [CrossRef] [PubMed]
- Wang, X.; Wang, J.; Du, T.; Kou, H.; Du, X.; Lu, X. Determination of Six Benzotriazole Ultraviolet Filters in Water and Cosmetic Samples by Graphene Sponge-Based Solid-Phase Extraction Followed by High-Performance Liquid Chromatography. Anal. Bioanal. Chem. 2018, 410, 6955–6962. [Google Scholar] [CrossRef] [PubMed]
- Wharton, M.; Geary, M.; O’Connor, N.; Murphy, B. A Rapid High Performance Liquid Chromatographic (HPLC) Method for the Simultaneous Determination of Seven UV Filters Found in Sunscreen and Cosmetics. Int. J. Cosmet. Sci. 2011, 33, 164–170. [Google Scholar] [CrossRef]
- Lee, M.-R.; Lin, C.-Y.; Li, Z.-G.; Tsai, T.-F. Simultaneous Analysis of Antioxidants and Preservatives in Cosmetics by Supercritical Fluid Extraction Combined with Liquid Chromatography–Mass Spectrometry. J. Chromatogr. A 2006, 1120, 244–251. [Google Scholar] [CrossRef]
- Liu, C.; Wang, J.; Yang, Y. High-Performance Liquid Chromatography Determination of Antioxidants in Cosmetics after Cloud Point Extraction Using Dodecylpolyoxyethylene Ether. Anal. Methods 2014, 6, 6038–6043. [Google Scholar] [CrossRef]
- Al-Halaseh, L.K.; Al-Adaileh, S.; Mbaideen, A.; Hajleh, M.N.A.; Al-Samydai, A.; Zakaraya, Z.Z.; Dayyih, W.A. Implication of Parabens in Cosmetics and Cosmeceuticals: Advantages and Limitations. J. Cosmet. Dermatol. 2022, 21, 3265–3271. [Google Scholar] [CrossRef]
- Khesina, Z.B.; Iartsev, S.D.; Revelsky, A.I.; Buryak, A.K. Microextraction by Packed Sorbent Optimized by Statistical Design of Experiment as an Approach to Increase the Sensitivity and Selectivity of HPLC-UV Determination of Parabens in Cosmetics. J. Pharm. Biomed. Anal. 2021, 195, 113843. [Google Scholar] [CrossRef]
- Matwiejczuk, N.; Galicka, A.; Brzóska, M.M. Review of the Safety of Application of Cosmetic Products Containing Parabens. J. Appl. Toxicol. 2020, 40, 176–210. [Google Scholar] [CrossRef] [PubMed]
- Piao, C.; Chen, L.; Wang, Y. A Review of the Extraction and Chromatographic Determination Methods for the Analysis of Parabens. J. Chromatogr. B 2014, 969, 139–148. [Google Scholar] [CrossRef] [PubMed]
- Cabaleiro, N.; de la Calle, I.; Bendicho, C.; Lavilla, I. An Overview of Sample Preparation for the Determination of Parabens in Cosmetics. TrAC Trends Anal. Chem. 2014, 57, 34–46. [Google Scholar] [CrossRef]
- Ocaña-González, J.A.; Villar-Navarro, M.; Ramos-Payán, M.; Fernández-Torres, R.; Bello-López, M.A. New Developments in the Extraction and Determination of Parabens in Cosmetics and Environmental Samples. A Review. Anal. Chim. Acta 2015, 858, 1–15. [Google Scholar] [CrossRef] [PubMed]
- Márquez-Sillero, I.; Aguilera-Herrador, E.; Cárdenas, S.; Valcárcel, M. Determination of Parabens in Cosmetic Products Using Multi-Walled Carbon Nanotubes as Solid Phase Extraction Sorbent and Corona-Charged Aerosol Detection System. J. Chromatogr. A 2010, 1217, 1–6. [Google Scholar] [CrossRef] [PubMed]
- Youngvises, N.; Chaida, T.; Khonyoung, S.; Kuppithayanant, N.; Tiyapongpattana, W.; Itharat, A.; Jakmunee, J. Greener Liquid Chromatography Using a Guard Column with Micellar Mobile Phase for Separation of Some Pharmaceuticals and Determination Ofparabens. Talanta 2013, 106, 350–359. [Google Scholar] [CrossRef] [PubMed]
- Gao, W.; Gray, N.; Heaton, J.; Smith, N.W.; Jia, Y.; Legido-Quigley, C. UV Gradient Combined with Principal Component Analysis: Highly Sensitive and Specific High Performance Liquid Chromatography Analysis of Cosmetic Creams. J. Chromatogr. A 2012, 1228, 324–328. [Google Scholar] [CrossRef] [PubMed]
- Gao, W.; Legido-Quigley, C. Fast and Sensitive High Performance Liquid Chromatography Analysis of Cosmetic Creams for Hydroquinone, Phenol and Six Preservatives. J. Chromatogr. A 2011, 1218, 4307–4311. [Google Scholar] [CrossRef]
- Shen, H.-Y.; Jiang, H.-L.; Mao, H.-L.; Pan, G.; Zhou, L.; Cao, Y.-F. Simultaneous Determination of Seven Phthalates and Four Parabens in Cosmetic Products Using HPLC-DAD and GC-MS Methods. J. Sep. Sci. 2007, 30, 48–54. [Google Scholar] [CrossRef]
- Fei, T.; Li, H.; Ding, M.; Ito, M.; Lin, J.-M. Determination of Parabens in Cosmetic Products by Solid-Phase Microextraction of Poly(Ethylene Glycol) Diacrylate Thin Film on Fibers and Ultra High-Speed Liquid Chromatography with Diode Array Detector. J. Sep. Sci. 2011, 34, 1599–1606. [Google Scholar] [CrossRef]
- Yamini, Y.; Saleh, A.; Rezaee, M.; Ranjbar, L.; Moradi, M. Ultrasound-Assisted Emulsification Microextraction of Various Preservatives from Cosmetics, Beverages, and Water Samples. J. Liq. Chromatogr. Relat. Technol. 2012, 35, 2623–2642. [Google Scholar] [CrossRef]
- Tahan, G.P.; Santos, N.; Albuquerque, A.C.; Martins, I. Determination of Parabens in Serum by Liquid Chromatography-Tandem Mass Spectrometry: Correlation with Lipstick Use. Regul. Toxicol. Pharmacol. 2016, 79, 42–48. [Google Scholar] [CrossRef] [PubMed]
- Zhang, Q.; Lian, M.; Liu, L.; Cui, H. High-Performance Liquid Chromatographic Assay of Parabens in Wash-off Cosmetic Products and Foods Using Chemiluminescence Detection. Anal. Chim. Acta 2005, 537, 31–39. [Google Scholar] [CrossRef]
- Guerra, E.; Llompart, M.; Garcia-Jares, C. Miniaturized Matrix Solid-Phase Dispersion Followed by Liquid Chromatography-Tandem Mass Spectrometry for the Quantification of Synthetic Dyes in Cosmetics and Foodstuffs Used or Consumed by Children. J. Chromatogr. A 2017, 1529, 29–38. [Google Scholar] [CrossRef] [PubMed]
- Guerra, E.; Celeiro, M.; Lamas, J.P.; Llompart, M.; Garcia-Jares, C. Determination of Dyes in Cosmetic Products by Micro-Matrix Solid Phase Dispersion and Liquid Chromatography Coupled to Tandem Mass Spectrometry. J. Chromatogr. A 2015, 1415, 27–37. [Google Scholar] [CrossRef] [PubMed]
- Franco, J.H.; Silva, B.F.; Zanoni, M.V.B. Using Ionic Liquid Combined with HPLC-DAD to Analyze Semi-Permanent Hair Dyes in Commercial Formulations. Anal. Methods 2015, 7, 1115–1122. [Google Scholar] [CrossRef]
- Miranda-Bermudez, E.; Harp, B.P.; Barrows, J.N. Qualitative Identification of Permitted and Non-Permitted Color Additives in Cosmetics. J. AOAC Int. 2014, 97, 1039–1047. [Google Scholar] [CrossRef]
- Guerra, E.; Llompart, M.; Garcia-Jares, C. Analysis of Dyes in Cosmetics: Challenges and Recent Developments. Cosmetics 2018, 5, 47. [Google Scholar] [CrossRef]
- Xian, Y.; Wu, Y.; Guo, X.; Lu, Y.; Luo, H.; Luo, D.; Chen, Y. Simultaneous Determination of 11 Restricted Dyes in Cosmetics by Ultra High-Performance Liquid Chromatography/Tandem Mass Spectrometry. Anal. Methods 2013, 5, 1965–1974. [Google Scholar] [CrossRef]
- Littlewood, A.B. Gas Chromatography: Principles, Techniques, and Applications; Elsevier: Amsterdam, The Netherlands, 2013; ISBN 978-1-4832-6098-3. [Google Scholar]
- Shellie, R.A. Chapter 9 Volatile Components of Plants, Essential Oils, and Fragrances. In Comprehensive Analytical Chemistry; Ramos, L., Ed.; Comprehensive Two Dimensional Gas Chromatography; Elsevier: Amsterdam, The Netherlands, 2009; Volume 55, pp. 189–213. [Google Scholar]
- Kumar, M.; Devi, A.; Sharma, M.; Kaur, P.; Mandal, U.K. Review on Perfume and Present Status of Its Associated Allergens. J. Cosmet. Dermatol. 2021, 20, 391–399. [Google Scholar] [CrossRef]
- Chen, J.; Yi, Z.; Sun, R.; Ning, W.; Zhou, C.; Tian, Z.; Sun, C.; Li, Y. Analysis of Fragrance Allergens in Personal Care Products, Toys, and Water Samples: A Review. J. AOAC Int. 2022, 105, 396–412. [Google Scholar] [CrossRef] [PubMed]
- Debonneville, C.; Thomé, M.-A.; Chaintreau, A. Hyphenation of Quadrupole MS to GC and Comprehensive Two-Dimensional GC for the Analysis of Suspected Allergens: Review and Improvement. J. Chromatogr. Sci. 2004, 42, 450–455. [Google Scholar] [CrossRef] [PubMed]
- Mondello, L.; Sciarrone, D.; Casilli, A.; Tranchida, P.Q.; Dugo, P.; Dugo, G. Fast Gas Chromatography-Full Scan Quadrupole Mass Spectrometry for the Determination of Allergens in Fragrances. J. Sep. Sci. 2007, 30, 1905–1911. [Google Scholar] [CrossRef] [PubMed]
- Divišová, R.; Vítová, E.; Diviš, P.; Zemanová, J.; Omelková, J. Validation of SPME-GC-FID Method for Determination of Fragrance Allergens in Selected Cosmetic Products. Acta Chromatogr. 2015, 27, 509–523. [Google Scholar] [CrossRef]
- Mazzucotelli, M.; Minteguiaga, M.A.; Sgorbini, B.; Sidisky, L.; Marengo, A.; Rubiolo, P.; Bicchi, C.; Cagliero, C. Ionic Liquids as Water-Compatible GC Stationary Phases for the Analysis of Fragrances and Essential Oils: Quantitative GC–MS Analysis of Officially-Regulated Allergens in Perfumes. J. Chromatogr. A 2020, 1610, 460567. [Google Scholar] [CrossRef]
- Chaintreau, A.; Joulain, D.; Marin, C.; Schmidt, C.-O.; Vey, M. GC-MS Quantitation of Fragrance Compounds Suspected To Cause Skin Reactions. 1. J. Agric. Food Chem. 2003, 51, 6398–6403. [Google Scholar] [CrossRef]
- Lamas, J.P.; Sanchez-Prado, L.; Garcia-Jares, C.; Lores, M.; Llompart, M. Development of a Solid Phase Dispersion-Pressurized Liquid Extraction Method for the Analysis of Suspected Fragrance Allergens in Leave-on Cosmetics. J. Chromatogr. A 2010, 1217, 8087–8094. [Google Scholar] [CrossRef]
- del Nogal Sánchez, M.; Pérez-Pavón, J.L.; Moreno Cordero, B. Determination of Suspected Allergens in Cosmetic Products by Headspace-Programmed Temperature Vaporization–Fast Gas Chromatography–Quadrupole Mass Spectrometry. Anal. Bioanal. Chem. 2010, 397, 2579–2591. [Google Scholar] [CrossRef]
- Saraji, M.; Mirmahdieh, S. Single-Drop Microextraction Followed by in-Syringe Derivatization and GC-MS Detection for the Determination of Parabens in Water and Cosmetic Products. J. Sep. Sci. 2009, 32, 988–995. [Google Scholar] [CrossRef]
- Yang, T.-J.; Tsai, F.-J.; Chen, C.-Y.; Yang, T.C.-C.; Lee, M.-R. Determination of Additives in Cosmetics by Supercritical Fluid Extraction On-Line Headspace Solid-Phase Microextraction Combined with Gas Chromatography–Mass Spectrometry. Anal. Chim. Acta 2010, 668, 188–194. [Google Scholar] [CrossRef]
- Wang, P.G.; Zhou, W. Rapid Determination of Parabens in Personal Care Products by Stable Isotope GC-MS/MS with Dynamic Selected Reaction Monitoring. J. Sep. Sci. 2013, 36, 1781–1787. [Google Scholar] [CrossRef] [PubMed]
- Alvarez-Rivera, G.; Vila, M.; Lores, M.; Garcia-Jares, C.; Llompart, M. Development of a Multi-Preservative Method Based on Solid-Phase Microextraction–Gas Chromatography–Tandem Mass Spectrometry for Cosmetic Analysis. J. Chromatogr. A 2014, 1339, 13–25. [Google Scholar] [CrossRef] [PubMed]
- Yi, X.; Guo, D.; Deng, X.; Li, B.; Fan, X.; Zhu, J. Determination of Methanol in Cosmetics by Headspace and Multidimensional Gas Chromatography with Mass Spectrometric Detection. J. AOAC Int. 2011, 94, 655–659. [Google Scholar] [CrossRef] [PubMed]
- Celeiro, M.; Varela, E.; Rodriguez, R.; Penedo, M.; Lores, M. Tracking Bacterial Spoilage in Cosmetics by a New Bioanalytical Approach: API-SPME-GC-MS to Monitor MVOCs. Cosmetics 2020, 7, 38. [Google Scholar] [CrossRef]
- Acree, T.E. Peer Reviewed: GC/Olfactometry GC With a Sense of Smell. Anal. Chem. 2011, 69, 170A–175A. [Google Scholar] [CrossRef]
- Aghoutane, Y.; Brebu, M.; Moufid, M.; Ionescu, R.; Bouchikhi, B.; El Bari, N. Detection of Counterfeit Perfumes by Using GC-MS Technique and Electronic Nose System Combined with Chemometric Tools. Micromachines 2023, 14, 524. [Google Scholar] [CrossRef]
- Van Asten, A. The Importance of GC and GC-MS in Perfume Analysis. TrAC Trends Anal. Chem. 2002, 21, 698–708. [Google Scholar] [CrossRef]
- Wardencki, W.; Chmiel, T.; Dymerski, T. Gas Chromatography-Olfactometry (GC-O), Electronic Noses (e-Noses) and Electronic Tongues (e-Tongues) for in Vivo Food Flavour Measurement. Instrum. Assess. Food Sens. Qual. 2013, 195–229. [Google Scholar] [CrossRef]
- De-La-fuente-blanco, A.; Ferreira, V. Gas Chromatography Olfactometry (GC-O) for the (Semi)Quantitative Screening of Wine Aroma. Foods 2020, 9, 1892. [Google Scholar] [CrossRef]
- Fuller, G.H.; Steltenkamp, R.; Tisserand, G.A. The Gas Chromatograph with Human Sensor: Perfumer Model. Ann. N. Y. Acad. Sci. 1964, 116, 711–724. [Google Scholar] [CrossRef]
- Reineccius, G. Choosing the Correct Analytical Technique in Aroma Analysis. In Flavour in Food; Elsevier: Amsterdam, The Netherlands, 2006; pp. 81–97. [Google Scholar]
- Delahunty, C.M.; Eyres, G.; Dufour, J.P. Gas Chromatography-Olfactometry. J. Sep. Sci. 2006, 29, 2107–2125. [Google Scholar] [CrossRef] [PubMed]
- Blank, I.; Fischer, K.-H.; Grosch, W. Intensive Neutral Odourants of Linden Honey Differences from Honeys of Other Botanical Origin. Z. Für Lebensm. Unters. Und Forsch. 1989, 189, 426–433. [Google Scholar] [CrossRef]
- Acree, T.E.; Barnard, J.; Cunningham, D.G. A Procedure for the Sensory Analysis of Gas Chromatographic Effluents. Food Chem. 1984, 14, 273–286. [Google Scholar] [CrossRef]
- Pollien, P.; Ott, A.; Montigon, F.; Baumgartner, M.; Muñoz-Box, R.; Chaintreau, A. Hyphenated Headspace-Gas Chromatography-Sniffing Technique: Screening of Impact Odorants and Quantitative Aromagram Comparisons. J. Agric. Food Chem. 1997, 45, 2630–2637. [Google Scholar] [CrossRef]
- d’Acampora Zellner, B.; Dugo, P.; Dugo, G.; Mondello, L. Gas Chromatography-Olfactometry in Food Flavour Analysis. J. Chromatogr. A 2008, 1186, 123–143. [Google Scholar] [CrossRef] [PubMed]
- Stevens, S.S. Issues in Psychophysical Measurement. Psychol. Rev. 1971, 78, 426–450. [Google Scholar] [CrossRef]
- Plutowska, B.; Wardencki, W. Gas Chromatography-Olfactometry of Alcoholic Beverages. Alcohol. Beverages 2012, 101–130. [Google Scholar] [CrossRef]
- Karakaya, D.; Ulucan, O.; Turkan, M. Electronic Nose and Its Applications: A Survey. Int. J. Autom. Comput. 2020, 17, 179–209. [Google Scholar] [CrossRef]
- Apetrei, C.; Apetrei, I.M.; Villanueva, S.; de Saja, J.A.; Gutierrez-Rosales, F.; Rodriguez-Mendez, M.L. Combination of an E-Nose, an e-Tongue and an e-Eye for the Characterisation of Olive Oils with Different Degree of Bitterness. Anal. Chim. Acta 2010, 663, 91–97. [Google Scholar] [CrossRef]
- Tothill, I.E.; Turner, A.P.F. Biosensors. Encycl. Food Sci. Nutr. 2003, 489–499. [Google Scholar] [CrossRef]
- Mottram, D.S.; Elmore, J.S. Sensory Evaluation|Aroma. Encycl. Food Sci. Nutr. 2003, 5174–5180. [Google Scholar] [CrossRef]
- Sberveglieri, G.; Greco, G.; Genzardi, D.; Núñez-Carmona, E.; Pezzottini, S.; Sberveglieri, V. The Electronic Nose: Review on Sensor Arrays and Future Perspectives. Chem. Eng. Trans. 2022, 95, 265–270. [Google Scholar] [CrossRef]
- Pearce, T.C.; Schiffman, S.S.; Nagle, H.T.; Gardner, J.W. (Eds.) Handbook of Machine Olfaction: Electronic Nose Technology; Wiley VCH: Weinheim, Germany, 2006; Volume 7, pp. 956–963. [Google Scholar]
- Nagle, H.T.; Schiffman, S.S.; Gutierrez-Osuna, R. How and Why of Electronic Noses. IEEE Spectr. 1998, 35, 22–34. [Google Scholar] [CrossRef]
- Romain, A.C.; Nicolas, J. Long Term Stability of Metal Oxide-Based Gas Sensors for e-Nose Environmental Applications: An Overview. Sens. Actuators B Chem. 2010, 146, 502–506. [Google Scholar] [CrossRef]
- Berna, A. Metal Oxide Sensors for Electronic Noses and Their Application to Food Analysis. Sensors 2010, 10, 3882–3910. [Google Scholar] [CrossRef] [PubMed]
- Chen, P.-C.; Shen, G.; Zhou, C. Chemical Sensors and Electronic Noses Based on 1-D Metal Oxide Nanostructures. IEEE Trans. Nanotechnol. 2008, 7, 668–682. [Google Scholar] [CrossRef]
- Arshak, K.; Moore, E.; Lyons, G.M.; Harris, J.; Clifford, S. A Review of Gas Sensors Employed in Electronic Nose Applications. Sens. Rev. 2004, 24, 181–198. [Google Scholar] [CrossRef]
- Korotcenkov, G. Metal Oxides for Solid-State Gas Sensors: What Determines Our Choice? Mater. Sci. Eng. B 2007, 139, 1–23. [Google Scholar] [CrossRef]
- Muñoz, B.C.; Steinthal, G.; Sunshine, S. Conductive Polymer-Carbon Black Composites-Based Sensor Arrays for Use in an Electronic Nose. Sens. Rev. 1999, 19, 300–305. [Google Scholar] [CrossRef]
- Scott, S.M.; James, D.; Ali, Z. Data Analysis for Electronic Nose Systems. Microchim. Acta 2006, 156, 183–207. [Google Scholar] [CrossRef]
- Julian, T.; Hidayat, S.N.; Rianjanu, A.; Dharmawan, A.B.; Wasisto, H.S.; Triyana, K. Intelligent Mobile Electronic Nose System Comprising a Hybrid Polymer-Functionalized Quartz Crystal Microbalance Sensor Array. ACS Omega 2020, 5, 29492–29503. [Google Scholar] [CrossRef] [PubMed]
- Rivai, M.; Purwanto, D.; Juwono, H.; Sujono, H.A. Electronic Nose Using Gas Chromatography Column and Quartz Crystal Microbalance. Telkomnika Telecommun. Comput. Electron. Control 2011, 9, 319–326. [Google Scholar] [CrossRef]
- Huang, X.; Bai, Q.; Hu, J.; Hou, D. A Practical Model of Quartz Crystal Microbalance in Actual Applications. Sensors 2017, 17, 1785. [Google Scholar] [CrossRef] [PubMed]
- Blank, I. Gas Chromatography-Olfactometry in Food Aroma Analisys. In Flavor, Fragrance and Odor Analysis; CRC Press: Boca Raton, FL, USA, 2002; pp. 297–331. [Google Scholar]
- Swift, K.A.D. Advances in Flavours and Fragrances: From the Sensation to the Synthesis; Royal Society of Chemistry: London, UK, 2002; Volume 124, p. 7877. ISBN 0854048219. [Google Scholar]
- Guć, M.; Cegłowski, M.; Pawlaczyk, M.; Kurczewska, J.; Reszke, E.; Schroeder, G. Application of FAPA Mass Spectrometry for Analysis of Fragrance Ingredients Used in Cosmetics. Measurement 2021, 168, 108326. [Google Scholar] [CrossRef]
- Mishra, J.; Sahgal, N. Navigating the Noteworthy: Regulating the Vulnerability of the Fragrance Industry. Indian J. Intellect. Prop. Law 2017, 8, 27. [Google Scholar]
- Dunn, M.S.; Vulic, N.; Shellie, R.A.; Whitehead, S.; Morrison, P.; Marriott, P.J. Targeted multidimensional gas chromatography for the quantitative analysis of suspected allergens in fragrance products. J. Chromatogr. A 2006, 1130, 122–129. [Google Scholar] [CrossRef]
- Cano, M.; Borrego, V.; Roales, J.; Idígoras, J.; Lopes-Costa, T.; Mendoza, P.; Pedrosa, J.M. Rapid discrimination and counterfeit detection of perfumes by an electronic olfactory system. Sens. Actuators B Chem. 2011, 156, 319–324. [Google Scholar] [CrossRef]
- Penza, M.; Cassano, G.; Tortorella, F.; Zaccaria, G. Classification of Food, Beverages and Perfumes by WO3 Thin-Film Sensors Array and Pattern Recognition Techniques. Sens. Actuators B Chem. 2001, 73, 76–87. [Google Scholar] [CrossRef]
- Hayase, M. Chapter 10—Introduction to Cosmetic Materials. In Cosmetic Science and Technology; Sakamoto, K., Lochhead, R.Y., Maibach, H.I., Yamashita, Y., Eds.; Elsevier: Amsterdam, The Netherlands, 2017; pp. 149–154. ISBN 978-0-12-802005-0. [Google Scholar]
- Marquez, R.; Forgiarini, A.M.; Langevin, D.; Salager, J.-L. Instability of Emulsions Made with Surfactant–Oil–Water Systems at Optimum Formulation with Ultralow Interfacial Tension. Langmuir 2018, 34, 9252–9263. [Google Scholar] [CrossRef]
- Wu, F.; Deng, J.; Hu, L.; Zhang, Z.; Jiang, H.; Li, Y.; Yi, Z.; Ngai, T. Investigation of the Stability in Pickering Emulsions Preparation with Commercial Cosmetic Ingredients. Colloids Surf. Physicochem. Eng. Asp. 2020, 602, 125082. [Google Scholar] [CrossRef]
- Ravera, F.; Dziza, K.; Santini, E.; Cristofolini, L.; Liggieri, L. Emulsification and Emulsion Stability: The Role of the Interfacial Properties. Adv. Colloid Interface Sci. 2021, 288, 102344. [Google Scholar] [CrossRef] [PubMed]
- Benson, H.A.E.; Benson, H.; Roberts, M.S.; Leite-Silva, V.R.; Walters, K. Cosmetic Formulation: Principles and Practice; CRC Press: Boca Raton, FL, USA, 2019; ISBN 978-1-4822-3540-1. [Google Scholar]
- Cosmetic Creams: Development, Manufacture and Marketing of Effective Skin Care Products|Wiley. Available online: https://0-www-wiley-com.brum.beds.ac.uk/en-us/Cosmetic+Creams%3A+Development%2C+Manufacture+and+Marketing+of+Effective+Skin+Care+Products-p-9783527812455 (accessed on 2 October 2023).
- Marquez, R.; Zwilling, J.; Zambrano, F.; Tolosa, L.; Marquez, M.E.; Venditti, R.; Jameel, H.; Gonzalez, R. Nanoparticles and Essential Oils with Antiviral Activity on Packaging and Surfaces: An Overview of Their Selection and Application. J. Surfactants Deterg. 2022, 25, 667–701. [Google Scholar] [CrossRef]
- Shao, P.; Feng, J.; Sun, P.; Xiang, N.; Lu, B.; Qiu, D. Recent Advances in Improving Stability of Food Emulsion by Plant Polysaccharides. Food Res. Int. 2020, 137, 109376. [Google Scholar] [CrossRef] [PubMed]
- Langevin, D. Recent Advances on Emulsion and Foam Stability. Langmuir 2023, 39, 3821–3828. [Google Scholar] [CrossRef] [PubMed]
- Marquez, R.; Ontiveros, J.F.; Barrios, N.; Tolosa, L.; Palazzo, G.; Nardello-Rataj, V.; Salager, J.L. Advantages and Limitations of Different Methods to Determine the Optimum Formulation in Surfactant–Oil–Water Systems: A Review. J. Surfactants Deterg. 2023, n/a. [Google Scholar] [CrossRef]
- Zamora, J.M.; Marquez, R.; Forgiarini, A.M.; Langevin, D.; Salager, J.-L. Interfacial Rheology of Low Interfacial Tension Systems Using a New Oscillating Spinning Drop Method. J. Colloid Interface Sci. 2018, 519, 27–37. [Google Scholar] [CrossRef] [PubMed]
- Marquez, R.; Forgiarini, A.M.; Fernández, J.; Langevin, D.; Salager, J.-L. New Interfacial Rheology Characteristics Measured Using a Spinning-Drop Rheometer at the Optimum Formulation of a Simple Surfactant–Oil–Water System. J. Surfactants Deterg. 2018, 21, 611–623. [Google Scholar] [CrossRef]
- Langevin, D. An Adventure into the World of Soft Matter. Annu. Rev. Condens. Matter Phys. 2023, 14, 21–33. [Google Scholar] [CrossRef]
- Alsmaeil, A.W.; Kouloumpis, A.; Potsi, G.; Hammami, M.A.; Kanj, M.Y.; Giannelis, E.P. Probing the Interfacial Properties of Oil–Water Interfaces Decorated with Ionizable, pH Responsive Silica Nanoparticles. Langmuir 2023, 39, 3118–3130. [Google Scholar] [CrossRef]
- Beltrán, R.A.P. Johnbrynner García Thermal Behavior of Waxes and Its Correlation with Mascara Stability Tests: A DSC Study. In Cosmetic Products and Industry; Ahmad, U., Akhtar, J., Eds.; IntechOpen: Rijeka, Croatia, 2023; p. Ch. 5. ISBN 978-1-83768-623-0. [Google Scholar]
- Capra, P.; Musitelli, G.; Perugini, P. Wetting and Adhesion Evaluation of Cosmetic Ingredients and Products: Correlation of in Vitro-in Vivo Contact Angle Measurements. Int. J. Cosmet. Sci. 2017, 39, 393–401. [Google Scholar] [CrossRef] [PubMed]
- McClements, D.J. Critical Review of Techniques and Methodologies for Characterization of Emulsion Stability. Crit. Rev. Food Sci. Nutr. 2007, 47, 611–649. [Google Scholar] [CrossRef] [PubMed]
- Niu, H.; Wang, W.; Dou, Z.; Chen, X.; Chen, X.; Chen, H.; Fu, X. Multiscale Combined Techniques for Evaluating Emulsion Stability: A Critical Review. Adv. Colloid Interface Sci. 2023, 311, 102813. [Google Scholar] [CrossRef] [PubMed]
- Mancuso, A.; Tarsitano, M.; Udongo, B.P.; Cristiano, M.C.; Torella, D.; Paolino, D.; Fresta, M. A Comparison between Silicone-Free and Silicone-Based Emulsions: Technological Features and in Vivo Evaluation. Int. J. Cosmet. Sci. 2022, 44, 514–529. [Google Scholar] [CrossRef] [PubMed]
- Li, D.; Zhao, Y.; Wang, X.; Tang, H.; Wu, N.; Wu, F.; Yu, D.; Elfalleh, W. Effects of (+)-Catechin on a Rice Bran Protein Oil-in-Water Emulsion: Droplet Size, Zeta-Potential, Emulsifying Properties, and Rheological Behavior. Food Hydrocoll. 2020, 98, 105306. [Google Scholar] [CrossRef]
- Sęk, A.; Perczyk, P.; Wydro, P.; Gruszecki, W.I.; Szcześ, A. Effect of Trace Amounts of Ionic Surfactants on the Zeta Potential of DPPC Liposomes. Chem. Phys. Lipids 2021, 235, 105059. [Google Scholar] [CrossRef] [PubMed]
- Hong, I.K.; Kim, S.I.; Lee, S.B. Effects of HLB Value on Oil-in-Water Emulsions: Droplet Size, Rheological Behavior, Zeta-Potential, and Creaming Index. J. Ind. Eng. Chem. 2018, 67, 123–131. [Google Scholar] [CrossRef]
- Li, J.-M.; Nie, S.-P. The Functional and Nutritional Aspects of Hydrocolloids in Foods. Food Hydrocoll. 2016, 53, 46–61. [Google Scholar] [CrossRef]
- Geremias-Andrade, I.M.; Souki, N.P.D.B.G.; Moraes, I.C.F.; Pinho, S.C. Rheological and Mechanical Characterization of Curcumin-Loaded Emulsion-Filled Gels Produced with Whey Protein Isolate and Xanthan Gum. LWT 2017, 86, 166–173. [Google Scholar] [CrossRef]
- Khasa, H.; Kilby, G.; Chen, X.; Wang, C. Analytical Band Centrifugation for the Separation and Quantification of Empty and Full AAV Particles. Mol. Ther. Methods Clin. Dev. 2021, 21, 585–591. [Google Scholar] [CrossRef]
- Ullmann, C.; Babick, F.; Koeber, R.; Stintz, M. Performance of Analytical Centrifugation for the Particle Size Analysis of Real-World Materials. Powder Technol. 2017, 319, 261–270. [Google Scholar] [CrossRef]
- Mehn, D.; Rio-Echevarria, I.M.; Gilliland, D.; Kaiser, M.; Vilsmeier, K.; Schuck, P.; Wohlleben, W. Identification of nanomaterials: A validation report of two laboratories using analytical ultracentrifugation with fixed and ramped speed options. NanoImpact 2018, 10, 87–96. [Google Scholar] [CrossRef]
- Laue, T.M. Analytical Ultracentrifugation. Curr. Protoc. Protein Sci. 1996, 4, 7.5.1–7.5.9. [Google Scholar] [CrossRef]
- Schuldt, U.; Woehlecke, H.; Lerche, D. Characterization of Mechanical Parameters of Microbeads by Means of Analytical Centrifugation. Food Hydrocoll. 2019, 86, 201–209. [Google Scholar] [CrossRef]
- Oshima, K.; Nakamura, K.; Guo, H.; Smith, R.L. Mini-Review on Application of Analytical Centrifugation, Ultracentrifugation and Centrifugal Devices to Phase Equilibria and Separation Processes. Fluid Phase Equilibria 2022, 558, 113457. [Google Scholar] [CrossRef]
- Cole, J.L. Centrifugation|Analytical Ultracentrifugation; Elsevier: Amsterdam, The Netherlands, 2013. [Google Scholar] [CrossRef]
- Wohlleben, W.; Coleman, V.A.; Gilliland, D. Chapter 3.3.1—Analytical Centrifugation. In Characterization of Nanoparticles; Hodoroaba, V.-D., Unger, W.E.S., Shard, A.G., Eds.; Micro and Nano Technologies; Elsevier: Amsterdam, The Netherlands, 2020; pp. 225–247. ISBN 978-0-12-814182-3. [Google Scholar]
- Detloff, T.; Sobisch, T.; Lerche, D. Particle Size Distribution by Space or Time Dependent Extinction Profiles Obtained by Analytical Centrifugation (Concentrated Systems). Powder Technol. 2007, 174, 50–55. [Google Scholar] [CrossRef]
- Pereira, I.; Zielińska, A.; Ferreira, N.R.; Silva, A.M.; Souto, E.B. Optimization of Linalool-Loaded Solid Lipid Nanoparticles Using Experimental Factorial Design and Long-Term Stability Studies with a New Centrifugal Sedimentation Method. Int. J. Pharm. 2018, 549, 261–270. [Google Scholar] [CrossRef]
- Tehrani-Bagha, A.R. Cationic Gemini Surfactant with Cleavable Spacer: Emulsion Stability. Colloids Surf. Physicochem. Eng. Asp. 2016, 508, 79–84. [Google Scholar] [CrossRef]
- Kadiya, K.; Ghosh, S. Analytical Photo-Centrifuge-Based Prediction of Shelf-Life and Droplet Packing Behaviour of Nanoemulsions upon Removal of Excess Micelles. Colloids Surf. Physicochem. Eng. Asp. 2021, 612, 125869. [Google Scholar] [CrossRef]
- Delforce, L.; Ontiveros, J.F.; Nardello-Rataj, V.; Aubry, J.-M. Rational Design of O/W Nanoemulsions Based on the Surfactant Dodecyldiglyceryl Ether Using the Normalized HLD Concept and the Formulation-Composition Map. Colloids Surf. Physicochem. Eng. Asp. 2023, 671, 131679. [Google Scholar] [CrossRef]
- Delforce, L.; Nardello-Rataj, V.; Lebeuf, R.; Aubry, J.-M.; Ontiveros, J.F. Self-Aggregation, Dilational Surface Rheology and Foaming Properties of 1-O-Dodecyl Diglyceryl Ether Compared to n-Dodecyl-β-D-Maltoside and Pentaethyleneglycol Monododecyl Ether. J. Mol. Liq. 2023, 388, 122795. [Google Scholar] [CrossRef]
- Marquez, R.; Bullon, J.; Forgiarini, A.; Salager, J.-L. The Oscillatory Spinning Drop Technique. An Innovative Method to Measure Dilational Interfacial Rheological Properties of Brine-Crude Oil Systems in the Presence of Asphaltenes. Colloids Interfaces 2021, 5, 42. [Google Scholar] [CrossRef]
- Ricardo, F.; Ruiz-Puentes, P.; Reyes, L.H.; Cruz, J.C.; Alvarez, O.; Pradilla, D. Estimation and Prediction of the Air–Water Interfacial Tension in Conventional and Peptide Surface-Active Agents by Random Forest Regression. Chem. Eng. Sci. 2023, 265, 118208. [Google Scholar] [CrossRef]
- Li, P.; Huang, H.; Fang, Y.; Wang, Y.; No, D.S.; Bhatnagar, R.S.; Abbaspourrad, A. Interfacial Engineering of Clear Emulsions: Surfactant Hydrophobicity and the Hidden Role of Chain Structure. Colloids Surf. Physicochem. Eng. Asp. 2023, 676, 132242. [Google Scholar] [CrossRef]
- Ho, T.M.; Razzaghi, A.; Ramachandran, A.; Mikkonen, K.S. Emulsion Characterization via Microfluidic Devices: A Review on Interfacial Tension and Stability to Coalescence. Adv. Colloid Interface Sci. 2022, 299, 102541. [Google Scholar] [CrossRef]
- Vera, R.E.; Salazar-Rodríguez, F.; Marquez, R.; Forgiarini, A.M. How the influence of different salts on interfacial properties of surfactant–oil–water systems at optimum formulation matches the Hofmeister series ranking. J. Surfactants Deterg. 2020, 23, 603–615. [Google Scholar] [CrossRef]
- Aubry, J.-M.; Ontiveros, J.F.; Salager, J.-L.; Nardello-Rataj, V. Use of the Normalized Hydrophilic-Lipophilic-Deviation (HLDN) Equation for Determining the Equivalent Alkane Carbon Number (EACN) of Oils and the Preferred Alkane Carbon Number (PACN) of Nonionic Surfactants by the Fish-Tail Method (FTM). Adv. Colloid Interface Sci. 2020, 276, 102099. [Google Scholar] [CrossRef]
- Labarre, L.; Squillace, O.; Liu, Y.; Fryer, P.J.; Kaur, P.; Whitaker, S.; Marsh, J.M.; Zhang, Z.J. Hair Surface Interactions against Different Chemical Functional Groups as a Function of Environment and Hair Condition. Int. J. Cosmet. Sci. 2023, 45, 224–235. [Google Scholar] [CrossRef]
- Eudier, F.; Savary, G.; Grisel, M.; Picard, C. Skin Surface Physico-Chemistry: Characteristics, Methods of Measurement, Influencing Factors and Future Developments. Adv. Colloid Interface Sci. 2019, 264, 11–27. [Google Scholar] [CrossRef]
- Rossi, D.; Realdon, N. Surface Tensiometry Approach to Characterize Cosmetic Products in the Beauty Sector. In Surface Science and Adhesion in Cosmetics; John Wiley & Sons, Ltd.: Hoboken, NJ, USA, 2021; pp. 309–352. ISBN 978-1-119-65492-6. [Google Scholar]
- Influence of the Sebum and the Hydrolipidic Layer in Skin Wettability and Friction. In Agache’s Measuring the Skin; SpringerLink: Berlin/Heidelberg, Germany, 2017; Available online: https://0-link-springer-com.brum.beds.ac.uk/referenceworkentry/10.1007/978-3-319-32383-1_19 (accessed on 3 October 2023).
- Forgiarini, A.M.; Marquez, R.; Salager, J.-L. Formulation Improvements in the Applications of Surfactant–Oil–Water Systems Using the HLDN Approach with Extended Surfactant Structure. Molecules 2021, 26, 3771. [Google Scholar] [CrossRef]
- Chao, C.; Génot, C.; Rodriguez, C.; Magniez, H.; Lacourt, S.; Fievez, A.; Len, C.; Pezron, I.; Luart, D.; van Hecke, E. Emollients for Cosmetic Formulations: Towards Relationships between Physico-Chemical Properties and Sensory Perceptions. Colloids Surf. Physicochem. Eng. Asp. 2018, 536, 156–164. [Google Scholar] [CrossRef]
- Beard, B.C.; Hare, J. Surface interaction of quaternary amines with hair. J. Surfact Deterg. 2002, 5, 145–150. [Google Scholar] [CrossRef]
- Tadros, T.F. Rheology of Dispersions: Principles and Applications; Wiley-VCH Verlag & Co. KGaA: Weinheim, Germany, 2010; ISBN 9783527320035. [Google Scholar]
- Gallegos, C.; Franco, J.M. Rheology of Food, Cosmetics and Pharmaceuticals. Curr. Opin. Colloid Interface Sci. 1999, 4, 288–293. [Google Scholar] [CrossRef]
- Förster, T. Principles of Emulsion Formation. Surfactants Cosmet. Second Ed. Revis. Expand. 2017, 68, 105–126. [Google Scholar] [CrossRef]
- Tadros, T.F. Colloids in Cosmetics and Personal Care. In Colloids and Interface Science Vol. 4; Tadros, T.F., Ed.; Wiley-VCH Verlag & Co. KGaA: Weinheim, Germany, 2008; Volume 4, ISBN 9783527319916. [Google Scholar]
- Barnes, H.A. Rheology of Emulsions—A Review. Colloids Surf. Physicochem. Eng. Asp. 1994, 91, 89–95. [Google Scholar] [CrossRef]
- Ajayi, O.; Davies, A.; Amin, S. Impact of Processing Conditions on Rheology, Tribology and Wet Lubrication Performance of a Novel Amino Lipid Hair Conditioner. Cosmetics 2021, 8, 77. [Google Scholar] [CrossRef]
- Guzmán, E.; Ortega, F.; Rubio, R.G. Chitosan: A Promising Multifunctional Cosmetic Ingredient for Skin and Hair Care. Cosmetics 2022, 9, 99. [Google Scholar] [CrossRef]
- Tadros, T. Application of Rheology for Assessment and Prediction of the Long-Term Physical Stability of Emulsions. Adv. Colloid Interface Sci. 2004, 108–109, 227–258. [Google Scholar] [CrossRef]
- Salager, J.L.; Antón, R.E.; Briceno, M.I.; Choplin, L.; Márquez, L.; Pizzino, A.; Rodriguez, M.P. The Emergence of Formulation Engineering in Emulsion Making—Transferring Know-How from Research Laboratory to Plant. Polym. Int. 2003, 52, 471–478. [Google Scholar] [CrossRef]
- Szymula, M. The Influence of Ascorbic Acid on the Rheological Properties of the Microemulsion Region of the SDS/Pentanol/Water System. J. Cosmet. Sci. 2005, 56, 267–277. [Google Scholar] [CrossRef]
- Pons, R.; Solans, C.; Stebé, M.J.; Erra, P.; Ravey, J.C. Stability and Rheological Properties of Gel Emulsions. Trends Colloid Interface Sci. VI 2007, 113, 110–113. [Google Scholar] [CrossRef]
- Derkach, S.; Zhabyko, I.; Voron’ko, N.; Maklakova, A.; Dyakina, T. Stability and the Rheological Properties of Concentrated Emulsions Containing Gelatin-κ-Carrageenan Polyelectrolyte Complexes. Colloids Surf. Physicochem. Eng. Asp. 2015, 483, 216–223. [Google Scholar] [CrossRef]
- Hou, Y.Y.; Kassim, H.O. Instrument Techniques for Rheometry. Rev. Sci. Instrum. 2005, 76, 1–19. [Google Scholar] [CrossRef]
- Kao, S.V.; Mason, S.G. Dispersion of Particles by Shear. Nature 1975, 253, 619–621. [Google Scholar] [CrossRef]
- Lequeux, F. Emulsion Rheology. Curr. Opin. Colloid Interface Sci. 1998, 3, 408–411. [Google Scholar] [CrossRef]
- Chanamai, R.; McClements, D.J. Dependence of Creaming and Rheology of Monodisperse Oil-in-Water Emulsions on Droplet Size and Concentration. Colloids Surf. Physicochem. Eng. Asp. 2000, 172, 79–86. [Google Scholar] [CrossRef]
- Matos, M.; Gutiérrez, G.; Iglesias, O.; Coca, J.; Pazos, C. Characterization, Stability and Rheology of Highly Concentrated Monodisperse Emulsions Containing Lutein. Food Hydrocoll. 2015, 49, 156–163. [Google Scholar] [CrossRef]
- Hirschman, J.; Venkataramani, D.; Murphy, M.I.; Patel, S.M.; Du, J.; Amin, S. Application of Thin Gap Rheometry for High Shear Rate Viscosity Measurement in Monoclonal Antibody Formulations. Colloids Surf. Physicochem. Eng. Asp. 2021, 626, 127018. [Google Scholar] [CrossRef]
- Venkataramani, D.; Tsulaia, A.; Amin, S. Fundamentals and Applications of Particle Stabilized Emulsions in Cosmetic Formulations. Adv. Colloid Interface Sci. 2020, 283, 102234. [Google Scholar] [CrossRef]
- Farias, B.V.; Khan, S.A. Probing Gels and Emulsions Using Large-Amplitude Oscillatory Shear and Frictional Studies with Soft Substrate Skin Surrogates. Colloids Surf. B Biointerfaces 2021, 201, 111595. [Google Scholar] [CrossRef]
- Lee, S.; Kim, S.R.; Lee, H.-J.; Kim, B.S.; Oh, H.; Lee, J.B.; Park, K.; Yi, Y.J.; Park, C.H.; Park, J.D. Predictive Model for the Spreadability of Cosmetic Formulations Based on Large Amplitude Oscillatory Shear (LAOS) and Machine Learning. Phys. Fluids 2022, 34, 103109. [Google Scholar] [CrossRef]
- Márquez, R.; Bullón, J.; Márquez, L.; Cárdenas, A.; Briceño, M.I.; Forgiarini, A. Rheological Changes of Parenteral Emulsions During Phase-Inversion Emulsification. J. Dispers. Sci. Technol. 2008, 29, 621–627. [Google Scholar] [CrossRef]
- Huynh, A.; Garcia, A.G.; Young, L.K.; Szoboszlai, M.; Liberatore, M.W.; Baki, G. Measurements Meet Perceptions: Rheology–Texture–Sensory Relations When Using Green, Bio-Derived Emollients in Cosmetic Emulsions. Int. J. Cosmet. Sci. 2021, 43, 11–19. [Google Scholar] [CrossRef] [PubMed]
- Tai, A.; Bianchini, R.; Jachowicz, J. Texture Analysis of Cosmetic/Pharmaceutical Raw Materials and Formulations. Int. J. Cosmet. Sci. 2014, 36, 291–304. [Google Scholar] [CrossRef] [PubMed]
- Anton Paar Rheology of Cosmetics 2023. Available online: https://wiki.anton-paar.com/us-en/basics-of-rheology/rheological-investigation-of-cosmetics-and-pharmaceuticals/ (accessed on 10 October 2023).
- Morris, R. Spectrophotometry. Curr. Protoc. Essent. Lab. Tech. 2008, 00, 2.1.1–2.1.24. [Google Scholar] [CrossRef]
- Measure Color in the Cosmetics Industry. Konica Minolta Sens. Available online: https://sensing.konicaminolta.us/us/learning-center/youtube/measure-color-in-the-cosmetics-industry/ (accessed on 10 October 2023).
- Weisz, A.; Milstein, S.R.; Scher, A.L.; Hepp, N.M. Chapter 7—Colouring Agents in Cosmetics: Regulatory Aspects and Analytical Methods. In Analysis of Cosmetic Products, 2nd ed.; Salvador, A., Chisvert, A., Eds.; Elsevier: Boston, MA, USA, 2018; pp. 123–157. ISBN 978-0-444-63508-2. [Google Scholar]
- Samanta, A.K. Colorimetry; Intechopen: London, UK, 2022; ISBN 978-1-83962-940-2. [Google Scholar]
- Raluca, B. A Review of Color Measurments in the Textile Industry; Editura Universităţii din Oradea: Oradea, Romania, 2016. [Google Scholar]
- Choudhury, A.K.R. Principles of Colour and Appearance Measurement: Object Appearance, Colour Perception and Instrumental Measurement; Elsevier: Amsterdam, The Netherlands, 2014; ISBN 978-0-85709-924-2. [Google Scholar]
- Kuehni, R.G. Colour Difference Formulaes; Accurate Enough for Objective Colour Quality Control of Textiles? Color. Technol. 2003, 119, 164–169. [Google Scholar] [CrossRef]
- Volz, H.G. Industrial Color Testing: Fundamentals and Techniques/Hans G. Volz; Translated by Ben Teague; Wiley-VCH: Weinheim, Germany; New York, NY, USA, 2001; ISBN 978-3-527-30436-3. [Google Scholar]
- Meyers, R.A. Encyclopedia of Physical Sciences and Technology; Academic Press: Cambridge, MA, USA, 1992. [Google Scholar]
- Mukthy, A.A.; Vik, M.; Viková, M. A Comparison of Two Different Light Booths for Measuring Color Difference of Metameric Pairs. Textiles 2021, 1, 558–570. [Google Scholar] [CrossRef]
- Fotios, S.; Cheal, C.; Boyce, P. Light Source Spectrum, Brightness Perception and Visual Performance in Pedestrian Environments: A Review. Light. Res. Technol. 2005, 37, 271–291. [Google Scholar] [CrossRef]
- Standard Practice for Visual Appraisal of Colors and Color Differences of Diffusely-Illuminated Opaque Materials. Available online: https://www.astm.org/d1729-22.html (accessed on 23 October 2023).
- Sha, D.R.K. The Concepts of Color Matching and Shade Selection in Prosthodontics; Book Rivers: Lucknow, India, 2021; ISBN 978-93-91000-32-5. [Google Scholar]
- Zollinger, H. Color Chemistry: Syntheses, Properties, and Applications of Organic Dyes and Pigments; John Wiley & Sons: Hoboken, NJ, USA, 2003; ISBN 978-3-906390-23-9. [Google Scholar]
- Zelanski, P.; Fisher, M.P. Color; Ediciones AKAL: Madrid, Spain, 2001; ISBN 978-84-89840-21-8. [Google Scholar]
- Hubel, D.H. Ojo, Cerebro y Visión; EDITUM, Universidad de Murcia: Murcia, Spain, 2000; ISBN 978-84-8371-143-9. [Google Scholar]
- Capilla, P.; Artigas, J.M.; Pujol, J. Fundamentos de Colorimetría; Universitat de València: Valencia, Spain, 2002; ISBN 978-84-370-5420-9. [Google Scholar]
- Gilchrist, A.; Nobbs, J. Colorimetry, Theory; Academic Press: Cambridge, MA, USA, 2000; pp. 337–343. ISBN 978-0-12-226680-5. [Google Scholar]
- Ji, K.; Xue, Y.; Cui, Z. A New Method for Colors Characterization of Colored Stainless Steel Using CIE and Munsell Color Systems. Opt. Mater. 2015, 47, 180–184. [Google Scholar] [CrossRef]
- Atlas of the Munsell Color System; Munsell Color Syst. Color Matching Munsell Color Co. Malden, Mass., Wadsworth, Howland & Co.: Wadsworth, OU, USA, 2014.
- Priest, I.G.; Gibson, K.S.; McNicholas, H.J. An Examination of the Munsell Color System: I. Spectral and Total Reflection and the Munsell Scale of Value; U.S. Government Printing Office: Washington, DC, USA, 1920.
- Wang, J.; Shi, G. Comparative Study on the Origin and Characteristics of Chinese (Manas) and Russian (East Sayan) Green Nephrites. Minerals 2021, 11, 1434. [Google Scholar] [CrossRef]
- González, A.M.; Vicente, I. El color en la Industria de los Alimentos; Editorial Universitaria: Habana, Cuba, 2020; ISBN 978-959-16-0582-5. [Google Scholar]
- Monedero Isorna, J. Simulación Visual de Materiales: Teoría, Técnicas, Análisis de Casos; Iniciativa Digital Politècnica: Madrid, Spain, 2015; ISBN 978-84-9880-564-2. [Google Scholar]
- Alizadeh Ghazijahani, H.; Abdollahzadeh, M.; Seyedarabi, H.; Musevi Niya, M.J. On Error and Bitrate Tradeoff in Visible Light Communication System to Ensure HEVC Video Quality. Int. J. Inf. Commun. Technol. Res. 2016, 8, 19–27. [Google Scholar]
- McLaren, K. The Development of the CIE 1976 (L*a*b*) Uniform Colour-Space and Colour-Difference Formula. J. Soc. Dye. Colour. 2008, 92, 338–341. [Google Scholar] [CrossRef]
- Ly, B.C.K.; Dyer, E.B.; Feig, J.L.; Chien, A.L.; Del Bino, S. Research Techniques Made Simple: Cutaneous Colorimetry: A Reliable Technique for Objective Skin Color Measurement. J. Invest. Dermatol. 2020, 140, 3–12.e1. [Google Scholar] [CrossRef] [PubMed]
- Hunt, R.W.G.; Pointer, M.R. Measuring Colour; John Wiley & Sons: Hoboken, NJ, USA, 2011; ISBN 978-1-119-97537-3. [Google Scholar]
- Yoshida, K.; Okiyama, N. Estimation of Reflectance, Transmittance, and Absorbance of Cosmetic Foundation Layer on Skin Using Translucency of Skin. Opt. Express 2021, 29, 40038–40050. [Google Scholar] [CrossRef] [PubMed]
- Wyszecki, G.; Stiles, W.S. Color Science: Concepts and Methods, Quantitative Data and Formulae; John Wiley & Sons: Hoboken, NJ, USA, 2000; Volume 40, ISBN 0-471-39918-3. [Google Scholar]
- Blaksley, C.; Casolino, M.; Cambié, G. Design and Performance of a Hyperspectral Camera for Full-Face in Vivo Imaging. Rev. Sci. Instrum. 2021, 92, 055108. [Google Scholar] [CrossRef] [PubMed]
- Sun, M.D.; Kentley, J.; Wilson, B.W.; Soyer, H.P.; Curiel-Lewandrowski, C.N.; Rotemberg, V.; Halpern, A.C. ISIC Technique Working Group Digital Skin Imaging Applications, Part I: Assessment of Image Acquisition Technique Features. Skin Res. Technol. 2022, 28, 623–632. [Google Scholar] [CrossRef] [PubMed]
- Fernandes, G.M.; Silva, W.R.; Barreto, D.N.; Lamarca, R.S.; Lima Gomes, P.C.F.; Flávio da S Petruci, J.; Batista, A.D. Novel Approaches for Colorimetric Measurements in Analytical Chemistry—A Review. Anal. Chim. Acta 2020, 1135, 187–203. [Google Scholar] [CrossRef]
- Berns, R.S. Billmeyer and Saltzman’s Principles of Color Technology; John Wiley & Sons: Hoboken, NJ, USA, 2019; ISBN 1-119-36722-0. [Google Scholar]
- Rocca, R.; Acerbi, F.; Fumagalli, L.; Taisch, M. Sustainability Paradigm in the Cosmetics Industry: State of the Art. Clean. Waste Syst. 2022, 3, 100057. [Google Scholar] [CrossRef]
- Kassim, M.A.; Meng, T.K.; Serri, N.A.; Yusoff, S.B.; Shahrin, N.A.M.; Seng, K.Y.; Bakar, M.H.A.; Keong, L.C. Sustainable Biorefinery Concept for Industrial Bioprocessing. In Biorefinery Production Technologies for Chemicals and Energy; Wiley: Hoboken, NJ, USA, 2020; pp. 15–53. ISBN 978-1-119-59306-5. [Google Scholar]
- Vinod, A.; Sanjay, M.R.; Suchart, S.; Jyotishkumar, P. Renewable and Sustainable Biobased Materials: An Assessment on Biofibers, Biofilms, Biopolymers and Biocomposites. J. Clean. Prod. 2020, 258, 120978. [Google Scholar] [CrossRef]
- Barrios, N.; Marquez, R.; McDonald, J.D.; Hubbe, M.A.; Venditti, R.A.; Pal, L. Innovation in Lignocellulosics Dewatering and Drying for Energy Sustainability and Enhanced Utilization of Forestry, Agriculture, and Marine Resources—A Review. Adv. Colloid Interface Sci. 2023, 318, 102936. [Google Scholar] [CrossRef]
- Marquez, R.; Barrios, N.; Vera, R.E.; Mendez, M.E.; Tolosa, L.; Zambrano, F.; Li, Y. A Perspective on the Synergistic Potential of Artificial Intelligence and Product-Based Learning Strategies in Biobased Materials Education. Educ. Chem. Eng. 2023, 44, 164–180. [Google Scholar] [CrossRef]
- Ariyanta, H.A.; Santoso, E.B.; Suryanegara, L.; Arung, E.T.; Kusuma, I.W.; Azman Mohammad Taib, M.N.; Hussin, M.H.; Yanuar, Y.; Batubara, I.; Fatriasari, W. Recent Progress on the Development of Lignin as Future Ingredient Biobased Cosmetics. Sustain. Chem. Pharm. 2023, 32, 100966. [Google Scholar] [CrossRef]
- Tinôco, D.; Borschiver, S.; Coutinho, P.L.; Freire, D.M.G. Technological Development of the Bio-Based 2,3-Butanediol Process. Biofuels Bioprod. Biorefining 2021, 15, 357–376. [Google Scholar] [CrossRef]
- Kenney, K.L.; Smith, W.A.; Gresham, G.L.; Westover, T.L. Understanding Biomass Feedstock Variability. Biofuels 2013, 4, 111–127. [Google Scholar] [CrossRef]
- Goyal, N.; Jerold, F. Biocosmetics: Technological Advances and Future Outlook. Environ. Sci. Pollut. Res. 2023, 30, 25148–25169. [Google Scholar] [CrossRef]
- Besselink, H.; Brouwer, B.; van der Burg, B. Validation and Regulatory Acceptance of Bio-Based Approaches to Assure Feedstock, Water & Product Quality in a Bio-Based Economy. Chall. Build. Sustain. Biobased Econ. 2017, 106, 138–145. [Google Scholar] [CrossRef]
- Narayan, R. Rationale, Drivers, Standards, and Technology for Biobased Materials. In Renewable Resources and Renewable Energy: A Global Challenge; CRC Press-Taylor and Francis Group: Boca Raton, FL, USA, 2007; pp. 3–18. [Google Scholar]
- Ngoc, L.T.; Moon, J.-Y.; Lee, Y.-C. Insights into Bioactive Peptides in Cosmetics. Cosmetics 2023, 10, 111. [Google Scholar] [CrossRef]
- Ugoeze, K.C.; Odeku, O.A. Chapter 7—Herbal Bioactive–Based Cosmetics. In Herbal Bioactive-Based Drug Delivery Systems; Bakshi, I.S., Bala, R., Madaan, R., Sindhu, R.K., Eds.; Academic Press: Cambridge, MA, USA, 2022; pp. 195–226. ISBN 978-0-12-824385-5. [Google Scholar]
- de Oliveira, C.A.; Dario, M.F. Bioactive Cosmetics. In Handbook of Ecomaterials; Martínez, L.M.T., Kharissova, O.V., Kharisov, B.I., Eds.; Springer International Publishing: Cham, Switzerland, 2019; pp. 3537–3559. ISBN 978-3-319-68255-6. [Google Scholar]
- Mitterer-Daltoé, M.L.; Martins, V.B.; Parabocz, C.R.B.; da Cunha, M.A.A. Use of Cosmetic Creams and Perception of Natural and Eco-Friendly Products by Women: The Role of Sociodemographic Factors. Cosmetics 2023, 10, 78. [Google Scholar] [CrossRef]
- Herrero, Y.R.; Camas, K.L.; Ullah, A. Chapter 4—Characterization of Biobased Materials. In Advanced Applications of Biobased Materials; Ahmed, S., Annu, Eds.; Elsevier: Amsterdam, The Netherlands, 2023; pp. 111–143. ISBN 978-0-323-91677-6. [Google Scholar]


| Stage | Description |
|---|---|
| Systematic Review | Begins with a thorough literature review to identify relevant studies using various analytical methods, aiming to cover a broad spectrum of research related to cosmetic analysis. |
| Comprehensive Data Collection | Involves gathering data from different analytical techniques specific to a cosmetic product, such as chromatography for chemical composition, rheology for texture and consistency, electronic nose for fragrance, and stability testing for shelf-life. |
| Data Integration and Synthesis | Integrates the collected data, which can be challenging due to their diversity. This step often includes standardizing different data forms for a comparative analysis. |
| Statistical Analysis and Modeling | Utilizes advanced statistical techniques and models to analyze the combined data set. This may include meta-regression analyses to understand variable relationships and their impact on a cosmetic product’s overall performance and quality. |
| Holistic Interpretation | Aims to provide a comprehensive understanding of a cosmetic product by interpreting the integrated data in terms of chemical composition, physical properties, sensory attributes, stability, and how these collectively define the product’s characteristics. |
| Application in Product Development and Quality Control | Applies the insights from the meta-analysis to guide product formulation, development, and quality control, ensuring informed decisions which consider various factors affecting the product’s efficacy, safety, and consumer acceptance. |
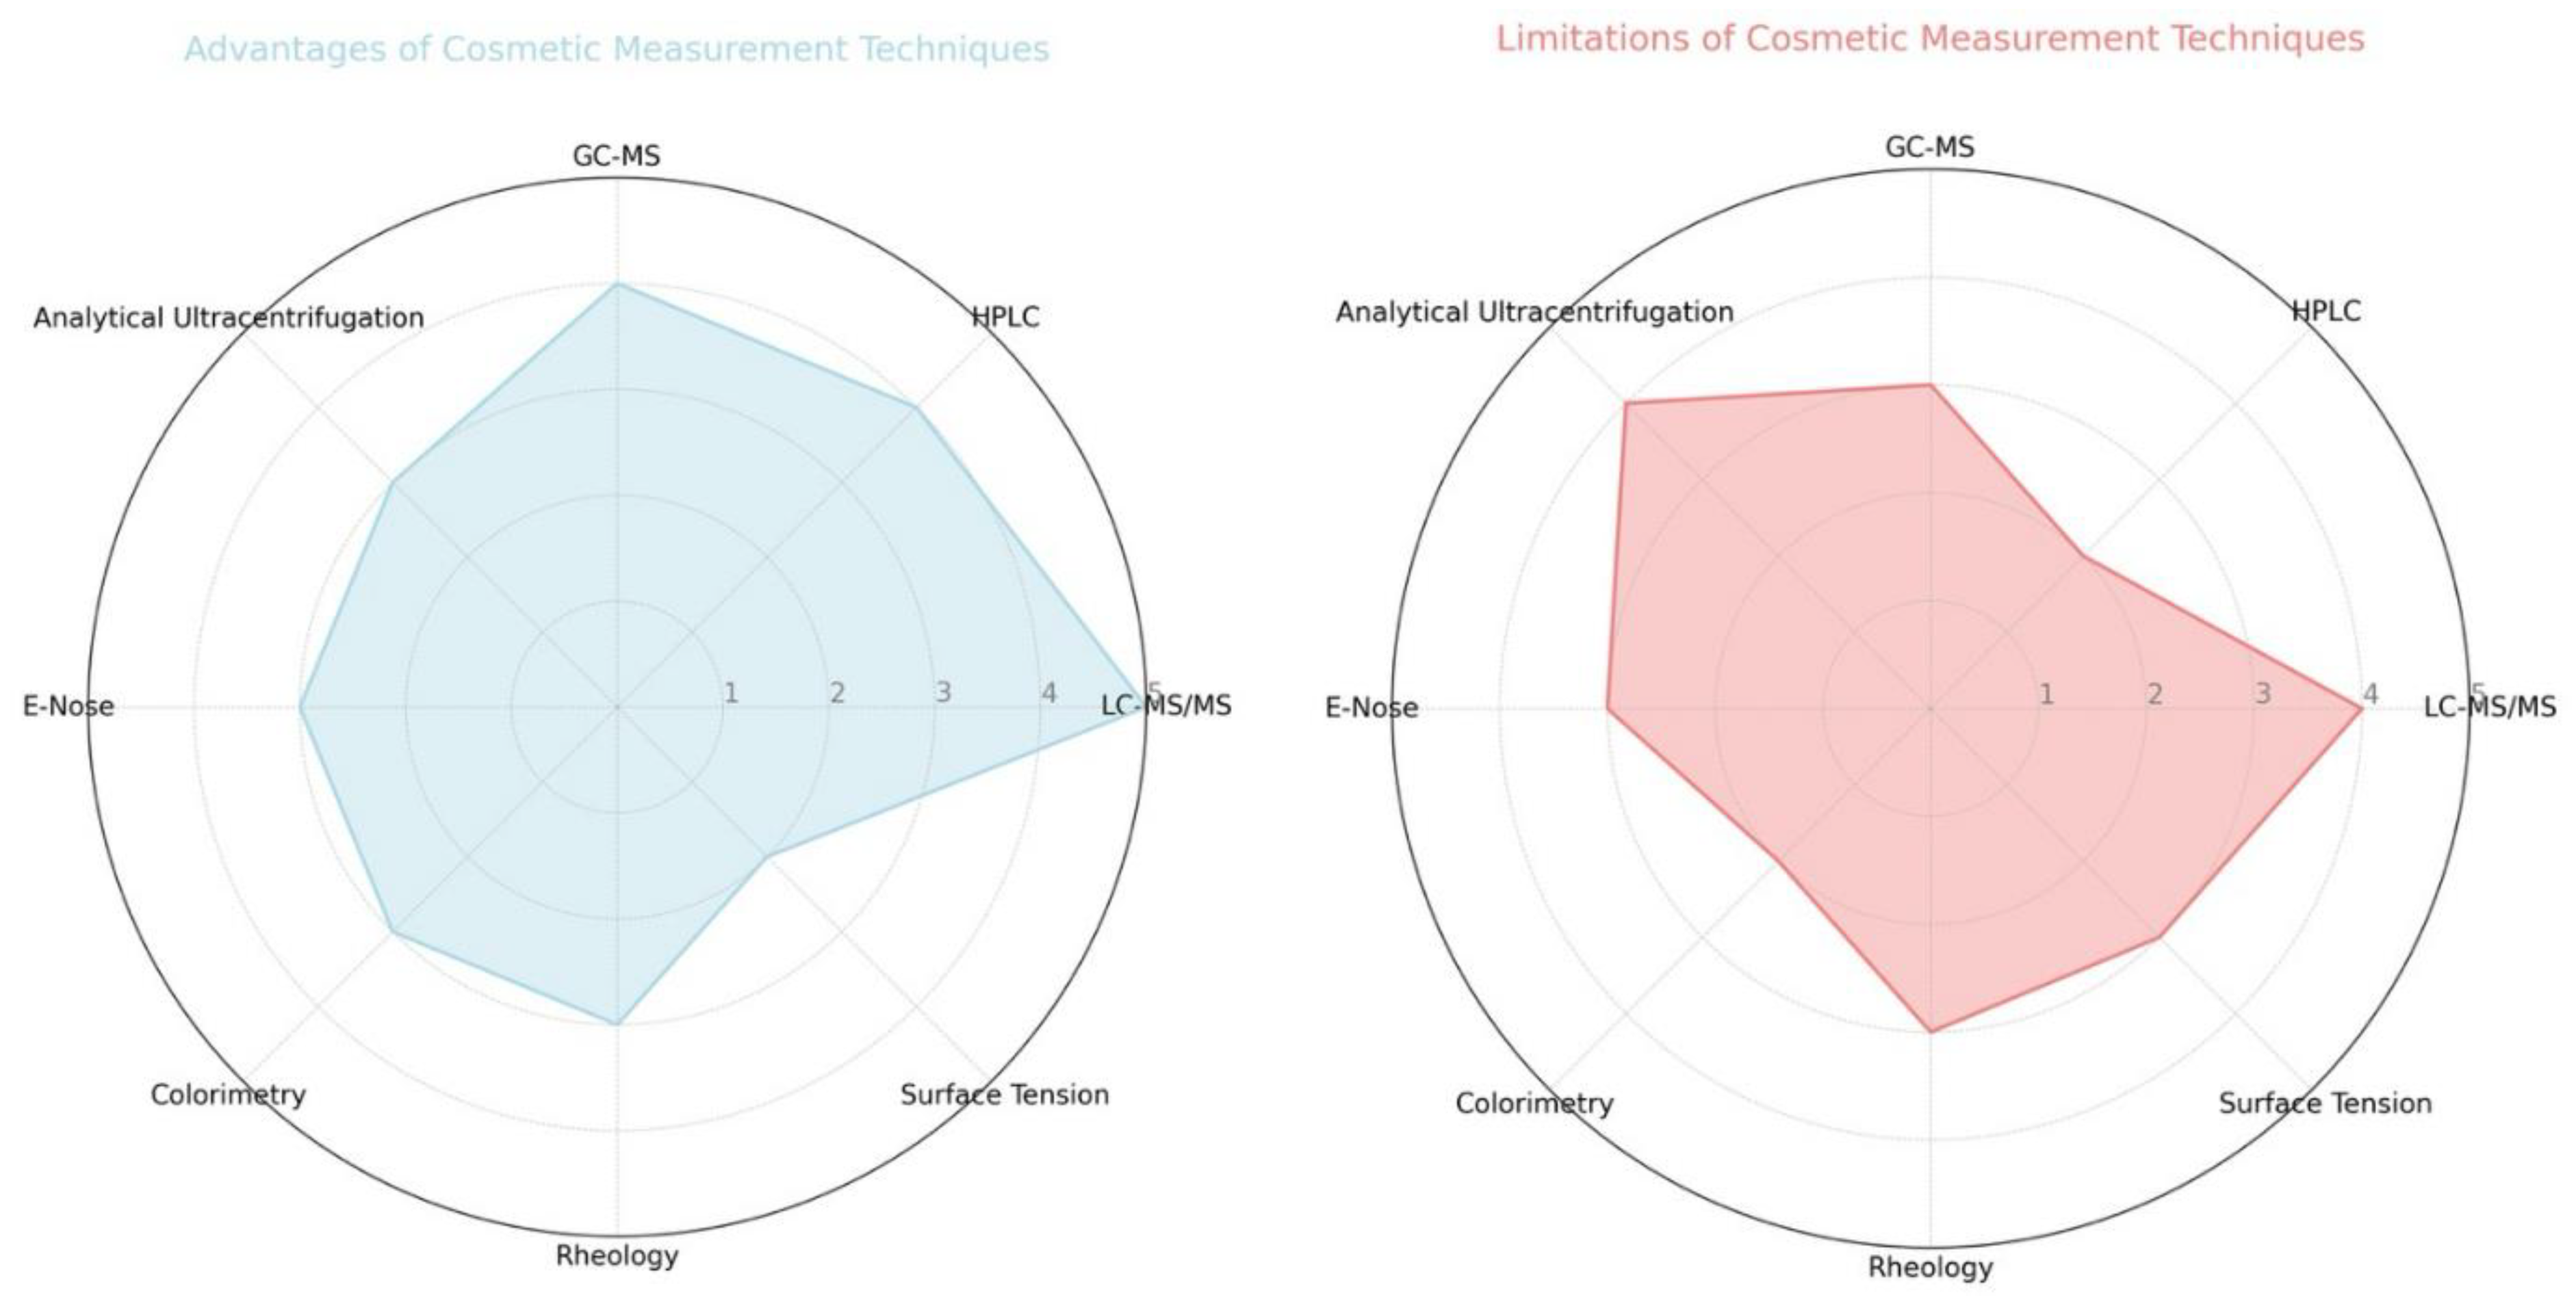
| Type of Technique | Advantages | Limitations | Comparison with Other Techniques | Recent Developments |
|---|---|---|---|---|
| LC-MS/MS | High specificity, sensitive in complex matrices | High cost, expertise needed | More sensitive than HPLC | Advancements in detection limits and sample preparation techniques |
| HPLC | Versatile, widely available | Less sensitive than LC-MS/MS | More accessible than LC-MS/MS | Improvements in column technology for better separation |
| GC-MS | Excellent for volatile compounds | Not suitable for high molecular weight compounds | Superior for volatiles compared to HPLC and LC-MS/MS | Enhanced sensitivity and faster analysis times |
| Electronic Nose | Rapid, suitable for complex aromas | Limited by sensor types, less specific | Faster, more holistic for aroma analysis | Improved sensor technology for better specificity |
| Colorimetry | Simple, quick for color analysis | Limited to surface color, can be subjective | Objective analysis of color compared to other techniques | Integration with digital imaging for enhanced accuracy |
| Rheology | Crucial for texture and viscosity assessment | Can be complex and equipment-dependent | Provides more detailed analysis than simple viscosity measurements | Advances in automation and precision of measurements |
| Surface Tension | Important for understanding foamability and surfactant micellization performance | Limited to specific types of analysis | More detailed than simple foam stability tests | Innovations in measurement techniques for faster and more accurate results |
| Ingredient | Sample | Method | Detection | Reference/Year |
|---|---|---|---|---|
| UV Filters | Samples with sunscreens | LiChrospher® RP-18 (12.5 cm × 4 mm i.d., 5 μm) | UV-Vis | [28]/2005 [29]/2004 |
| UV Filters | Skin lotion, skin emulsion, skin cream, and sunscreen. | Agilent C18 HPLC column (150 mm × 4.6 mm, 5 μm) | UV-Vis | [30]/2018 |
| UV Filters | Sunscreen | Hypersil C18 BDS (100 mm × 4.6 mm i.d. 3 μm) | UV-Vis | [31]/ 2011 |
| Antioxidants and Preservatives | Skin cream | Column C18 (4.6 mm × 250 mm, 5 μm) | MS | [32]/2006 |
| Preservatives | Creams, lotions, shampoos, conditioners, and liquid soap | Zorbax SB-C18 column (12.5 × 4.6 mm i.d., 5 μm) Mobile phase with SDS. | UV-Vis | [41]/2013 |
| Preservatives | Creams | Zorbax Bonus-RP column (100 mm × 2.1 mm i.d., 3.5 μm) Mobile phase: a methanol and ammonium formate solution 0.05 mol/L (pH = 3.0). | UV-Vis | [42]/2012 [43]/2011 |
| Phthalates and Parabens | Hair sprays, perfumes, deodorants, creams, and lotions | Zorbax C8 column (150 mm × 4.6 mm i.d., 3 μm) Mobile phase: methanol and water. | DAD | [44]/2007 |
| Preservatives | Sunblock, hand cream, body cream, and toothpaste. | Column ODS-3 (150 mm × 4.0 mm, 3 μm). | DAD | [45]/2011 [46]/2012 |
| Preservatives | Serum | Column SHIM-PACK XR-ODS® column (100 × 3.0 mm i.d., 2.2 μm) | MS | [47]/2016 |
| Preservatives | Bath products | Column Zorbax Eclipse XDB-C8 (150 × 4.6 mm i.d., 5 μm) | Quimioluminiscence | [48]/2005 |
| Colorants | Lip balm, hair spray, eye shadow, soap, nail polish, shampoos, toothpaste, and face paints. | Column Phenomenex Kinetex C18 (100 mm × 2.1 mm, 2.6 μm) | MS/MS | [49]/2017 |
| Colorants | Lipsticks, lip gloss, nail polish, lip balm, shampoo, perfumes, liquid soaps, shower gels, mouthwashes, and regenerative creams. | Column Thermo Scientific Hypersil Gold (100 mm × 2.1 mm, 1.9 μm) | MS/MS | [50]/2015 |
| Colorants | Hair dye | Shimadzu CLC-ODS, C18, (25 cm × 4.6 mm, 5 μm) | UV | [51]/2015 |
| Colorants | Lipsticks, nail polishes, eye products, blushes, body glitter, face paints, bath products, creams, and toothpaste. | Column Xterra RP18 (250 × 4.6 mm i.d., 5 μm) | PDA | [52]/2014 |
| Type of Cosmetic Product | Characteristics | Measured Properties | Model Used | Important Parameters |
|---|---|---|---|---|
| Hair Gel | Viscoelastic system with high molecular weight polymers, forming a three-dimensional network. | Viscosity, Yield Stress | Herschel–Bulkley model for yield stress calculation | High viscosity during production, high yield stress for consumer perception |
| Nail Polish | Thixotropic material with time-dependent viscosity behavior. | Thixotropic Recovery, Viscosity | Three-interval thixotropy step test | Thixotropic recovery rates affecting application |
| Skin Cream | Emulsion with key focus on tactile experience and long-term stability. | Storage Modulus (G′), Loss Modulus (G″) | Amplitude sweeps in oscillation tests | Storage and loss modulus in the low strain/stress range |
Disclaimer/Publisher’s Note: The statements, opinions and data contained in all publications are solely those of the individual author(s) and contributor(s) and not of MDPI and/or the editor(s). MDPI and/or the editor(s) disclaim responsibility for any injury to people or property resulting from any ideas, methods, instructions or products referred to in the content. |
© 2023 by the authors. Licensee MDPI, Basel, Switzerland. This article is an open access article distributed under the terms and conditions of the Creative Commons Attribution (CC BY) license (https://creativecommons.org/licenses/by/4.0/).
Share and Cite
Rico, F.; Mazabel, A.; Egurrola, G.; Pulido, J.; Barrios, N.; Marquez, R.; García, J. Meta-Analysis and Analytical Methods in Cosmetics Formulation: A Review. Cosmetics 2024, 11, 1. https://0-doi-org.brum.beds.ac.uk/10.3390/cosmetics11010001
Rico F, Mazabel A, Egurrola G, Pulido J, Barrios N, Marquez R, García J. Meta-Analysis and Analytical Methods in Cosmetics Formulation: A Review. Cosmetics. 2024; 11(1):1. https://0-doi-org.brum.beds.ac.uk/10.3390/cosmetics11010001
Chicago/Turabian StyleRico, Felipe, Angela Mazabel, Greciel Egurrola, Juanita Pulido, Nelson Barrios, Ronald Marquez, and Johnbrynner García. 2024. "Meta-Analysis and Analytical Methods in Cosmetics Formulation: A Review" Cosmetics 11, no. 1: 1. https://0-doi-org.brum.beds.ac.uk/10.3390/cosmetics11010001