Article

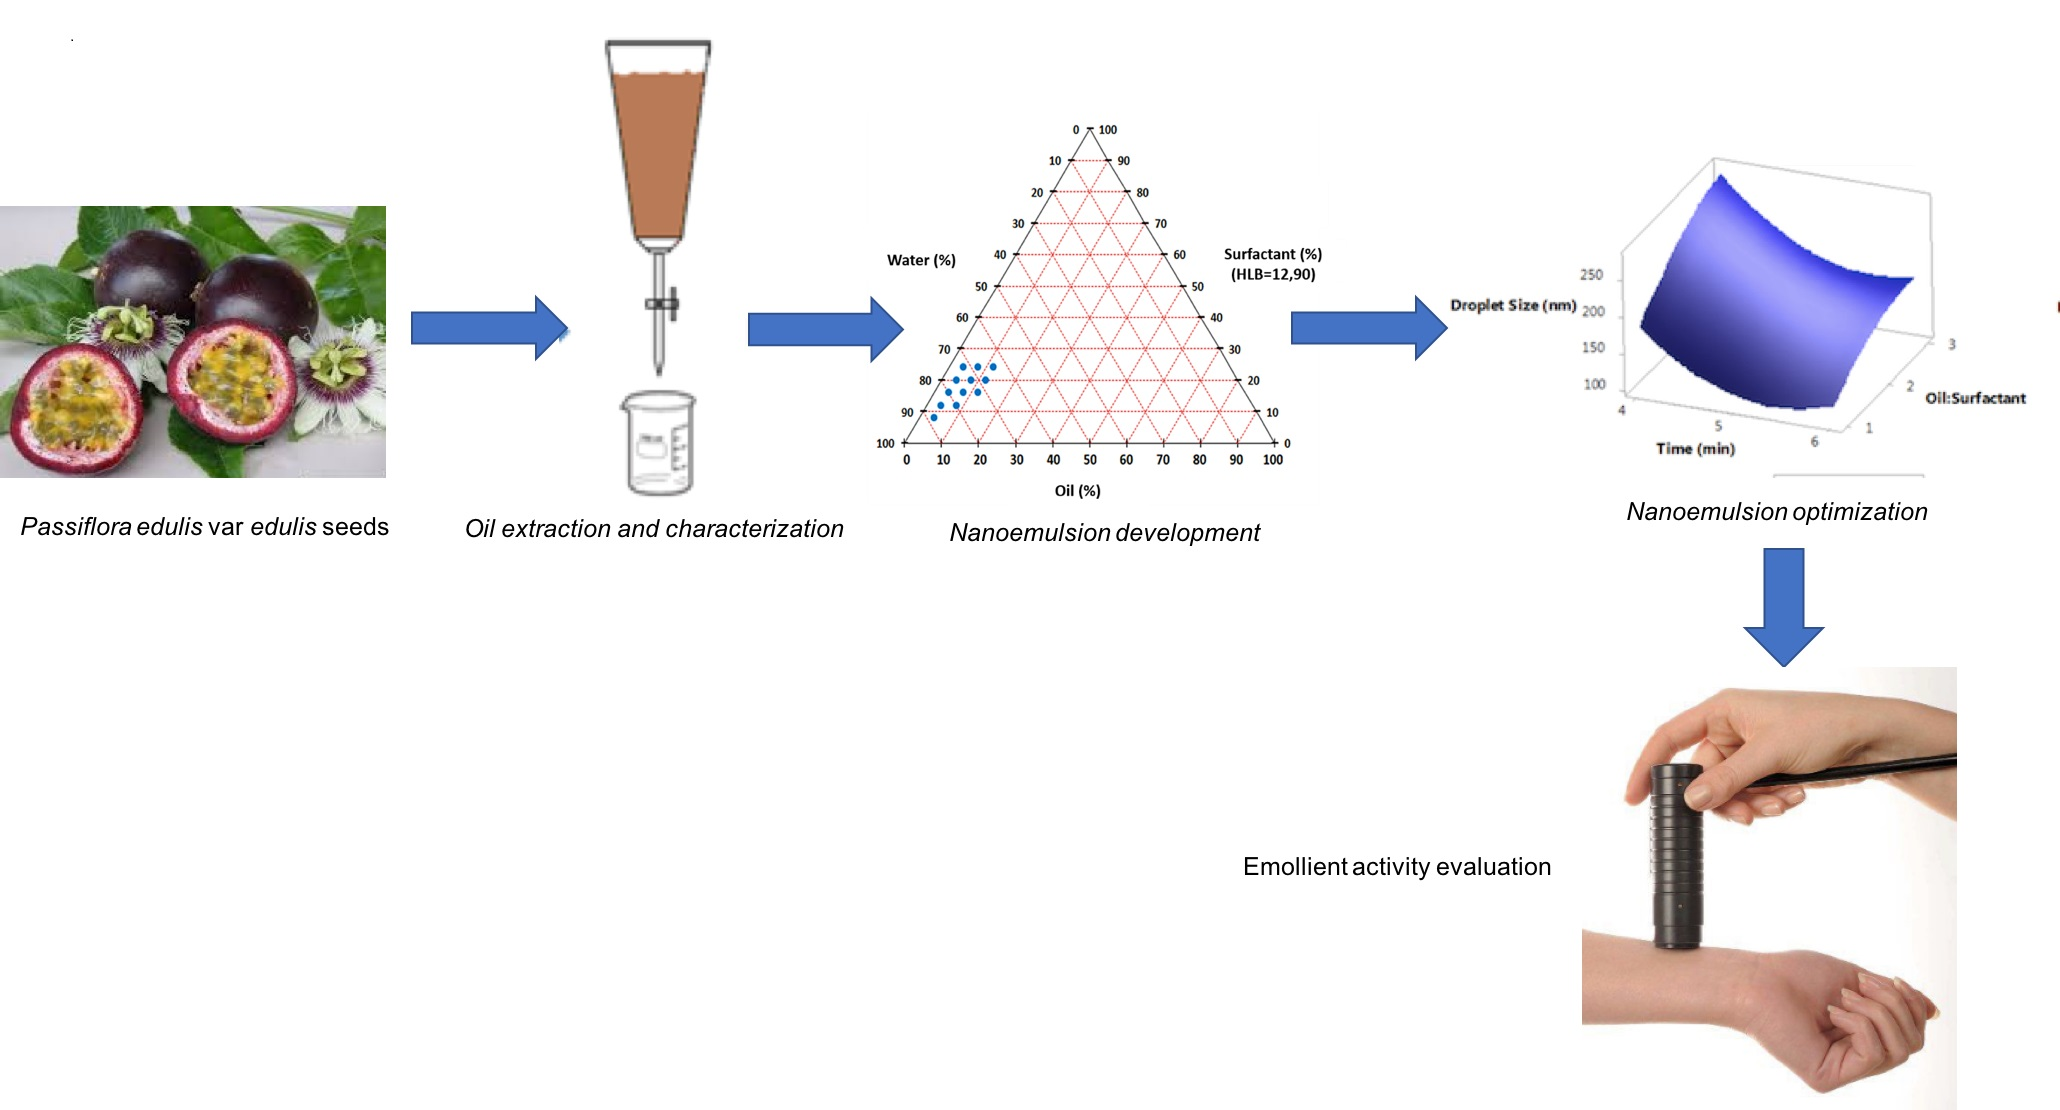
Optimization of Ultrasound-Assisted Emulsification of Emollient Nanoemulsions of Seed Oil of Passiflora edulis var. edulis

by
Caterine Guzmán
,
Maritza Adelina Rojas
and
Marcela Aragón
*
Departamento de Farmacia, Facultad de Ciencias, Universidad Nacional de Colombia, Cra. 30 N° 45-03, Bogotá D.C 111321, Colombia
*
Author to whom correspondence should be addressed.
Submission received: 16 November 2020 / Revised: 17 December 2020 / Accepted: 17 December 2020 / Published: 23 December 2020

Abstract

:
Passiflora edulis var. edulis is a plant of commercial interest because of it fruits. The seeds, a by-product in the food industry, can be a source of oil for cosmetic, pharmaceutical and food industries. The aims of this work were to optimize the ultrasonic-assisted emulsification conditions for o/w nanoemulsions and to evaluate the emollient activity of the seed oil. The optimum emulsification conditions were established, using the response surface methodology with a Box-Behnken design (BBD). The emollient activity of seed oil of P. edulis var. edulis was evaluated with healthy volunteers using a cutometer for skin moisture and viscoelasticity measurements. The optimal formulation variables (85.34 W of ultrasonic power, 5.96 irradiation time, 70.65% water and a 5:4 oil:surfactant ratio), resulted in considerable improvement in the properties of the ultrasonically formulated nanoemulsions. Finally, the seed oil of P. edulis var. edulis and the nanoemulsion generated by ultrasound presented emollient activity.

Graphical Abstract

1. Introduction

The widespread use of oils from plant seeds in cosmetic formulations is due to the composition of these oils, which are rich in fatty acids and triglycerides that help reduce the loss of transepidermal water by forming an occlusive film [1]. Some of the seed oils widely used in cosmetic products are castor oil Ricinus communis, for its skin softening and moisturizing properties, cocoa butter Theobroma cacao (Sterculiaceae), and mango oil Mangifera indica (Anacardiaceae) for their emollient characteristics on the skin, coconut oil Cocos nucifera (Arecaceae), and sunflower oil Helianthus annuus (Compositae), which prevent the loss of transepidermal water, a very important factor in the maintenance of skin emollience [1].
Emulsions or nanoemulsions are generally used to incorporate vegetable oils into a cosmetic product. Nanoemulsions are kinetically stable, isotropically clear dispersions of two immiscible liquids with droplets in the range of 20–200 nm. They are translucent or transparent, and have high kinetic stability. The small size of the dispersed droplets gives them inherent stability against instability processes such as cremation, sedimentation, flocculation and coalescence, as well as allowing effective transport of active ingredients from the formulation to the skin [2]. Taking into account that different lipids can be used in the design of nanoemulsions, the influence of the physicochemical properties of the oil on the physical properties of the emulsified system should be considered [3].
Passiflora edulis var. edulis belongs to the Passifloraceae family. It is native to Brazil, but is grown in different subtropical regions, between 1600 and 2700 m.a.s.l. and is a species that can still be found in the wild. P. edulis var. edulis was chosen for this study because it is widely cultivated in Colombia, due to the great interest in exporting it to European countries [4]. In addition, a commercial interest of P. edulis var. edulis seed oil could contribute significantly to the value of the crop. Previous reports have identified the presence of saturated and polyunsaturated and essential fatty acids in the oil extracted from seeds of P. edulis var. edulis, compounds usually employed as emollients in the cosmetic industry and with known antioxidant and antibacterial activities. In spite of this, there are no reports of employment of the seed oil of P. edulis var. edulis in the cosmetic field until now, and the seed oil of the seeds from Passiflora edulis var. flavicarpa (usually named as Passiflora edulis) is a recognized cosmetic ingredient classified as an emollient.
Considering that different oils obtained from plants of the family Passifloraceae have shown potential use in cosmetic products for skin and hair care, this work evaluates the chemical and physicochemical properties of the seed oil of P. edulis var. edulis, seeking to optimize the conditions of assisted emulsification by ultrasound for a nanoemulsion o/w of the seed oil, and to evaluate its emollient activity.

2. Materials and Methods

2.1. Vegetal Material

The mature fruits of P. edulis var. edulis (10 kg) were obtained from a local business in the city of Bogotá D.C. (Colombia). The seeds of P. edulis var. edulis were manually separated from the pulp, and were then washed with distilled water, to eliminate all pulp residues.

2.2. Extraction of P. edulis var. edulis Seed Oil (PEO)

The oil was extracted by a previously reported method [5]. Briefly, PEO was extracted from 1 kg of dry seeds by the percolation method, using n-hexane (1:5 p/v) at room temperature for 96 hours and changing the solvent every 24 hours. The plant material: solvent ratio was 1:5 w/v. Subsequently, the solvent was eliminated by reduced pressure and the oil obtained was stored in a desiccator until further analysis. The yield was 20.5%.

2.3. Chemical Characterization of Seed Oil of Passiflora edulis var. edulis

2.3.1. Preparation of Methyl Esters of Fatty Acids

The cold esterification of fatty acids was prepared according to The Commission of the European Communities [6], using the methodology described by Hernandez et al. [5]. Briefly, esterification was prepared in a 5 mL screw-top test tube by mixing PEO (100 mg), hexane (1 mL) and 0.5 mL of 2 N methanolic potassium hydroxide solution and shaking vigorously for 30 s. After 45 min the mixture turned clear; the upper organic phase was transferred to a clean autosampler vial, and 1 μL was analyzed using GC-MS/EI.

2.3.2. Gas Chromatography Analysis Coupled to GC-MS Mass Spectrometry

All the GC-MS/EI analyses were performed on a Thermo Scientific ™TRACE™ 1300 gas chromatograph connected to an ISQ QD single quadrupole mass spectrophotometer and to an AL1310 autosampler (Thermo Fischer, MA, USA) in liquid injection mode. Fatty acids were identified by comparing their retention time with standards and their mass spectrum and fragmentation patterns with NIST267 library. The data were analyzed using a Chromeleon® 7 Chromatography Data System version 7.2.2.6394 software with a NIST 2007 target library. The GC conditions were adapted to Standard ISO-5508 [7] as shown in Table 1.

2.4. Physicochemical Characterization of Fixed Seed Oil of P. edulis var. edulis

The acidity, saponification, esterification and peroxide index, density and refractive index were determined according to the official method of the United States Pharmacopeia [8], with slight modifications according previous investigations [5]. All determinations were made in triplicate.

Anisidine Index

The absorbance was measured at 350 nm in a 1 cm cuvette of a solution containing 0.100 g of PEO in 5 mL of isooctane. Next, 1 mL of p-anisidine reagent was added to the sample, and the optical density was measured at precisely 10 min after the preparation.

2.5. Preparation of the Nanoemulsion Containing Soil of Passiflora edulis var. edulis

Given that the required HLB (rHLB) for PEO was experimentally determined as 12.9 (data not shown), a blend of sorbitan tioleate (Span 85®, Sigma, St. Louis, MO, USA) and polysorbate 80 (Tween 80®, Sigma) (1:3) was used as a surfactant for the nanoemulsion preparations.
To identify the nanoemulsion region, a pseudo-ternary phase diagram was constructed with 24 systems, modifying the percentage of water, PEO, and the mixture of surfactants. Nanoemulsions were prepared using a Q500-SONICATOR® ultrasonicator (Newton, MA, USA) with 80% of amplitude for 3 min. All formulations were characterized after 1 and 7 days of preparation. The mean droplet size, polydispersity index and potential ζ were determined by dynamic light scattering (DLS) using a Zetasizer nano-ZS (dispersion angle 173°, 25 °C) (Worcestershire, UK) and 5.0 μL of each sample was diluted in 1 mL of deionized water, and the measurement was performed at 25 °C. The effect of dilution on the mean particle size or the size distribution were not taken into consideration. The values were obtained from the mean and standard deviation of 3 measurements for each emulsion.

2.6. Optimization of Nanoemulsions Containing Seed Oil of Passiflora edulis var. edulis

The composition of the PEO nanoemulsions and the conditions of ultrasound-assisted emulsification were optimized using a surface response methodology (SRM). The evaluation included the measurement of droplet size, the PDI, the potential ζ and the p-anisidine value of the systems [9].
The levels were chosen based on the results obtained previously in the determination of the nanoemulsion zone, and on the methodology suggested by Alzorqi et al. [9]. Box-Behnken design (BBD) response surface methodology (RSM) was employed to find the optimal nanoemulsification conditions needed to obtain the lowest droplet size and PDI value. For the experimental design, three factors (independent variables) (Table 2) were assayed at three levels: High (+1), medium (0) and low (−1). The number of experiments (N) required for the development of BBD was defined as N = 2k(k−1) + C0, (where k is a number of factors and C0 is the number of central points). For this research, the BBD used was composed of 27 experiments, which included 24 treatments and 3 central points (Table 3). For the experimental design, the data analysis and the construction of the model, the MiniTab®18 tool was used (Copyright 2018. Minitab Inc., State College, PA, USA). Additionally, the statistical software for Excel (XLSTAT 2018.1) was used for the statistical analysis of droplet size, PDI, potential ζ and p-anisidine value, by means of the Student t test.
The independent control variables (water content, oil: surfactant ratio, ultrasonic amplitude and irradiation time) and factor combinations were randomly established, as shown in Table 3. The properties evaluated were represented by three response surface functions, i.e., droplet size (nm), PDI, potential ζ (mV) and p-anisidine value.

2.7. Characterization of Nanoemulsions of the Optimized Design

2.7.1. Droplet Size Analysis, PDI, Potential ζ and p-Anisidine Value of Nanoemulsions of the Optimized Design

The measurement and analysis of droplet size, PDI, potential ζ and p-anisidine value of the nanoemulsified systems was carried out as previously described [5,10]. The measurements were made in triplicate, and the data were analyzed using the software (DTS, Nano, Version 5.0, Worcestershire, UK) provided with the measuring instrument. The average size value represents the average droplet diameter of the emulsion, the PDI represents the accumulated width analysis of measurements for the droplet size distribution, the average potential ζ value indicates the average millivolts of the droplet surface in each emulsion, and the p-anisidine value represents the average secondary oxidation in each emulsion.

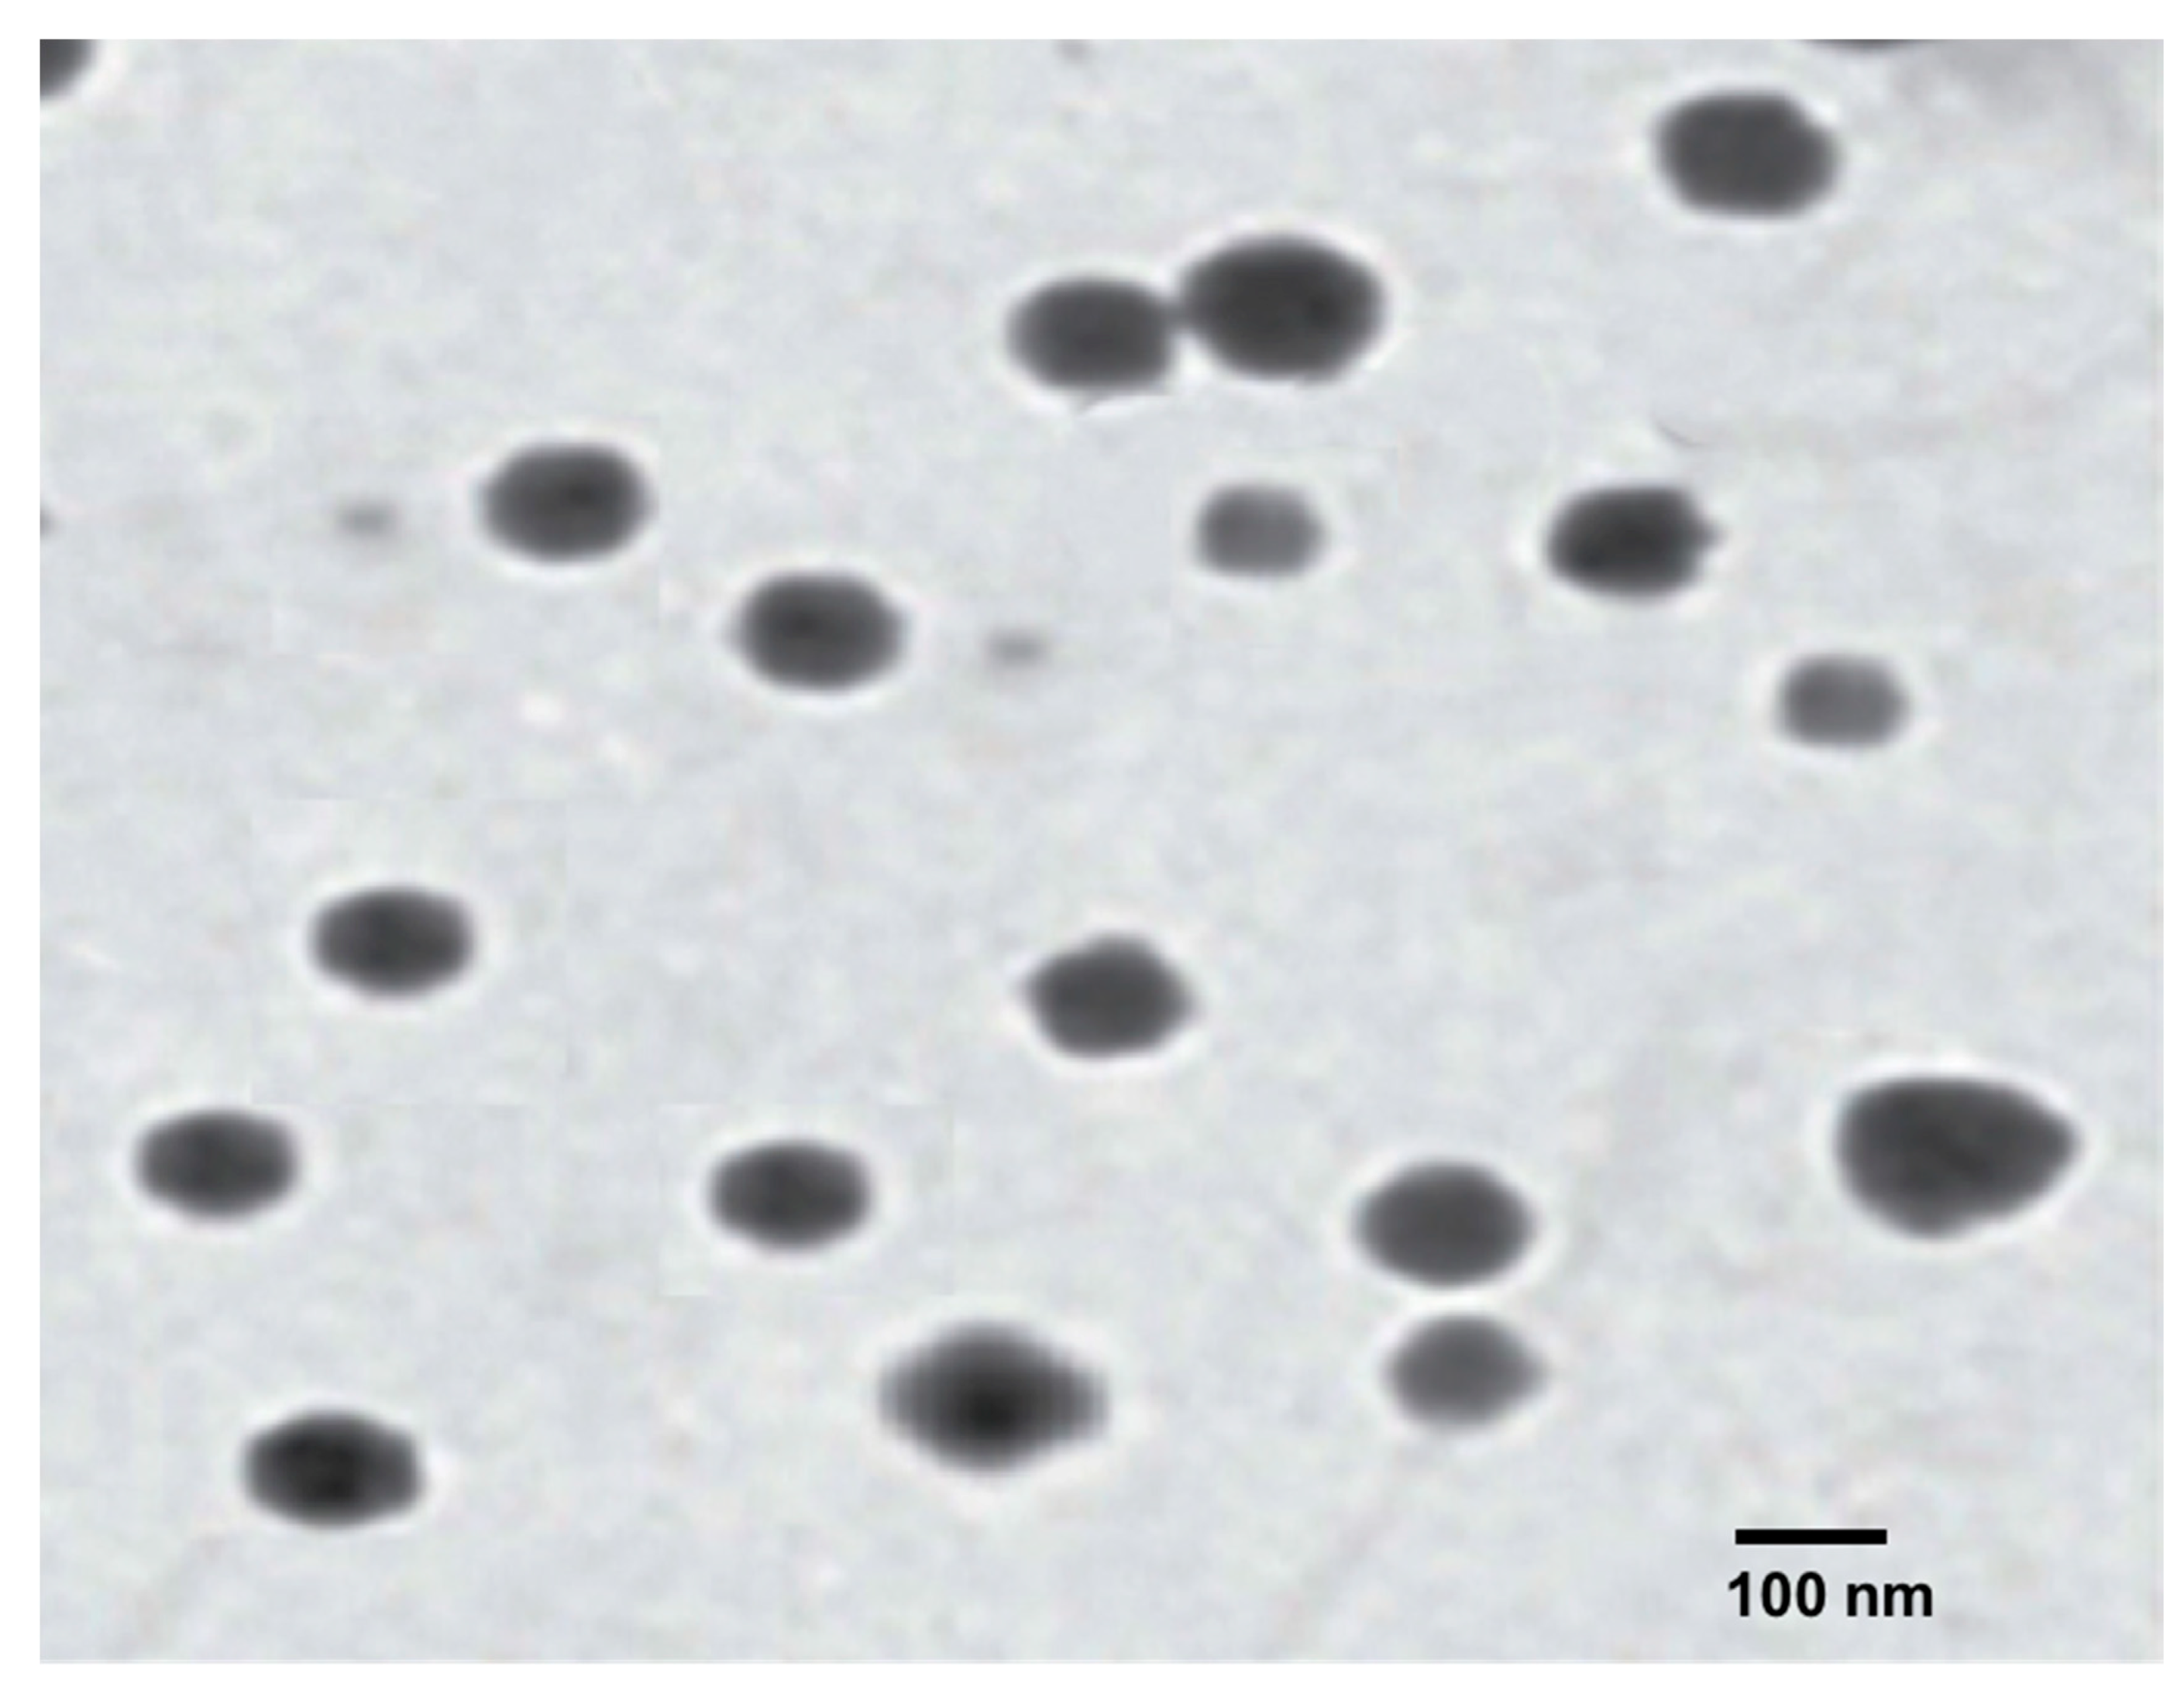
2.7.2. Transmission Electron Microscopy (TEM)

Morphology of the optimized nanoemulsion was studied using transmission electron microscopy (TEM) (JEOL JEM 2100, Hitachi corporation, Tokio, Japan) with a working voltage of 100 kV. Diluted and filtered sample was stained on a carbon coated copper grid (300 mesh) with 1% aqueous solution of phosphotungstic acid for 30 s at room temperature and was then observed under the electron microscope.

2.7.3. Viscosity, pH and Conductivity

Viscosity of nanoemulsion was analyzed by a Digital Viscometer (Brookfield Engineering Laboratories, Inc., MA). pH of NE was recorded through a digital pH meter (ST2100-F, Ohaus, USA) at room temperature. For conductivity, it was employed a standard digital conductometer (Starter 3100C, Ohaus, Parsippany, NJ, USA). All measurements were made by triplicate at room temperature (20 ± 2 °C).

2.8. Stability Evaluation

The stability of the nanoemulsions under different storage conditions (4 °C, 20 °C and 40 °C) and durations (1, 7, 21 days) was investigated by monitoring the droplet size and polydispersity index using a Zetasizer Nano-ZS (Dispersion Angle 90°, 25 °C) (Worcestershire, UK). The tests were conducted in triplicate and the values were recorded as means of the measurement.

2.9. Evaluation of Influence of Nanoemulsions of Seed Oil of Passiflora edulis var. edulis on Skin Parameters

Once the PEO nanoemulsion was optimized, the effect of PEO and the nanoemulsion on the transepidermal water loss (TEWL) and skin viscoelasticity and firmness properties was evaluated according to the method reported by Estanqueiro et al. [11]. Seventeen healthy volunteers—six men, and eleven women—aged between 20 and 35 years participated in the study. All the participants gave written informed consent and completed a data confidentiality form. This study was conducted in a laboratory with controlled temperature (20 ± 2 °C) and relative humidity (60 ± 10%). The evaluation was carried out on the forearm, in an area of 4 cm2. Four areas of 4 cm2 were marked on the forearm, one area was treated with as a control, and the others were treated with vehicle (10 µL), nanoemulsion (10 µL) and oil (1.5 µL, same oil amount in 10 µL of nanoemulsion), each treatment was applied once. Hydration and skin occlusion were recorded in the demarcated areas after 30 min of the application of the treatments. The average values of five measurements were used in the subsequent analysis. Additionally, the statistical software for Excel (XLSTAT 2018.1) was used for the statistical analysis by means of the Student t test. Informed consent was obtained from every person that participated in this experiment. The study was approved by the local Research Ethics Committee (Act 02/2018 Faculty of Science of University National of Colombia).

2.9.1. Skin Viscoelasticity and Firmness

The mechanical properties of the epidermis were determined in vivo by a non-invasive method, using a suction skin elasticity meter; a Cutometer (MPA 580, Courage and Khazaka, Cologne, Germany) equipped with a 2 mm measurement probe. The time/voltage mode was used, applying a negative pressure of 450 mbar for a time of 5 s, followed by a relaxation period of 5 s. The relationship between viscoelastic and elastic distension, which represents the viscoelastic part of the skin deformation, was evaluated [12,13]. The average values of the two measurements was used in the subsequent analysis.

2.9.2. Transepidermal Water Loss

The hydration of the epidermis was determined in vivo by a non-invasive technique using an electronic device; a Tewameter (MPA 580, Courage and Khazaka, Cologne, Germany). The Tewameter probe measures the water vapor pressure by the density gradient of the water evaporation from the skin indirectly by the two pairs of sensors (temperature and relative humidity) inside the hollow cylinder, according to the method reported by [14].

2.10. Statistical Analysis

The experimental design, data analysis, and nanoemulsion optimization was performed with Minitab® software (version 17 State College, PA, USA). GraphPad Prism® software (version 6, San Diego, CA, USA) was employed for the analysis of the emollient effect by a two-way ANOVA followed by a Tukey’s multiple comparisons test.

3. Results and Discussion

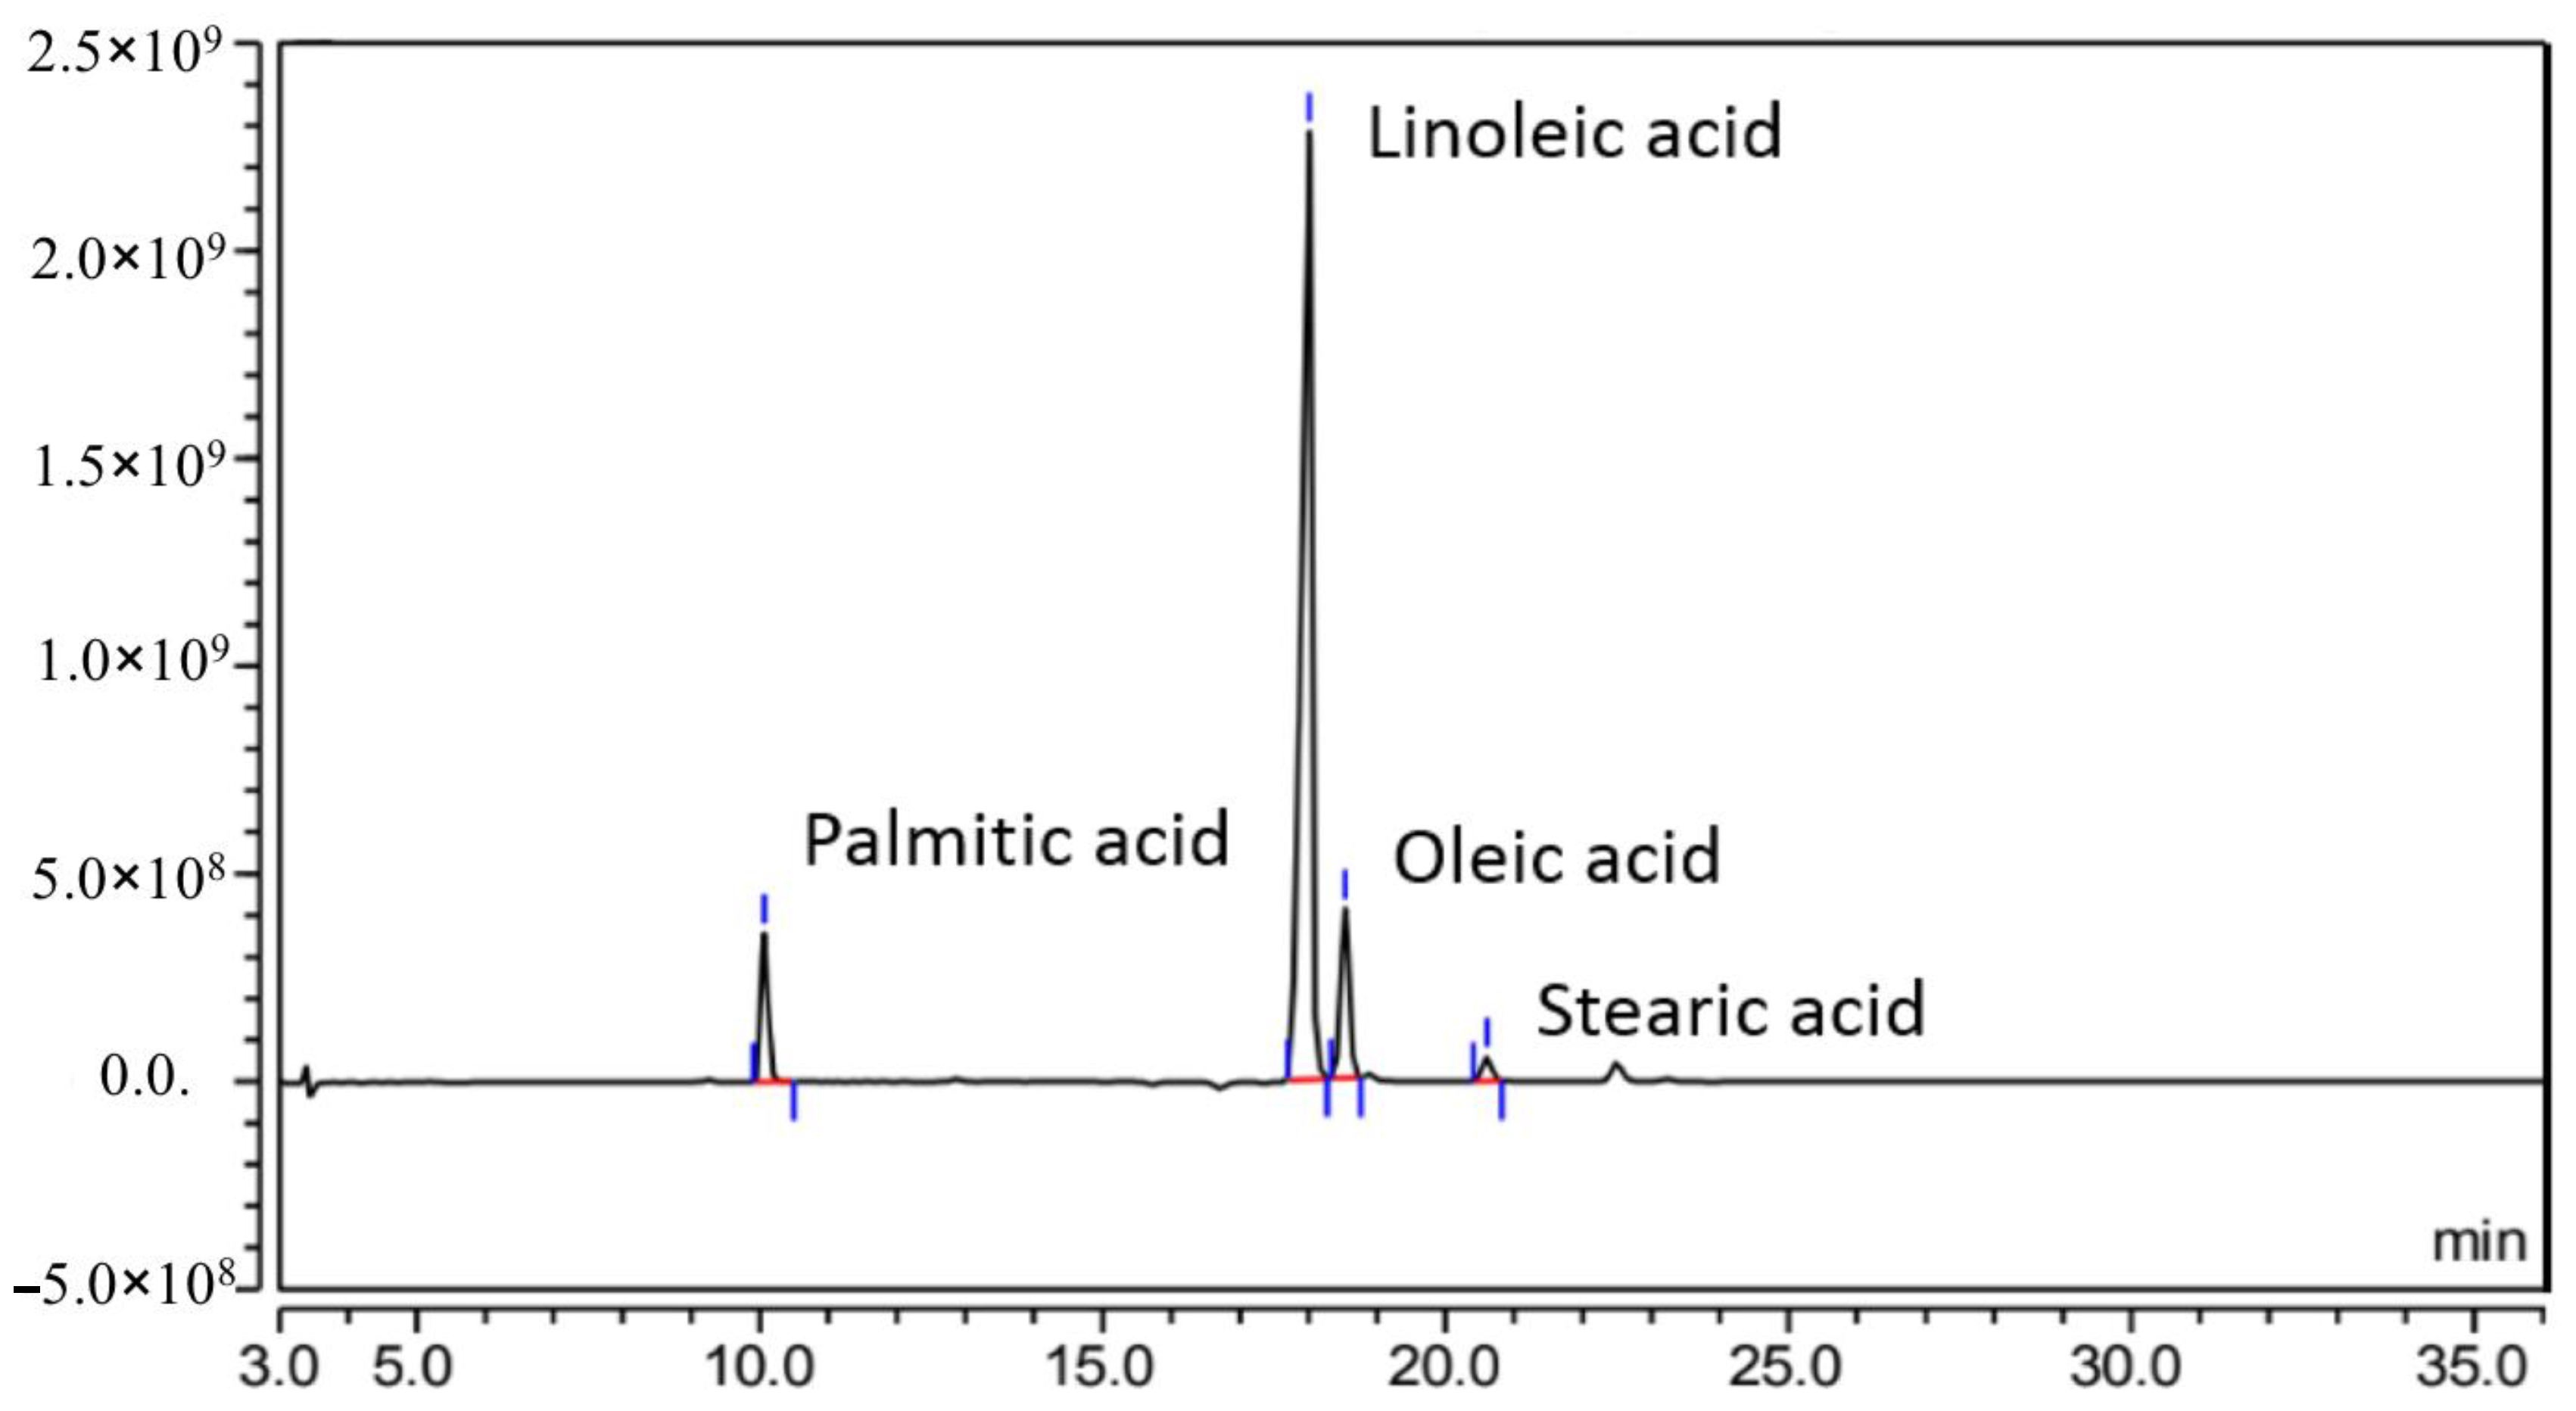
3.1. Chemical and Physicochemical Characterization of Fixed Seed Oil of Passiflora edulis var. edulis

The chromatographic profile (Figure 1) of fatty acids from fixed seed oil of P. edulis var. edulis shows similar compounds to other seed oils used in the pharmaceutical and cosmetic industries [15].
According to the chromatographic profile, the oil has a high percentage of essential fatty acids (linoleic acid and oleic acid). The fatty acid composition of the oil is Linoleic acid (C18:2) 78.77 ± 0.06%, oleic acid (C18:1) 11.57 ± 0.02%, palmitic acid (C16:0) 7.79 ± 0.02% and stearic acid (C18:0) 1.85 ± 0.05%. This composition is similar to that of other Passion seed oils extracted with solvents in cold methods. The profile of fatty acids obtained from PEO showed saturated fatty acids (10.0%), unsaturated fatty acids (90.0%), monounsaturated fatty acids (12.5%) and polyunsaturated fatty acids (77.5%). This fatty acid profile is also similar to that of other Passion seed oils [5,15,16,17,18,19].
The physicochemical properties of PEO, density (0.9394 ± 0.048 g/mL), refraction index (1.465 ± 0.005), acidity index (2.3576 ± 0.037 mg KOH/g oil), saponification index (185.8959 ± 4.200 mg KOH/g oil), esterification index (183.5382 ± 5.1510 mg KOH/g oil), peroxide index (6.0008 ± 0.0233 mEq O2/Kg oil) and p-anisidine value (5.050 ± 0.1500) were also similar to those of other Passion seed oils [16,17,18,19,20,21].

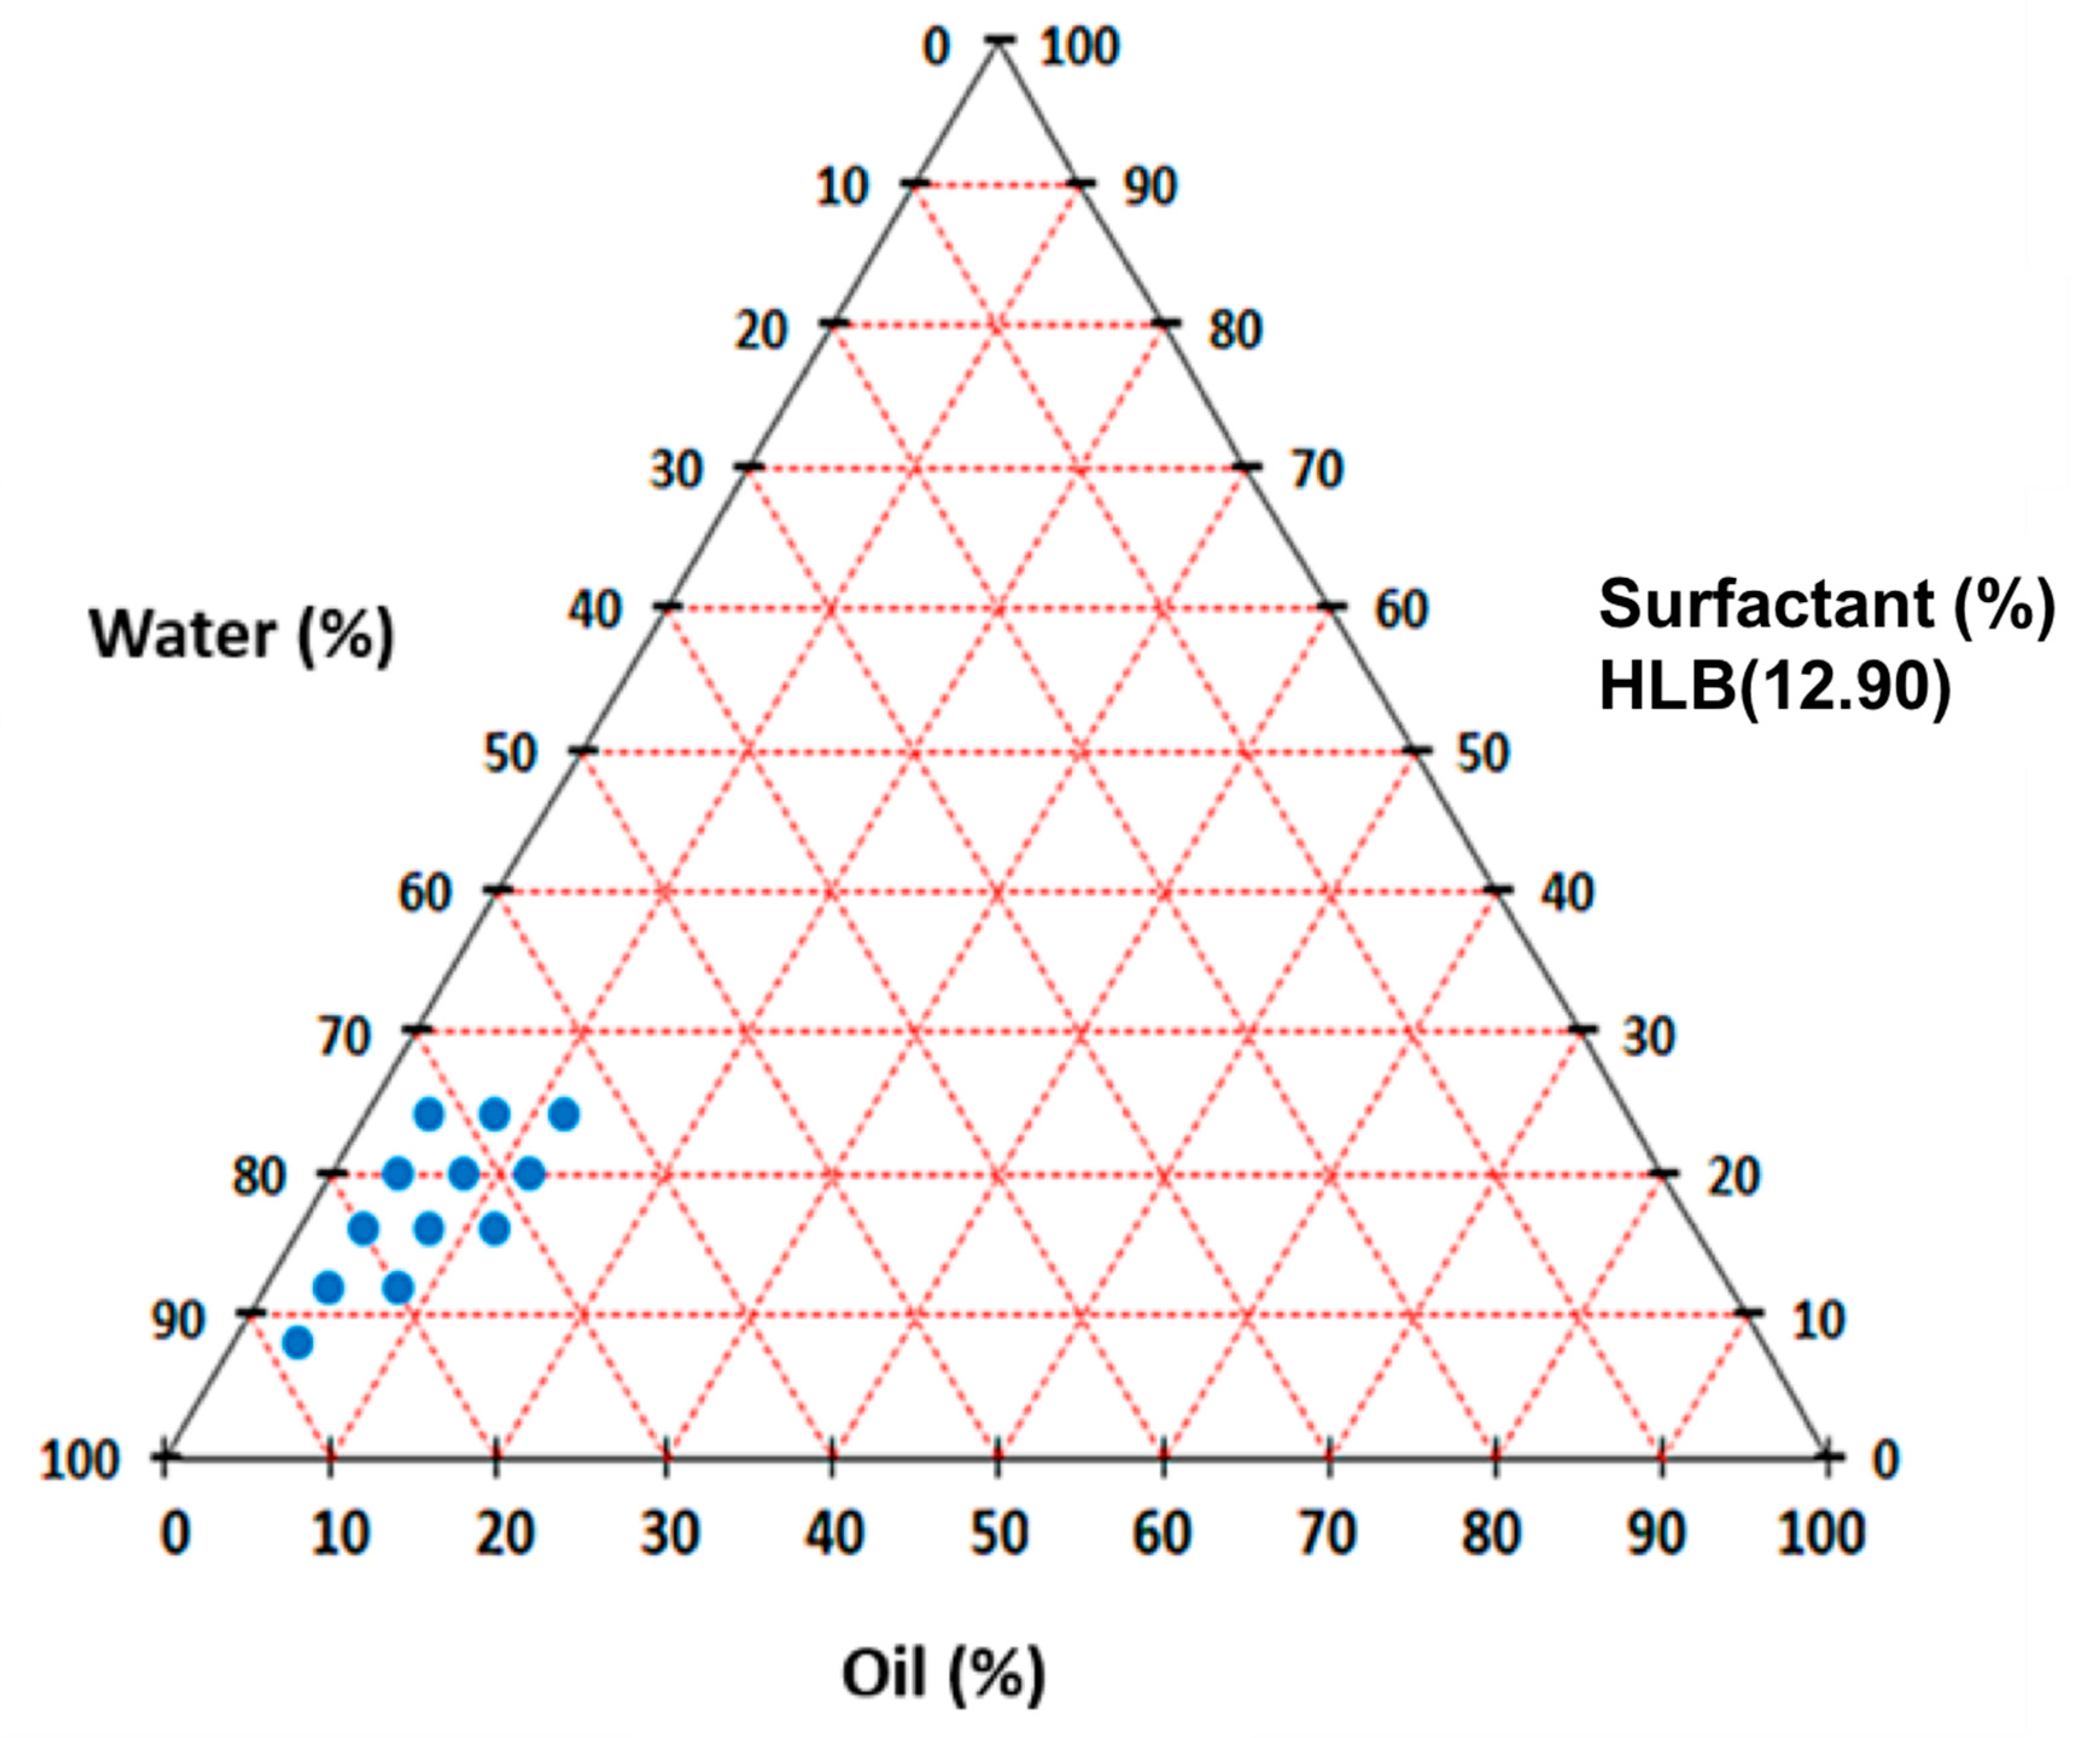
3.2. Preparation of the Nanoemulsion Containing Seed Oil of Passiflora edulis var. edulis

Twenty-four nanoemulsions were prepared (Table 3) by varying the proportion of the dispersed phase (PEO), the dispersing phase (deionized water) and the mixture of surfactants, in order to evaluate the influence of the composition on the formation of nanoemulsified systems. The variation of the proportions in the emulsions was defined based on previous studies reported in the literature [5,10], with percentages of oil in the oil phase ranging from 4% to 20%.
The droplet size ranged from 33.98 ± 1.76 nm (8% oil, 24% surfactants and 68% water) to 305.0 ± 3.73 nm (16% oil, 4% surfactants and 80% water). Nanoemulsions with a droplet size less than 100 nm and a PDI less than 0.500 after 1 and 7 days of preparation were used to determine the nanoemulsion region in the pseudo-ternary diagram (Figure 2), taking into account the definition of proposed nanoemulsion [22] and ensuring that the stability of the system is not affected by the phenomenon of coalescence. Nanoemulsions were obtained in the region with PEO between 4% and 12% p/p, water between 64% and 88% p/p and surfactants between 8% and 24% p/p. The results obtained corroborated those reported by Hernández et al. [5] and B. Yang and Xu [23].

3.3. Optimization of Nanomulsions Containing Seed Oil of Passiflora edulis var. edulis

The generation of nanoemulsions is achieved after the interruption of droplet formation and the phenomenon of coalescence, which ends with a kinetic equilibrium that determines the final size of the droplet in the nanoemulsion.
The application of a high shear force to the process of preparation of the nanoemulsions allows the oil droplets to be broken up. Therefore, the main factors that intervene in the phenomenon of droplet interruption are the type and intensity of the shear force applied to the system [9]. In the same way, the ability of the surfactant, and its concentration in the system, will significantly affect its location in the system interface, the formation of the droplets, and consequently, the final size of the droplets. For this reason, the interactions of the independent variables will optimize the conditions of disruption, coalescence and stability of the droplet.

3.3.1. Response Surface Models

To predict the variation in droplet size, the PDI, potential ζ and p-anisidine value of the nanoemulsions as a function of the formulation variables (% water, oil: surfactant ratio, ultrasonic amplitude and ultrasonic irradiation time) and surface models were used. As shown in Table 4, twenty-seven factorial points of the BBD matrix represent the different combinations of the independent variables and the responses of droplet size, PDI, potential ζ and p-anisidine value.
The experimental data were used to generate the coefficients of the quadratic polynomial models. Regression equations for different responses in terms of coded values, obtained through RSM, were given as the following equations:
S i z e   ( n m ) = 3581 3057 A 637.5 B 1465 C + 119.4 D + 0.975 A 2 + 41.77 B 2 + 0.0167 C 2 15.50 D 2 + 1.339 A B + 0.0770 A C + 0.592 A D + 1.113 B C 8.10 B D 0.310 C D
P D I = 1.856 0.0411 A 0.1599 B + 0.0062 C + 0.1098 D + 0.000181 A 2 + 0.00554 B 2 0.000040 C 2 + 0.01129 D 2 + 0.001569 A B + 0.000048 A C 0.000150 A D + 0.000019 B C 0.01175 B D 0.001000 C D
P o t e n t i a l   ζ   = 1.856 0.0411 A 0.1599 B + 0.0062 C + 0.1098 D + 0.000181 A 2 + 0.00554 B 2 0.000040 C 2 + 0.01129 D 2 + 0.001569 A B + 0.000048 A C 0.000150 A D + 0.000019 B C 0.01175 B D 0.001000 C D
p a n i s i d i n e   v a l u e = 24.9 + 0.730 A + 5.98 B 0.206 C 1.51 D   0.00347 A 2   0.298 B 2 + 0.00074 C 2 0.520 D 2 0.0464 A B 0.00006 A C +   0.0001 A D + 0.0050 B C + 0.323 B D + 0.0207 C D
where, A: Power (W); B: Time (min); C: Water (%); D: Oil: Surfactant ratio.
The analysis of variance (ANOVA) for the square polynomial models enabled the relationships of statistical significance (p-value <0.05) to be established for all the models evaluated. The degree of fitness of the model was evaluated by coefficients of determination (R2), adjusted coefficients of determination (R2 adj) and the p-value of the lack-of-fit test.
The coefficients of determination (R2), for the model of drop size (0.9885) and IPD (0.9569), indicate a high degree of fitness of the model as they approach the unit. With respect to the potential ζ model, the R2 value indicates a lower aptitude of the prediction model (0.8723), which shows that the model could only predict the incidence of independent variables over the potential ζ by 87.23%. Similarly, for the model of the p-anisidine, the R2 value indicates a lower aptitude of the prediction model (0.5624), which shows that the model could only predict the incidence of independent variables over the p-anisidine value by 56.24%.
On the other hand, the adjusted determination coefficient (R2 adj) for the droplet size model (0.9612) shows a high approximation with the R2 value of this model, which indicates a good prediction of the incidence of the independent variables on the response variable, considering the IPD model, the value of R2 adj (0.8565) shows a lower approximation with the R2 value of the model, which would indicate a lower predictive capacity of the model; finally, for the potential ζ model and p-anisidine model, it was observed that the R2 adj (0.6488) and R2 adj (0.5200) values for the two models, respectively, show an even smaller approximation with the R2 value, and this variation between them implies poor predictive capacity of the model for that response variable. Additionally, the low F value and the high p-value of the lack of fit test (Table 5) for all the models were not significant.
In the experimental design, a mathematical model of square polynomial was used in the experimental design, to generate the estimated regression coefficients and to evaluate the response functions of the dependent variables [24]. To illustrate the response functions, surface graphs were generated for each dependent variable (Figure 3, Figure 4, Figure 5 and Figure 6).
All the non-significant terms (value of p > 0.05) (Table 5) were eliminated in the evaluation of the response of the dependent variables. Therefore, a final reduced model is presented to readjust the experimental data only in the significant coefficients.

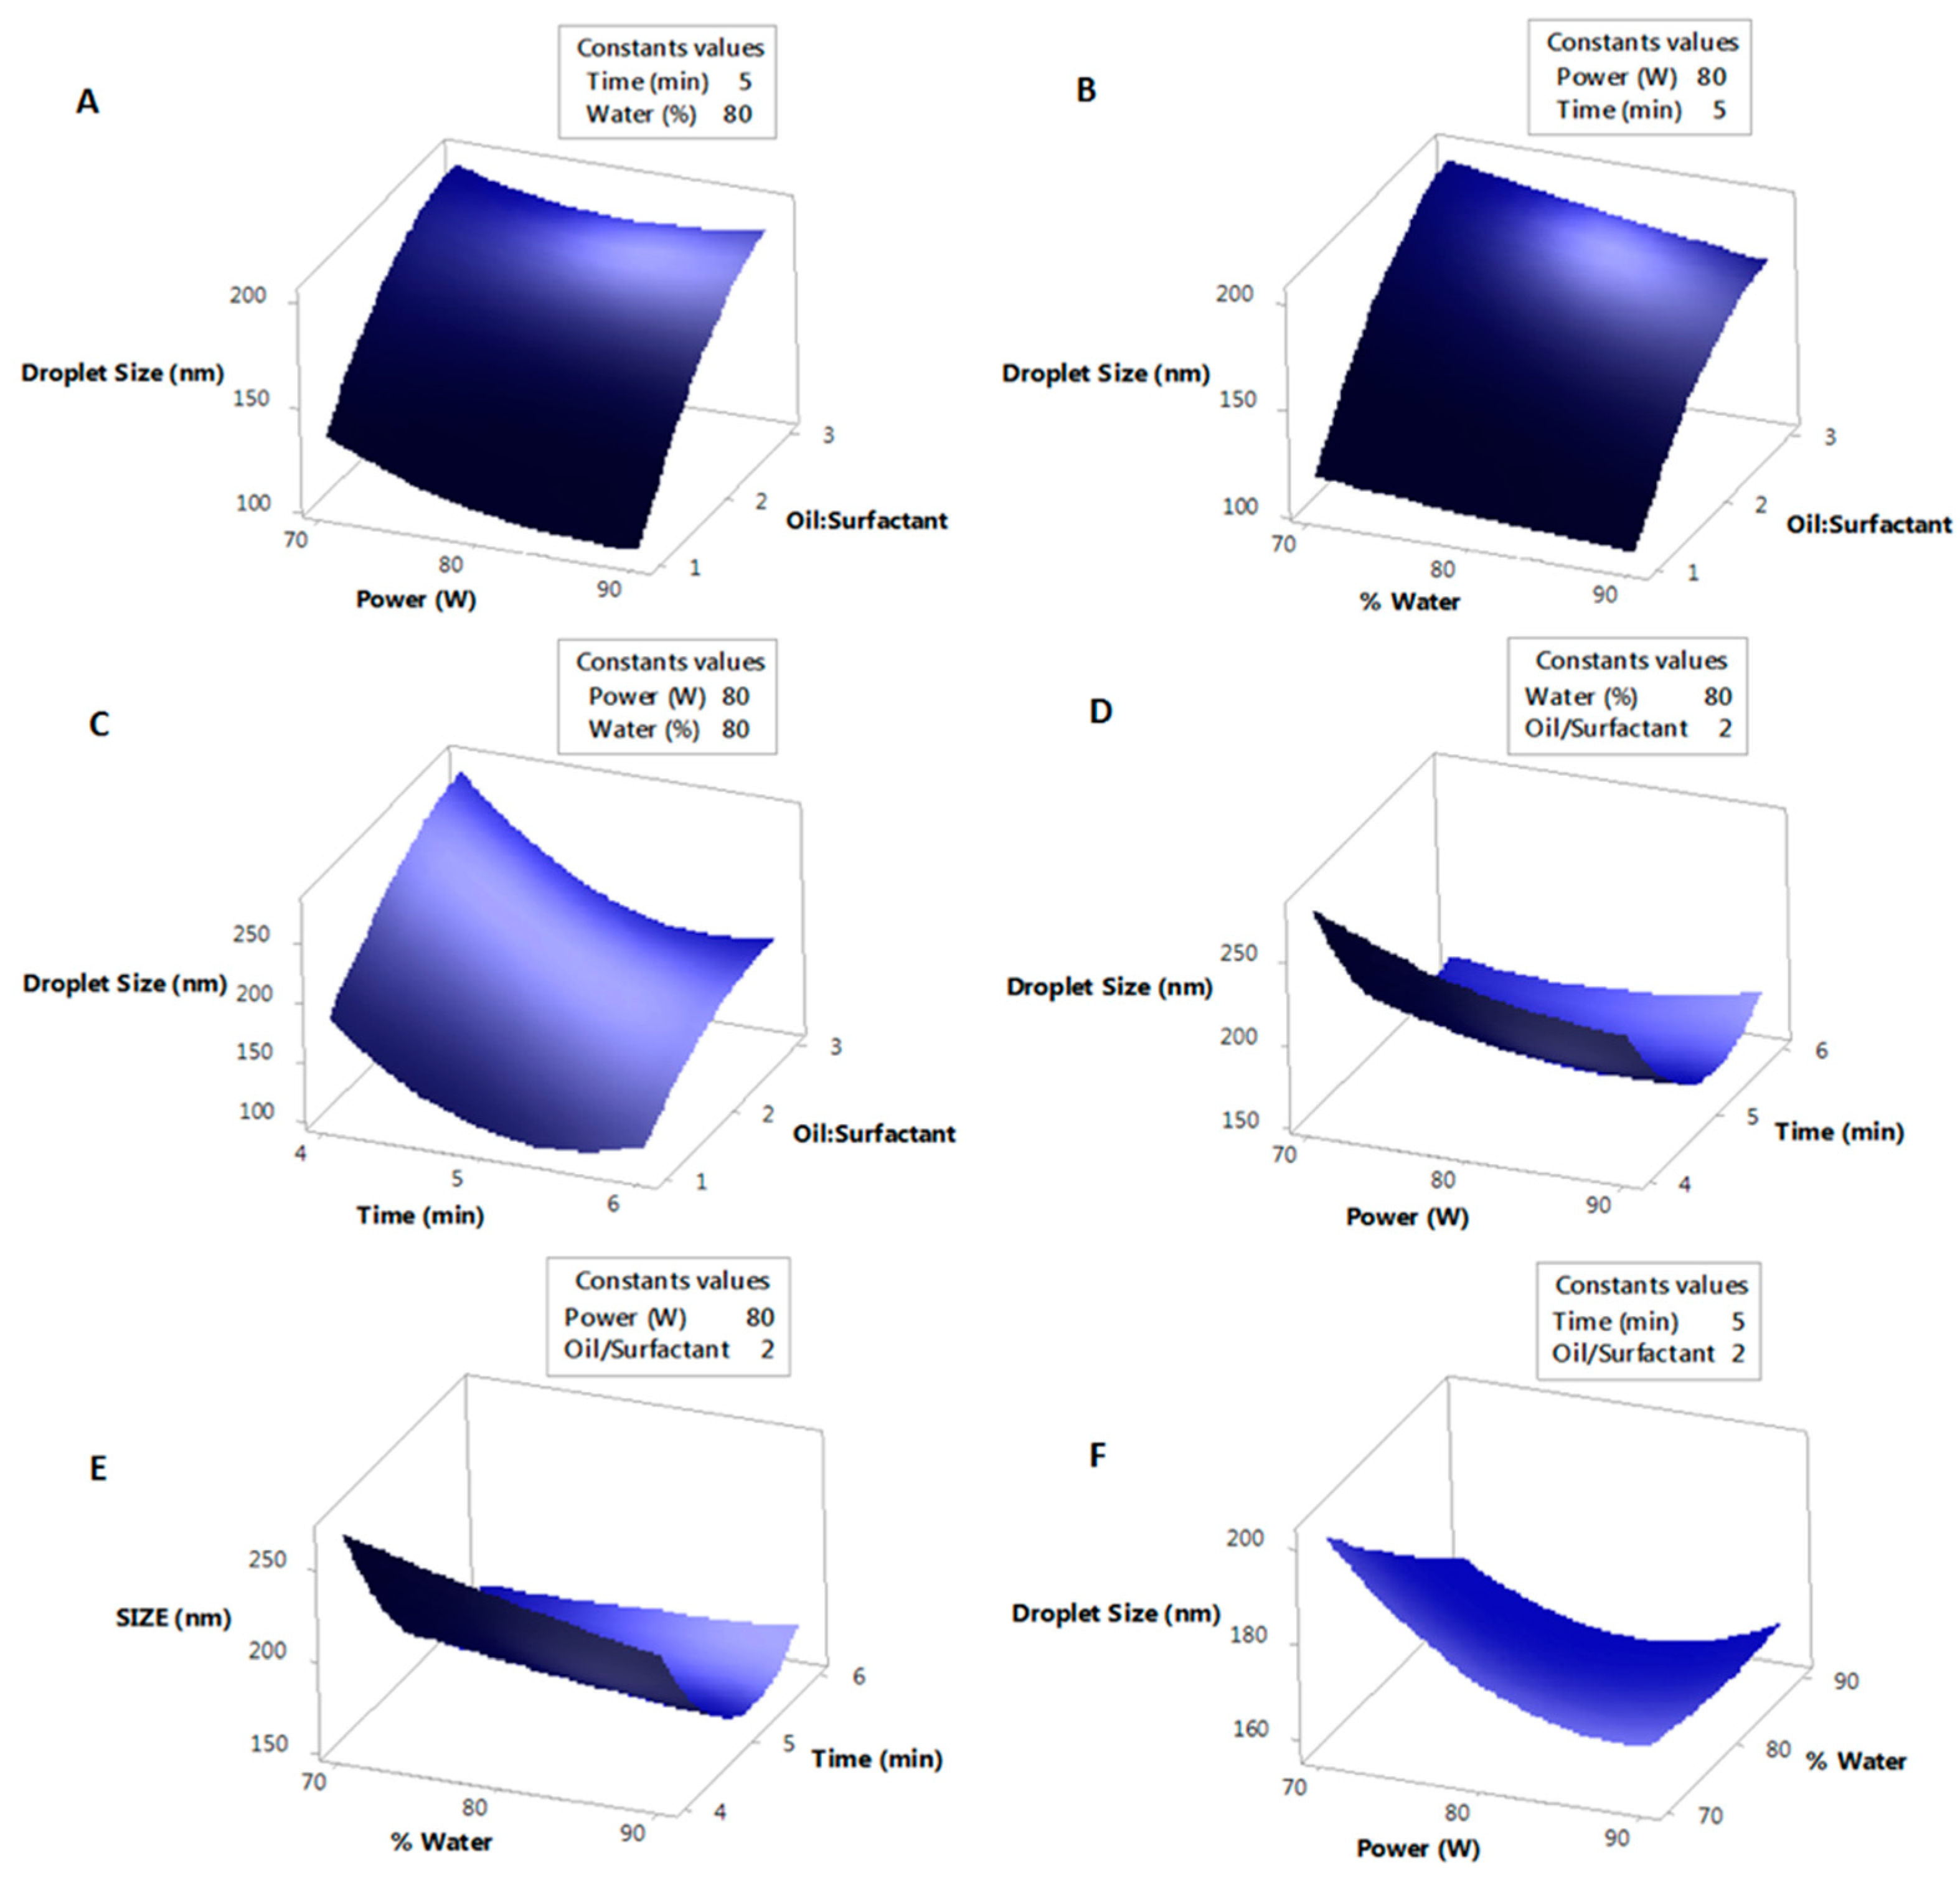
3.3.2. Analysis of the Response Surface of the Effects of the Formulation Variables on the Droplet Size of the Nanoemulsions

The relationship between the independent variables and the response variables (drop size) of the nanoemulsions could be adequately represented by the linear terms of ultrasonic amplitude, irradiation time, the percentage of water and oil: surfactant ratio; the quadratic effects of ultrasound amplitude, irradiation time and oil: surfactant ratio. All other regression coefficients of the effects were excluded because they were not significant in the model.
In the three-dimensional surface graphics (Figure 3) generated by MiniTab®18 (Copyright 2018. Minitab Inc.), for the response variable (drop size) of the nanoemulsions when evaluating the effect of two independent variables, the other two variables remained constant at the central point.
In Table 5, it can be seen that linear independent variables have greater significance than the quadratic variables. The factors with the greatest influence were the oil: surfactant ratio (0.000) and the irradiation time (0.000).
As shown in Figure 3A–C, keeping the irradiation time and the percentage of water (5 min, 80%) at the central point, the amplitude of the ultrasound and the irradiation time (80%, 5 min) and the amplitude of the ultrasonication and percentage of water (80%, 80%) respectively, it was observed that the droplet size decreased as the oil:surfactant ratio decreased from 3 to 1, as a result of the decreased oil in the nanoemulsion [9,25,26]. This is explained by the fact that when the oil:surfactant ratio was higher, the amount of surfactant in the emulsion was not sufficient to surround and cover the newly formed oil droplets, preventing the surface of the droplets from stabilizing and triggering the phenomenon of coalescence. By reducing the oil:surfactant ratio, the amount of surfactant is able to cover all the droplets formed by decreasing the interfacial tension and stabilizing the droplets in the emulsion [26]. These results corroborate those reported by Chanana and Sheth, Li et al. and Alzorqi et al. [9,27,28]
With respect to the linear factor of irradiation time, by keeping the same factors in the central point, it was observed that the droplet size decreased (Figure 3D–E) when the irradiation time increased from 4 to 6 min, because the irradiation time impacts on the speed of adsorption of the emulsifier on the surface of the droplets, and on their size [27].The formation of a smaller droplet diameter requires longer irradiation times, which leads to an increase in energy density that is inversely correlated with droplet size, in an exponential relationship [29].
Finally, in relation to the linear factors of irradiation amplitude and water percentage (Figure 3F), it is observed that by keeping the irradiation time and the oil: surfactant ratio at the central point (5 min, 2), a decrease in droplet size is obtained. This is attributed to the higher amplitude of ultrasonic irradiation, which generates an increase in energy density, similar to what occurred with the irradiation time, leading to the decrease in droplet size. Regarding the influence of the percentage of water in the emulsion, an increase in the water content available in the system, keeping the oil:surfactant ratio constant allows greater solubility of the hydrophilic surfactant in the emulsion and helps to reduce the size of the droplet by greater adsorption of the surfactant on the oil droplets, significantly reducing the interfacial tension; additionally, a greater proportion of water in the emulsion decreases the resistance to flow of the internal phase, increasing the interruption in the formation of oil drops.

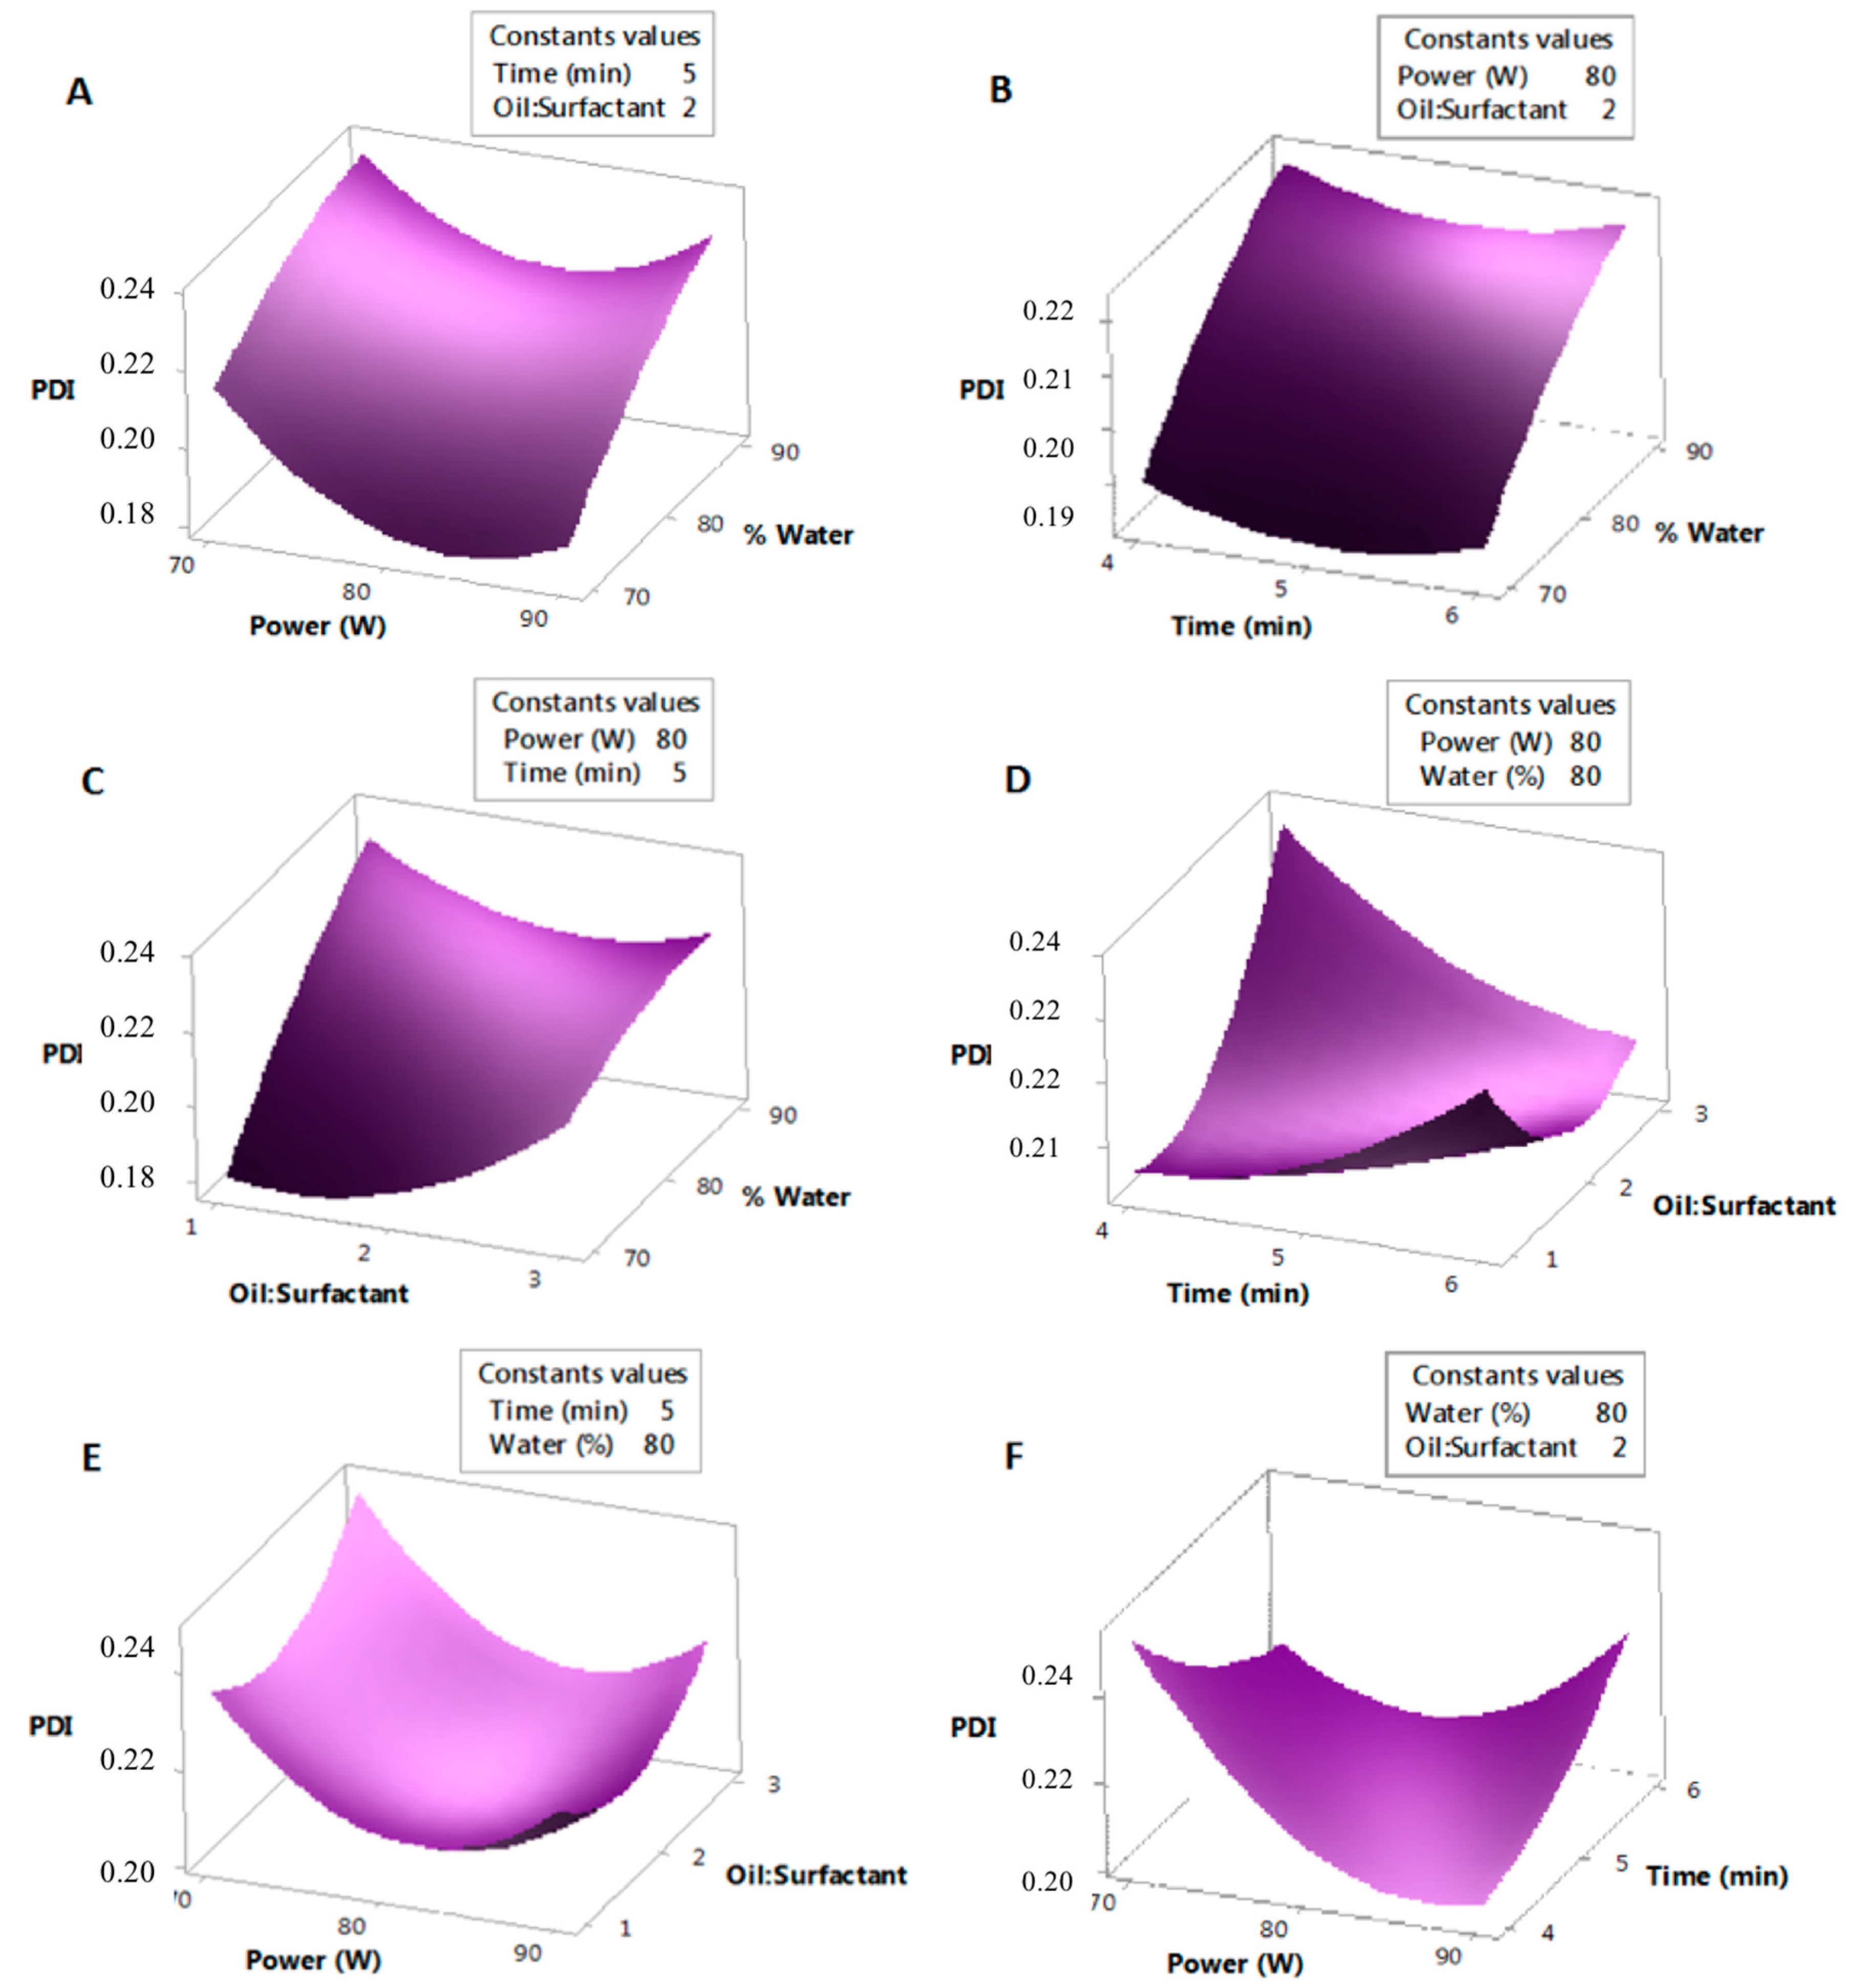
3.3.3. Analysis of the Response Surface of the Effects of the Formulation Variables on the PDI of the Nanoemulsions

The relationship between the independent variables and the response variable (polydispersity index) (Figure 4) of the nanoemulsions is adequately represented by the linear terms of ultrasonication power and percentage of water; the quadratic effects of ultrasonic power and oil:surfactant ratio and the interactions of amplitude-time of ultrasonication and the water oil:surfactant ratio. All other regression coefficients of the effects were excluded because they were not significant in the model.
In Table 5, it can be seen that linear independent variables have greater significance than quadratic variables and interactions. The factor with the greatest influence was the percentage of water (0.001), followed by the power of ultrasonication (0.025), which also shows significance as a quadratic variable (0.008). As shown in Figure 4A–C, keeping the irradiation time and the oil:surfactant ratio (5 min, 2) at the central point, the ultrasonication amplitude and the oil:surfactant ratio at 80%, 2 and the power of ultrasonication and irradiation time (80%, 5 min respectively), it was observed that the PDI value decreased. This can be explained by physical aspects of the system preparation process, since in systems with a lower proportion of water, it would be more likely that the dispersed droplets in the water will be interrupted by cavitation forces, leading to a decrease in variation of the size distribution (PDI). With respect to the linear factor of the power of ultrasonication, by keeping the factor irradiation time and percentage of water (5 min, 80%); and percentage of water and oil:surfactant ratio (80%, 2) at the central point, it was observed that the PDI value decreased (Figure 4D–E) when the ultrasonication amplitude was increased from 70% to 90% because the greater power of ultrasonication shear rates in the process of interruption of droplet formation increases, leading to an increase in the intensity of acoustic cavitation, which in turn contributes to a decrease in the coalescence rate and in the variation of droplet size distribution (PDI) [9]. Additionally, increasing the amplitude of the ultrasonication increases the turbulence formed in the system, leading to a decrease in the PDI value. These results are in agreement with Yuan et al. and Meor et al. [30,31].
In relation to the linear factors of oil:surfactant ratio and irradiation time, it is observed that by maintaining the percentage of water and the power of ultrasonication (80%, 80%) at the central point, a decrease in the PDI is obtained. This is attributed to the fact that a longer ultrasonic irradiation time generates an increase in energy density and a decrease in PDI, similarly to what occurred with the power of ultrasonication (Figure 4F). As for the influence of the oil:surfactant ratio in the emulsion, a decrease of this ratio of 3 to 1 contributes to the decrease in PDI. Similarly to what occurred with the droplet size, by decreasing the amount of oil in the surfactant agent, it was able to cover all the droplets formed, by decreasing the interfacial tension and stabilizing the drops in the emulsion with greater ease, contributing to the uniformity in the distribution of sizes [26]. These results corroborate those reported by Chanana and Sheth, Li et al., and Alzorqi et al. [9,28].

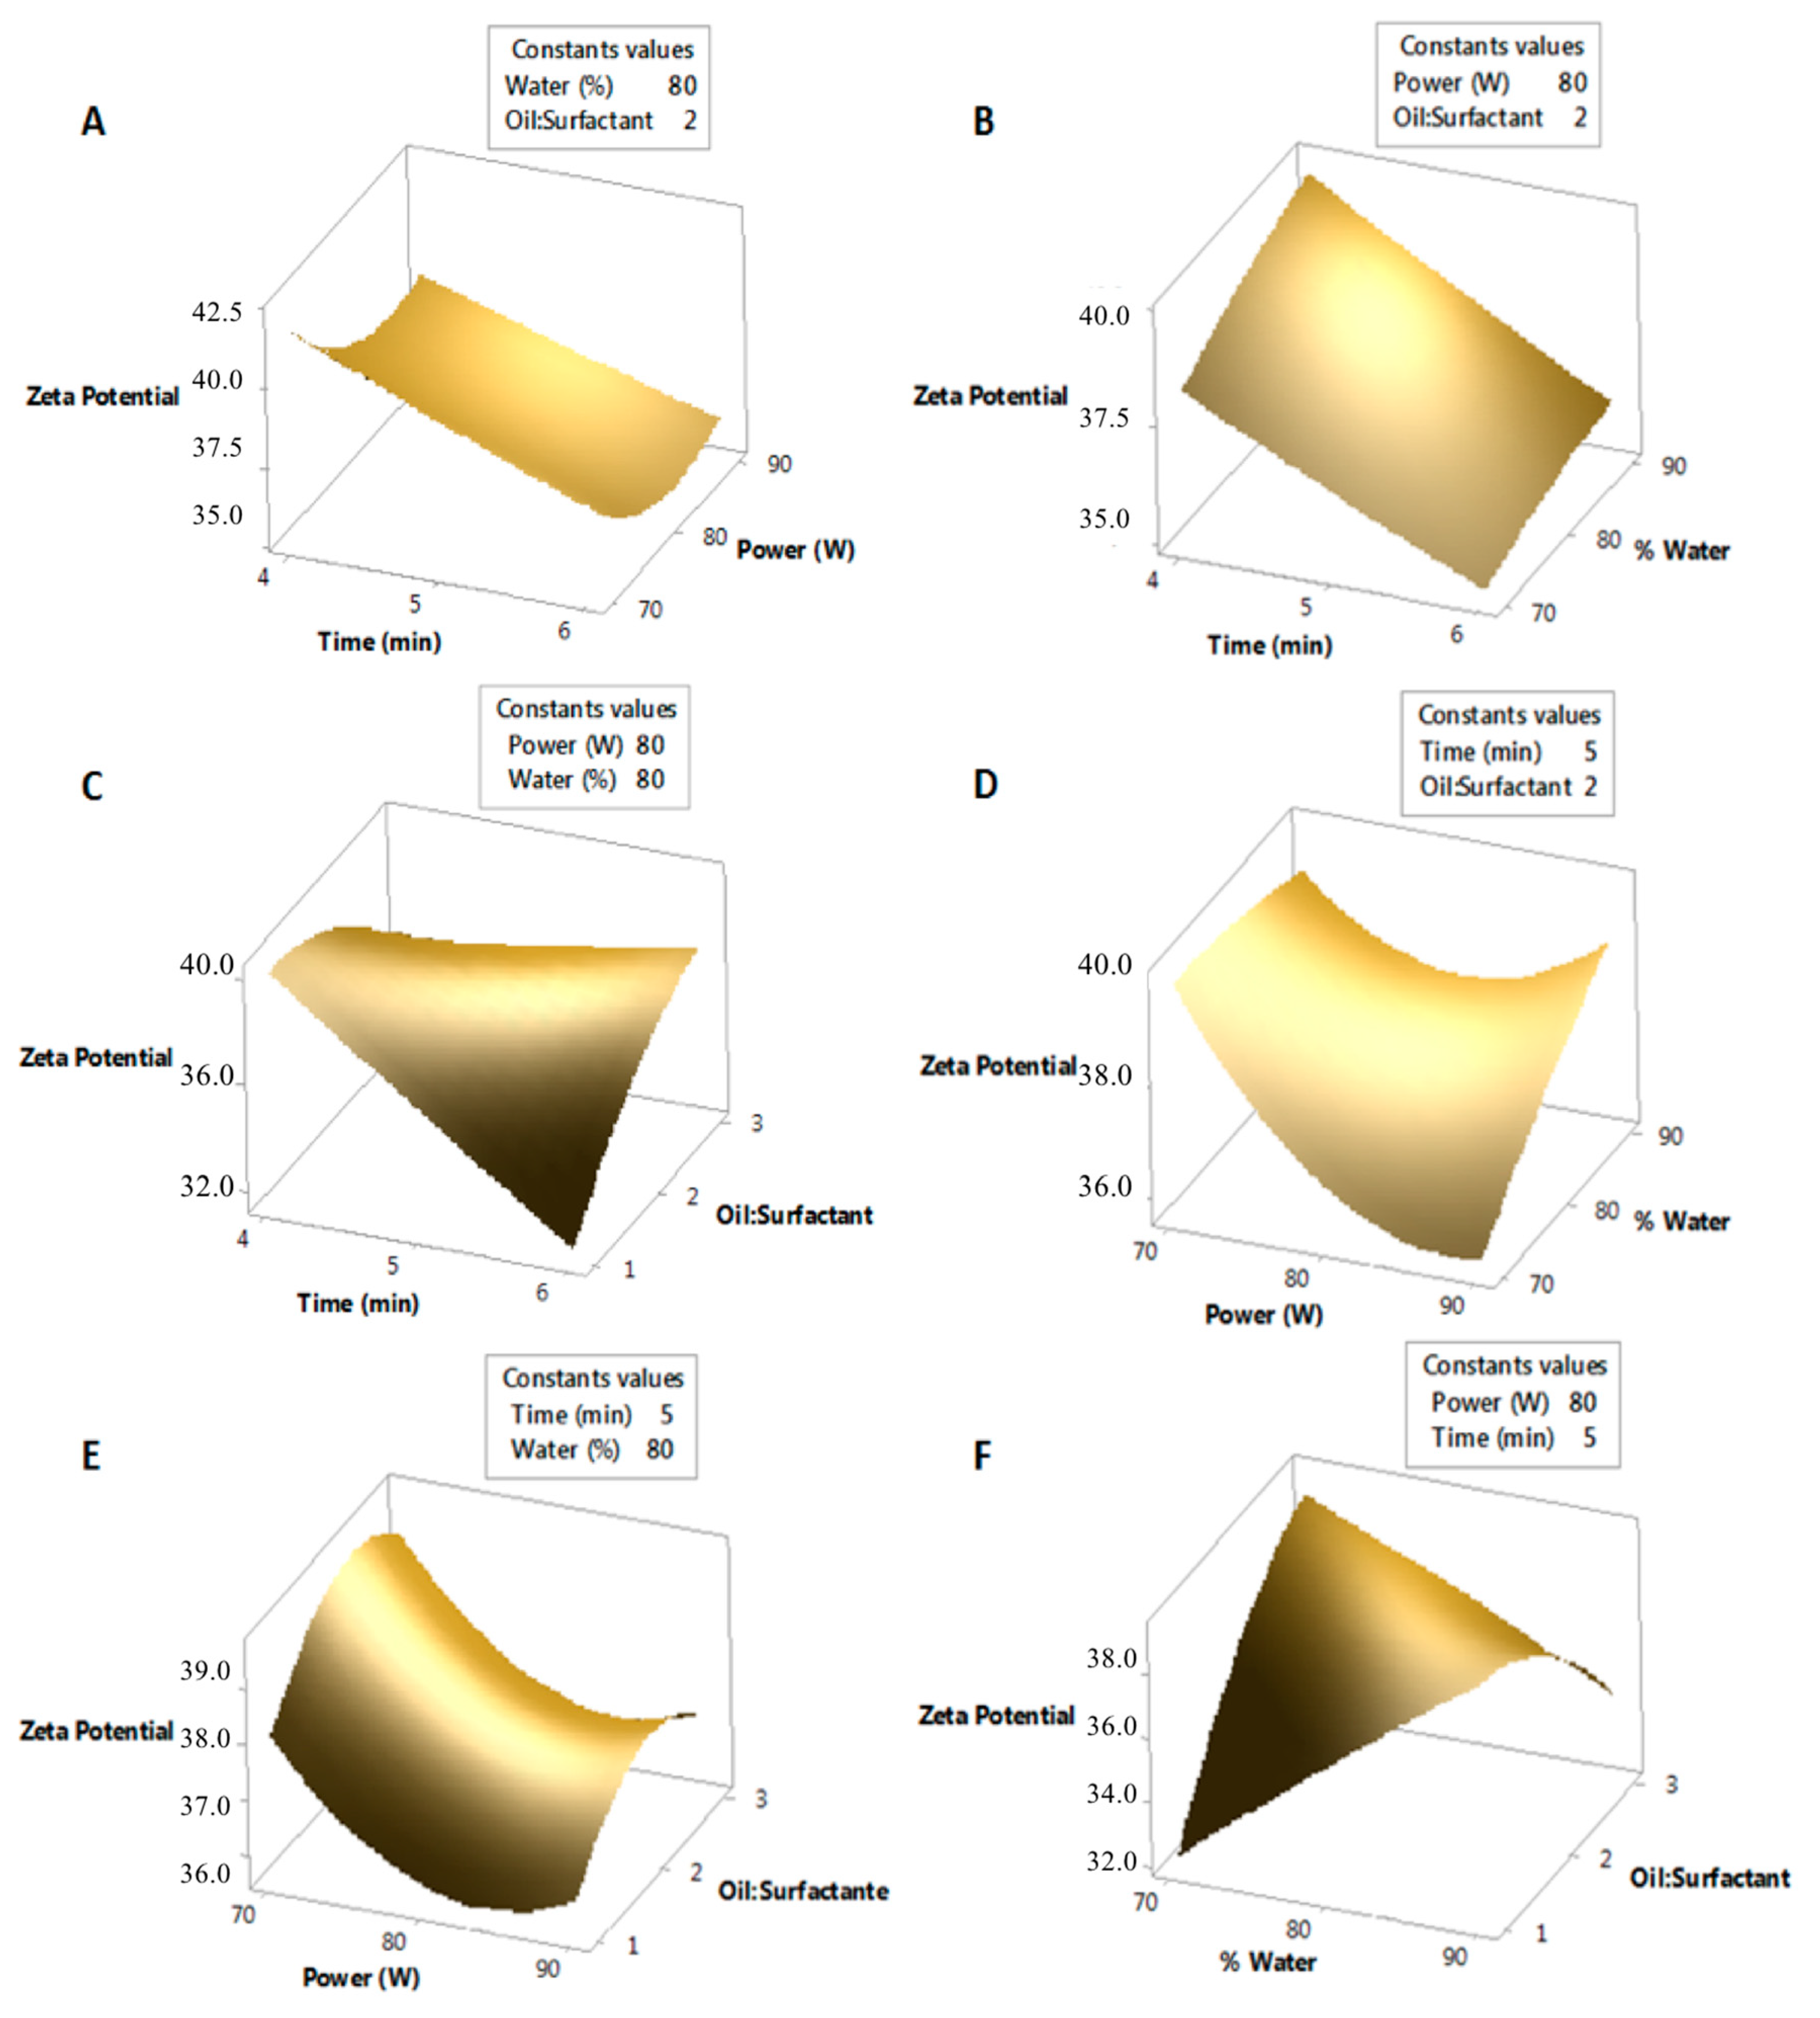
3.3.4. Analysis of the Response Surface of the Effects of the Formulation Variables on the Potential ζ of the Nanoemulsions

For potential ζ statistical analysis, absolute potential ζ value was employed. The relationship of the independent variables and the response variable (potential ζ) of the nanoemulsions is appropriately represented by the linear terms of irradiation time and power of ultrasonication, and the percentage interaction of the water oil:surfactant ratio (Figure 5). All other regression coefficients of the effects were excluded, because they were not significant in the model.
In Table 5, it can be seen that linear independent variables have a greater influence. The factor with the greatest influence was the irradiation time (0.001), followed by the power of ultrasonication (0.007). As shown in Figure 5A–C, maintaining the percentage of water and the oil:surfactant ratio (80%, 2) at the central point, the power of ultrasonication and the oil:surfactant ratio (80%, 2) and the power of ultrasonication and the percentage of water (80%, 80%) respectively, an increase in the absolute value of the potential ζ of the emulsions was observed. By decreasing the irradiation time, the absolute value of the potential ζ increased.
Taking into account that the surfactants used a non-ionic, stabilization of the system is achieved by steric and non-electrostatic repulsion [32]. The potential ζ values obtained show that the surface of the oil drop is negatively charged, which will improve the stability of the emulsion, causing repulsion of the double layer between the droplets. However, the net negative charge is presumably attributed to the polyoxyethylene chains of the surfactants (Tween 20) [33] and to the intrinsic charge in the oil droplet.
With respect to the linear factor of power of ultrasonication, by keeping at the central point the factors of irradiation time and the oil:surfactant ratio (5 min, 2), and irradiation time and percentage of water (5 min, 80%), an increase in the absolute value of the potential ζ was observed (Figure 5D–E) by decreasing the ultrasonication amplitude from 90% to 70%. A shorter irradiation tune and power of ultrasonication causes a smaller increase in the temperature of the system induced by cavitation, which could decrease the number of cavitation nuclei and its vapor pressure [34] affecting the emulsifying efficiency, albeit to a lesser extent, and preventing the decrease in the absolute value of the potential ζ. These results are in agreement with Nagn et al. [35] It is also observed that when the percentage of water and the oil: surfactant ratio are increased, the absolute value of the potential ζ increases (Figure 5F), which is to be expected since increasing the proportion of water in the system increases the rate of hydrolysis of the triglycerides of the oil, thereby increasing the amount of free fatty acids in the system, which contributes to negative charges on the interface [36]. Likewise, it would be expected that if the proportion of oil in the system is increased, the amount of free fatty acids would also increase, and in turn, the absolute value of the potential ζ. An oil:surfactant ratio of 3:1 shows that the amount of agent surfactant in the emulsion was not enough to surround and cover the newly formed oil droplets, while simultaneously, those droplets that were covered also showed a negative net charge [37]. In the same way, when the oil:surfactant ratio and the proportion of water in the system were increased, the chemical phenomena associated with the polyoxyethylene chains of Tween 20 were affected, thereby increasing the potential ζ value [38].

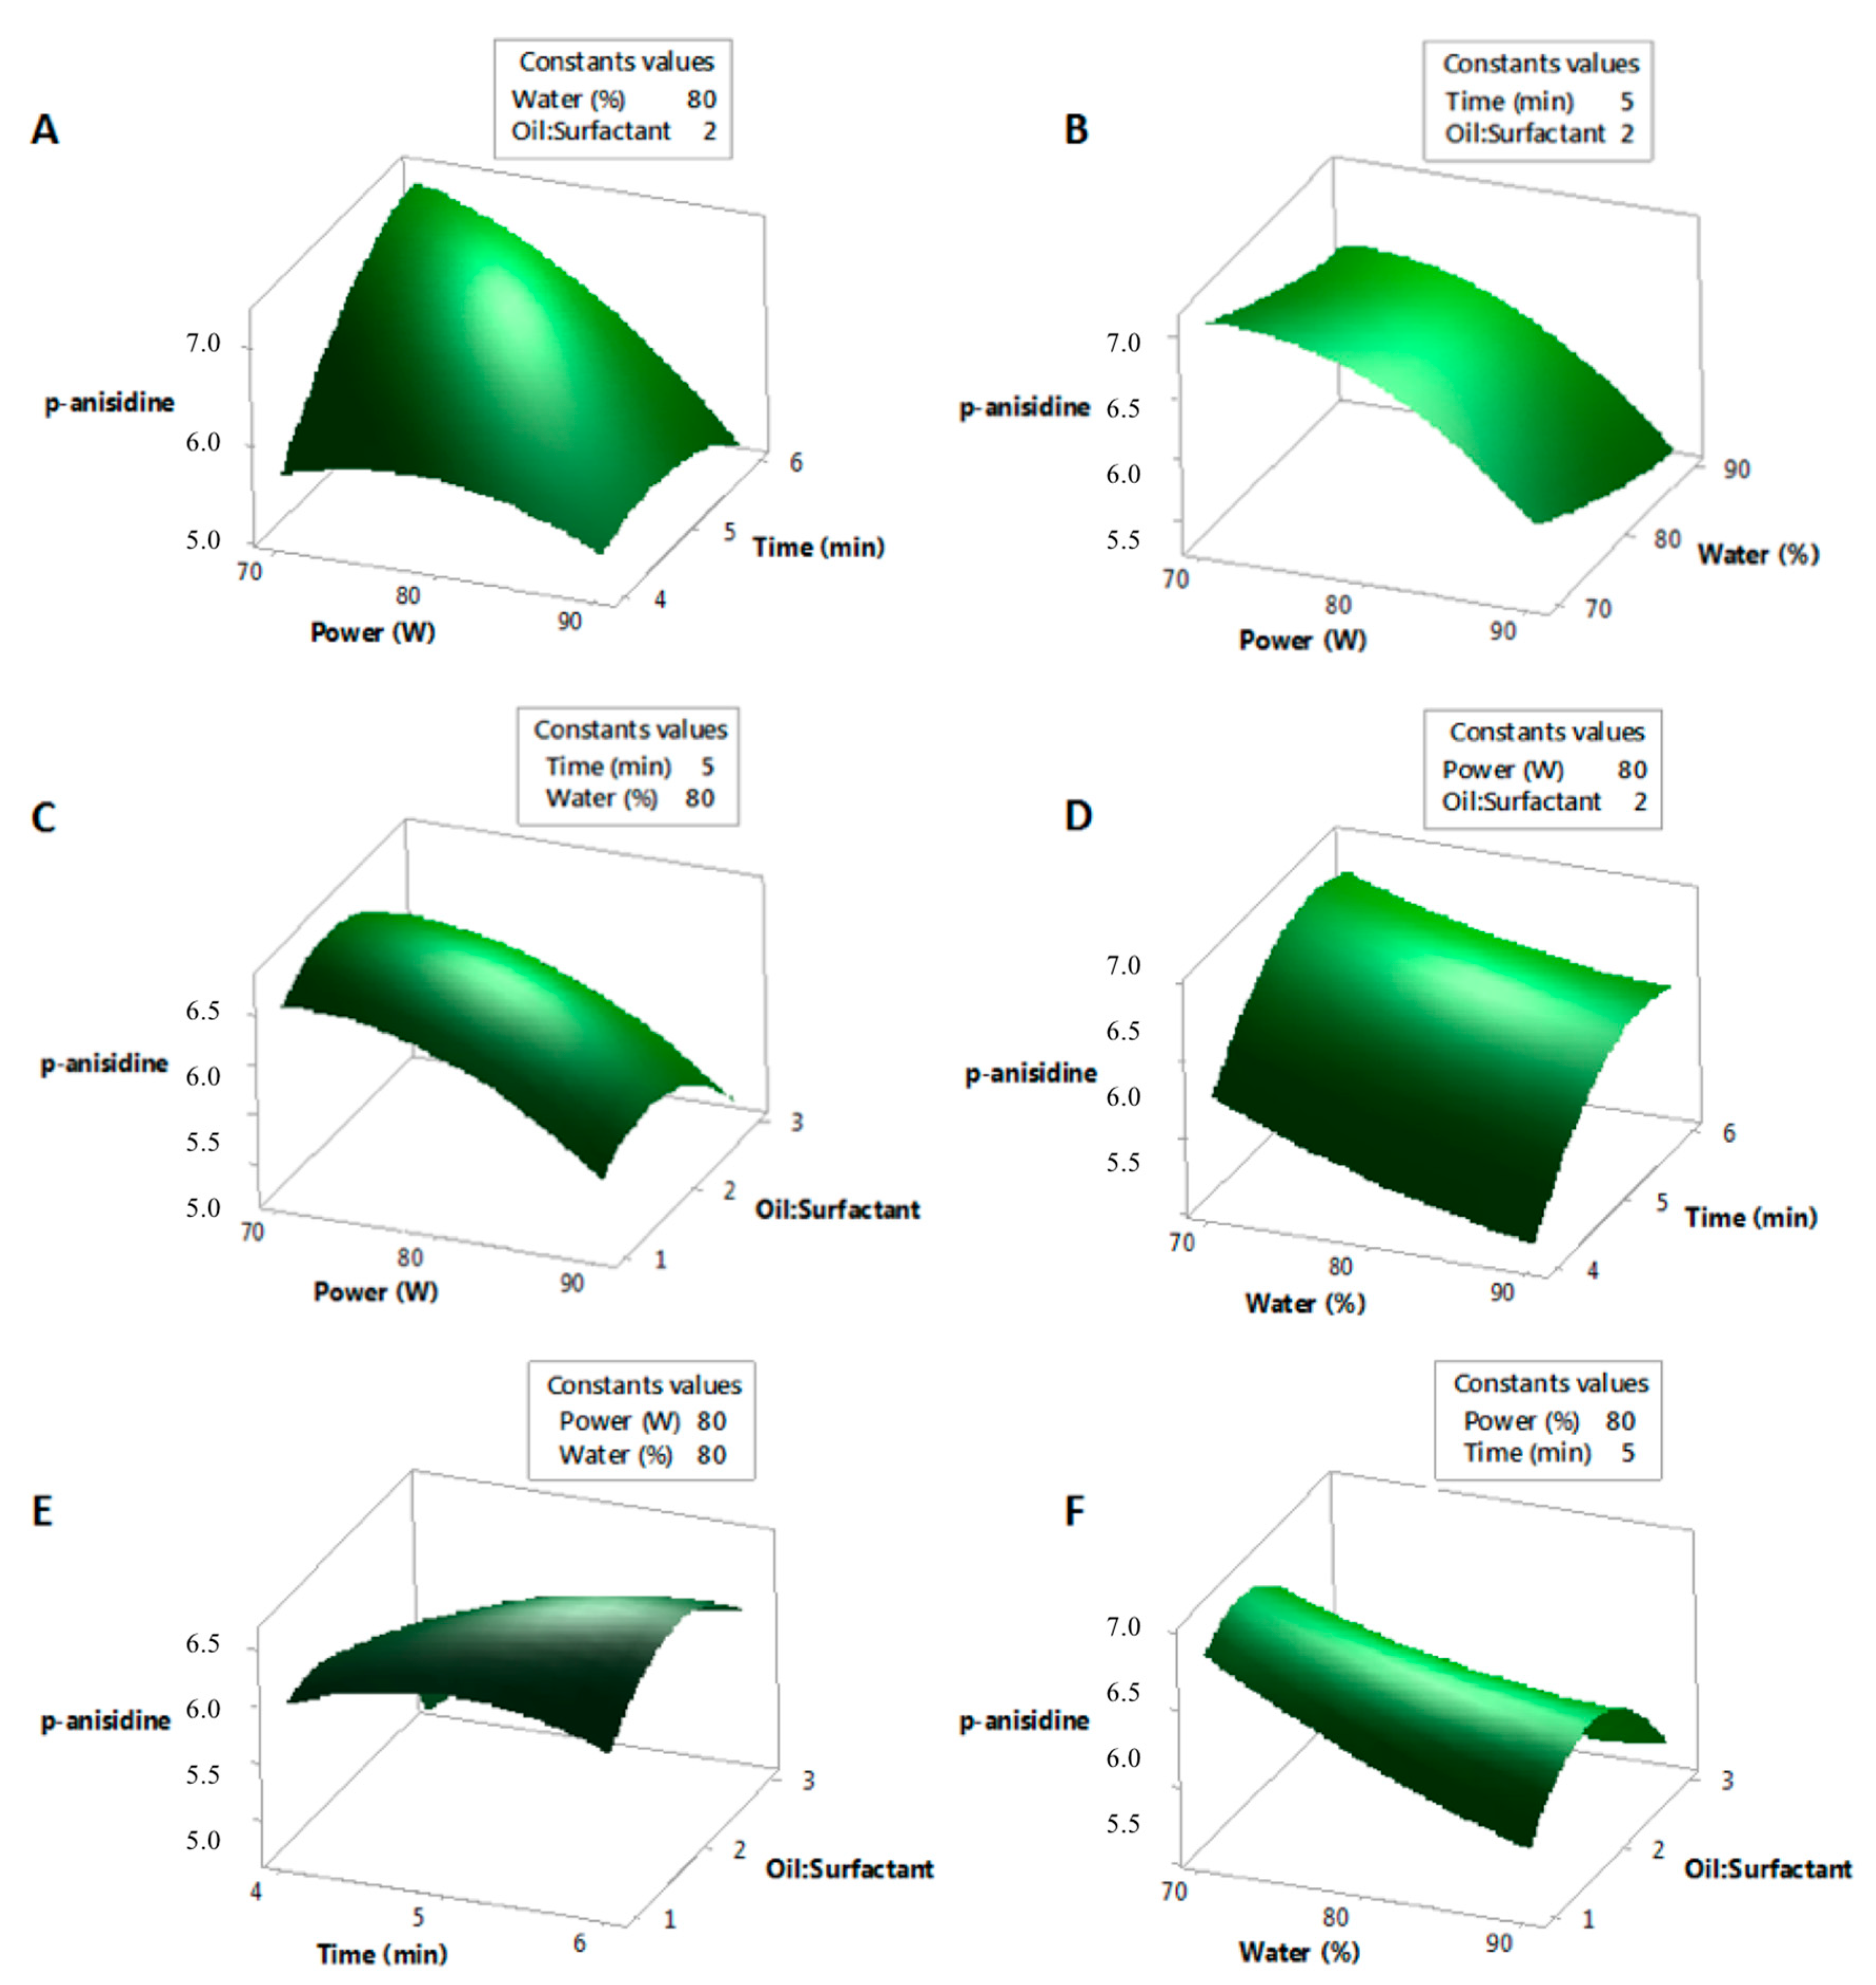
3.3.5. Analysis of the Response Surface of the Effects of the Formulation Variables on the p-Anisidine Value of the Nanoemulsions

p-anisidine value allows evaluating the presence of products of secondary oxidation in oils such as aldehydes. Since seed oil of P. edulis var. edulis is highly unsaturated, the p-anisidine value was chosen as an optimization parameter to achieve an optimal nanoemulsion with the minimal oxidation caused by the ultrasound emulsification.
The relationship of the independent variables on the response variable (p-anisidine value) of the nanoemulsions could be adequately represented by the linear term of ultrasonication amplitude; the other linear effects, the quadratic effects and the interactions were excluded because they were not significant in the model.
In the three-dimensional surface graphics (Figure 6) generated by MiniTab®18 (Copyright 2018. Minitab Inc.), for the response variable (p-anisidine value) of the nanoemulsions, when evaluating the effect of two independent variables, the two other variables are kept constant at the central point.
Table 5 shows that the only variable that has a significant effect on the independent variable of the power of ultrasonication (0.030). As shown in Figure 6A–C, maintaining the oil:surfactant ratio and the percentage of water (2, 80%) at the central point, the irradiation time and the oil:surfactant ratio (5 min, 2) and the irradiation time and percentage of water (5 min, 80%) respectively, it was observed that the p-anisidine value decreased when the ultrasonication power was increased from 70% to 90% and the irradiation time was decreased from 6 to 4 min. This is attributed to the fact that a greater power of ultrasonic irradiation generates an increase in energy density for a shorter period, which leads to a slightly higher average droplet diameter, resulting in a decrease in the available area of oxidation and thus minimizing the probability of oxidation of the scattered droplets [10]. Likewise, when the irradiation time is increased (Figure 6D–E), the system is exposed to an increase in temperature and energy in the ultrasonic cavitation process, which leads to an increase in oxidation of the oil [39].
With respect to the percentage of water, when the percentage of water in the formulation is increased from 70% to 90%, the p-anisidine value decreases. This is attributed to the fact that the mass ratio between the dispersed phase and the dispersant phase is lower, thereby decreasing the pro-oxidation of the dispersed oil [39,40]. On the other hand, reducing the oil:surfactant ratio (Figure 6F) allows the amount of surfactant available to completely cover the droplet of oil, reducing the access to the interior of the dispersed droplet, thus decreasing oxidation [26,27]. These results corroborate those reported by Hwang et al. and Mehmood et al. [21,40].

3.4. Validation of the Model for Optimized Nanoemulsions Containing Seed Oil of Passiflora edulis var. edulis

Three levels were optimized, with four independent variables, to achieve the optimal response of the formulated nanoemulsions. Multiple response optimization conditions would be considered if the optimization criteria produced the smallest droplet diameter, the narrowest PDI, and the highest absolute potential ζ value. Based on the statistical analysis of the different experimental combinations, a combination of 70.65% water content, 1.27 or 5:4 oil:surfactant ratio, 85.34% ultrasonic power and irradiation time of 5.96 min was selected numerically as the optimal conditions, from among the predicted solutions. This solution resulted in optimal response values of 130 nm, 0.200, −30 mV and 6.00 for droplet size, PDI, potential ζ and p-anisidine, respectively.
The adequacy of the polynomial models generated to represent the relationship between the independent and dependent variables was validated by performing three samples under optimal conditions. Table 6 shows both predicted and the experimental values for the propertied of the optimized nanoemulsion. The errors ranged between 0.25 and 9.33%, suggesting a high aptitude of the polynomial models of the response surface to express the relationships between the independent and dependent variables evaluated.
Optimized nanoemulsion also was characterized with regards to its viscosity (3.04 ± 0.17 cP), pH (6.82 ± 0.42) and conductivity (0.74 ± 0.18 ms/cm). In the TEM photograph (Figure 7) dispersed oil droplets of optimized nanoemulsion are shown as a dark spot. Droplet size observed by TEM was quite similar to that obtained by Zetasizer.

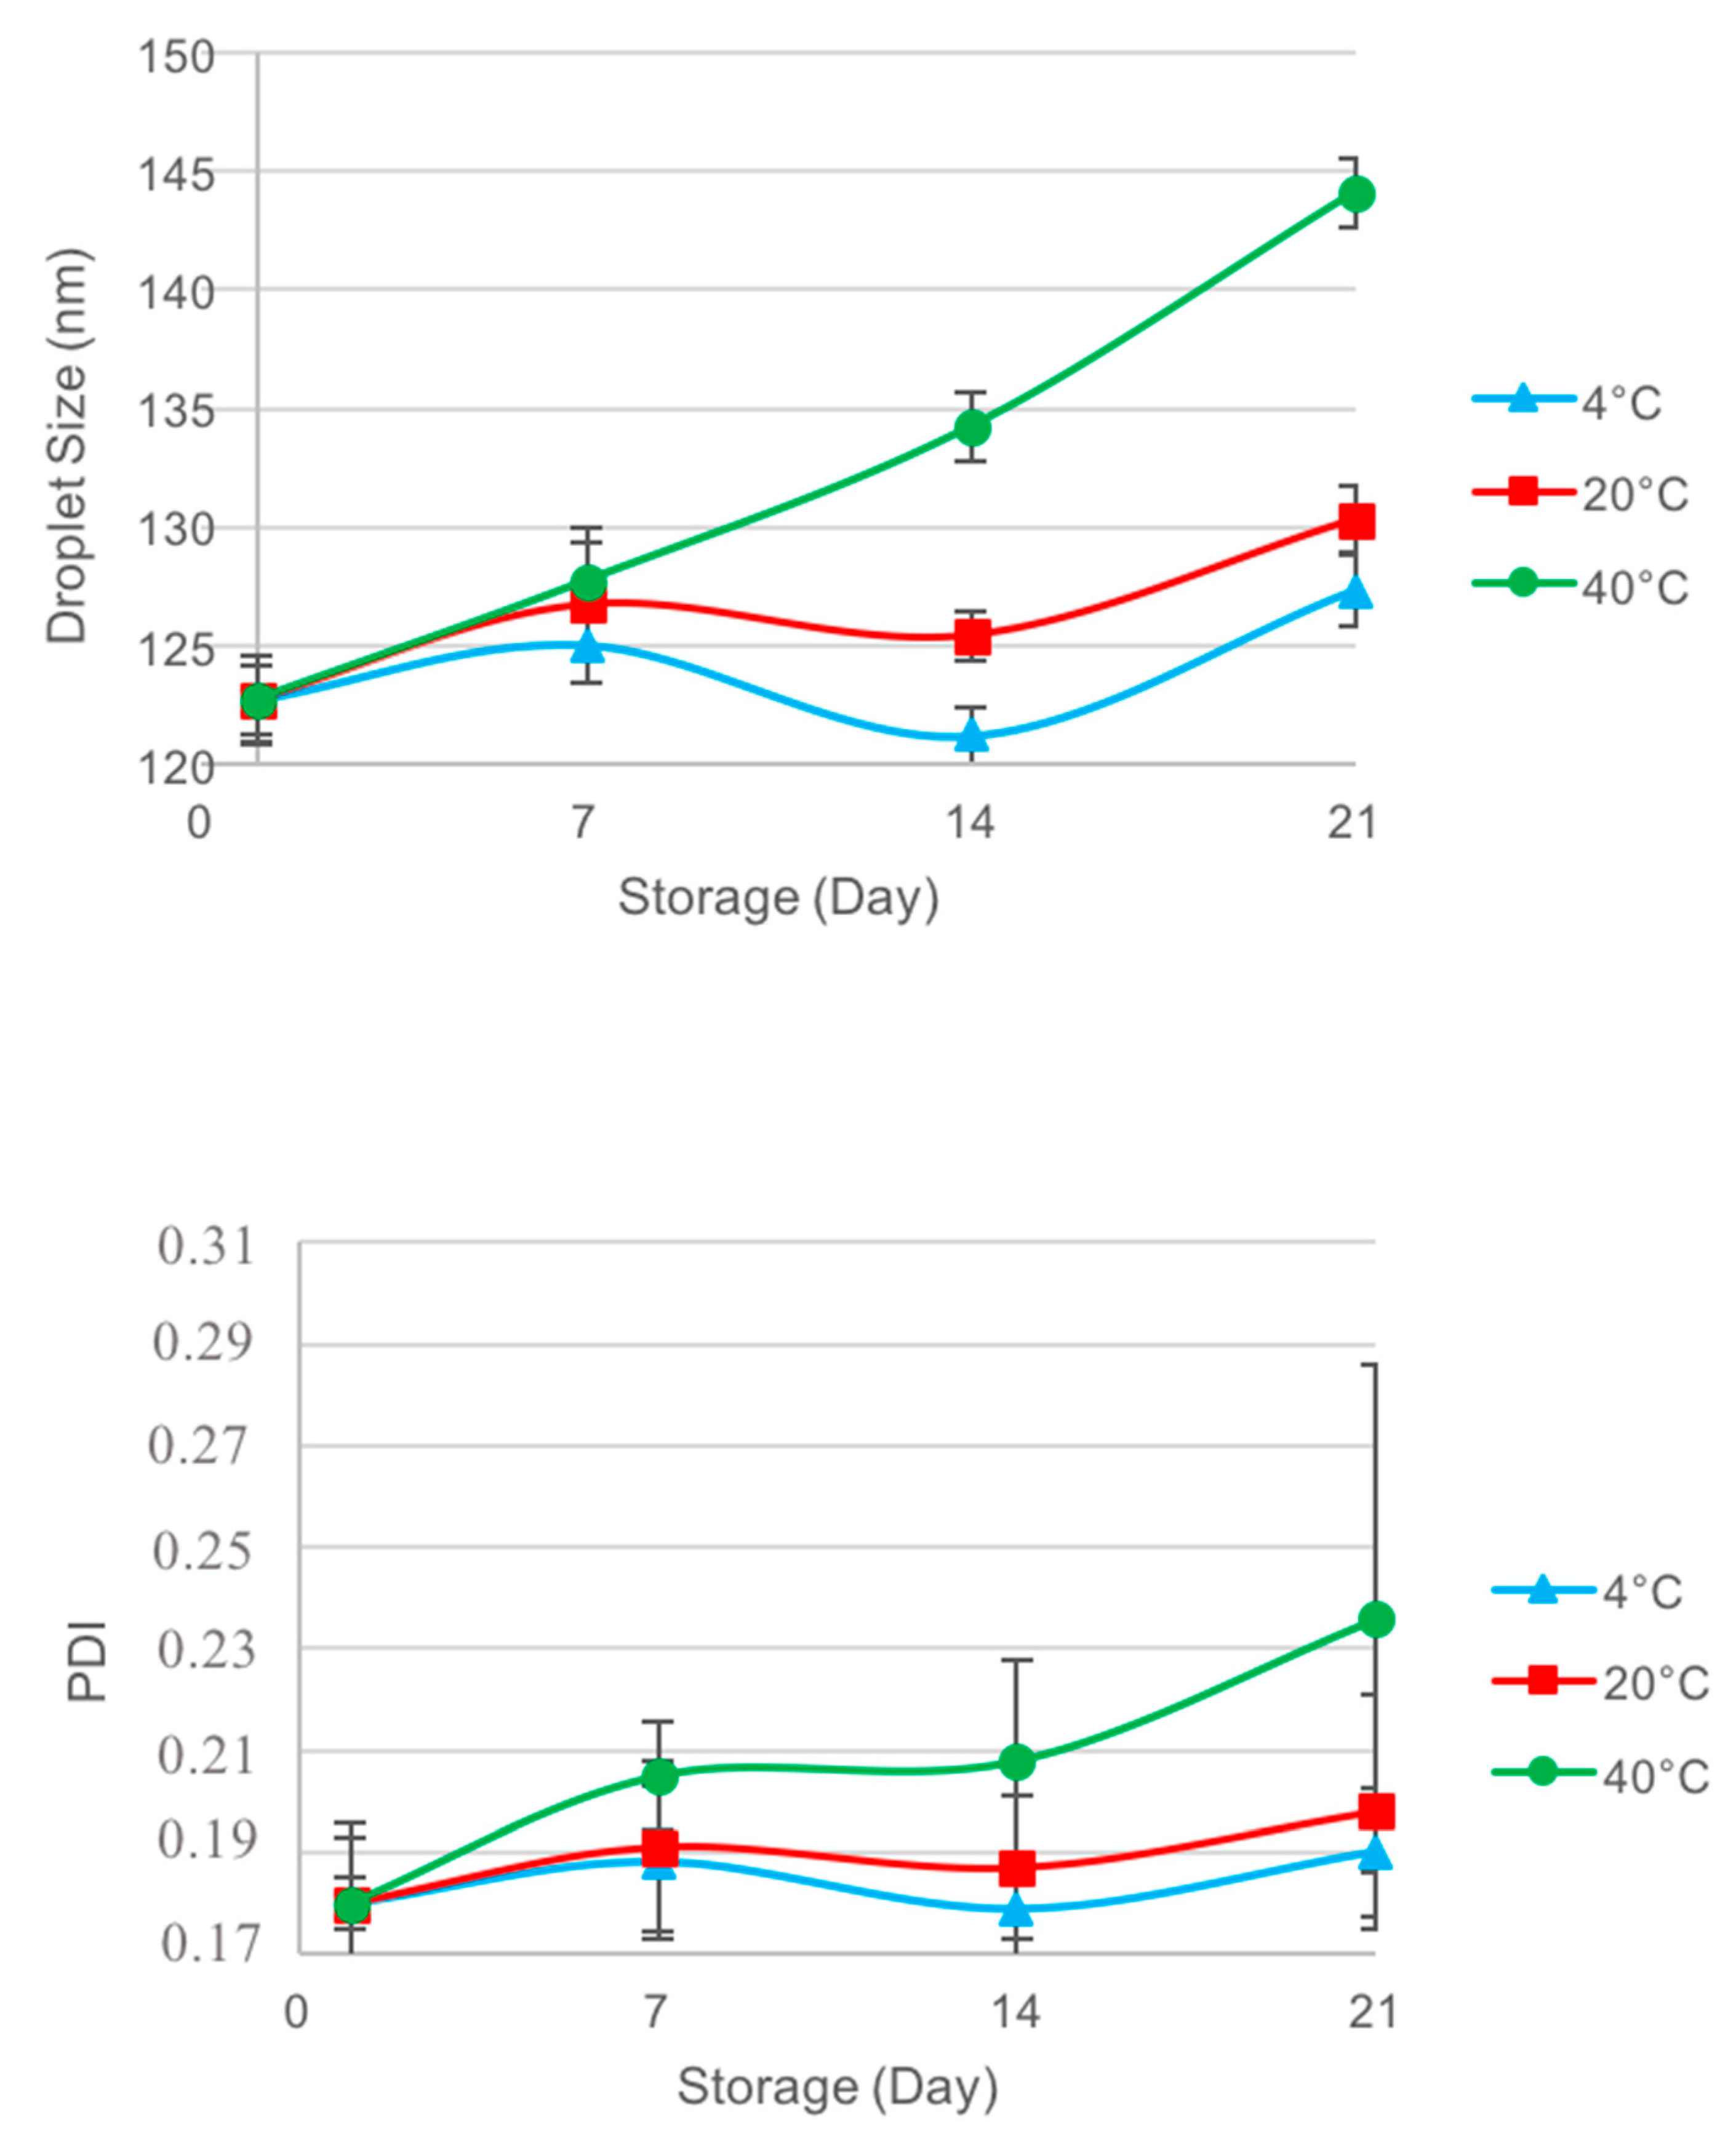
3.5. Stability Evaluation of the Optimized Nanoemulsion of Passiflora edulis var. edulis

The physical stability of the optimal formulation of nanoemulsions was evaluated under different storage conditions (4 °C, 20 °C and 40 °C). Droplet size measurements are a good indicator of the stability of the systems, as a rapid increase in the average droplet diameter and the PDI indicate low [41].
As shown in Figure 8 for the formulation stored at 4 °C, the mean droplet diameter ranged from 122.70 to 127.73 nm and the PDI ranged from 0.179 to 0.190; no cream formation or visible flocculation was observed. Therefore, the droplet size of the nanoemulsion evaluated at 4 °C was considered constant during the evaluation time, since no significant changes were observed. However, on day 7 of the evaluation, a decrease in droplet size was observed.
This decrease is attributed to the fact that the kinetic energy and the movements of the droplets decreased in the system and the system reached kinetic equilibrium. For the system evaluated at 20 °C, it was observed that the mean droplet diameter ranged between 122.70 to 137.33 nm, the PDI ranged from 0.179 to 0.178. No visible cream or flocculation was observed, showing the same behavior as the system evaluated at 4 °C.
Conversely, the system that was maintained at 40 °C showed a greater variation in droplet size and PDI, ranging from 122.70 to 144.10 nm and from 0.179 to 0.0950, respectively. It is presumed that with an increase in temperature, the movement of the scattered drops will increase, thereby increasing the probability of collision between them, and hence, the possibility of flocculation and coalescence occurring [42]. Likewise, an increase in droplet size can be attributed to a change in the structure of the monolayer, due to the dehydration of the hydrophilic group of the surfactant with the increase in temperature [43]. These results corroborate those reported by Rao and McClements and Eid et al. [44,45].
Therefore, it can be assured that the formulations stored at 4 °C and 25 °C are stable during the evaluation time. This remarkable stability could be attributed to several factors that directly and indirectly influenced the physical properties of the nanoemulsions. One of these factors is the linoleic acid content of the fixed seed oil of P. edulis var. edulis, as a high content of carboxylic acids in the interface of the droplet gives negative net charges to the oil droplets, causing them to repel each other by the incompatibility of loads. This effect contributes to a decrease in the phenomena of coalescence and an increase in the stability of the emulsions [46]. Additionally, the content of unsaturated fatty acids in the oil requires a greater proportion of hydrophilic surfactants (Tween 20) to increase the stability of the nanoemulsions [47]. This is an aspect that coincides with the design proposed and evaluated in the present study. The emulsifiers with higher HLB value stabilize the oil droplets in an O/W emulsion, more efficiently creating smaller droplets [48].

3.6. Evaluation of the Emollient Effect of the Seed Oil of Passiflora edulis var. edulis and Its Optimized Nanoemulsion

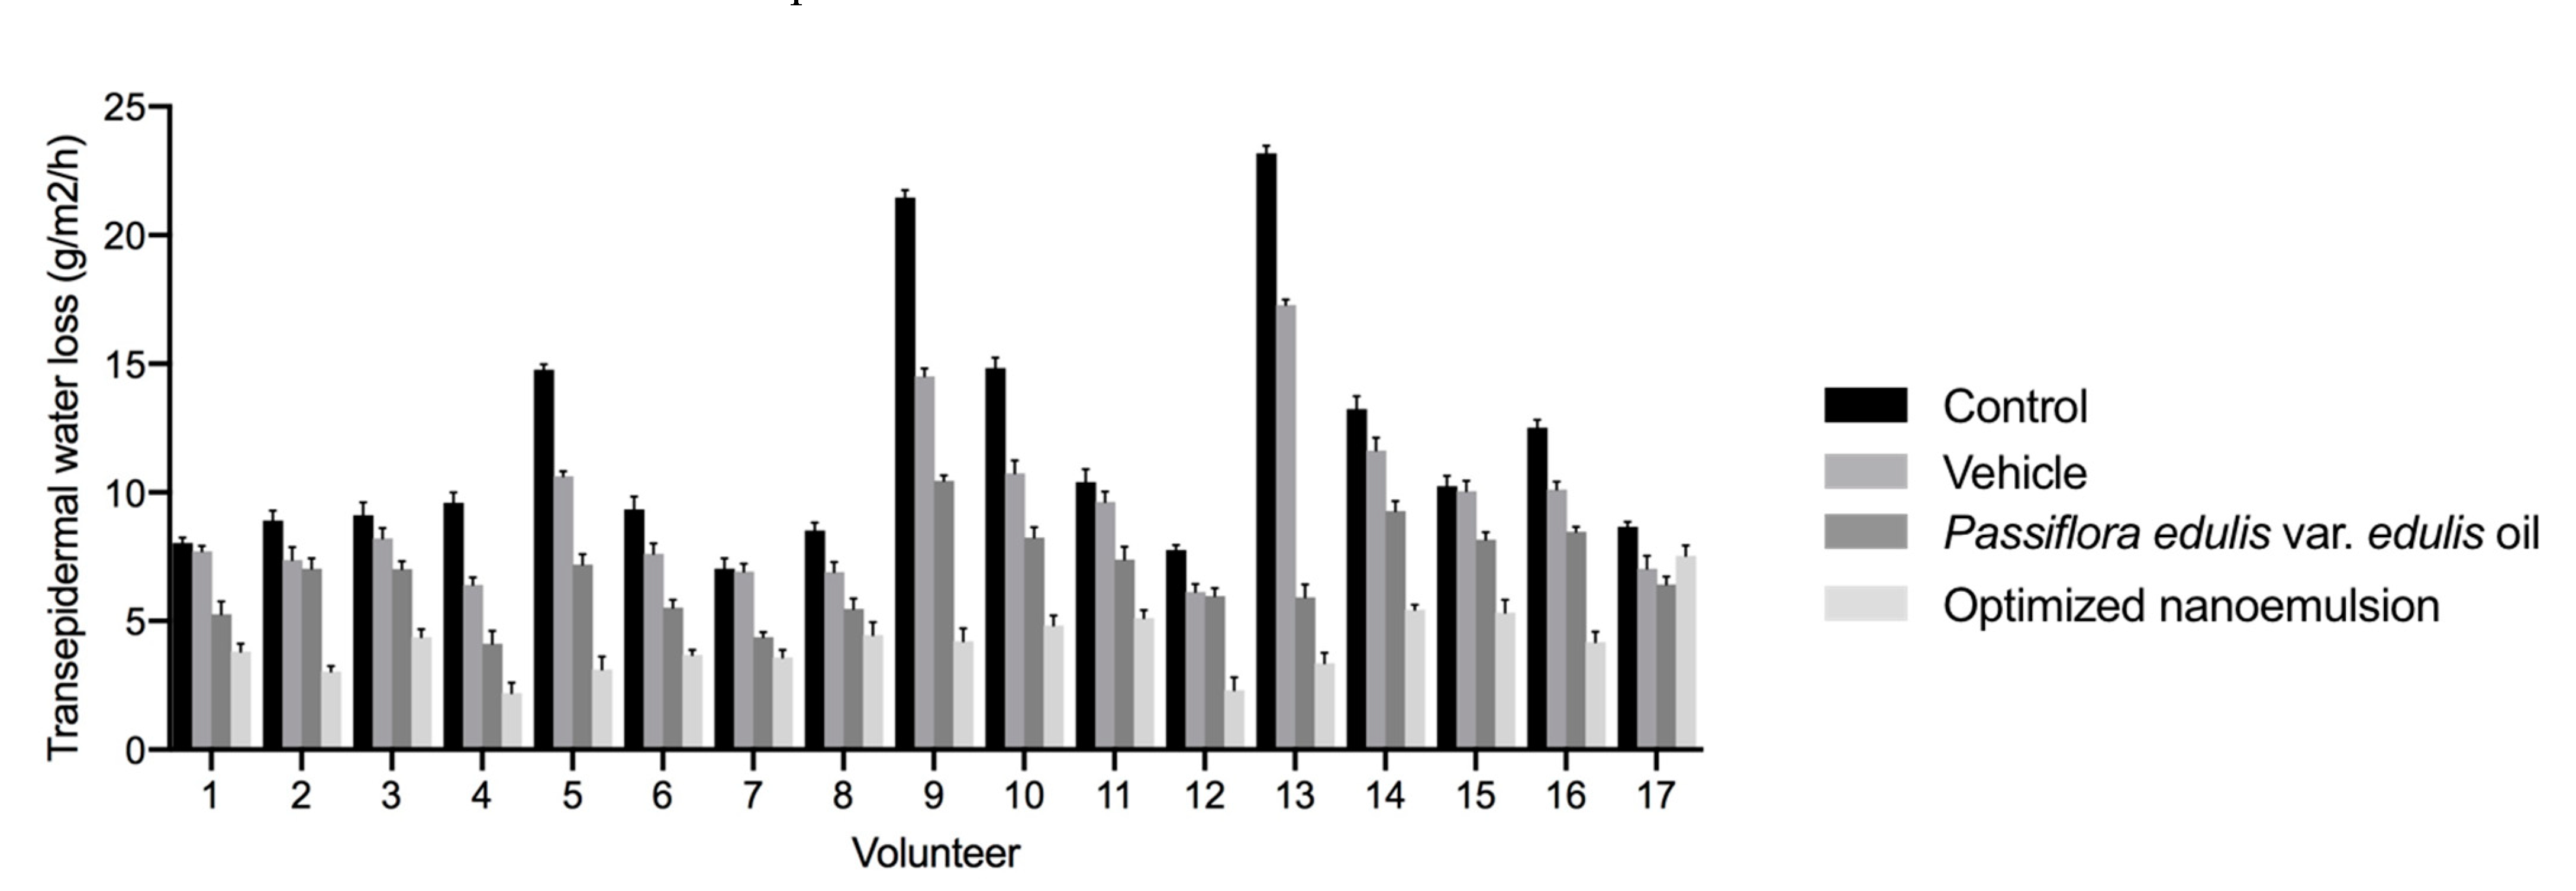
3.6.1. Transepidermal Water Loss

The measurements for the evaluation of the level of skin hydration, humectation and viscoelasticity are shown in Figure 9. The results show, for all the volunteers, an increase in the moisture and viscoelasticity of the skin, and a decrease in transepidermal water loss (TEWL).
The two-way ANOVA followed by a Tukey’s multiple comparisons test indicated that there is a statistically significant difference between all the treatments (p < 0.0001). After application of the PEO and PEO nanoemulsion, a decrease in transepidermal water loss (g/m2/h) is observed. This fact could be attributed to the formation of an occlusive film on the stratum corneum, which decreases and prevents water loss from the skin [36], thereby increasing the hydration of stratum corneum. A TEWL of less than 10 g/m2/h is an important characteristic for skin health.

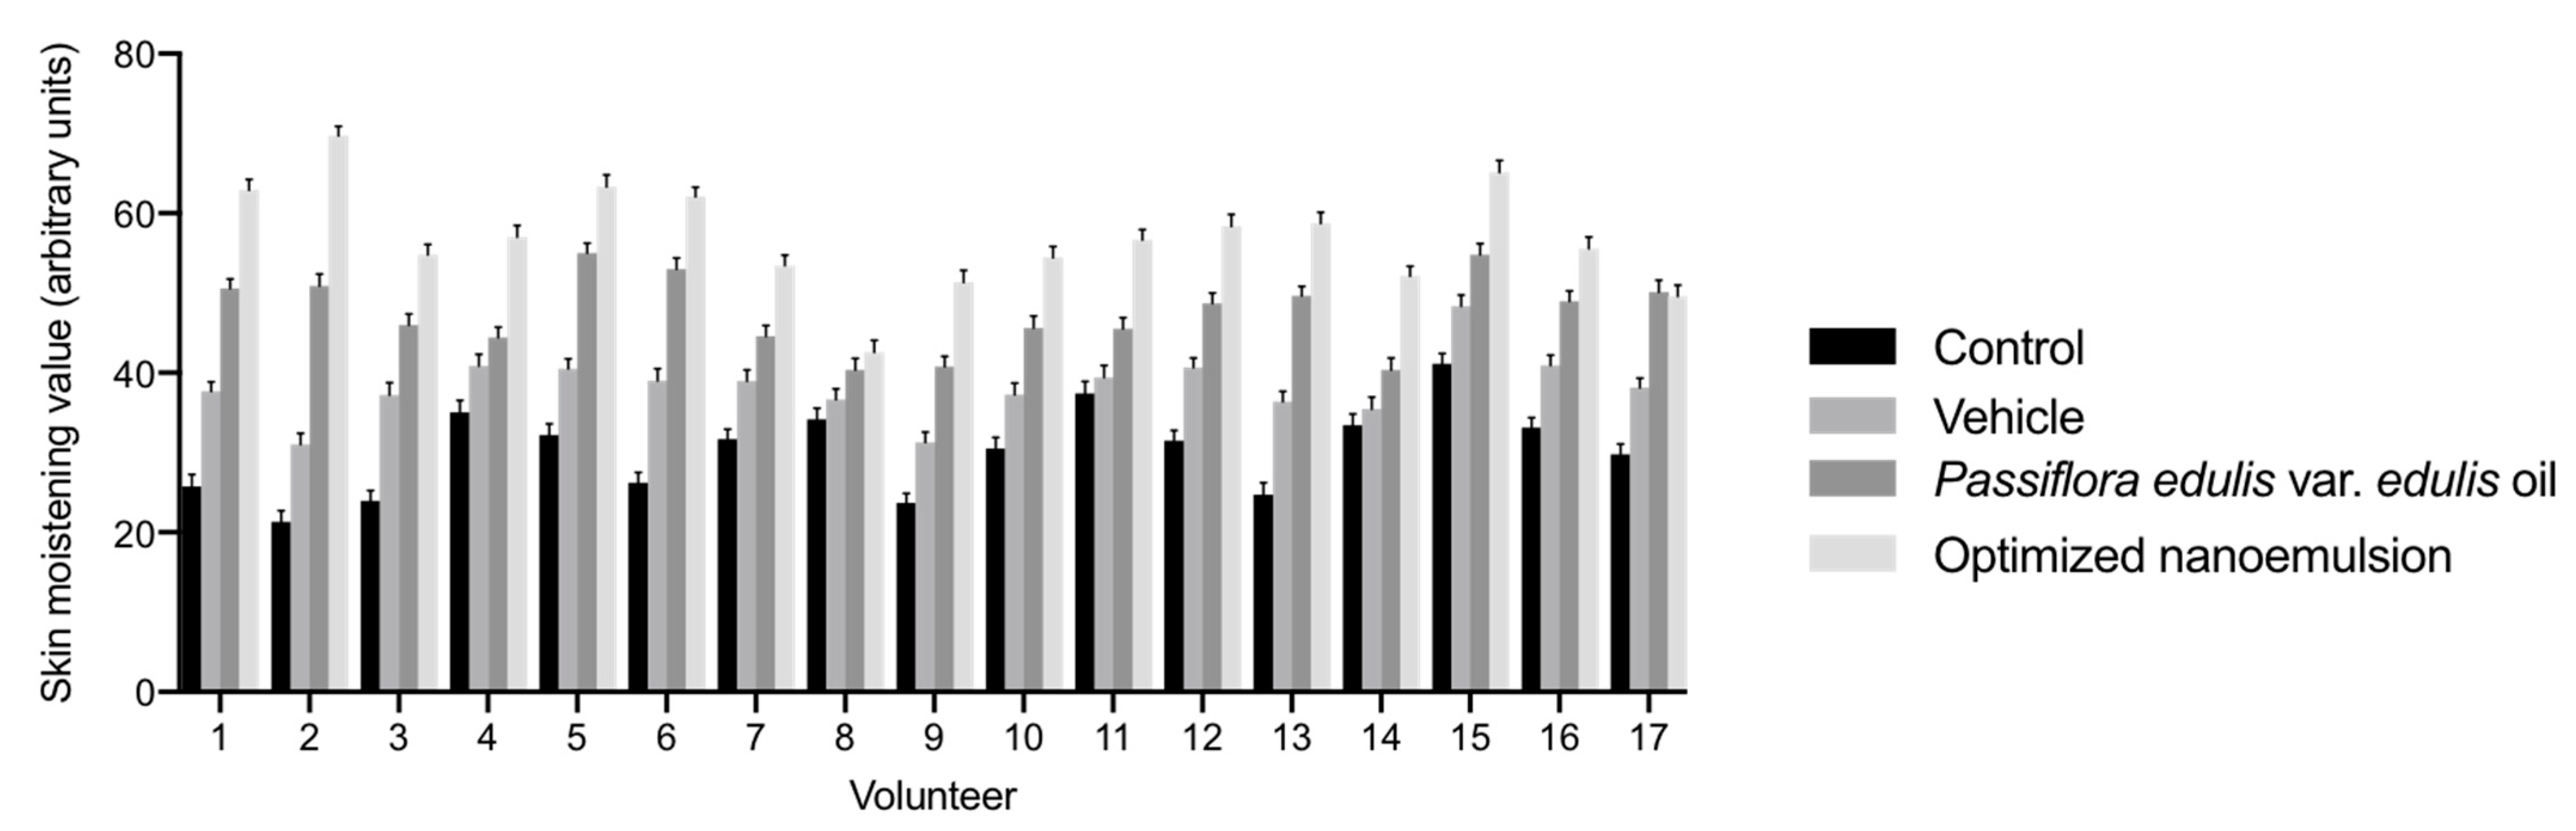
3.6.2. Skin Moisturizing

The ability of an active ingredient to prevent loss of water from the stratum corneum is directly related to its effectiveness in skin care [11]. The stratum corneum is a dielectric medium, and its dielectric properties change as the moisture content changes [38]. Moisturizing agents with oily substances can act by an occlusive mechanism, forming an epicutaneous lipid film that hinders the evaporation of water from the stratum corneum [49,50]. The results of the present study show an increase in water content in the stratum corneum after applying the oil, vehicle and nanoemulsion, compared to the control (Figure 10). The vehicle, oil and nanoemulsion increased the level of skin humidity compared to the control. This effect is attributed to mechanisms that retain water in the stratum corneum.
The water content of the skin is preserved by occlusive mechanisms or mechanisms of reorganization of the stratum corneum and restitution of water [38]. Thus, the oil generates a lipid film at the level of the stratum corneum, which prevents loss of water from it, preserving the water levels of the skin. The water of the vehicle also favors the hydric balance by active hydration, contributing to the formation of aquaporins and facilitating the flow of water [51]. The measurements of moisture level of the skin after application of the nanoemulsion and the vehicle showed a statistically significant difference. There was also a difference in skin moisture after the application of the PEO nanoemulsion or the PEO. This suggests that moisture level is due to the activity of the oil present in the PEO nanoemulsion. These results may also be related to the droplet size of the nanoemulsion, as an appropriate droplet size will facilitate penetration into the skin, increasing the skin moisture and hydration values [52].

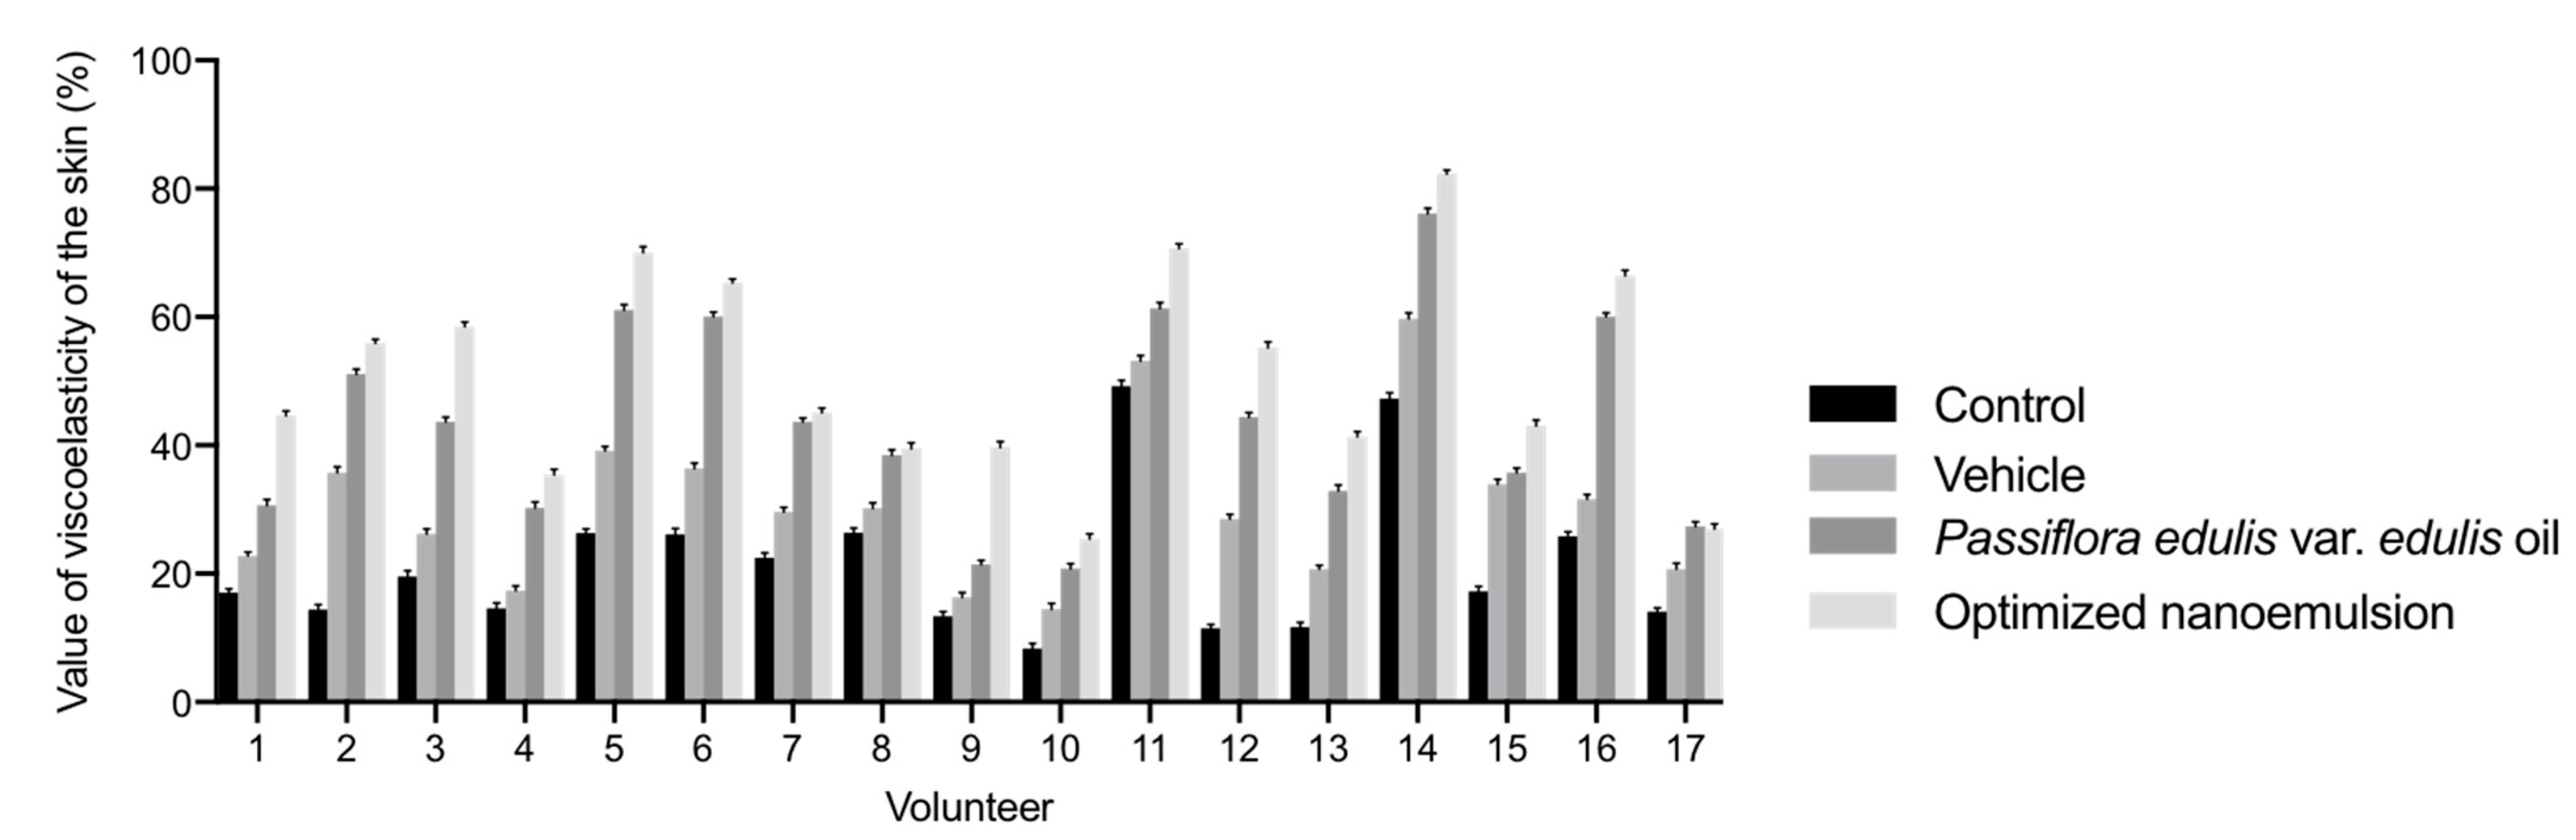
3.6.3. Skin Viscoelasticity

An increase in skin viscoelasticity indicates an increase in water content, which triggers a decrease in the viscosity of the interstitial fluid. When the water in the skin increases, the friction of the fibers of the dermis hinders the movement of the interstitial fluid, which is reflected in an improved viscoelasticity of the skin.
The composition also helps restore the collagen matrix, which is composed of cytoskeletons. The cytoskeletons have a fixed composition of lipids, phosphates, ceramides and fatty acids; these cytoskeleton structures mechanically couple with adjacent cells and proteins in extracellular regions. With the restoration of the collagen matrix, an imbalance in the composition of the collagen is avoided, which helps improve mechanical properties such as softness, firmness and elasticity of the skin [14].
Our results show that the vehicle, PEO and PEO nanoemulsions increased the viscoelasticity of the stratum corneum, modifying the biomechanical properties of the skin (Figure 11). Given the statistical differences between the vehicle, PEO and PEO nanoemulsions, this increase in skin viscoelasticity may be related to adequate maintenance of the stratum corneum, and to the composition of the oil of seeds of P. edulis var. edulis. This is due to the triglycerides, which act as intercellular cement between the corneocytes, contributing significantly to the regulation of the passage of water through the skin and inhibiting the evaporation of water from the skin [14]. Taking into account that the fixed oil of seeds of P. edulis var. edulis has low acidity, it is estimated that a high triglyceride content would contribute to the skin moisturization. The PEO is composed mostly of unsaturated fatty acids (90.0%), such as linoleic acid (78.77% ± 0.06) and oleic acid (11.57% ± 0.02); linoleic acid is part of the structure of cell membranes of the phospholipids, which contribute to improving the structure of the skin, with a beneficial effect on dry, rough skin [53].

4. Conclusions

The seed oil of P. edulis var. edulis has a high linoleic acid content, similar to that of oils of other Passiflora species. A combination of 70.65% water, oil:surfactant ratio of 5:4, ultrasonic power of 85.34W and irradiation time of 5.96 min was selected as the optimum emulsification conditions, with response values of 130, 33 nm, 0.202, −30.4 mV and 5.44 for droplet size, POI, ζ potential and p-anisidine value, respectively. Based on the above, it is concluded that the method of ultrasound-assisted preparation of nanoemulsions enables systems to be obtained with small droplets and low PDI by the incidence that has the power and irradiation time on these response variables. In addition, the optimized formulation is stable at 4 °C and 20 °C for 21 days. Finally, the in vivo efficacy tests demonstrated that the seed oil of P. edulis var. edulis, as well as its nanoemulsion, is present for the emollient activity by increasing moisture, hydration and skin elasticity after topical application.

Author Contributions

Conceptualization, M.A., M.A.R.; methodology, C.G.; formal analysis, C.G.; investigation, C.G.; writing—original draft preparation, C.G.; writing—review and editing, M.A., M.A.R.; supervision, M.A., M.A.R.; project administration, M.A., M.A.R. All authors have read and agreed to the published version of the manuscript.

Funding

This research received no external funding.

Institutional Review Board Statement

The study was conducted according to the guidelines of the Declaration of Helsinki, and approved by the local Research Ethics Committee of the Faculty of Science of University National of Colombia (Act 02/2018).

Informed Consent Statement

Informed consent was obtained from all subjects in-volved in the study.

Data Availability Statement

The data presented in this study are available on request from the corresponding author.

Acknowledgments

The authors thank the National University of Colombia for the financial support provided, and the Pharmacy Department of the National University of Colombia for the supply of equipment and the use of its facilities in the development of this study.

Conflicts of Interest

The authors declare no conflict of interest.

References

  1. Aburjai, T.; Natsheh, F.M. Plants Used in Cosmetics. Phyther. Res. 2003, 17, 987–1000. [Google Scholar] [CrossRef] [PubMed]
  2. Guglielmini, G. Nanostructured novel carrier for topical application. Clin. Derm. 2008, 26, 341–346. [Google Scholar] [CrossRef] [PubMed]
  3. McClements, D.J.; Xiao, H. Potential biological fate of ingested nanoemulsions: Influence of particle characteristics. Food Funct. 2012, 3, 202–220. [Google Scholar] [CrossRef] [PubMed]
  4. Coca, C.A.; Nates Parra, G.; Ospina Torres, R.; Melo Ortiz, C.D. Biología floral y reproductiva de la gulupa Passiflora edulis sims F. edulis. Caldasia 2011, 33, 433–451. [Google Scholar]
  5. Hernandez, Y.; Aragón, M.; Martinez, J.; Rojas, M. Evaluation of Passiflora tripartita var. mollisima seed oil as potential nanoemulsion excipient. J. Excip. Food Chem. 2018, 9, 16–27. [Google Scholar]
  6. The Commission of the European Communities. Commission Regulation (EC) No. 796/2002 of May 6 of 2002; Amending Regulation (EEC) No 2568/91 on the characteristics of olive oil and olive-pomace oil and on the relevant methods of analysis. Off. J. Eur. Union. 2002, 15, 23–26. [Google Scholar]
  7. International Organization for Standardization. ISO 5508: 1990: Animal and Vegetable Fats and Oils—Analysis by Gas Chromatography of Methyl Esters of Fatty Acids; International Organization for Standardization: Geneva, Switzerland, 1990; Volume 2, p. 12. [Google Scholar]
  8. U.S. Pharmacopoeia-National Formulary (USP 40 NF 35); United States Pharmacopeial Convention, Inc.: Rockville, MD, USA, 2017; Volume 1, Chemical Test (401). Fats and Fixed oils; pp. 332–336.
  9. Alzorqi, I.; Ketabchi, M.R.; Sudheer, S.; Manickam, S. Optimization of ultrasound induced emulsification on the formulation of palm-olein based nanoemulsions for the incorporation of antioxidant β-d-glucan polysaccharides. Ultrason. Sonochem. 2016, 31, 71–84. [Google Scholar] [CrossRef]
  10. Rodrigues, R.F.; Costa, I.C.; Almeida, F.B.; Cruz, R.A.S.; Ferreira, A.M.; Vilhena, J.C.E.; Florentino, A.C.; Carvalho, J.C.T.; Fernandes, C.P. Development and characterization of evening primrose (Oenothera biennis) oil nanoemulsions. Rev. Bras. Farm. 2015, 25, 422–425. [Google Scholar] [CrossRef] [Green Version]
  11. Estanqueiro, M.; Conceição, J.; Amaral, M.H.; Sousa Lobo, J.M. Characterization, sensorial evaluation and moisturizing efficacy of nanolipidgel formulations. Int. J. Cosmet. Sci. 2014, 36, 159–166. [Google Scholar] [CrossRef]
  12. Kapoor, S.; Saraf, S. Formulation and Evaluation of Moisturizer Containing Herbal Extracts for the Management of Dry Ski. Pharmacogn. J. 2010, 2, 409–417. [Google Scholar] [CrossRef] [Green Version]
  13. Kapoor, S.; Saraf, S. Assessment of viscoelasticity and hydration effect of herbal moisturizers using bioengineering techniques. Pharm. Mag. 2010, 6, 298–300. [Google Scholar] [CrossRef] [PubMed] [Green Version]
  14. Ahshawat, M.S.; Saraf, S.; Saraf, S. Preparation and characterization of herbal creams for improvement of skin viscoelastic properties. Int. J. Cosmet. Sci. 2008, 30, 183–193. [Google Scholar] [CrossRef] [PubMed]
  15. Malacrida, C.R.; Jorge, N. Yellow passion fruit seed oil (Passiflora edulis f. flavicarpa): Physical and chemical characteristics. Braz. Arch. Biol. Technol. 2012, 55, 127–134. [Google Scholar]
  16. Liu, S.; Yang, F.; Li, J.; Zhang, C.; Ji, H.; Hong, P. Physical and chemical analysis of Passiflora seeds and seed oil from China. Int. J. Food Sci. Nutr. 2008, 59, 706–715. [Google Scholar] [CrossRef]
  17. Nyanzi, S.A.; Carstensen, B.; Schwack, W. A comparative study of fatty acid profiles of Passiflora seed oils from Uganda. J. Am. Oil Chem. Soc. 2005, 82, 41–44. [Google Scholar] [CrossRef]
  18. de Santana, F.C.; Shinagawa, F.B.; Araujo, E.D.; Costa, A.M.; Mancini-Filho, J. Chemical Composition and Antioxidant Capacity of Brazilian Passiflora Seed Oils. J. Food Sci. 2015, 80, C2647–C2654. [Google Scholar] [CrossRef]
  19. Pereira, M.G.; Hamerski, F.; Andrade, E.F.; Scheer, A.D.; Corazza, M.L. Assessment of subcritical propane, ultrasound-assisted and Soxhlet extraction of oil from sweet passion fruit (Passiflora alata Curtis) seeds. J. Supercrit. Fluids. 2017, 128, 338–348. [Google Scholar] [CrossRef]
  20. Labrinea, E.P.; Thomaidis, N.S.; Georgiou, C.A. Direct olive oil anisidine value determination by flow injection. Anal. Chim. Acta. 2001, 448, 201–206. [Google Scholar] [CrossRef]
  21. Hwang, J.-Y.; Ha, H.-K.; Lee, M.-R.; Kim, J.W.; Kim, H.-J.; Lee, W.-J. Physicochemical Property and Oxidative Stability of Whey Protein Concentrate Multiple Nanoemulsion Containing Fish Oil. J. Food Sci. 2017, 82, 437–444. [Google Scholar] [CrossRef]
  22. Silva, H.D.; Cerqueira, M.A.; Vicente, A.A. Influence of surfactant and processing conditions in the stability of oil-in-water nanoemulsions. J. Food Eng. 2015, 167, 89–98. [Google Scholar] [CrossRef] [Green Version]
  23. Yang, B.; Xu, J. Thermophysical Properties and SANS Studies of Nanoemulsion Heat Transfer Fluids. In Neutron Scattering; InTech: London, UK, 2016. [Google Scholar]
  24. Woitiski, C.B.; Veiga, F.; Ribeiro, A.; Neufeld, R. Design for optimization of nanoparticles integrating biomaterials for orally dosed insulin. Eur. J. Pharm. Biopharm. 2009, 73, 25–33. [Google Scholar] [CrossRef] [PubMed]
  25. Kentish, S.; Wooster, T.J.; Ashokkumar, M.; Balachandran, S.; Mawson, R.; Simons, L. The use of ultrasonics for nanoemulsion preparation. Innov. Food Sci. Emerg. Technol. 2008, 9, 170–175. [Google Scholar] [CrossRef]
  26. Tadros, T.; Izquierdo, P.; Esquena, J.; Solans, C. Formation and stability of nano-emulsions. Adv. Colloid Interface Sci. 2004, 108–109, 303–318. [Google Scholar] [CrossRef] [PubMed]
  27. Li, P.H.; Chiang, B.H. Process optimization and stability of D-limonene-in-water nanoemulsions prepared by ultrasonic emulsification using response surface methodology. Ultrason. Sonochem. 2012, 19, 192–197. [Google Scholar] [CrossRef] [PubMed]
  28. Chanana, G.D.; Sheth, B.B. Particle Size Reduction of Emulsions by Formulation Design-II: Effect of Oil and Surfactant Concentration. PDA J. Pharm Sci. Technol. 1995, 49, 71–76. [Google Scholar]
  29. Leong, T.S.H.; Wooster, T.J.; Kentish, S.E.; Ashokkumar, M. Minimising oil droplet size using ultrasonic emulsification. Ultrason. Sonochem. 2009, 16, 721–727. [Google Scholar] [CrossRef] [Green Version]
  30. Yuan, Y.; Gao, Y.; Zhao, J.; Mao, L. Characterization and stability evaluation of β-carotene nanoemulsions prepared by high pressure homogenization under various emulsifying conditions. Food Res. Int. 2008, 41, 61–68. [Google Scholar] [CrossRef]
  31. Meor Mohd, A.; Bustami Effendi, T.J.; Abdul Majeed, A.B. Development and stability evaluation of Astaxanthin nanoemulsion. Asian J. Pharm. Clin. Res. 2011, 4, 143–148. [Google Scholar]
  32. Wang, L.; Dong, J.; Chen, J.; Eastoe, J.; Li, X. Design and optimization of a new self-nanoemulsifying drug delivery system. J. Colloid Interface Sci. 2009, 330, 443–448. [Google Scholar] [CrossRef]
  33. Maruno, M.; da Rocha-Filho, P.A. O/W Nanoemulsion after 15 Years of Preparation: A Suitable Vehicle for Pharmaceutical and Cosmetic Applications. J. Dispers. Sci. Technol. 2009, 31, 17–22. [Google Scholar] [CrossRef]
  34. Canselier, J.P.; Delmas, H.; Wilhelm, A.M.; Abismaïl, B. Ultrasound Emulsification—An Overview. J. Dispers. Sci. Technol. 2002, 23, 333–349. [Google Scholar] [CrossRef]
  35. Ngan, C.L.; Basri, M.; Lye, F.F.; Fard Masoumi, H.R.; Tripathy, M.; Abedi Karjiban, R.; Abdul-Malek, E. Comparison of process parameter optimization using different designs in nanoemulsion-based formulation for transdermal delivery of fullerene. Int. J. Nanomed. 2014, 9, 4375–4386. [Google Scholar] [CrossRef] [PubMed] [Green Version]
  36. Dias, D.D.; Colombo, M.; Kelmann, R.G.; Kaiser, S.; Lucca, L.G.; Teixeira, H.F.; Limberger, R.P.; Veiga, V.F., Jr.; Koester, L.S. Optimization of Copaiba oil-based nanoemulsions obtained by different preparation methods. Ind. Crops Prod. 2014, 59, 154–162. [Google Scholar] [CrossRef]
  37. Manev, E.D.; Pugh, R.J. Diffuse layer electrostatic potential and stability of thin aqueous films containing a nonionic surfactant. Langmuir 1991, 7, 2253–2260. [Google Scholar] [CrossRef]
  38. Ribeiro, R.; Barreto, S.; Ostrosky, E.; Rocha-Filho, P.; Veríssimo, L.; Ferrari, M. Production and Characterization of Cosmetic Nanoemulsions Containing Opuntia ficus-indica (L.) Mill Extract as Moisturizing Agent. Molecules 2015, 20, 2492–2509. [Google Scholar] [CrossRef] [Green Version]
  39. Mehmood, T.; Ahmad, A.; Ahmed, A.; Ahmed, Z. Optimization of olive oil based O/W nanoemulsions prepared through ultrasonic homogenization: A response surface methodology approach. Food Chem. 2017, 229, 790–796. [Google Scholar] [CrossRef]
  40. Mehmood, T.; Ahmed, A.; Ahmad, A.; Ahmad, M.S.; Sandhu, M.A. Optimization of mixed surfactants-based β-carotene nanoemulsions using response surface methodology: An ultrasonic homogenization approach. Food Chem. 2018, 253, 179–184. [Google Scholar] [CrossRef]
  41. Bernardi, D.S.; Pereira, T.A.; Maciel, N.R.; Bortoloto, J.; Viera, G.S.; Oliveira, G.C.; Rocha-Filho, P.A. Formation and stability of oil-in-water nanoemulsions containing rice bran oil: In vitro and in vivo assessments. J. Nanobiotechnol. 2011, 9, 44–47. [Google Scholar] [CrossRef]
  42. De Morais, J.M.; Dos Santos, O.D.H.; Delicato, T.; Da Rocha-Filho, P.A. Characterization and Evaluation of Electrolyte Influence on Canola Oil/Water Nano-Emulsion. J. Dispers. Sci. Technol. 2006, 27, 1009–1014. [Google Scholar] [CrossRef]
  43. Ahmad Mustafa, M.E.; Nagib Ali, E.; Hesham Ali, E. Preparation and Evaluation of Olive Oil Nanoemulsion Using Sucrose. Int. J. Pharm. Pharm. Sci. 2013, 5, 434–440. [Google Scholar]
  44. Eid, A.M.M.; Baie, S.H.; Arafat, O. Development and stability evaluation of olive oil nanoemulsion using sucrose monoester laurate. AIP Conf. Proc. 2012, 1502, 486–494. [Google Scholar]
  45. Rao, J.; McClements, D.J. Food-grade microemulsions, nanoemulsions and emulsions: Fabrication from sucrose monopalmitate & lemon oil. Food Hydrocoll. 2011, 25, 1413–1423. [Google Scholar]
  46. Zhang, X.; Sun, X.; Li, J.; Zhang, X.; Gong, T.; Zhang, Z. Lipid nanoemulsions loaded with doxorubicin-oleic acid ionic complex: Characterization, in vitro and in vivo studies. Die Pharm. 2011, 66, 496–505. [Google Scholar]
  47. Ahmad, K.; Ho, C.C.; Fong, W.K.; Toji, D. Properties of Palm Oil-in-Water Emulsions Stabilized by Nonionic Emulsifiers. J. Colloid Interface Sci. 1996, 181, 595–604. [Google Scholar] [CrossRef]
  48. Tan, C.; Nakajima, M. β-Carotene nanodispersions: Preparation, characterization and stability evaluation. Food Chem. 2005, 92, 661–671. [Google Scholar] [CrossRef]
  49. Fluhr, J.W. Practical Aspects of Cosmetic Testing; Springer: Berlin/Heidelberg, Germany, 2011. [Google Scholar]
  50. Dal’Belo, S.E.; Rigo Gaspar, L. Berardo Gonçalves, P.M.; Moisturizing effect of cosmetic formulations containing Aloe vera extract in different concentrations assessed by skin bioengineering techniques. Ski. Res. Technol. 2006, 12, 241–246. [Google Scholar] [CrossRef]
  51. Bonté, F. Skin moisturization mechanisms: New data. Ann. Pharm. Fr. 2011, 69, 135–141. [Google Scholar] [CrossRef]
  52. Bolzinger, M.A.; Briançon, S.; Chevalier, Y. Nanoparticles through the skin: Managing conflicting results of inorganic and organic particles in cosmetics and pharmaceutics. Wiley Interdiscip. Rev. Nanomed. Nanobiotechnol. 2011, 3, 463–478. [Google Scholar] [CrossRef]
  53. Kowalska, M.; Wozniak, M.; Pazdzior, M. Assessment of the sensory and moisturizing properties of emulsions with hemp oil. Acta Polytech. Hung. 2017, 14, 183–195. [Google Scholar]
Figure 1. Chromatographic profile of fatty acids from seed oil of P. edulis var. edulis.
Cosmetics 08 00001 g001
Figure 2. Pseudo-ternary diagram for the determination of the P. edulis var. edulis seed oil nanoemulsion region.
Cosmetics 08 00001 g002
Figure 3. Surface response diagram showing the effect of ultrasound-assisted emulsification conditions on droplet size. (A) Effect of power (W) and ratio oil:surfactant on droplet size (nm), (B) Effect of water (%) and ratio oil:surfactant on droplet size (nm), (C) Effect of time of irradiation (min) and ratio oil:surfactant on droplet size (nm), (D) Effect of power (W) and time of irradiation (min) on droplet size (nm), (E) Effect of water (%) and time (min) on droplet size (nm), and (F) Effect of power (W) and water (%) on droplet size (nm).
Cosmetics 08 00001 g003
Figure 4. Surface response diagram showing the effect of ultrasound-assisted emulsification conditions on the PDI. (A) Effect of power (W) and water (%) on the PDI, (B) Effect of time (min) and water (%) on the PDI, (C) Effect of ratio oil:surfactant and water (%) on the PDI, (D) Effect of time of irradiation (min) and ratio oil:surfactant on the PDI, (E) Effect of power (W) and ratio oil:surfactant on the PDI, and (F) Effect of power (W) and time (min) on the PDI.
Cosmetics 08 00001 g004
Figure 5. Surface response diagram showing the effect of ultrasound-assisted emulsification conditions on the potential ζ. (A) Effect of time of irradiation (min) and power (w) on the potential ζ; (B) Effect of time (min) and water (%)on the potential ζ; (C) Effect of time (min) and oil:surfactant ratio on the potential ζ; (D) Effect of power (W) and water (%) on the potential ζ; (E) Effect of power (W) and oil:surfactant ratio on the potential ζ; and (F) Effect of water (%) and oil:surfactant ratio on the potential ζ.
Cosmetics 08 00001 g005
Figure 6. Surface response diagram showing the effect of ultrasound-assisted emulsification conditions on the potential ζ; (A) Effect of time of irradiation (min) and power (w) on the potential ζ; (B) Effect of time (min) and water (%) on the potential ζ; (C) Effect of time (min) and oil:surfactant ratio on the potential ζ; (D) Effect of power (W) and water (%) on the potential ζ; (E) Effect of power (W) and oil:surfactant ratio on the potential ζ; and (F) Effect of water (%) and oil:surfactant ratio on the potential ζ.
Cosmetics 08 00001 g006
Figure 7. TEM photograph of optimized Passiflora edulis var edulis seeds in an oil nanoemulsion.
Cosmetics 08 00001 g007
Figure 8. Effects of storage conditions on droplet size (nm) and PDI of the optimized nanoemulsion (Top) Average droplet diameter, (Bottom) Average PDI.
Cosmetics 08 00001 g008
Figure 9. Effect of P. edulis var. edulis seeds oil and optimized nanoemulsion in transepidermal water loss.
Cosmetics 08 00001 g009
Figure 10. Effect of P. edulis var. edulis seeds oil and optimized nanoemulsion in skin moisturizing.
Cosmetics 08 00001 g010
Figure 11. Effect of P. edulis var. edulis seeds oil and optimized nanoemulsion in skin viscoelasticity.
Cosmetics 08 00001 g011
Table 1. Gas Chromatograph Conditions Coupled to Mass Spectrometry.
Injection Volume1.0 µL
Injection split10:1
Capillary ColumnThermo Scientific ™TRACE™ TR1
30 m × 0.25 mm
Film thickness0.25 µm
Injection port temperature220 ° C
Carrier gasHelium (≥99.9% purity)
Flow rate1.0 mL/min
Initial oven temperature180 °C (15 min)
Rate of increase of temperature of the furnace0.5 °C/min
Final temperature of the oven193 °C (43 min)
Table 2. Matrix of Independent Variables of the Box-Behnken Design (BBD).
Independent VariablesCodesLevels
−1 (−α)01 (+α)
Power (W) A708090
Time (min)B456
Water (%)C708090
Oil: Surfactant ratioD123
In Oil: Surfactant ratio level 1 means 1:1, level 2 means 2:1 and level 3.
Table 3. Droplet Size of Emulsions Containing P. edulis var. mollisima Seed Oil.
DAY 1DAY 7
No% PEO% S% WPEO:SDroplet Size (nm)PDIζ Potential (mV)Droplet Size (nm)PDIζ Potential (mV)
148881:0256.72 ± 0.69880.357 ± 0.0017−29.10 ± 0.679860.87 ± 0.57190.471 ± 0.0033−21.8 ± 0.3091
2412841:0341.59 ± 0.32290.366 ± 0.0024−17.40 ± 1.265742.01 ± 0.74500.532 ± 0.0266−20.6 ± 0.3741
3416801:0446.60 ± 1.52480.592 ± 0.0925−38.00 ± 2.269137.81 ± 0.93380.581 ± 0.0252−16.2 ± 0.6847
4420761:0585.66 ± 0.69070.087 ± 0.0128−32.60 ± 1.108586.04 ± 1.18800.092 ± 0.0176−17.1 ± 0.1577
5424721:0688.79 ± 0.61500.103 ± 0.0164−39.00 ± 0.047189.31 ± 0.58970.081 ± 0.0107−19.9 ± 06128
684882:01171.10 ± 1.77950.219 ± 0.0046−31.40 ± 1.1430166.00 ± 1.77950.222 ± 0.0046−36.8 ± 0.2494
788841:01106.10 ± 1.06250.224 ± 0.0237−37.80 ± 0.5734106.00 ± 1.06250.228 ± 0.0237−42.1 ± 0.5734
8812802:0383.26 ± 1.32580.292 ± 0.0024−33.10 ± 1.519590.80 ± 1.05810.322 ± 0.0005−28.9 ± 0.3500
9816761:0259.72 ± 1.81500.354 ± 0.0305−29.60 ± 0.368161.19 ± 0.46480.486 ± 0.0065−26.2 ± 1.1953
10820722:0564.34 ± 1.74780.688 ± 0.0384−20.70 ± 1.488456.66 ± 1.11530.432 ± 0.1970−22.5 ± 2.1275
11824681:0334.47 ± 0.10780.256 ± 0.0034−21.20 ± 1.373533.98 ± 1.75980.447 ± 0.0400−20.7 ± 1.5412
12124843:01195.50 ± 2.21060.232 ± 0.0094−42.90 ± 0.4320189.50 ± 2.58500.223 ± 0.0041−37.4 ± 0.6480
13128803:02133.50 ± 0.18860.178 ± 0.0078−33.20 ± 0.7788139.00 ± 1.40550.186 ± 0.0025−32.8 ± 0.8060
141212761:01136.90 ± 1.77450.201 ± 0.0092−29.80 ± 0.8259135.30 ± 1.86730.176 ± 0.0096−36.3 ± 0.8055
151216723:0481.97 ± 0.51070.218 ± 0.0045−28.80 ± 1.452284.00 ± 1.01380.252 ± 0.0016−26.6 ± 1.3021
161220683:0572.95 ± 1.65620.275 ± 0.0059−23.90 ± 1.202773.84 ± 0.90600.303 ± 0.0031−26.9 ± 0.4921
171224641:0252.68 ± 0.24230.26 ± 0.0014−18.40 ± 0.684755.27 ± 1.18750.458 ± 0.0290−22.4 ± 1.0873
18164804:01219.00 ± 2.05320.239 ± 0.0071−41.90 ± 0.6164305.00 ± 1.72590.447 ± 0.0076−44.4 ± 0.6480
19168762:01165.40 ± 2.00720.208 ± 0.0198−38.00 ± 1.4337162.30 ± 1.84570.215 ± 0.0041−43.9 ± 0.6128
201612724:03169.40 ± 1.41660.251 ± 0.0082−35.00 ± 1.2027168.90 ± 0.99780.258 ± 0.0107−40.3 ± 0.0816
211616681:01131.00 ± 1.97540.239 ± 0.0128−30.50 ± 0.6531127.0 ± 1.16140.211 ± 0.0118−32.5 ± 0.9285
22204765:01281.70 ± 1.86420.377 ± 0.0052−47.60 ± 0.7845272.6 ± 0.46430.375 ± 0.0135−46.2 ± 1.3767
23208725:02202.50 ± 1.06520.254 ± 0.0043−29.70 ± 0.1885184.1 ± 2.52230.21 ± 0.0133−36.8 ± 0.0816
242012685:03166.90 ± 1.94310.236 ± 0.0054−30.70 ± 1.4429156.4 ± 1.64380.202 ± 0.0048−32.5 ± 0.4109
PEO: P. edulis var. edulis seed oil; S: surfactant; W: water; PEO:S: surfactant P. edulis var. edulis seed oil ratio. In all cases, S corresponds to Tween®20: Span®85 3:1. Data are expressed as the mean ± standard deviation (n = 5).
Table 4. Factorial Points, Independent Factor Levels and Experimental Values of Dependent Variables for the Box–Behnken Design (BBD).
Independent Variables. Response Variables
NoW (%)PEO:SPower (W)Time (m)Droplet Size (nm)PDIPotential ζ (mV)p-Anisidine Value
1703:01805197.6 ± 2.62810.212 ± 0.013539.90 ± 0.26255.2187 ± 0.2730
2803:01905195.5 ± 1.43840.224 ± 0.011137.20 ± 0.32665.3447 ± 0.1274
3902:01905167.1 ± 1.98160.207 ± 0.006539.10 ± 0.41904.7094 ± 1.1095
4902:01705175.0 ± 1.14310.238 ± 0.003439.50 ± 0.57935.7191 ± 0.0152
5901:01805108.5 ± 1.14410.236 ± 0.001938.20 ± 0.74835.9547 ± 0.4382
6701:01805122.9 ± 1.34740.184 ± 0.012332.80 ± 1.28326.4179 ± 0.2582
7702:02804168.2 ± 2.77970.198 ± 0.006137.70 ± 0.20556.0636 ± 0.7051
8902:02804183.7 ± 2.57470.224 ± 0.004339.80 ± 0.14146.6534 ± 0.5350
9802:02805161.4 ± 0.59070.198 ± 0.008238.20 ± 0.43205.8233 ± 0.0495
10801:01705132.9 ± 1.69900.233 ± 0.003337.70 ± 0.64816.2062 ± 0.1885
11702:02705205.1 ± 2.24850.265 ± 0.009039.60 ± 0.53547.9133 ± 0.0339
12802:02706170.1 ± 1.87790.225 ± 0.012338.30 ± 1.06147.5773 ± 0.0131
13802:02805167.3 ± 1.22570.210 ± 0.001236.00 ± 1.09657.5622 ± 0.5468
14802:02805166.1 ± 1.52970.203 ± 0.014037.80 ± 0.63776.0865 ± 0.3119
15801:01905107.2 ± 1.23560.218 ± 0.005036.70 ± 0.54375.1968 ± 0.2999
16803:01806193.3 ± 0.94630.212 ± 0.007436.90 ± 0.09435.7673 ± 0.3119
17902:02806168.9 ± 1.31990.215 ± 0.003736.50 ± 0.55586.8725 ± 0.2999
18803:03804285.3 ± 2.02370.431 ± 0.006246.60 ± 0.33004.5363 ± 1.5573
19802:01906178.3 ± 2.45360.241 ± 0.007035.90 ± 0.49224.9296 ± 0.2981
20903:01805170.8 ± 0.80420.224 ± 0.04347.40 ± 1.04035.5833 ± 0.1280
21702:01806164.3 ± 0.87310.180 ± 0.014235.00 ± 0.68486.0818 ± 1.0589
22801:01804177.0 ± 3.01370.369 ± 0.034740.90 ± 2.21966.4257 ± 0.6207
23801:01806117.4 ± 0.43200.227 ± 0.012738.40 ± 1.86256.3627 ± 0.5862
24702:01905166.4 ± 1.92240.188 ± 0.005335.50 ± 0.26256.9292 ± 0.7144
25803:01705197.5 ± 0.40820.245 ± 0.007038.50 ± 0.64816.3500 ± 0.5181
26802:01704177.0 ± 2.31560.251 ± 0.002941.90 ± 1.10865.3320 ± 0.8545
27802:01904279.1 ± 2.14170.351 ± 0.015138.40 ± 1.72504.5409 ± 0.8396
PEO: P. edulis var. edulis seed oil; S: surfactant; W: water; PEO:S: surfactant P. edulis var. edulis seed oil ratio. Potential ζ is shown as absolute potential ζ value.
Table 5. Analysis of Variance of a Surface Response of Quadratic Equations for Drop Size, PDI, Potential ζ and p-Anisidine Value.
VariableDrop SizePDIPotential ζp-Anisidine
F Valuep ValueF Valuep ValueF Valuep ValueF Valuep Value
Linear termsA12.280.0088.840.02512.630.0076.080.03
B147.230.0000.060.81925.770.0011.790.206
C11.170.01035.240.0013.550.0961.070.32
D335.930.0002.580.1591.420.2671.550.237
Quadratic termsA27.920.02315.350.0085.280.0510.840.376
B2104.770.0001.120.3310.010.9160.620.446
C20.230.6440.750.4200.070.7990.040.848
D220.020.0027.540.0331.960.1991.900.194
Terms of interactionsAB5.140.0538.790.0250.280.6081.130.308
AC4.250.0730.290.6083.210.1110.000.989
AD2.520.1510.160.7020.020.8880.000.998
BC3.550.0960.000.9730.080.7790.010.910
BD4.710.0623.950.0944.890.0580.550.472
CD0.690.4307.150.0376.320.0360.230.644
A: Power (W); B: Time (min); C: Water (%); D: Oil: Surfactant ratio. In the model, values less of p (<0.05) are considered significant.
Table 6. Optimal Predicted and Experimental Conditions for the Formulation of Nanoemulsions.
Response VariablePredicted ValueExperimental ValueError (%)
Drop Size (nm)130.00130.33 ± 0.8580.25
PDI0.2000.202 ± 0.0150.80
Potential ζ* 30.00−30.40 ± 0.8291.33
p-anisidine6.005.44 ± 0.2359.33
* Expressed as absolute potential ζ value.
Publisher’s Note: MDPI stays neutral with regard to jurisdictional claims in published maps and institutional affiliations.

