Article

Microstructural and Energy-Dispersive X-ray Analyses on Argon Ion Implantations in Tantalum Thin Films for Microelectronic Substrates

by
Amir Hoshang Ramezani
1,*,
Siamak Hoseinzadeh
2,*,
Zhaleh Ebrahiminejad
1,
Milad Sangashekan
3,4 and
Saim Memon
5
1
Department of Physics, West Tehran Branch, Islamic Azad University, Tehran 19393-34651, Iran
2
Department of Planning, Design, and Technology of Architecture, Sapienza University of Rome, Via Flaminia 72, 00196 Rome, Italy
3
Department of Chemical Engineering, University of Guilan, Rasht 41635-3756, Iran
4
Nano Mila Paint Company, Sari 48187-46747, Iran
5
London Centre for Energy Engineering, Electrical and Electronic Engineering Division, School of Engineering, London South Bank University, London SE1 0AA, UK
*
Authors to whom correspondence should be addressed.
Submission received: 15 October 2021 / Revised: 22 November 2021 / Accepted: 24 November 2021 / Published: 26 November 2021

Abstract

:
In the present study, the microstructural and statistical properties of unimplanted in comparison to argon ion-implanted tantalum-based thin film surface structures are investigated for potential application in microelectronic thin film substrates. In the study, the argon ions were implanted at the energy of 30 keV and the doses of 1 × 10¹⁷, 3 × 10¹⁷, and 7 × 10¹⁷ (ion/cm2) at an ambient temperature. Two primary goals have been pursued in this study. First, by using atomic force microscopy (AFM) analysis, the roughness of samples, before and after implantation, has been studied. The corrosion apparatus wear has been used to compare resistance against tantalum corrosion for all samples. The results show an increase in resistance against tantalum corrosion after the argon ion implantation process. After the corrosion test, scanning electron microscopy (SEM) analysis was applied to study the sample morphology. The elemental composition of the samples was characterized by using energy-dispersive X-ray (EDX) analysis. Second, the statisticalcharacteristics of both unimplanted and implanted samples, using the monofractal analysis with correlation function and correlation length of samples, were studied. The results show, however, that all samples are correlated and that the variation of ion doses has a negligible impact on the values of correlation lengths. Moreover, the study of height distribution and higher-order moments show the deviation from Gaussian distribution. The calculations of the roughness exponent and fractal dimension indicates that the implanted samples are the self-affine fractal surfaces.

1. Introduction

A typical tantalum’s (Ta) core properties include a high melting point, strong electrical conductivity, high ductility, and corrosion resistance, making it suitable for sophisticated technical applications [1] such as its use in improving surface substrate performance. Ion implantations and ion coatings [2] are two important techniques that have recently gained prominence due to their applications in enhancing the tantalum’s corrosive resistivity in extreme industrial mechanisms [3]. It is possible to utilize either or all of the following elements: nitrogen, carbon, oxygen, and argon for ion implantations to tantalum [4] using the ion bombardment process, in which the ion energy, irradiation time, temperature, and density of current distress are the paramount parameters in determining the surface resilience [5,6]. Such a technique typically alters the morphological properties of the tantalum samples, causing microstructure defects, resulting in the improvement of the corrosion resistance [7]. This forms substantial substrates that are suitable for electrical circuit components (such as capacitors, inductors, and resistors) subjected to extreme environments, for example the diffusion barriers in integrated circuits with copper interconnects [8,9]. The influence of argon ion implantation on the characteristics of tantalum thin films has been studied in the literature [10,11]. For example, Bifano et al. [12] demonstrated thin film formation, in which argon ion bombardment was utilized at 500 eV to improve bending caused by high stress differentials.
This paper investigates, by using X-ray diffraction (XRD), scanning electron microscopy (SEM), and atomic force microscopy (AFM) methods, the effects of argon ion implantation on the structural, mechanical, and statistical properties of tantalum-based surfaces. The XRD and AFM analyses of the argon ion-implanted tantalum surfaces are carried out for the evaluation of the corrosion resistance behavior of samples. In this paper, the height distribution and the higher-order moments of the surface height are also investigated. In additon, based on the monofractal analysis, various statistical properties, such as height fluctuations, power spectral density, skewness, kurtosis, correlation function, and correlation length, roughness exponent, and fractal dimension of samples, are calculated.

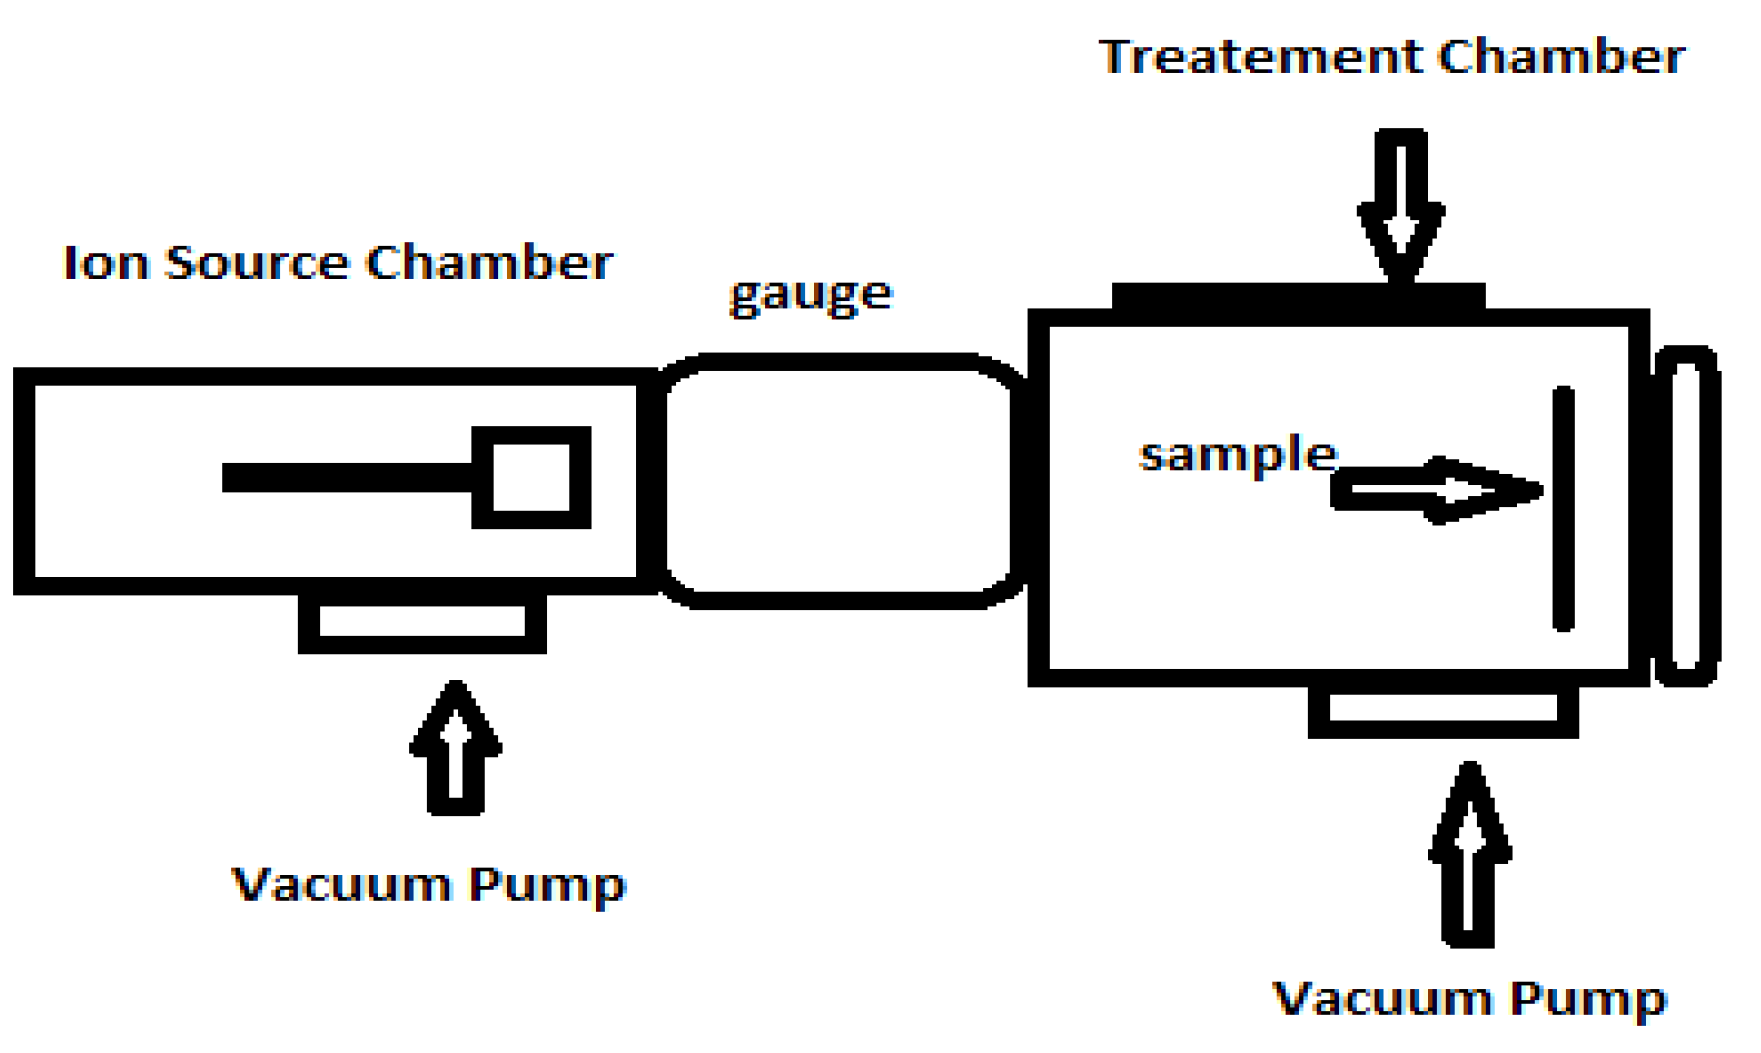
2. Materials and Methods

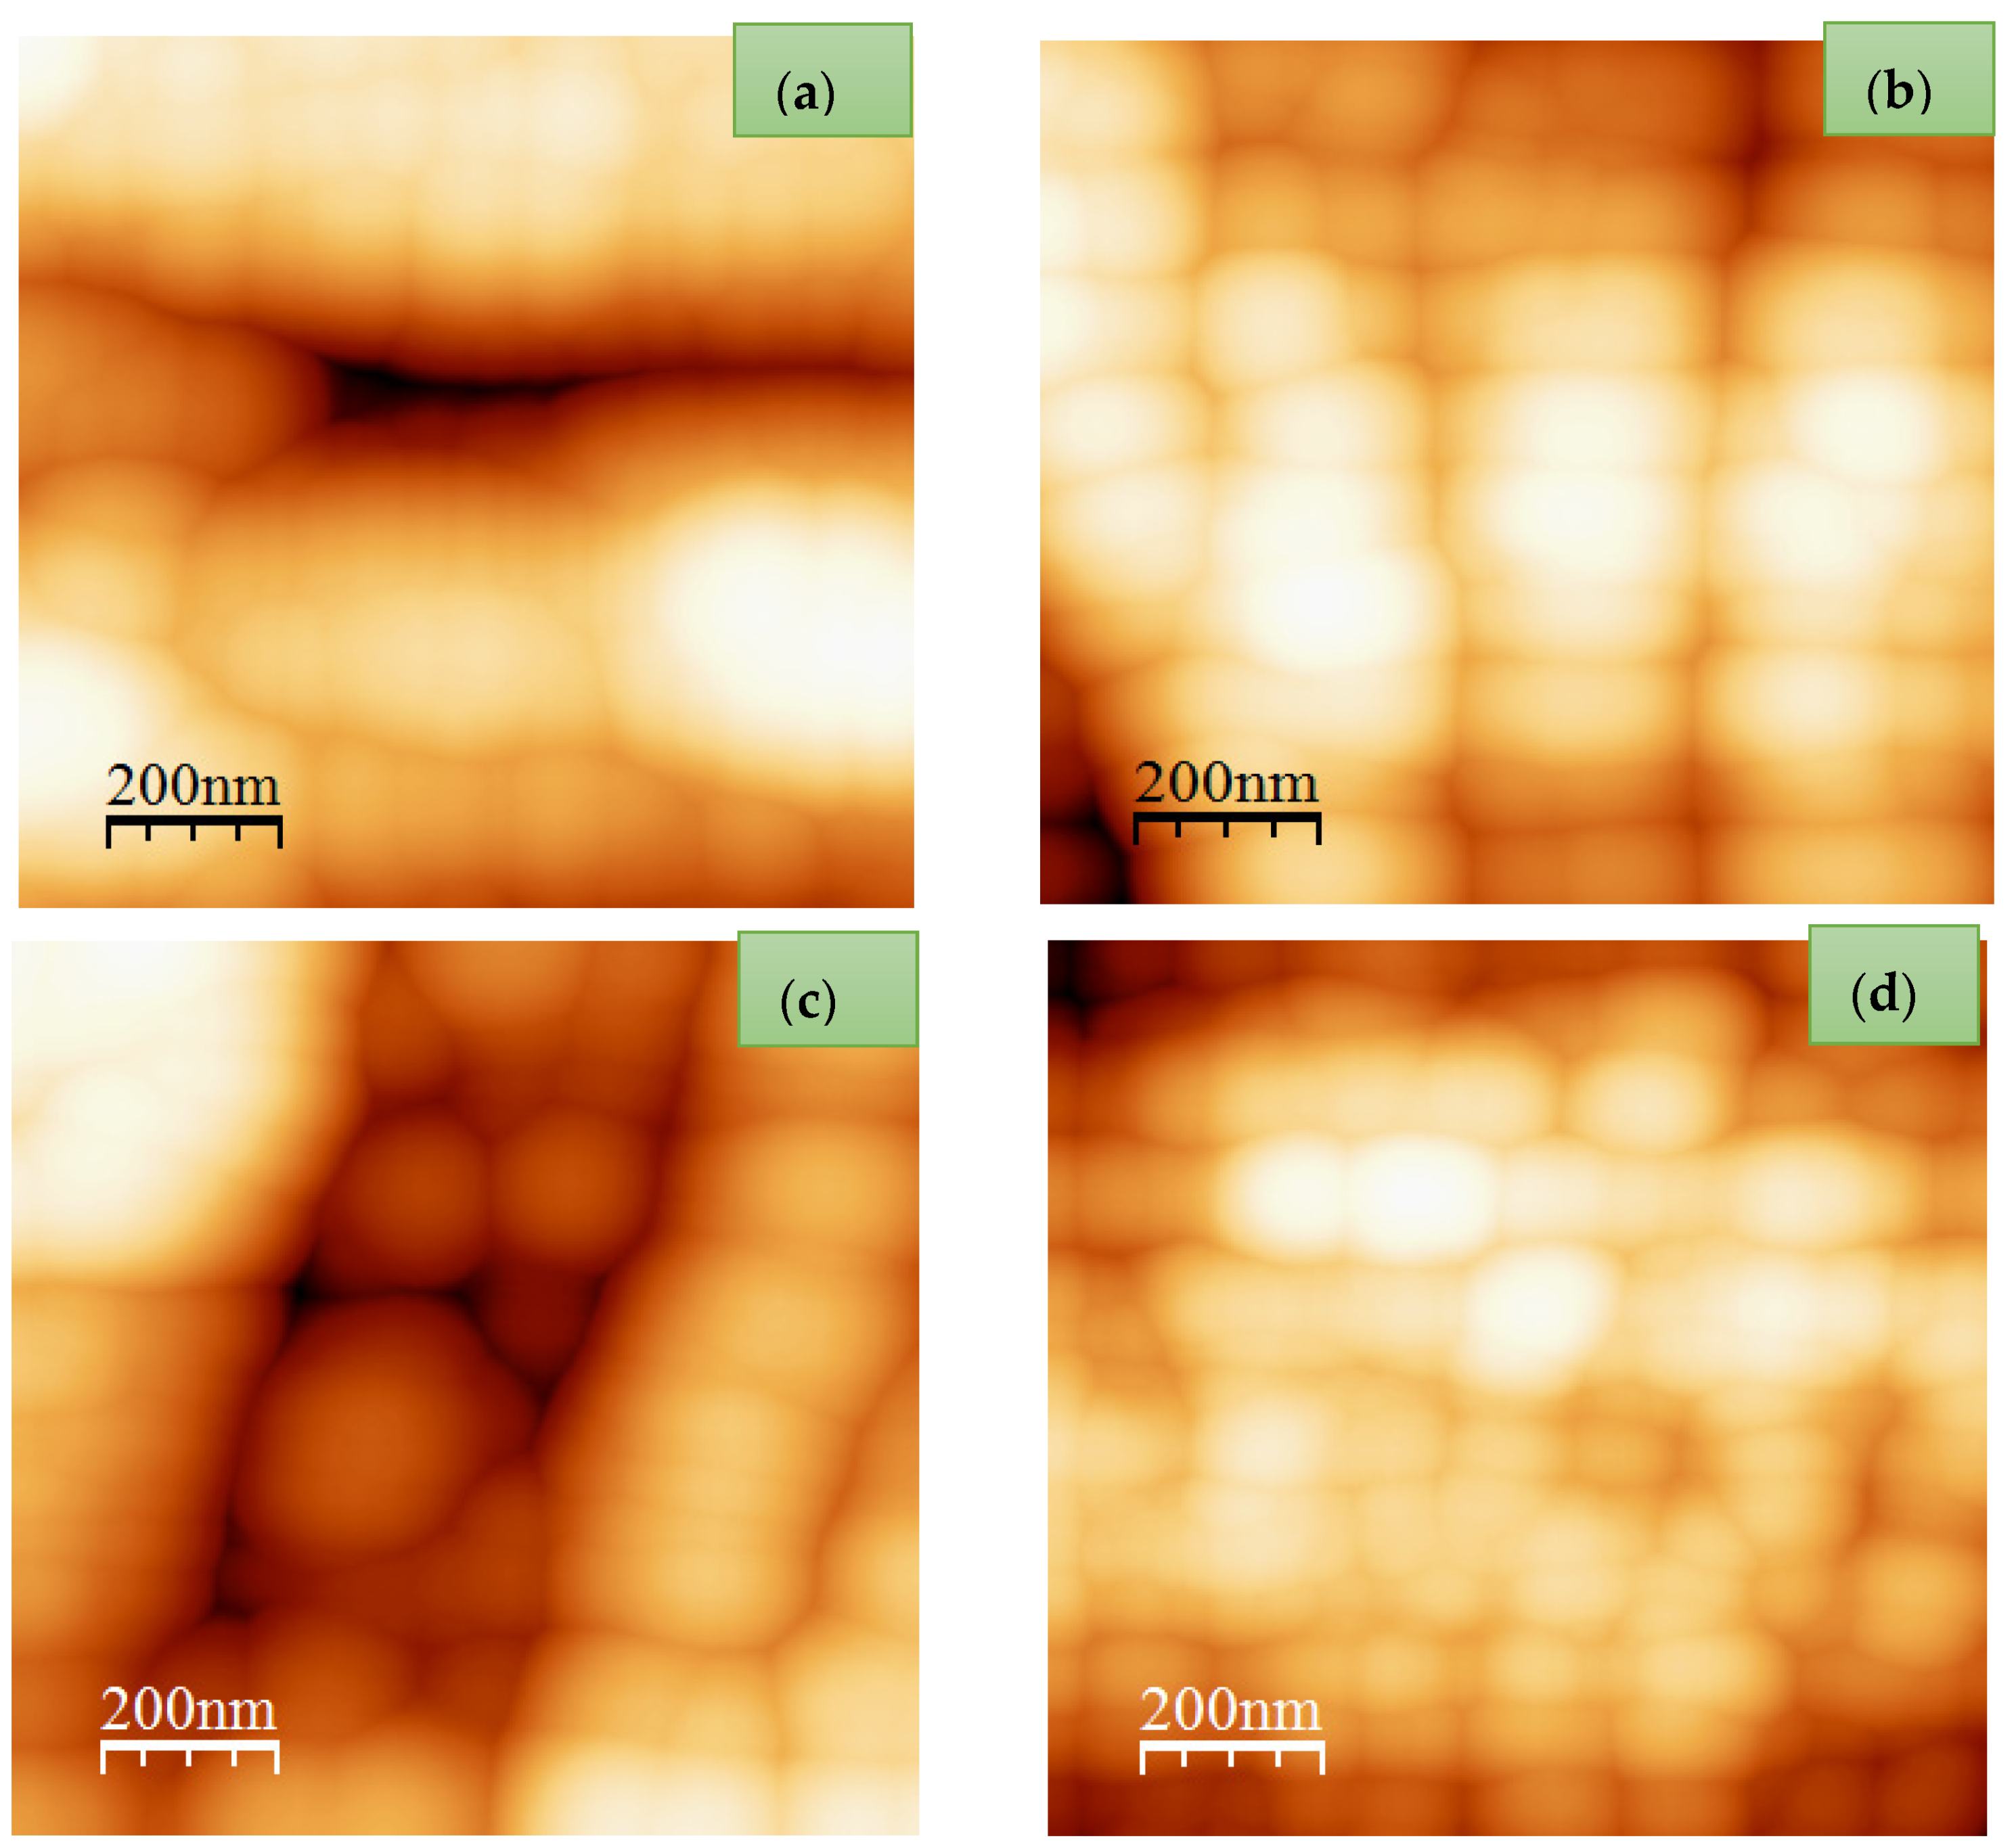
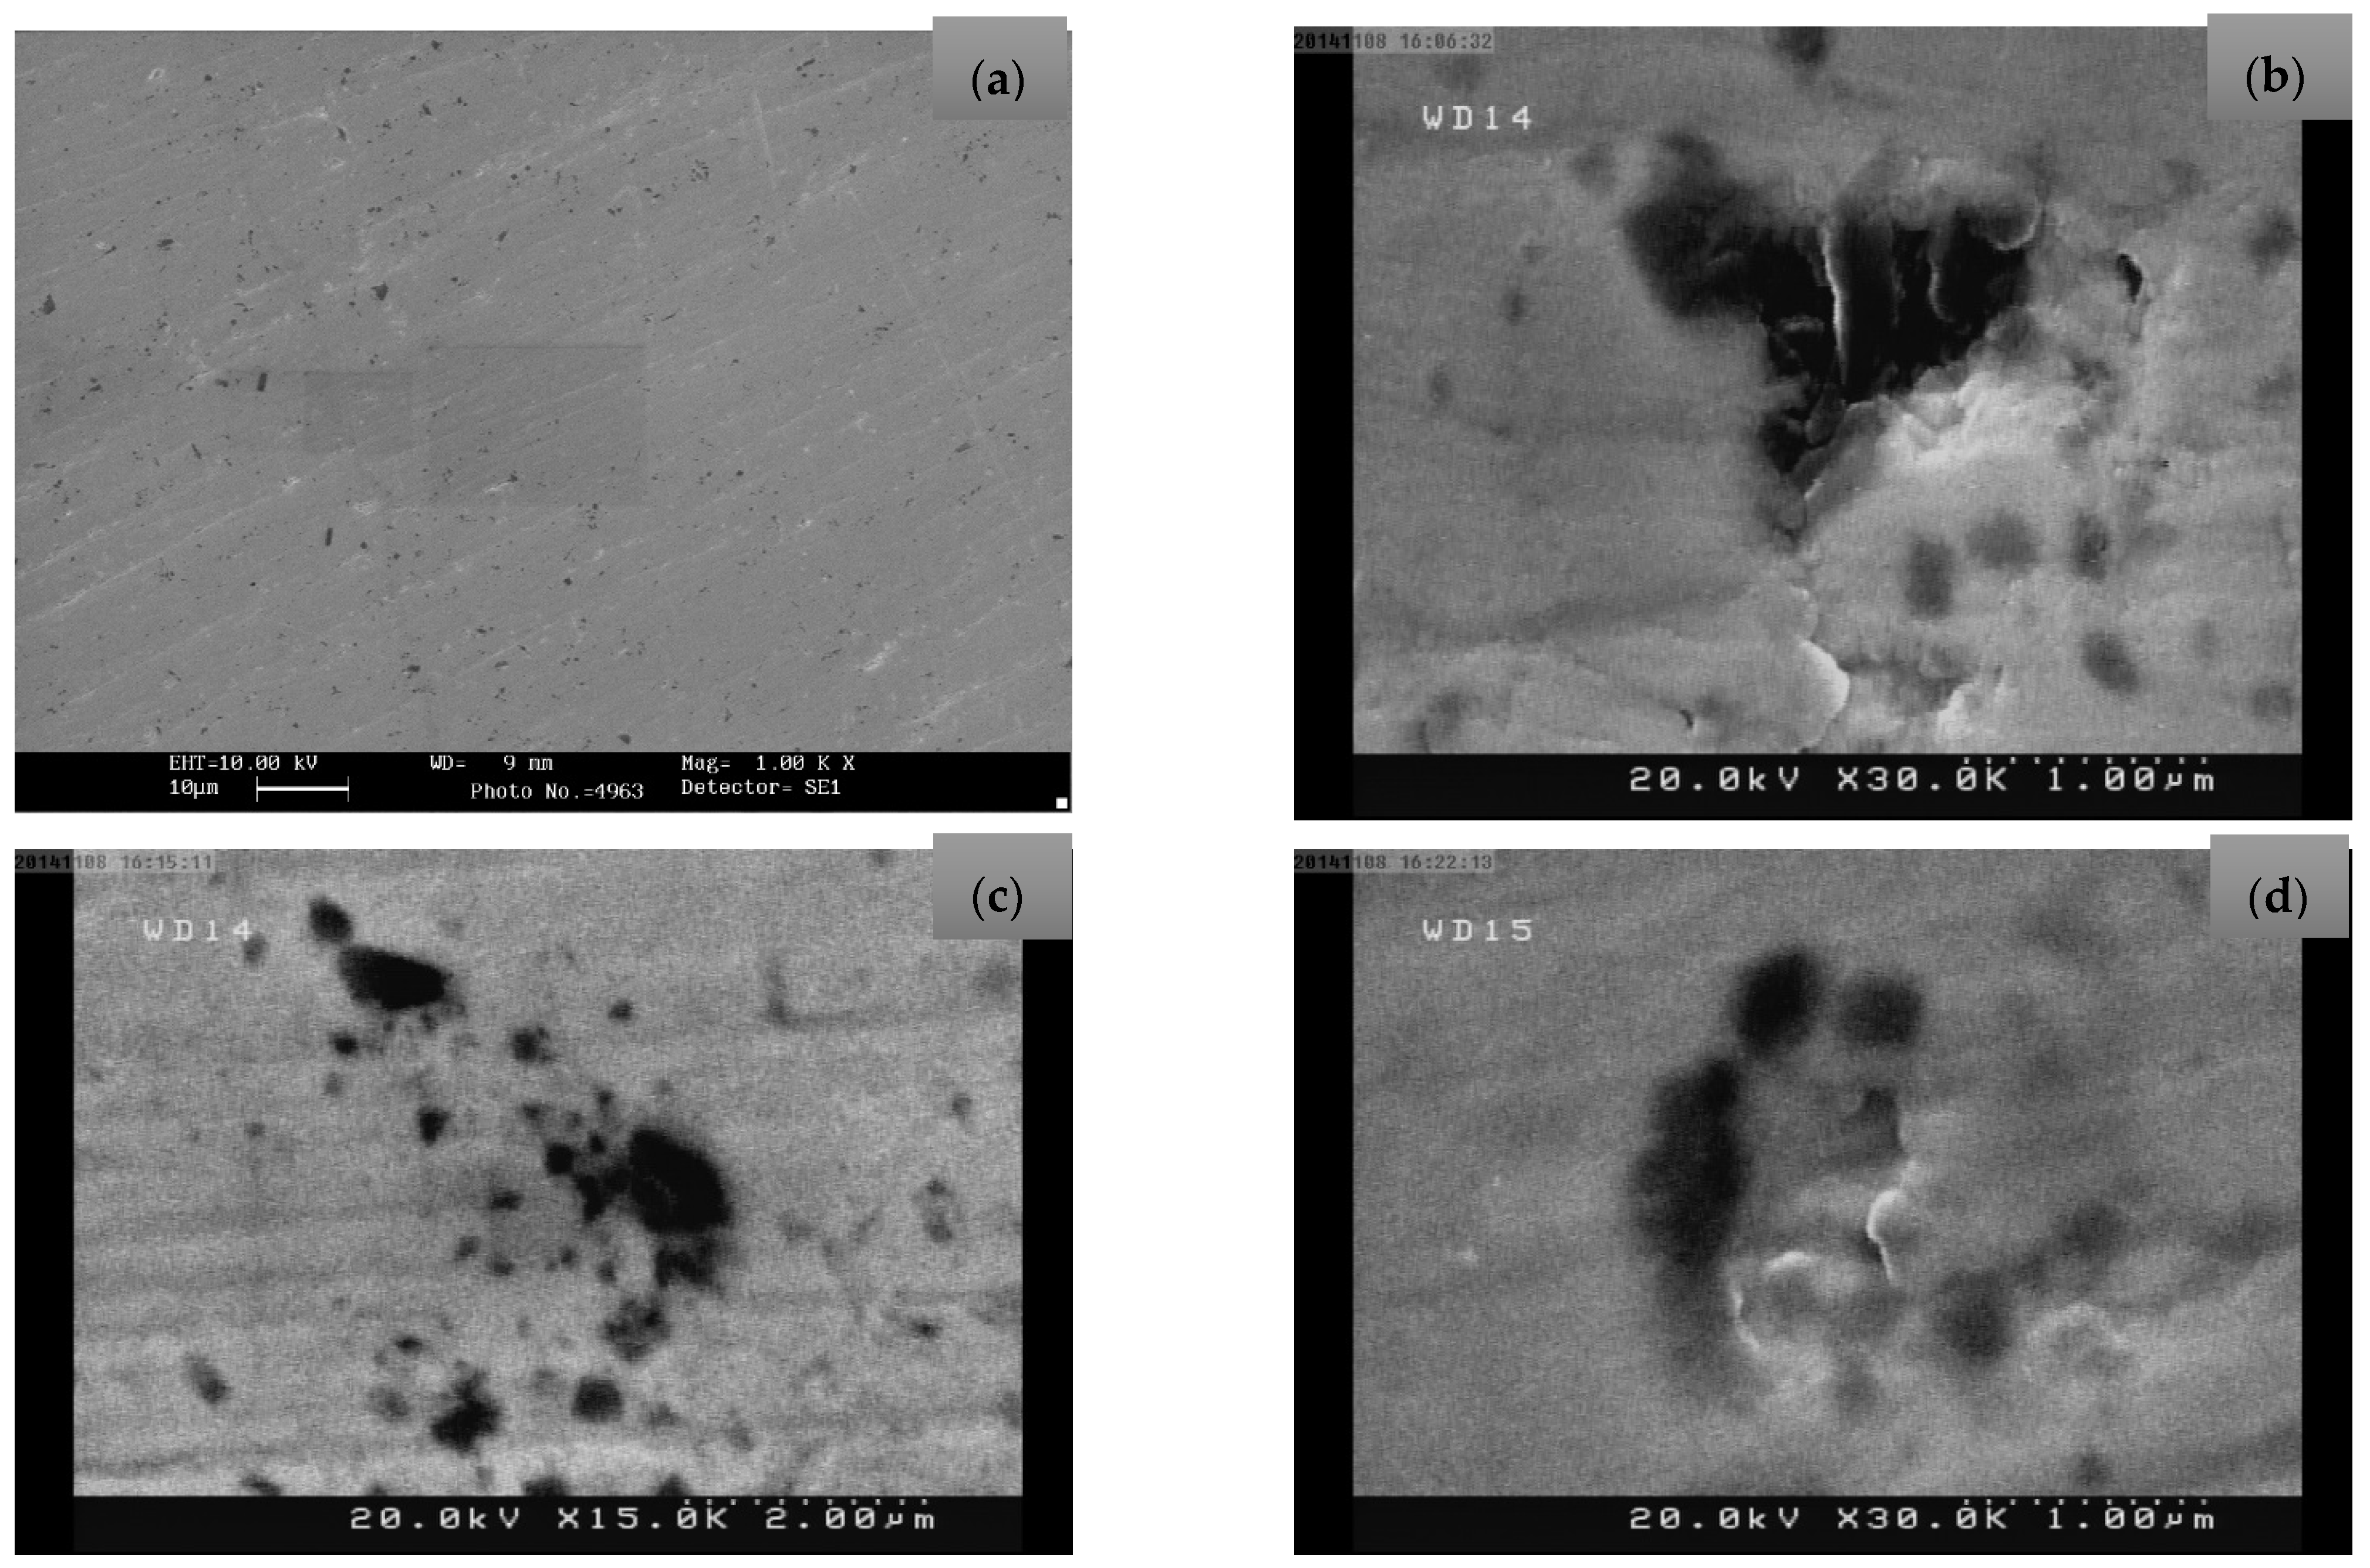
Preparation of Argon Ion-Implanted Tantalum Thin Film with SEM and AFM Analyses

The schematic diagram of the experimental process is shown in Figure 1. It consists of an ion source chamber, a vacuum pump integrated into the treatment chamber through a gauge, and a secondary vacuum pump underneath the treatment chamber. In this preparation stage, tantalum has been used as a substrate for producing the samples with argon ion implantation at various doses. The impact of corrosion has been studied on the surface samples by using AFM and SEM analyses. In addition, the change in corrosion resistance and surface roughness have been investigated.
The ion bombardment process was conducted at an ambient temperature by argon ions (99.999%) at the doses of 1 × 10¹⁷, 3 × 10¹⁷, and 7 × 10¹⁷ (ion/cm2). The angle between the surface of samples and incident ions was chosen to be 90 °C. As a part of the requisite preparation, before the ion implantation process, the surfaces were polished to a glossy finish by diamond paste. After that, the surfaces were cleaned ultrasonically in alcohol and an acetone bath and dried in an oven at 100 °C.
The extracted ions were accelerated to the maximum energy of 30 keV. The ion beams covered the whole sample area homogeneously, and the current densities and the ion beam energy were considered fixed for all cases. The temperature of the samples was measured by a thermocouple during the implantation procedure. Prior to the launch of the ion implantation process, the entire sample was maintained at room temperature (between 21 °C and 23 °C). However, the sample temperatures varied during the implantation procedure due to the heat transfer from ion bombardment to the samples [10]. The implantation parameters are recorded in Table 1.
The AFM microstructural images at the scan area of 1000 nm 1000 nm for unimplanted and implanted samples with different argon ion doses are illustrated in Figure 2.
Figure 2 shows the samples surface textures before and after ion implantation and changes to the surface’s areas were observed in terms of grain size and roughness. In order to obtain a more precise analysis about the implanted and unimplanted samples, the potentiodynamic findings by electrochemical analysis were carried out. The results are presented in Table 2.
As shown in Table 2, various corrosion current densities (icorr) of samples in terms of argon ion implantation doses show the maximum and minimum corrosion current density values assigned to Sample 1 and Sample 2, respectively.
The corrosion potential of the implanted samples at doses of 1 × 10¹⁷ ions/cm2 increases, and this increase continues up to the 3 × 10¹⁷ ions/cm2 dose. It is worthwhile to use AFM image analysis to explain the cause of these effects. This behavior is due to an inadequate ion energy bombardment on the surfaces. This procedure results in the formation of cracks and pores in grain bounders. Therefore, by increasing the surface roughness in the grain boundaries, the tendency to corrode is increased when compared with other conditions. Additionally, the analysis results show that all implanted samples’ corrosion resistance has improved by argon ion implantation. SEM images are shown in Figure 3 in order to comparatively analyze the formation of thick corrosion products on the samples.
Figure 3 shows that the corrosion products formed on the sample surfaces and the corrosion rate decrease by increasing the ion doses. The local pitting corrosion is clearly observable on the sample surfaces (Figure 2c). In this investigation, it was found that the argon ions with a high collision rate damage the surface of tantalum, resulting in a formation of the protective layer.

3. Results and Discussion

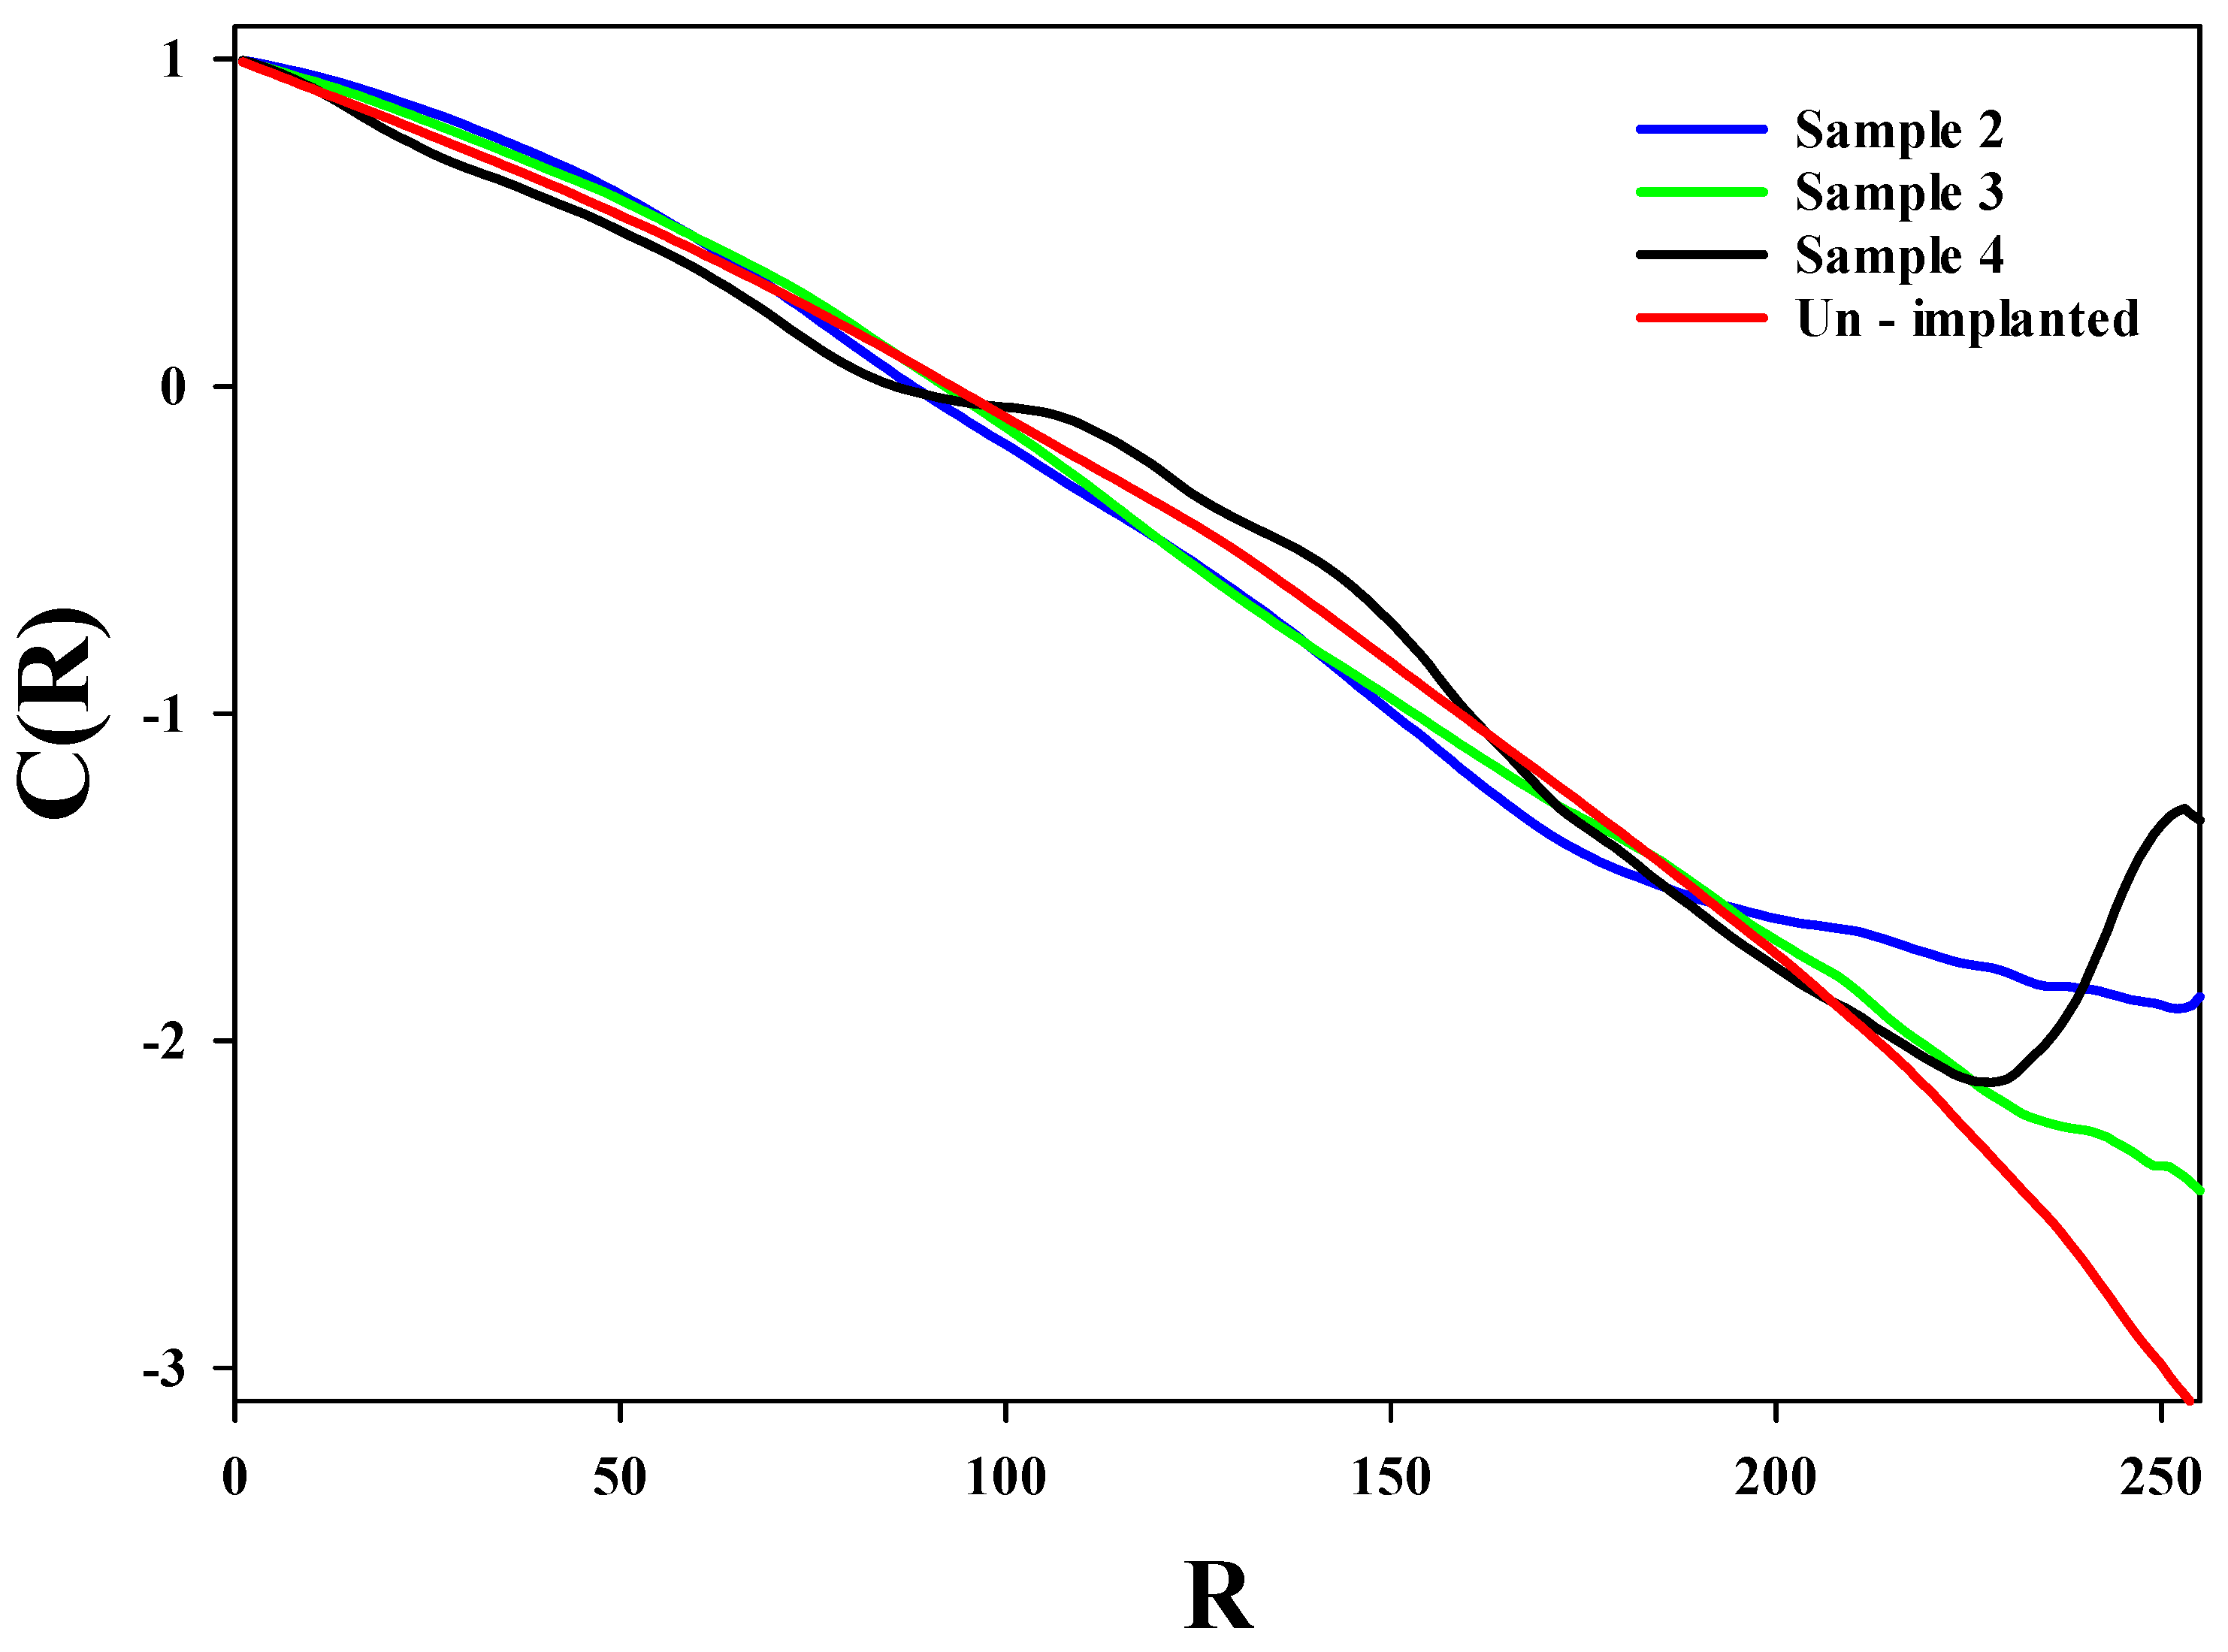
3.1. Monofractal Analysis of Roughness Based on Statistical Properties at Various Argon Ion Implanted Doses

In this study, monofractal analysis was applied to study the effect of argon ion implantation on the tantalum-based surfaces of samples. In the study, different doses of argon ions considered for the implantation processes and the structural and statistical properties of samples have been studied. The experimental results, shown in the previous section, show that all samples are rough. They are called stochastic due to the observation of their height fluctuation compared to the smooth surface being random. The root-mean-square (RMS) height ( σ ) can be written as in Equation (1).
σ = h ( r ) 2 ,
where h ( r ) indicates the site height at position r [13,14]. Based on our statistical analysis, the average roughness and the RMS values of the samples were obtained and are shown in Table 3.
Details of the height variations could be obtained by the average surface roughness, but it does not provide information about the waviness. The RMS roughness is more sensitive to the deviation from the smooth surface as a reference. However, it does not present a comprehensive explanation of the rough surfaces. In order to express the roughness of surfaces, the correlation function, C( R ), is presented in Equation (2). In addition to the RMS height, the correlation function is used to describe the surface morphology, because the surfaces with the same σ values have different morphologies. This function defines the manner of the height’s variations of the correlation property of surface heights at two positions that are R points away along the rough surfaces. The normalized correlation function is well-defined by Equation (2).
C ( R ) = h ( l 1 ) h ( l 2 ) / σ 2 ,
where R = | l 1 l 2 | . Based on this definition, for points with large distance ( R ), the C( R ) becomes zero. Another parameter which describes the correlation behavior along the rough surfaces is correlation length, ξ . Based on the definition, it is the distance where C( R ) drops 1/e of its maximum value [15,16]. In order to study the sample morphologies, the correlation functions of un-implanted and implanted samples as a function of separation distance R have been drawn in Figure 4.
Through the rough surface growth, at first, the height of sites is not dependent on neighboring sites, in other words, the surface is uncorrelated. In all cases, the C( R ), reduces with an increase in separation distance. Figure 5 shows that the samples’ (both unimplanted and implanted) correlation lengths have minor differences up until around R of 225.

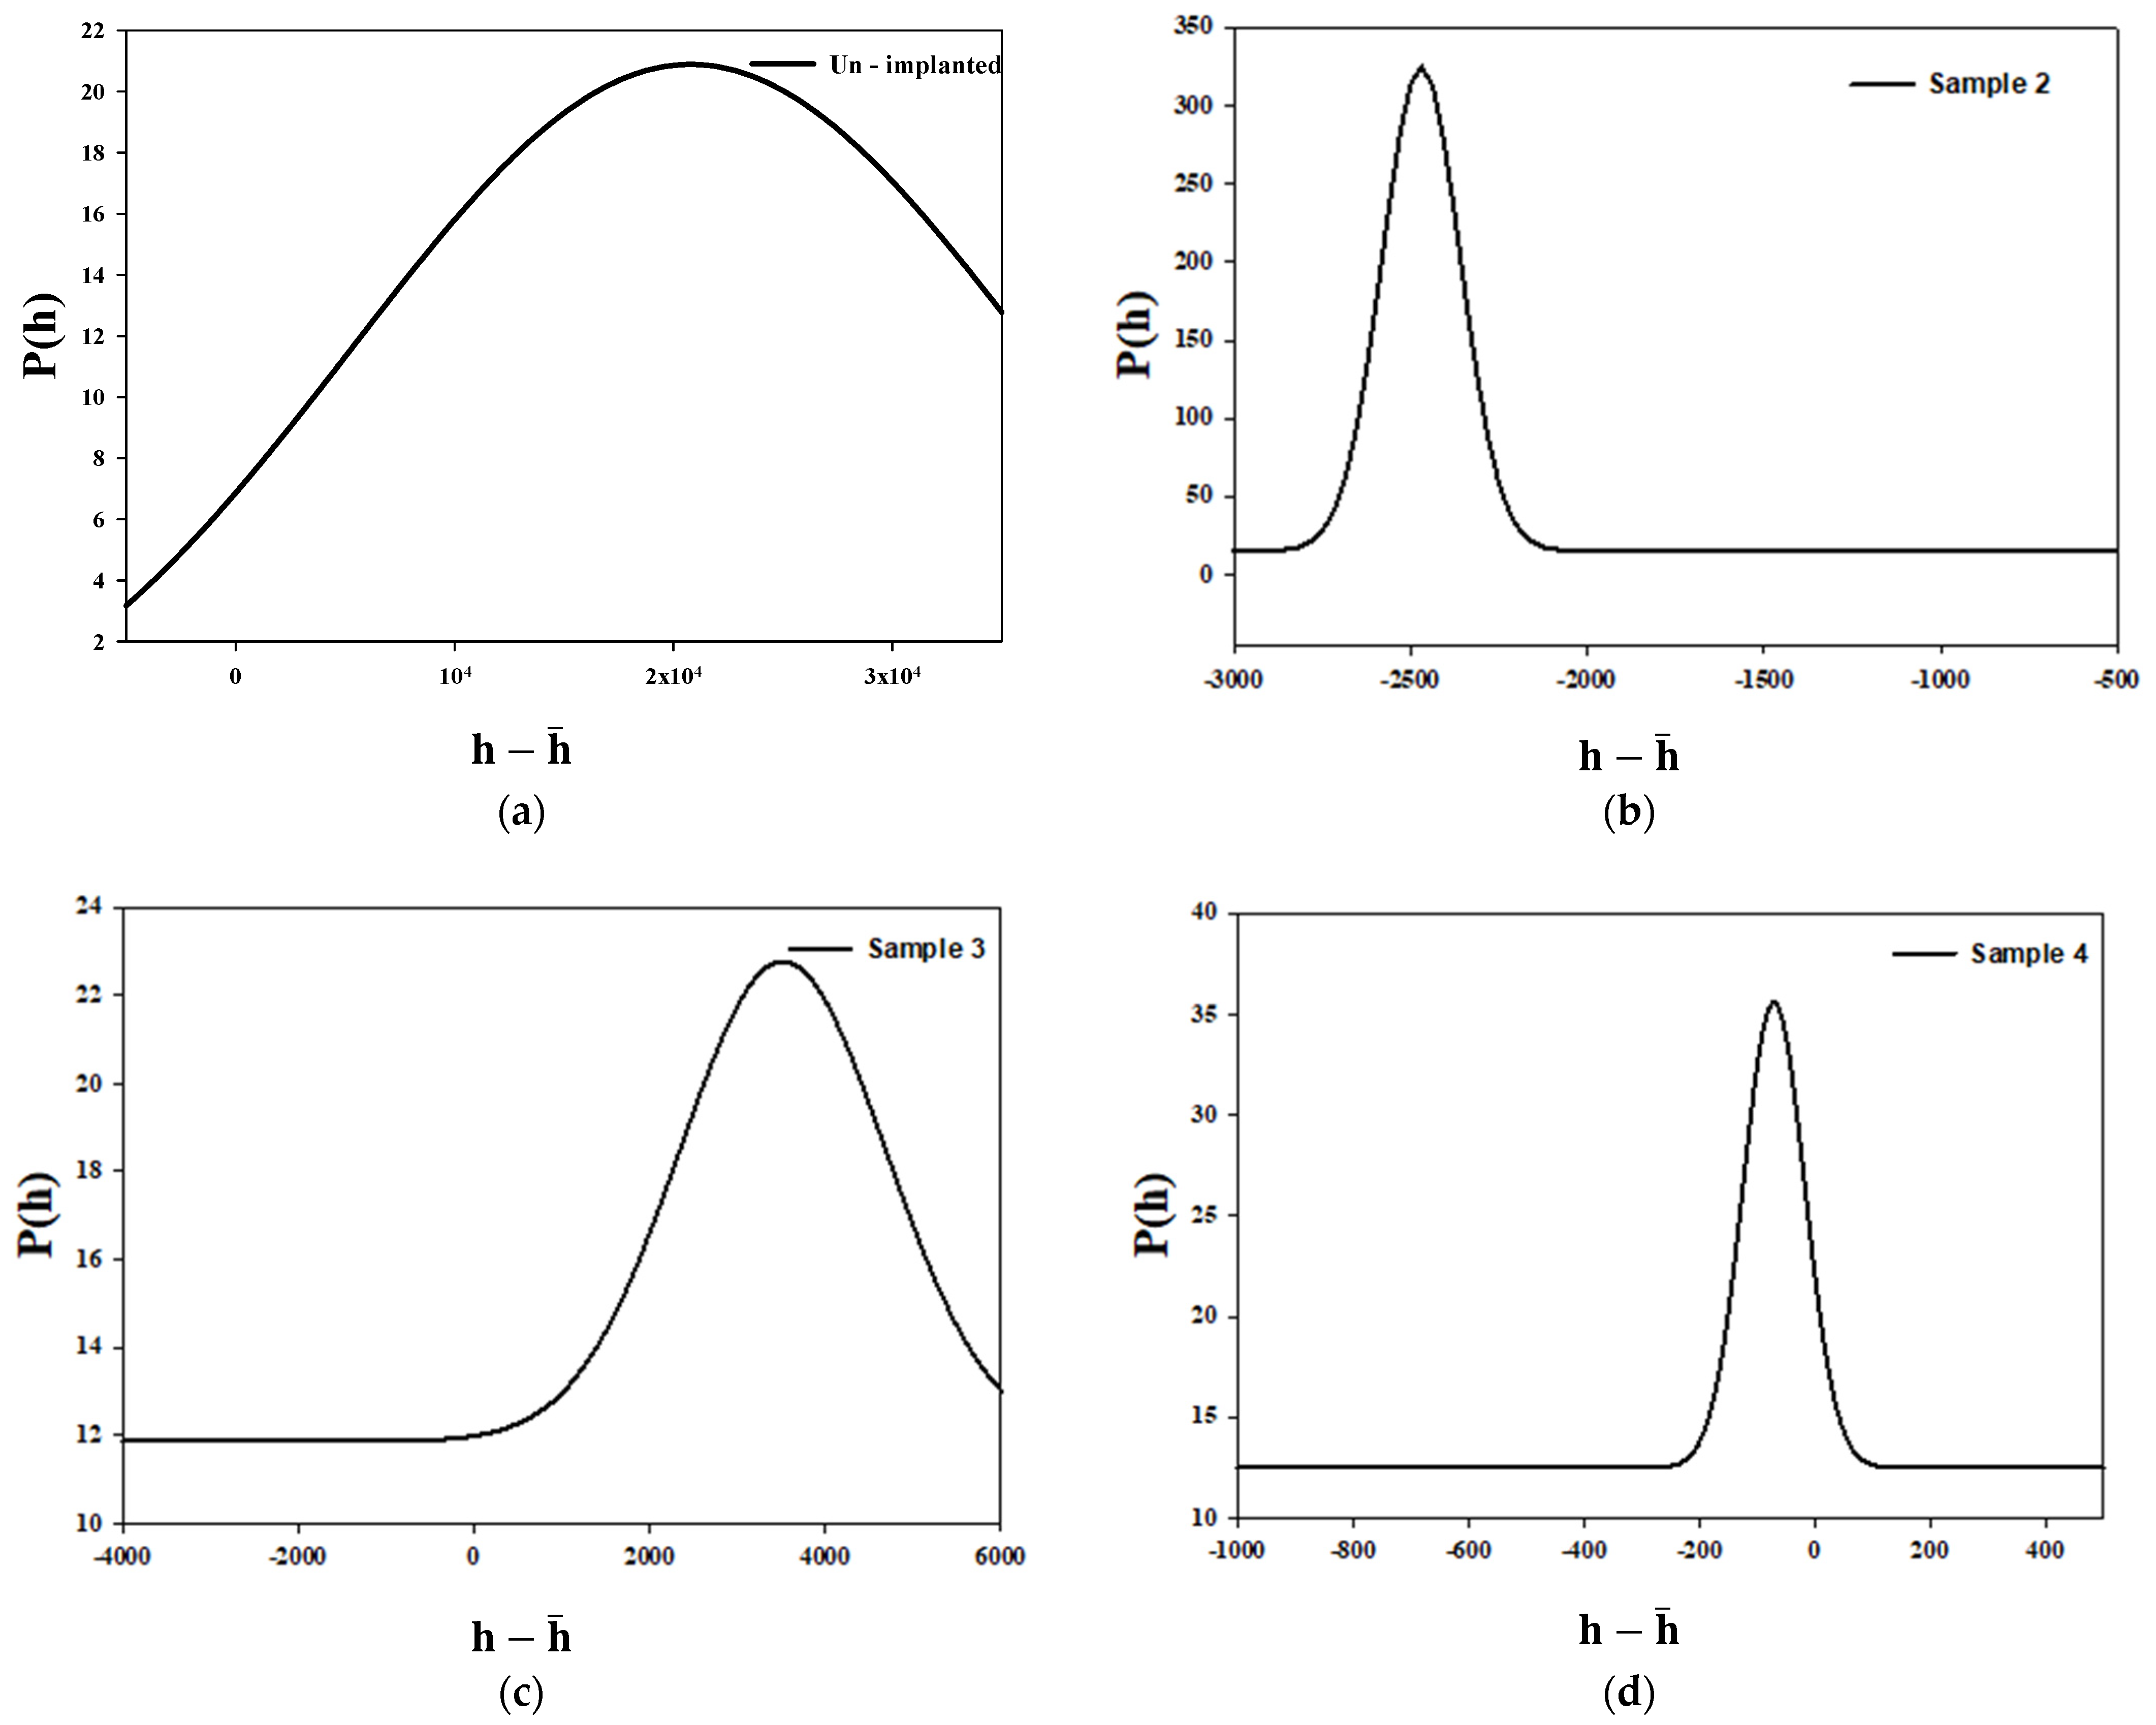
3.2. Monofractal Analysis of Height Distribution Based on Statistical Properties at Various Argon Ion Implanted Doses

Based on the monofractal analysis, the height distribution (both symmetric and asymmetric behaviors) and the higher third and fourth order moments are studied. Skewness is observed in the third moment of the height distribution. It is a parameter to measure the symmetry distribution of surface height as shown in Equation (3). The output resultant signs describe that the data points are skewed to the left (negative sign) or the right (positive sign) of the data average [17].
R s k = ( h h ¯ ) 3 ( h h ¯ ) 2 3 / 2
Kurtosis is the fourth-order moment of surface height. For the Gaussian distribution, its value is equivalent to 3. Kurtosis is a measure that determines the sharpness of the height distribution function. Indeed, it is a measure of the fatness ( R k u < 3) or the sharpness ( R k u > 3) peak of the probability, as expressed in Equation (4) [17].
R k u = ( h h ¯ ) 4 ( h h ¯ ) 2 2
In Table 4, the values of higher order moments of height distribution have been presented for all samples. The values of kurtosis and skewness expressed that both skewness of unimplanted and implanted samples approve the deviation of the Gaussian distribution.
In all cases, ( R k u < 3) indicates the lower slope and higher peaks over the surface samples. In addition, the asymmetric tail and non-zero skewness are the two important reasons for deviation from the Gaussian distribution [18,19].
A suitable measure that designates the heights spread above the mean surface and the height variation along the surface is named the power spectrum. Moreover, the power spectrum is the transform of the correlation function and mathematically expressed in Equation (5).
P ( h ) = 1 2 π   C ( ) e i k . d
When the height of the points is measured with respect to the mean height, the normalized height distribution P ( h ) is calculated [18].
Figure 6 shows that in all cases the height distributions deviate from the Gaussian distribution; therefore, the descriptions about the skewness and kurtosis measurements have been confirmed.

3.3. Hurst (Roughness) Exponent and Fractal Dimension

The width of the rough surfaces is mathematically expressed in Equation (6).
w ( L , t ) = ( h ( i , t ) h ¯ ( t ) ) 2
where the surface height at site (i) and at time (t) is shown by h(i,t) and where h ¯ ( t ) is the average height at time t. After a long period of time, the surfaces become saturated and the roughness width ( w ( L , t ) ) shows a power low dependency on the L (substrate size) as w L = L α [14]. The roughness exponent ( α ) , which is also called the Hurst exponent, is utilized for analyzing the smoothness and irregularity behavior of the saturated rough surfaces [16,20,21]. The samples’ Hurst exponent values have been measured in Table 5.
In the case of self-affine surfaces, the Hurst exponent is in the range 0 ≤ α ≤ 1. The self-affine characteristic indicates that a surface appears less rough as the scale increases. If one uses various magnifications on a self-affine profile, a magnified part of the surface would look statistically equal to the whole profile. The small values of roughness exponent characterize jagged or irregular surfaces at short length scales [22,23,24]. Overall, the results show low irregularity of samples, whilst the jaggedness of sample surfaces vary by the variation in argon ion doses.
The fractal dimension, D f , is another measurement that has a straight relation with the Hurst exponent, and it is a measure of the surface complexity. There are various approaches for obtaining the D f [19,25], such as D f = D + 1 α for measurement of the fractal dimension [26]. The value of D is considered 1 for profiles and 2 for surfaces. The D f values of implanted samples are indicated in Table 6.
One of the approaches which leads to the production of rough surfaces with self-affine fractal characteristics is erosion by ion bombardment. Based on the results, one can conclude that the rough tantalum-based samples which have been implanted by argon ions have fractal behavior.

4. Conclusions

In the present study, the microstructural and statistical analysis of implanted tantalum (Ta)-based samples have been studied for potential application in microelectronic substrates. The implantation process has been carried out by argon ions with different doses and an energy of 30 keV. The AFM and SEM analyses have been applied to express the effect of the argon ion implantation on the structural properties of samples. Ion doses affect the morphology of Ta-based samples during the implantation process, for which the statistical properties of each sample have been comparatively analyzed. As argon ion doses increase, the resistance against tantalum corrosion increases. Based on our results, all samples are correlated, and their correlation lengths vary negligibly with an increase in argon ion doses. The measurements of higher orders of height, skewness and kurtosis show a deviation from the Gaussian distribution. These obtained consequences have been verified by the results of the normalized height distribution. Additionally, the Hurst exponent and the fractal dimension of samples have been estimated. The results are in good agreement with experimental works. In this study, the monofractal analysis revealed that the samples are the self-affine fractal surfaces.

Author Contributions

Conceptualization, A.H.R. and S.H., Z.E.; methodology, A.H.R., S.H., S.M., Z.E.; software, A.H.R., S.H., Z.E.; validation, A.H.R., S.H., Z.E., S.M.; formal analysis, A.H.R., S.H., Z.E., M.S., S.M.; investigation, A.H.R., S.H., Z.E., M.S., S.M.; resources, S.H., A.H.R.; data curation, A.H.R., Z.E.; writing—original draft preparation, A.H.R., S.H., Z.E., M.S., S.M.; writing—review and editing, S.M., S.H., A.H.R., M.S.; visualization, S.H., A.H.R., M.S., S.M.; supervision, S.H., A.H.R.; project administration, S.H., S.M., A.H.R., Z.E., M.S.; funding acquisition, S.H., A.H.R. All authors have read and agreed to the published version of the manuscript.

Funding

This research received no external funding.

Acknowledgments

The authors express gratitude and acknowledge the international research collaboration developed between Iran, Italy and the UK.

Conflicts of Interest

The authors declare no conflict of interest.

References

  1. Kalyanasundaram, N.; Moore, M.C.; Freund, J.B.; Johnson, H.T. Stress evolution due to medium-energy ion bombardment of silicon. Acta Mater. 2006, 54, 483–491. [Google Scholar] [CrossRef]
  2. Hellal, F.; Atmani, F.; Malki, B.; Sedjal, H.; Kerkar, M.; Dalard, F. Study of corrosion behaviour of Ti-coated AISI 316L stainless steel in a simulated body fluid solution. In Passivation of Metals and Semiconductors, and Properties of Thin Oxide Layers; Elsevier: Amsterdam, The Netherlands, 2006; pp. 371–376. ISBN 9780444522245. [Google Scholar]
  3. Liu, Y.Z.; Zu, X.T.; Cao, J.; Wang, L.; Li, C.; Huang, X.Q. Phase formation in nitrogen ion implanted Ti-Al-Zr alloy and modification of corrosion property. Nucl. Instrum. Methods Phys. Res. Sect. B Beam Interact. Mater. At. 2005, 237, 543–549. [Google Scholar] [CrossRef]
  4. Patil, S.S.; Fernandes, R.P.; Patel, N.K.; Rayjada, P.A.; Raole, P.M.; Kothari, D.C. Corrosion resistance study of argon implanted and ion-beam-mixed 316 SS. Surf. Coat. Technol. 2005, 196, 284–287. [Google Scholar] [CrossRef]
  5. De, A.K.; Speer, J.G.; Matlock, D.K.; Murdock, D.C.; Mataya, M.C.; Comstock, R.J. Deformation-induced phase transformation and strain hardening in type 304 austenitic stainless steel. Metall. Mater. Trans. A Phys. Metall. Mater. Sci. 2006, 37, 1875–1886. [Google Scholar] [CrossRef]
  6. Chen, G.S.; Chen, S.T. Diffusion barrier properties of single- and multilayered quasi-amorphous tantalum nitride thin films against copper penetration. J. Appl. Phys. 2000, 87, 8473–8482. [Google Scholar] [CrossRef]
  7. Chuang, J.C.; Chen, M.C. Properties of thin Ta-N films reactively sputtered on Cu/SiO2/Si substrates. Thin Solid Films 1998, 322, 213–217. [Google Scholar] [CrossRef]
  8. Stavrev, M.; Fischer, D.; Wenzel, C.; Drescher, K.; Mattern, N. Crystallographic and morphological characterization of reactively sputtered Ta, Ta-N and Ta-N-O thin films. Thin Solid Films 1997, 307, 79–88. [Google Scholar] [CrossRef]
  9. Ramezani, A.H.; Sari, A.H.; Shokouhy, A. The effects of argon ion bombardment on the corrosion resistance of tantalum. Int. Nano Lett. 2017, 7, 51–57. [Google Scholar] [CrossRef] [Green Version]
  10. Li, Y.; Wei, S.; Cheng, X.; Zhang, T.; Cheng, G. Corrosion behavior and surface characterization of tantalum implanted TiNi alloy. Surf. Coat. Technol. 2008, 202, 3017–3022. [Google Scholar] [CrossRef]
  11. Ghosh, K.; Pandey, R.K. Assessment of fractal and multifractal features of sol-gel spin coated ZnO thin film surface. Mater. Res. Express 2019, 6, 086454. [Google Scholar] [CrossRef]
  12. Bifano, T.G.; Johnson, H.T.; Bierden, P.; Mali, R.K. Elimination of stress-induced curvature in thin-film structures. J. Microelectromech. Syst. 2002, 11, 592–597. [Google Scholar] [CrossRef]
  13. Barabási, A.L.; Stanley, H.E. Fractal Concepts in Surface Growth; Cambridge University Press: Cambridge, UK, 1995. [Google Scholar]
  14. Ghosh, K.; Pandey, R.K. Fractal assessment of ZnO thin films using Higuchi’s algorithm. In Proceedings of the AIP Conference Proceedings; American Institute of Physics Inc.: College Park, MD, USA, 2019; Volume 2115, p. 030280. [Google Scholar]
  15. Ogilvy, J.A.; Foster, J.R. Rough surfaces: Gaussian or exponential statistics? J. Phys. D. Appl. Phys. 1989, 22, 1243–1251. [Google Scholar] [CrossRef]
  16. Gadelmawla, E.S.; Koura, M.M.; Maksoud, T.M.A.; Elewa, I.M.; Soliman, H.H. Roughness parameters. J. Mater. Process. Technol. 2002, 123, 133–145. [Google Scholar] [CrossRef]
  17. Palasantzas, G.; Barnaś, J. Surface-roughness fractality effects in electrical conductivity of single metallic and semiconducting films. Phys. Rev. B Condens. Matter Mater. Phys. 1997, 56, 7726–7731. [Google Scholar] [CrossRef] [Green Version]
  18. Simonovski, L. Available online: https://inis.iaea.org/search/search.aspx?orig_q=RN:37104664 (accessed on 20 October 2021).
  19. Zhao, Y.; Wang, G.C.; Lu, T.M. Characterization of Amorphous and Crystalline Rough Surface—Principles and Applications; Elsevier: Amsterdam, The Netherlands, 2000. [Google Scholar]
  20. Ebrahiminejad, Z.; Masoudi, S.F.; Jafari, G.R.; Dariani, R.S. Effects of self-affine roughness characteristics on electron transmission through tunneling structures. Thin Solid Films 2012, 522, 233–237. [Google Scholar] [CrossRef]
  21. Forgerini, F.L.; Figueiredo, W. Random deposition of particles of different sizes. Phys. Rev. E Stat. Nonlinear Soft Matter Phys. 2009, 79, 041602. [Google Scholar] [CrossRef] [Green Version]
  22. Aarão Reis, F.D.A. Roughness fluctuations, roughness exponents and the universality class of ballistic deposition. Phys. A Stat. Mech. Its Appl. 2006, 364, 190–196. [Google Scholar] [CrossRef] [Green Version]
  23. Silveira, F.A.; Aarão Reis, F.D.A. Surface and bulk properties of deposits grown with a bidisperse ballistic deposition model. Phys. Rev. E Stat. Nonlinear Soft Matter Phys. 2007, 75, 061608. [Google Scholar] [CrossRef] [Green Version]
  24. Raoufi, D.; Hosseinpanahi, F. The effect of film thickness on surface morphology of ITO thin films. J. Theor. Appl. Phys. 2013, 7, 21. [Google Scholar] [CrossRef] [Green Version]
  25. Ramezani, A.H.; Hoseinzadeh, S.; Ebrahiminejad, Z. Statistical and fractal analysis of nitrogen ion implanted tantalum thin films. Appl. Phys. A 2020, 126, 481. [Google Scholar] [CrossRef]
  26. Ramezani, A.H.; Hoseinzadeh, S.; Ebrahiminejad, Z. Structural and mechanical properties of tantalum thin films ected by nitrogen ion implantation. Mod. Phys. Lett. Bvol. 2020, 34, 2050163. [Google Scholar] [CrossRef]
Figure 1. A schematic diagram of the experimental system employed for argon ion implantation.
Electronics 10 02941 g001
Figure 2. Two-dimensional AFM images of sample surfaces of (a) unimplanted, (b) argon ion implanted at the dose of 1 × 10¹⁷ ions/cm2, (c) argon ion implanted at the dose of 3 × 10¹⁷ ions/cm2, and (d) argon ion implanted at the dose of 7 × 10¹⁷ ions/cm2.
Electronics 10 02941 g002
Figure 3. Scanning electron microscopic (SEM) images of (a) unimplanted in comparison to implanted samples after corrosion test with argon dose of (b) 1 × 10¹⁷ ions/cm2, (c) 3 × 10¹⁷ ions/cm2, and (d) 7 × 10¹⁷ ions/cm2.
Electronics 10 02941 g003
Figure 4. The correlation functions as a separation distance for unimplanted and implanted samples.
Electronics 10 02941 g004
Figure 5. The correlation lengths versus argon ion doses for unimplanted and implanted samples.
Electronics 10 02941 g005
Figure 6. The normalized height distributions of (a) unimplanted sample, (b) implanted sample 2, (c) implanted sample 3 and (d) implanted sample 4.
Electronics 10 02941 g006
Table 1. The argon ion implantation process parameters.
Sample No.Dose of Extracted Ions (ion/cm2)Time (s)
1Un-implanted------------
21 × 1017360
33 × 10171050
47 × 10172560
Table 2. The results of sample corrosion tests.
SampleDose (ion/cm2)Corrosion Current
* (10−6)
Corrosion Potential
* (10−4)
Sample 1Unimplanted0.107−1.78
Sample 21 × 10170.0116−0.681
Sample 33 × 10170.0259−5.037
Sample 47 × 10170.0347−0.680
Table 3. The values of average roughness and root mean square roughness of samples.
SampleDose
(ion/cm2)
RMS Roughness
(Å)
Average Roughness
(Å)
1-----22.315.7
21 × 101730.525.64
33 × 101741.132.8
47 × 101750.341.3
Table 4. The values of kurtosis and skewness for all samples.
SampleKurtosisSkewness
12.57−1.53
21.87−1.33
31.561.22
41.51−1.04
Table 5. The Hurst exponent of implanted samples.
Dose (Ion/cm2)1 × 10173 × 10177 × 1017
Hurst Exponent0.890.900.87
Table 6. The fractal dimension values of implanted samples.
Dose (Ion/cm2)1 × 10173 × 10177 × 1017
Df1.11.091.13
Publisher’s Note: MDPI stays neutral with regard to jurisdictional claims in published maps and institutional affiliations.

