
An Adaptive Routing Framework for Efficient Power Consumption in Software-Defined Datacenter Networks


Abstract
:1. Introduction
2. Related Work
3. Problem Statement and Proposed Solutions
4. Proposed Model
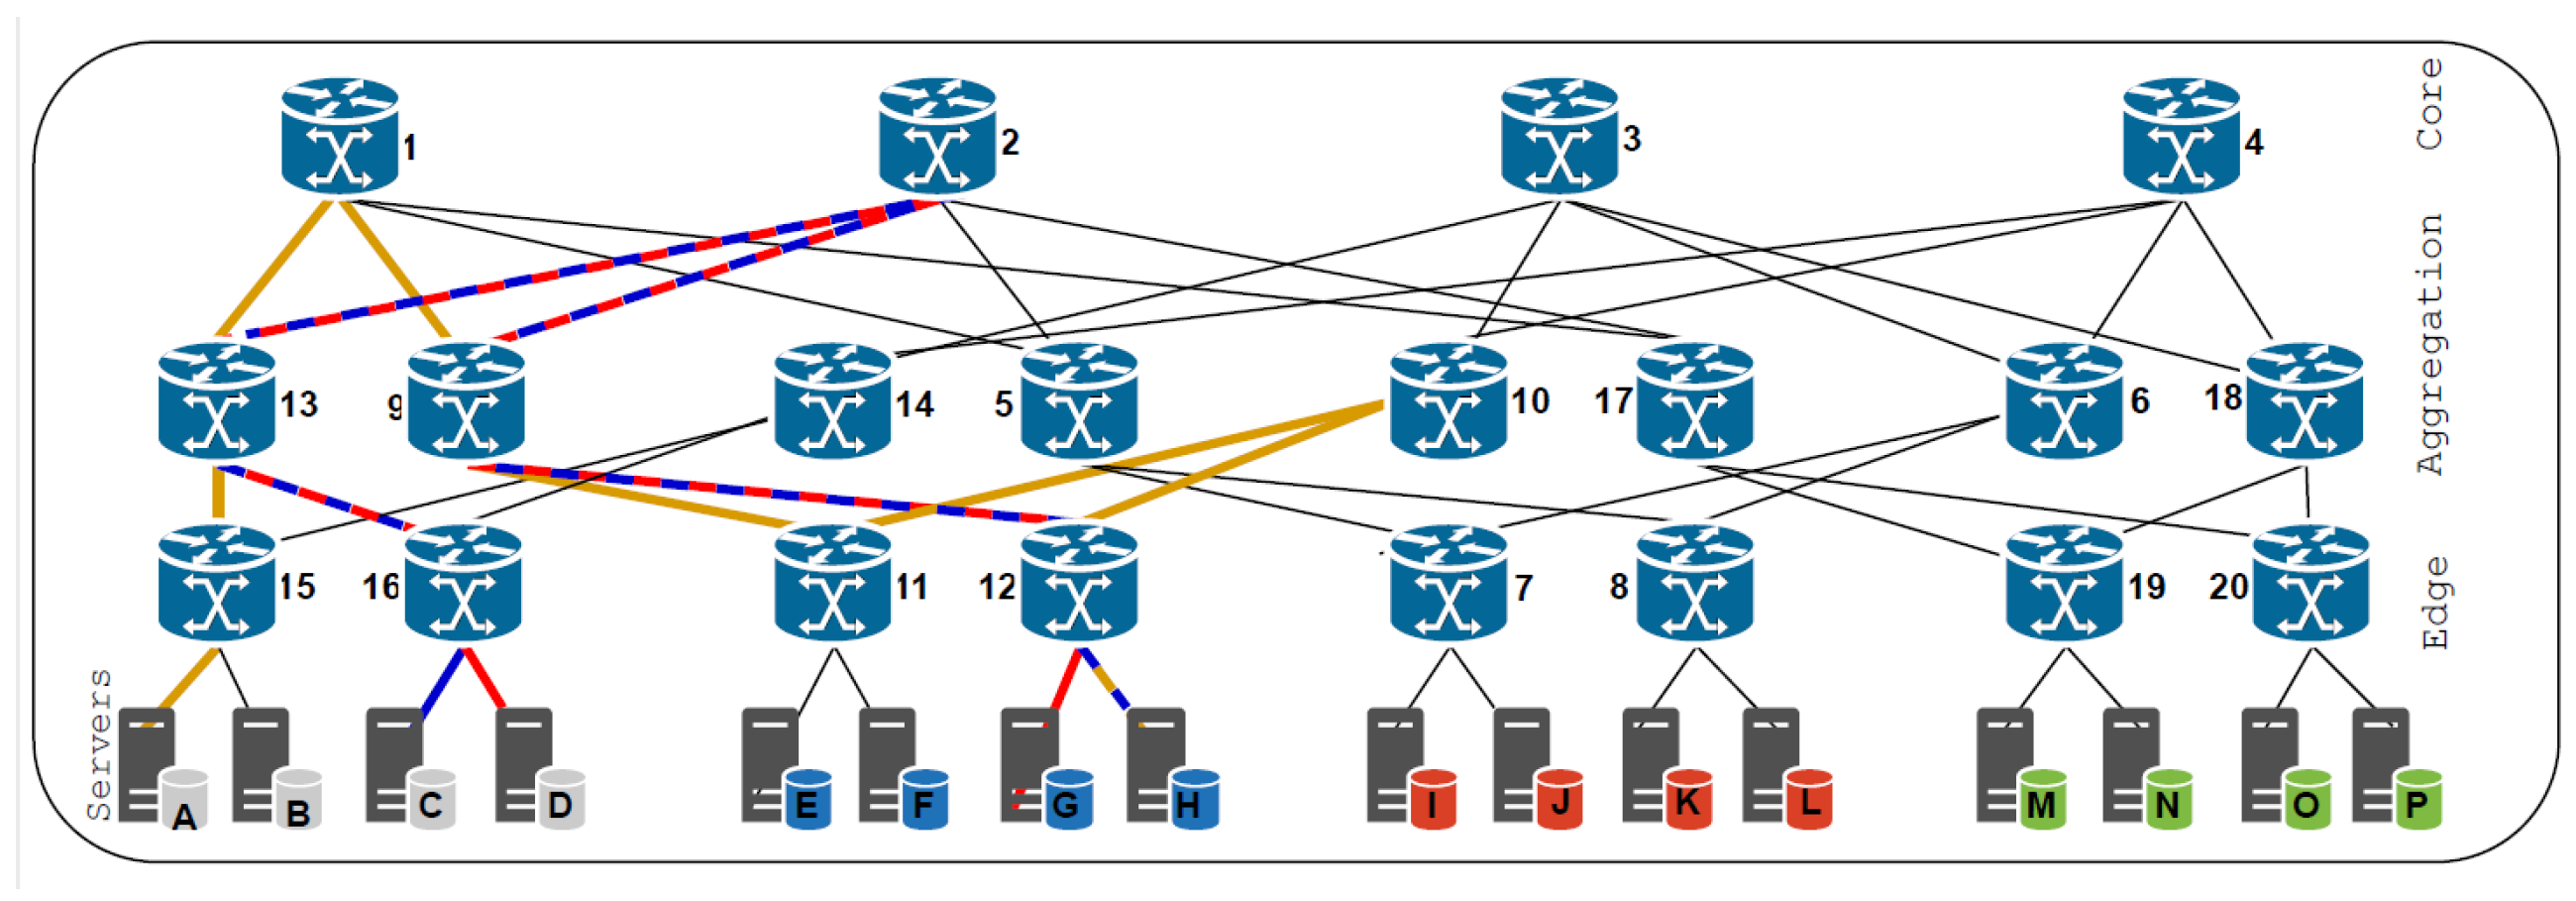
4.1. Network Model
4.2. Optimization Model
4.3. IntP formulation
5. Proposed Power Consumption Method
5.1. Monitoring Model
5.2. FPLF-Adaptive Algorithm Components
| Algorithm 1: Link-Utility. |
| Input: Fat-Tree topology , traffic demand |
| Output: utilization matrix of all links |
 |
| Algorithm 2: Link-Cost. |
| Input: utilization matrix , Fat-Tree topology |
| Output:link-cost matrix |
 |
| Algorithm 3: Fill-Shortest Path (Dijkstra-like algorithm). |
| Input: Fat-Tree topology , flow , link-cost matrix |
| Output: energy-saving path |
 |
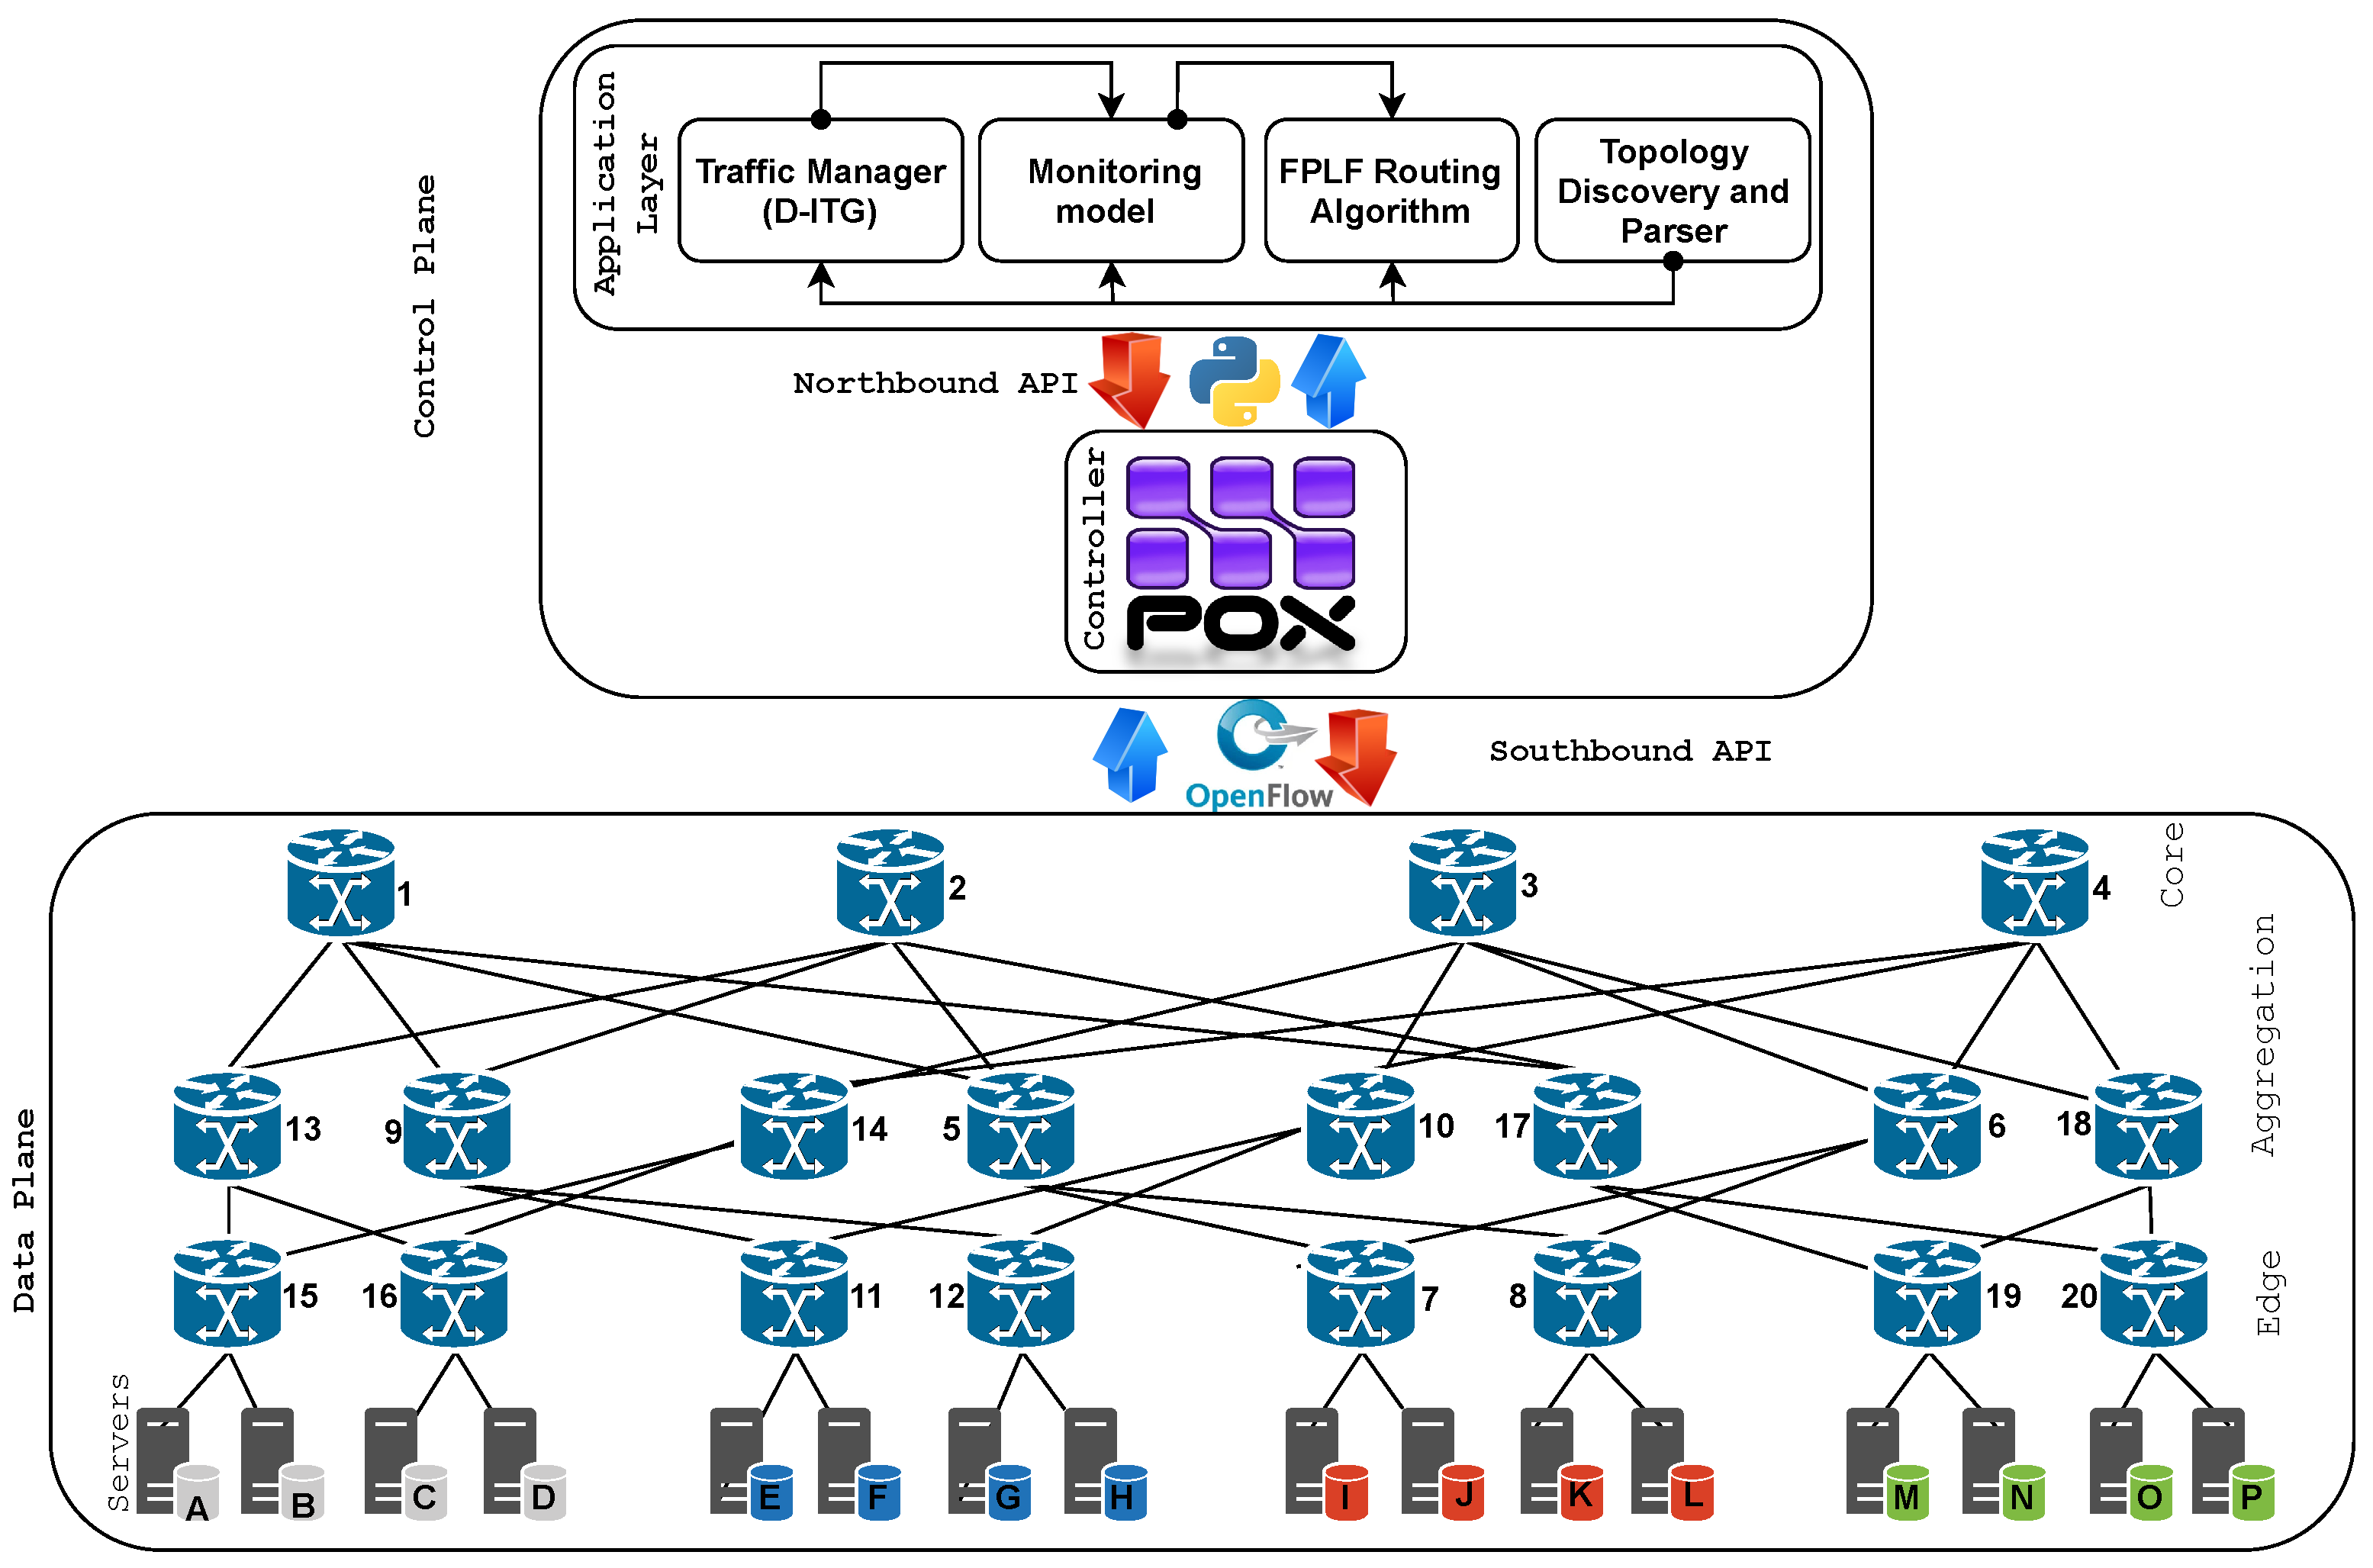
6. Proposed Framework and Implementation
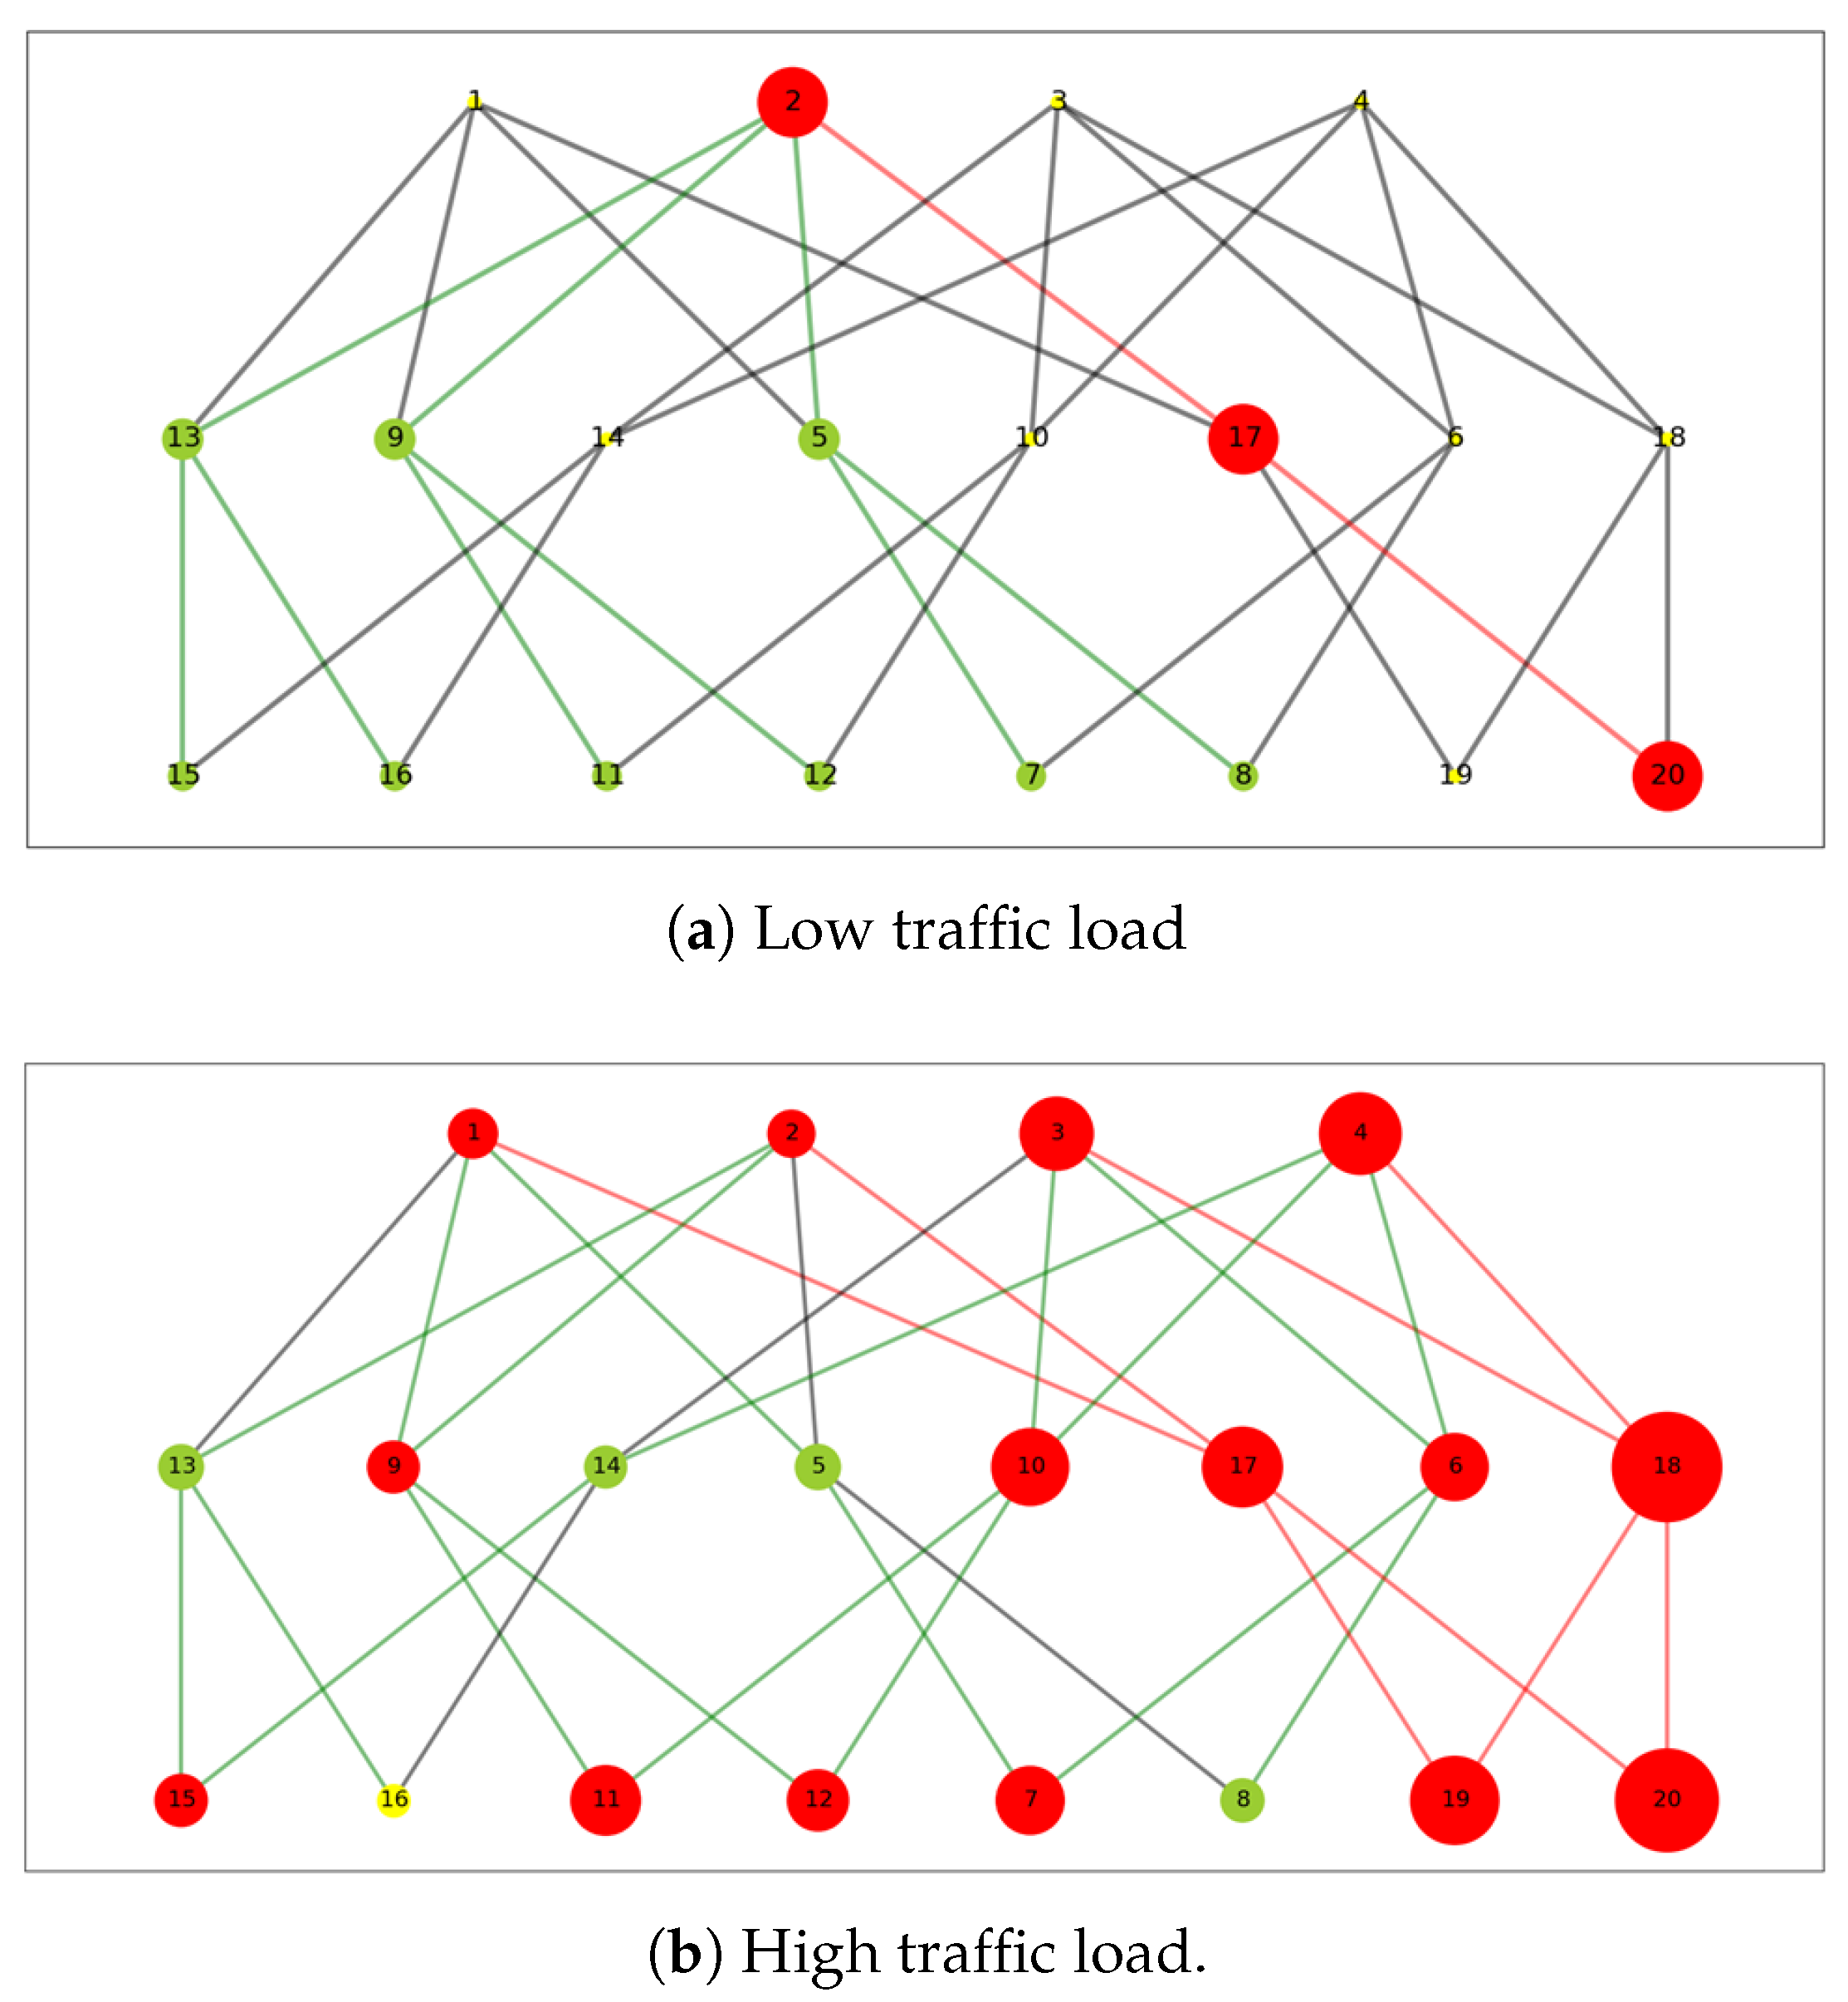
6.1. Experiment Design and Simulation Results
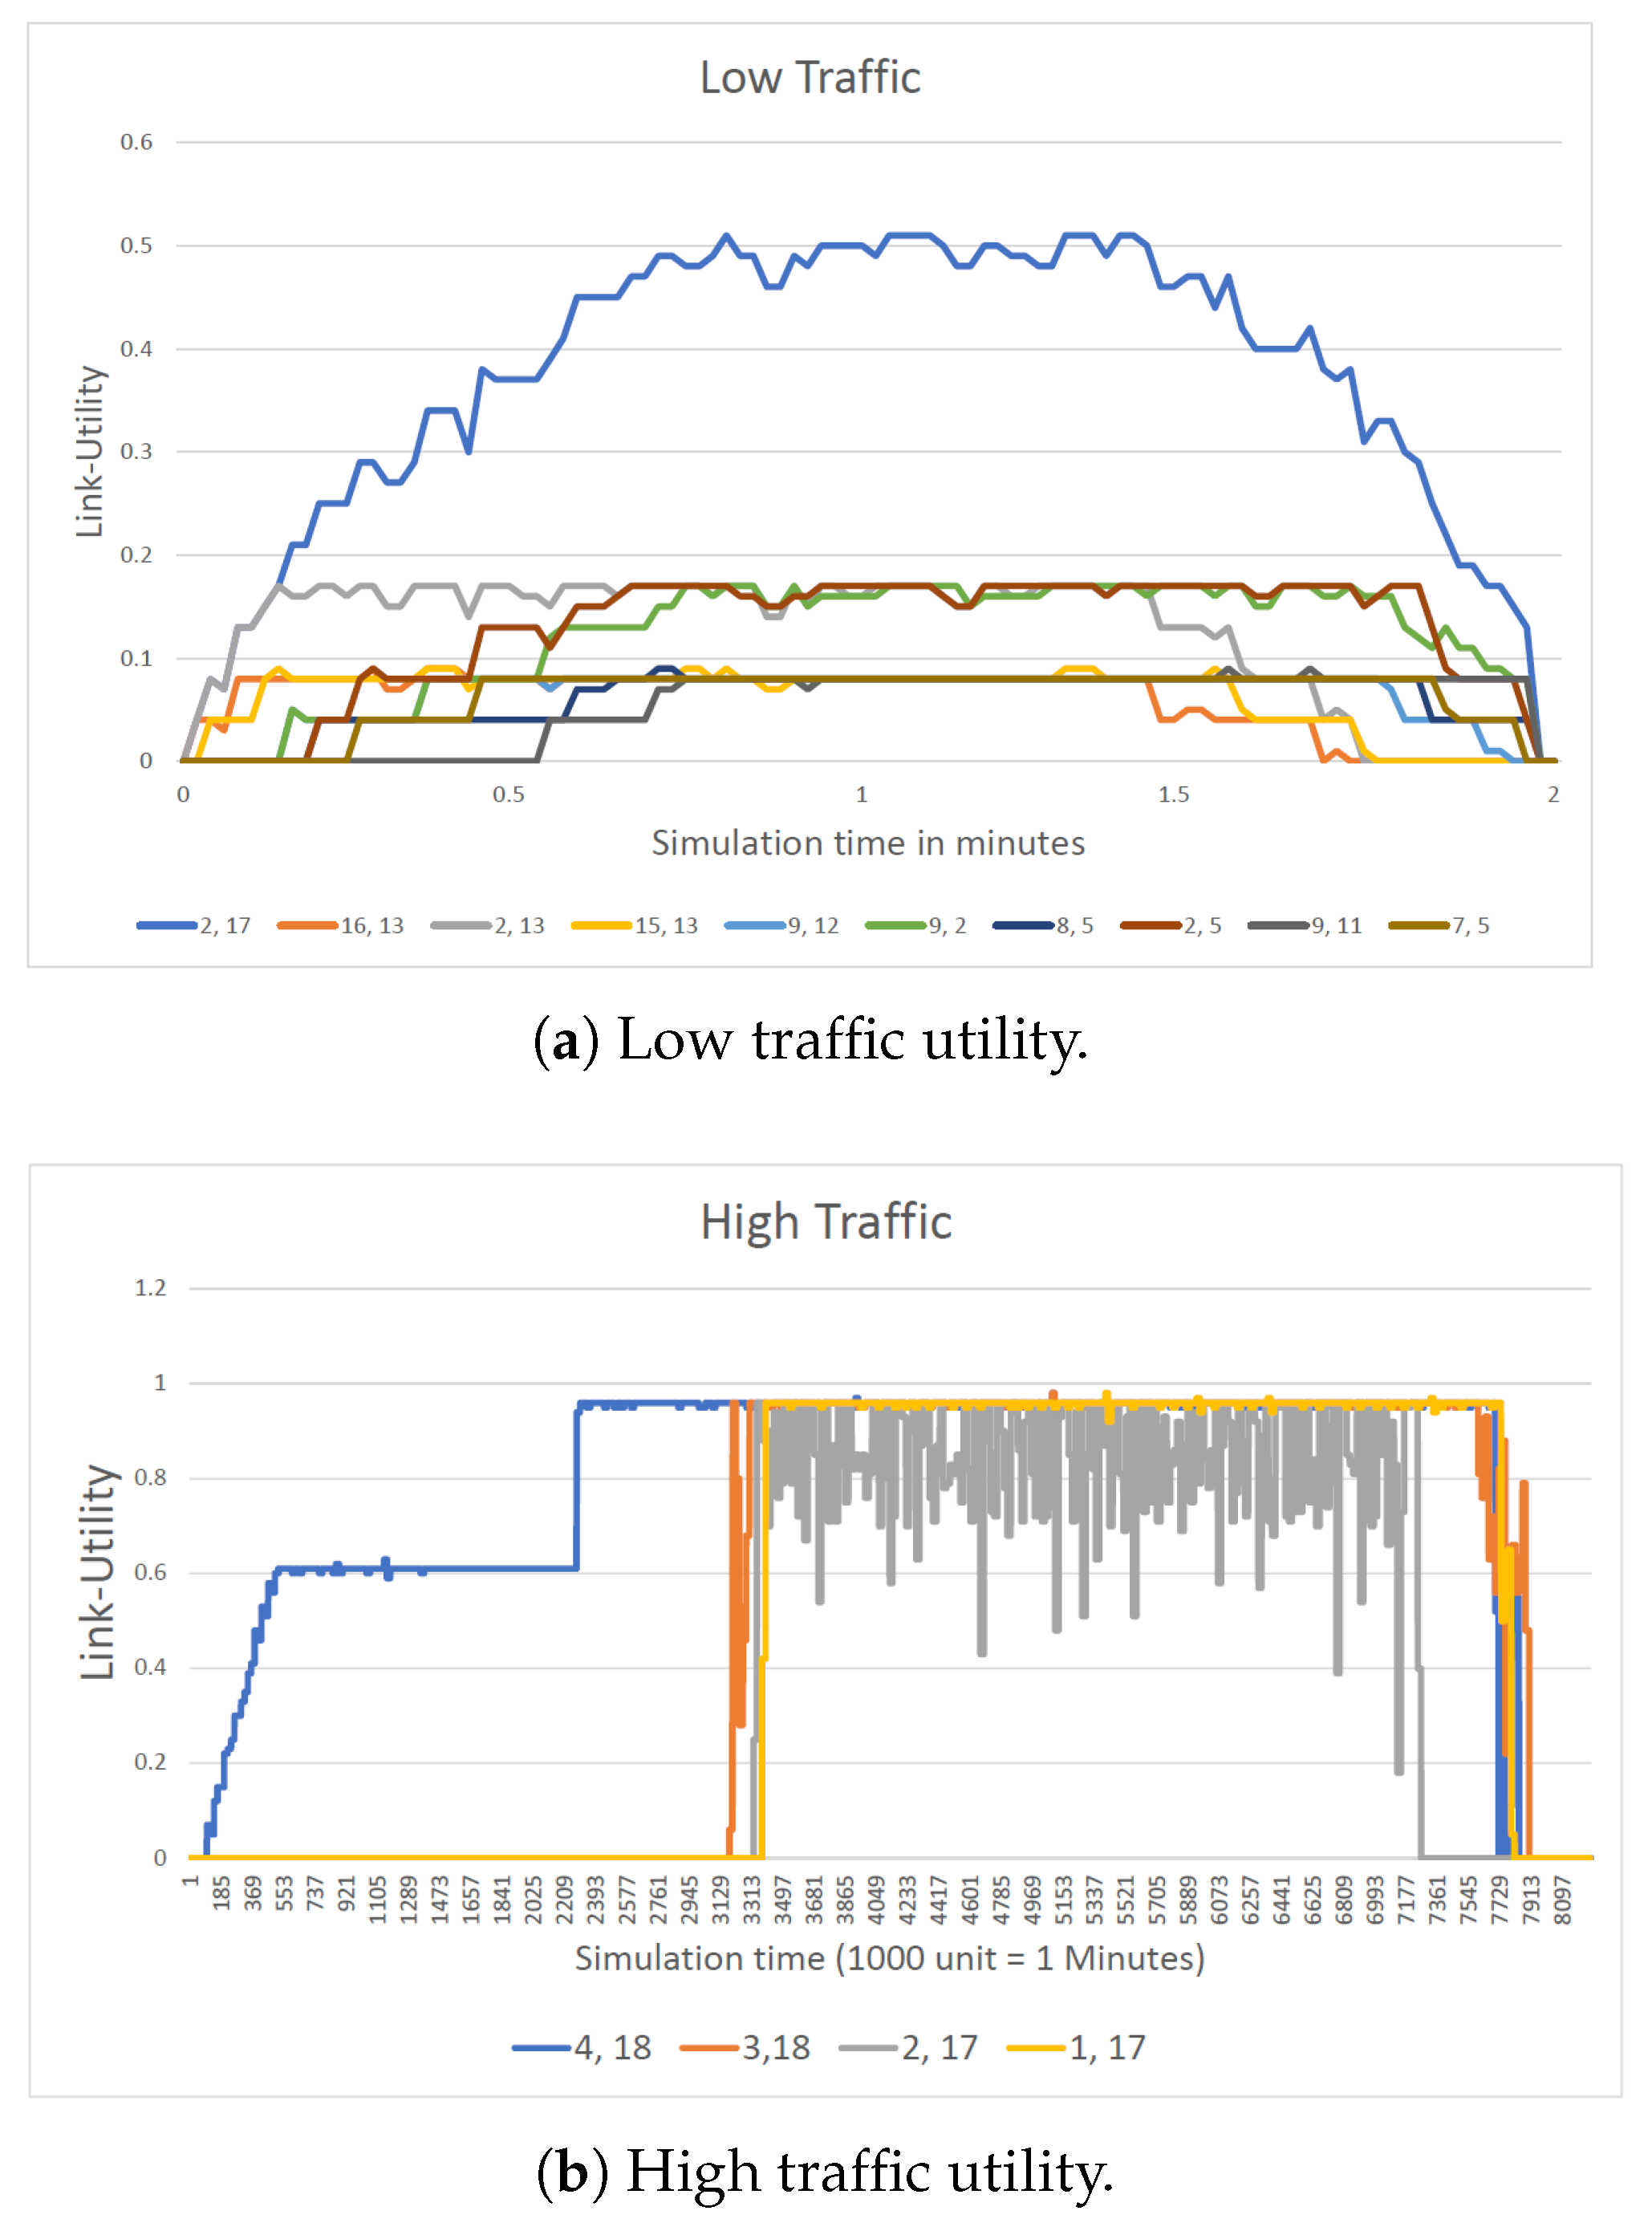
6.2. Performance Evaluation
6.3. Limitations
7. Conclusions
Author Contributions
Funding
Conflicts of Interest
References
- Choumas, K.; Giatsios, D.; Flegkas, P.; Korakis, T. SDN Controller Placement and Switch Assignment for Low Power IoT. Electronics 2020, 9, 325. [Google Scholar] [CrossRef] [Green Version]
- Nsaif, M.R.; Al-Haboobi, A.S.; Rabee, F.; Alasadi, F.A. Reliable Compression Route Protocol for Mobile Crowd Sensing (RCR-MSC). J. Commun. 2019, 14, 170–178. [Google Scholar] [CrossRef]
- Rabee, F.; Al-Haboobi, A.; Nsaif, M.R. Parallel three-way handshaking route in mobile crowd sensing (PT-MCS). J. Eng. Appl. Sci. 2019, 14, 3200–3209. [Google Scholar] [CrossRef] [Green Version]
- Heller, B.; Seetharaman, S.; Mahadevan, P.; Yiakoumis, Y.; Sharma, P.; Banerjee, S.; McKeown, N. Elastictree: Saving energy in data center networks. In Proceedings of the 7th USENIX Symposium on Networked Systems Design and Implementation, San Jose, CA, USA, 28–30 April 2010; Volume 10, pp. 249–264. [Google Scholar]
- Assefa, B.G.; Özkasap, Ö. A survey of energy efficiency in SDN: Software-based methods and optimization models. J. Netw. Comput. Appl. 2019, 137, 127–143. [Google Scholar] [CrossRef] [Green Version]
- Bertoldi, P. A market transformation programme for improving energy efficiency in data centres. In Proceedings of the ACEEE Summer Study on Energy Efficiency in Buildings, Pacific Grove, CA, USA, 17–22 August 2014. [Google Scholar]
- Avgerinou, M.; Bertoldi, P.; Castellazzi, L. Trends in data centre energy consumption under the european code of conduct for data centre energy efficiency. Energies 2017, 10, 1470. [Google Scholar] [CrossRef]
- Tatchell-Evans, M.; Kapur, N.; Summers, J.; Thompson, H.; Oldham, D. An experimental and theoretical investigation of the extent of bypass air within data centres employing aisle containment, and its impact on power consumption. Appl. Energy 2017, 186, 457–469. [Google Scholar] [CrossRef]
- Staessens, D.; Sharma, S.; Colle, D.; Pickavet, M.; Demeester, P. Software defined networking: Meeting carrier grade requirements. In Proceedings of the 2011 18th IEEE Workshop on Local & Metropolitan Area Networks (LANMAN), Chapel Hill, NC, USA, 13–14 October 2011; pp. 1–6. [Google Scholar]
- Thanh, N.H.; Nam, P.N.; Truong, T.H.; Hung, N.T.; Doanh, L.K.; Pries, R. Enabling experiments for energy-efficient data center networks on openflow-based platform. In Proceedings of the 2012 Fourth International Conference on Communications and Electronics (ICCE), Hue Royal City, Vietnam, 1–3 August 2012; pp. 239–244. [Google Scholar]
- Riekstin, A.C.; Januário, G.C.; Rodrigues, B.B.; Nascimento, V.T.; Carvalho, T.C.; Meirosu, C. Orchestration of energy efficiency capabilities in networks. J. Netw. Comput. Appl. 2016, 59, 74–87. [Google Scholar] [CrossRef]
- Shirayanagi, H.; Yamada, H.; Kono, K. Honeyguide: A vm migration-aware network topology for saving energy consumption in data center networks. IEICE Trans. Inf. Syst. 2013, 96, 2055–2064. [Google Scholar] [CrossRef] [Green Version]
- Galán-Jiménez, J.; Polverini, M.; Cianfrani, A. Reducing the reconfiguration cost of flow tables in energy-efficient software-defined networks. Comput. Commun. 2018, 128, 95–105. [Google Scholar] [CrossRef]
- Wang, S.H.; Huang, P.P.W.; Wen, C.H.P.; Wang, L.C. EQVMP: Energy-efficient and QoS-aware virtual machine placement for software defined datacenter networks. In Proceedings of the The International Conference on Information Networking 2014 (ICOIN2014), Phuket, Thailand, 10–12 February 2014; pp. 220–225. [Google Scholar]
- Dalvandi, A.; Gurusamy, M.; Chua, K.C. Power-efficient resource-guaranteed VM placement and routing for time-aware data center applications. Comput. Netw. 2015, 88, 249–268. [Google Scholar] [CrossRef]
- Kang, N.; Liu, Z.; Rexford, J.; Walker, D. Optimizing the “one big switch” abstraction in software-defined networks. In Proceedings of the Ninth ACM Conference on Emerging Networking Experiments and Technologies, Santa Barbara, CA, USA, 9–12 December 2013; pp. 13–24. [Google Scholar]
- Kanizo, Y.; Hay, D.; Keslassy, I. Palette: Distributing tables in software-defined networks. In Proceedings of the 2013 Proceedings IEEE INFOCOM, Turin, Italy, 14–19 April 2013; pp. 545–549. [Google Scholar]
- Rifai, M.; Huin, N.; Caillouet, C.; Giroire, F.; Lopez-Pacheco, D.; Moulierac, J.; Urvoy-Keller, G. Too many SDN rules? Compress them with MINNIE. In Proceedings of the 2015 IEEE Global Communications Conference (GLOBECOM), San Diego, CA, USA, 6–10 December 2015; pp. 1–7. [Google Scholar]
- Izima, O.; de Fréin, R.; Malik, A. A Survey of Machine Learning Techniques for Video Quality Prediction from Quality of Delivery Metrics. Electronics 2021, 10, 2851. [Google Scholar] [CrossRef]
- McKeown, N.; Anderson, T.; Balakrishnan, H.; Parulkar, G.; Peterson, L.; Rexford, J.; Shenker, S.; Turner, J. OpenFlow: Enabling innovation in campus networks. ACM SIGCOMM Comput. Commun. Rev. 2008, 38, 69–74. [Google Scholar] [CrossRef]
- Hopps, C. Analysis of an Equal-Cost Multi-Path Algorithm. RFC 2000, 2992, 1–8. [Google Scholar]
- Al-Fares, M.; Radhakrishnan, S.; Raghavan, B.; Huang, N.; Vahdat, A. Hedera: Dynamic flow scheduling for data center networks. In Proceedings of the 7th USENIX conference on Networked systems design and implementation, San Jose, CA, USA, 28–30 April 2010; Volume 10, pp. 89–92. [Google Scholar]
- Luo, J.; Zhang, S.; Yin, L.; Guo, Y. Dynamic flow scheduling for power optimization of data center networks. In Proceedings of the 2017 Fifth International Conference on Advanced Cloud and Big Data (CBD), Shanghai, China, 13–16 August 2017; pp. 57–62. [Google Scholar]
- Vu, T.H.; Luc, V.C.; Quan, N.T.; Nam, T.M.; Thanh, N.H.; Nam, P.N. The new method to save energy for Openflow Switch based on traffic engineering. In Proceedings of the 2014 2nd International Conference on Electronic Design (ICED), Penang, Malaysia, 19–21 August 2014; pp. 309–314. [Google Scholar]
- Assefa, B.G.; Ozkasap, O. Link utility and traffic aware energy saving in software defined networks. In Proceedings of the 2017 IEEE International Black Sea Conference on Communications and Networking (BlackSeaCom), Istanbul, Turkey, 5–8 June 2017; pp. 1–5. [Google Scholar]
- Orlowski, S.; Wessäly, R.; Pióro, M.; Tomaszewski, A. SNDlib 1.0—Survivable network design library. Netw. Int. J. 2010, 55, 276–286. [Google Scholar] [CrossRef] [Green Version]
- Assefa, B.G.; Özkasap, Ö. Resdn: A novel metric and method for energy efficient routing in software defined networks. IEEE Trans. Netw. Serv. Manag. 2020, 17, 736–749. [Google Scholar] [CrossRef] [Green Version]
- Malik, A.; Fréin, R.d.; Ke, C.H.; Alyasiri, H.; Izima, O. Bayesian Adaptive Path Allocation Techniques for Intra-Datacenter Workloads. In Proceedings of the 2021 International Conference on Computer Communications and Networks (ICCCN), Athens, Greece, 19–22 July 2021; pp. 1–8. [Google Scholar] [CrossRef]
- Kaup, F.; Melnikowitsch, S.; Hausheer, D. Measuring and modeling the power consumption of OpenFlow switches. In Proceedings of the 10th International Conference on Network and Service Management (CNSM) and Workshop, Rio de Janeiro, Brazil, 17–21 November 2014; pp. 181–186. [Google Scholar]
- Inc, L.S. LINGO the Modeling Language and Optimizer; Technical Support; LINDO Systems Inc.: Chicago, IL, USA, 2020; Available online: http://www.lindo.com (accessed on 1 August 2021).
- Lantz, B.; Heller, B.; McKeown, N. A network in a laptop: Rapid prototyping for software-defined networks. In Proceedings of the 9th ACM SIGCOMM Workshop on Hot Topics in Networks, New York, NY, USA, 20–21 October 2010; pp. 1–6. [Google Scholar]
- Saino, L.; Cocora, C.; Pavlou, G. A Toolchain for Simplifying Network Simulation Setup. In Proceedings of the 6th International ICST Conference on Simulation Tools and Techniques, Cannes, France, 5–7 March 2013; SIMUTOOLS ’13. ICST (Institute for Computer Sciences, Social-Informatics and Telecommunications Engineering): Brussels, Belgium, 2013. [Google Scholar]
- de Donato, M.; Dainotti, A.; Avallone, S.; Pescap, A. D-ITG 2.8.1 Manual; COMICS (COMputer for Interaction and CommunicationS). Available online: http://www.traffic.comics.unina.it/software/ITG/ (accessed on 1 August 2021).
- De Fréin, R. Source Separation Approach to Video Quality Prediction in Computer Networks. IEEE Commun. Lett. 2016, 20, 1333–1336. [Google Scholar] [CrossRef]
- de Fréin, R.; Izima, O.; Malik, A. Detecting Network State in the Presence of Varying Levels of Congestion. In Proceedings of the IEEE International Workshop on Machine Learning for Signal Processing, Gold Coast, Australia, 25–28 October 2021; pp. 1–6. [Google Scholar]
- Malik, A.; de Fréin, R.; Aziz, B. Rapid restoration techniques for software-defined networks. Appl. Sci. 2020, 10, 3411. [Google Scholar] [CrossRef]
- Savelsbergh, M.W.; Sigismondi, G.C.; Nemhauser, G.L. Functional Description of MINTO, a Mixed Integer Optimizer; Eindhoven University of Technology: Eindhoven, The Netherlands, 1991. [Google Scholar]
- Woodruff, D.L. A chunking based selection strategy for integrating meta-heuristics with branch and bound. In Meta-Heuristics; Springer: Berlin/Heidelberg, Germany, 1999; pp. 499–511. [Google Scholar]
- Septién, J.; Mozos, D.; Tirado, F.; Hermida, R.; Fernández, M. Heuristics for branch-and-bound global allocation. In EURO-DAC; IEEE Computer Society Press: Washington, DC, USA, 1992; pp. 334–340. [Google Scholar]


| Western Europe | 2013 | 2014 | 2015 | 2016 | 2017 | 2018 | 2019 | 2020 |
|---|---|---|---|---|---|---|---|---|
| Net data center space (thousands of m) | 10,256 | 10,221 | 10,105 | 10,055 | 9875 | 9555 | 9365 | 9155 |
| Average power density (kW/m) | 1.1 | 1.1 | 1.2 | 1.2 | 1.3 | 1.3 | 1.2 | 1.3 |
| Total power usage (GW) | 11.3 | 11.2 | 12.1 | 12 | 12.8 | 12.4 | 11.3 | 10.9 |
| Parameter | Description |
|---|---|
| Set of nodes (switches) in the DCN topology, | |
| Set of edges where represents the connection between two switches and | |
| adjacency matrix scaled by the bandwidth of the edges equal to 1 Mbps for all links | |
| Set of flows | |
| A flow represented by source, destination and packet rate | |
| Utilization matrix where represents the utilization of the link | |
| T | Input traffic matrix where denotes input traffic of |
| Link-cost matrix where denotes the cost of the link | |
| k | number of the pods in the fat-tree topology |
| energy-saving path | |
| source switch | |
| destination switch |
| Case | No. of Flows | Objective Value | Total Variables | Integer Variables | Total Constraints | Memory (kB) | Runtime (s) |
|---|---|---|---|---|---|---|---|
| 1 | 120 | 35 | 156,912 | 155,616 | 319,249 | 51,179 | 9891.79 |
| 2 | 110 | 32 | 142,656 | 141,360 | 290,341 | 46,542 | 275.24 |
| 3 | 100 | 32 | 130,992 | 129,696 | 266,689 | 42,747 | 219.28 |
| 4 | 90 | 33 | 118,032 | 116,736 | 240,409 | 38,531 | 452.84 |
| 5 | 80 | 30 | 105,072 | 103,776 | 214,129 | 34,315 | 45.53 |
| 6 | 70 | 31 | 90,816 | 89,520 | 185,221 | 29,678 | 49.00 |
| 7 | 60 | 29 | 77,856 | 76,560 | 158,941 | 25,463 | 12.38 |
| 8 | 50 | 29 | 66,192 | 64,896 | 135,289 | 21,247 | 16.89 |
| 9 | 40 | 28 | 51,936 | 50,640 | 106,381 | 17,031 | 4.37 |
| 10 | 30 | 28 | 38,976 | 37,680 | 80,101 | 12,858 | 3.22 |
| 11 | 20 | 24 | 26,016 | 24,720 | 53,821 | 8599 | 2.22 |
| 12 | 10 | 19 | 14,352 | 13,056 | 30,169 | 4805 | 1.34 |
| 13 | 5 | 17 | 7872 | 6576 | 17,029 | 2697 | 0.79 |
| Source | Number of Flows | Start Time (s) | End Time (s) | D-L Utility (2,17) | FPLF-Action | Number of the Core Switches |
|---|---|---|---|---|---|---|
| A, B | Single/Multiple small | 0 | 100 | increased from 0 to 1.7 | Install-ESP | 1 |
| C, D | Single/Multiple small | 3 | 105 | increased from 1.7 to 0.22 | Install-ESP | 1 |
| E, F | Single/Multiple small | 10 | 115 | increased from 0.22 to 0.25 | Install-ESP | 1 |
| G, H | Single/Multiple small | 15 | 120 | increased from 0.25 to 0.37 | Install-ESP | 1 |
| I, J | Single/Multiple small | 20 | 120 | increased from 0.37 to 0.51 | Install-ESP | 1 |
| K, L | Single/Multiple small | 33 | 120 | fluctuated between 0.51 and 0.47 | Install-ESP | 1 |
| Source | Destination | Flows Description |
|---|---|---|
| A,B,C | M | Between 0 to 11 s, started with multiple small flows, after 140 s from the time of simulation, burst with large flow, i.e., high traffic |
| D,E,F | N | Between 0 to 11 s, started with multiple small flows, after 190 s from the time of simulation, burst with large flow, i.e., high traffic |
| G,H,I | O | Between 9 to 30 s, started with multiple small flows, after 190 s from the time of simulation, burst with large flow, i.e., high traffic |
| G,K,L | P | Between 21 to 28 s, started with multiple small flows, after 190 s from the time of simulation, burst with large flow, i.e., high traffic |
| Events Time (s) | D-L Utility (1, 18) | D-L Utility (3, 18) | D-L Utility (2, 17) | D-L Utility (4, 18) | FPLF-Action | Number of the Core Switches |
|---|---|---|---|---|---|---|
| 0 TO 136 | 0 | 0 | 0 | 0 increased to 0.6 | Install-ESP | 1 |
| 136 TO 190 | 0 | 0 | 0 | 0.6 increased to 0.96 | Install-ESP | 1 |
| 190 TO 200 | 0 | 0.3 increased to 0.96 | 0 | 0.96 | Install-ESP | 2 |
| 200 TO 202 | 0 | 0.96 | 0 increased to 0.96 | 0.96 | Install-ESP | 3 |
| 202 TO 205 | 0 increasing to 0.96 | 0.96 | 0.96 | 0.96 | Install-ESP | 4 |
| 205 TO 440 | 0.1.8 fluctuated between 0.96 | 0.96 | 0.96 | 0.96 | No action | 4 |
| 440 TO 466 | 0 | 0.96 | 0.96 | 0.96 | No action | 3 |
| 466 TO 470 | 0 | 0.96 decreased to 0.57 | 0.96 | 0.96 | No action | 3 |
| 470 TO 486 | 0 | 0.57 decreased to 0 | 0.96 decreased to 0 | 0.96 decreased to 0 | No action | 0 |
| Destination Server | Total Time (S) | Total Received Packets | Packets Dropped-ECMP | Packets Dropped % |
|---|---|---|---|---|
| M | 429 | 58,614 | 128 | 0.22% |
| N | 326.6 | 53,329 | 157 | 0.29% |
| O | 335.6 | 53,413 | 206 | 0.38% |
| P | 439.7 | 59,053 | 415 | 0.70% |
| Destination Server | Total Time (S) | Total Received Packets | Packets Dropped-FPLF | Packets Dropped % |
|---|---|---|---|---|
| M | 414 | 58,360 | 152 | 0.26% |
| N | 322 | 56,705 | 117 | 0.21% |
| O | 330 | 59,671 | 115 | 0.19% |
| P | 423 | 62,706 | 114 | 0.18% |
Publisher’s Note: MDPI stays neutral with regard to jurisdictional claims in published maps and institutional affiliations. |
© 2021 by the authors. Licensee MDPI, Basel, Switzerland. This article is an open access article distributed under the terms and conditions of the Creative Commons Attribution (CC BY) license (https://creativecommons.org/licenses/by/4.0/).
Share and Cite
Nsaif, M.; Kovásznai, G.; Rácz, A.; Malik, A.; de Fréin, R. An Adaptive Routing Framework for Efficient Power Consumption in Software-Defined Datacenter Networks. Electronics 2021, 10, 3027. https://0-doi-org.brum.beds.ac.uk/10.3390/electronics10233027
Nsaif M, Kovásznai G, Rácz A, Malik A, de Fréin R. An Adaptive Routing Framework for Efficient Power Consumption in Software-Defined Datacenter Networks. Electronics. 2021; 10(23):3027. https://0-doi-org.brum.beds.ac.uk/10.3390/electronics10233027
Chicago/Turabian StyleNsaif, Mohammed, Gergely Kovásznai, Anett Rácz, Ali Malik, and Ruairí de Fréin. 2021. "An Adaptive Routing Framework for Efficient Power Consumption in Software-Defined Datacenter Networks" Electronics 10, no. 23: 3027. https://0-doi-org.brum.beds.ac.uk/10.3390/electronics10233027