Article

Research on Target Localization Method of CRTS-III Slab Ballastless Track Plate Based on Machine Vision

1
University of Chinese Academy of Sciences, Beijing 100049, China
2
Shenyang Institute of Computing Technology, Chinese Academy of Sciences, Shenyang 110168, China
3
Shenyang CASNC Technology Co., Ltd., Shenyang 110168, China
*
Author to whom correspondence should be addressed.
Submission received: 19 October 2021 / Revised: 25 November 2021 / Accepted: 29 November 2021 / Published: 4 December 2021
(This article belongs to the Section Computer Science & Engineering)

Abstract

:
In the construction of high-speed railway infrastructure, a CRTS-III slab ballastless track plate has been widely used. Anchor sealing is an essential step in the production of track plates. We design a novel automated platform based on industrial robots with vision guidance to improve the automation of a predominantly human-powered anchor sealing station. This paper proposes a precise and efficient target localization method for large and high-resolution images to obtain accurate target position information. To accurately update the robot’s work path and reduce idle waiting time, this paper proposes a low-cost and easily configurable visual localization system based on dual monocular cameras, which realizes the acquisition of track plate position information and the correction of position deviation in the robot coordinate system. We evaluate the repeatable positioning accuracy and the temporal performance of the visual localization system in a real production environment. The results show that the repeatable positioning accuracy of this localization system in the robot coordinate system can reach ±0.150 mm in the x- and y-directions and ±0.120° in the rotation angle. Moreover, this system completes two 18-megapixel image acquisitions, and the whole process takes around 570 ms to meet real production needs.

1. Introduction

With a series of technical advantages, such as high speed, high capacity, low energy consumption, and light pollution, high-speed railways have adapted to the new demands of modern socio-economic development [1,2]. Ballastless track plates have been widely developed and applied worldwide to meet the requirements of high speed, high stability, high ride comfort, and low maintenance cost of high-speed railroads. At present, Japan has laid more than 2700 km of slab ballastless track on the Shinkansen [3]. However, the development of ballastless tracks in Japan adopts a cooperative promotion research mode and takes slab-type track as its primary research direction. The ballastless track structure type on the Shinkansen is predominantly single. German railroads have adopted a more flexible mechanism for ballastless track development and application. Ballastless track systems, such as Rheda and Borg slab track [4], have been promoted and used extensively on new high-speed railroads in Germany.
China Railway Track System (CRTS) III is designed and developed independently by China and applied to new railroad lines [5]. The CRTS-III slab ballastless track plate has good structural integrity and has become a vital technology for China’s high-speed trains going global [6]. Anchor sealing is an essential step in the production process of track plates, and the sealing effect of one of the anchor holes is shown in Figure 1. Currently, the primary production method is manual operation, and this method has problems such as high labor intensity, low production efficiency, and defective quality control. Therefore, it is necessary to use robotic arms instead of manual labor to improve the automation of this production line. However, the position of the track plate is not fixed each time it arrives at the station, which leads to the robot arm not being able to accurately find the position of the anchor holes and complete the anchor sealing task. Therefore, it is necessary to obtain the accurate position information of the anchor holes in advance to plan the robot’s working path. Since the position of the anchor hole is fixed relative to the track plate, we can transform the problem of positioning the anchor hole into the issue of locating the track plate. In addition, under the premise of ensuring the high accuracy of acquiring track plate position information, the speed at which information is obtained should be further improved to shorten the production cycle.
Machine vision has become one of the most important sensing technologies for robots because of its non-contact nature and convenient ability to collect large amounts of information [7]. In recent years, the integration of robotics and vision technologies has developed rapidly. In researching vision localization methods, many scholars have conducted a great deal of technical exploration and practice. Wan (2021) et al. [8] proposed an industrial robotic grinding station with vision-based burr detection and trajectory planning functions, using a deep learning approach to find the region of interest (ROI) area of the target, combined with the template matching algorithm and Line-MOD algorithm to precisely identify position information. Xu (2017) et al. [9] developed a robotic welding system for seam tracking based on a purpose-built vision system that used edge feature point interpolation to plan the welding path. The experimental results showed that the welding system could control the error within ±0.45 mm during the real-time welding process. Pagano (2020) et al. [10] proposed a gluing machine integrating robot and vision technology. This machine used point clouds to fit the contours of objects to achieve positioning, and the feasibility of bonding was verified through application examples. Gao (2017) et al. [11] developed an automatic assembling system to grab and place the sealing rings of the battery lid, which combined the Hough transform and the algorithm of voting to achieve target positioning. Experimental results showed that the proposed system could significantly improve the efficiency of battery production lines. Ni (2020) et al. [12] designed a microelectronic device detection scheme, which combined the boundary tracking algorithm and template matching algorithm to localize the workpieces accurately. The results demonstrated that the positioning accuracy was 0.2 mm, with a certain practical value.
In these applications of machining positioning, image feature extraction algorithms can be broadly classified into three categories: traditional feature extraction algorithms, template matching algorithms, and deep learning algorithms, each of which has advantages and disadvantages. Traditional feature extraction algorithms have good localization results when the target features are noticeable but less adaptable in rotation and lighting changes. The template matching algorithms are easy to use and robust, but because they are based on sliding windows, the matching process requires traversing the whole image, which takes longer. In addition, the template algorithms have higher requirements for template design and image integrity. The deep learning approaches are more stable in complex environments and can effectively improve the accuracy of feature extraction, but they require higher computing power, which will undoubtedly increase equipment costs. This paper uses a traditional feature extraction algorithm due to equipment cost limitations and the difficulty of capturing the entire track plate image. We combine the feature extraction algorithm with the threshold segmentation and outlier rejection algorithms to improve the localization accuracy of the vision system and its adaptability to environmental changes.
This paper designs an anchor sealing platform based on industrial robots and a vision system to automate anchor sealing tasks. The platform can adjust the robot working trajectory without human intervention and realize the automated operation of the CRTS-III slab ballastless track plate sealing process.
We make the following contributions in this paper:
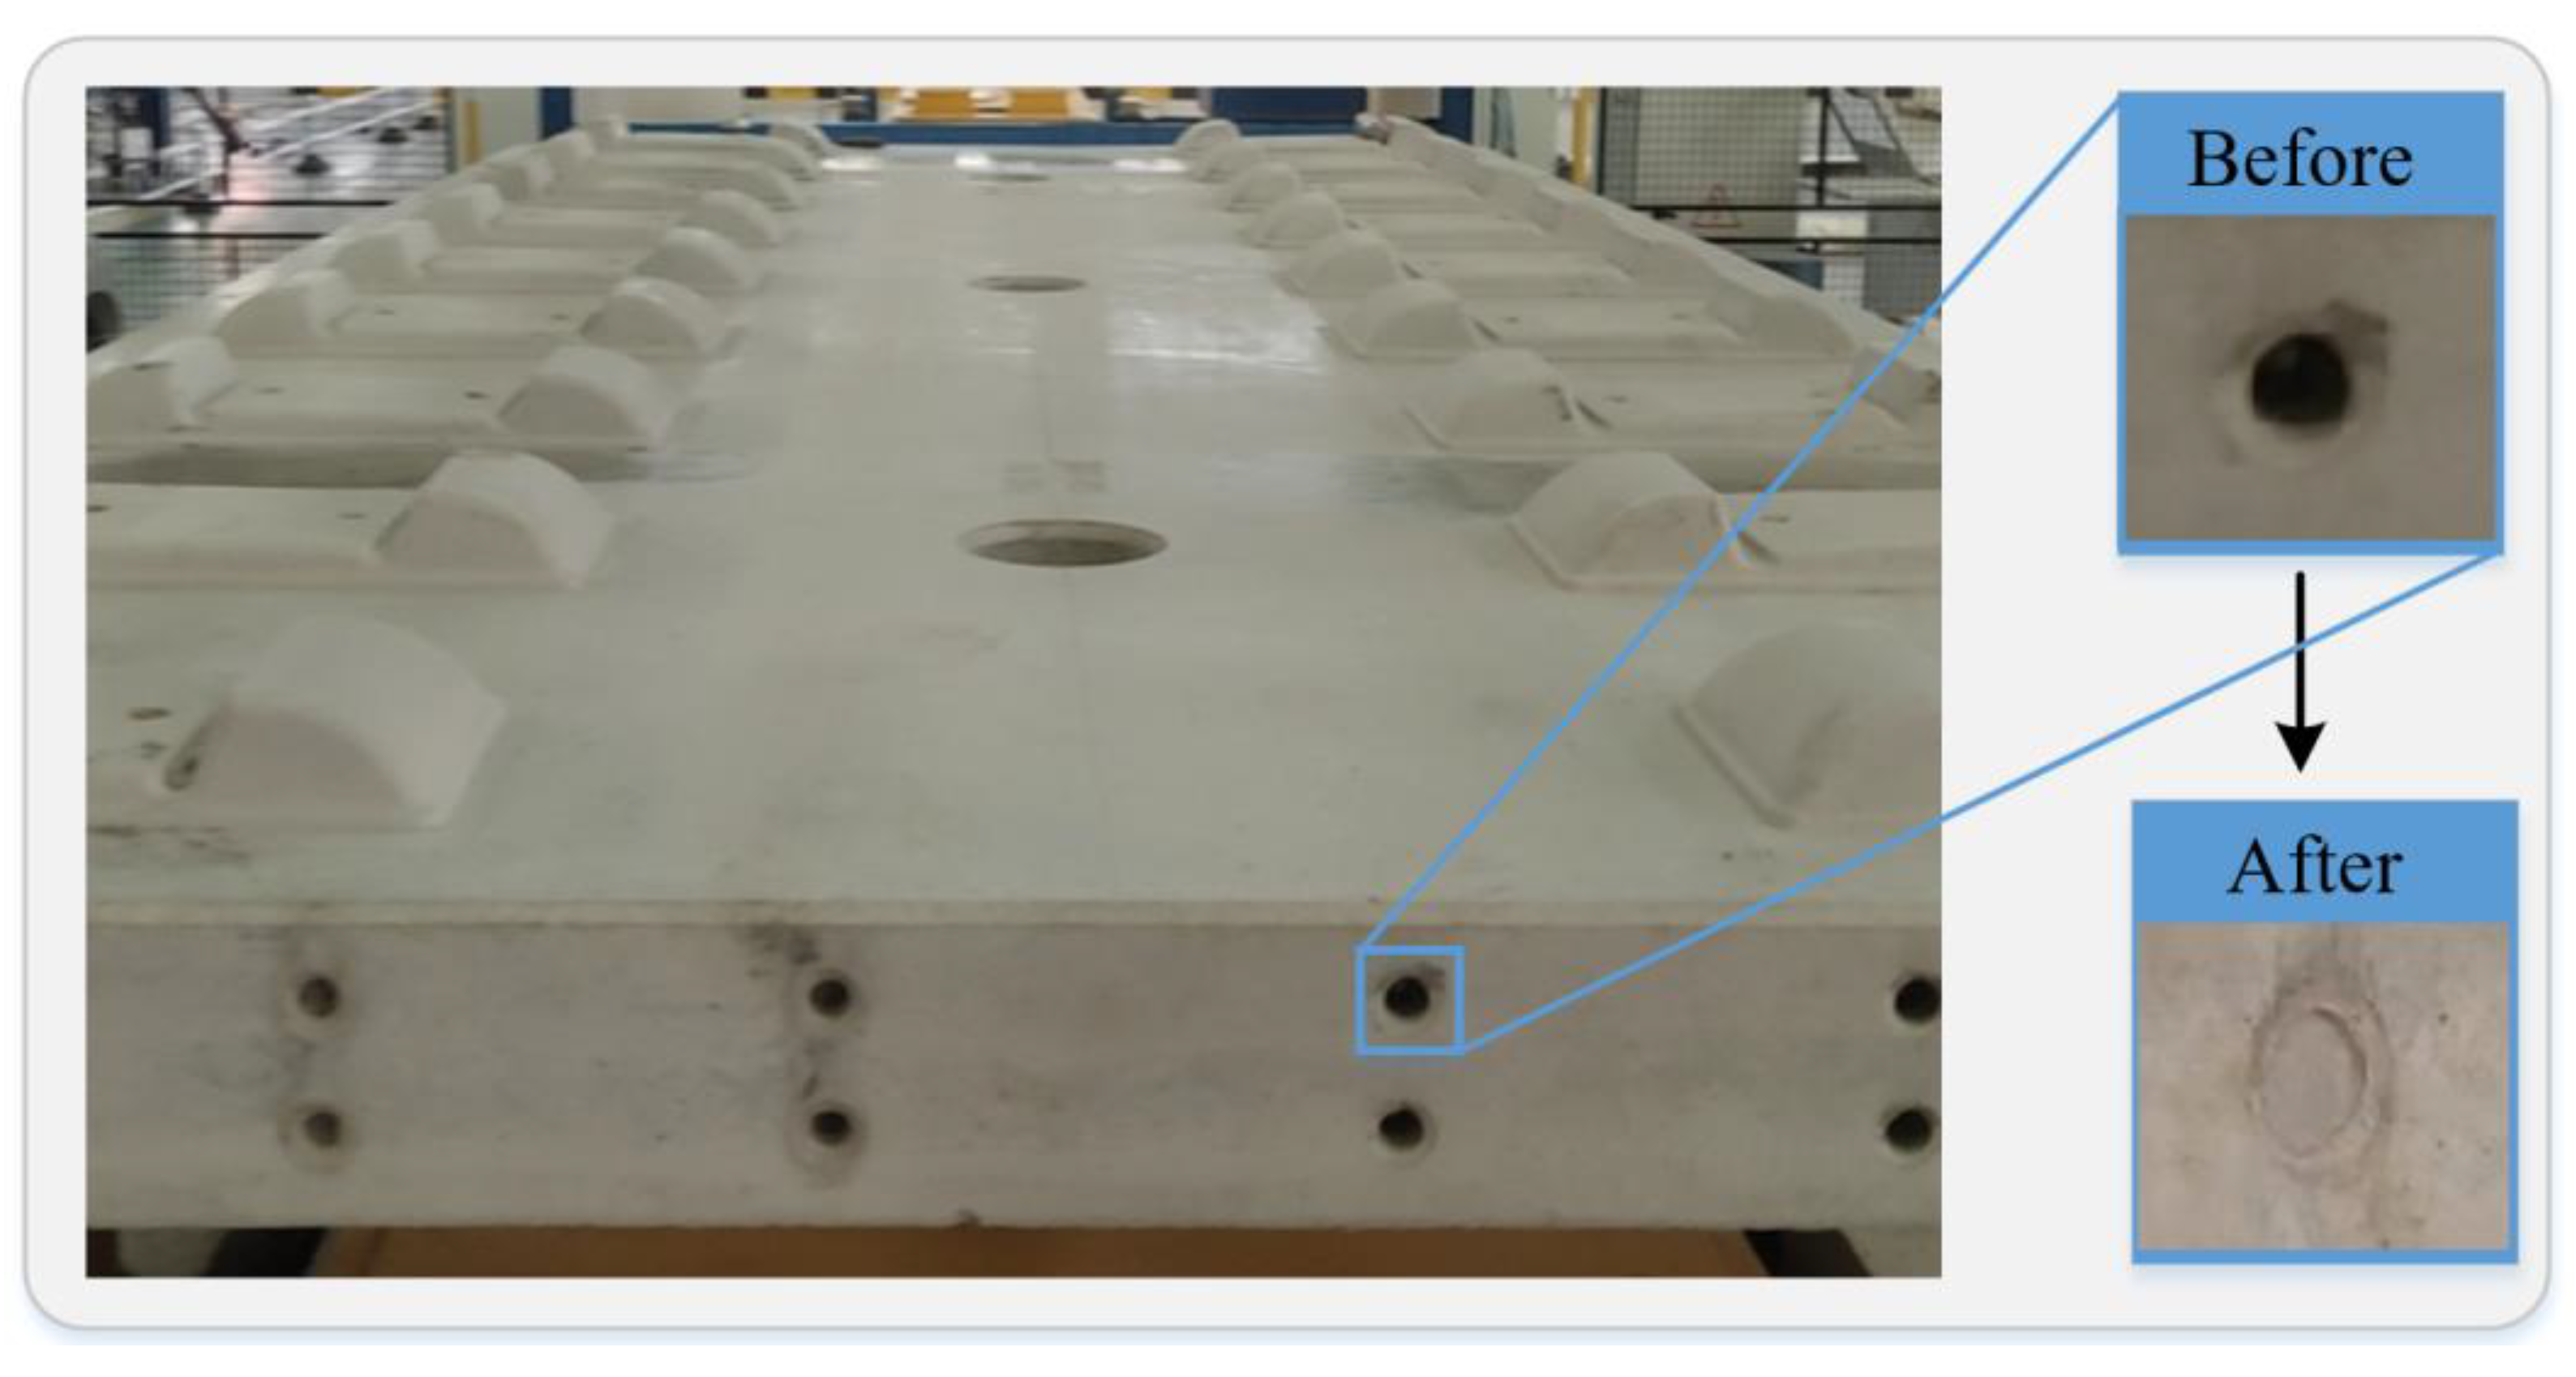
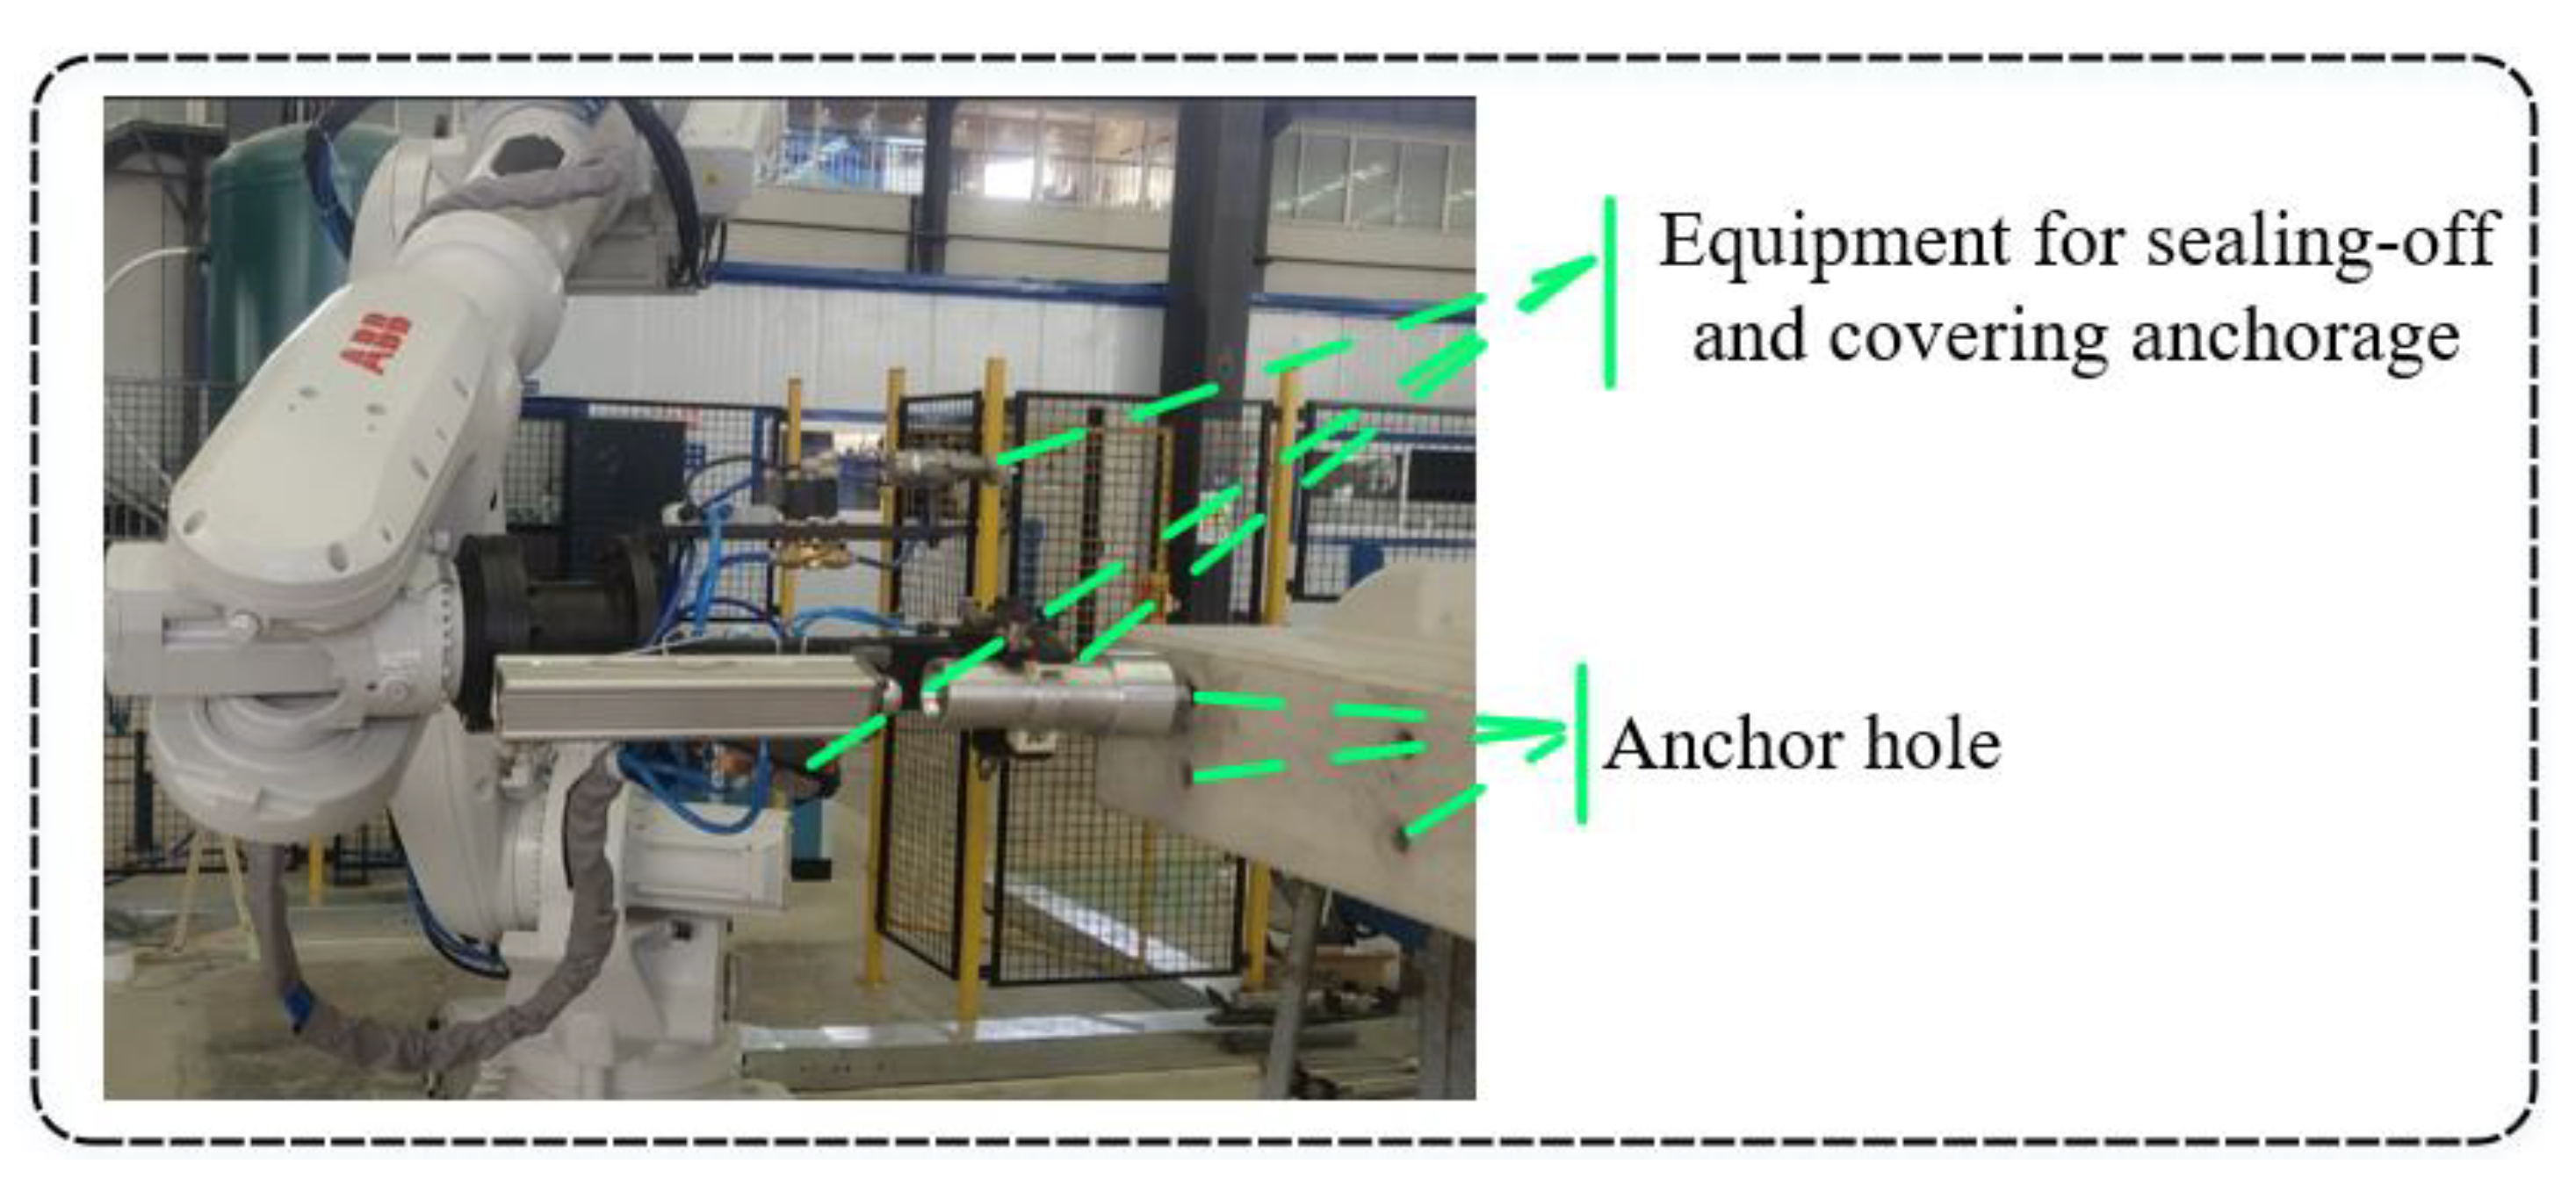
  • We design a novel automated anchor sealing platform based on vision guidance to reduce labor costs and improve product quality (Section 2.1);
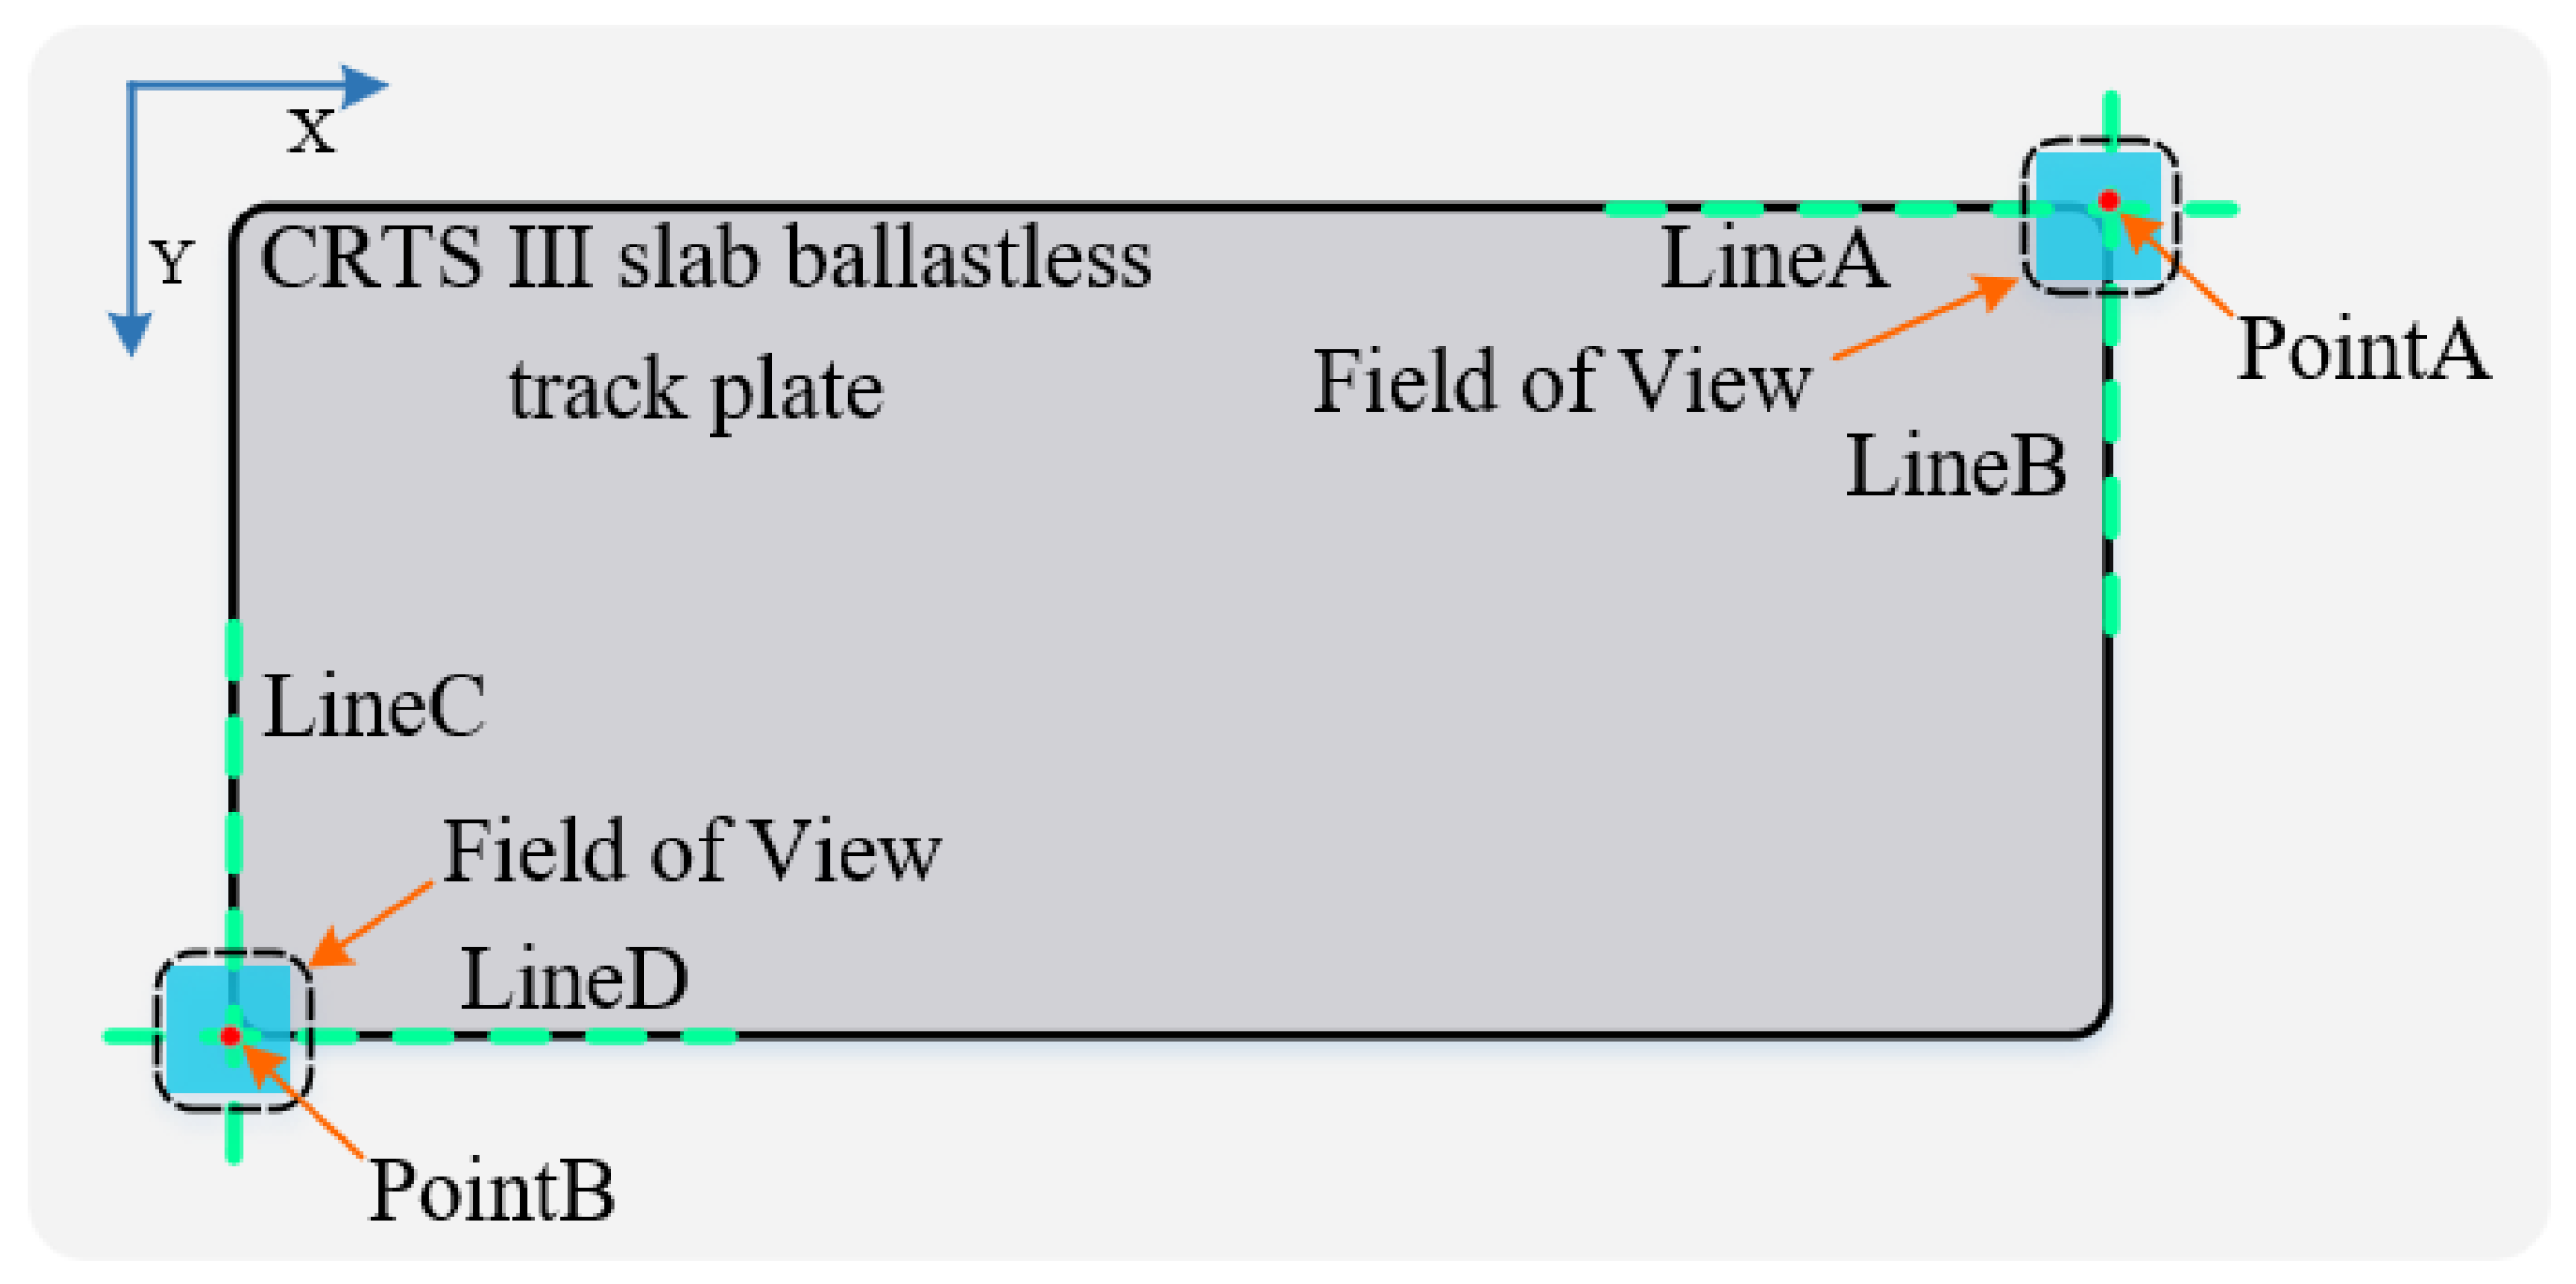
  • We establish an efficient, accurate, and simple method for locating the CRTS-III slab ballastless track plate based on the edge feature points (Section 2.2);
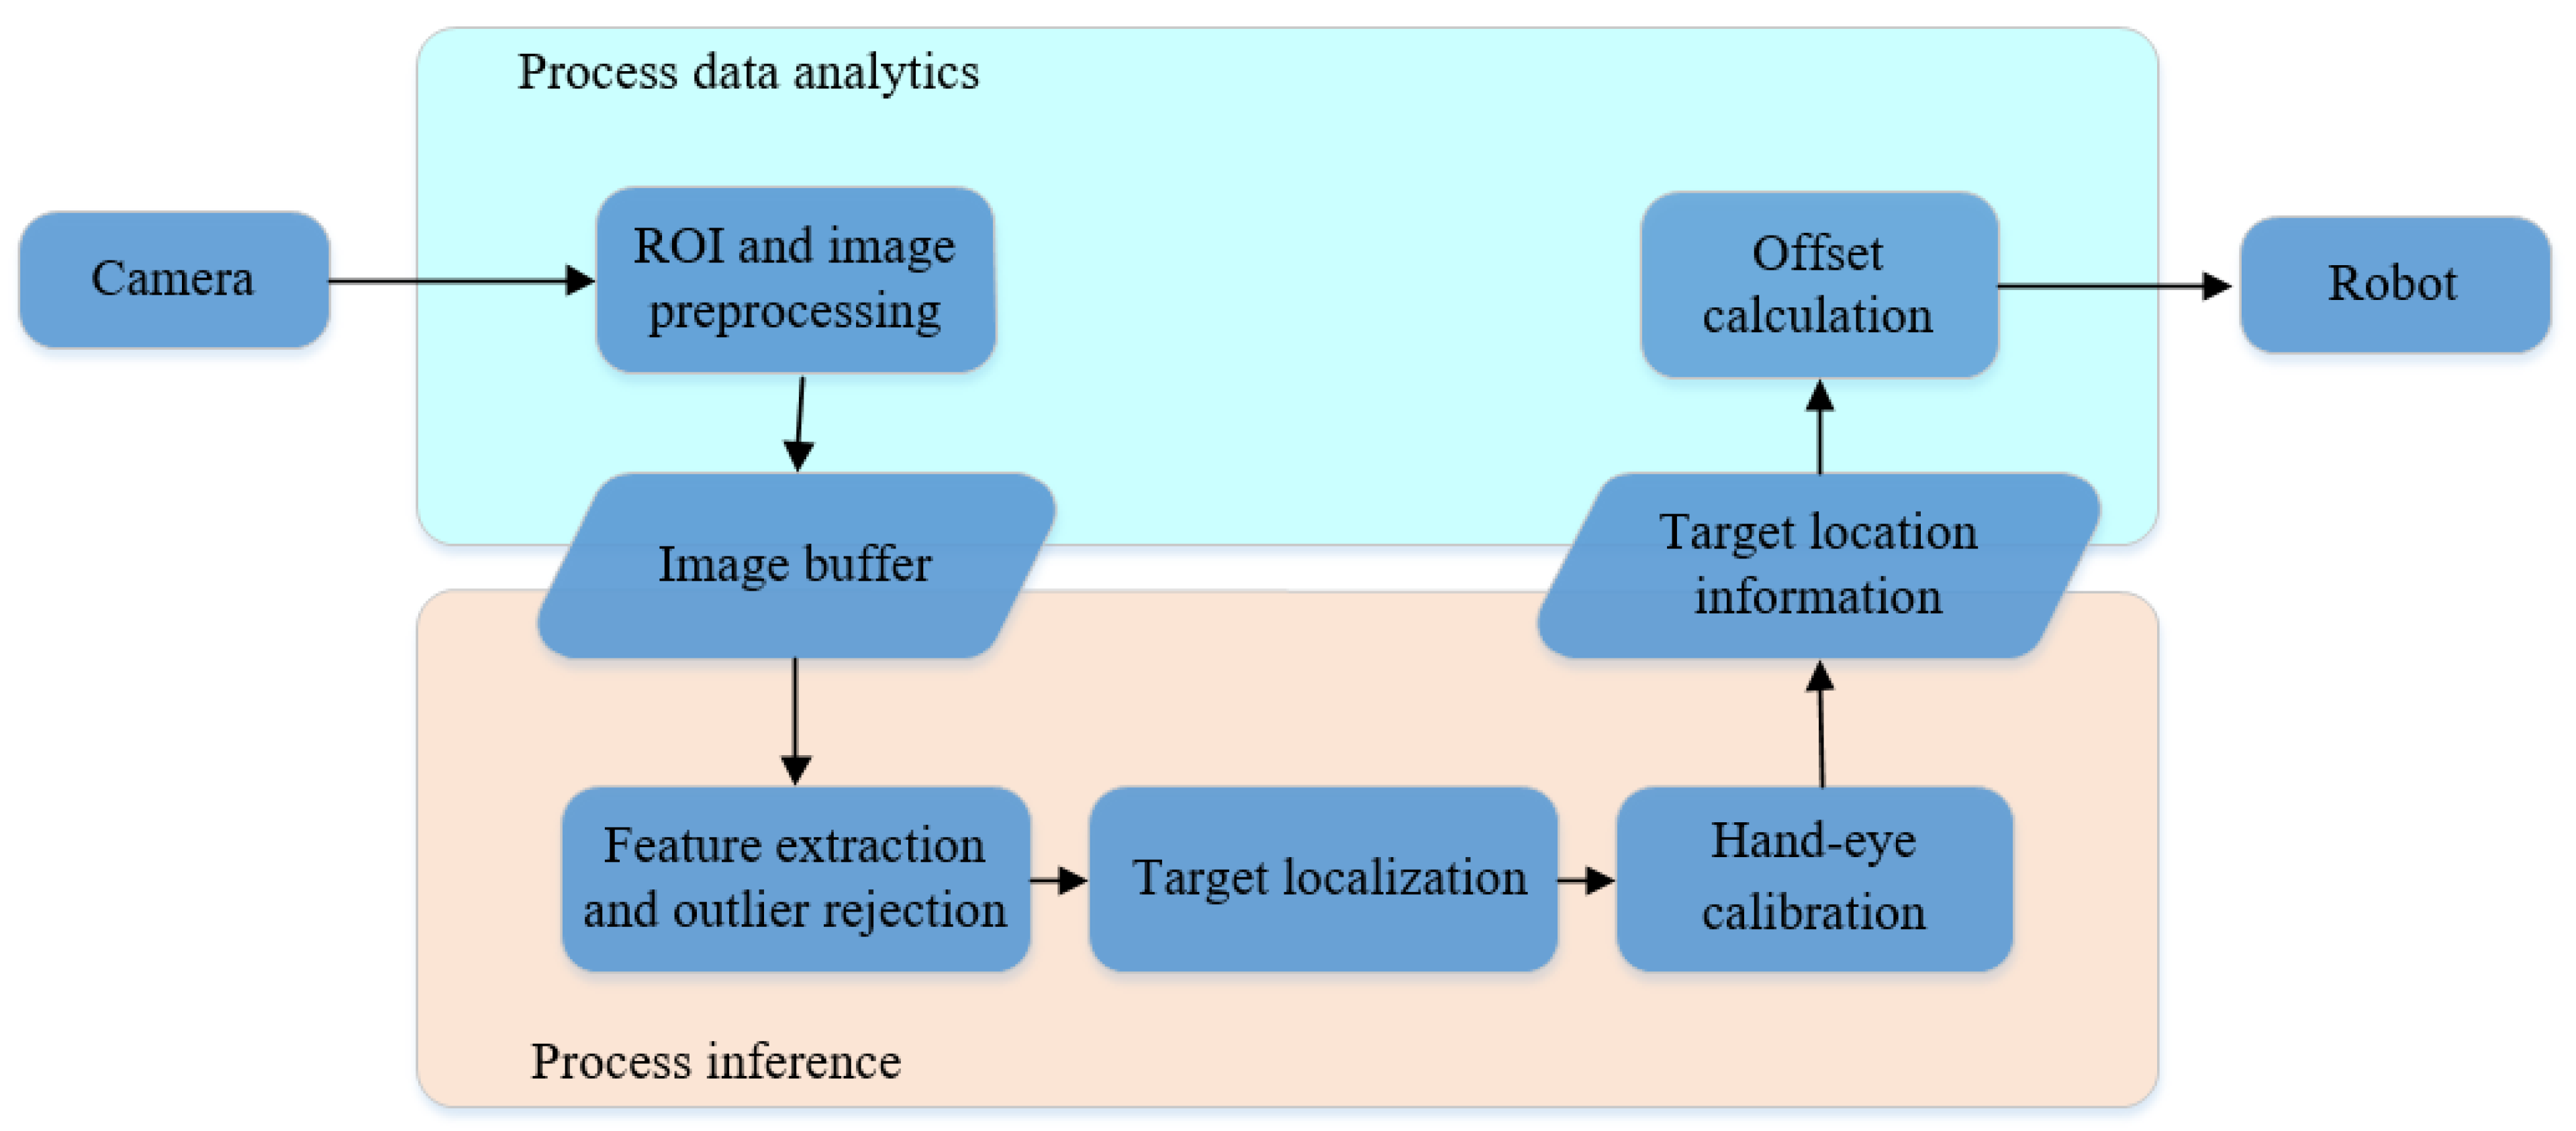
  • We design and implement an affordable visual localization system based on monocular camera and machine vision software in the anchor sealing platform to correct the robot end coordinate system. Furthermore, we evaluate the system’s effectiveness in a production environment (Section 3).

2. Materials and Methods

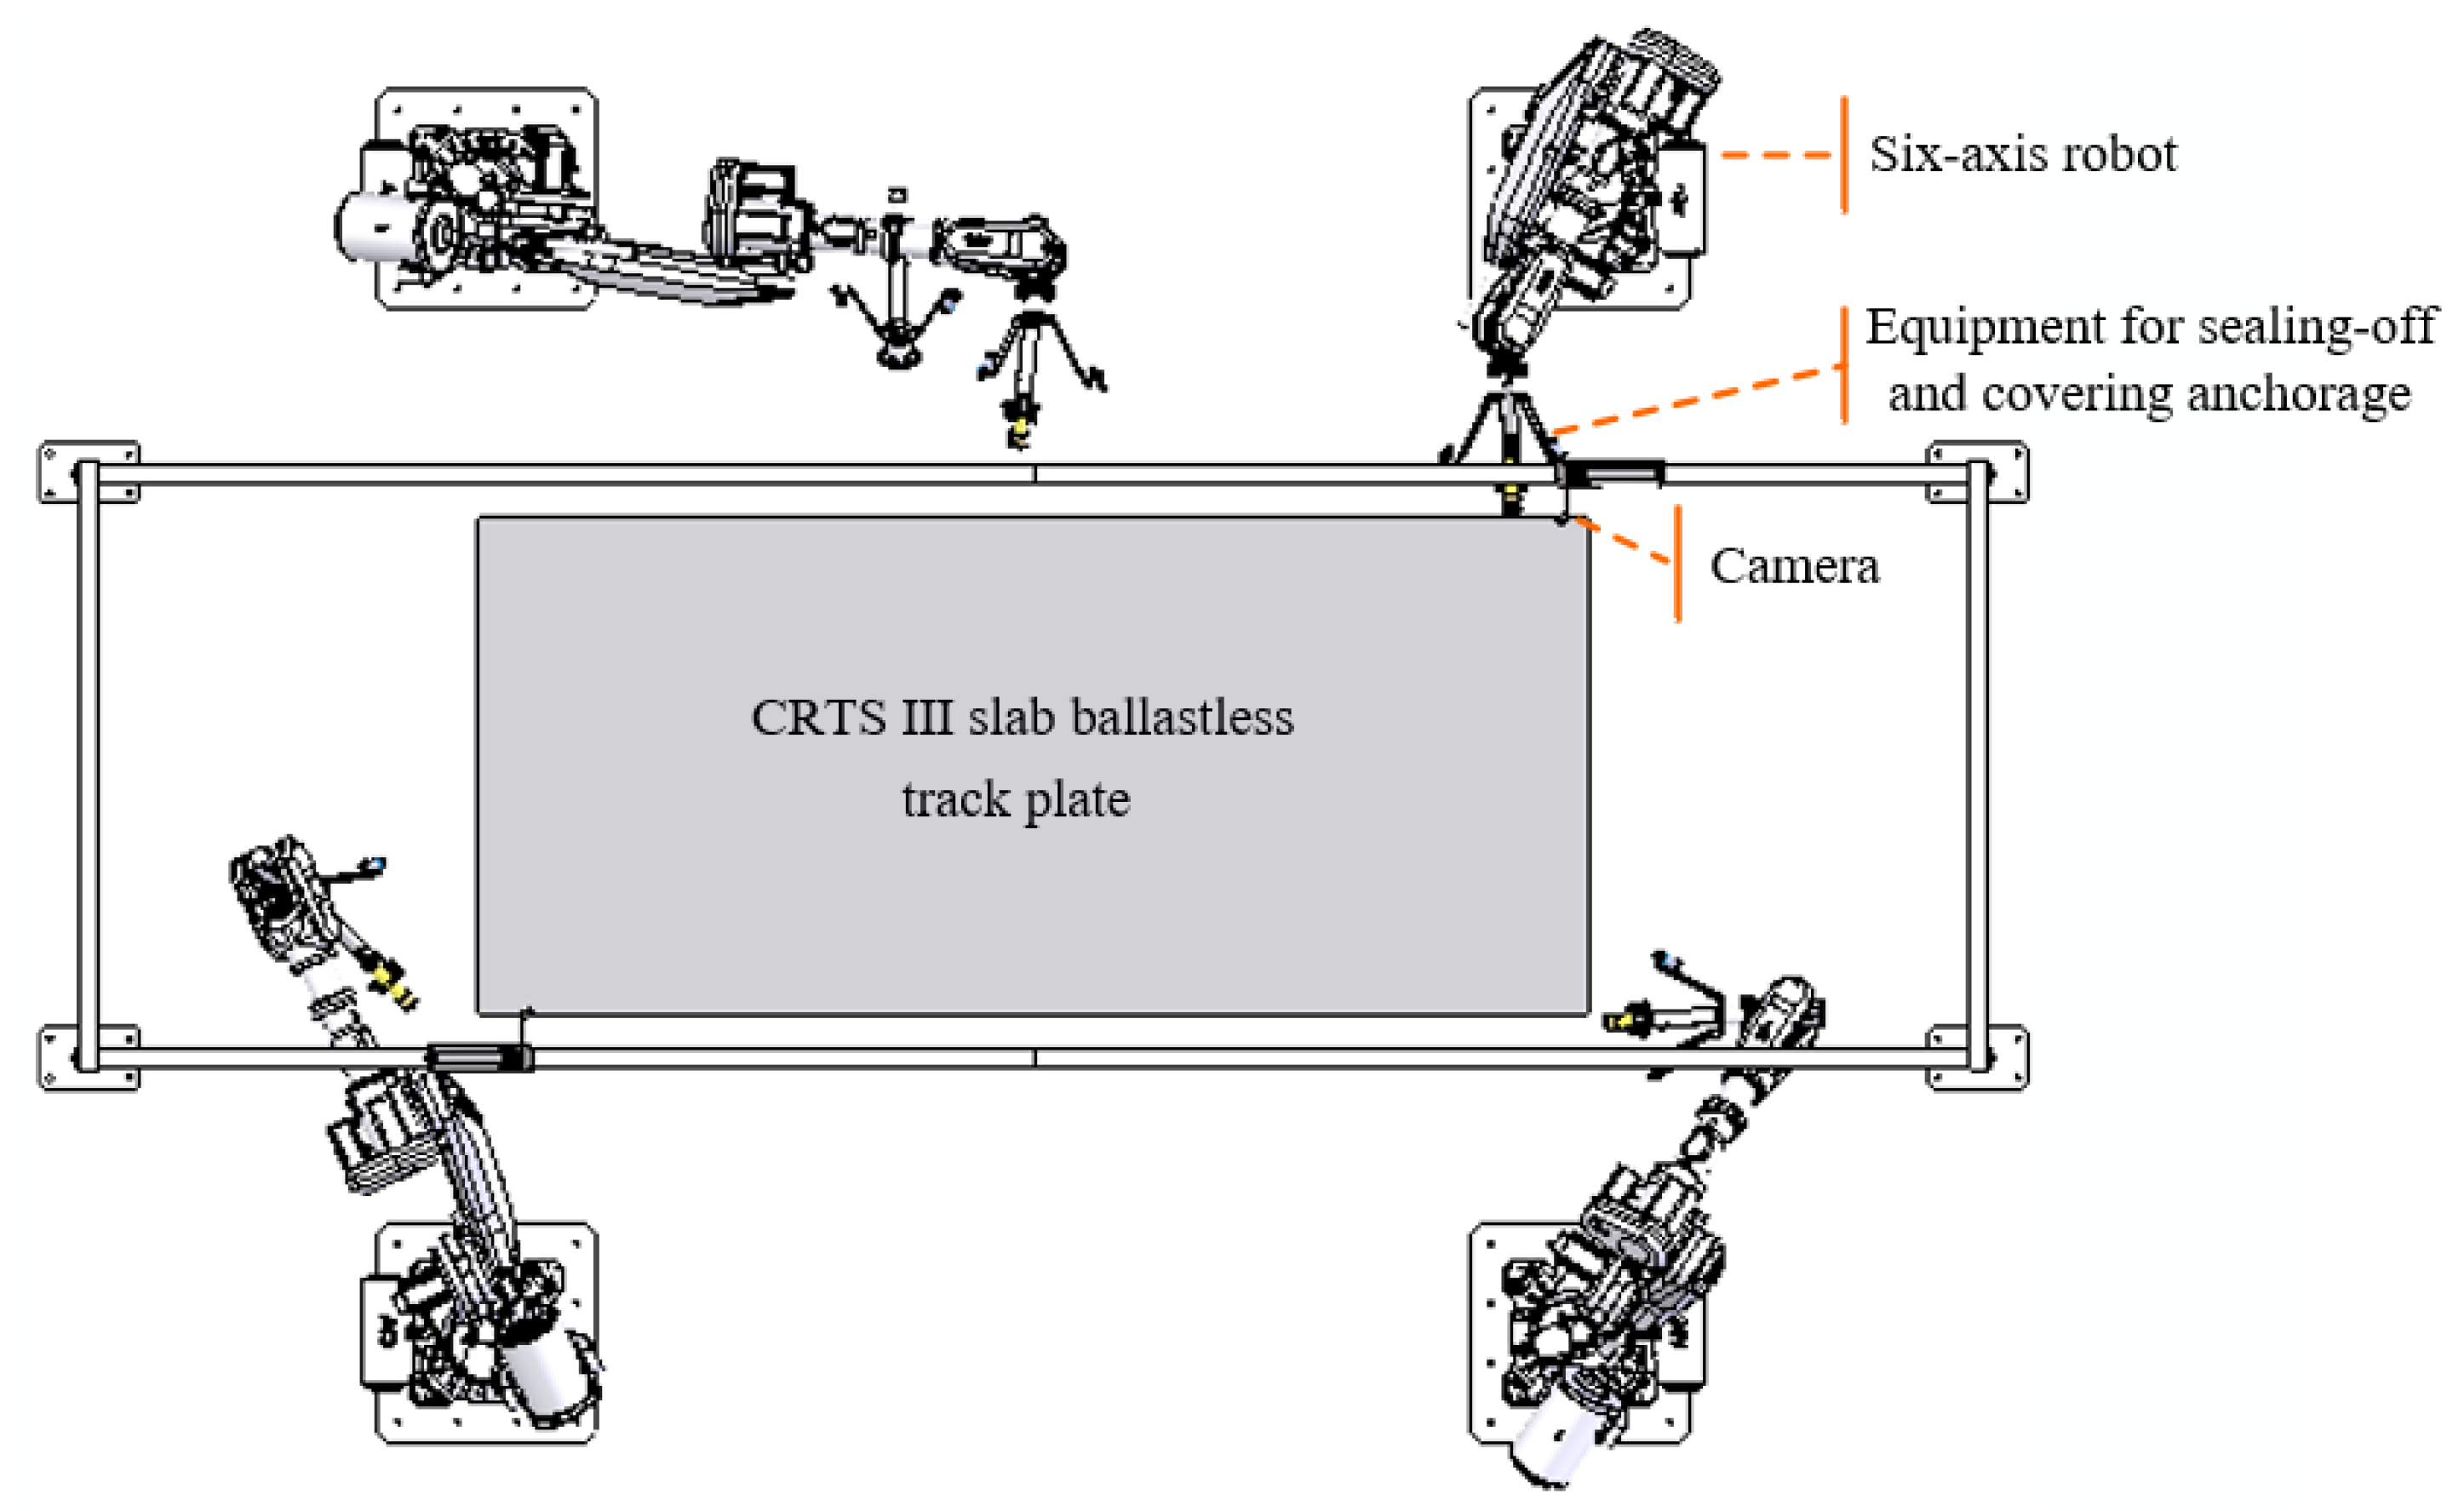
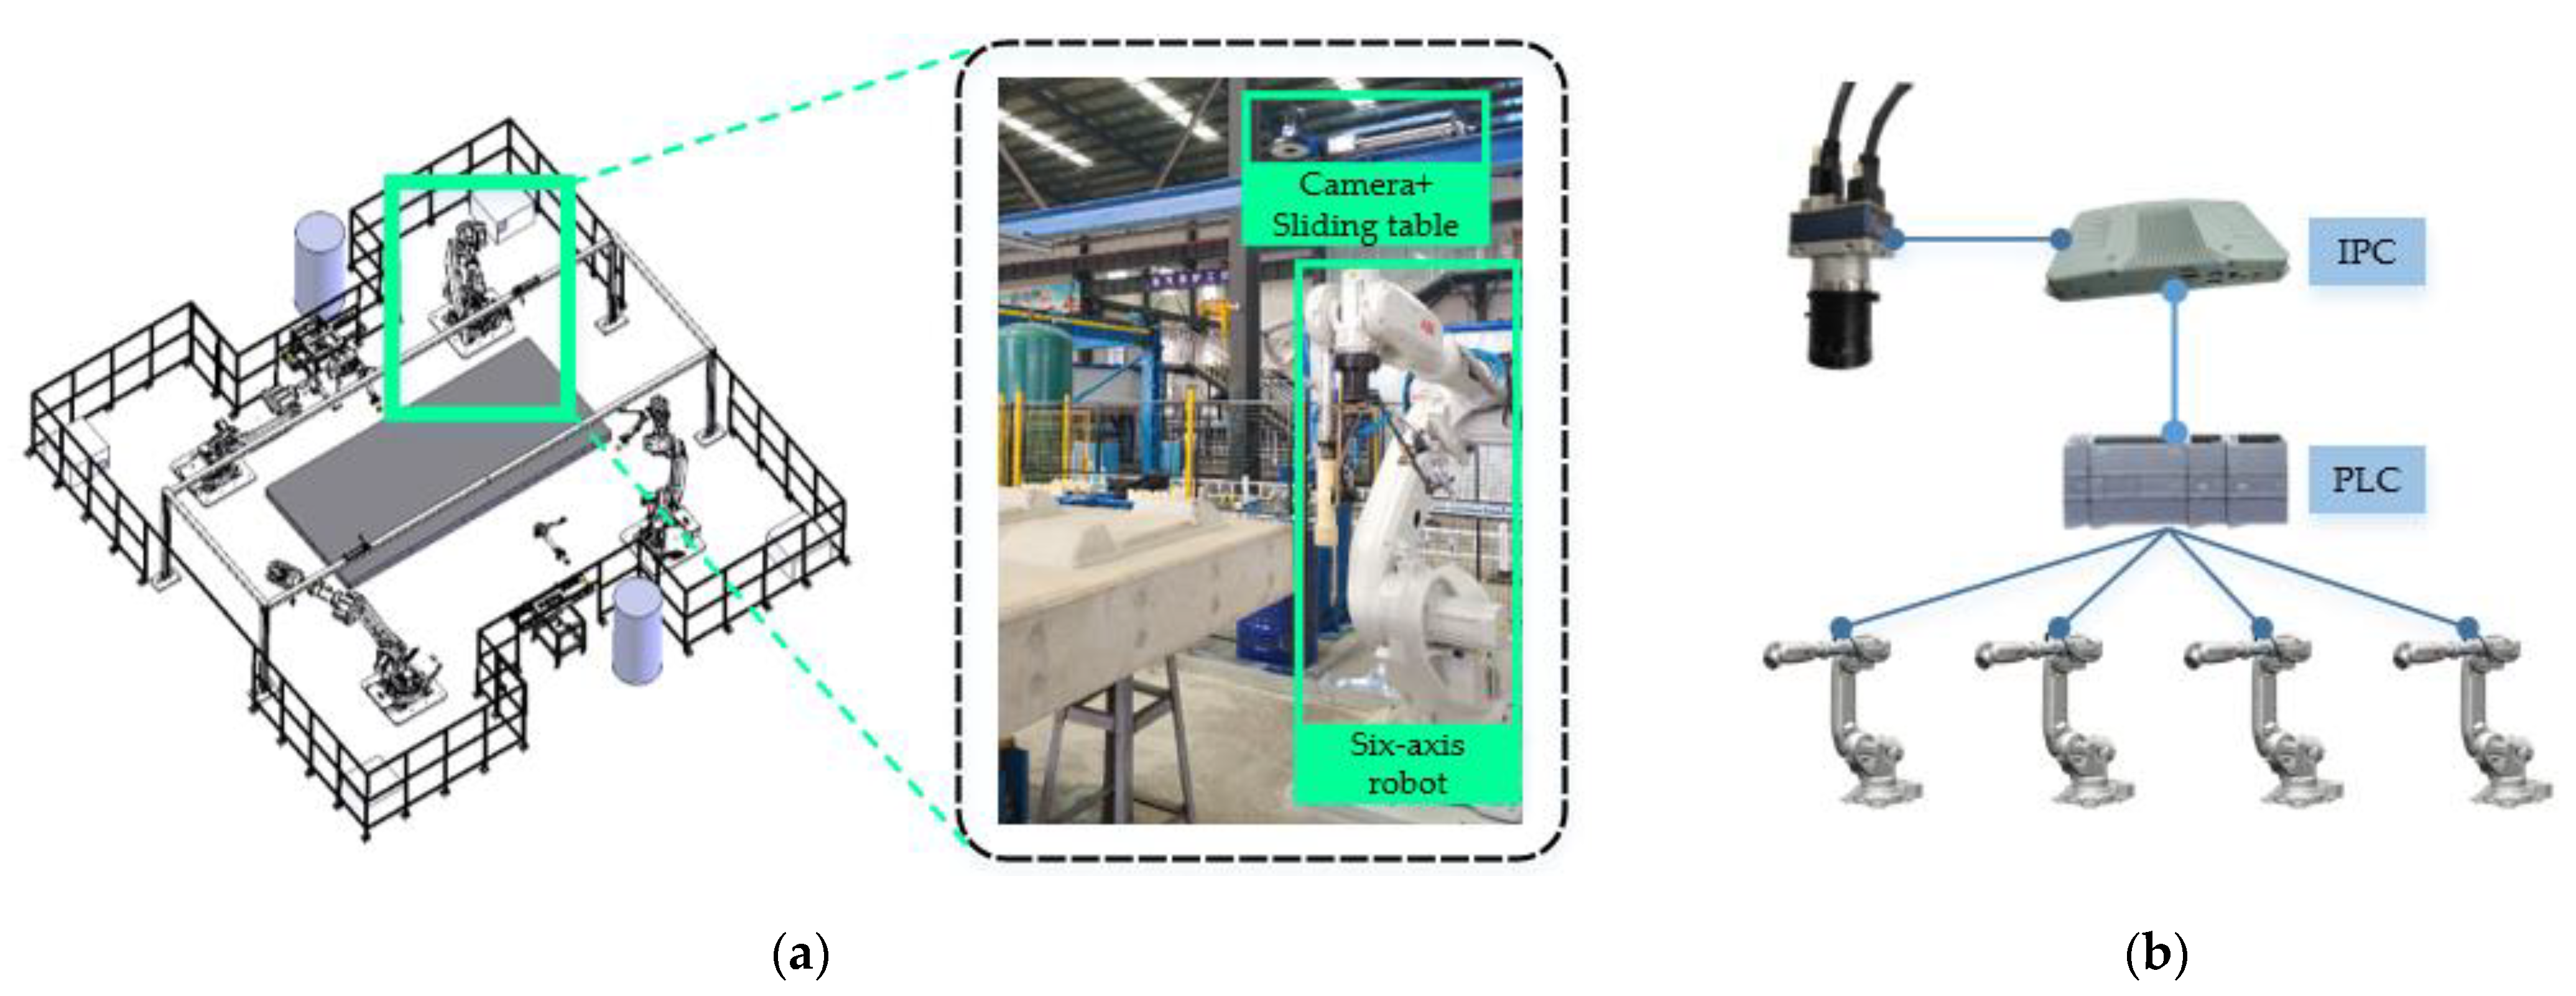
2.1. Platform Overview

Vision guidance technology is currently a research area of interest in robotics, enhancing industrial robots’ intelligence and environmental adaptability [13,14]. To accomplish the automated anchor sealing task during the production of the CRTS-III slab ballastless track plate, we design the anchor sealing platform with four six-axis robots as the actuator and two industrial cameras as the detector, as shown in Figure 2. Considering the size of the track plate and the robot’s arm span, we use four six-axis robots to work together. Each robot is equipped with a glue gun and an electric grinding head for anchor sealing.
To improve the stability of the robot in the working process, we implement the robot’s working path planning at the reference position through the teach pendant. However, this approach is demanding on the track plate position, and the robot has difficulty coping with significant deviations from the track plate position. Therefore, it is necessary to introduce vision guidance technology to detect the displacement and rotation volume of the current track plate position compared to the reference position in real time. The end coordinate system of the robot can be adjusted in real time according to the amount of displacement and rotation.

2.2. Visual Localization Method Design

Due to the large size of the CRTS-III ballastless track plate, it is difficult for the camera’s field of view to cover all of it. Therefore, to ensure the high positioning accuracy of the system, this paper adopts a method to precisely locate the key local position of the target and use it to infer the position information of the whole track plate. The schematic diagram of the vision system localization principle is shown in Figure 3. To reduce the measurement error of using a single monocular camera [15], we use a dual monocular camera design. The blue rectangle area in Figure 3 shows the field of view of the two cameras. We use a convenient and efficient image processing method for each target image to obtain approximate straight lines for the two edges of the track plate (e.g., lines A and B in Figure 3). According to the intersection point ( x , y ) and the tilt angle θ of the lines, we could obtain the displacement and rotation volume of the current track plate compared to the reference position. Moreover, the final detection result ( x C , y C , θ C ) is equal to the mean of the deviations in both images, as:
{ x C = [ ( x A x A ¯ ) + ( x B x B ¯ ) ] / 2 y C = [ ( y A y A ¯ ) + ( y B y B ¯ ) ] / 2 θ C = [ ( θ A θ A ¯ ) + ( θ B θ B ¯ ) ] / 2 ,
where ( x A , y A , θ A ) and ( x B , y B , θ B ) are the detection values of P o i n t   A and P o i n t   B , and ( x A ¯ , y A ¯ , θ A ¯ ) and ( x B ¯ , y B ¯ , θ B ¯ ) are the reference values.
More specifically, the data flow is shown in Figure 4, which depicts the logical model and the data transformation of the visual positioning system. The vision localization system collects data from the camera as the input to the system and finally transmits the position data to the robot. The central part of the system consists of two processes: the data analysis process and the data inference process. The data analysis process is mainly responsible for providing pre-processed data for the data inference process and reprocessing the results obtained from the data inference process. The data inference process is accountable for target localization and mapping the position information in the image coordinate system to the robot base coordinate system.
During the execution of the program, the data processing process is as follows. The data analysis process first selects the ROI containing the target to be detected in the high-resolution image to reduce the amount of data. Further, after data pre-processing of the extracted ROI regions, the processing results of multiple ROI regions are saved to the image buffer. The inference process reads the image information from the image buffer, extracts the key feature points, eliminates the outliers, and achieves the target localization according to the inliers. If the result of the target location is within a reasonable range, then this detection is successful. Otherwise, it needs to be re-detected. Moreover, the hand–eye relationship matrix obtained by the hand–eye calibration completes the coordinate mapping under different coordinate systems. The target position information in the base coordinate system of the robot is submitted to the data analysis process. The deviation of the current detected position information from the base position is calculated and sent to the robot to realize the adjustment of the robot end coordinate system. The remainder of this subsection describes the implementation details of each process in detail.

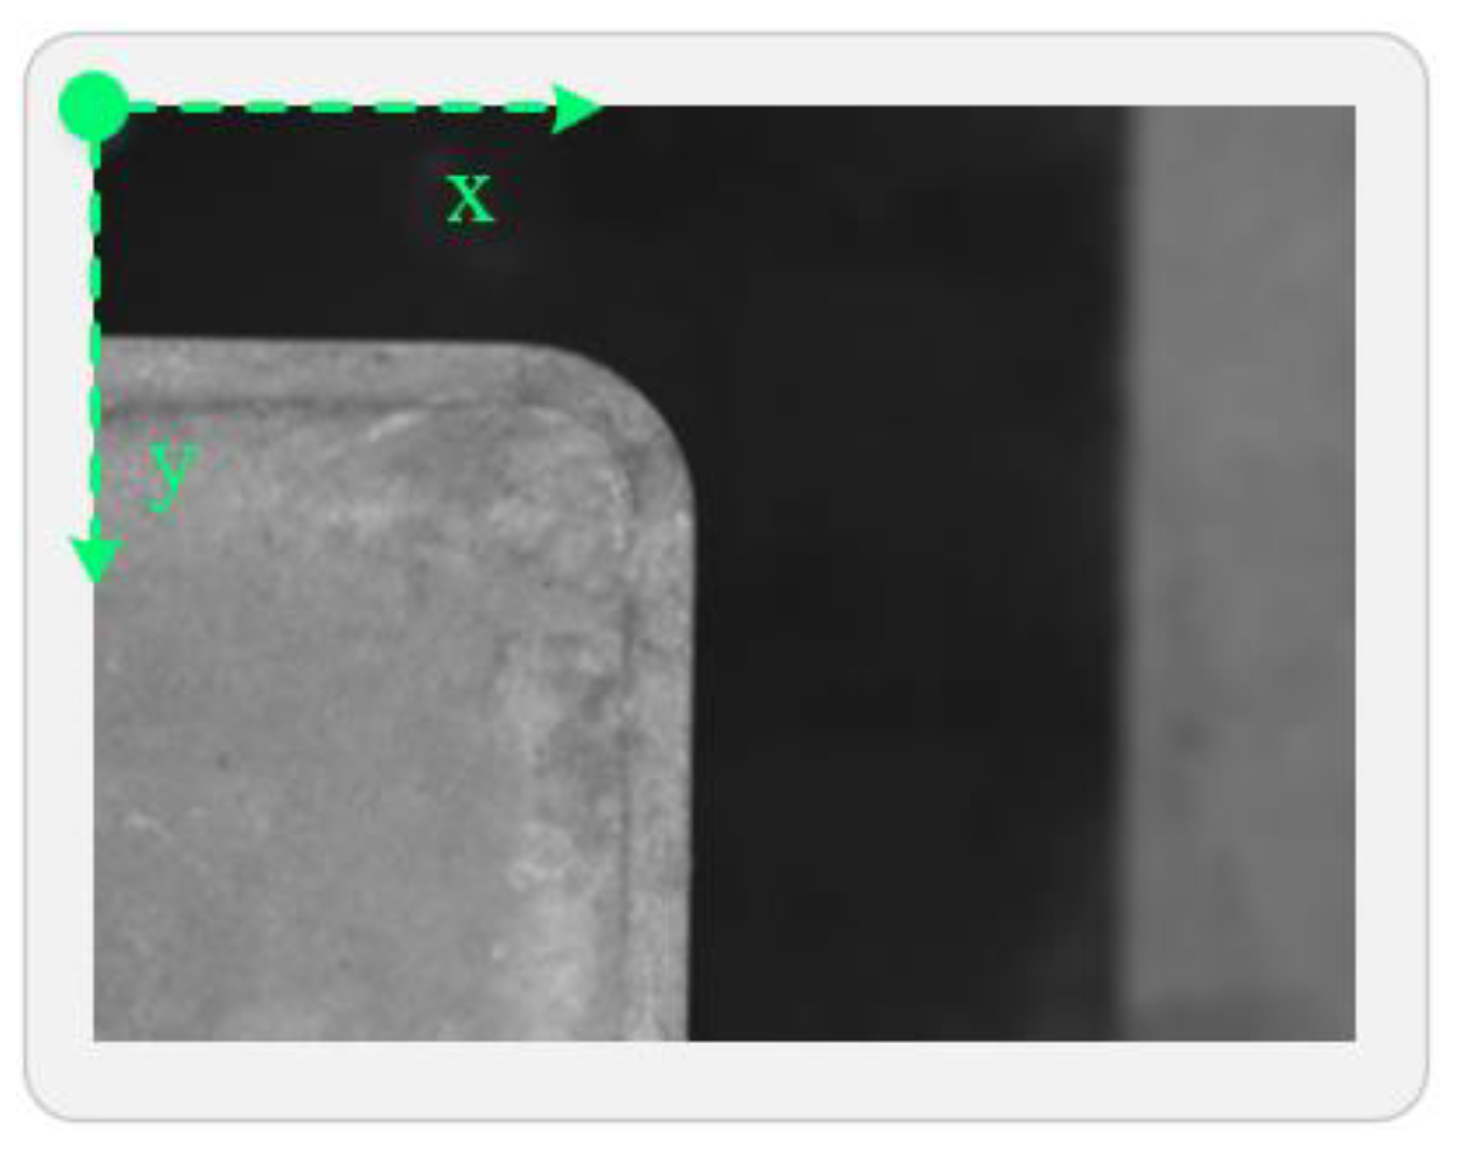
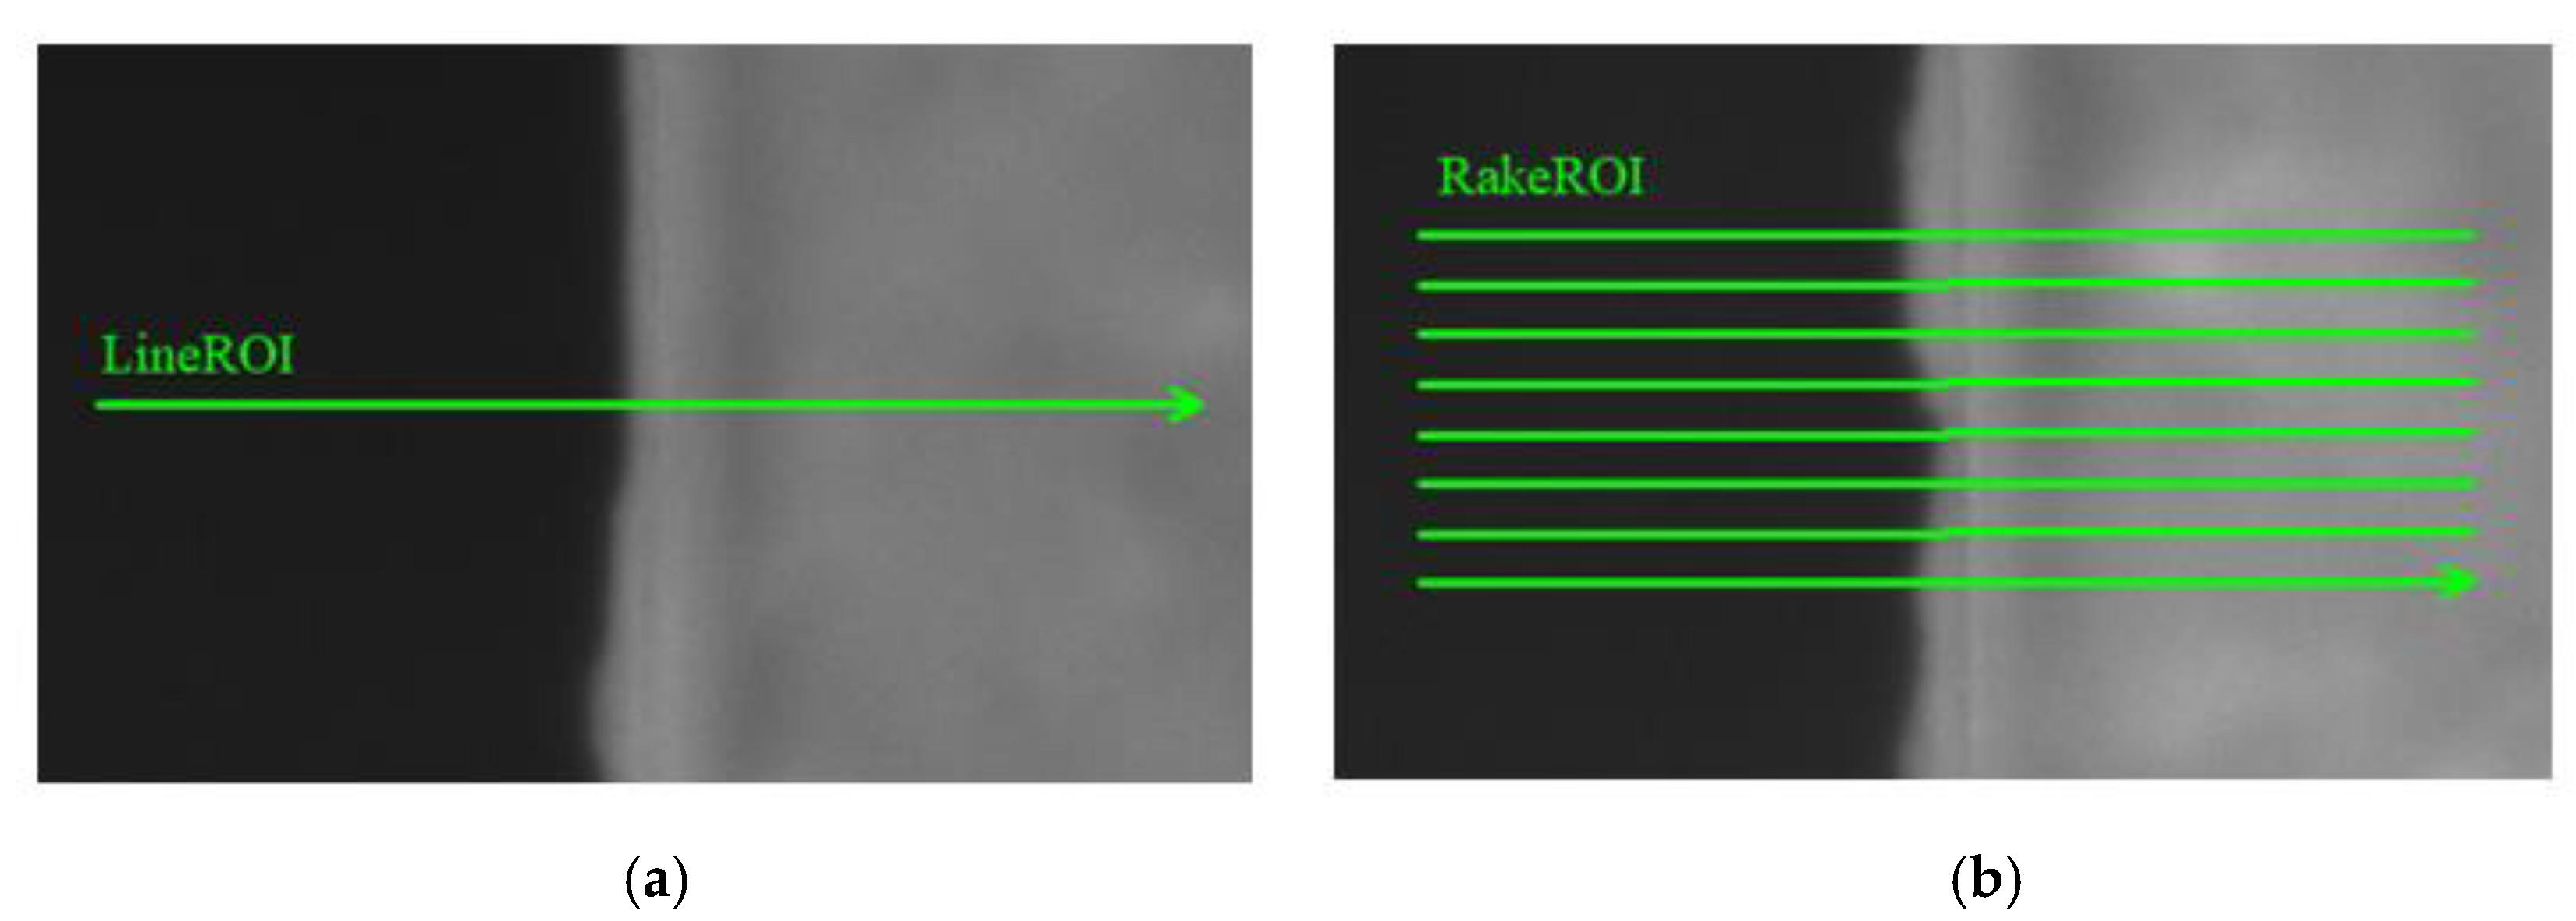
2.2.1. Region of Interest

Figure 5 shows a sample image taken from the upper right field of view in Figure 3. We noticed that the size of the target to be detected was only about 1/3 of the whole image, and there was a large amount of irrelevant data in the image. Therefore, it is necessary to set the ROI to extract the area of focus in the image before the subsequent image processing [16]. In machine vision, the form of ROI usually includes rectangles, circles, ellipses, irregular polygons, and so forth [17]. However, if we use a closed graph, such as a rectangle, to select the ROI, we still retain a large amount of useless information inside the target. Therefore, to further reduce the computational volume, this paper adopts Rake ROI, which is a kind of region of interest based on Line ROI. Line ROI is shown in Figure 6a, and the specific presentation of Rake ROI is shown in Figure 6b. Rake ROI can be regarded as a series of Line ROI of the same size equally spaced combinations.
Using Rake ROI to extract regions of interest in an image can significantly reduce the arithmetic power demanded by image processing algorithms for image processing devices and reduce the configuration cost of hardware. Assuming that the original size of the whole image is W × H and the size of the Line ROI is 1 × N , where N is the number of pixels contained in the Line ROI, the number of pixels contained in a Rake ROI with k Line ROI is k × N . Consider the case where the line segments of the Rake ROI are horizontal, as shown in Figure 6b, where N W and   k < < H . In this system, we set the image resolution to 4912 × 3688 . Depending on the value of k , H / k can be taken in the tens or even hundreds. In other words, using Rake ROI can compress the computational effort tens or even hundreds of times compared to using rectangular ROI.

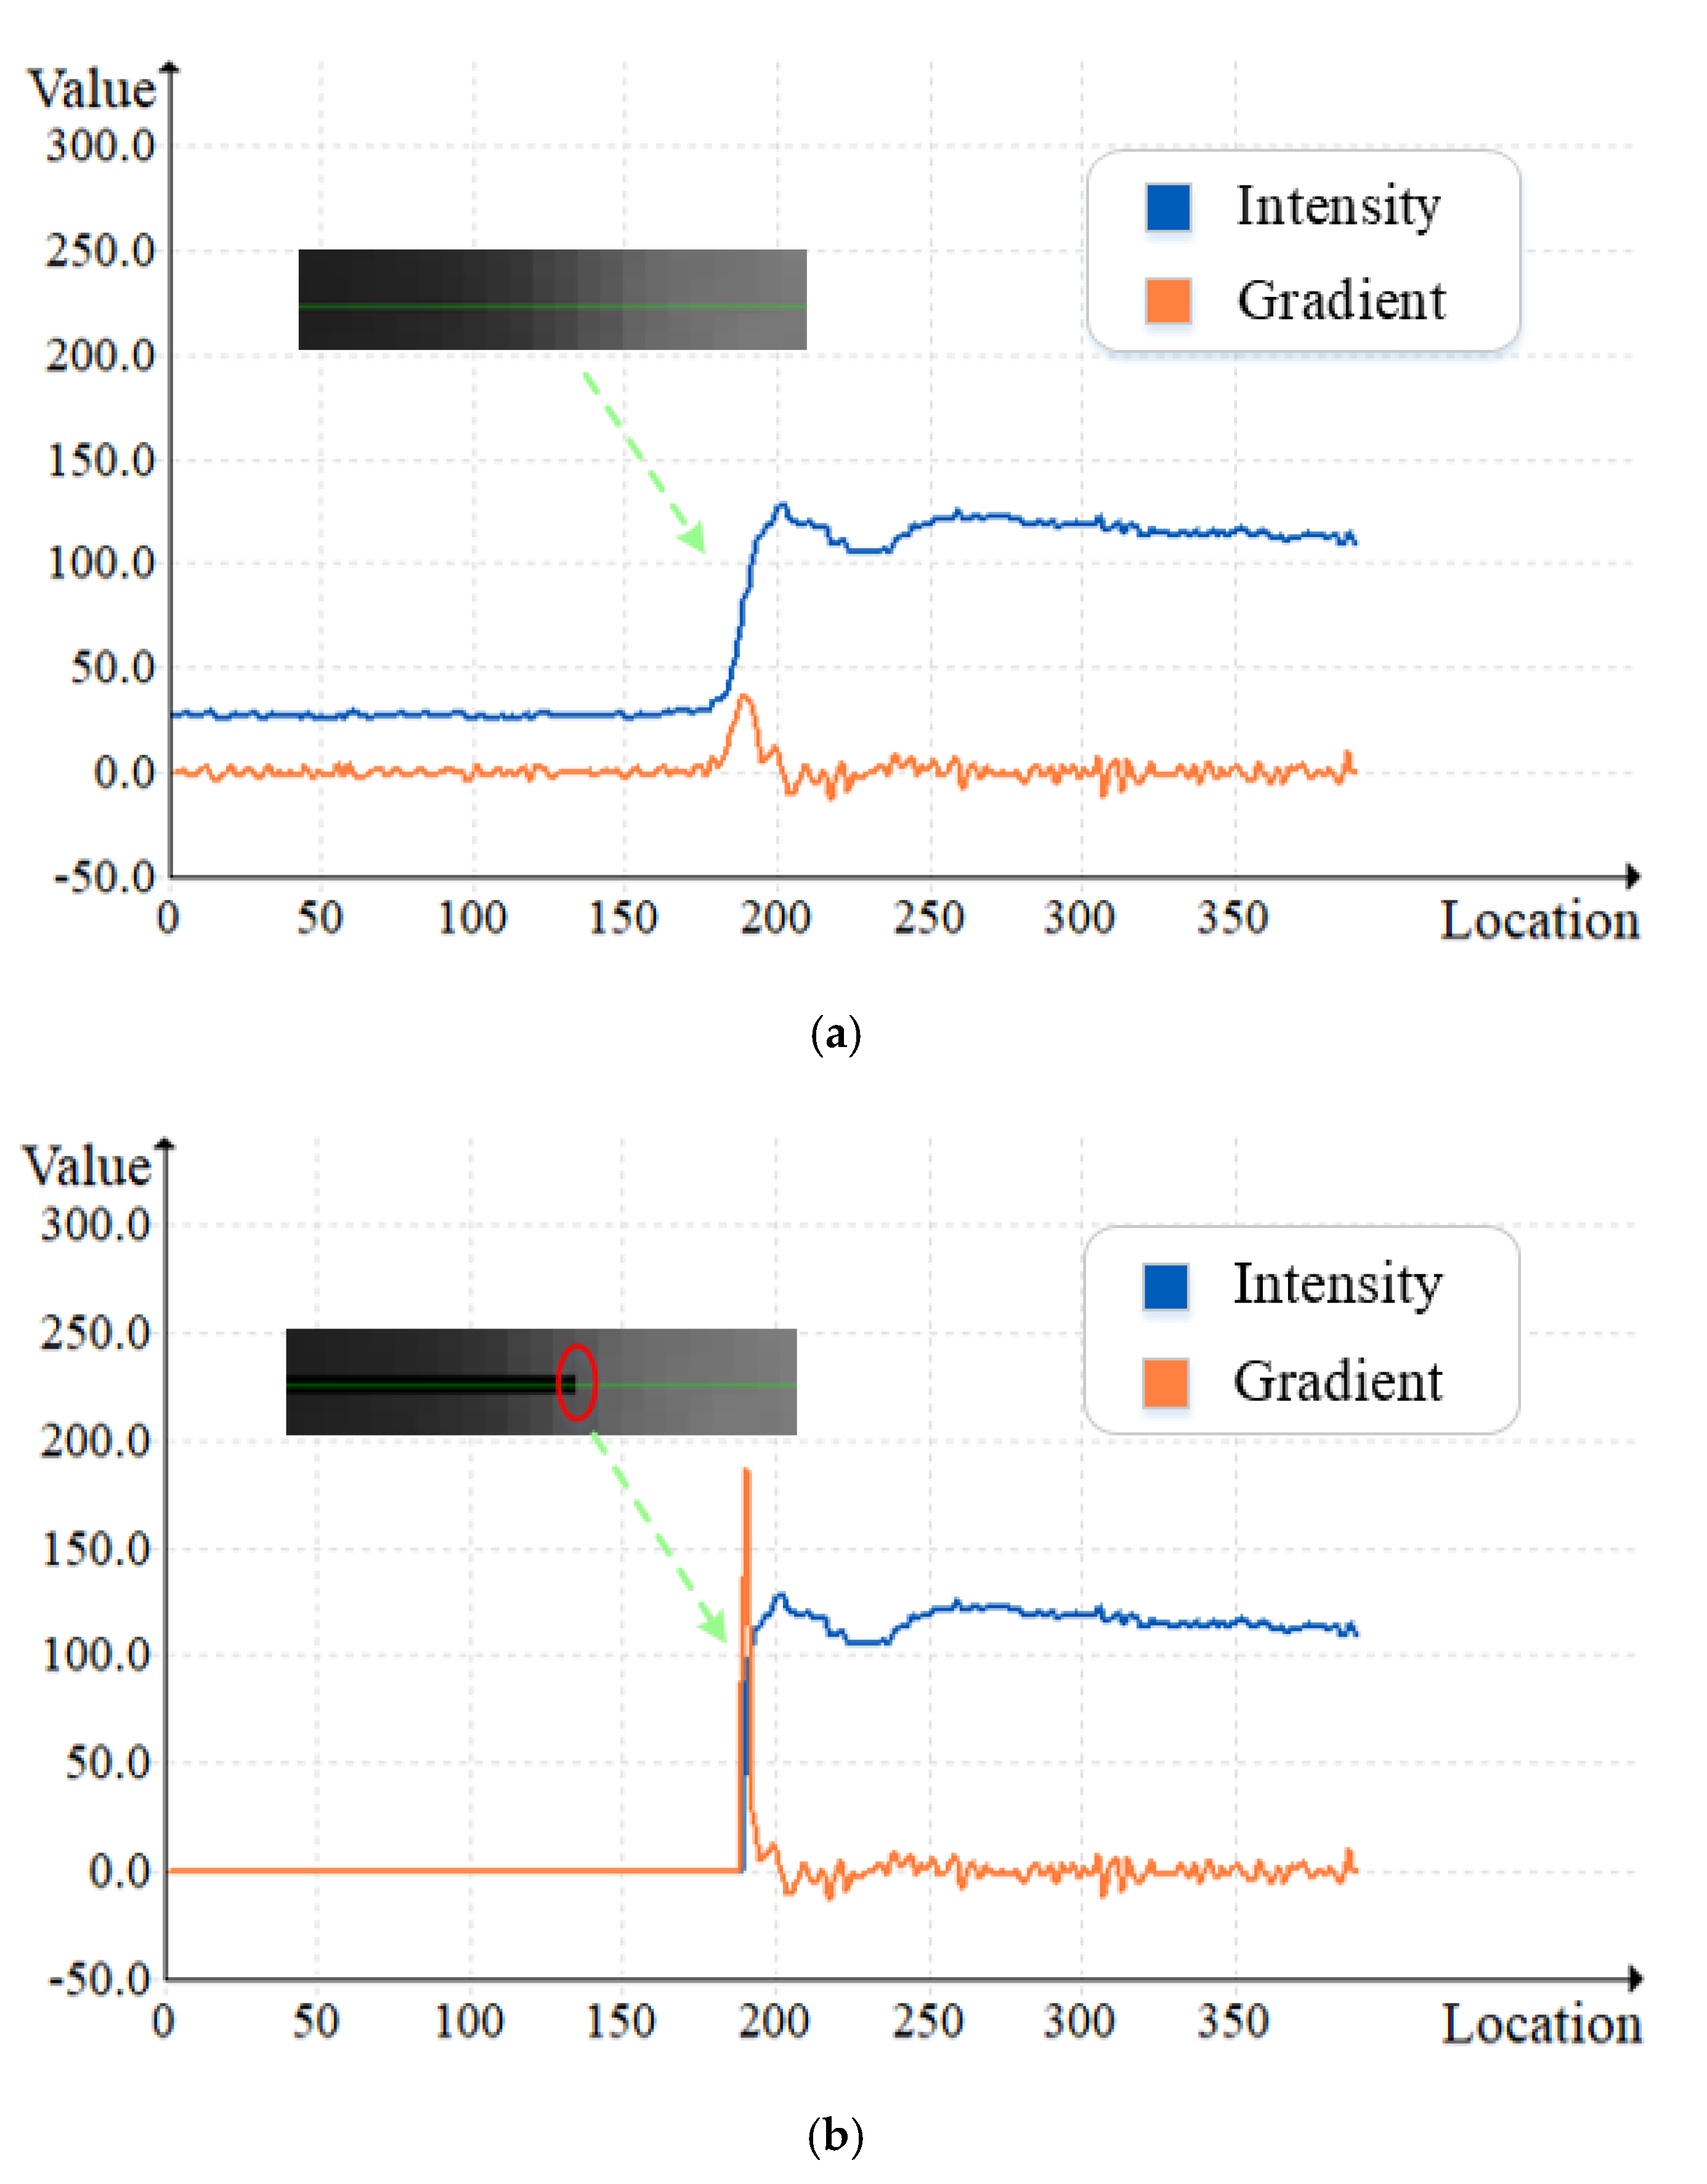
2.2.2. Image Preprocessing

In practice, the edges of the images obtained are usually blurred and noisy due to limitations in the camera focusing mechanism, the electronics of the imaging system, and environmental factors such as illumination [18]. In this case, the edge is modeled as a slope closer to the grayscale slope, which is shown schematically in Figure 7. The curve in Figure 7 depicts the variation in pixel grayscale values in the 1 × 390 region covered by the Line ROI in Figure 6a, where the interval [180, 200] roughly corresponds to the junction between the background region and the target object in the image when the edge point could be any point in the slope.
To improve the accuracy of feature point extraction, it is necessary to threshold the foreground and background of the image to transform the slope model into a step model [19]. Threshold segmentation works by selecting a gray value as the segmentation threshold T for region segmentation based on the gray scale characteristics of the image and separating the foreground and background according to the threshold T to obtain a binarized image [20]. Current mainstream threshold segmentation methods can broadly be classified into fixed thresholding methods and adaptive thresholding methods [21,22]. The fixed thresholding method is based on the histogram wave characteristics of grayscale to select a fixed threshold value, which is suitable for scenes with an apparent distinction between foreground and background. However, noise, light changes, and uneven light distribution often disturb the image acquisition. The fixed threshold cannot be dynamically adjusted according to the field environment. Therefore, this paper adopts the more flexible OTSU algorithm [23], which does not need to introduce additional parameters and automatically determine the optimal threshold in a mathematical sense based on maximizing the variance between classes. A more considerable interclass variance between background and foreground indicates a more distinct differentiation between the two regions of the image, where the interclass variance can be defined as:
g = ω 0 ω 1 ( μ 0 μ 1 ) 2 ,
where ω 0 is the ratio of the number of pixels in the foreground part to the total number, μ 0 is the gray average of the foreground part, ω 1 is the ratio of the number of pixels in the background part to the total number, and μ 1 is the gray average of the background part. The OTSU algorithm calculates the threshold T that maximizes the variance   g between classes based on the gray distribution of the whole image by traversing the gray levels of the image, and uses this threshold as the basis for classifying binary images.

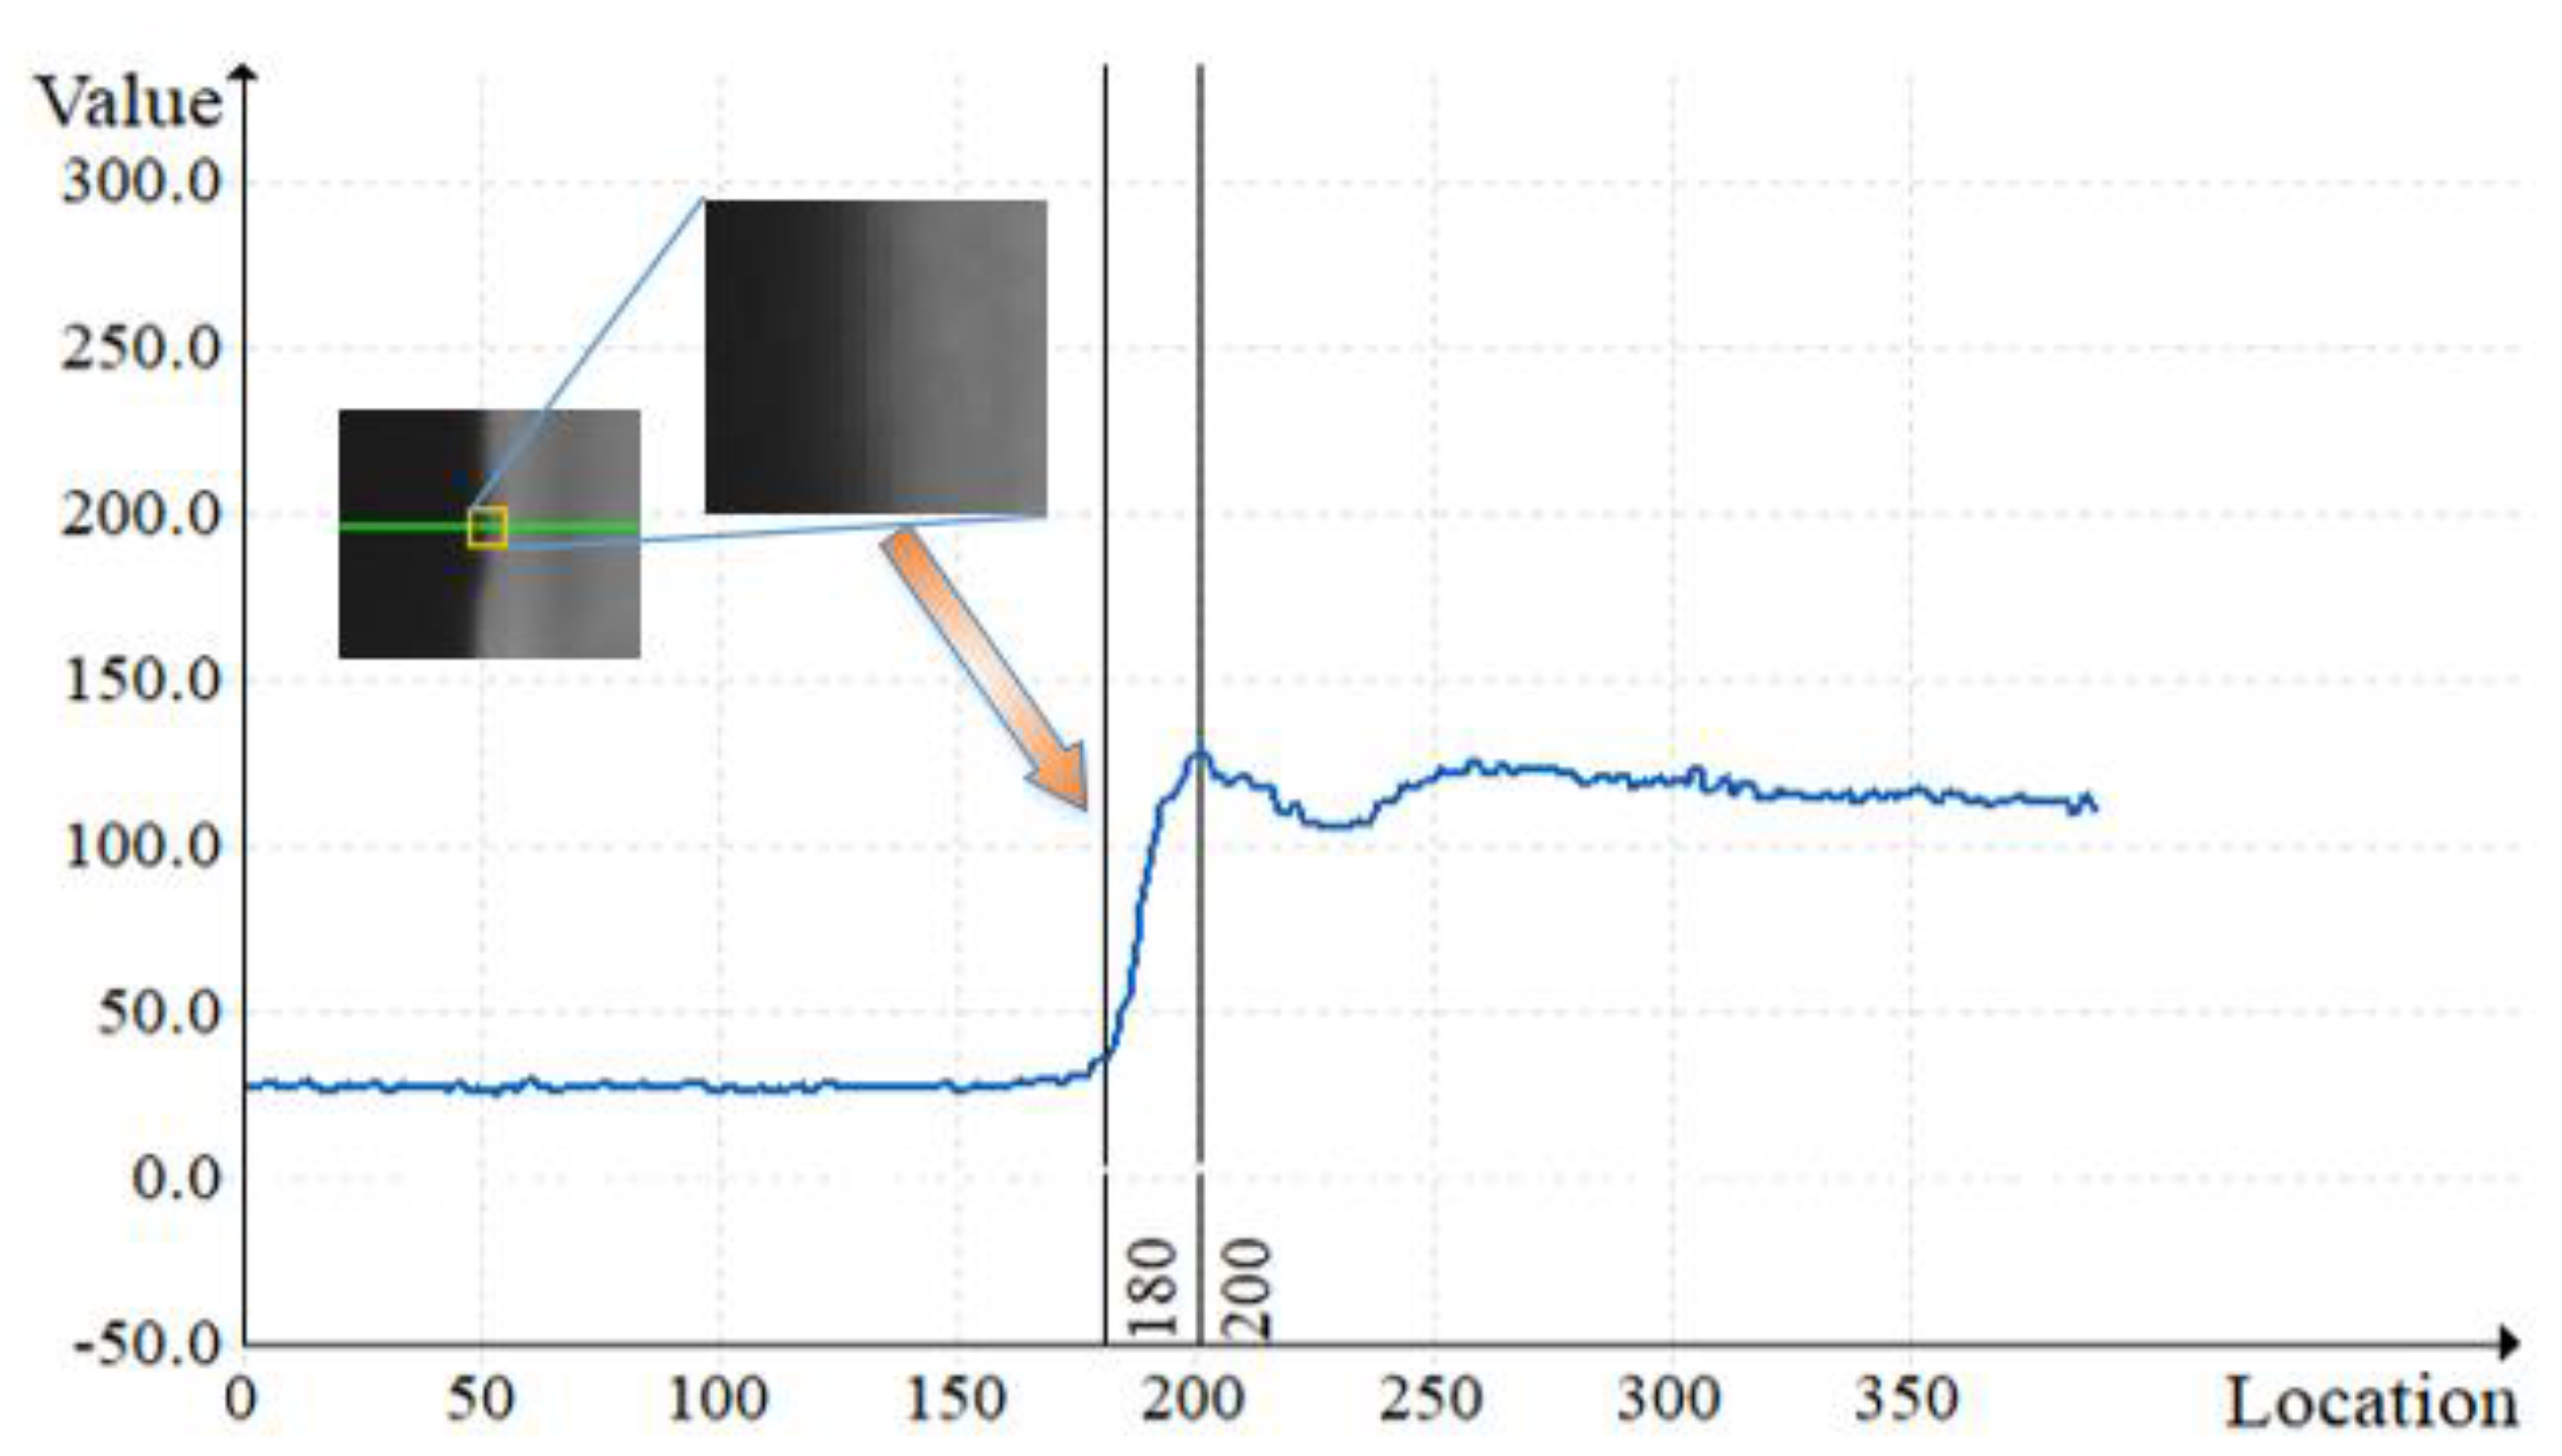
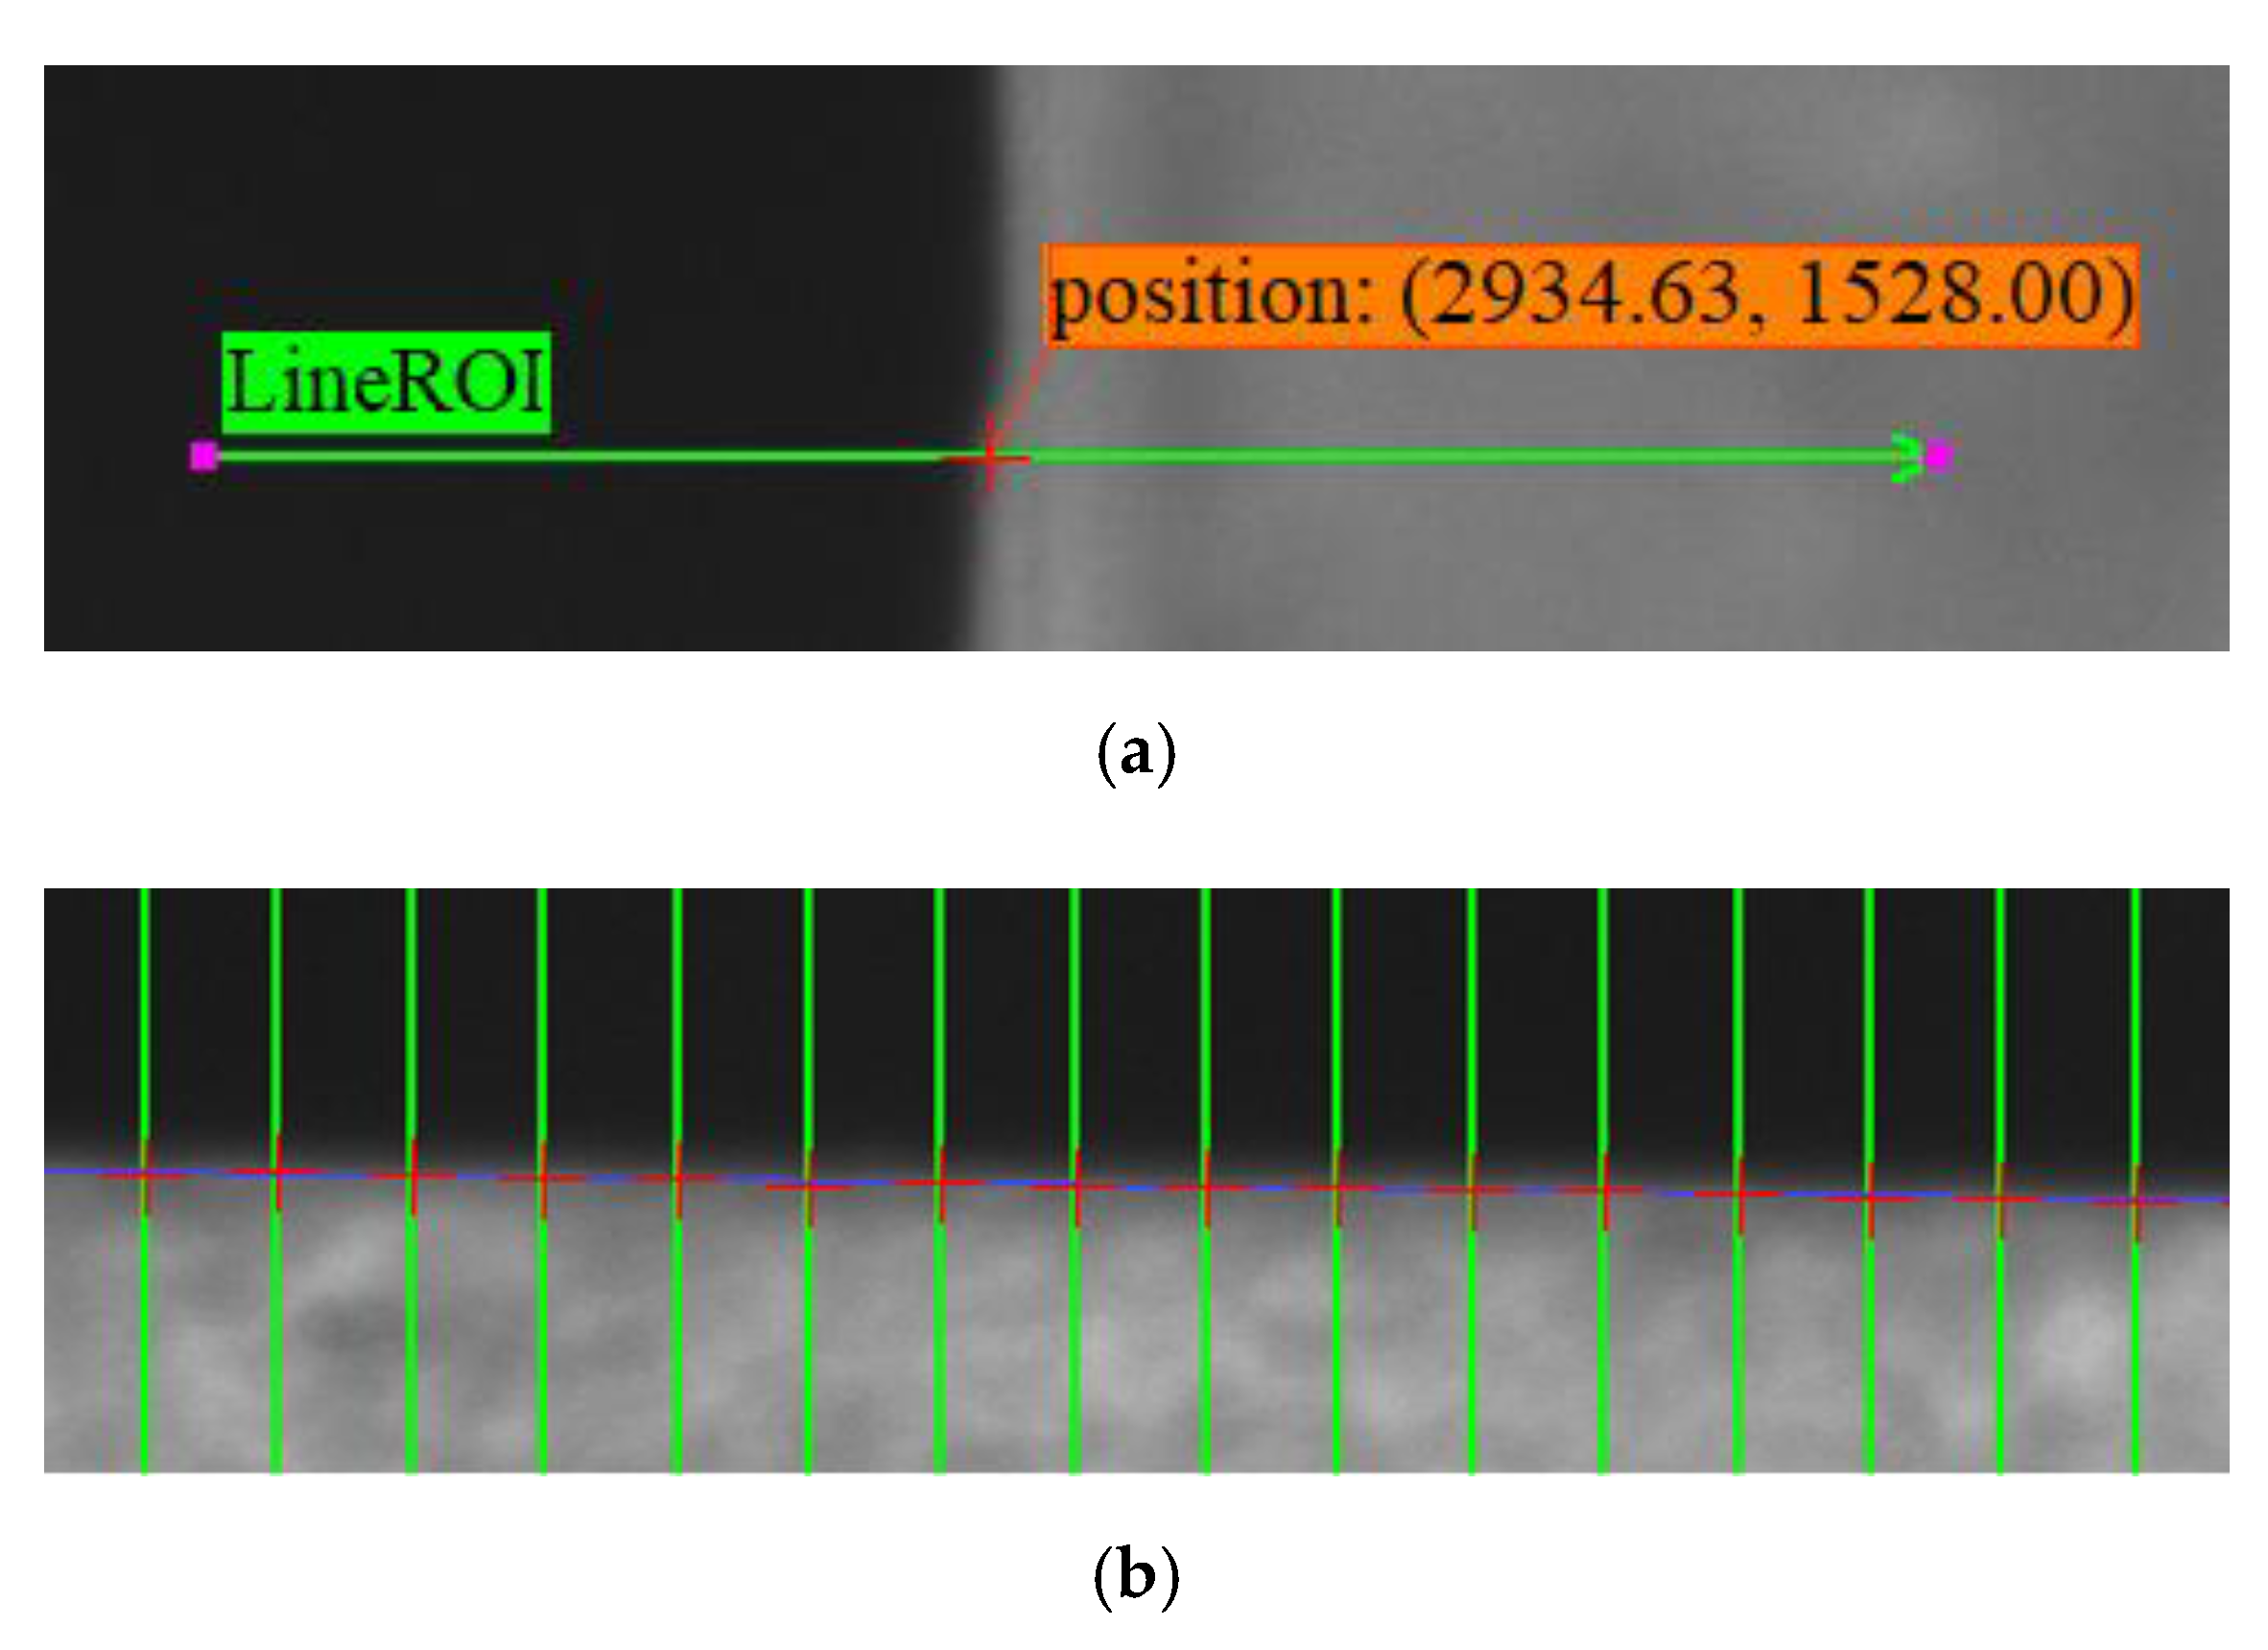
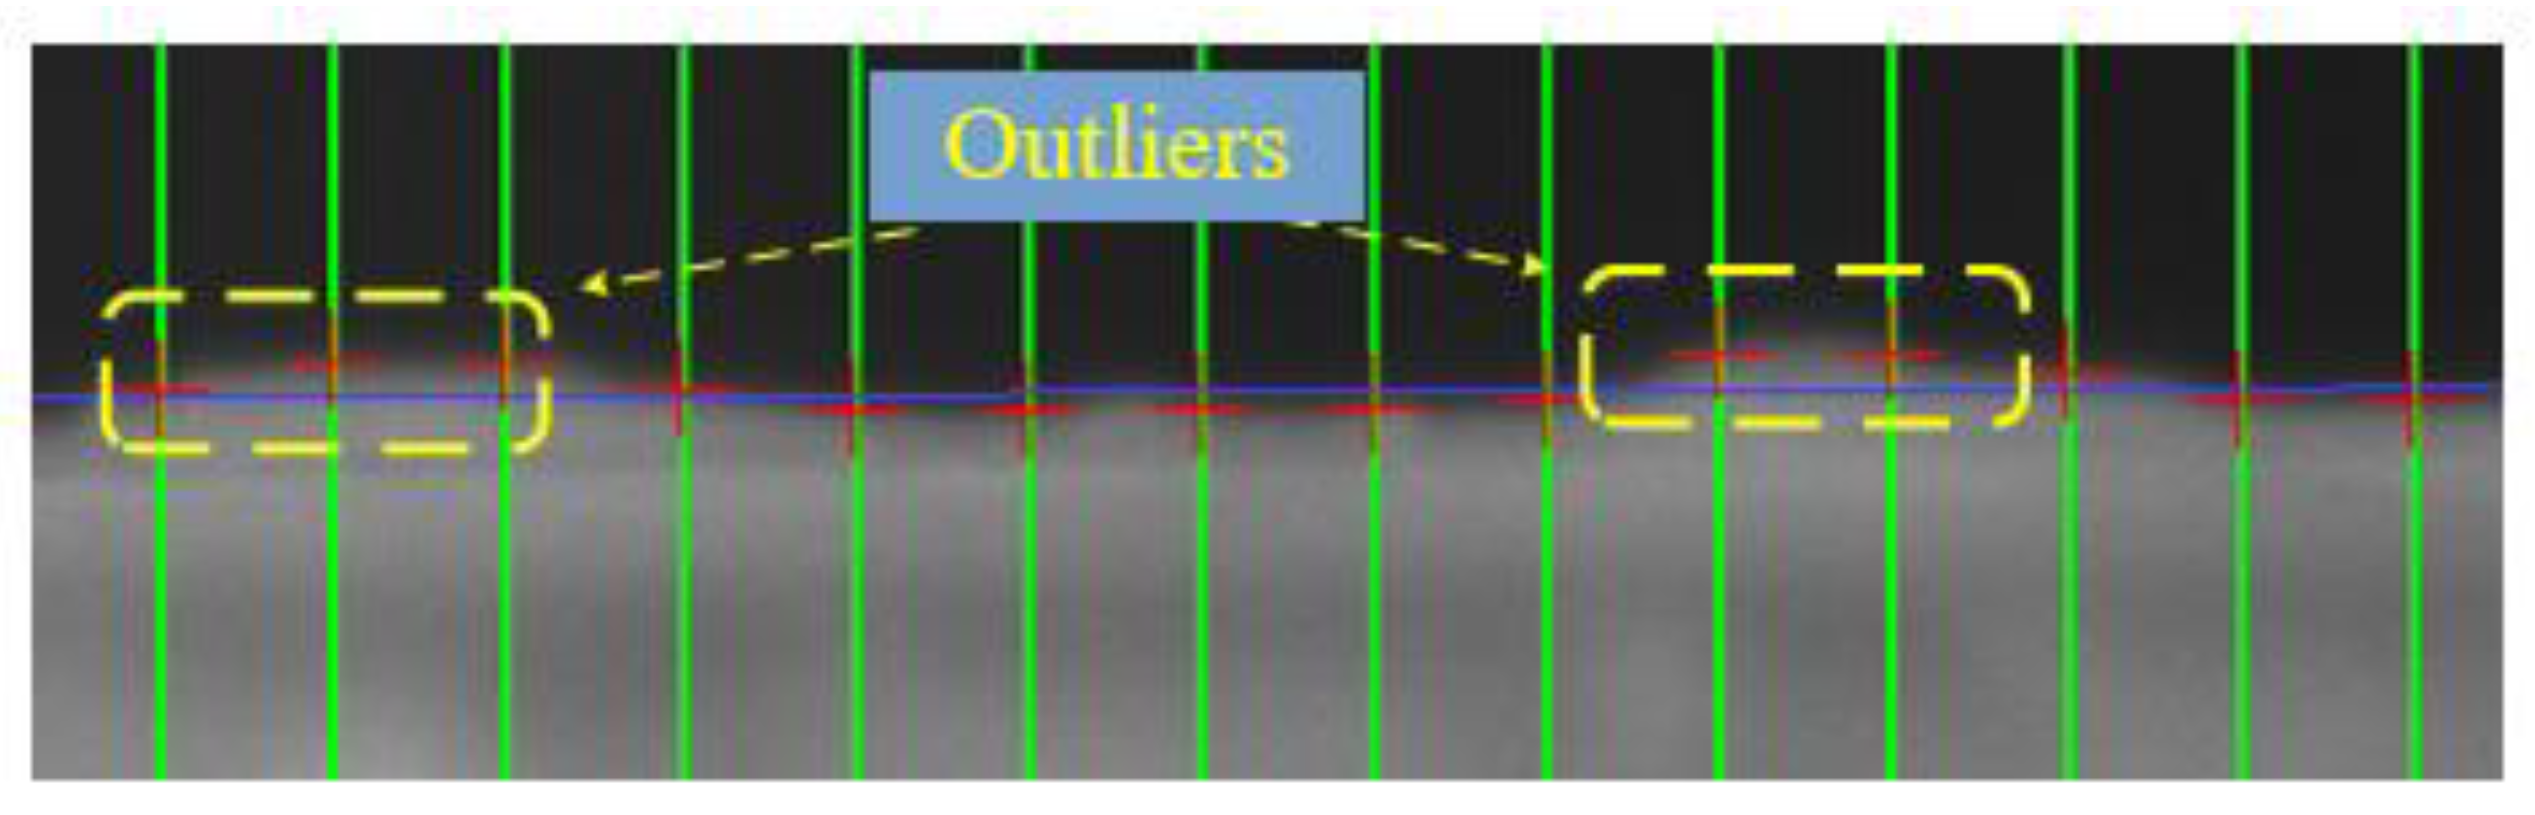
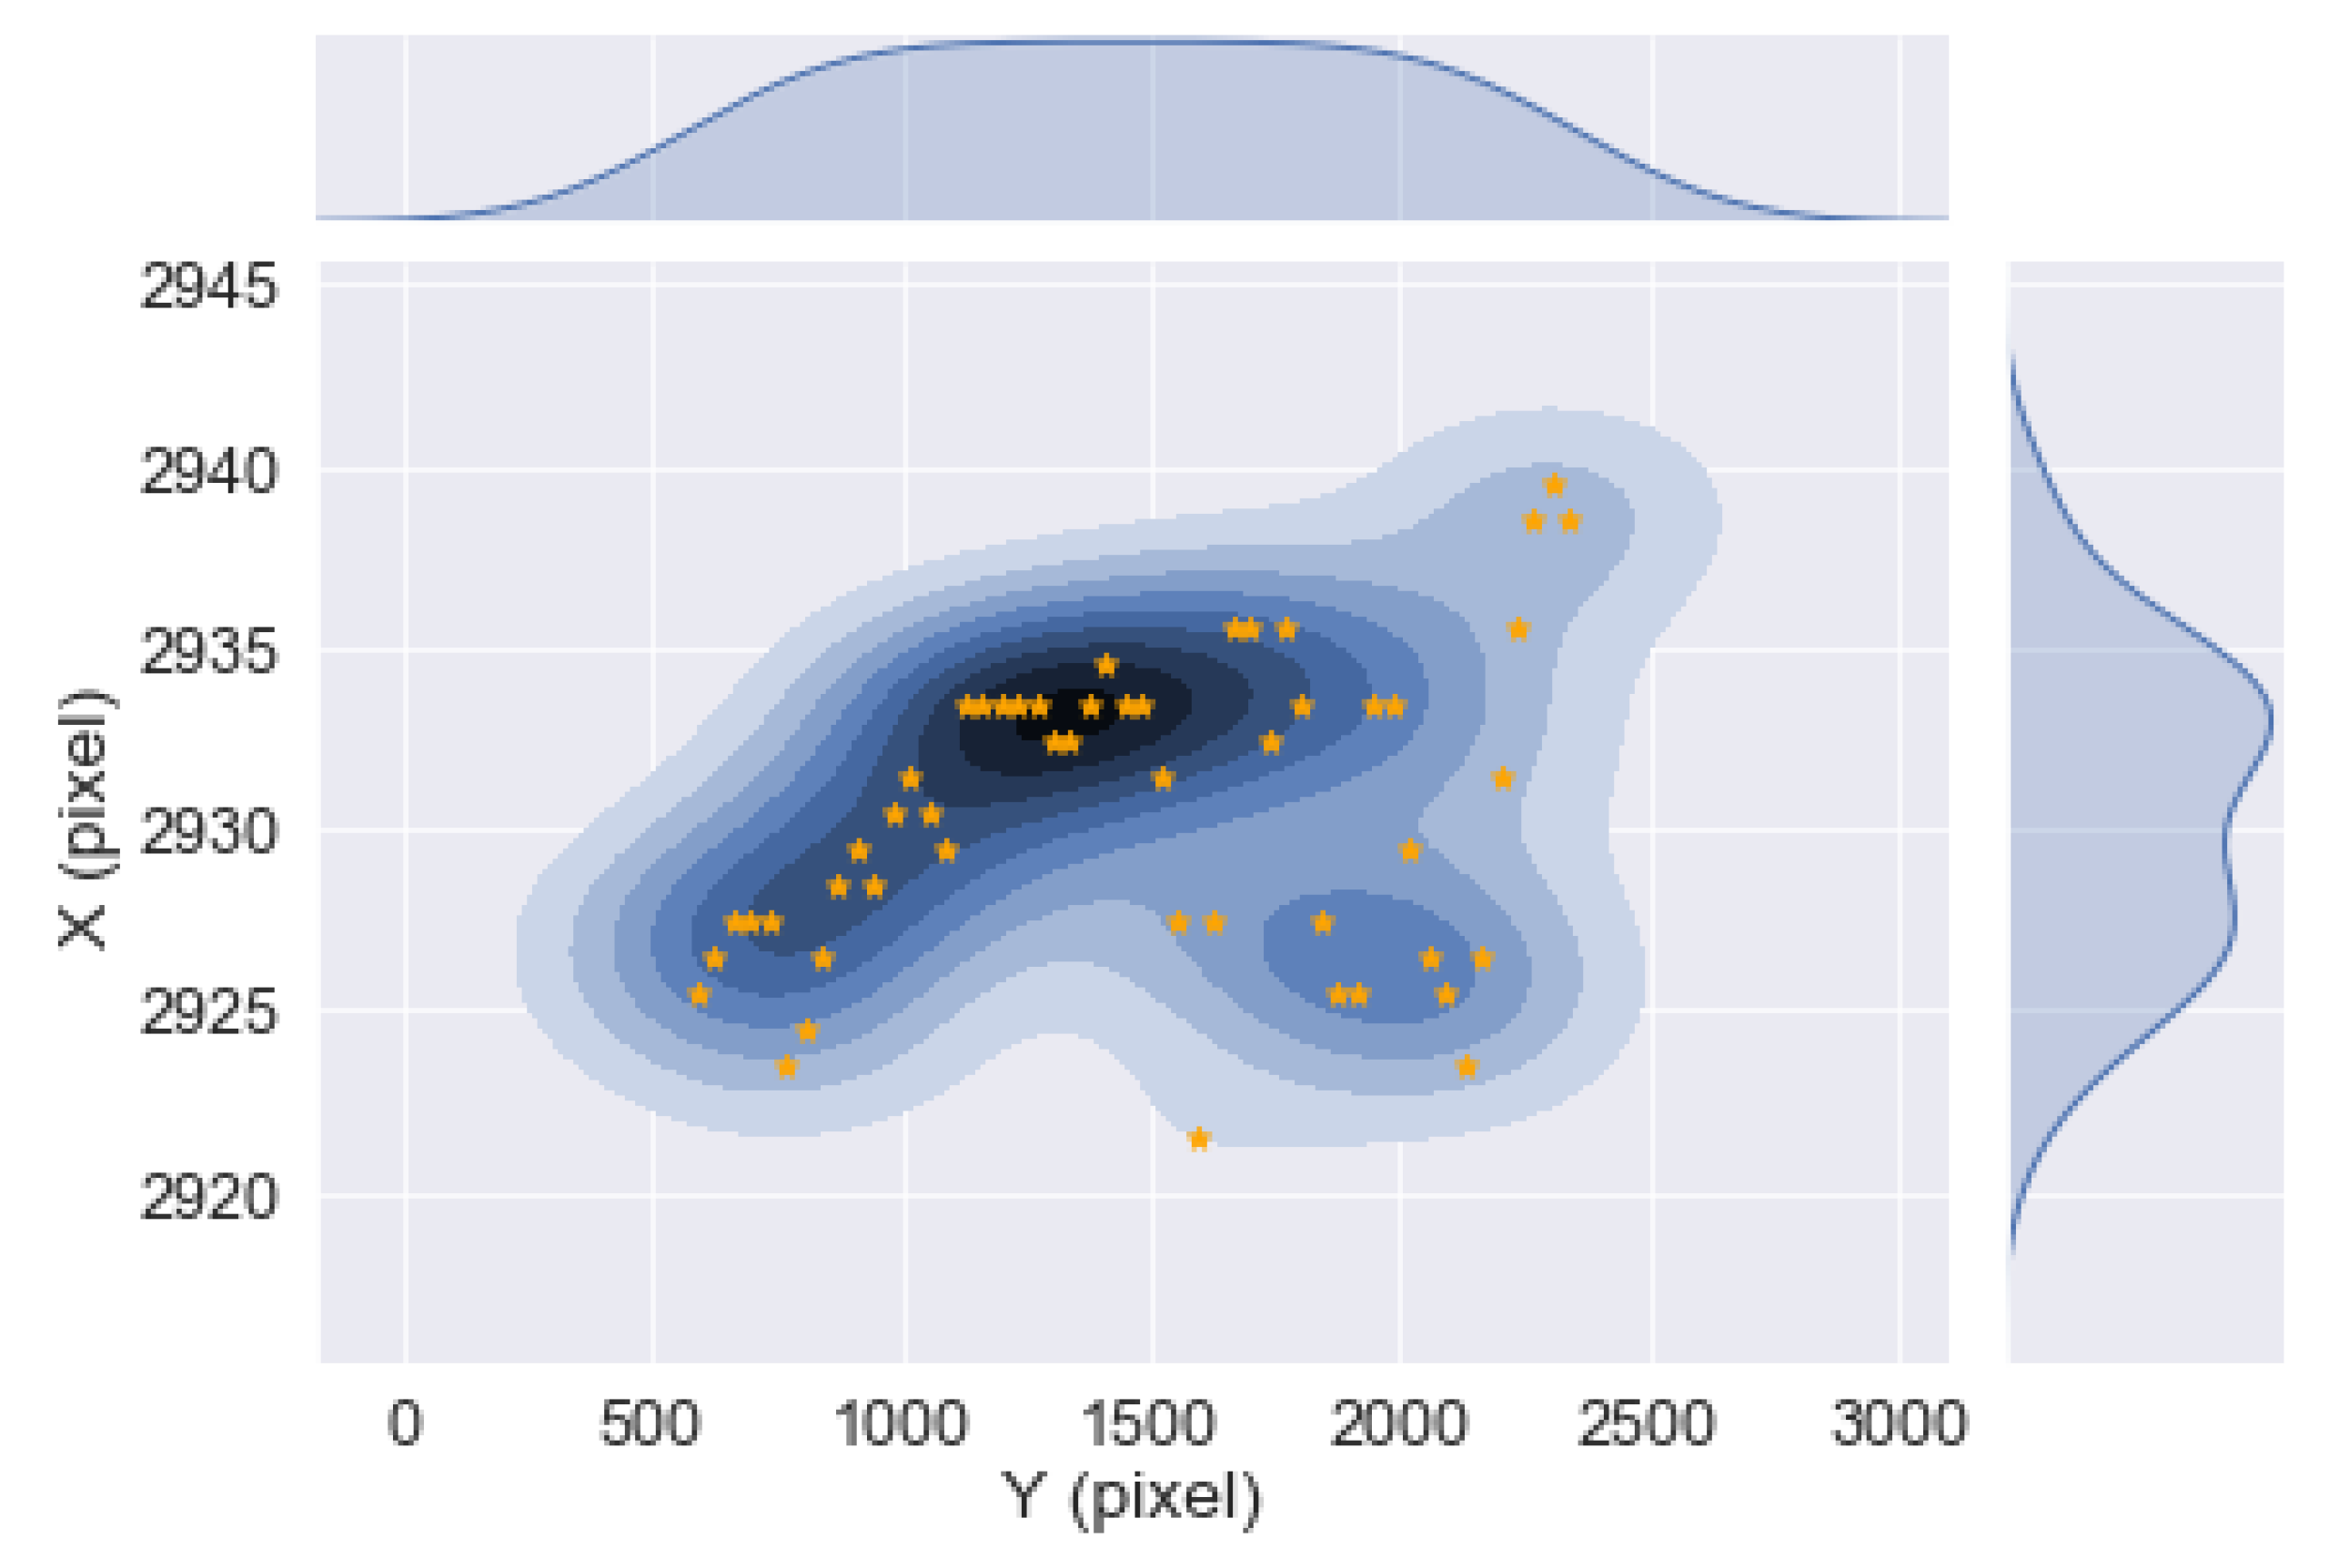
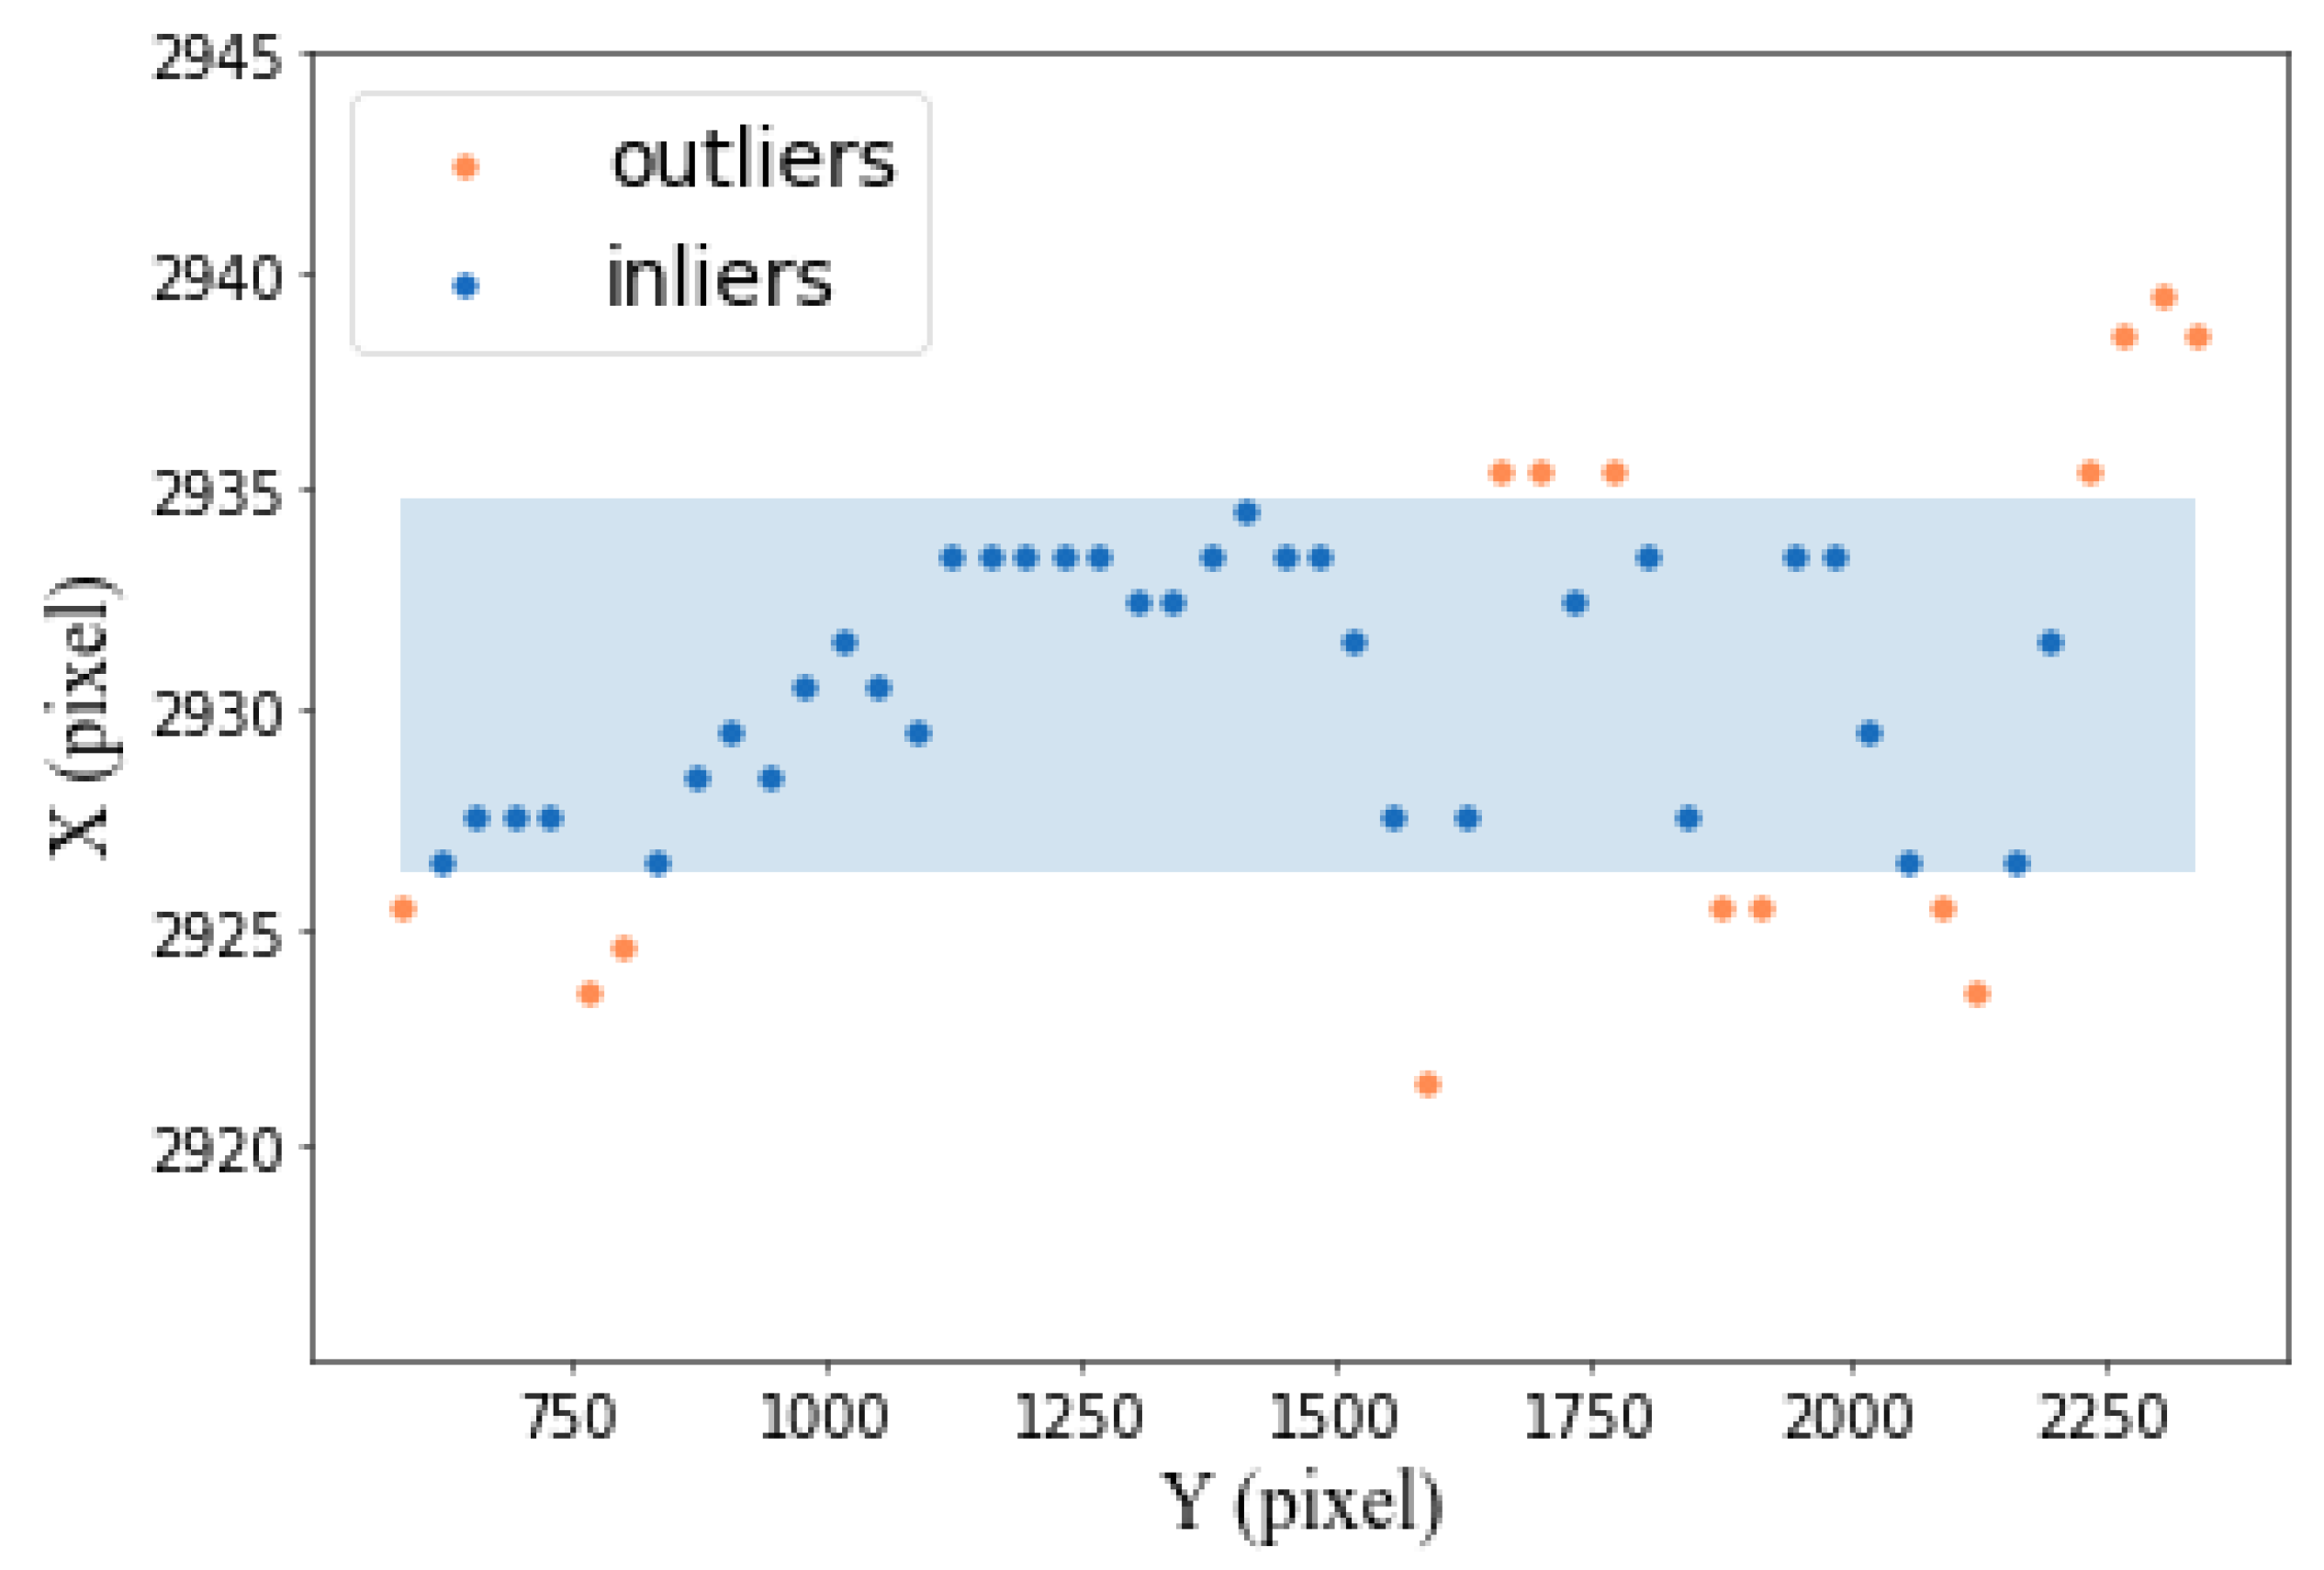
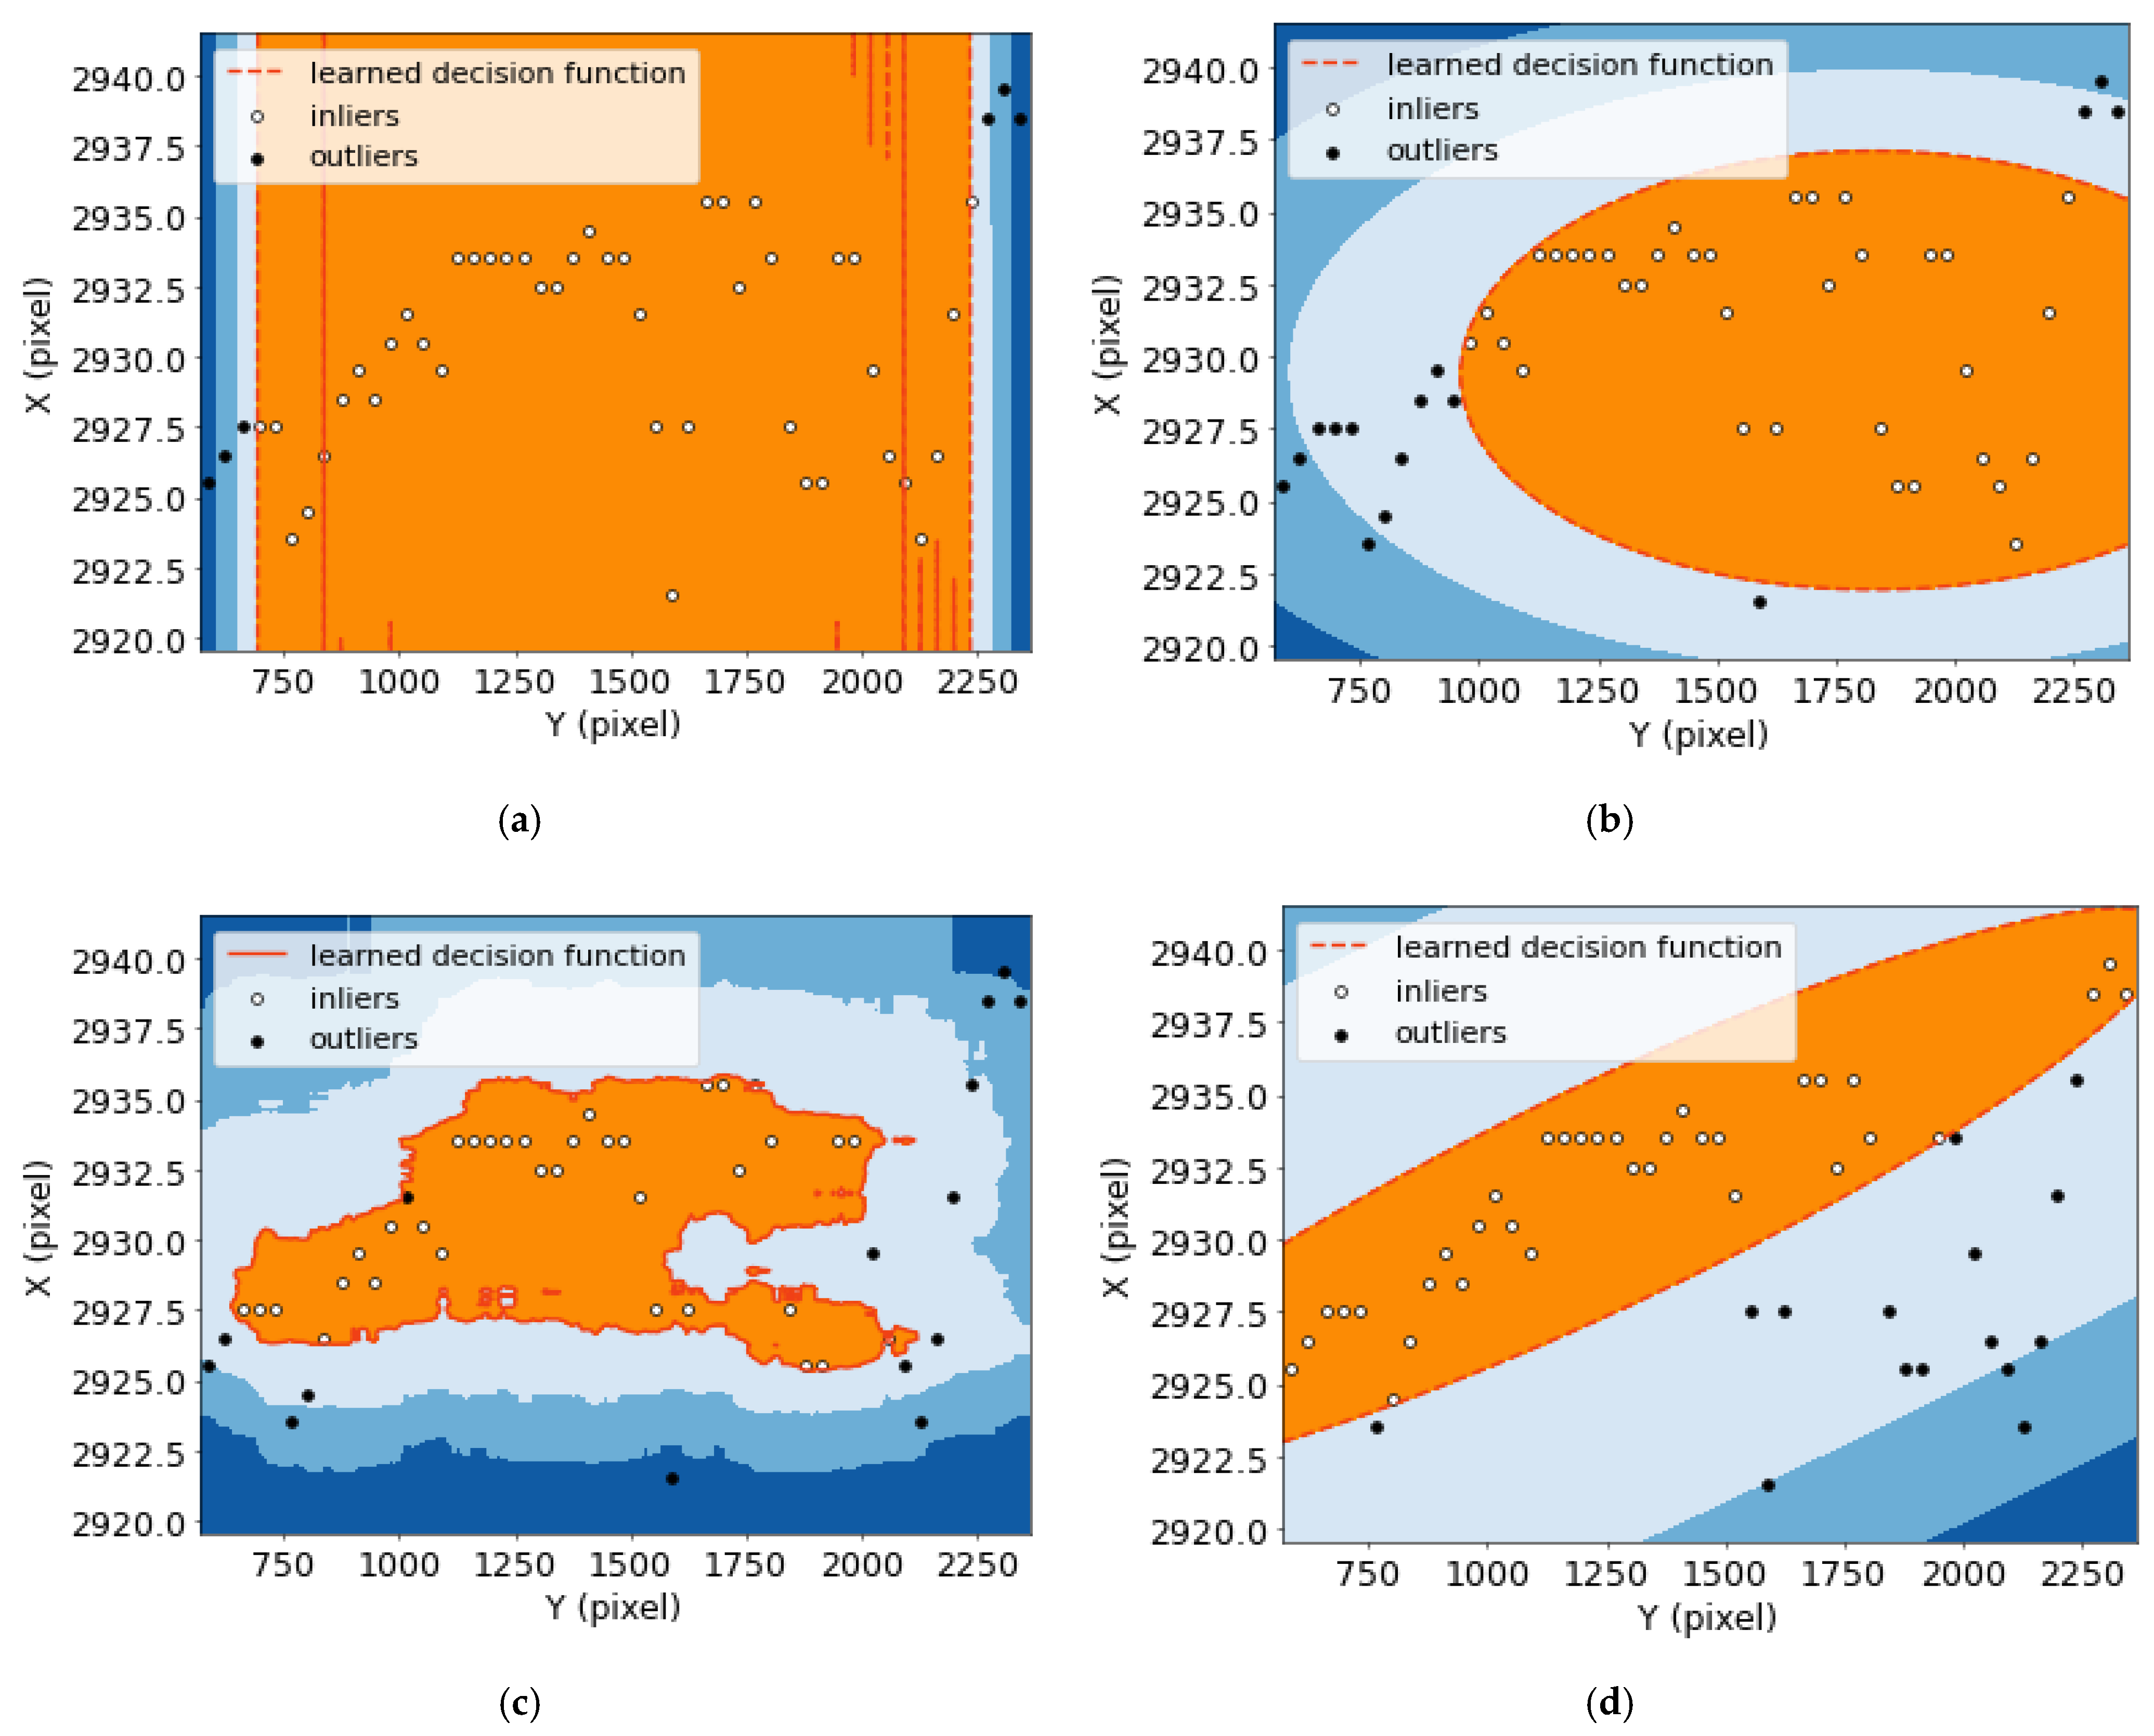
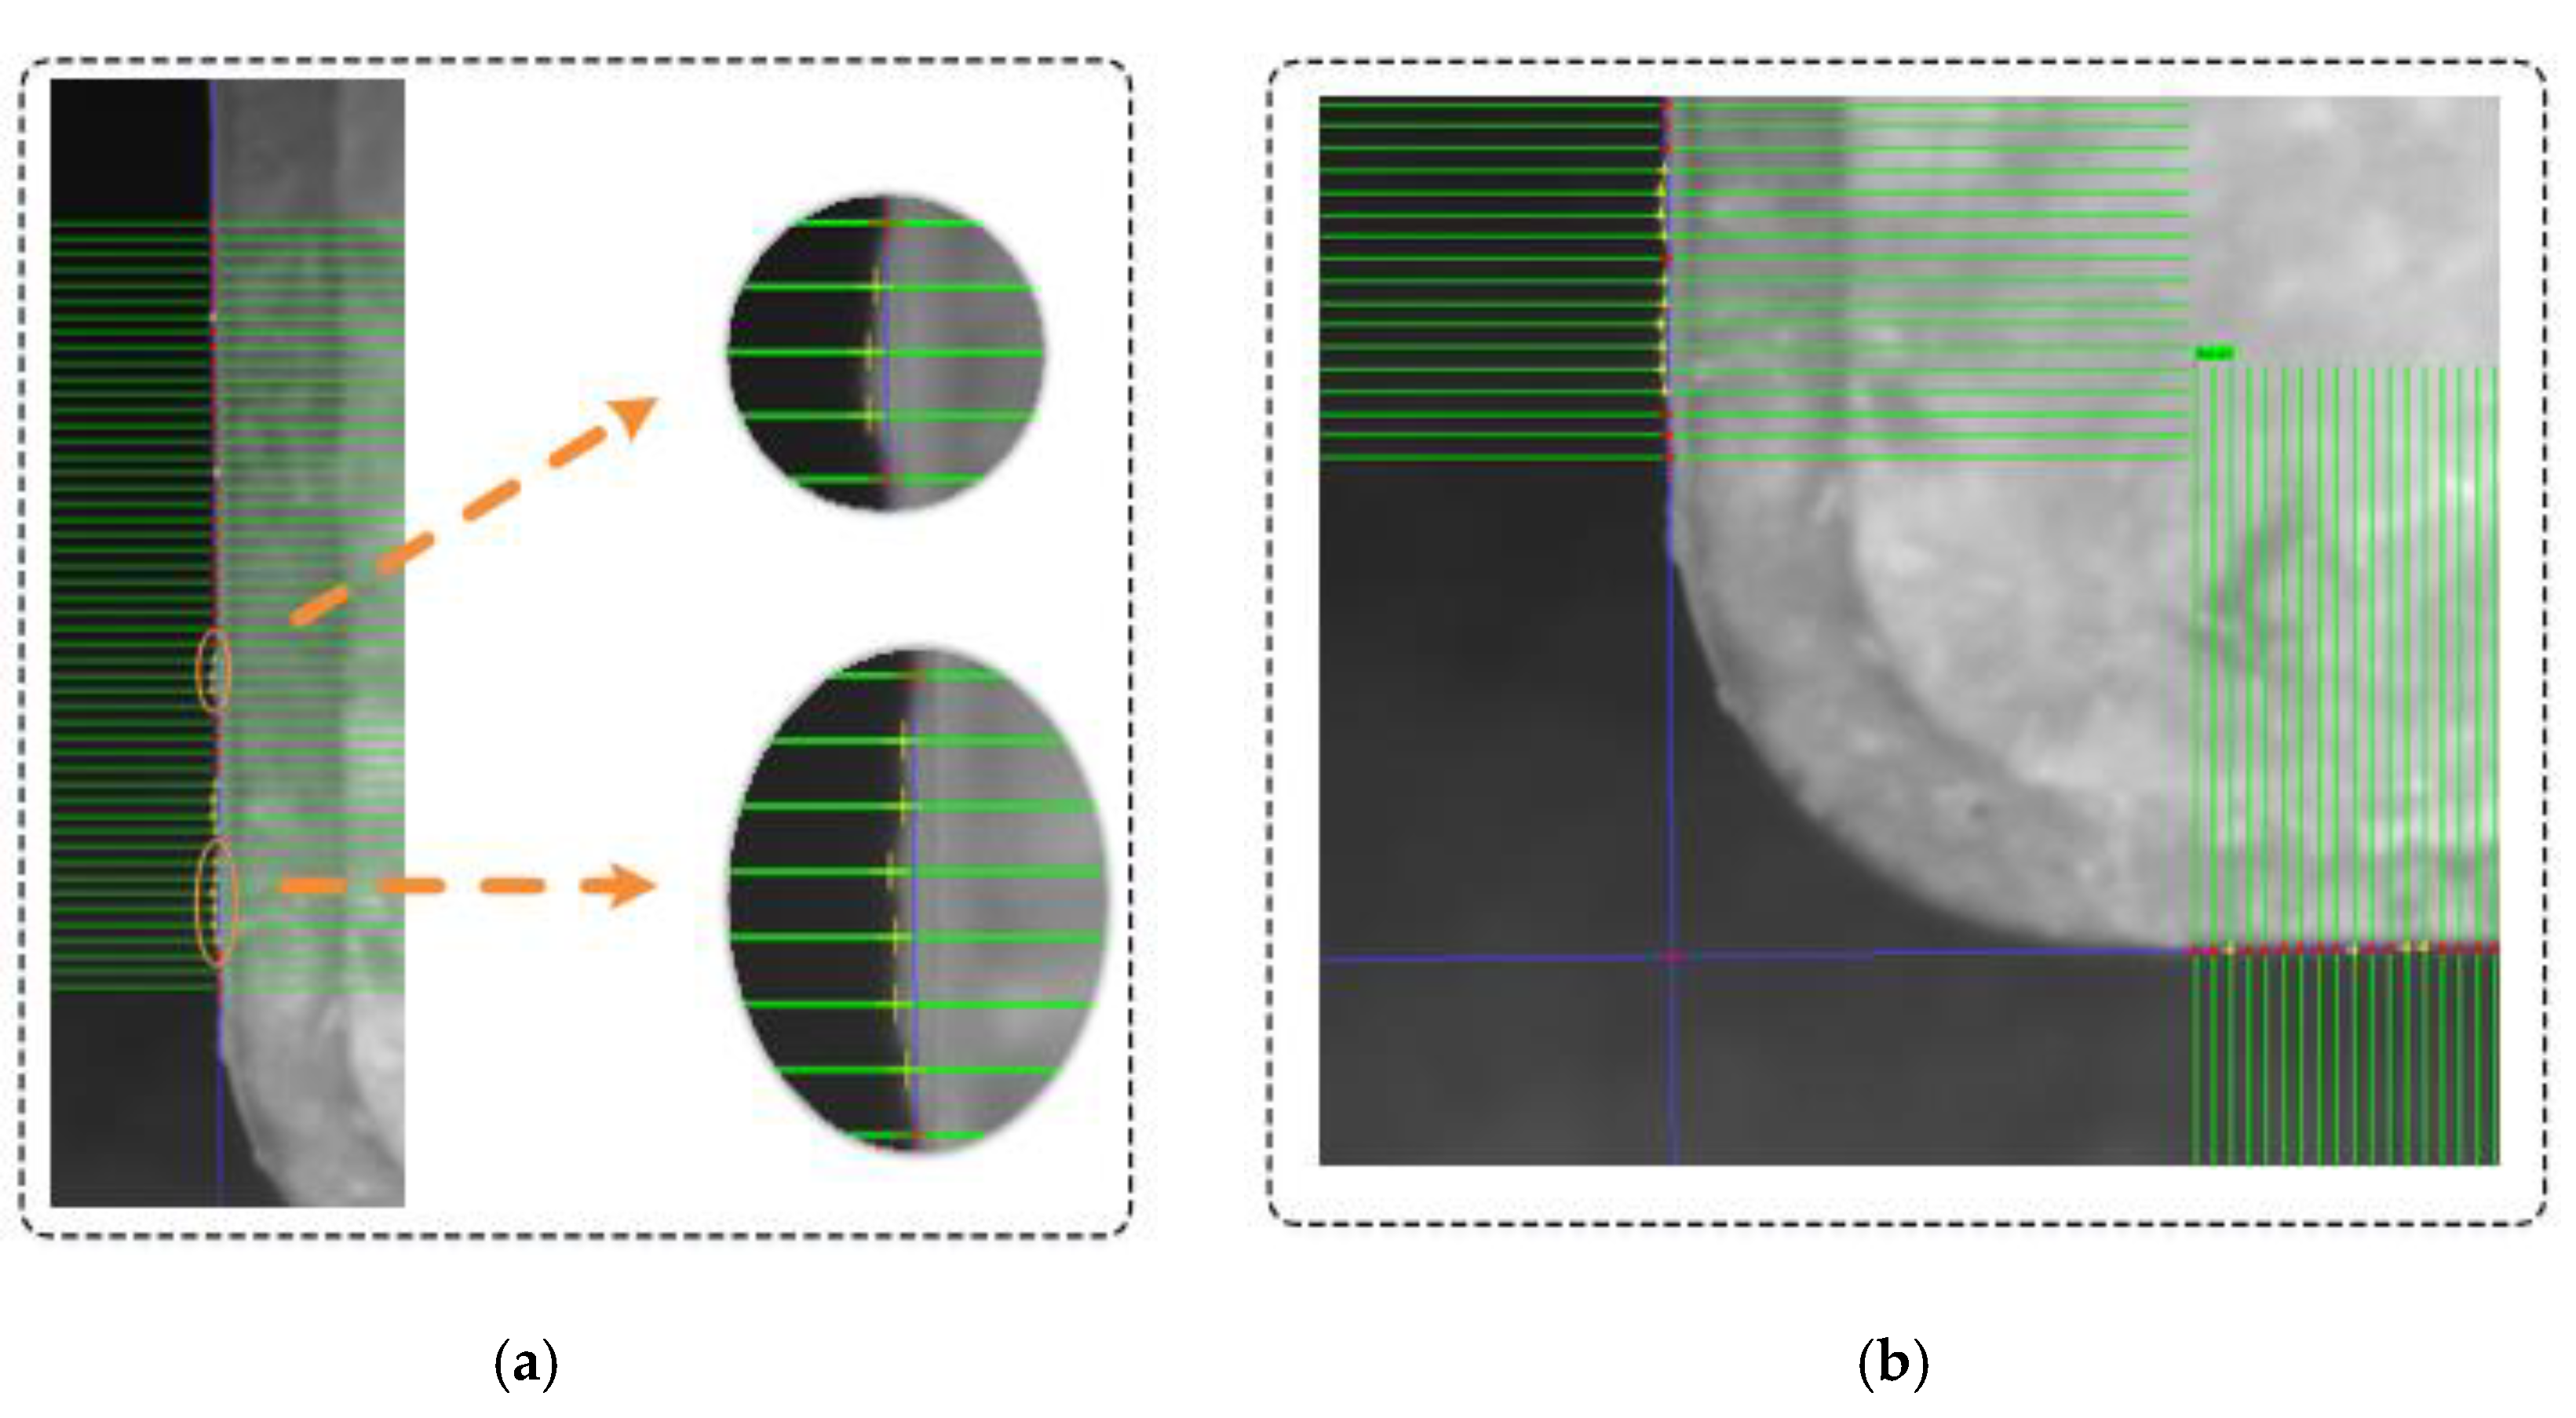
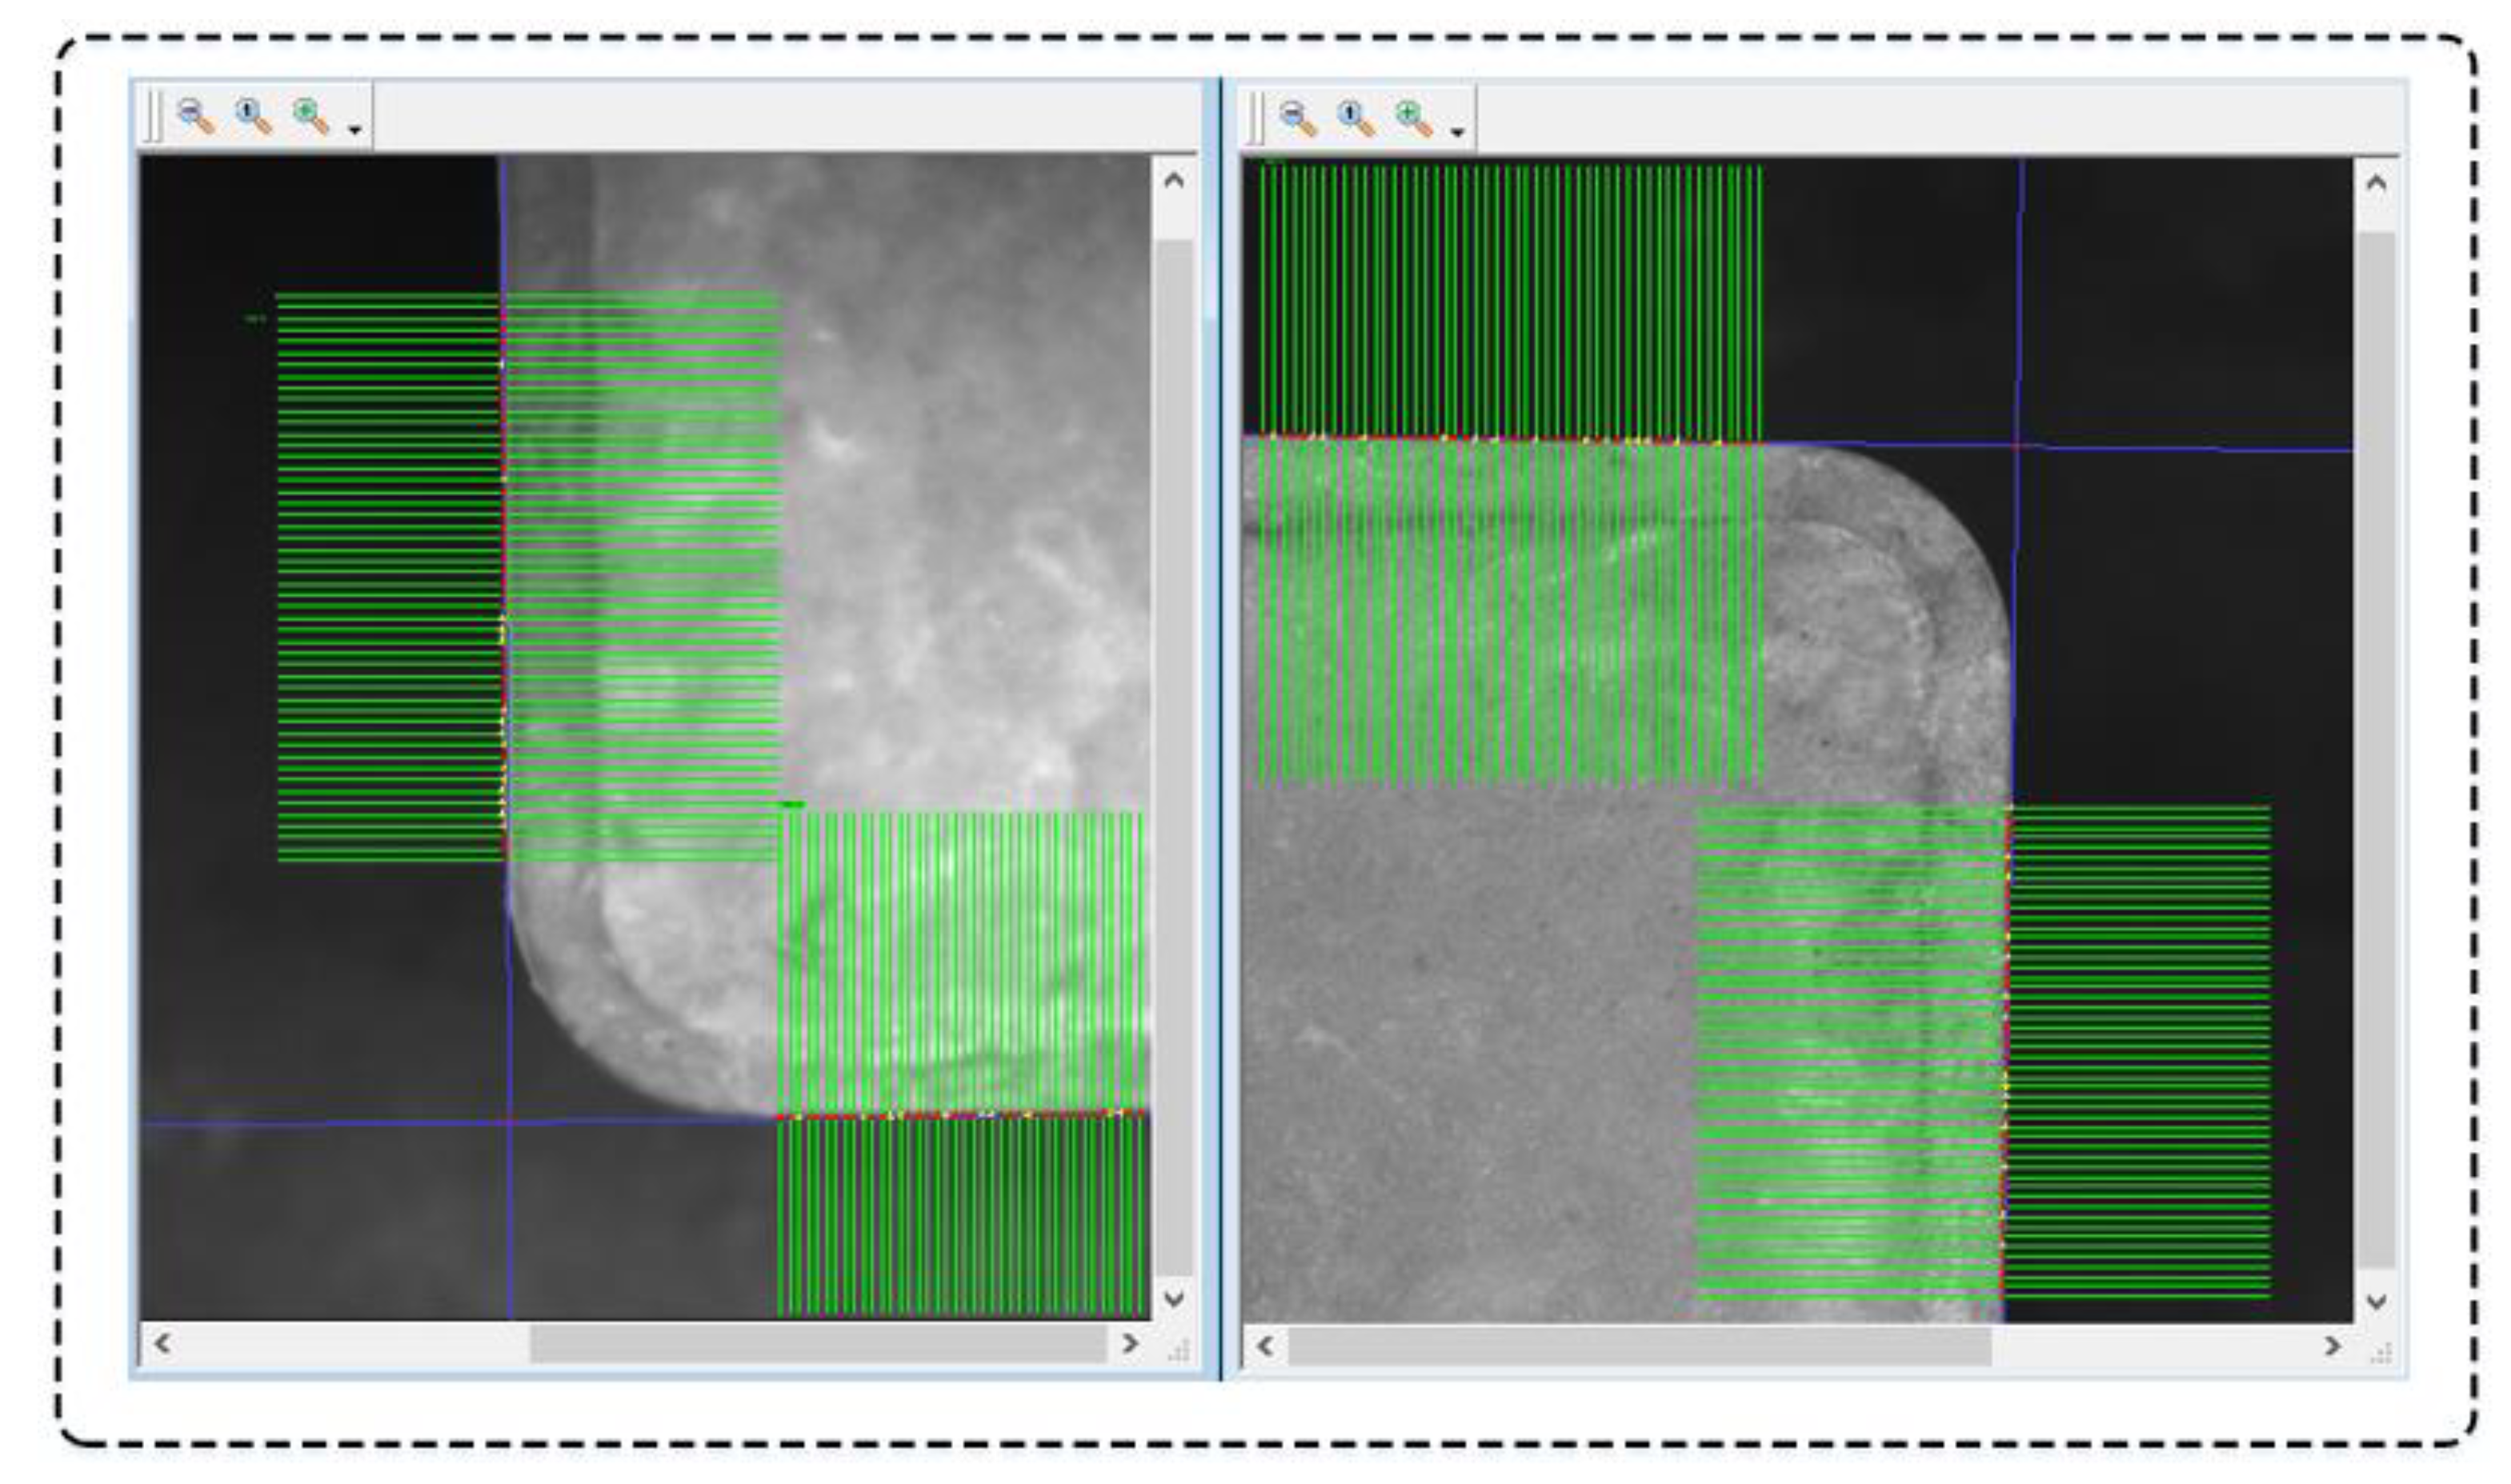
2.2.3. Feature Extraction and Target Localization

Edge features are the most fundamental features of an image, and edges describe regions where local features change dramatically. Edges are the end of one region and the beginning of another [24]. The edges of an image play a key role in image analysis processing scenarios such as image feature segmentation, texture feature classification, and feature localization [25]. The main principle of edge detection lies in identifying pixel points in digital images with significant color changes or luminance changes. The significant differences in these pixel points often represent essential changes in this part of the image features, including discontinuities in-depth, discontinuities in orientation, and discontinuities in luminance.
The Line ROI that constitutes the Rake ROI can be considered a one-dimensional image. Since the acquired image is discrete and contains noise, the edge definition given by using the first-order derivative is preferable when extracting edges from the one-dimensional grayscale profile. The salient edges can easily be selected by thresholding the absolute value of the first-order derivative [26]. Additionally, the first-order derivative can be approximated as a first-order difference, which is easy to calculate and can be expressed as:
f x = f ( x + 1 ) f ( x ) .
The calculation results are shown in Figure 8. After the threshold segment, the pixel’s gray value will experience a sudden change. At this point, it is effortless to determine the maximum global value of the gray value gradient. The unique edge point can be determined accurately based on this maximum value.
The effect of edge feature point extraction is shown in Figure 9a. For each Line ROI in the Rake ROI, threshold segmentation and first-order differencing can extract the target’s relatively accurate edge position for measurement. Ideally, the edge of the CRTS-III slab ballastless track plate should be relatively flat, as shown in Figure 9b. The set of feature points extracted using Rake ROI can reasonably approximate the object’s edge, so the extracted set of feature points can be directly fitted into a straight edge line by linear regression [27,28]. Further, the position parameters of the track plate can be obtained based on the intersection information of two adjacent edge straight lines of the object to be measured.
However, the image edges of the captured CRTS-III slab ballastless track plates in the real production process may have depressed and raised areas, as shown in Figure 10. Such uneven edges may be determined by various factors, such as production molds, processing techniques, and camera shooting angles. Therefore, the feature points extracted in these regions should be defined as outliers. Assuming these outlier points are involved in the line fitting, a line with a large deviation will be obtained. In this case, it will reduce the accuracy of the final position information, so removing the outlier points from the feature points sequence is necessary.
Outlier detection can be viewed as a multi-classification task for unbalanced data under unsupervised learning or weakly supervised learning [29]. Outlier detection methods can be classified into seven methods [30]: statistical-based methods, distance-based methods, density-based methods, clustering-based methods, and so forth. Since there are significant differences in data size, distribution, and feature dimensions in different application scenarios, there is no universally optimal model. When solving specific outlier detection problems, it is necessary to choose the appropriate method according to the characteristics of the data [31,32].
In image processing tasks, feature points are primarily represented in two or three dimensions. The distribution of feature points extracted using a single Rake ROI in this paper is shown in Figure 11. A common approach in processing such low-dimensional data is statistical-based methods [33]. Assuming that the data obey a Gaussian distribution, about 68% of the data values will fall within an interval of one standard deviation from the mean, as shown in Figure 12. At that point, the data outside the interval can be marked as outliers. In addition, we also investigated the standard outlier detection methods such as K nearest neighbors (KNN) [34], principal component analysis (PCA) [35], isolate forest [36], and minimum covariance determinant (MCD) [37] under two-dimensional data to find an algorithm that performs better; the detection results are shown in Figure 13 for this feature point sample. We use a manual mechanism to verify the detection results of the outlier algorithms by mapping inliers back into the original image and observing the fit of straight lines at the edge of the track plate. Finally, we choose the MCD algorithm as the outlier detection algorithm.
Mapping feature points to images, Figure 14 shows the results of outlier detection and fitting the edge using inliers. After zooming in on the local area in Figure 14a, it can be seen that the feature points in the bumpy area of the target edge can be detected very well after outlier detection. As a whole, the edge line fitted with inliers can accurately describe the edges of the CRTS-III slab ballastless track plate. Further, we could conveniently obtain two straight lines of the edge of the track plate in the field of view of a monocular camera, and the effect is shown in Figure 14b. The coordinates of the ( x , y ) position of the track plate in the horizontal direction can be determined from the intersection of the straight lines, and the rotation angle(θ) of the track plate can be determined from the slope of the straight lines. In addition, there may be extreme cases, such as sudden locational illumination changes in the real environment, resulting in a mismatch between ( x , y , θ ) and the actual position of the track plate. So, we limit the range of values of ( x , y , θ ) : x [ x l , x u ] , y [ y l , y u ] , and θ [ θ l , θ u ] . If the detection result is outside the interval, the detection is considered a failure and needs to be redetected. If necessary, the system will adjust the camera, light source, and other hardware to weaken this effect.

2.2.4. Hand–Eye Calibration

The relative position relationship between the track plate position parameters acquired by the vision system and the robot end-effector in the robot base coordinate system constitutes the hand–eye calibration problem of the positioning platform [38]. The vision system converts the position parameters into coordinate information in the robot base coordinate system based on the hand–eye relationship matrix to control the robot end-effector [39]. The hand–eye calibration accuracy is of great importance for the irradiation test results.
The calibration process requires a calibration board to complete the acquisition of image coordinates and coordinate data in the corresponding robot base coordinate system. Firstly, place the calibration board in the camera’s field of view and select a series of calibration points P in the image. Then, control the robot holding the probe to reach the corresponding calibration point. Read the coordinate PB of the robot end in the robot base coordinate system at this time on the teach pendant. The calibration process records n sets of measurement data, and the corresponding measurement coordinates of each set shall satisfy the same hand–eye relationship matrix T , as:
( P B 1 P B 2 P B n 1 1 1 ) = T ( P 1 P 2 P n 1 1 1 ) .
The matrix T consists of a rotation matrix R and a translation matrix t. The calibration process mainly relies on human vision to observe the probe position. Factors such as light and mechanical vibration in the test environment can interfere with the calibration process; therefore, the least-squares method is well suited for estimating the hand–eye transformation relationship under two sets of coordinate systems. The least-squares solution of the initial rotation and translation matrices is solved by the singular value decomposition (SVD) algorithm [40].
( R , t ) = argmin R , t i n ( R P i + t ) P B i 2 .
The randomness and chance of errors in the calibration process will affect the reliability of the hand–eye relationship. In order to reduce the influence of the error data on the calibration result, different weights are assigned to each group of data to reduce the influence of the more significant error data on the calibration result.
Using the initial hand–eye relationship to find the corresponding coordinate P B of the irradiation position parameter in the base coordinate system again, we recorded the calibration error e i of each set of measurement data and calculated the average error e ¯ .
e ¯ = P B i P B i 2 n ( i = 1 , 2 , 3 n ) .
Set the weight function according to each group of measurement data as:
w i = m a x ( 0 , k e ¯ e i k e ) ( i = 1 , 2 , 3 n ) .
In order to ensure the integrity of the measurement data, the value of the variable k in Equation (7) is restricted. The value of variable k is the result of rounding under the ratio of the maximum error e m a x to the average error e ¯ in the measurement data, and the value of k should not be less than 2. The weights are set so that the smaller the measurement data error, the larger the proportion of the group’s weight of measurement data, and vice versa. Thus, outlier data that significantly deviate from the error distribution interval are excluded. The least-squares solution of the hand–eye relationship matrix T is again obtained using the measurement data with the entitled values as follows:
( R , t ) = argmin R , t i n W i ( R P i + t ) P B i 2 .
After that, the weights are updated according to the new errors, and the above process is iterated until the hand–eye calibration errors converge within a reasonable interval, completing the hand–eye calibration process.

3. Results and Discussion

We tested the effect of the visual positioning system in a real production environment. The equipment distribution model is shown in Figure 15a, with the CAD model of the anchor sealing platform on the left and the physical view of the site on the right. We used four six-axis robots as actuation equipment. The image acquisition equipment includes two Teledyne DALSA GigE cameras with 18 megapixels and 35 mm focal length lenses. The image processing software was developed based on Sherlock7 and C++. In order to cope with the positioning requirements of different sizes of CRTS-III ballastless track slabs, the cameras were mounted on top of the sliding table and moved along with the sliding table according to programmable logic controller (PLC) trigger signals. The image processing equipment was an Industrial PC (IPC) configured with Intel(R) Celeron(R) J1900 @ 1.99GHz CPU and 4GB RAM. As shown in Figure 15b, the camera, PLC, IPC, and robots were connected via industrial Ethernet. In order to ensure the clarity of the image, we set the image resolution to 4912 × 3688 . At this time, the field-of-view size was about 200 × 150   mm 2 at a camera height of 1.2 m.
A visual representation of the target localization results in the image processing software is shown in Figure 16. Two regions of interest are set separately for a single image in the figure, and these two regions of interest are sufficient to cover all possible locations of two adjacent edges of the CRTS-III slab ballastless track plate. Threshold segmentation, edge point detection, outlier rejection, and straight-line fitting operations are applied to all four Rake ROI-selected image regions. These four edge straight lines obtained can fit the four edges of the entire track plate very accurately and calculate the position information of the track plate in the image. Further, the hand–eye relationship matrix obtained from the hand–eye calibration calculation is used to map the position information of the track plate in the image coordinate system to the robot base coordinate system, thus guiding the motion of the six-axis robot. The six-axis robot performs the anchor sealing action, as shown in Figure 17.
In this automatic anchor sealing platform, accurate positioning of the track plate position is a prerequisite for post-sequence operation. The positioning accuracy of the vision system is directly related to whether the robot can complete the anchor sealing task correctly. On the other hand, the robot will not start working until it receives the position information from the vision system, and the idle waiting time of the robot is directly related to the length of the whole production cycle. To verify the feasibility of the visual positioning system, we evaluate the repeatable positioning accuracy and the temporal performance of the system in Section 3.1 and Section 3.2. We measure the accuracy and the precision of the measurement data by statistical indicators such as arithmetic mean (AM), mean absolute deviation (MAD), and sample standard deviation (SD) as:
M A D = 1 n i = 1 n | x i x ¯ |
S D = i = 1 n ( x i x ¯ ) 2 x 1

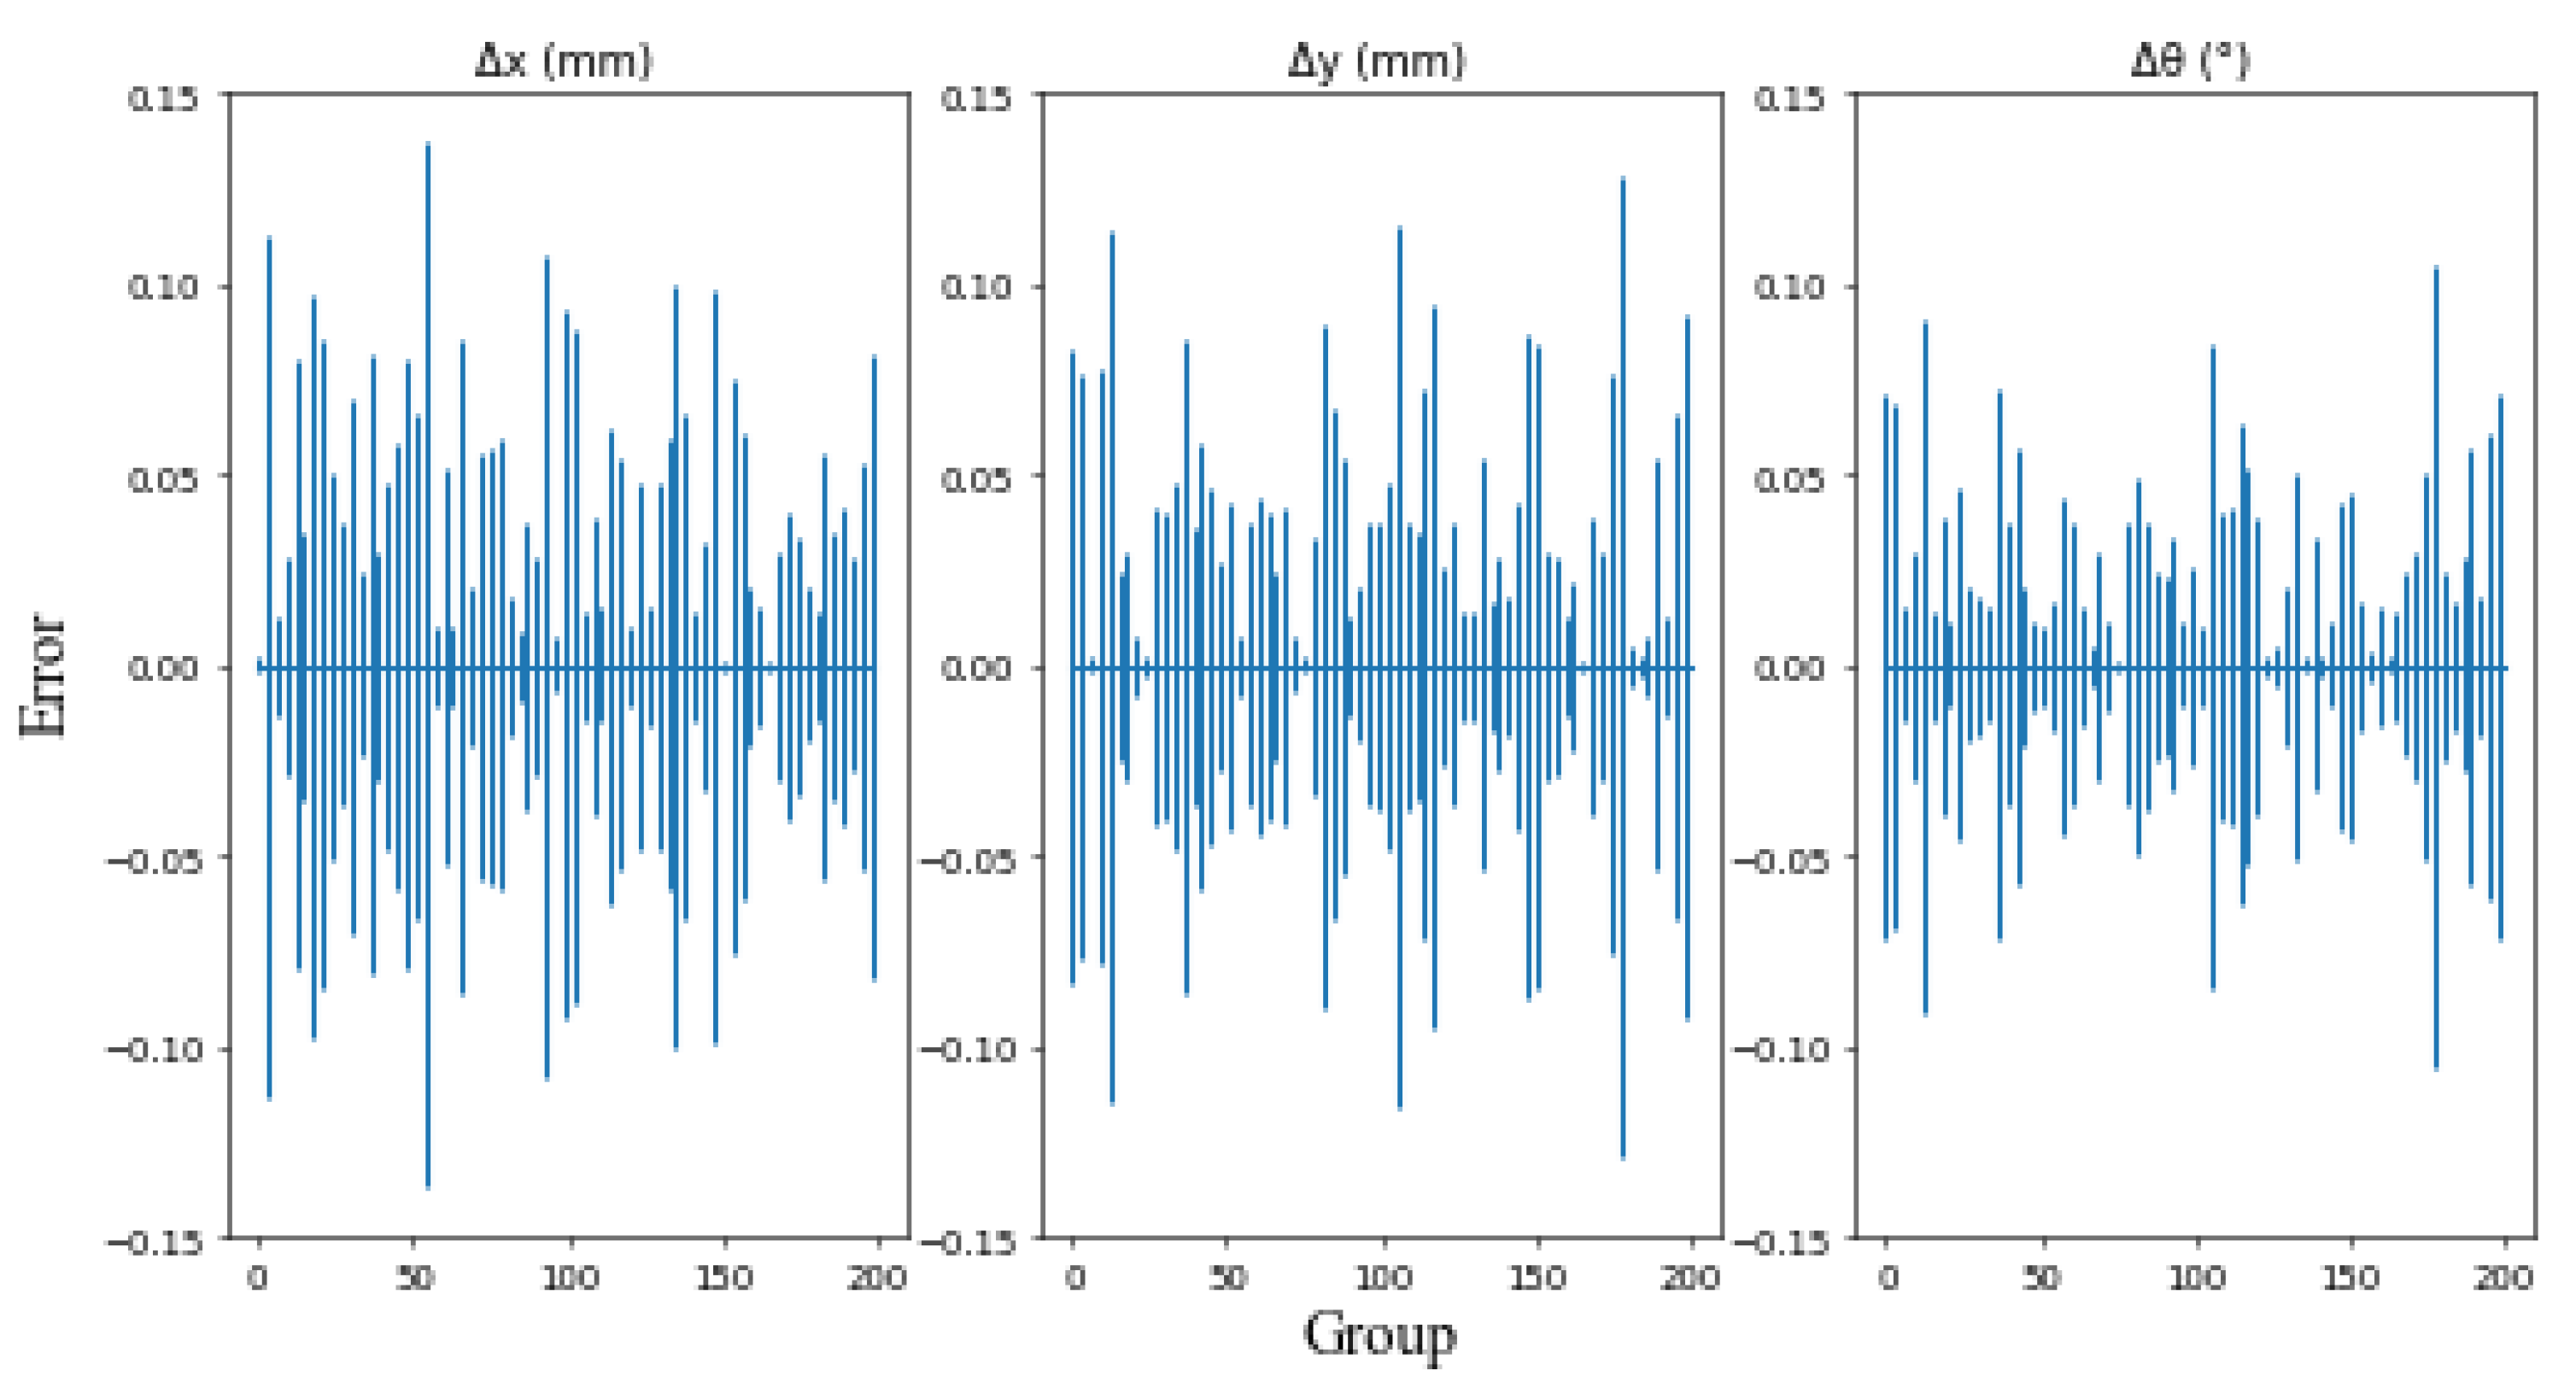
3.1. Evaluation of Repeatable Positioning Accuracy

The production platform is located in a semi-open environment, and the most influential factor on the accuracy of the visual localization system is the ambient light. Therefore, to verify the repetitive positioning accuracy of the visual localization system under different lighting conditions, we design repetitive experiments for different periods. Since the final actuator of the production platform is a six-axis robot, the robot coordinate system is selected as the reference coordinate system in the experiment. During the experiment, the position of the track plate is kept constant, and the robot clamping probe acquires the current position information of the track plate under the robot base coordinate system. The specific data in the robot demonstrator are used as the reference value. The visual positioning program performs the positioning task once every 3 min, 200 times. The ( x , y , θ ) measurements obtained from these 200 sets of experiments were compared with the reference values to obtain the errors ( Δ x , Δ y , Δ θ ) .
The error bar plotted for 200 sets of ( Δ x , Δ y , Δ θ ) data is shown in Figure 18, and the results of the specific numerical analysis of the data range, AM, MAD, and SD of the experimental results are shown in Table 1. The experimental results show that the visual positioning system is more drastically affected by the light and has lower precision. However, its accuracy is higher and can meet the practical requirements. As can be seen from Table 1, the MAD and SD of the data are relatively large, and the relative standard deviation in x and y directions can reach −12.99% and 17.8% after calculation, which means the data distribution is relatively discrete. However, the vision localization system can achieve a repeatable positioning accuracy of ± 0.150   mm in both x and y directions. For the x-direction, the probability that any measurement falls in the interval [ 0.114 , 0.106 ] is 98.5%. For the y-direction, about 97.5% of the measurements fall in the interval [ 0.094 ,   0.099 ] . The error of the rotation angle θ can be controlled within ±0.120°.

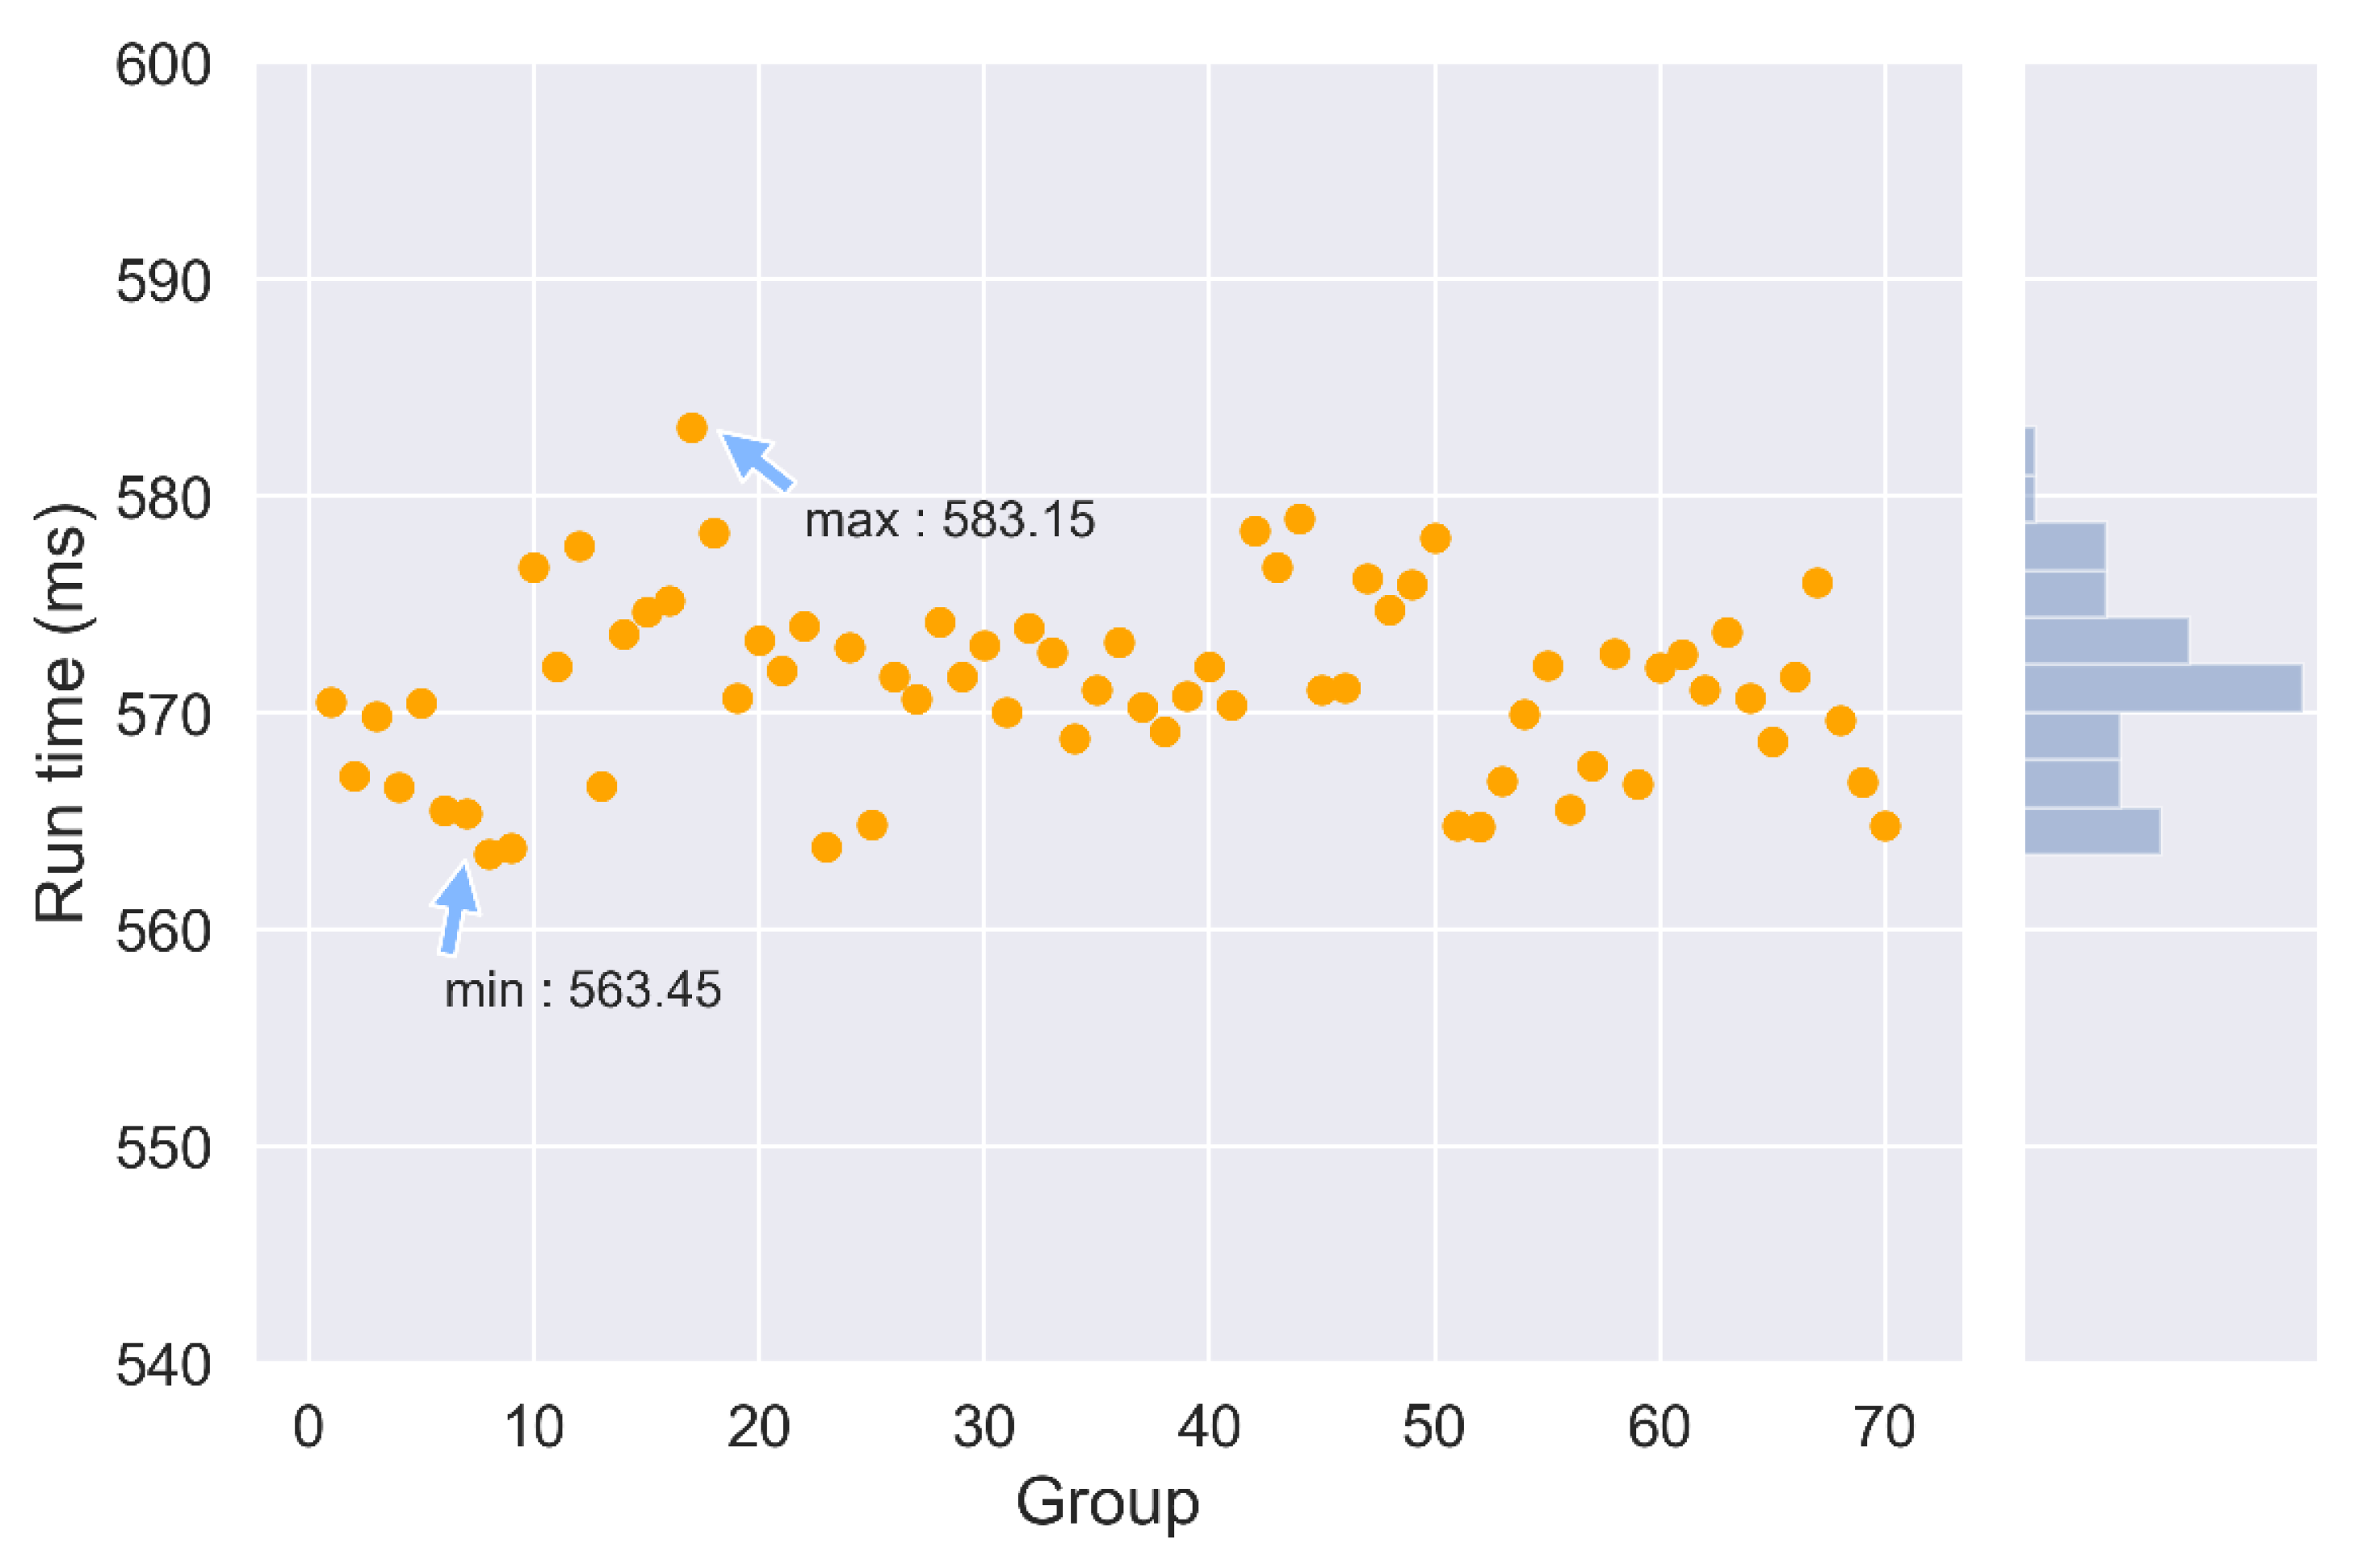
3.2. Evaluation of Temporal Performance

The results of the temporal performance evaluation of the vision localization system are shown in Figure 19. In this paper, the visual localization system’s statistical range of time consumption covers the whole process of acquiring images, image processing, extraction of position information from the track plate, and sending the extracted position information to the robot controller. We count the total execution time of this process for 70 groups. The results of the analysis of the specific values of the execution time are shown in Table 2. The shortest execution time is 563.45 ms, the longest execution time is 583.15 ms, and the arithmetic mean of all the data is 571.21 ms. The MAD and SD of the data are relatively small, which means that the precision is relatively high. Moreover, it can also be seen from Figure 19 that the vast majority of the data are concentrated in the interval of [ 560 ,   580 ] . More precisely, the probability of any measurement falling in the range [ 562.85 , 571.69 ] is about 98.6%. It is worth noting that this system uses a dual monocular camera, which means that it takes about 570 ms to complete the acquisition of two 18-megapixel images, the extraction of target position information, and the data communication between the modules. It can fully meet the needs of production beats.

4. Conclusions

Automated production systems are critical for improving productivity and increasing product quality in the construction of high-speed railway infrastructure. In this paper, an automated anchor sealing platform was designed based on six-axis robots and a machine vision system with the CRTS-III slab ballastless track plate required for high-speed railroads above 300 kM/h as the target product. The platform solves the high intensity and low efficiency of manual work at the anchor sealing station in the prefabrication process of the track plate. To improve the robustness of the six-joint robot in the case of deviation of the track plate position, we design an accurate and low-cost visual localization system to guide the robot motion. We carefully design a structure combining a dual monocular camera and a sliding table, which can acquire 4 k ( 4912 × 3688 ) images corresponding to a localized 200 × 150   mm 2 area and detect track plates with different sizes. We use an edge feature point-based approach to fit the target edges to enable efficient and accurate target localization in 4 K high-resolution images. In the target localization method, we use Rake ROI to extract the region of interest, significantly reducing the data volume and improving detection efficiency. The outlier rejection algorithm enhances the accuracy of the fitted edges. We have verified the visual localization system’s repeatable positioning accuracy and temporal performance in a real production environment. Using the six-axis robot coordinate system as the reference coordinate system, we achieved a repeatability accuracy of ± 0.150   mm in the x and y directions, and the error of the rotation angle θ can be controlled within ± 0.120 ° . The test results show that the visual localization system designed in this paper has good robustness to environmental changes such as illumination. In terms of time performance, it only takes about 570 ms from image acquisition and processing to the completion of the transformation of the hand–eye relationship from the image coordinate system to the robot coordinate system, most of which is spent on the transmission of the 18-megapixel image data. The successful practice resulting from the work in this paper can be successfully extended to other real-world scenarios with computational and runtime limitations. In addition, the research on the visual localization system in this paper provides insights for other tasks such as non-contact and high-precision measurement and inspection in industrial environments.

Author Contributions

Conceptualization, X.L., W.W. and L.Z.; methodology, X.L. and S.W.; software, X.L.; validation, X.L., S.W. and Q.Z.; formal analysis, X.L and Q.W.; investigation, L.Z., S.W. and Q.Z.; resources, X.L. and L.Z.; data curation, X.L. and Q.Z.; writing—original draft preparation, X.L.; writing—review and editing, W.W. and L.Z.; visualization, X.L.; supervision, W.W.; project administration, L.Z.; funding acquisition, L.Z. All authors have read and agreed to the published version of the manuscript.

Funding

This research was funded by the National Key R&D Program, China (No. 2018YFB1308803), and the China Postdoctoral Science Foundation (No. 2021M703394).

Conflicts of Interest

The authors declare no conflict of interest. The funders had no role in the design of the study; in the collection, analyses, or interpretation of data; in the writing of the manuscript, or in the decision to publish the results.

References

  1. Otsuka, A. Assessment of the improvement in energy intensity by the new high-speed railway in Japan. Asia Pac. J. Reg. Sci. 2020, 1–16. [Google Scholar] [CrossRef]
  2. Guo, X.; Sun, W.; Yao, S.; Zheng, S. Does High-Speed Railway Reduce Air Pollution along Highways?—Evidence from China. Transp. Res. Part D Transp. Environ. 2020, 89, 102607. [Google Scholar] [CrossRef]
  3. Demizu, F.; Li, Y.-T.; Schmöcker, J.-D.; Nakamura, T.; Uno, N. Long-term impact of the Shinkansen on rail and air demand: Analysis with data from Northeast Japan. Transp. Plan. Technol. 2017, 40, 741–756. [Google Scholar] [CrossRef]
  4. Kanazawa, H.; Su, K.; Noguchi, T.; Hachiya, Y.; Nakano, M. Evaluation of airport runway pavement based on pilots’ subjec-tive judgement. Int. J. Pavement Eng. 2010, 11, 189–195. [Google Scholar] [CrossRef]
  5. Zhi-ping, Z.; Jun-dong, W.; Shi-wen, S.; Ping, L.; Shuaibu, A.A.; Wei-dong, W. Experimental Study on Evolution of Mechan-ical Properties of CRTS III Ballastless Slab Track under Fatigue Load. Constr. Build. Mater. 2019, 210, 639–649. [Google Scholar] [CrossRef]
  6. Xu, Q.; Sun, H.; Wang, L.; Xu, L.; Chen, W.; Lou, P. Influence of Vehicle Number on the Dynamic Characteristics of High-Speed Train-CRTS III Slab Track-Subgrade Coupled System. Materials 2021, 14, 3662. [Google Scholar] [CrossRef]
  7. He, W.; Jiang, Z.; Ming, W.; Zhang, G.; Yuan, J.; Yin, L. A critical review for machining positioning based on computer vision. Measurement 2021, 184, 109973. [Google Scholar] [CrossRef]
  8. Wan, G.; Wang, G.; Fan, Y. A Robotic grinding station based on an industrial manipulator and vision system. PLoS ONE 2021, 16, e0248993. [Google Scholar] [CrossRef]
  9. Xu, Y.; Lv, N.; Fang, G.; Du, S.; Zhao, W.; Ye, Z.; Chen, S. Welding seam tracking in robotic gas metal arc welding. J. Mater. Process. Technol. 2017, 248, 18–30. [Google Scholar] [CrossRef]
  10. Pagano, S.; Russo, R.; Savino, S. A vision guided robotic system for flexible gluing process in the footwear industry. Robot. Comput. Manuf. 2020, 65, 101965. [Google Scholar] [CrossRef]
  11. Gao, M.; Li, X.; He, Z.; Yang, Y. An Automatic Assembling System for Sealing Rings Based on Machine Vision. J. Sens. 2017, 2017, 4207432. [Google Scholar] [CrossRef] [Green Version]
  12. Ni, Q.; Li, D.; Chen, Y.; Dai, H. Visual Positioning Algorithm Based on Micro Assembly Line. J. Phys. Conf. Ser. 2020, 1626, 012023. [Google Scholar] [CrossRef]
  13. Zhang, J.; Xu, Z.; Yu, F.; Tang, Q. A Fully Distributed Multi-Robot Navigation Method without Pre-Allocating Target Positions. Auton. Robot. 2021, 45, 473–492. [Google Scholar] [CrossRef]
  14. Pérez, L.; Rodríguez, Í.; Rodríguez, N.; Usamentiaga, R.; García, D.F. Robot Guidance Using Machine Vision Techniques in Industrial Environments: A Comparative Review. Sensors 2016, 16, 335. [Google Scholar] [CrossRef] [PubMed]
  15. Qin, T.; Li, P.; Shen, S. VINS-Mono: A Robust and Versatile Monocular Visual-Inertial State Estimator. IEEE Trans. Robot. 2018, 34, 1004–1020. [Google Scholar] [CrossRef] [Green Version]
  16. Min, Y.; Xiao, B.; Dang, J.; Yue, B.; Cheng, T. Real time detection system for rail surface defects based on machine vision. EURASIP J. Image Video Process. 2018, 2018, 3. [Google Scholar] [CrossRef] [Green Version]
  17. Dikarinata, R.; Wibowo, I.K.; Bachtiar, M.M.; Haq, M.A. Searching Ball Around ROI to Increase Computational Processing of Detection. In Proceedings of the 2020 International Electronics Symposium (IES), Surabaya, Indonesia, 29–30 September 2020; pp. 207–212. [Google Scholar]
  18. Rida, I.; Herault, R.; Marcialis, G.L.; Gasso, G. Palmprint recognition with an efficient data driven ensemble classifier. Pattern Recognit. Lett. 2019, 126, 21–30. [Google Scholar] [CrossRef]
  19. Chen, X.; Drew, M.S.; Li, Z.N. Illumination and Reflectance Spectra Separation of Hy-perspectral Image Data under Multiple Illumination Conditions. Electron. Imaging 2017, 2017, 194–199. [Google Scholar] [CrossRef] [Green Version]
  20. Yousif, W.K.; Ali, A.A. A Corporative System of Edge Mapping and Hybrid Path A*-Douglas-Pucker Algorithm Planning Method. J. Southwest Jiaotong Univ. 2019, 54. [Google Scholar] [CrossRef]
  21. Penumuru, D.P.; Muthuswamy, S.; Karumbu, P. Identification and classification of materials using machine vision and ma-chine learning in the context of industry 4.0. J. Intell. Manuf. 2019, 31, 1229–1241. [Google Scholar] [CrossRef]
  22. Tsai, D.-M.; Hsieh, Y.-C. Machine Vision-Based Positioning and Inspection Using Expectation–Maximization Technique. IEEE Trans. Instrum. Meas. 2017, 66, 2858–2868. [Google Scholar] [CrossRef]
  23. Yuan, X.C.; Wu, L.S.; Chen, H. Rail Image Segmentation Based on Otsu Threshold Method. Opt. Precis. Eng. 2016, 24, 1772–1781. [Google Scholar] [CrossRef]
  24. Zhou, J.; Qian, H.; Chen, C.-F.; Zhao, J.; Li, G.; Wu, Q.; Luo, H.; Wen, S.; Liu, Z. Optical edge detection based on high-efficiency dielectric metasurface. Proc. Natl. Acad. Sci. USA 2019, 116, 11137–11140. [Google Scholar] [CrossRef] [PubMed] [Green Version]
  25. Orujov, F.; Maskeliūnas, R.; Damaševičius, R.; Wei, W. Fuzzy Based Image Edge Detection Algorithm for Blood Vessel De-tection in Retinal Images. Appl. Soft Comput. 2020, 94, 106452. [Google Scholar] [CrossRef]
  26. Steger, C.; Ulrich, M.; Wiedemann, C. Machine Vision Algorithms and Applications; Wiley: Hoboken, NJ, USA, 2018; ISBN 978-3-527-41365-2. [Google Scholar]
  27. Connelly, L. Logistic Regression. Medsurg Nurs. 2020, 29, 353–354. [Google Scholar]
  28. Rida, I.; Al-Maadeed, N.; Al-Maadeed, S.; Bakshi, S. A comprehensive overview of feature representation for biometric recognition. Multimed. Tools Appl. 2018, 79, 4867–4890. [Google Scholar] [CrossRef]
  29. Aggarwal, C.C. An Introduction to Outlier Analysis. In Outlier Analysis; Springer: Berlin/Heidelberg, Germany, 2017; pp. 1–34. [Google Scholar]
  30. Wang, H.; Bah, M.J.; Hammad, M. Progress in Outlier Detection Techniques: A Survey. IEEE Access 2019, 7, 107964–108000. [Google Scholar] [CrossRef]
  31. Ting, K.M.; Aryal, S.; Washio, T. Which Outlier Detector Should I Use? In Proceedings of the 2018 IEEE International Con-ference on Data Mining (ICDM), Singapore, 17–20 November 2018; p. 8. [Google Scholar]
  32. Zhao, Y.; Nasrullah, Z.; Li, Z. Pyod: A Python Toolbox for Scalable Outlier Detection. arXiv 2019, arXiv:1901.01588. [Google Scholar]
  33. Rida, I.; Al-Maadeed, S.; Mahmood, A.; Bouridane, A.; Bakshi, S. Palmprint Identification Using an Ensemble of Sparse Rep-resentations. IEEE Access 2018, 6, 3241–3248. [Google Scholar] [CrossRef]
  34. Bandaragoda, T.R.; Ting, K.M.; Albrecht, D.; Liu, F.T.; Zhu, Y.; Wells, J.R. Isolation-Based Anomaly Detection Using Near-est-Neighbor Ensembles. Comput. Intell. 2018, 34, 968–998. [Google Scholar] [CrossRef]
  35. Damrongsakmethee, T.; Neagoe, V.-E. Principal Component Analysis and ReliefF Cascaded with Decision Tree for Credit Scoring. In Proceedings of the Computer Science Online Conference, Zlin, Czech Republic, 24–27 April 2019; pp. 85–95. [Google Scholar]
  36. Hariri, S.; Kind, M.C.; Brunner, R.J. Extended Isolation Forest. IEEE Trans. Knowl. Data Eng. 2021, 33, 1479–1489. [Google Scholar] [CrossRef] [Green Version]
  37. Hubert, M.; Debruyne, M.; Rousseeuw, P.J. Minimum Covariance Determinant and Extensions. Wiley Interdiscip. Rev. Comput. Stat. 2018, 10, e1421. [Google Scholar] [CrossRef] [Green Version]
  38. Koide, K.; Menegatti, E. General Hand–Eye Calibration Based on Reprojection Error Minimization. IEEE Robot. Autom. Lett. 2019, 4, 1021–1028. [Google Scholar] [CrossRef]
  39. Jia, G.; Dong, X.; Huo, Q.; Wang, K.; Mei, X. Positioning and navigation system based on machine vision intended for la-ser-electrochemical micro-hole processing. Int. J. Adv. Manuf. Technol. 2017, 94, 1397–1410. [Google Scholar] [CrossRef]
  40. Dongarra, J.; Gates, M.; Haidar, A.; Kurzak, J.; Luszczek, P.; Tomov, S.; Yamazaki, I. The Singular Value Decomposition: Anatomy of Optimizing an Algorithm for Extreme Scale. SIAM Rev. 2018, 60, 808–865. [Google Scholar] [CrossRef]
Figure 1. CRTS-III slab ballastless track plate without anchor sealing and anchor hole pattern before and after anchor sealing.
Electronics 10 03033 g001
Figure 2. Schematic diagram of the anchor sealing platform.
Electronics 10 03033 g002
Figure 3. Schematic diagram of the positioning principle of the visual localization system.
Electronics 10 03033 g003
Figure 4. Data flow of the visual localization system.
Electronics 10 03033 g004
Figure 5. Sample images taken in actual scenes.
Electronics 10 03033 g005
Figure 6. Diagram of ROI style: (a) the style of Line ROI; (b) the style of Rake ROI.
Electronics 10 03033 g006
Figure 7. Diagram of grayscale slope.
Electronics 10 03033 g007
Figure 8. Grayscale value and corresponding gradient of pixels in Line ROI: (a) the result of grayscale value gradient calculation of the image in the original state; (b) the image style and grayscale value gradient calculation of the original pixels after threshold segmentation.
Electronics 10 03033 g008
Figure 9. Schematic diagram of the extraction effect of edge feature points: (a) extraction of edge feature points using Line ROI and getting the coordinates of the edge points under the image coordinate system; (b) the effect of edge point extraction in the flat area of the track plate using Rake ROI.
Electronics 10 03033 g009
Figure 10. Schematic diagram of outliers.
Electronics 10 03033 g010
Figure 11. Distribution of feature point data in the image coordinate system.
Electronics 10 03033 g011
Figure 12. Outlier detection method based on Gaussian distribution.
Electronics 10 03033 g012
Figure 13. Effectiveness of several usual outlier detection algorithms on sample feature points: (a) KNN; (b) PCA; (c) isolate forest; (d) MCD.
Electronics 10 03033 g013
Figure 14. Outlier detection effect and edge fitting effect in the real image: (a) effect of outlier detection after zooming in on a local area of the image, with outliers marked in yellow and inliers marked in red; (b) obtained track plate position information based on edge straight line.
Electronics 10 03033 g014
Figure 15. (a) Device distribution model. (b) Diagram of device connection.
Electronics 10 03033 g015
Figure 16. Image processing software interface.
Electronics 10 03033 g016
Figure 17. Vision system guides six-axis robot to seal anchor.
Electronics 10 03033 g017
Figure 18. Error bar describing the deviation of measurement data from the reference value.
Electronics 10 03033 g018
Figure 19. Execution times and distribution of data in time–performance evaluation experiments.
Electronics 10 03033 g019
Table 1. Summary of evaluation items and experimental results of repeat positioning accuracy.
Evaluation ItemsΔx (mm)Δy (mm)Δθ (°)
Data Range−0.137–0.108−0.129–0.116−0.091–0.115
AM−0.0040.0020.010
MAD0.0460.0380.030
SD0.0550.0480.038
Table 2. Summary of evaluation items and experimental results of temporal performance.
Data Range(mm)AM (ms)MAD (ms)SD (ms)
563.45–583.15571.273.274.21
Publisher’s Note: MDPI stays neutral with regard to jurisdictional claims in published maps and institutional affiliations.

