
Traffic Inference System Using Correlation Analysis with Various Predicted Big Data


1
Division of Computer Software Engineering, Silla University, Busan 46958, Korea
2
Department of Data Informatics, Korea Maritime and Ocean University, Busan 49112, Korea
3
Department of Computer Engineering, Pukyong National University, Busan 48513, Korea
*
Authors to whom correspondence should be addressed.
Electronics 2021, 10(3), 354; https://0-doi-org.brum.beds.ac.uk/10.3390/electronics10030354
Submission received: 31 October 2020
/
Revised: 9 January 2021
/
Accepted: 23 January 2021
/
Published: 2 February 2021
(This article belongs to the Special Issue Electronic Solutions for Artificial Intelligence Healthcare)
Abstract
:Currently, most of the transportation systems require changes to intelligent transportation systems, but most of them focus on efficient transportation rather than on improvement in human life. Sometimes, traffic systems are designed for economic value, and safety-related issues are neglected. A traffic information system that reflects various kinds of environmental information related to people’s safety must be able to reflect not only the existing economic goals but also a safe traffic environment. The traffic environment can be thought of as safety and direct information such as rainfall, including information on specific days when many people are scheduled to be gathered for certain events nearby. Intelligent transportation systems using this information can provide safety-related information for traveling to a specific area or for business trips. In addition, traffic congestion is a social problem and is directly related to a comfort life for individuals. Therefore, addressing various social and environmental factors could make human life more stable and reduce stress as a result. To do that, we need to estimate the impact on traffic based on environmental Big Data. The data can generally be divided into structured data and unstructured data. In inference, structured data analysis is relatively easy due to the precise meaning of the data. Nonetheless, it can be very difficult to predict environmentally sensitive data, such as traffic volume in intelligent transportation systems. To cope with this problem, there are a few systems for handling unstructured data to find out specific events that affect the traffic volume and improve its reliability. This paper shows that it is possible to estimate the exact volume of traffic using correlation analysis with various predicted data. Thus, we may apply this technique to the existing intelligent transportation system to predict the exact volume of traffic with environmentally sensitive data including various unstructured data.
1. Introduction
Inference research through Big Data analysis is being developed in a way that only structured data, only unstructured data, and both structured data and unstructured data are studied. Unstructured data are produced in various types such as image, sound, and text. ITS research has been conducted using the clock-based method such as the Advanced Traveler Information System (ATIS), particularly focusing on the state and space [1]. In order to express potential traffic flow characteristics such as nonlinear space and time correlation, research on Stacked Auto-encoders Traffic Flow Prediction (SAEs) has been carried out to improve predictive performance by applying greedy class-based non-supervised learning [2].
Nonetheless, traffic information contains a lot of environmental information. Especially, various kinds of information such as construction information, fire information, and event information are important factors for determining traffic volume. Still, other studies focus only on the volume of traffic.
Furthermore, unstructured data analysis, while analyzing the structured data that already reflects environmental information such as traffic volume, would be more serious. If we assume that there is a certain event in a particular spot, the surrounding traffic volume may grow more than the assumed point of traffic. Nonetheless, this analysis is difficult to predict if the traffic information alone does not include past events and the results are different in the area where the specific event occurs. Therefore, if past event information is examined, the reliability of future traffic prediction information becomes high [3,4,5,6].
In addition, various studies related to artificial intelligence and data security [7] are underway. Still, what is most important is the pre-processing part of these data. In the field of artificial intelligence, if the relationship between data is not checked in advance in data extraction for learning, efficient learning cannot be performed. Therefore, the analysis of data using structured and unstructured data is a part to be studied continuously. Determining the relationship between data can be the basis for various studies; if it can be estimated by itself, the burden of hardware through complex algorithms can be minimized. In particular, systems such as support vector machine (SVM) and fuzzy may feel backwards to the times, but it is because the economic cost of the system is small in the system configuration.
The intelligent transportation system can consequently reduce the stress of traffic congestion and become a criterion for minimizing inefficient costs in the economic and industrial sectors. In other words, a large volume of traffic occurs on a specific road; still, if the traffic network is expanded without accurately recognizing its cause, social costs will increase. Moreover, the main cause is the increase in traffic volume for the next two to three years due to the periodic occurrence of certain events around the area, so the transportation network is expanded.
In this paper, we try to solve this problem by using correlation analysis to replace data by day of week and to select the most similar day of the week data to increase the reliability of traffic estimation. We propose a system that reflects event information, which are construction information and event information data corresponding to the relevant area that can be referenced on the Internet. In order to minimize errors that may occur by guessing an area where no such event occurs, we try to analyze the correlation analysis of calculating the net traffic volume.
2. Related Research
2.1. Latent Semantic Analysis
The mathematical foundation of Latent Semantic Analysis (LSA) is the Vector Space Model (VSM), an algebraic model for representing documents as vectors in a space where dictionary terms are used as dimensions [8]. The basic concept of this distributional representation is that linguistic terms with similar distributions have similar meanings; similarly, this traditional algorithm is used for Information Retrieval (IR). The algorithm uses the matrix, which is a fairly large sparse matrix so it has many disadvantages, and it is based on Singular Value Decomposition (SVD). In this paper, we try to analyze the unstructured data, which are the distribution of words as shown in Figure 1.
2.2. Fuzzy C-Means Clustering Algorithm
In general, the clustering algorithm allocates only one cluster to a cluster when a cluster is formed by dividing the data set. Nonetheless, in some cases, it may not be appropriate to assign each data object to one cluster only. On the other hand, the fuzzy clustering algorithm divides data objects into overlapping groups. Therefore, fuzzy clustering algorithms can provide more effective results than conventional clustering algorithms in understanding the structure of the original data sets [9].
Fuzzy C-means (FCM) is a data classification algorithm that uses a fuzzy segmentation technique to classify data points according to their membership degree. Membership Function U of the FCM clustering algorithm has elements with values between 0 and 1; the sum of membership values for the data set is always 1 as in the following equation:
The cost function for FCM clustering has the following equation:
- : degree of membership of the k-th data of belonging to the i-th cluster;
- : center vector of the i-th cluster;
- : a parameter that controls the amount of fuzzy in the classification process; usually ;
- : distance between the k-th data in the cluster and the center vector of the i-th cluster;
- : cost function for FCM clustering.
The FCM algorithm is based on the iterative optimization of the objective function with the fuzzy theory applied to the Last Square Criterion function [10]. Compared to taking a formal methodology, each pattern helps form more accurate information by giving a degree of belonging to a specific cluster. Figure 2 shows an example of FCM according to the temperature and amount of rainfall on the roads.
2.3. Correlation Analysis
Among the methods for estimating traffic volume, statistical techniques [11,12,13] have been used, or studies have been conducted to reduce such error ranges; however, in this paper, it is thought that there will be limitations in solving these errors by probabilistic calculations. A big problem in this area is that the prediction of traffic volume due to temporary events is greatly different. In this regard, it was expected that the amount of change in traffic volume should be checked by reviewing whether construction information and regional events are held using the LSA mentioned in Section 2.1.
Therefore, we have to provide two estimates of traffic. One is the average traffic volume, and the other is the irregular traffic volume increase due to construction information and local events. Estimation of irregular traffic volume was studied in previous studies [14], and it is intended to be applied using correlation analysis in relation to average traffic volume.
Correlation analysis is a statistical method for analyzing how closely the linear relationship between two variables is, with correlation referring to the strength of the relationship between two variables. A simple correlation analysis is used to measure how strongly two variables are related to each other according to the analysis method, and the intensity of the relationship between three or more variables is referred to as a multiple correlation analysis. The relationship between the variables is fixed, and the strength of the relationship between the two variables is called a partial correlation analysis. The sample correlation coefficient and difference test formulas are shown in Equations (1) and (2), respectively [15,16].
- : Pearson’s correlation coefficient;
- n: sample size;
- : the individual sample points indexed with ;
- : the sample mean;
- : t-distribution (student’s t-distribution).
3. Proposed System Architecture
Figure 3 shows the entire architecture proposed in this paper. In this system, the structured data and unstructured data are saved in the general database using Web Crawler and Data Extractor. The FCM clustering module is used to analyze the structured data, and the unstructured data are typically handled based on LSA clustering [16].
Here, analyzing the structured data means predicting whether the traffic is increased for the date. In addition, analyzing the unstructured data means finding and reflecting certain sentences including events that affect the traffic volume. Thus, the system will select the appropriate sentence and predict the date of the incident in relation to multiple information. Nonetheless, the traffic volume corresponding to the estimated date is determined by the data related to the event and the other traffic volume used as the traffic volume without the event, because the traffic volume is divided into two: one that is influenced by the event information, and one that is not affected by the event information [17,18,19,20].
Therefore, users can use the event so that they may guess the value of the event in the future in our system [21,22,23,24,25]. If they put it in our system, they can see the included event of traffic volume they choose. Not including the event of traffic volume can also be predicted by our system, because this system is based on pure Big Data that are traffic Big Data except the event information when collecting the Big Data.
The presented structure can be divided into structured data and unstructured data, and structured data are implemented using Fuzzy Inference as shown in Figure 4. In the algorithm of Figure 4, the Fuzzy Number is calculated with the group created using FCM clustering, and the calculated Fuzzy Number and Rule are applied. When the inference model is created, the final data are estimated by Defuzzification.
In detail, Fuzzy Inference Engine is an engine for inferring structured data, and it sets the number of inputs, outputs, and Membership Functions based on a large amount of existing crisp structured data and creates a rule. After that, the crisp value entered by the user is calculated using the Membership Function and Rule. The Fuzzy Inference engine consists of Fuzzy C-Means (FCM) Clustering, Fuzzy Number Calculator, and Defuzzification.
First. FCM Clustering: In FCM clustering, the number of input/output variables and the number of Membership Functions are set, and clustering is performed based on the input data. FCM consists of Fuzzy Number and Rule.
- Fuzzy Number: Defines and stores the Membership Function based on the maximum, minimum, and center values calculated in FCM clustering.
- Rule: Creates a Rule based on the calculated Membership Function and actual result value and saves this value.
Second. Fuzzy Number Calculator: Calculates the Fuzzy Number based on the crisp value and Membership Function inputted by the user from outside.
Third. Defuzzification: Calculates the crisp value using the area center method by applying the calculated Fuzzy Number and rule.
In the case of unstructured data analysis fuzzy reasoning system algorithm, it is analyzed as shown in Figure 5. When major information in several documents is inputted, multidimensional analysis is performed through the LSA engine. That is, the singular points of each word are extracted and stored in matrix form. It is delivered for analysis in FCM Inference of major environmental information and unstructured data, and the traffic volume for the last specific day is estimated.
4. Implementation and Evaluation
Figure 6 shows the simulator of FCM. The FCM simulator performs clustering using the actual traffic volume and precipitation, and then estimates the traffic volume and traffic time corresponding to each day of the week. As shown in the figure, on Saturday, the traffic volume is estimated to be 40,666, and the traffic time is 274,500 ms. In actual implementation, such observation tool is not required but produced separately for the review of the actual estimate.
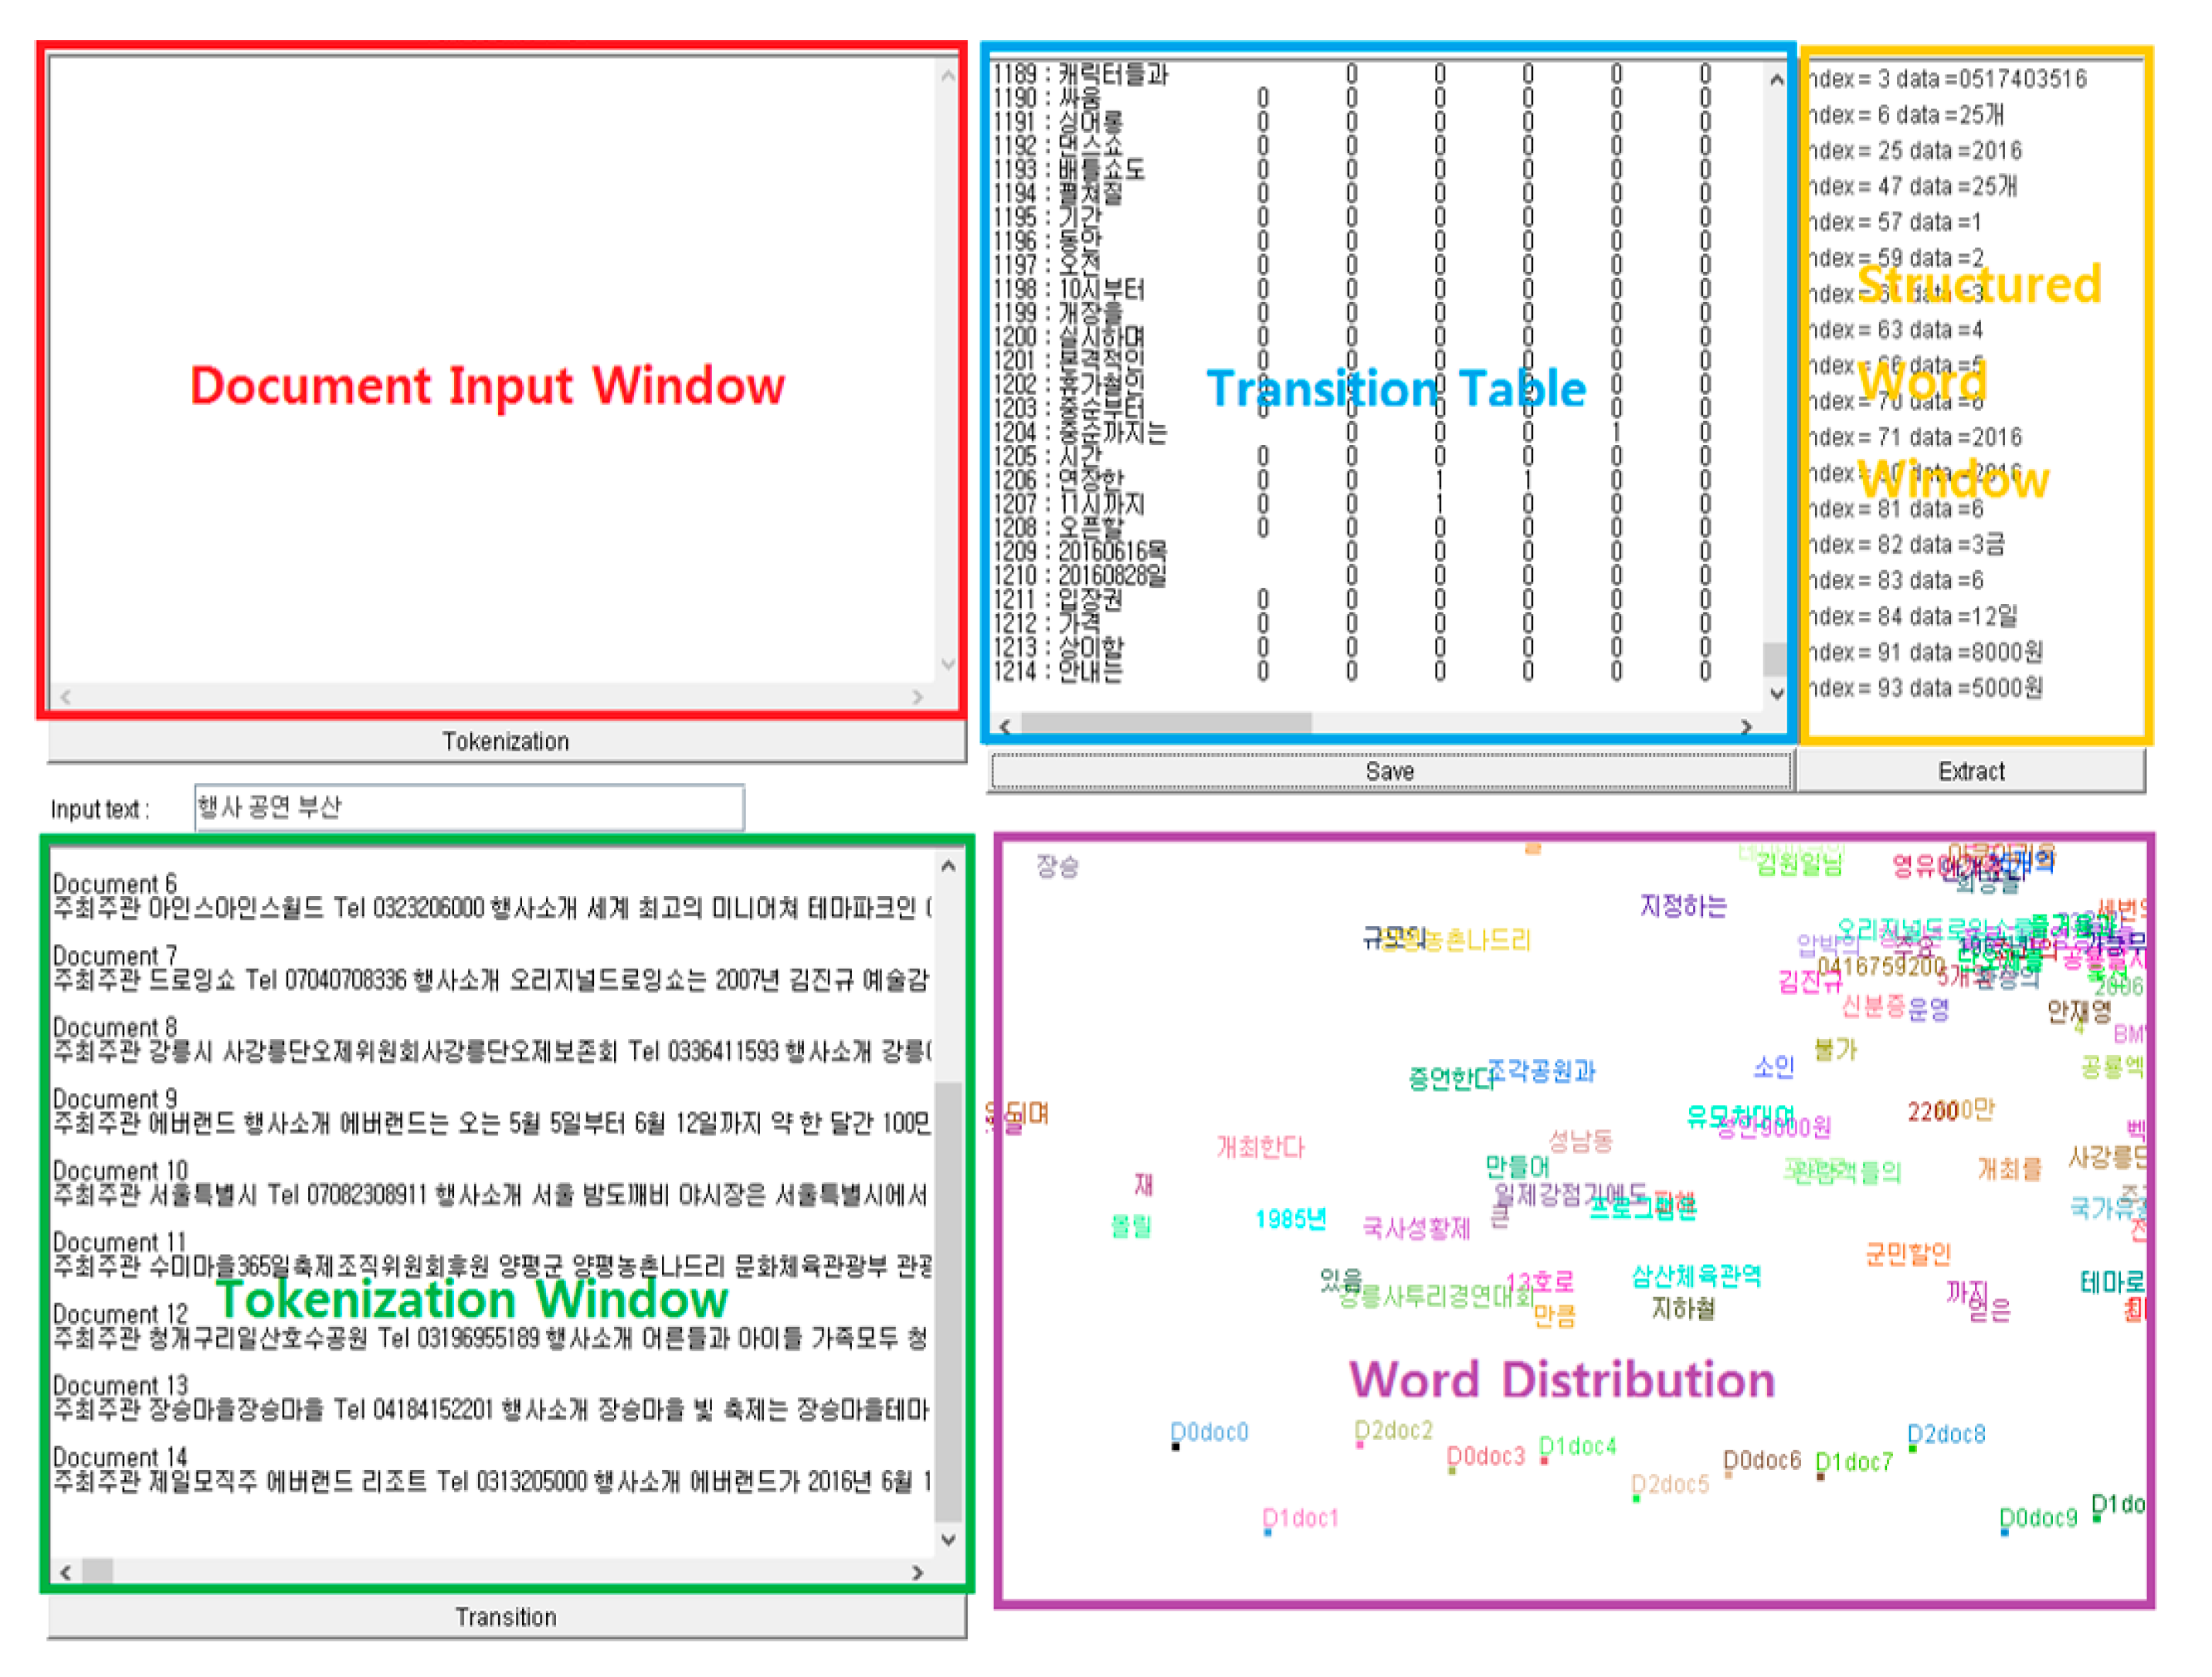
Figure 7 shows the analysis of word distribution using LSA. In the LSA simulator, entering a value on the Document Input Window on the upper left enables monitoring the decomposition of each document token by the Tokenization Window on the lower left and checking the tokenized words on the Transition Table Window at the upper center. Word Distribution on the lower right is for viewing the distribution according to the correlation of words; the Structured Word Window on the upper right can confirm the final standardized Big Data.
In this paper, we construct a system using traffic volume between Busan and Gimhae in June 2016. These data were used in previous studies, and the final goal was to predict the traffic volume in July 2016. For this purpose, the actual July data were collected together, and our system also estimated the July data and compared them.
By using the Membership Function created using FCM clustering, the rule for the result value is created, the Fuzzy Number is estimated for the value entered afterward, and the result is calculated by converting it into the final crisp value.
Figure 8 is a visualization of the learning results for the Big Data for the month of June based on the crisp value of traffic volume using MatLab. In this paper, this part is written as a Java program. Learning is represented by the slope of 7 Membership Functions, showing that the range of fluctuations according to the day of the week is irregular and varied. In particular, 3 Membership Functions (1, 2, 6) pass through 36,000 traffic points, which means that the three values are set according to the rule decision by prior learning.
In particular, membership functions 1 and 6 have a large difference in Fuzzy Numbers depending on the selection result. This means that, due to the characteristics of the Fuzzy System that applies the area-centered method during Defuzzification, center shift occurs considerably to the left or right, with the returned result value eventually fluctuating. This result is considered to be the ITS characteristic, and it can be seen that it reacts sensitively to small values; this sensitivity shows that precise measurement of information is possible.
This system is designed to predict the last one week and is composed of a dual system of 1 input 1 output and 2 inputs 1 output; the whole data are divided into days with and without rainfall, and learning is conducted. This is because, in the case of measured data, the test is performed based on the data in which the peculiar value has already been reflected, so it is considered to obtain more intact data.
Rainy days are classified according to the amount of precipitation, and learning is applied to enable more efficient and accurate prediction; FCM is applied to cluster large amounts of Crisp and fuzzy values accurately.
This result is shown in Figure 9. Unlike other weeks as shown in Figure 9, traffic on Sunday and Friday sees an irregular increase in the 4th week, due to the international motor festival held on the 4th of June. Therefore, if the international motor festival was not held, we wanted to know the traffic volume that would be generated.
It collects unstructured data (construction information, event information), divides it into an extractor, and calculates the final machine learning basic data through formalization using date marking characteristics.
- First: Based on event information, it is decomposed into behavioral units and stored in an array.
- It creates a matrix of a column consisting of document information and a row consisting of word information. In this study, the matching results for 1214 words after duplicate removal among 1754 words are used.
- Select the most similar documents. In the study, the similarity values for the words “event”, “performance”, and “Busan” are calculated, and the highest similarity value is document #3, which is confirmed as a document for the Busan International Motor Show 2016.
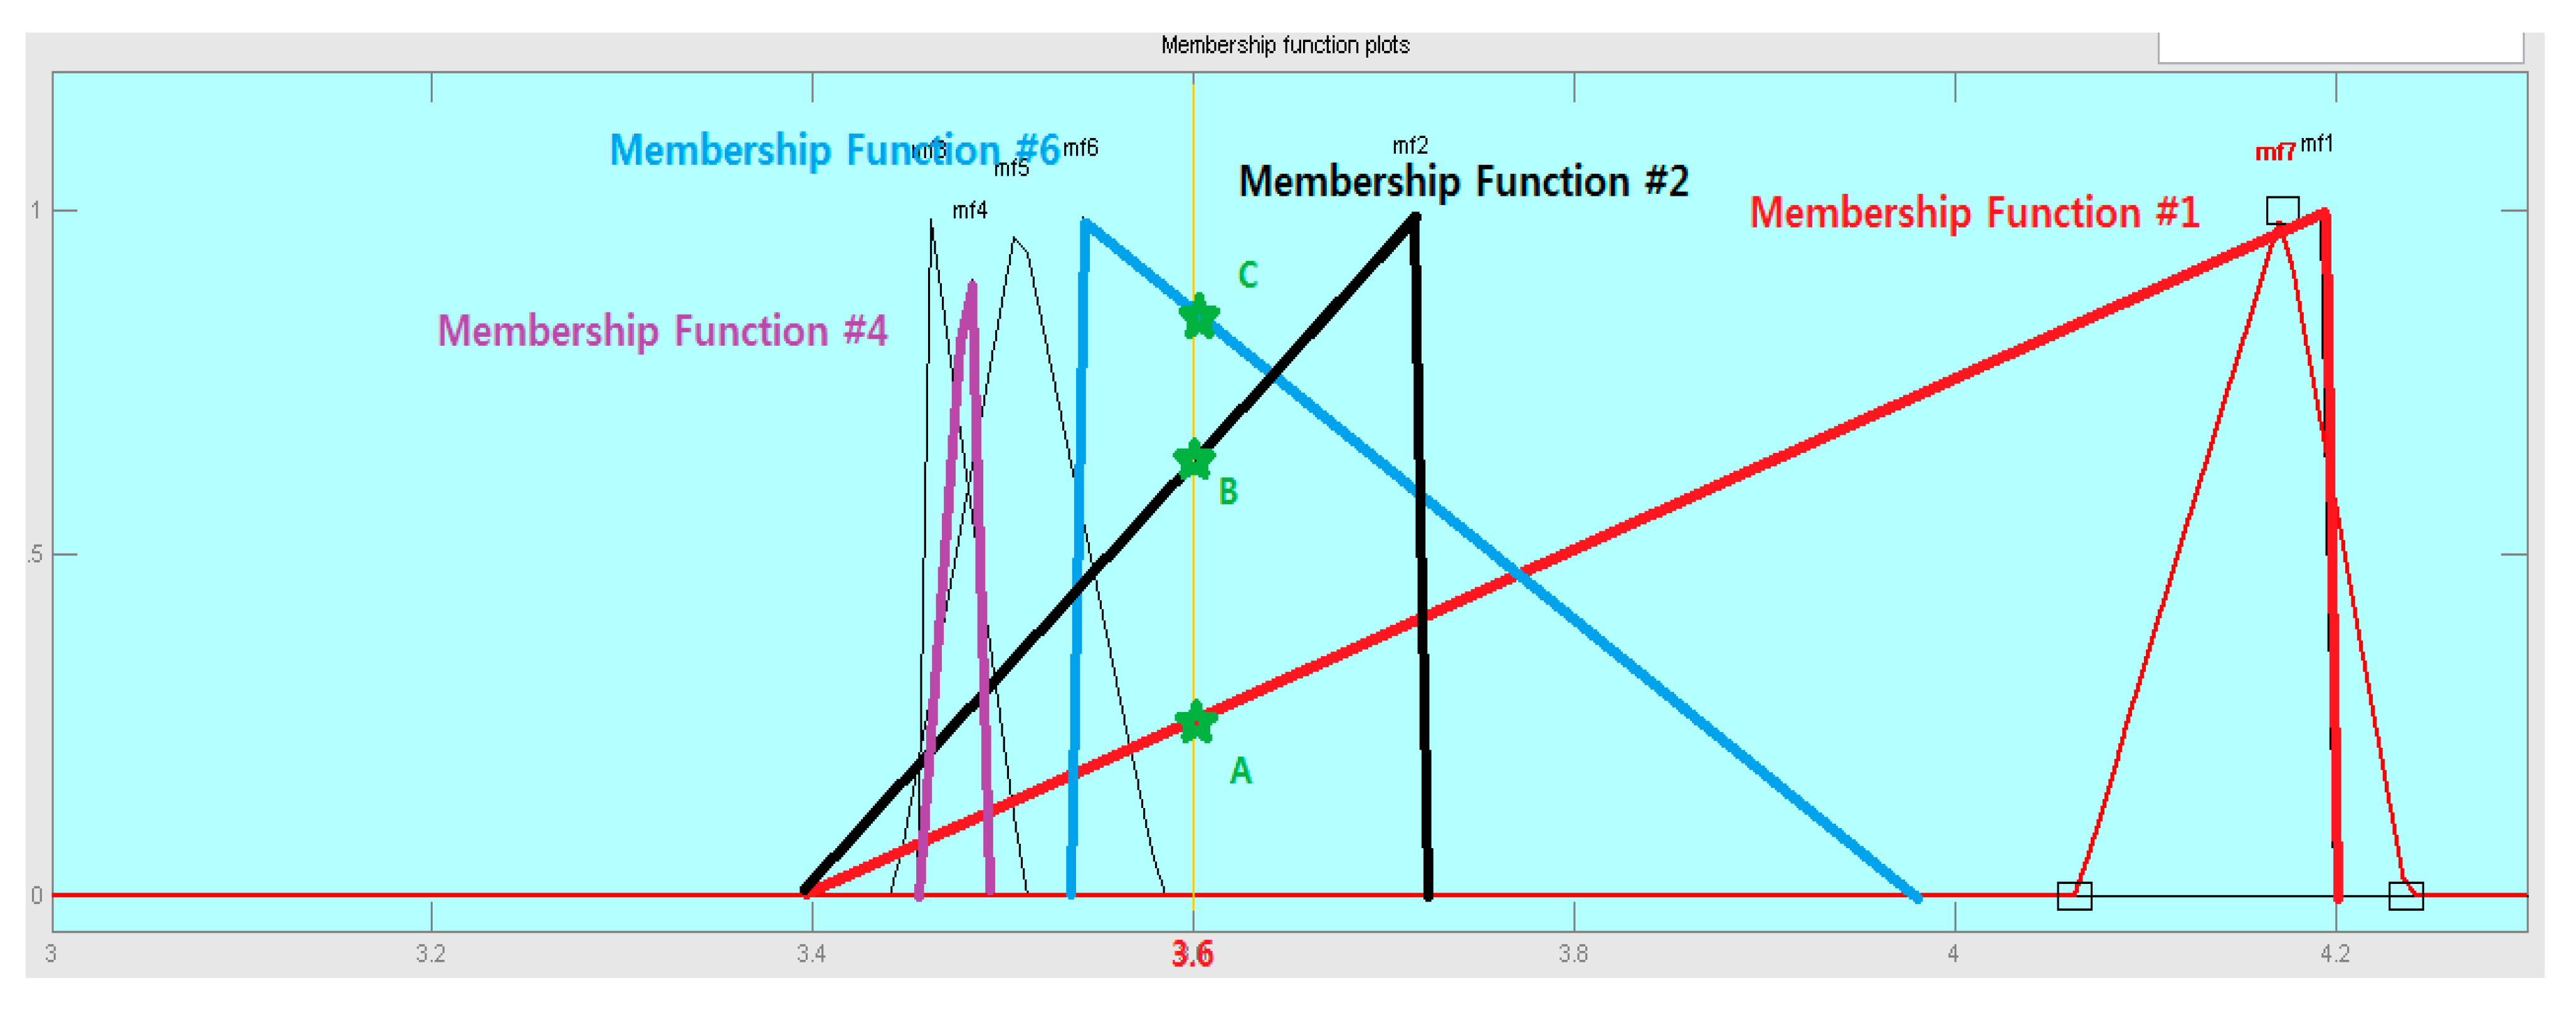
Figure 9 is a visualization of the Membership Function applied with unstructured data. Function #1, Function #2, and Function #6 are showing a lot of fluctuations, and it can be seen that the existing points A and C have changed from 3600 traffic volume. In particular, the center point of Function #1 has moved to Saturday, so the event is held on Saturday. You can see a sharp increase in traffic volume.
As shown in Figure 10, it is possible to estimate the result of the traffic volume for each week in the same way as above.
We thought that we had to separate the data with the event and without the event to solve the problem. We also realized that we had to consider how to get pure traffic value that is not affected by the events. Nonetheless, it is difficult to determine the volume of traffic on the scale of the event from the data with the actual event; rather, it would be easier to estimate the volume of traffic when the event was originally included, but there was no event. This is because we can find traffic on a similar day.
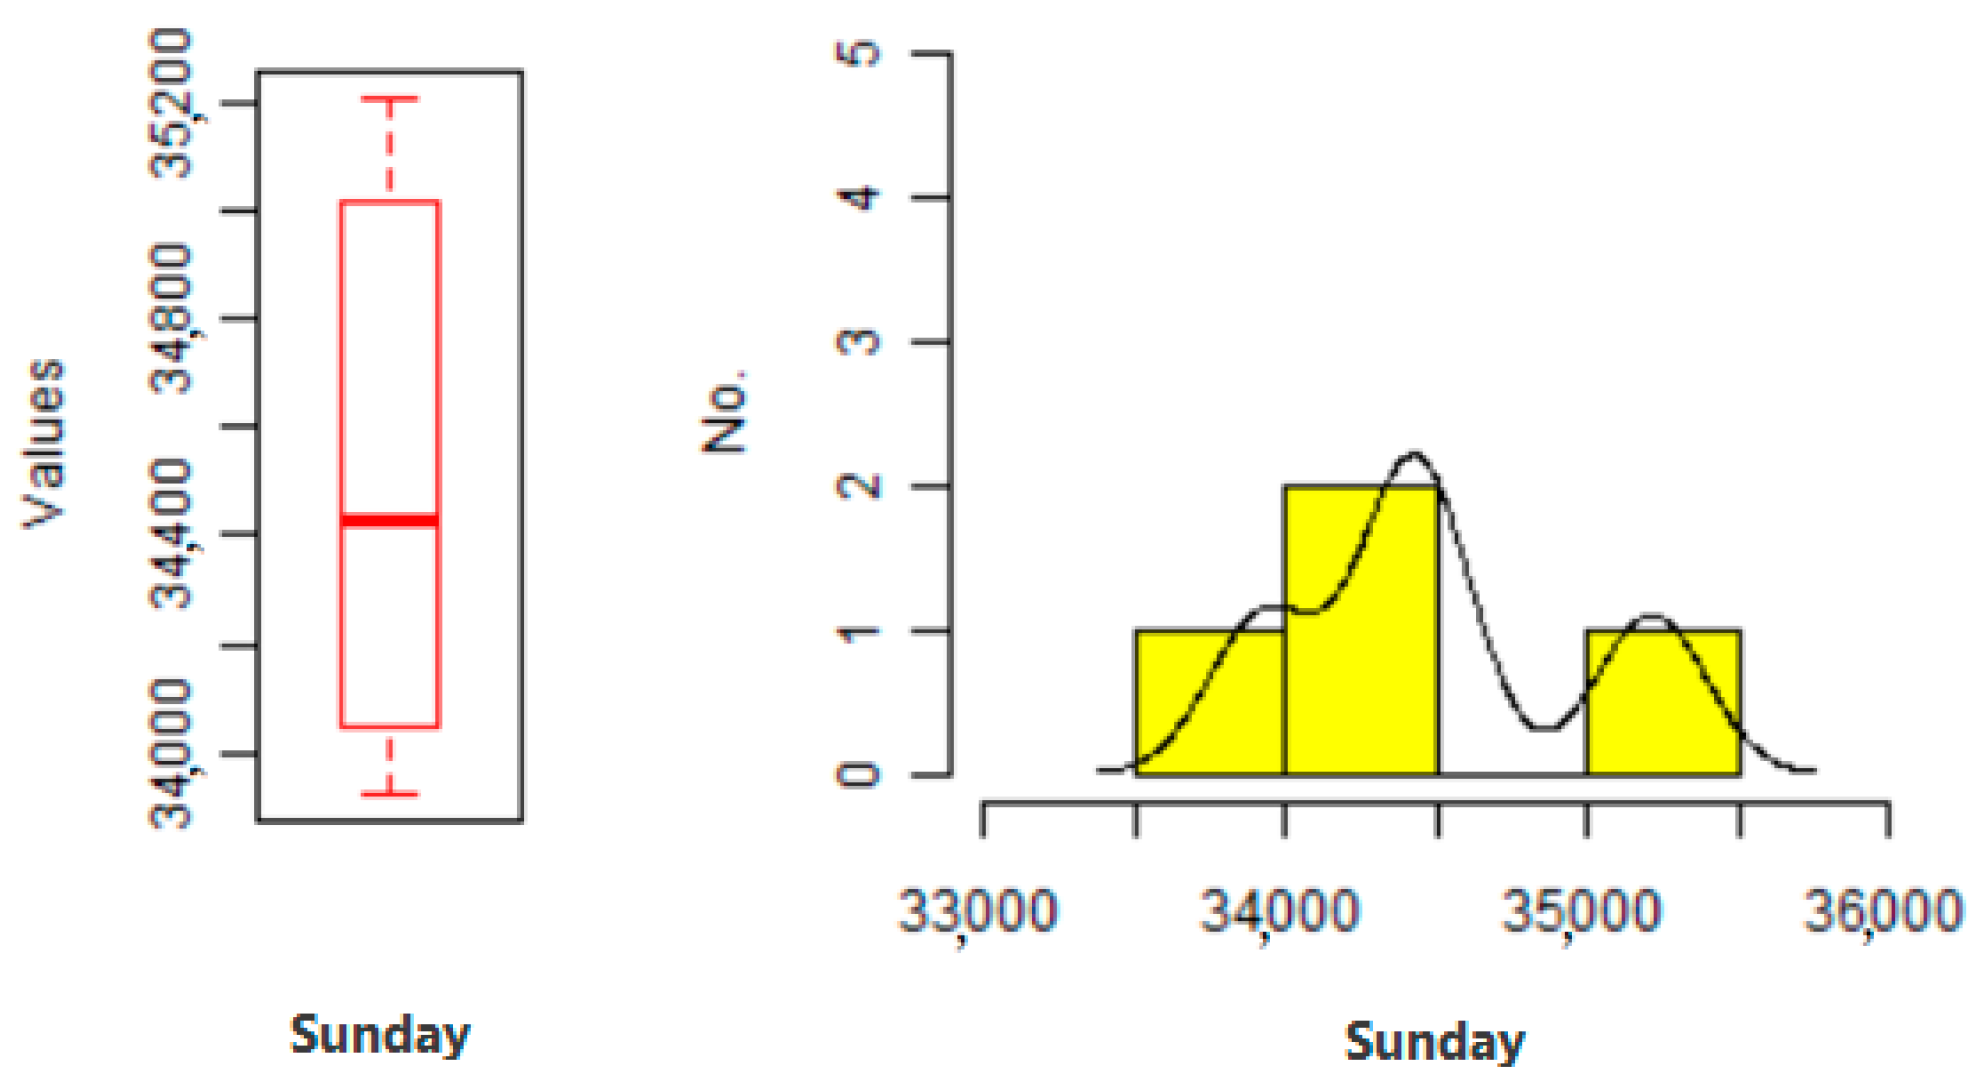
Figure 11, Figure 12, Figure 13 and Figure 14 show the distribution of data with and without event data, among which Figure 11 shows data for Sunday. Here, we can see that the average point is downward. This means that data for the first week, second week, third week, and fifth week on Sunday are in the range of 36,000 vehicles to 34,000 vehicles, and that the data of the fourth week are in the range of 40,000 vehicles to 42,000 vehicles, which is consistent with the analysis in Figure 10. We analyzed the unstructured data and predicted an increase in the number of vehicles due to the motor show in the fourth week.
Figure 11 and Figure 12 show the variance of traffic volumes without an event, and Figure 13 and Figure 14 present the variance of traffic volumes with an event.
In order to obtain such variance data, we refer to the traffic information at the past time for the traffic volumes at the time of the event. Of course, too old information was not used. This is because the natural increase due to the development of the region must be considered.
4.1. Implementation
These Big Data are an increased value of traffic volume due to environmental information. If the user wants to analyze the traffic volume when there is no event, it can be regarded as a noise value. Therefore, this value is deleted. Big Data analysis after deletion is shown in Figure 12, where the middle value and the average value move to the center as the noise disappears. In this paper, we examine the traffic volume on the day when an event occurs. If the user wants the volume of traffic on the day without an event, delete the data on the day when the event occurs.
In this section, an arbitrary rank value is assigned to each day, and the correlation coefficient is calculated first followed by the t score using the determined correlation coefficient. t means the value of the horizontal axis belonging to the range of 0.5% in the dispersion. The final p-value is calculated from the t score. The results of using the Statistical Analysis Tool (SALT) program are shown in Table 1 and Figure 15.
In Figure 15, the vertical axis and the horizontal axis represent the volume of traffic corresponding to each day of the week. It can be estimated as a more consistent value if the increased size is identical, and the closest accordance value is shown to the center line between Monday and Sunday.
In Table 1, for each day of the week, we apply the Spearman correlation coefficient. The p-values of Thursday and Wednesday, Saturday and Friday, and Monday and Sunday are correlated to less than 0.05, and the value of the relevant event is changed by the correlated traffic value.
Nonetheless, there was a matter that could not be considered relevant in the remaining relationship. In this paper, we select the lowest volume of p-value. In the results of this experiment, we calculated the daily and weekly correlations and replaced the values on the day of the event. In other words, there was a correlation between Monday and Sunday and between the 4th and 2nd weeks. Therefore, the value on the 4th Sunday could be regarded as correlated with the value on the Sunday of the 2nd and changed. This way, we find the highly correlated week and day and increase the accuracy of the average data by assigning the derived value to the place with the excluded data included with the event.
4.2. Evaluation
Table 3 describes the forecast of the traffic value with the proposed system and the existing system. There were events on Tuesday and Monday in June, but not in July. If we estimate the data for July, except for the traffic volume increased by the event, we should estimate the volume of traffic on Tuesday and Monday in July. Therefore, the traffic value on the day including the event information was removed, the traffic volume on the day the event was not included was predicted according to correlation analysis, and the data was replaced. As a result, we can see that it is better than the existing results.
Nonetheless, on Sunday, the event information was assumed to have been reflected, and the existing data were removed and the substitute data were inserted; thus resulting in lower reliability. This is expected to require more scrutiny from unstructured data analysis.
Figure 16 is a graph comparing the existing system with the proposed system in July. On Monday and Tuesday, we found that the proposed system is closer to the actual data than the existing system. Nonetheless, on Saturday, we found that the proposed system’s traffic information is not accurate compared to the existing system. The results show that pure traffic information is not detected accurately on Saturdays when many events occur, and this difficulty is found in this part.
Meanwhile, our goal was to estimate the average traffic volume. Therefore, we implemented the traffic volume estimation system with FCM. However, when estimating from these FCMs, it is necessary to use the old traffic volume, the problem is that the actual traffic volume information is traffic volume including regional influence.
Therefore, we preemptively used the LSA to calculate an estimate including regional traffic volume so that we can know the extent of regional impact on the FCM.
After that, we began to study how statistical techniques could be used to exclude local traffic.
The scientific contribution you mentioned is in a method of comparing the traffic volume estimated using the LSA (including regional events) and the traffic volume without regional events, and is based on systemizing this.
The importance of this is that it is difficult to measure traffic volume in the absence of specific events from the Big Data collected. This is because a lot of problems arise when designing such as urban planning with traffic volume that includes these short-term specific events. As a result that the event can end at any time, it can disappear.
5. Conclusions
Most of the actual data are affected by the surrounding environment information, and we have researched these influencing factors. If we can analyze these elements well, it will help us study actual data. Nonetheless, such data may or may not be readily recognizable by us, and it is especially difficult to define clearly the parts that affect traffic volume such as traffic volume analysis. Therefore, a system that accurately predicts the volume of traffic without an event is required, but this research is still lacking until now. Actually, it is true that there are many difficulties when we use environment information. Nonetheless, we need to attempt such to implement the system.
Therefore, we proposed Big Data prediction systems based on various kinds of information such as structured data and unstructured data. In addition, the proposed system was applied with statistical method in order to address the traffic volume Big Data containing specific environmental information.
We also proposed applying the system by statistical method to process the traffic Big Data including specific environmental information. We implemented the proposed system and confirmed that the results were more efficient and more accurate than the existing system. We also expect pure data without event information to be applied to various systems requiring traffic information.
Although we could not analyze various other inference systems in parallel in this research, we could obtain net data that did not include environmental information using various algorithms. These results are better than those of one exact algorithm only. Based on the results, we could predict the correct volume of traffic according to the condition of environmental information.
In further research, we intend to reinforce environmental information in unstructured data analysis and to include analysis related to neural network.
Author Contributions
Conceptualization, Y.K., M.C. and J.-H.H.; data curation, M.C.; formal analysis, Y.K., J.-H.H., and M.C.; funding acquisition, M.C.; investigation, Y.K. and M.C.; methodology, Y.K.; project administration, J.-H.H. and M.C.; resources, Y.K., J.-H.H., and M.C.; software, Y.K., J.-H.H., and M.C.; supervision, Y.K., J.-H.H., and M.C.; validation, J.-H.H. and M.C.; visualization, Y.K. and M.C.; writing—original draft, Y.K., J.-H.H., and M.C.; writing—review and editing, J.-H.H. and M.C. All authors have read and agreed to the published version of the manuscript.
Funding
This research was supported by Basic Science Research Program through the National Research Foundation of Korea (NRF) funded by the Ministry of Education (NRF-2017R1D1A1B03030033).
Data Availability Statement
Korea Expressway Public Data Information (Traffic volume by office: http://data.ex.co.kr/portal/fdwn/view?type=TCS&num=34&requestfrom=dataset, Traffic volume by region: http://data.ex.co.kr/portal/fdwn/view?type=TCS&num=32&requestfrom=dataset, Traffic volume between offices: http://data.ex.co.kr/portal/fdwn/view?type=TCS&num=35&requestfrom=dataset, Section Traffic: http://data.ex.co.kr/portal/fdwn/view?type=VDS&num=38&requestfrom=dataset) and Road construction status (http://data.ex.co.kr/openapi/basicinfo/openApiInfoM?apiId=0614&serviceType=&keyWord=&searchDayFrom=2014.12.01&searchDayTo=2021.01.28&CATEGORY=CO&GROUP_TR=)
Acknowledgments
This paper is a revised and expanded version of a paper titled Traffic Prediction System Utilizing the Application and Control of Environmental Information conference proceeding in 2017 in the Lecture Notes in Electrical Engineering (Conference proceedings) [23], 474, December 2017 and presented at the 12th KIPS International Conference on Ubiquitous Information Technologies and Applications (CUTE 2017), 18–20 December 2017, Providence University, Taiwan.
Conflicts of Interest
The authors declare no conflict of interest.
Abbreviations
| FCM | Fuzzy C-Means |
| ITS | Intelligent Transportation Systems |
| ATIS | Advanced Traveler Information System |
| SAEs | Stacked Auto-encoders Traffic Flow Prediction |
| LSA | Latent Semantic Analysis |
| VSM | Vector Space Model |
| SVD | Singular Value Decomposition |
| IR | Information Retrieval |
| SALT | Statistical Analysis Tool (Programming tool) |
| p-value | The probability of obtaining results at least as extreme as the observed results of a statistical hypothesis test |
| Busan | City name in Korea |
| Gimhae | City name in Korea |
References
- Stathopoulos, A.; Karlaftis, M.G. A multivariate state space approach for urban traffic flow modeling and prediction. Transp. Res. Part C Emerg. Technol. 2003, 11, 121–135. [Google Scholar] [CrossRef]
- Lv, Y.; Duan, Y.; Kang, W.; Li, Z.; Wang, F.-Y. Traffic Flow Prediction With Big Data: A Deep Learning Approach. IEEE Trans. Intell. Transp. Syst. 2014, 16, 865–873. [Google Scholar] [CrossRef]
- Blumberg, R.; Shaku, A. The Problem with Unstructured Data; Atre Group, Inc.: New York, NY, USA, 2003; p. 42. [Google Scholar]
- Tirgari, V. Information technology policies and procedures against unstructured data: A phenomenological study of information technology professionals. J. Manag. Inf. Decis. Sci. 2012, 15, 87. [Google Scholar]
- Bakshi, K. Considerations for big data: Architecture and approach. In Proceedings of the 2012 IEEE Aerospace Conference, Big Sky, MT, USA, 3–10 March 2012; pp. 1–7. [Google Scholar]
- Ali, M.; Fathalla, S.; Kholief, M.; Hassan, Y.F. The problem learning Non-Taxonomic Relationships of Ontologies from unstructured data sources. In Proceedings of the 2017 23rd International Conference on Automation and Computing (ICAC), Huddersfield, UK, 7–8 September 2017; pp. 1–6. [Google Scholar]
- Zheng, Y.; Liu, F.; Hsieh, H.P. U-air: When urban air quality inference meets big data. In Proceedings of the 19th ACM SIGKDD International Conference on Knowledge Discovery and Data Mining, Chicago, IL, USA, 11–14 August 2013. [Google Scholar]
- Evangelopoulos, N.; Xiaoni, Z.; Prybutok, V.R. Latent sementic analysis: Five methodological recommendation. J. Inf. Syst. 2012, 21, 70–86. [Google Scholar] [CrossRef]
- Zimmermann, H.J. Fuzzy Set Theory and Its Applications; Kluwer Academic Publishers: Amsterdam, The Netherlands, 2001. [Google Scholar]
- Kim, Y. Fuzzy Inference System Based on the Formal Analysis of Unstructured Data. Master’s Thesis, Pukyong National University, Pukyong, Korea, 2017. [Google Scholar]
- Zambrano-Martinez, J.L.; Calafate, C.T.; Soler, D.; Cano, J.-C. Towards Realistic Urban Traffic Experiments Using DFROUTER: Heuristic, Validation and Extensions. Sensors 2017, 17, 2921. [Google Scholar] [CrossRef] [PubMed] [Green Version]
- Zambrano-Martinez, J.L.; Calafate, C.T.; Soler, D.; Cano, J.-C.; Manzoni, P. Modeling and Characterization of Traffic Flows in Urban Environments. Sensors 2018, 18, 2020. [Google Scholar] [CrossRef] [PubMed] [Green Version]
- Van Hinsbergen, C.P.I.J.; Schreiter, T.; Zuurbier, F.S.; Van Lint, J.W.C.; Van Zuylen, H.J. Localized Extended Kalman Filter for Scalable Real-Time Traffic State Estimation. IEEE Trans. Intell. Transp. Syst. 2012, 13, 385–394. [Google Scholar] [CrossRef]
- Kim, Y.; Chung, M. Unstructured Data Service Model Utilizing Context-Aware Big Data Analysis; Lecture Notes in Electrical Engineering; Springer: Singapore, 2016; Volume 421, pp. 926–931. [Google Scholar]
- Cohen, J.; Cohen, P.; West, S.G.; Aiken, L.S. Applied Multiple Regression/Correlation Analysis for the Behavioral Sciences, 2rd ed.; Lawrence Erlbaum Associates, Inc.: Hillsdale, MI, USA, 2003. [Google Scholar]
- Walck, C. Hand-Book on Statistical Distributions for Experimentalists; University of Stockholm: Stockholm, Sweden, 2007. [Google Scholar]
- Chen, Q.; Song, X.; Yamada, H.; Shibasaki, R. Learning deep representation from big and heterogeneous data for traffic accident inference. In Proceedings of the Thirtieth AAAI Conference on Artificial Intelligence, Phoenix, AZ, USA, 12–17 February 2016. [Google Scholar]
- Singh, D.; Upadhyay, R.; Pannu, H.S.; Leray, D. Development of an adaptive neuro fuzzy inference system based vehicular traffic noise prediction model. J. Ambient. Intell. Humaniz. Comput. 2020, 1–17. [Google Scholar] [CrossRef]
- Shi, Q.; Abdel-Aty, M. Big Data applications in real-time traffic operation and safety monitoring and improvement on urban expressways. Transp. Res. Part C Emerg. Technol. 2015, 58, 380–394. [Google Scholar] [CrossRef]
- Li, H.; Xu, Z.; Zhu, H.; Ma, D.; Li, S.; Xing, K. Demographics inference through Wi-Fi network traffic analysis. In Proceedings of the IEEE INFOCOM 2016-The 35th Annual IEEE International Conference on Computer Communications, San Francisco, CA, USA, 10–14 April 2016; pp. 1–9. [Google Scholar]
- Tang, J.; Liu, F.; Zou, Y.; Zhang, W.; Wang, Y. An Improved Fuzzy Neural Network for Traffic Speed Prediction Considering Periodic Characteristic. IEEE Trans. Intell. Transp. Syst. 2017, 18, 2340–2350. [Google Scholar] [CrossRef]
- Gokulan, B.P.; Srinivasan, D. Distributed Geometric Fuzzy Multiagent Urban Traffic Signal Control. IEEE Trans. Intell. Transp. Syst. 2010, 11, 714–727. [Google Scholar] [CrossRef]
- Kim, Y.; Chung, M. Traffic Prediction System Utilizing Application and Control of Environmental Information; Lecture Notes in Electrical Engineering; Springer: Berlin/Heidelberg, Germany, 2017; Volume 474, pp. 1043–1050. [Google Scholar]
- Meng, W.; Li, W.; Su, C.; Zhou, J.; Lu, R. Enhancing Trust Management for Wireless Intrusion Detection via Traffic Sampling in the Era of Big Data. IEEE Access 2017, 6, 7234–7243. [Google Scholar] [CrossRef]
- Ortega, L.C.; Otero, L.D.; Otero, C.E. Fuzzy Inference System Framework to Prioritize the Deployment of Resources in Low Visibility Traffic Conditions. IEEE Access 2019, 7, 174368–174379. [Google Scholar] [CrossRef]
Figure 1.
Example of Singular Value Decomposition (SVD).

Figure 2.
Example of Fuzzy C-means (FCM) according to the temperature and amount of rainfall on the roads.
Figure 2.
Example of Fuzzy C-means (FCM) according to the temperature and amount of rainfall on the roads.

Figure 3.
Proposed system architecture.

Figure 4.
Algorithm of structured data analysis.

Figure 5.
Unstructured data analysis fuzzy reasoning system algorithm.

Figure 6.
Example of an FCM simulator.

Figure 7.
Example of a Latent Semantic Analysis (LSA) simulator.

Figure 8.
Example of a Membership Function: the vertical axis is Membership Function, and the horizontal axis is the traffic volume: Membership function #1~7 means sequentially from distribution of Sunday traffic volume to Saturday traffic volume.
Figure 8.
Example of a Membership Function: the vertical axis is Membership Function, and the horizontal axis is the traffic volume: Membership function #1~7 means sequentially from distribution of Sunday traffic volume to Saturday traffic volume.

Figure 9.
Membership Function example after applying unstructured data: the vertical axis is Membership Function, and the horizontal axis is the traffic volume. Membership function #1~7 means sequentially from distribution of Sunday traffic volume to Saturday traffic volume.
Figure 9.
Membership Function example after applying unstructured data: the vertical axis is Membership Function, and the horizontal axis is the traffic volume. Membership function #1~7 means sequentially from distribution of Sunday traffic volume to Saturday traffic volume.

Figure 10.
Estimated volume of each weekly traffic.

Figure 11.
Before a variance of excluding the noise data on Sunday: In the graph, the vertical axis is the day of the week, and the horizontal axis is the traffic volume.
Figure 11.
Before a variance of excluding the noise data on Sunday: In the graph, the vertical axis is the day of the week, and the horizontal axis is the traffic volume.

Figure 12.
Before a variance of excluding the noise data on Monday: In the graph, the vertical axis is the day of the week, and the horizontal axis is the traffic volume.
Figure 12.
Before a variance of excluding the noise data on Monday: In the graph, the vertical axis is the day of the week, and the horizontal axis is the traffic volume.

Figure 13.
After the variance of excluding the noise data on Sunday: In the graph, the vertical axis is the day of the week, and the horizontal axis is the traffic volume.
Figure 13.
After the variance of excluding the noise data on Sunday: In the graph, the vertical axis is the day of the week, and the horizontal axis is the traffic volume.

Figure 14.
After a variance of excluding the noise data on Monday: In the graph, the vertical axis is the day of the week, and the horizontal axis is the traffic volume.
Figure 14.
After a variance of excluding the noise data on Monday: In the graph, the vertical axis is the day of the week, and the horizontal axis is the traffic volume.

Figure 15.
Correlation analysis graph for each day of the week on Sunday: all vertical and horizontal axis is traffic volume and (a) is correlation analysis between Sunday and Monday; (b) between Sunday and Tuesday; (c) between Sunday and Wednesday; (d) between Sunday and Thursday; (e) between Sunday and Friday; and (f) between Sunday and Friday.


Figure 16.
Comparison graph of the traffic volume for actual data.


Table 1.
Correlation analysis table for each day.
| Week. | Monday | Tuesday | Wednesday | Thursday | Friday | Saturday |
|---|---|---|---|---|---|---|
| Sunday | 0.99/0.003 | 0.68/0.31 | 0.75/0.24 | 0.58/0.41 | 0.70/0.29 | 0.77/0.23 |
| Monday | 0.70/0.20 | 0.79/0.20 | 0.61/0.38 | 0.72/0.27 | 0.79/0.20 | |
| Tuesday | 0.70/0.18 | 0.70/0.18 | 0.53/0.35 | 0.74/0.15 | ||
| Wednesday | 0.92/0.02 | 0.56/0.32 | 0.55/0.32 | |||
| Thursday | 0.23/0.70 | 0.30/0.61 | ||||
| Friday | 0.94/0.01 |
(Standardized Coefficient/p-value).
Table 2.
Correlation analysis table for each week.
| Week | 1st | 2nd | 3rd | 4th | 5th |
|---|---|---|---|---|---|
| 1st | 0.90/0.005 | 0.90/0.005 | 0.90/0.03 | 0.95/0.06 | |
| 2nd | 0.99/0.01 | 0.990.01 | 0.86/0.01 | ||
| 3rd | 0.99/0.01 | 0.85/0.01 | |||
| 4th | 0.81/0.09 |
(Standardized Coefficient/p-value).
Table 3.
Reliability comparison between the existing system and the proposed system for actual data.
Table 3.
Reliability comparison between the existing system and the proposed system for actual data.
| Week Day | Existing SYSTEM | Proposed SYSTEM | Actual Data | Existing System Reliability | Proposed System Reliability |
|---|---|---|---|---|---|
| Sunday | 34,802 | 34,134 | 33,243 | 1.04 | 1.02 |
| Monday | 35,779 | 34,304 | 33,118 | 1.08 | 1.03 |
| Tuesday | 34,648 | 34,648 | 33,990 | 1.01 | 1.01 |
| Wednesday | 34,670 | 34,670 | 35,631 | 0.97 | 0.97 |
| Thursday | 35,004 | 35,004 | 36,230 | 0.96 | 0.96 |
| Friday | 38,634 | 38,634 | 39,477 | 0.97 | 0.97 |
| Saturday | 40,666 | 37,933 | 39,488 | 1.03 | 0.96 |
(Reliability: System data/Actual data).
Publisher’s Note: MDPI stays neutral with regard to jurisdictional claims in published maps and institutional affiliations. |
© 2021 by the authors. Licensee MDPI, Basel, Switzerland. This article is an open access article distributed under the terms and conditions of the Creative Commons Attribution (CC BY) license (http://creativecommons.org/licenses/by/4.0/).
Share and Cite
MDPI and ACS Style
Kim, Y.; Huh, J.-H.; Chung, M. Traffic Inference System Using Correlation Analysis with Various Predicted Big Data. Electronics 2021, 10, 354. https://0-doi-org.brum.beds.ac.uk/10.3390/electronics10030354
AMA Style
Kim Y, Huh J-H, Chung M. Traffic Inference System Using Correlation Analysis with Various Predicted Big Data. Electronics. 2021; 10(3):354. https://0-doi-org.brum.beds.ac.uk/10.3390/electronics10030354
Chicago/Turabian StyleKim, Yonghoon, Jun-Ho Huh, and Mokdong Chung. 2021. "Traffic Inference System Using Correlation Analysis with Various Predicted Big Data" Electronics 10, no. 3: 354. https://0-doi-org.brum.beds.ac.uk/10.3390/electronics10030354
Note that from the first issue of 2016, this journal uses article numbers instead of page numbers. See further details here.