1. Introduction
Although many studies have investigated the benefits of group formation in collaborative learning scenarios, to date, few studies have analyzed the achievements of published research on the subject [
1]. Research has focused on the proper functioning of collaborative learning, but the formation process of such groups is neglected or belittled [
2]. The group formation in collaborative environments is not a trivial task when achieving homogeneity or heterogeneity within the groups is concerned. Applying a good strategy in their forming, which considers not only one, but several of the student characteristics, depend largely on the general academic benefit [
3]. Given the above, one of the aspects to be evaluated in group formation may be the personality of the students.
Despite the important contributions of the work on group formation, it is observed that few studies in the literature combine personality traits with other important factors in the grouping of students [
4]. Even rarer is research that is based on pedagogical approaches, based on theories and learning strategies, and that considers student personality traits to support the formation of learning groups [
1]. Therefore, there is great potential for research on this subject. In this context, the development of this work is motivated by the lack of scientific studies that combine personality traits with collaborative learning theories to support the group formation process in these scenarios.
The main contribution of this paper is given by the results of the research process carried out for the structuring of a group formation evolutionary strategy in collaborative learning scenarios, formation based on personality traits. To do this, the “big five inventory”, a standardized inventory or questionnaire based on the psychological model of the big five, is used as an instrument for measuring personality traits. On the other hand, since group formation is a combinatorial problem involving multiple characteristics, it was used as an optimization technique, the heuristic search offered by genetic algorithms, the objective: to evaluate the traits of each person within a global group, to later find the group mean in each dimension contemplated by the big five models, and to form groups seeking to optimize a certain measure of intra-heterogeneity and inter-homogeneity.
The proposed strategy was validated through a controlled experiment with 238 students from 14 programming and related courses, belonging to the systems engineering programs of the University of Nariño, the Mariana University and the CESMAG University of the City of San Juan de Pasto-Colombia, in the academic semesters B-2019 and A-2020. The experiment consisted of the development of one collaborative activity by the students, obtaining the required groups through the proposed strategy and by self-formation, to finally evaluate the collaborative performance achieved by the participants.
Section 4.1 describes the empirical study in detail.
The paper is organized as follows: initially, some theoretical background that supports the research are briefly presented;
Section 3 subsequently describes in detail the proposed strategy;
Section 4 describes the empirical study carried out, including the results; and
Section 5 addresses the discussion. Finally,
Section 6 presents a set of conclusions and further works.
2. Theoretical Background
This section briefly presents the theoretical background that supports the research carried out. Topics about work and collaborative learning, collaborative performance evaluation, group formation, genetic algorithms, and the big five personality model are addressed.
2.1. Work and Collaborative Learning
Collaborative work, in an educational context, constitutes an interactive learning model, which invites students to build together, which requires combining efforts, talents, and competencies through a series of transactions that allow them to achieve the goals established by consensus. More than a technique, collaborative work is considered an interaction philosophy and a personal way of working that involves managing aspects such as respecting the individual contributions of group members [
5].
According to Chung [
6], to understand the collaborative work concept as a methodology, it is necessary to keep in mind the theoretical framework that supports this teaching model. Based on the idea that a pedagogical process is impregnated with social skills and that communication is inherent in every human group, the collective learning construction through dialog remains present through time. Working in the classroom, for common purposes, using the appropriate strategies, makes students develop interpersonal strategies and high thinking levels for a deep understanding of the content.
From the above, the collaborative learning construct arises. Collaborative learning, according to Johnson et al. [
7], is a carefully designed interaction system that organizes and induces reciprocal influence between team members. It is developed through a gradual process in which each member and everyone feels mutually committed to each other’s learning, generating a positive interdependence that does not imply competition. In collaborative learning, group work aims to share authority, accept responsibility and the other’s point of view, and build consensus with others. In practice, collaborative learning has come to mean that students work in small groups to achieve common learning goals, learning through group work rather than working alone [
8].
2.2. Collaborative Performance Evaluation
Defining the characteristics of the collaboration process relevant to its quality and developing instruments capable of evaluating these characteristics are not trivial tasks [
9]. In the literature, several works propose different methods and approaches of assessing the quality of collaboration, both for academic and organizational contexts. However, this multiplicity of dispersed works is generally presented without any validation [
10,
11]. Chebil et al. [
12] mention that generally, in these works, the evaluation is carried out through the identification of metrics and their measurement and through the design of questionnaires that reflect the aspects to be evaluated and their use.
Table 1 presents studies from the last decade specifically oriented to academic contexts, indicating some of their basic characteristics, as well as their validation scenario.
For this study, the questionnaire-type tool proposed by Diez et al. [
17] was selected and adapted, taking into account its completeness and, at the same time, its systematic application, as well as its orientation and specific validation in educational contexts. Furthermore, since it is a self-assessment and co-assessment questionnaire, its use does not imply an additional “workload” for the teacher. Collaborative performance is measured through seven indicators that the authors call operational processes (see
Figure 1). These processes describe functions and interactions that appear during group work and how these are managed to perform group tasks. They coincide directly or indirectly with the criteria or dimensions of group performance evaluation to be taken into account in collaborative work scenarios, described in some of the studies listed in
Table 1.
P1—Participation/decision-making: refers to the degree to which the members of the group have an active role in the development of the work and how decisions are made.
P2—Conflict management: refers to how conflicts are valued in the group and if they are managed properly.
P3—Problem resolution: is the ability to solve problems, which is related to the group’s improvement objective.
P4—Internal communication/mutual respect/trust: refers to how communication has developed within the group.
P5—External communication/feedback: refers to the degree to which the group has access to the information and is, in turn, listened to by the teacher.
P6—Collaboration/cooperation/coordination: refers to how the members of the group work to achieve the objectives that have been established.
P7—Leadership: refers to the internal leader of the group.
It is worth clarifying that the proposal of Diez et al. [
17] considers collaborative performance evaluation as an integral multidimensional process, in which one of its dimensions is precisely collaboration, disaggregating into collaboration, cooperation and coordination, but more as competence or students’ ability than as the general macro-process of collaboration.
The tool is composed of a questionnaire that allows assessing the level of collaborative performance and a document that allows students to interpret the score obtained and provided them with guidelines for improvement. The questionnaire originally contains 23 questions directly related to activities and operations associated with the aforementioned processes, which were adapted in its writing and supplemented with an additional question on the leadership process. The questions are scored on a Likert scale from 0–4 (0 = totally disagree or not applicable, 1 = partially disagree, 2 = indifferent or undecided, 3 = partially agree, 4 = totally agree). Each operational process that you want to evaluate is associated with several questions in the questionnaire. To obtain a final score regarding a certain process, the average is calculated with the scores of the questions with which it is related.
The questionnaire is designed to be completed by students at the end of a collaborative activity, first individually by each member of each group and then agreeing on the answers as a group. In this way, at the end of the process, the groups have a consensus score for each question in the questionnaire. With these global scores, the averages are obtained for each operational process, from which the “trace” of each group is constructed, which represents evidence of their collaborative performance in carrying out a specific activity.
Figure 2 presents an example of a trace for a working group. In practice, this trace is what would allow the teacher to provide feedback on the group’s work, identifying the processes in which it could be improved. This indirectly provides the group and, by extension, each student, in particular, a powerful tool for the analysis of strengths and weaknesses of the working group as an initial basis for improvement [
23,
24].
2.3. About Group Formation
Groups constitute a basic social structure. They are formed in many ways for many different purposes: people meet in social situations, coordinate to perform work-related tasks or constitute commissions because of common interests. Although, in the academic fields, they are also easily formed, and for very different purposes, group creation in the classroom can be a complicated and unnatural process. However, for collaborative learning to succeed, it is important to set up effective groups [
8].
The group formation can be characterized by different parameters, such as the size of the group, the duration of the group, the ideal method of grouping, the authority of grouping, and the type of the groups formed, among others. In addition, it is necessary to pay attention to the educational and psychological characteristics of the members involved in the grouping. These characteristics vary from group to group if the group’s goals and tasks are different. In some of the works found in the literature, groups are formed using characteristics of the members such as knowledge, skills, and competencies, while other working groups are based on learning styles, personality traits, and other characteristics [
25]. Regardless of what these characteristics are, three types of grouping can be generated related to the level of uniformity or similarity in them: homogeneous grouping, with this distribution, all the groups that are formed present greater similarity to the totality of individuals, when all the characteristics are considered together; heterogeneous grouping, with this distribution, all the groups that are formed present greater variability concerning the totality of individuals, when all the characteristics are considered together; and, mixed grouping, with this distribution, all the groups that are formed present greater similarity and variability concerning the totality of individuals, when is searching out homogeneity for certain characteristics and heterogeneity for certain other characteristics [
25].
Several studies deal with the group formation problem, considering a limited number of characteristics of students and employing different optimization techniques. Sancho-Asensio et al. [
26] experimented with an incremental search technique called “backtracking” applied to student profiles. Zheng and Pinkwart [
27] used the discrete particle swarm optimization algorithm to heterogeneous group learners according to their personality traits and gender. Costaguta et al. [
28] and Lescano et al. [
29] present an approach to performing the automatic group formation of students in collaborative environments, which considers their learning styles, applying data mining techniques and genetic algorithms. Basu Roy et al. [
30] employed a semantics-based recommendation system for group formation with different objectives. Tien et al. [
31] examined the effectiveness of the group formation process by proposing a new strategy that adopted a genetic algorithm with the TOPSIS technique. Srba and Bielikova [
32] formed groups through the application of so-called group technology, a concept that is managed in the engineering and manufacturing management sector; they considered feedback as a criterion for the group formation, arguing that the quality of previous collaboration is important when forming a group. Battur et al. [
33] propose in their study that the teams be formed based on the student’s complementary skills and ensuring that each team has an expert member in each identified skill. Wichmann et al. [
34] investigated how group formation based on student behavior affects productivity in a small group task. Amara et al. [
35] conducted research to form homogeneous groups in a mobile collaborative learning environment, with a personalized selection of training attributes; the technique used was the K-Means algorithm. Sadeghi and Kardan [
36] and Amarasinghe et al. [
37] propose as an optimization technique for group formation the entire binary linear programming, based on task assignment, gender, and language preferences. Manske and Hoppe [
38] used a semantic algorithm, which maximized the diversity of knowledge in the groups; artefacts produced by students were analyzed to extract knowledge from each of them; student concepts were added in a unified data model and used to calculate diversity. Odo et al. [
39] discussed how student affective status can affect their performance in collaborative study groups. Lykourentzou et al. [
40] and R. C. D. Reis et al. [
41] highlight in their works the importance of personality traits as critical elements affecting student collaboration and interaction, stating that this factor can influence student performance and satisfaction, and induce various actions and behaviors in group work.
2.4. Genetic Algorithms
Genetic algorithms were described by Holland [
42] and are considered as a computational model family inspired by Darwin’s principles of evolution. The common characteristic of these algorithms is that they encode the potential solutions to the problem using a data structure, generally a vector, as a chromosome, and apply recombination operators seeking to preserve the critical information that guides a satisfactory solution [
43].
To provide a clearer idea of the general scheme of these algorithms,
Figure 3 is presented. Here it can be seen that one starts from an initial population of individuals, typically random, where an individual is understood as a possible solution (not necessarily a good one). Everyone is then represented with a chromosome made up of genes where each gene refers to a part or sequence of such a solution. These individuals are then evaluated using a specific fitness function, and genetic operators are applied to obtain a new population (next-generation). These operators aim to preserve the chromosomes or part of them that represent better solutions, following the principles of natural selection, so that fittest individuals are more likely to survive.
Regarding their application, genetic algorithms have been used, particularly during the last two decades, in a wide range of combinatorial optimization problems, including travel salesman problem (TSP), knapsack problem (KP), sequencing and scheduling of tasks (Scheduling), vehicle routing, among others [
44], which makes this technique a good candidate to solve the grouping problem outlined in this paper.
The literature review by Cruz and Isotani [
45] concerning group formation demonstrates the great interest of researchers in using the technique of genetic algorithms as a solution to the problem, given its relevance in dealing with a large number of variables and their ability to quickly generate optimal solutions, i.e., useful groups.
In this work, a modified genetic algorithm was used over other optimization techniques, alluding, among others, to the following reasons: genetic algorithms are intrinsically parallel, that is, they operate simultaneously with several solutions, instead of working sequentially as traditional techniques; they are less affected by local maximums (false solutions) than traditional techniques; they can manipulate many parameters simultaneously, which is interesting if you have several objectives to solve; they are relatively easy to run on today’s massive parallel architectures; they use probabilistic operators instead of the typical deterministic operators of other techniques. A more detailed explanation of its specific application in the study problem is found in
Section 3.3.
2.5. The “Big Five” Model
Currently, a wide variety of models and personality theories that offer different perspectives on how to approach a person’s personality are presented. Some of these theories are Carl Jung’s psychological types, Keirsey’s personality types theory, The “big five” factors personality model, and Myers–Briggs type indicator (MBTI), among others [
46].
In this work, it was decided to use the “big five” or “five-factor model (FFM)” personality model because it has obtained the greatest consensus in the area of Psychology and because it is one of the most widely used in the literature [
47,
48]. The “big five” is a personality traits hierarchical model composed of five big factors where each represents personality characteristics at a more general abstraction level. These factors or dimensions are traditionally referred to as extraversion, agreeableness, conscientiousness, neuroticism, and openness.
Table 2 shows the most prominent characteristics of each of the dimensions of the model [
49].
Each value combination in the different dimensions generates a personality type with a different tendency to behave, interact, react, and reason. Each personality has a different preference to perform a certain task or to work with certain people type. A personality analysis aims to know the abilities of a person and to know how to take advantage of them, and in turn, to know what weaknesses could manifest to balance them with the abilities of other people.
Since the big five model is a purely descriptive personality model, psychologists have developed various tests and questionnaires that evaluate each of the five factors or dimensions in individuals; for example, NEO Personality Inventory-Revised (NEO-PI-R), Sixteen Personality Factor Fifth Edition (16PF-5), Big Five Questionnaire (BFQ), Big Five Quiestionnaire - Children (BFQ-C), 100 Trait-Descriptive Adjectives (TDA-100), Big Five Inventory (BFI), Hogan Personality Inventory (HPI), and Five-Factor Personality Inventory (FFPI), among others [
50,
51].
The “big five” model of personality is the most widely applied when investigating the influential role of personality traits on group functioning and performance [
52,
53,
54,
55]. Specifically, the relationship between this personality model and group performance has been investigated in several studies. For example, Baer et al. [
56], Rhee et al. [
57], Sánchez Hórreo and Carro [
58] and Thoms et al. [
59] found a positive relationship between the extraversion level and group performance; levels of agreeableness were positively related to group performance [
55,
60]; conscientiousness was considered the most related trait in both individual and group success [
55], since conscientious individuals are described as hardworking, self-disciplined and reliable; De Dreu and Van Vianen [
60] and Peeters et al. [
55] showed a positive relationship between levels of conscientiousness and group performance; Peeters et al. [
55] and Rhee et al. [
57] also investigated emotional stability (or reversely neuroticism), and found a negative relationship between emotional stability and group performance; finally, Sánchez Hórreo and Carro [
58] showed that heterogeneous groups based on openness got better results than homogeneous groups, and Baer et al. [
56] found that the openness level was positively related to the group performance. Facets of personality, such as agreeableness, emotional stability, and helpfulness, contribute to the outcomes of collaborative work; other criteria related to relationships, such as the level of members’ communication and the team cooperation, have also been associated with personality traits (Davies and Kanaki, 2006).
3. The Strategy for Forming Collaborative Learning Groups
The proposed strategy seeks to form homogeneous, heterogeneous, or mixed groups, contrasting the five dimensions proposed by the “big five” model to address a person’s personality. The measurement of each of these personality dimensions can be obtained by the psychometric instrument “big five inventory” (BFI) to later find the mean of the group in each and then form the groups looking to optimize some measure intra-heterogeneity and inter-homogeneity.
3.1. Methodological Approach
The methodological approach for forming optimal collaborative learning groups based on participant’s personality traits is presented as a sequential process comprising three stages described in the following sections.
Figure 4 schematically summarizes this process. The texts at the top are the required inputs at each stage, and those at the bottom describe the outputs in each of them.
It is clarified that, as such, the proposed group-building technique would go only until the second stage. Stage three, related to the collaborative activity or activities to be developed, is incorporated into the process only for evaluation of the technique. This stage would be relative to the academic space in which it will be implemented, considering that a collaborative learning process consists of several tasks or activities that must be developed both by the cognitive mediator or facilitator and by the groups of learners, clearly defining three stages: pre-process, process and post-process, as it is proposed by Collazos et al. [
61].
3.2. Measurement of Personality Traits
A Spanish adaptation of the BFI (big five inventory) is used as an instrument to measure the personality traits of students. The aim of using this instrument is to have a scientifically accepted way to quantify the personality traits of an individual, which, as will be seen later, is the input required by the grouping algorithm. At no time is it intended to issue any type of concept or psychological diagnosis of the study participants, as this is outside the scope of this. The adaptation of the BFI into Spanish by Oliver P. John and Verónica Benet-Martínez [
62] is used, with the corresponding consent for investigative purposes. The instrument requires the individual to fill out an “informed consent”, with which the use of the results for a specific purpose is accepted, in this case, the formation of groups as a didactic strategy.
Figure 5 shows the Spanish and English versions of the instrument, the latter as a reference for non-Spanish-speaking readers, which were reconstructed from the original paper.
Once the BFI was applied to each of the n students to be grouped, the results obtained must be stored as shown in Table 4. Each row corresponds to a student, the first two columns being their identifier and his name, and the remaining five measures each of the personality dimensions considered by the “big five” model: extraversion, agreeableness, conscientiousness, neuroticism, and openness.
For it filling out and processing, one activity type “survey” and a complement for Moodle™ were developed, respectively, which can be imported into any course or academic space that is implemented in the aforementioned LMS. The two resources are available for your use by previously contacting the authors.
3.3. Group Formation
The grouping of elements is a general combinatorial problem that consists of the distribution of a set of elements to a defined number of groups, generally of the same size, in such a way that a certain condition is satisfied [
31]. Although at first glance it may seem simple, the complexity of this problem is mainly focused on two aspects. The first refers to the condition that must be satisfied, which in the most common case can be to obtain “equitable” or homogeneous groups considering a certain measure of value for each element. For example, in the case that concerns the present study, suppose that in a class you want to form several groups of students. A simple method of achieving some homogeneity (academically speaking) would be to order the students from highest to lowest according to some type of prior assessment and begin to assign one to each group in a sequential manner. However, what happens when each element does not take into account only one attribute, but several, and it is desired that each group is equitable considering them all? Worse still, what happens when such attributes are not proportional to each other? In these cases, the distribution criterion is no longer trivial but requires some intelligent search to find a solution that satisfies the required condition.
The second aspect is the resulting combinatorial explosion that goes hand-in-hand with the total number of elements to be grouped and the number of groups that want to form. Thus, for example, if you want to distribute 50 students into groups of 5, this value would amount to 2,118,760 possible combinations (employing combinatorial number), which makes finding the best solution from an exhaustive search not feasible in many cases.
When considering these two aspects together, it is easy to intuit that this problem can be treated as a multiobjective optimization, where each objective consists of reaching the highest possible level of similarity between the average of each group concerning each attribute and the average of all the elements [
63].
One-way to approach this problem, as mentioned above, is through an exhaustive search, which depending on the number of elements and groups, will not always be possible given the inherent computational limitations. In these cases, heuristic search methods can be a good alternative because, although these methods do not guarantee to find the optimal solution, they generally find satisfactory one, using considerably less computational effort. Among these methods, we can mention [
64]: local search, taboo search, and genetic algorithms, among others, the latter being the object of study in this proposal. As mentioned in
Section 2.2, the specific case of the combinatorial problem of group formation solved through the genetic algorithm technique has been widely addressed by researchers, given its relevance when dealing with a large number of variables and its possibility to quickly generate optimal solutions.
Taking into account the principles of genetic algorithms, as well as the nature of the problem of interest, the proposed method for group formation is described in detail in this section. The procedure is based on the work of Moreno et al. [
2], who propose a method to group elements (not necessarily students) in a homogeneous way, using genetic algorithms.
3.3.1. Students Representation
Since the idea is to consider not only one but several characteristics of the students, each
n student can be represented employing a vector as follows;
m is the number of characteristics:
These characteristics might have different nature, for example, demographic (age, sex, etc.), psychological (personality traits, skills, abilities, etc.), academic (qualifications, pretests, self-assessment, etc.), and cognitive (learning styles, intelligence types, etc.), among others.
This representation requires that any characteristic m (1 ≤ m ≤ M) be quantified by a numerical value in a predefined range, which does not mean that categorical attributes can be considered. In these cases, a prior numerical discretization process would be required. For example, if an attribute takes “high”, “medium”, and “low” values, these may be changed to 1, 2, and 3, respectively.
The total number of students can be represented by an array of
M ×
N, with
M being the number of characteristics and
N is the number of students, as shown in Table 4. Once the data are organized in this way, it may require being scaled to a common range so that there are no disturbances in the calculation and that they are easily comparable. An easy way to achieve this is that all data are in the range 0–1, applying statistical standardization based on the unit [
65], using the following formula:
where
Xmax and
Xmin are the maximum and minimum values of the corresponding dimension.
3.3.2. Individual Representations
In the grouping case, an individual corresponds to a given collection of G groups, each with up to N/G students, with N being the total number of students. In most jobs that use genetic algorithms, the data structure used is a vector where each position corresponds to a solution gene. In the proposed model, it is proposed to use an array, where the number of rows corresponds to the number of groups desired G and the number of columns corresponds to the maximum size of each N/G group. In this way, each gene that makes up the chromosome contains the identifier of an element, and its position within the matrix defines the group to which it would belong. This representation, in addition to the clarity it entails, facilitates the use of the genetic crossover operator proposed below.
In the group formation problem, as well as in other combinatorial problems, a chromosome cannot have repeated genes, meaning that an individual (feasible solution) is that in which each element is in a single position in the chromosome. For example, if you have a total of 20 students and want to form 4 groups, each will contain exactly 5 students. In this case, a possible individual, if the students are numbered consecutively, could be like the one presented in
Table 3.
3.3.3. Fitness Measurement
Since this method aims to obtain homogeneous/heterogeneous groups concerning all students, it is necessary to define a measure of this homogeneity/heterogeneity. One possible way to do this is described below. The average of each characteristic of the entire student (
TM) is first calculated:
Then for each
g group (1 ≤
g ≤
G) of everyone, the average of each characteristic is calculated. Because each individual
i is represented as a
Xi matrix, such averages (
IM) can be represented as follows:
Subsequently, the sum of the squared differences between the characteristics
M for each group
g of the individual
i and the average of each characteristic is calculated in the entire elements as well:
The lower this value (with a minimum of 0), the more similar each of the groups will be on average concerning the total number of students, for the case of homogeneous formation, and the higher this value, the less similar each of the groups will be on average concerning the total number of students, for the case of heterogeneous formation. Therefore, the objective function of the problem could be expressed as follows:
For mixed formation, that is, heterogeneous for certain characteristics and homogeneous for others, the problem becomes one of multiobjective optimization: it is required to maximize the differences for the heterogeneous characteristics and at the same time minimize the differences for the homogeneous characteristics. Considering the above, a possible way to deal with this situation is described below.
Let
HT and
HM be the vectors of characteristic for which heterogeneity and homogeneity are considered, respectively, represented as follows:
where
J +
K =
M.
For the fitness measure, the sum of the squared differences between the
J characteristics of heterogeneity for each group
g of individual
i and the average of each characteristic in all the elements is calculated, and the value obtained from the sum is subtracted from the differences squared between the
K characteristics of homogeneity for each group
g of individual
i and the average of each characteristic in all the elements, all this in absolute value, thus:
The greater the difference in objectives, the better heterogeneity the groups would have in the
HT characteristics and the better homogeneity in the
HM characteristics, simultaneously. The objective function can be expressed as follows:
To clarify this metric and apply the concepts presented so far, the following example is considered where you have 6 students with the 5 dimensions of the “big five” model valued, as shown in
Table 4.
After scaling these values according to the procedure described at the end of the “students representation” section,
Table 5 is obtained.
Now we want to form two groups, each with three students. Two possible individuals are shown in
Table 6.
When we apply (3), we get:
When calculating
according to (4) from
Table 5 and
Table 6, we get:
Finally, by calculating the fitness measures by applying (5), D1 is obtained by 0.2790 and D2–0.3282. It can be observed that the grouping represented by individual 1 is more inter-homogeneous than individual 2. In other words, with this distribution, all the groups of individual 1 reflect the total of students with greater precision when all the characteristics are considered on the whole. On the contrary, the grouping represented by individual 2 is more inter-heterogeneous than individual 1. In other words, with this distribution, all the groups of individual 2 present greater variability concerning the total of students when all the characteristics are considered on the whole.
Now a mixed formation is desired, which is homogeneous for
C2 and
C3, and at the same time heterogeneous for
C1,
C4 and
C5. According to (7) and (8) is having:
Calculating the fitness measures applying (9) is obtained:
It can be seen that the grouping represented by individual 1 is more inter-homogeneous for C2 and C3, and inter-heterogeneous for C1, C4, and C5 than individual 2, that is, with this distribution, all groups of individual 1 more accurately reflect similarity and variability with the total set of students, when simultaneously looking for homogeneity for C2 and C3, and heterogeneity for C1, C4, and C5.
3.3.4. Initial Population and Evolution
The example represented in
Table 6 shows a trivial group formation: assign each student to a group based on the identifier they have. The first
N/G students (in this case, 3) belong to group 1, the following
N/G to group 2, and so on. While this formation is valid, the idea of the initial population is to randomly generate k individuals, using the matrix representation described above and complying with the restriction that each element must be in one and only one of the array positions.
Once the initial population is obtained, and according to the scheme represented in
Figure 3, the process of evolution is carried out in which it is passed from one generation to another using genetic operators until the desired aptitude measure is obtained or until a total of
h generations is reached.
4. An Empirical Study
4.1. Empirical Design
The research process was developed with an empirical design based on an experiment [
66] as shown in
Figure 6, seeking to verify one of the following hypotheses: H
0: the collaborative performance of the students does not improve considering their personality traits when forming working groups (null hypothesis), or, H
1: the collaborative performance of students improves considering their personality traits when forming working groups (research hypothesis).
The experiment consisted of conducting a collaborative learning activity was carried out with 238 students from 14 courses programming and related, belonging to Programs Systems Engineering at the University of Nariño, the Mariana University, and CESMAG University the City of San Juan de Pasto-Colombia, in the academic semesters B-2019 and A-2020. It is worth mentioning that for the A-2020 period, only two courses were available that were developed in virtual modality, given the situation of COVID-19.
The courses indexed from 1 to 10 were the experimental groups to which the experimental treatment (X
i) was applied: homogeneous, heterogeneous, and mixed formation of the groups required for collaborative activity, applying the proposed strategy. The courses indexed from 11 to 14 were the control groups, to which the experimental treatment was not applied; the groups required for the activity were formed by student preference.
Table 7 summarizes this characterization. In turn,
Oi and
Oj were the posttests applied at the end of the experiment, both to the experimental groups and to the control groups, which consisted of individual and group processing of the instrument described in
Section 2.2, seeking to determine the incidence of the experimental treatment in the collaborative performance of the participants.
In mixed formations, for the functional validation of the strategy, one dimension of the big five model is considered in each case for homogeneity and the others for heterogeneity, respectively openness (O), neuroticism (N), and conscientiousness (C). These dimensions are chosen for homogeneity because the evidence shows that they could be important and relevant to influence academic success in higher education [
67].
4.2. Class Session
Before presenting the results obtained in the research process, it is convenient to show how a class session would be carried out in which you want to form groups with the proposed strategy. To do this, the teacher, taking into account the methodological scheme presented in
Figure 4, performs the steps indicated in the activity diagram shown in
Figure 7.
Figure 7 shows the performance of the following activities:
Preparation of students: The teacher in charge must explain to the students why and why the whole process is going to be developed. It should be recommended to students to answer all of the BFI in full, as honestly as possible since there are no “right” or “wrong” answers; clarify that the results provide a general personality profile of the participants, which will be used only as input for the grouping process. As mentioned above, it is recommended to leave proof of the above by individually filling out an “informed consent”, with which the use of the results for a specific purpose is accepted, in this case, the group formation as a didactic strategy. This filling out is done through a physical format or computer media.
BFI application: Once the corresponding setting was made, we proceed to the “Spanish BFI” application. The questionnaire application is done directly in printed formats or digitally through a PDF form, an electronic sheet, or through computer applications specifically designed for this purpose. Students can do this activity at home or in a special class section designated for this purpose, taking into account to reserve a space of 10–15 min for the filling out of the instrument.
Obtaining and tabulating results: After applying the questionnaires, the teacher proceeds to obtain scores for each of the students in each of its dimensions. Like the previous task, obtaining results is done manually or in an automated way through a computational tool.
At this point, it is important to clarify that these first three activities, corresponding to the measurement of the students’ personality traits, are carried out once in the academic period (for the case under study, once a semester), since the group generally remains stable throughout the period, and the results can be used as many times as desired for the formation of new working groups, in terms of members or number of these.
- 4.
Group formation: The measurement of the student personality traits is supplied by the teacher to the computational tool that implements the algorithmic proposal, which allows obtaining the “ideal” formation of the groups (homogeneous, heterogeneous, or mixed), taking into account the participants’ personality traits.
- 5.
Assignment of the collaborative activity: Considering the curricular planning of the course, the teacher assigns the group the corresponding collaborative activity, establishing the execution and evaluation rules, also informing how the different working groups were formed for their development.
- 6.
Development of the collaborative activity: The students in the different working groups develop the activity proposed by the teacher under his guidance and supervision.
- 7.
Evaluation of the collaborative activity: Once the activity is finished by the students, the teacher proceeds to evaluate the activity, taking into account the established evaluation rubric.
Table 8 describes the roles, the fulfillment, and the duration of each of the tasks that were carried out to support the different themes through the strategy proposed in the experimental courses listed in
Table 7.
4.3. Results
To comprehensively evaluate the collaborative performance achieved by the students participating in this study, the instrument described in
Section 2.2 was applied to 10 experimental groups (with 58 working groups) and 4 control groups (with 16 working groups), which was implemented as a “survey” type activity for Moodle™. The “working group” is considered as a unit of experimentation; in total 74 groups, were made up of 3 or 4 students.
The working groups developed collaborative activities within the framework of their respective experimentation groups (experimental and control) for each of the courses (see
Table 7). The students carried out one collaborative work per course, evaluated from the instrument filling out by each group. These works correspond to practical cases of collaborative programming. The group activity was considered in all courses as a non-face-to-face task, and the instruments were filling out outside of school hours.
Before analyzing the data, the reliability of the results was verified through the calculation of Cronbach’s α, obtaining a value of 0.875, classified as a high level of reliability. This value supports the reliability of the results discussed below.
However, knowing Cronbach’s α by itself does not prove the validity of the instrument used. The conceptual coherence of the instrument was validated by observing whether the results it provides are consistent with the theory about collaborative work and the influence of personality in programming and software development activities. Specifically, and as will be seen later, a contrast of experimental groups was carried out for each of the different types of grouping (homogeneous, heterogeneous, and mixed) versus control groups.
Table 9 and
Figure 8 show the overall results of the working groups. The aim of these is to present in a summarized way the results of all groups, but their analysis at a general level is not significant for this study. In practice, what is interesting about the experience is the particular analysis of each group and its subsequent feedback.
Concerning the overall results of the working groups, it can be observed that operational processes 4 and 6 are those that obtain the highest average scores, which implies that internal communication is adequate and effective; and that collaboration is present in the groups to achieve the objectives that were established. On the other hand, operative process 7 is the one that obtained the least score, this being a key factor to take into account when managing collaborative working groups [
68,
69], independent of its form of composition since an undefined leadership in the groups can affect their performance, especially when it is not managed well [
70]. A fairly uniform behavior is also observed between the groups (little variability in the data).
The mean scores of the experimental groups were contrasted versus those of the control groups, seeking to verify if there is a general improvement in the collaborative performance of the working groups applying the proposed strategy, concerning the process of self-training of groups traditionally used by teachers and their students, when developing a collaborative activity.
Table 10 summarizes the mean scores of the experimentation groups (experimental and control) in each of the operational processes and for each of the types of formation, followed by the corresponding traces (see
Figure 9).
Figure 10 contrasts the experimental groups by type of grouping.
These behaviors highlight the following:
Those groups whose formation was pre-established by the teachers (experimental) through the proposed strategy have generally had a better collaborative performance than the groups with traditional formation (control), except in the case of heterogeneous training. The mixed formations were the best scored. The lowest rated process in all relationships is “conflict management” This is an aspect to improve regardless of the type of grouping since conflict within the group can affect its performance [
70].
“Leadership” is the process that evolved the most in the different relationships, except in the one that considers mixed formation privileging the dimension of neuroticism (N). In other words, homogeneous formation for neuroticism and heterogeneous for the other dimensions. The latter is explained because emotional stability and high levels of emotional adjustment, contrary to neuroticism, predict leadership potential in a person, while on the contrary, neurotic people have a low probability of showing leadership characteristics, even more so when working together [
71].
“Internal communication” is the process that always excels in control groups. Allowing students to choose their classmates or group members makes them feel more comfortable and motivated to work, allowing communication within the group to flow in a better way [
8]. The processes of “participation/decision-making”, “problem resolution”, “external communication” and “collaboration” score better in the experimental groups, except in the case of heterogeneous formation, since students may feel uncomfortable with the diversity of opinions and the possible tensions arising from disagreements, situations that tend to occur in this type of grouping [
8].
The mixed formations that favor the dimension of openness (O) and conscientiousness (C) share the best average score for all operational processes. This confirms what has been stated in some studies that affirm that these dimensions of the big five model are among the most representative in programmers and software developers, both in their individual and group work [
72,
73,
74,
75,
76,
77,
78]. For its part, as mentioned above, the mixed training that favors the neuroticism dimension (N) was the one that obtained the lowest average score, confirming in the same way what was stated in some related studies [
49,
72,
73,
77,
79,
80,
81].
5. Discussion
This work aimed to propose a strategy based on a genetic algorithm approach that allows obtaining optimal collaborative learning groups, considering the students’ personality traits as a grouping criterion, addressing the different needs for group formation: homogeneous, heterogeneous, and mixed.
In practice, a group formation strategy like this can be particularly useful for teachers just beginning to understand the unique abilities of their students or when they want to consider more complex factors for such formation; it can also be useful for distance education teachers who need to form “virtual groups” without the benefits of face-to-face meetings; outside of academia, for example, software managers may find it useful to form development teams, although they would need to be very specific in the use of psychological variables. On the other hand, it may be less useful for teachers who know their students well enough to develop their own strategies for creating successful small learning groups.
The algorithm is flexible to the number and type of attributes of the individuals to the group. Depending on the context, different sets of attributes can be used to form the groups. In this case, the five personality dimensions handled by the big five model were used as characteristics or attributes. Other attributes that can be quantified and used with the algorithm can be learning styles, personal skills, levels of knowledge, and team roles, among others [
1,
25], which opens a wide range of research possibilities in the field of group formation in collaborative learning scenarios.
The proposed strategy also entails some ethical implications that must be taken into account when replicating the experience, since, as mentioned throughout the paper, it involves in a certain way a scheme of “classification” of the students using their personality traits, assessed through a psychometric test. Among them, it is worth highlighting that it must necessarily have the “informed consent” on the part of the participating students; the psychometric test to be used must have its proper authorization for use; the teacher becomes the custodian of the privacy and confidentiality of the data even though psychological concepts are not emitted; and it should be clarified to students that there is no communication of test results, neither personal nor group.
Likewise, considering that the computational implementation involves a “genetic allocation algorithm”, with highly stochastic elements and programmed by humans, this may not necessarily lead to the “perfect solution” in terms of the real context, since a certain degree of bias, before which it would be important to consider in the process of group formation the perception that the teacher has of the personal characteristics of his students, especially in situations where it is evident that the algorithm exerts a high degree of subjectivity or discrimination. The above, as an ethical measure before the possible consequences of the diffusion of the model and its eventual adoption as a standard.
Given that the context of the application of the study is framed in academic scenarios, which by their nature are dynamic, situations may arise that threaten its internal validity, and this affects the results in experimentation. According to the classification made by Kirk [
66], specifically for the study, some of these situations are: external events occur during the experiment and influence only some students (history); the students change or mature during the experiment (
maturation); the students abandon the experiment (experimental mortality); students from different groups communicate with each other (treatments diffusion); students from control groups perceive that they receive nothing and this discourages them (compensation); the teacher’s behavior has a positive or negative influence on the experiment (experimenter behavior); and, the environmental conditions of the experiment are not the same for all participating groups (experimental environment).
For its part, the main threat to the external validity of the results of the study lies in the size and context of the sample, 238 students of programming courses and related courses of the systems engineering programs of the City of San Juan de Pasto-Colombia, presenting limitations in terms of the number of courses available for experimentation by type of grouping (homogeneous, heterogeneous, mixed or by student preference), and in terms of population diversity, which somewhat restricts the generalization of the findings.
Taking into account that the processes for measuring personality traits and collaborative performance assessment require the filling out of questionnaires, a response bias could occur if this activity is not carried out conscientiously by the students. In the same way, experimenting with different teachers in different courses could cause a procedural bias if the criteria for experimentation are not previously unified.
6. Conclusions and Further Work
The work presented in this paper aims to be a relevant contribution in the context of collaborative learning since the research focuses on a key element: the formation of learning groups. The main objective is to obtain homogeneous or heterogeneous groups, as similar or different as possible to the general characteristics (personality traits) of the total sample of students.
Although in this work, the experimentation was limited to a few characteristics (the five dimensions of the big five model), the proposed strategy allows working with an unlimited number of characteristics of different nature, so it can be considered generic. To achieve this goal, the method uses a matrix representation for each student and then translates the grouping problem into a multiobjective optimization problem under a combinatorial scenario, which is solved with an approach based on genetic algorithms. This algorithm defines the fitness value as the mean squared difference between the entire sample and each group and uses an iterative process that is based on the principles of evolution of the species, where different solutions are obtained looking for the optimal value.
Now, from the pedagogical point of view, it is confirming that not considering criteria related to personality traits before the group formation has generally led to lower results. Taking into account personality traits in the group formation process enhances their collaborative performance when it comes to software development activities [
78,
82,
83,
84,
85,
86,
87,
88,
89,
90]. In this aspect, the highlight of the study is that those groups whose formation has been pre-established by the teachers through the proposed strategy, in general, have had a better collaborative performance than groups with traditional formation, except in the case of heterogeneous training.
The experimental data collected shows the suitability of the instrument used to measure collaborative performance in terms of its representativeness and objectivity. The results observed in real working groups created and formed according to the proposed strategy are consistent with what could be expected.
It is important to clarify that none of the working groups had previous experience and/or training in structured and well-defined collaborative work. Studies affirm that later experiences and/or previous training in collaborative work would lead to a more significant improvement in the group performance [
91,
92].
Taking into account the latter, in the future, it is suggested to extend the described experiment by incorporating a pretest, which would allow, in the first place, to verify the hypothesis that later experiences and/or previous training lead to an evolution in the collaborative performance of participants; and, second, as part of the pretest, an assessment of academic performance could be carried out to later be contrasted with the corresponding posttest, in search of evolution or involution in the academic performance of the participants.
It is also proposed to assess in each context, also through controlled experiments, what type of approach is the most appropriate to organize the groups (homogeneous, heterogeneous, or mixed), bearing in mind that there are a strategy and a tool that facilitate this work and automates it.
In addition, it is suggested to explore which specific dimensions of the personality can most directly influence the learning process of programming and software engineering in general. From this, eventually propose a recommendation system that “recommends” what would be the “ideal” formation of a working group, taking into account the specific characteristics of the students and the proposed collaborative activities.
Given that the application of the strategy would entail an additional effort for both teachers and students, it is also proposed as future work to evaluate this “amount of additional effort” and if, or under what circumstances, it is worth it.
Author Contributions
Conceptualization, O.R.S., C.A.C. and M.A.R.; methodology, O.R.S., C.A.C. and M.A.R.; software, O.R.S.; validation, O.R.S.; formal analysis, O.R.S.; investigation, O.R.S.; writing—original draft preparation, O.R.S.; writing—review and editing, O.R.S., C.A.C. and M.A.R.; supervision, C.A.C. and M.A.R.; funding acquisition, M.A.R. All authors have read and agreed to the published version of the manuscript.
Funding
This research received no external funding.
Institutional Review Board Statement
Ethical review and approval were waived for this study because all participant students were informed about the research’s purpose and scope and were ensured their anonymity.
Informed Consent Statement
Informed consent was obtained from all students involved in the study.
Data Availability Statement
The data presented in this study are available on request from the corresponding author.
Acknowledgments
The authors express their thanks to the respective research groups for allowing and supporting the development of this work: Galeras.NET Group, Universidad de Nariño; IDIS Group, Universidad del Cauca; and CHICO Group, Universidad de Castilla-La Mancha. In addition, special recognition to CHICO Research Group of the Universidad de Castilla-La Mancha for having funded the publication of this paper.
Conflicts of Interest
The authors declare no conflict of interest.
References
- Borges, S.; Mizoguchi, R.; Bittencourt, I.I.; Isotani, S. Group Formation in CSCL: A Review of the State of the Art. In Higher Education for All. From Challenges to Novel Technology-Enhanced Solutions. HEFA 2017. Communications in Computer and Information Science; Cristea, A.I., Bittencourt, I.I., Lima, F., Eds.; Springer: Cham, Switzerland, 2018; Volume 832, pp. 71–88. ISBN 9783319979335. [Google Scholar]
- Moreno, J.; Ovalle, D.A.; Vicari, R.M. A Genetic Algorithm Approach for Group Formation in Collaborative Learning Considering Multiple Student Characteristics. Comput. Educ. 2012, 58, 560–569. [Google Scholar] [CrossRef]
- Bekele, R. Computer-Assisted Learner Group Formation Based on Personality Traits. Ph.D. Thesis, University of Hamburg, Hamburg, Germany, 2005. [Google Scholar]
- Reis, R.; Rodríguez, C.; Lyra, K.; Isotani, S. Investigando o Impacto Da Característica de Impulsividade Na Aprendizagem Colaborativa Com Suporte Computacional. In Proceedings of the XXVII Simpósio Brasileiro de Informática na Educação (SBIE 2016); Sociedade Brasileira de Computação—SBC, Uberlândia, Brasil, 24–27 October 2016; Volume 1, pp. 1235–1244. [Google Scholar]
- Randrup, N.; Druckenmiller, D.; Briggs, R.O. Philosophy of Collaboration. In Proceedings of the 49th Hawaii International Conference on System Sciences (HICSS), Koloa, HI, USA, 5–8 January 2016; pp. 898–907. [Google Scholar]
- Chung, S.M. An Overview of Collaborative Work: The Student Experience. Master’s Thesis, Gardner-Webb University, Boiling Springs, NC, USA, 2012. [Google Scholar]
- Johnson, D.W.; Johnson, R.T.; Johnson Holubec, E. The New Circles of Learning: Cooperation in the Classroom and School; ASCD: Alexandria, VI, USA, 1994; ISBN 9780871202277. [Google Scholar]
- Barkley, E.F.; Major, C.H.; Cross, K.P. Collaborative Learning Techniques: A Handbook for College Faculty, 2nd ed.; Jossey-Bass: San Francisco, CA, USA, 2014; ISBN 9781118761557. [Google Scholar]
- Meier, A.; Spada, H.; Rummel, N. A Rating Scheme for Assessing the Quality of Computer-Supported Collaboration Processes. Int. J. Comput. Collab. Learn. 2007, 2, 63–86. [Google Scholar] [CrossRef] [Green Version]
- Steves, M.P.; Scholtz, J. A Framework for Evaluating Collaborative Systems in the Real World. In Proceedings of the 38th Annual Hawaii International Conference on System Sciences, Big Island, HI, USA, 3–6 January 2005; pp. 1–9. [Google Scholar]
- Westphal, I.; Thoben, K.-D.; Seifert, M. Measuring Collaboration Performance in Virtual Organizations. In Establishing the Foundation of Collaborative Networks. PRO-VE 2007. IFIP—The International Federation for Information Processing; Camarinha-Matos, L.M., Afsarmanesh, H., Novais, P., Analide, C., Eds.; Springer: Boston, MA, USA, 2007; Volume 243, pp. 33–42. ISBN 9781475705645. [Google Scholar]
- Chebil, R.; Chaari, W.L.; Cerri, S.A.; Ghedira, K. A Causal Graph Based Method to Evaluate E-Collaboration Scenarios. In Proceedings of the Workshops on Enabling Technologies: Infrastructure for Collaborative Enterprises, Hammamet, Tunisia, 17–20 June 2013; pp. 225–230. [Google Scholar]
- Borden, L.M.; Perkins, D.F. Assessing Your Collaboration: A Self Evaluation Tool. J. Ext. 1999, 37, 67–72. [Google Scholar]
- Kellerman, M. Collaboration Assessment Guide and Tool; United Way of Canada—Centraide Canada: Ottawa, ON, Canada, 2007. [Google Scholar]
- Kahrimanis, G.; Chounta, I.A.; Avouris, N. Validating empirically a rating approach for quantifying the quality of collaboration. In Intelligent Adaptation and Personalization Techniques in Computer-Supported Collaborative Learning. Studies in Computational Intelligence; Springer: Berlin, Germany, 2012; Volume 408, pp. 295–310. ISBN 9783642285851. [Google Scholar]
- Anaya, A.R.; Boticario, J.G. A Domain-Independent, Transferable and Timely Analysis Approach to Assess Student Collaboration. Int. J. Artif. Intell. Tools 2013, 22, 1–35. [Google Scholar] [CrossRef]
- Diez, E.V.; Zárraga-Rodríguez, M.; García, C.J. Tool to Assess Teamwork Performance in Higher Education. Intang. Cap. 2013, 9, 281–304. [Google Scholar] [CrossRef] [Green Version]
- Dascalu, M.; Trausan-Matu, S.; McNamara, D.S.; Dessus, P. ReaderBench: Automated Evaluation of Collaboration Based on Cohesion and Dialogism. Int. J. Comput. Collab. Learn. 2015, 10, 395–423. [Google Scholar] [CrossRef]
- Marek, L.I.; Brock, D.-J.P.; Savla, J. Evaluating Collaboration for Effectiveness. Am. J. Eval. 2015, 36, 67–85. [Google Scholar] [CrossRef]
- Chounta, I.-A.; Avouris, N. Towards the Real-Time Evaluation of Collaborative Activities: Integration of an Automatic Rater of Collaboration Quality in the Classroom from the Teacher’s Perspective. Educ. Inf. Technol. 2016, 21, 815–835. [Google Scholar] [CrossRef]
- Herro, D.; Quigley, C.; Andrews, J.; Delacruz, G. Co-Measure: Developing an Assessment for Student Collaboration in STEAM Activities. Int. J. STEM Educ. 2017, 4, 1–12. [Google Scholar] [CrossRef] [PubMed] [Green Version]
- D’Angelo, C.M.; Smith, J.; Alozie, N.; Tsiartas, A.; Richey, C.; Bratt, H. Mapping Individual to Group Level Collaboration Indicators Using Speech Data. In Proceedings of the 13th CSCL 2019, International Society of the Learning Sciences (ISLS), Lyon, France, 17–21 June 2019; pp. 628–631. [Google Scholar]
- Oakley, B.; Felder, R.; Brent, R.; Elhajj, I. Turning Student Groups into Effective Teams. J. Stud. Cent. Learn. 2004, 2, 9–34. [Google Scholar]
- Wanous, M.; Procter, B.; Murshid, K. Assessment for Learning and Skills Development: The Case of Large Classes. Eur. J. Eng. Educ. 2009, 34, 77–85. [Google Scholar] [CrossRef]
- Maqtary, N.; Mohsen, A.; Bechkoum, K. Group Formation Techniques in Computer-Supported Collaborative Learning: A Systematic Literature Review. Technol. Knowl. Learn. 2019, 24, 169–190. [Google Scholar] [CrossRef]
- Sancho-Asensio, A.; Solé, X.; Montero, J.; Navarro, J.; Canaleta, X.; Vernet, D. Support Tool for the Formation of Working Groups in Collaborative Learning Environments. In Proceedings of the 9th Iberian Conference on Information Systems and Technologies (CISTI), Barcelona, Spain, 18–21 June 2014; pp. 1–6. [Google Scholar]
- Zheng, Z.; Pinkwart, N. A Discrete Particle Swarm Optimization Approach to Compose Heterogeneous Learning Groups. In Proceedings of the 14th International Conference on Advanced Learning Technologies, Athens, Greece, 7–10 July 2014; pp. 49–51. [Google Scholar]
- Costaguta, R.; Menini, M.D.L.Á. An Assistant Agent for Group Formation in CSCL Based on Student Learning Styles. In Proceedings of the 7th Euro American Conference on Telematics and Information Systems (EATIS ’14), Valparaiso, Chile, 2–4 April 2014; pp. 1–4. [Google Scholar]
- Lescano, G.; Costaguta, R.; Amandi, A. Genetic Algorithm for Automatic Group Formation Considering Student’s Learning Styles. In Proceedings of the 8th Euro American Conference on Telematics and Information Systems (EATIS), Cartagena, Colombia, 28–29 April 2016; pp. 1–8. [Google Scholar]
- Basu Roy, S.; Lakshmanan, L.V.S.; Liu, R. From Group Recommendations to Group Formation. In Proceedings of the ACM SIGMOD International Conference on Management of Data, Melbourne, Australia, 31 May–4 June 2015; pp. 1603–1616. [Google Scholar]
- Tien, H.-W.; Lin, Y.-S.; Chang, Y.-C.; Chu, C.-P. A Genetic Algorithm-Based Multiple Characteristics Grouping Strategy for Collaborative Learning. In Advances in Web-Based Learning—ICWL 2013 Workshops. ICWL 2013. Lecture Notes in Computer Science; Chiu, D.K.W., Wang, M., Popescu, E., Li, Q., Lau, R., Shih, T.K., Yang, C.-S., Sampson, D.G., Eds.; Springer: Berlin, Germany, 2015; Volume 8390, pp. 11–22. ISBN 9783662463147. [Google Scholar]
- Srba, I.; Bielikova, M. Dynamic Group Formation as an Approach to Collaborative Learning Support. IEEE Trans. Learn. Technol. 2015, 8, 173–186. [Google Scholar] [CrossRef]
- Battur, S.; Patil, M.S.; Desai, P.; Vijayalakshmi, M.; Raikar, M.M.; Hegde, P.; Joshi, G.H. Enhancing the Students Project with Team Based Learning Approach: A Case Study. In Proceedings of the 4th International Conference on MOOCs, Innovation and Technology in Education (MITE), Madurai, India, 9–10 December 2016; pp. 275–280. [Google Scholar]
- Wichmann, A.; Hecking, T.; Elson, M.; Christmann, N.; Herrmann, T.; Hoppe, H.U. Group Formation for Small-Group Learning. In Proceedings of the 12th International Symposium on Open Collaboration, Berlin, Germany, 17–19 August 2016; pp. 1–4. [Google Scholar]
- Amara, S.; Macedo, J.; Bendella, F.; Santos, A. Group Formation in Mobile Computer Supported Collaborative Learning Contexts: A Systematic Literature Review. Educ. Technol. Soc. 2016, 19, 258–273. [Google Scholar]
- Sadeghi, H.; Kardan, A.A. Toward Effective Group Formation in Computer-Supported Collaborative Learning. Interact. Learn. Environ. 2016, 24, 382–395. [Google Scholar] [CrossRef]
- Amarasinghe, I.; Hernandez-Leo, D.; Jonsson, A. Intelligent Group Formation in Computer Supported Collaborative Learning Scripts. In Proceedings of the 17th International Conference on Advanced Learning Technologies (ICALT), Timisoara, Romania, 3–7 July 2017; pp. 201–203. [Google Scholar]
- Manske, S.; Hoppe, H.U. Managing Knowledge Diversity: Towards Automatic Semantic Group Formation. In Proceedings of the 17th International Conference on Advanced Learning Technologies (ICALT), Timisoara, Romania, 3–7 July 2017; pp. 330–332. [Google Scholar]
- Odo, C.; Masthoff, J.; Beacham, N.; Alhathli, M. Affective State for Learning Activities Selection. In Proceedings of the Intelligent Mentoring Systems Workshop Associated with the 19th International Conference on Artificial Intelligence in Education (AIED 2018), London, UK, 27–30 June 2018; pp. 1–10. [Google Scholar]
- Lykourentzou, I.; Antoniou, A.; Naudet, Y.; Dow, S.P. Personality Matters. In Proceedings of the 19th ACM Conference on Computer-Supported Cooperative Work & Social Computing, San Francisco, CA, USA, 27 February–2 March 2016; pp. 260–273. [Google Scholar]
- Reis, R.C.D.; Rodriguez, C.L.; Challco, G.C.; Lyra, K.T.; Marques, L.B.; Jaques, P.A.; Bittencourt, I.I.; Isotani, S. Step towards a Model to Bridge the Gap between Personality Traits and Collaborative Learning Roles. Interact. Des. Archit. 2016, 28, 124–144. [Google Scholar]
- Holland, J.H. Adaptation in Natural and Artificial Systems: An Introductory Analysis with Applications to Biology, Control, and Artificial Intelligence; MIT University Press: Cambridge, MA, USA, 1992; ISBN 9780262275552. [Google Scholar]
- Goldberg, D.E. Genetic Algorithms; Pearson Education: New York, NY, USA, 2006; ISBN 9788177588293. [Google Scholar]
- García-Martínez, C.; Rodriguez, F.J.; Lozano, M. Genetic Algorithms. In Handbook of Heuristics; Martí, R., Pardalos, P.M., Resende, M.G.C., Eds.; Springer: Cham, Switzerland, 2018; pp. 431–464. ISBN 9783319071237. [Google Scholar]
- Cruz, W.M.; Isotani, S. Group Formation Algorithms in Collaborative Learning Contexts: A Systematic Mapping of the Literature. In Collaboration and Technology. CRIWG 2014. Lecture Notes in Computer Science; Baloian, N., Burstein, F., Ogata, H., Santoro, F., Zurita, G., Eds.; Springer: Cham, Switzerland, 2014; Volume 8658, pp. 199–214. ISBN 9783319101651. [Google Scholar]
- Ellis, A.; Abrams, M. Personality Theories: Critical Perspectives; SAGE Publications, Inc.: Los Angeles, CA, USA, 2009; ISBN 9781412970624. [Google Scholar]
- Aguilar, R.A.; De Antonio, A.; Imbert, R. Searching Pancho’s Soul: An Intelligent Virtual Agent for Human Teams. In Proceedings of the Electronics, Robotics and Automotive Mechanics Conference (CERMA 2007), Morelos, Mexico, 25–28 September 2007; pp. 568–571. [Google Scholar]
- Soto, C.J.; Kronauer, A.; Liang, J.K. Five-Factor Model of Personality. In The Encyclopedia of Adulthood and Aging; John Wiley & Sons, Inc.: Hoboken, NJ, USA, 2015; pp. 1–5. ISBN 9781118528921. [Google Scholar]
- Aqeel Iqbal, M.; Aldaihani, A.R.; Shah, A. Big-Five Personality Traits Mapped with Software Development Tasks to Find Most Productive Software Development Teams. Int. J. Innov. Technol. Explor. Eng. 2019, 8, 965–971. [Google Scholar] [CrossRef]
- John, O.P.; Naumann, L.P.; Soto, C.J. Paradigm shift to the integrative Big Five trait taxonomy: History, measurement, and conceptual issues. In Handbook of Personality: Theory and Research; John, O.P., Robins, R.W., Pervin, L.A., Eds.; The Guilford Press: New York, NY, USA, 2008; pp. 114–158. ISBN 9781606237380. [Google Scholar]
- Sleep, C.E.; Lynam, D.R.; Miller, J.D. A Comparison of the Validity of Very Brief Measures of the Big Five/Five-Factor Model of Personality. Assessment 2020, 1–20. [Google Scholar] [CrossRef]
- Barrick, M.R.; Mount, M.K. The Big Five Personality Dimensions and Job Performance: A Meta-Analysis. Pers. Psychol. 1991, 44, 1–26. [Google Scholar] [CrossRef]
- Barrick, M.R.; Mount, M.K. Autonomy as a Moderator of the Relationships between the Big Five Personality Dimensions and Job Performance. J. Appl. Psychol. 1993, 78, 111–118. [Google Scholar] [CrossRef]
- Kichuk, S.L.; Wiesner, W.H. The Big Five Personality Factors and Team Performance: Implications for Selecting Successful Product Design Teams. J. Eng. Technol. Manag. 1997, 14, 195–221. [Google Scholar] [CrossRef]
- Peeters, M.A.G.; Van Tuijl, H.F.J.M.; Rutte, C.G.; Reymen, I.M.M.J. Personality and Team Performance: A Meta-analysis. Eur. J. Pers. 2006, 20, 377–396. [Google Scholar] [CrossRef] [Green Version]
- Baer, M.; Oldham, G.R.; Jacobsohn, G.C.; Hollingshead, A.B. The Personality Composition of Teams and Creativity: The Moderating Role of Team Creative Confidence. J. Creat. Behav. 2008, 42, 255–282. [Google Scholar] [CrossRef] [Green Version]
- Rhee, J.; Parent, D.; Basu, A. The Influence of Personality and Ability on Undergraduate Teamwork and Team Performance. Springerplus 2013, 2, 1–14. [Google Scholar] [CrossRef] [Green Version]
- Sánchez Hórreo, V.; Carro, R.M. Studying the Impact of Personality and Group Formation on Learner Performance. In Groupware: Design, Implementation, and Use. CRIWG 2007. Lecture Notes in Computer Science; Haake, J.M., Ochoa, S.F., Cechich, A., Eds.; Springer: Berlin, Germany, 2007; pp. 287–294. ISBN 9783540748113. [Google Scholar]
- Thoms, P.; Moore, K.S.; Scott, K.S. The Relationship between Self-Efficacy for Participating in Self-Managed Work Groups and the Big Five Personality Dimensions. J. Organ. Behav. 1996, 17, 349–362. [Google Scholar] [CrossRef]
- De Dreu, C.K.W.; Van Vianen, A.E.M. Managing Relationship Conflict and the Effectiveness of Organizational Teams. J. Organ. Behav. 2001, 22, 309–328. [Google Scholar] [CrossRef]
- Collazos, C.A.; Guerrero, L.A.; Pino, J.A.; Renzi, S.; Klobas, J.; Ortega, M.; Redondo, M.A.; Bravo, C. Evaluating Collaborative Learning Processes Using System-Based Measurement. Educ. Technol. Soc. 2007, 10, 257–274. [Google Scholar]
- Benet-Martínez, V.; John, O.P. Los Cinco Grandes across Cultures and Ethnic Groups: Multitrait-Multimethod Analyses of the Big Five in Spanish and English. J. Pers. Soc. Psychol. 1998, 75, 729–750. [Google Scholar] [CrossRef]
- Pinninghoff, J.M.; Contreras, A.R.; Salcedo, L.P. Genetic Algorithms as a Tool for Structuring Collaborative Groups. Nat. Comput. 2017, 16, 231–239. [Google Scholar] [CrossRef]
- Glover, F.; Kochenberger, G.A. Handbook of Metaheuristics; International Series in Operations Research & Management Science; Springer: Boston, MA, USA, 2010; Volume 146, ISBN 9781441916631. [Google Scholar]
- The International Statistical Institute. The Oxford Dictionary of Statistical Terms, 6th ed.; Dodge, Y., Ed.; Oxford University Press: New York, NY, USA, 2006; ISBN 9780199206131. [Google Scholar]
- Kirk, R.E. Experimental Design—Procedures for the Behavioral Sciences, 4th ed.; SAGE Publications, Inc.: Los Angeles, CA, USA, 2013; ISBN 9781412974455. [Google Scholar]
- De Raad, B.; Schouwenburg, H.C. Personality in Learning and Education: A Review. Eur. J. Pers. 1996, 10, 303–336. [Google Scholar] [CrossRef]
- Ilgen, D.R.; Hollenbeck, J.R.; Johnson, M.; Jundt, D. Teams in Organizations: From Input-Process-Output Models to IMOI Models. Annu. Rev. Psychol. 2005, 56, 517–543. [Google Scholar] [CrossRef] [PubMed] [Green Version]
- Mathieu, J.; Maynard, M.T.; Rapp, T.; Gilson, L. Team Effectiveness 1997-2007: A Review of Recent Advancements and a Glimpse Into the Future. J. Manag. 2008, 34, 410–476. [Google Scholar] [CrossRef] [Green Version]
- Kozlowski, S.W.J.; Ilgen, D.R. Enhancing the Effectiveness of Work Groups and Teams. Psychol. Sci. Public Interest 2006, 7, 77–124. [Google Scholar] [CrossRef] [PubMed] [Green Version]
- Özbağ, G.K. The Role of Personality in Leadership: Five Factor Personality Traits and Ethical Leadership. Procedia Soc. Behav. Sci. 2016, 235, 235–242. [Google Scholar] [CrossRef]
- Amin, A.; Rehman, M.; Akbar, R.; Basri, S.; Hassan, M.F. Trait-Based Personality Profile of Software Programmers: A Study on Pakistan’s Software Industry. In Proceedings of the 8th International Conference on Intelligent Systems, Modelling and Simulation (ISMS), Kuala Lumpur, Malaysia, 8–10 May 2018; pp. 90–94. [Google Scholar]
- Anvari, F.; Richards, D. Using Personality Traits and a Spatial Ability Test to Identify Talented Aspiring Designers in User-Centred Design Methodologies. In Proceedings of the 10th International Conference on Evaluation of Novel Approaches to Software Engineering, Barcelona, Spain, 29–30 April 2015; SCITEPRESS—Science and Technology Publications: Barcelona, Spain, 2015; pp. 90–101. [Google Scholar]
- Kanij, T.; Merkel, R.; Grundy, J. An Empirical Investigation of Personality Traits of Software Testers. In Proceedings of the 8th International Workshop on Cooperative and Human Aspects of Software Engineering, Florence, Italy, 18 May 2015; pp. 1–7. [Google Scholar]
- Karimi, Z.; Baraani-Dastjerdi, A.; Ghasem-Aghaee, N.; Wagner, S. Influence of Personality on Programming Styles an Empirical Study. J. Inf. Technol. Res. 2015, 8, 38–56. [Google Scholar] [CrossRef] [Green Version]
- Karimi, Z.; Baraani-Dastjerdi, A.; Ghasem-Aghaee, N.; Wagner, S. Using Personality Traits to Understand the Influence of Personality on Computer Programming. J. Cases Inf. Technol. 2016, 18, 28–48. [Google Scholar] [CrossRef]
- Gilal, A.R.; Jaafar, J.; Abro, A.; Omar, M.; Basri, S.; Saleem, M.Q. Effective Personality Preferences of Software Programmer: A Systematic Review. J. Inf. Sci. Eng. 2017, 33, 1399–1416. [Google Scholar]
- Soomro, A.B.; Salleh, N.; Nordin, A. How Personality Traits Are Interrelated with Team Climate and Team Performance in Software Engineering? A Preliminary Study. In Proceedings of the 9th Malaysian Software Engineering Conference (MySEC), Kuala Lumpur, Malaysia, 16–17 December 2015; pp. 259–265. [Google Scholar]
- Karimi, Z.; Baraani-Dastjerdi, A.; Ghasem-Aghaee, N.; Wagner, S. Links between the Personalities, Styles and Performance in Computer Programming. J. Syst. Softw. 2016, 111, 228–241. [Google Scholar] [CrossRef] [Green Version]
- Toala-Sanchez, G.; Cachero, C.; Melia, S. Evaluating the Impact of the Personality Traits in the Perception of Model-Driven Engineering. In Proceedings of the 13th Iberian Conference on Information Systems and Technologies (CISTI), Cáceres, Spain, 13–16 June 2018; pp. 1–6. [Google Scholar]
- Toala-Sánchez, G.; Cachero, C.; Meliá, S. Evaluating the Effect of Developers’Personality and Productivity on TheirIntention to Use Model-DrivenWebEngineering Techniques: An ExploratoryObservational Study. J. Web Eng. 2019, 17, 483–526. [Google Scholar] [CrossRef]
- Acuña, S.T.; Gómez, M.N.; Hannay, J.E.; Juristo, N.; Pfahl, D. Are Team Personality and Climate Related to Satisfaction and Software Quality? Aggregating Results from a Twice Replicated Experiment. Inf. Softw. Technol. 2015, 57, 141–156. [Google Scholar] [CrossRef] [Green Version]
- Akarsu, Z.; Orgun, P.; Dinc, H.; Gunyel, B.; Yilmaz, M. Assessing Personality Traits in a Large Scale Software Development Company: Exploratory Industrial Case Study. In Systems, Software and Services Process Improvement. EuroSPI 2019. Communications in Computer and Information Science; Walker, A., O’Connor, R.V., Messnarz, R., Eds.; Springer: Cham, Switzerland, 2019; Volume 1060, pp. 192–206. ISBN 9783030280048. [Google Scholar]
- Chowdhury, S.; Walter, C.; Gamble, R. Toward Increasing Collaboration Awareness in Software Engineering Teams. In Proceedings of the Frontiers in Education Conference (FIE), San Jose, CA, USA, 3–6 October 2018; pp. 1–9. [Google Scholar]
- Gilal, A.R.; Omar, M.; Gilal, R.; Waqas, A.; Afridi, S.; Jaafar, J. A Decision Tree Model for Software Development Teams. Int. J. Innov. Technol. Explor. Eng. 2019, 8, 241–245. [Google Scholar]
- Licorish, S.A.; MacDonell, S.G. Communication and Personality Profiles of Global Software Developers. Inf. Softw. Technol. 2015, 64, 113–131. [Google Scholar] [CrossRef]
- Omar, M.; Syed-Abdullah, S.-L. Finding the Effectiveness of Software Team Members Using Decision Tree. In Pattern Analysis, Intelligent Security and the Internet of Things. Advances in Intelligent Systems and Computing; Abraham, A., Muda, A.K., Choo, Y.-H., Eds.; Springer: Cham, Switzerland, 2015; Volume 355, pp. 107–115. ISBN 9783319173979. [Google Scholar]
- Pieterse, V.; Leeu, M.; van Eekelen, M. How Personality Diversity Influences Team Performance in Student Software Engineering Teams. In Proceedings of the Conference on Information Communications Technology and Society (ICTAS), Durban, South Africa, 8–9 March 2018; pp. 1–6. [Google Scholar]
- Yilmaz, M.; Al-Taei, A.; O’Connor, R.V. A Machine-Based Personality Oriented Team Recommender for Software Development Organizations. In Systems, Software and Services Process Improvement. EuroSPI 2015. Communications in Computer and Information Science; O’Connor, R.V., Akkaya, M.U., Kemaneci, K., Yilmaz, M., Poth, A., Messnarz, R., Eds.; Springer: Cham, Switzerland, 2015; Volume 543, pp. 75–86. ISBN 9783319246468. [Google Scholar]
- Yilmaz, M.; O’Connor, R.V.; Colomo-Palacios, R.; Clarke, P. An Examination of Personality Traits and How They Impact on Software Development Teams. Inf. Softw. Technol. 2017, 86, 101–122. [Google Scholar] [CrossRef] [Green Version]
- Kirkman, B.L.; Rosen, B. Beyond Self-Management: Antecedents and Consequences of Team Empowerment. Acad. Manag. J. 1999, 42, 58–74. [Google Scholar] [CrossRef]
- Moreland, R.L.; Argote, L.; Krishnan, R. Training People to Work in Groups. In Theory and Research on Small Groups. Social Psychological Applications to Social Issues; Tindale, R.S., Heath, L., Edwards, J., Posavac, E.J., Bryant, F.B., Eds.; Springer: Boston, MA, USA, 2002; pp. 37–60. ISBN 9780306456794. [Google Scholar]
| Publisher’s Note: MDPI stays neutral with regard to jurisdictional claims in published maps and institutional affiliations. |
© 2021 by the authors. Licensee MDPI, Basel, Switzerland. This article is an open access article distributed under the terms and conditions of the Creative Commons Attribution (CC BY) license (http://creativecommons.org/licenses/by/4.0/).


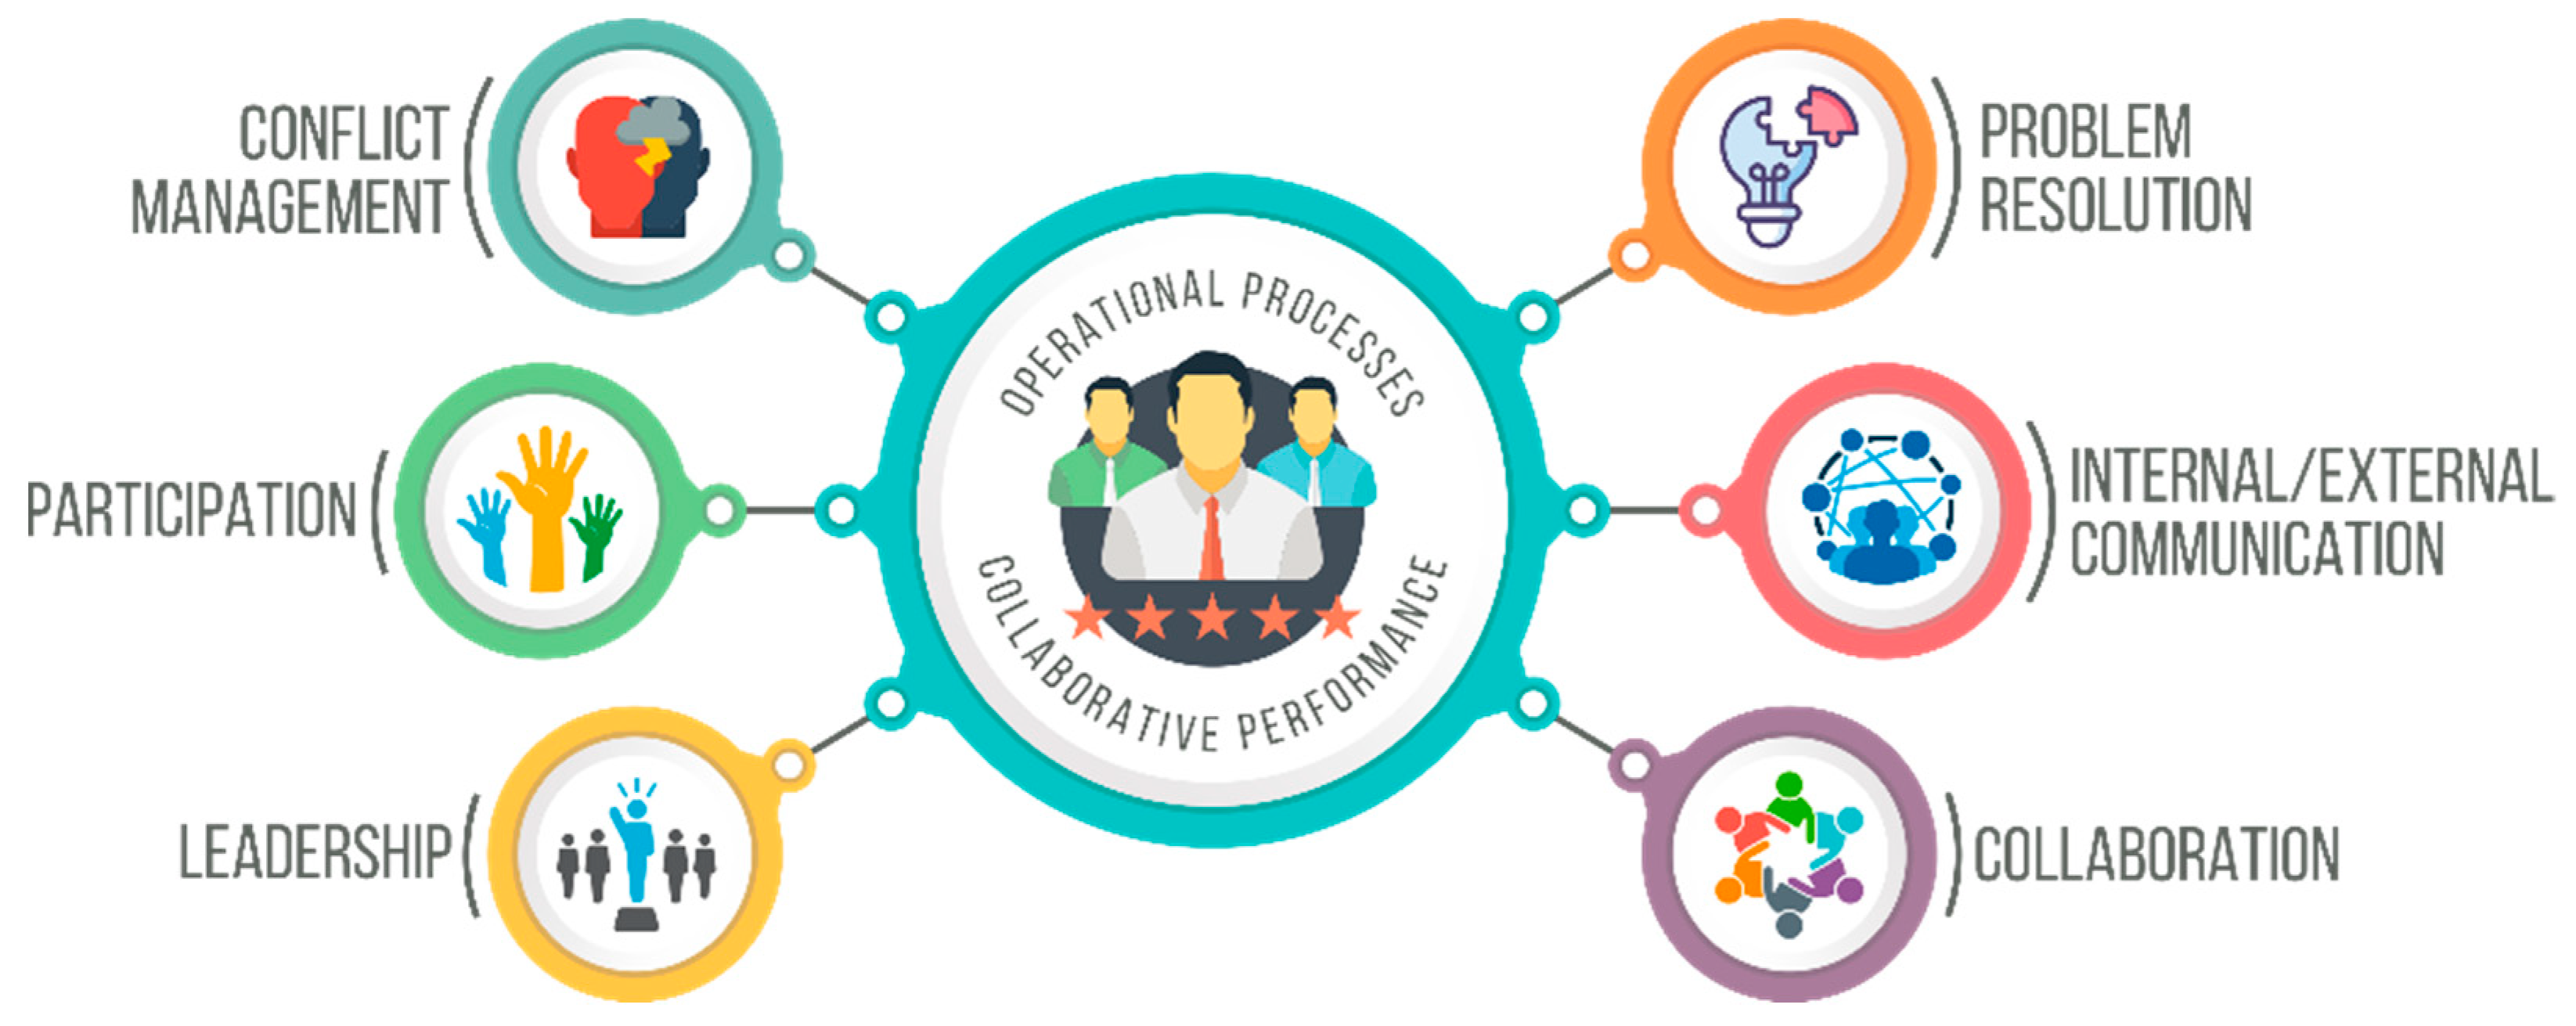
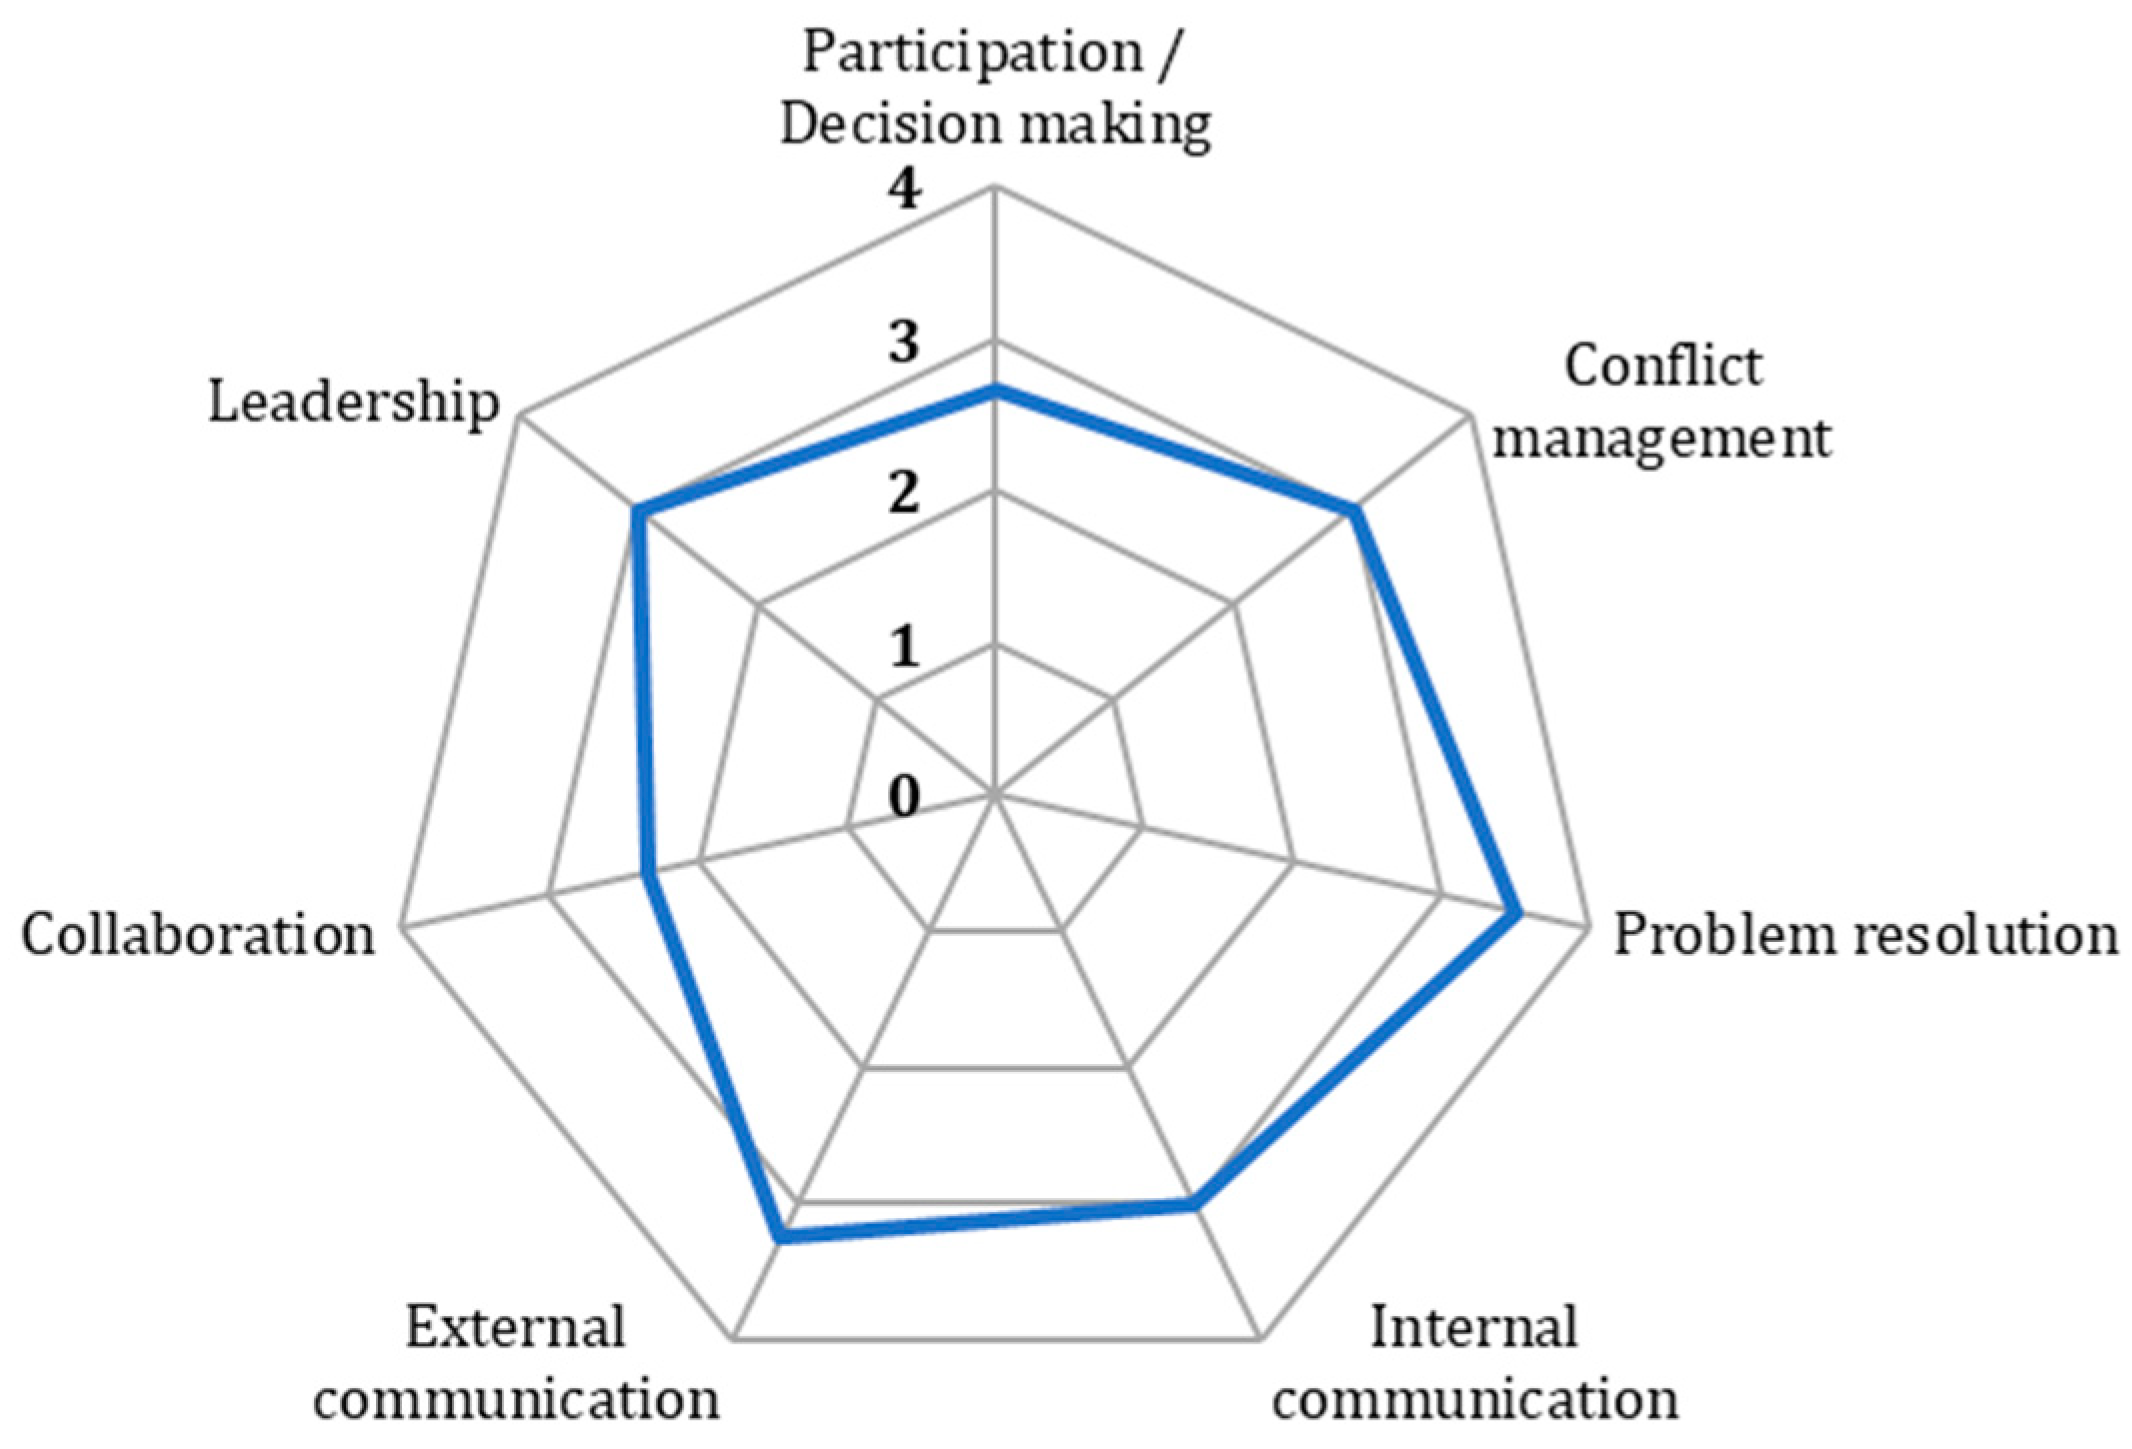
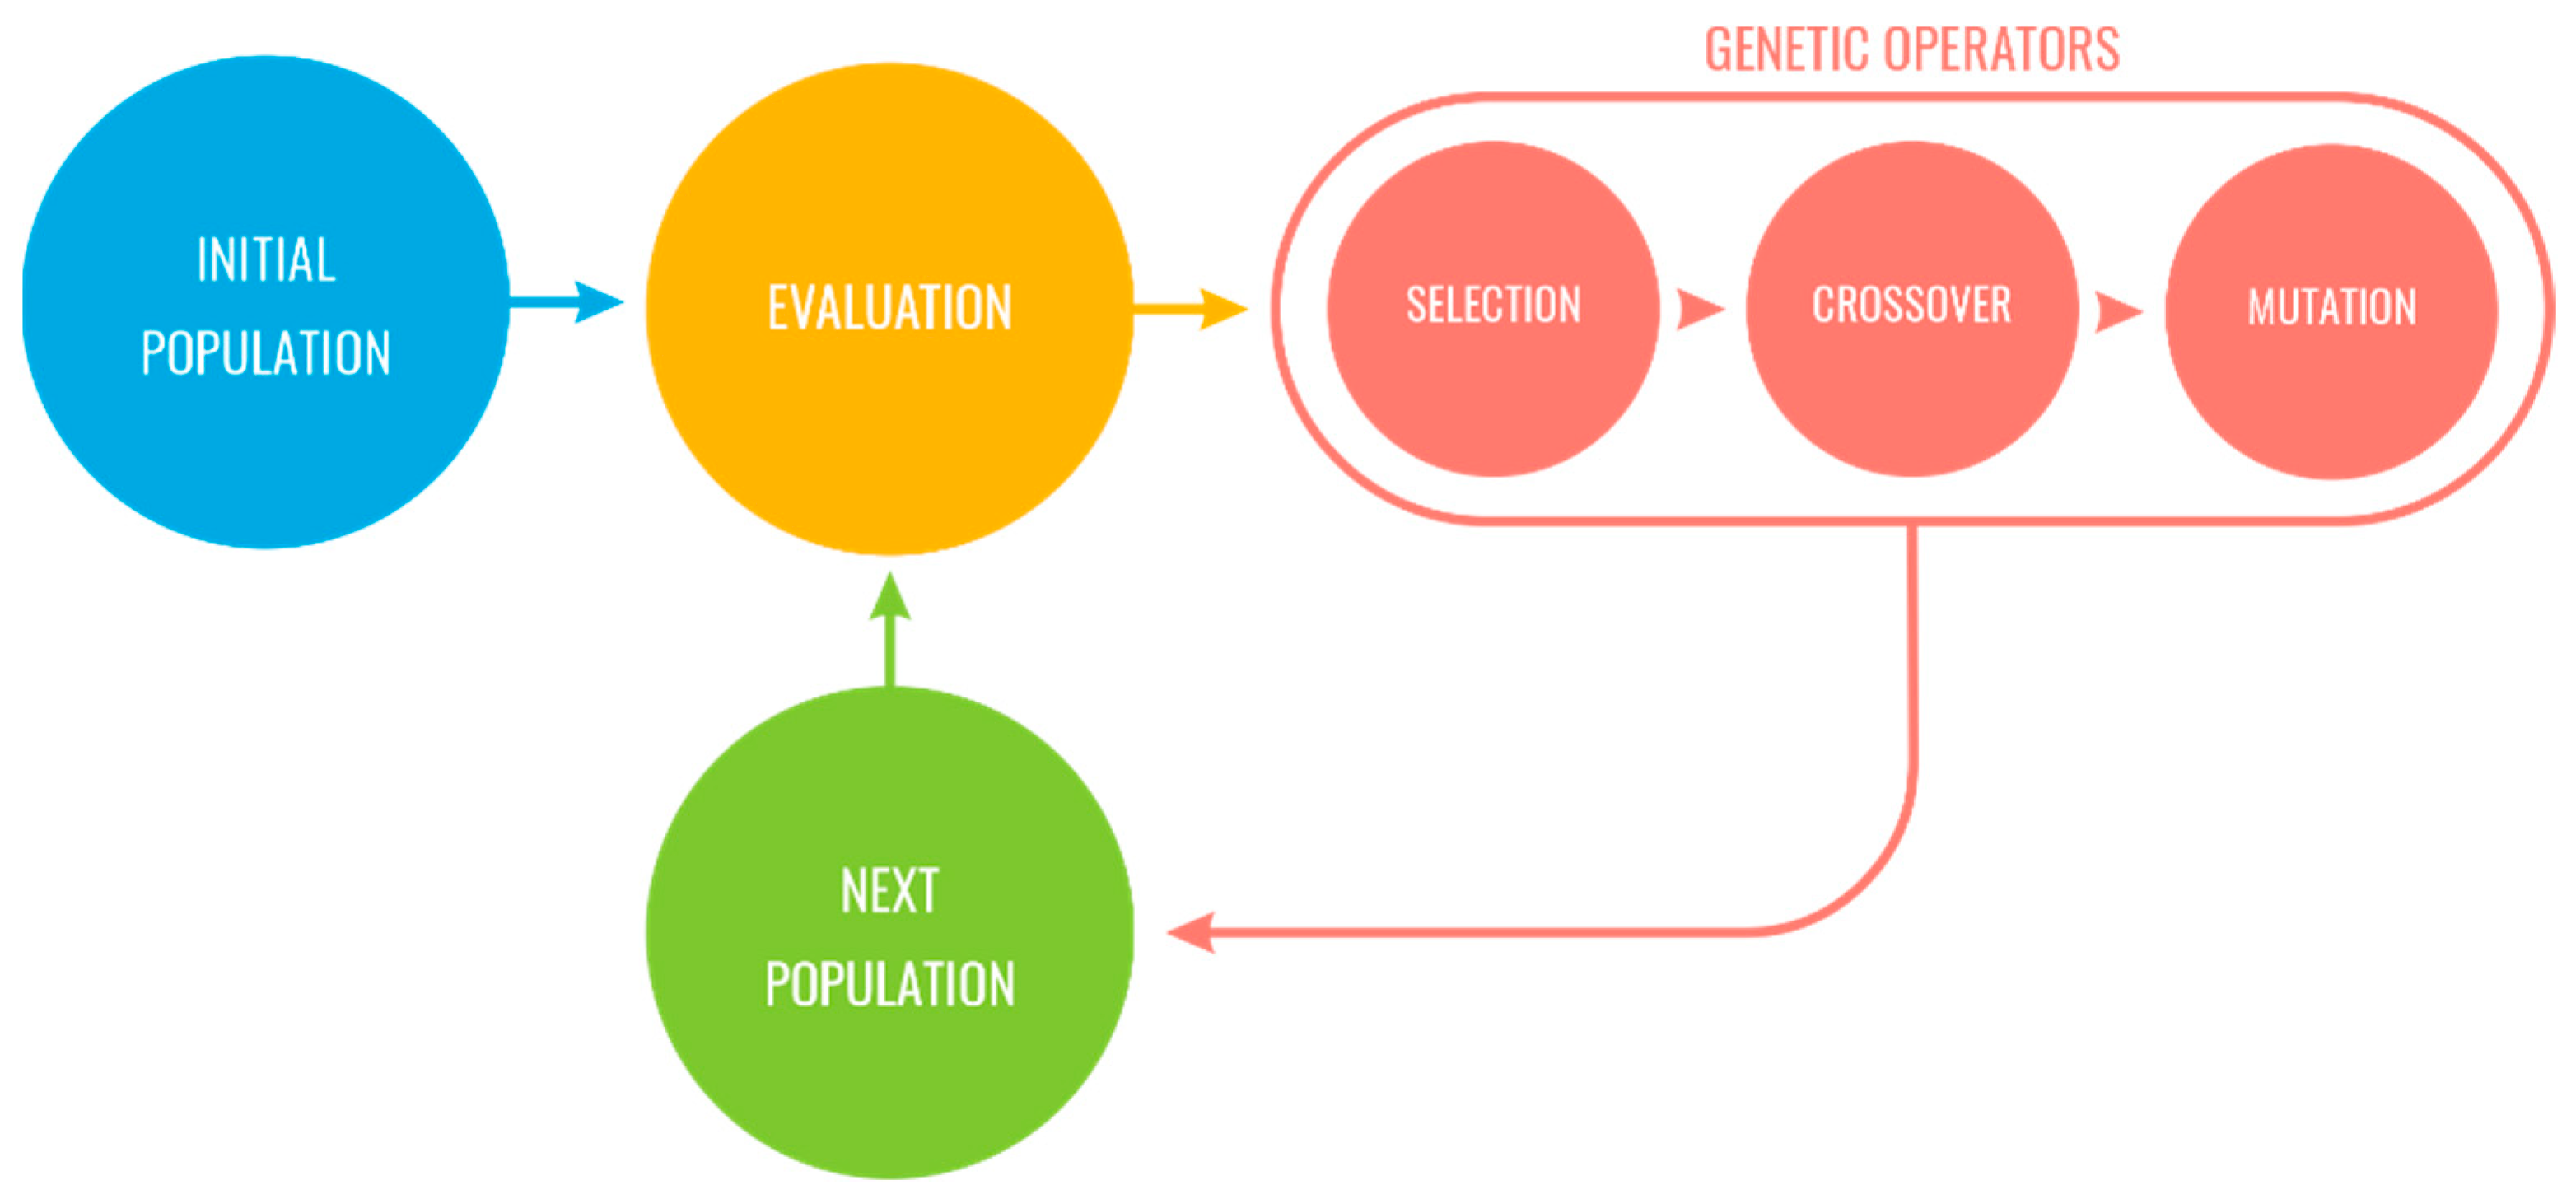
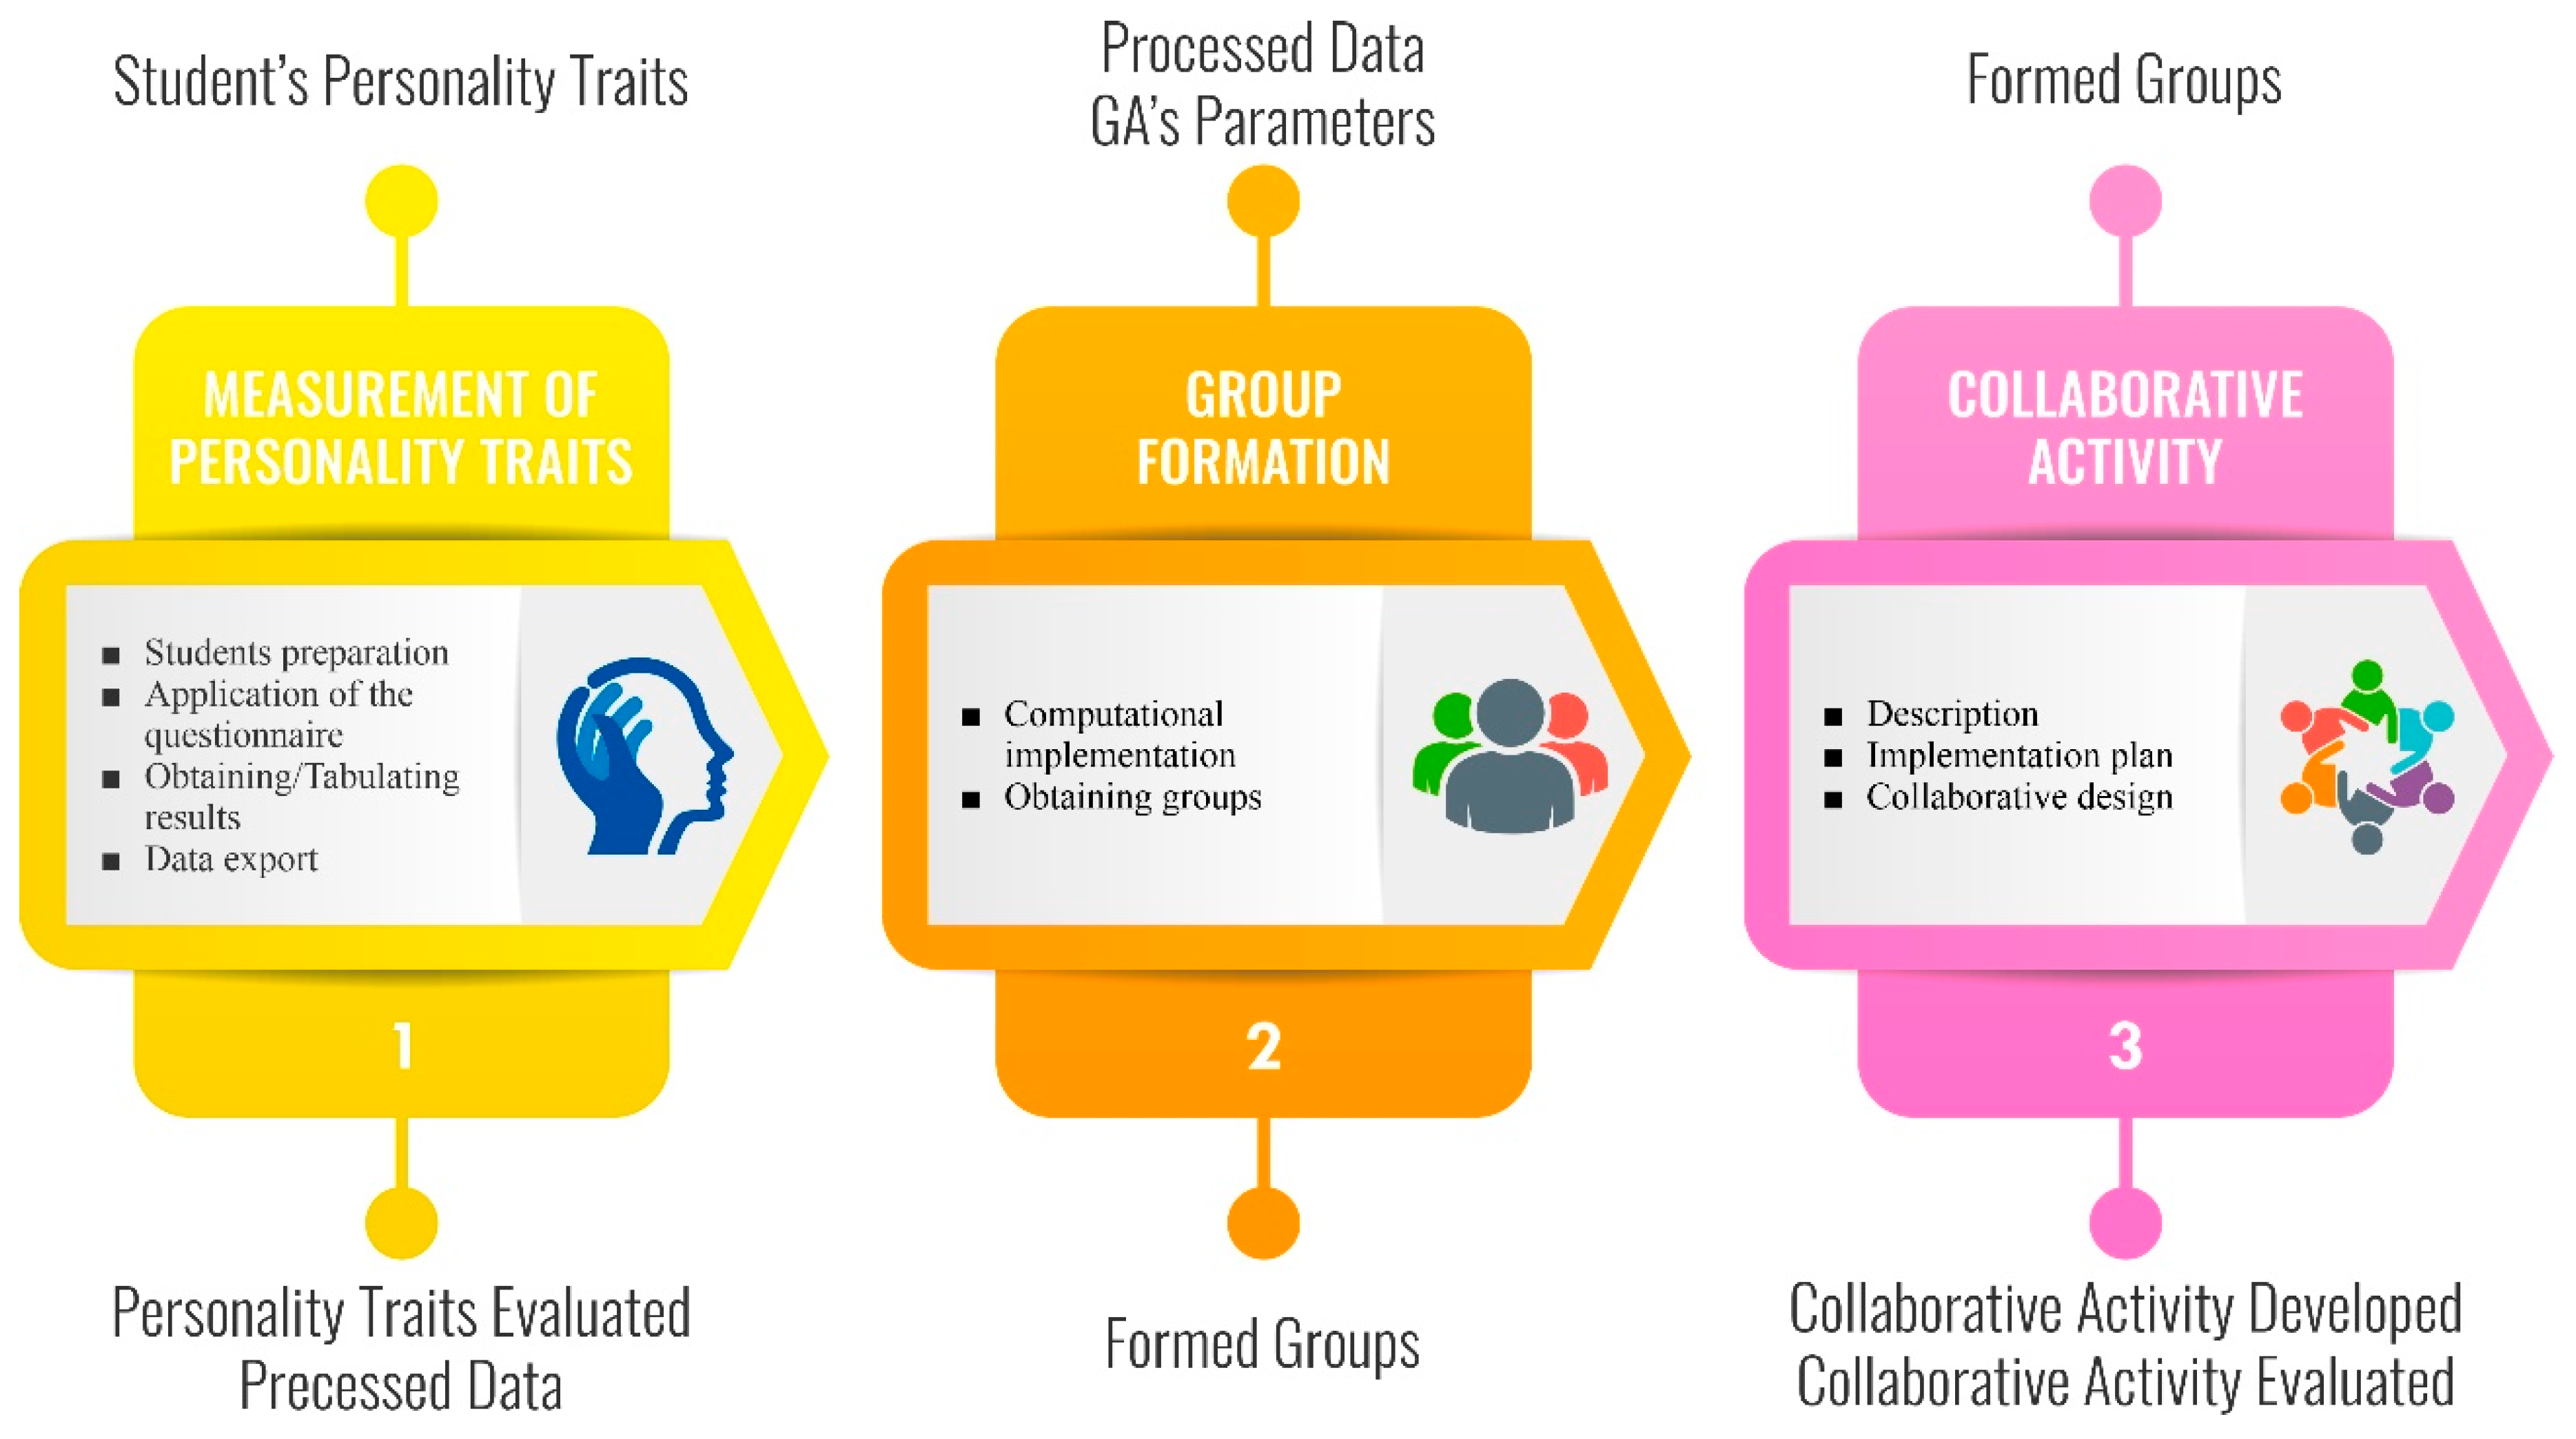
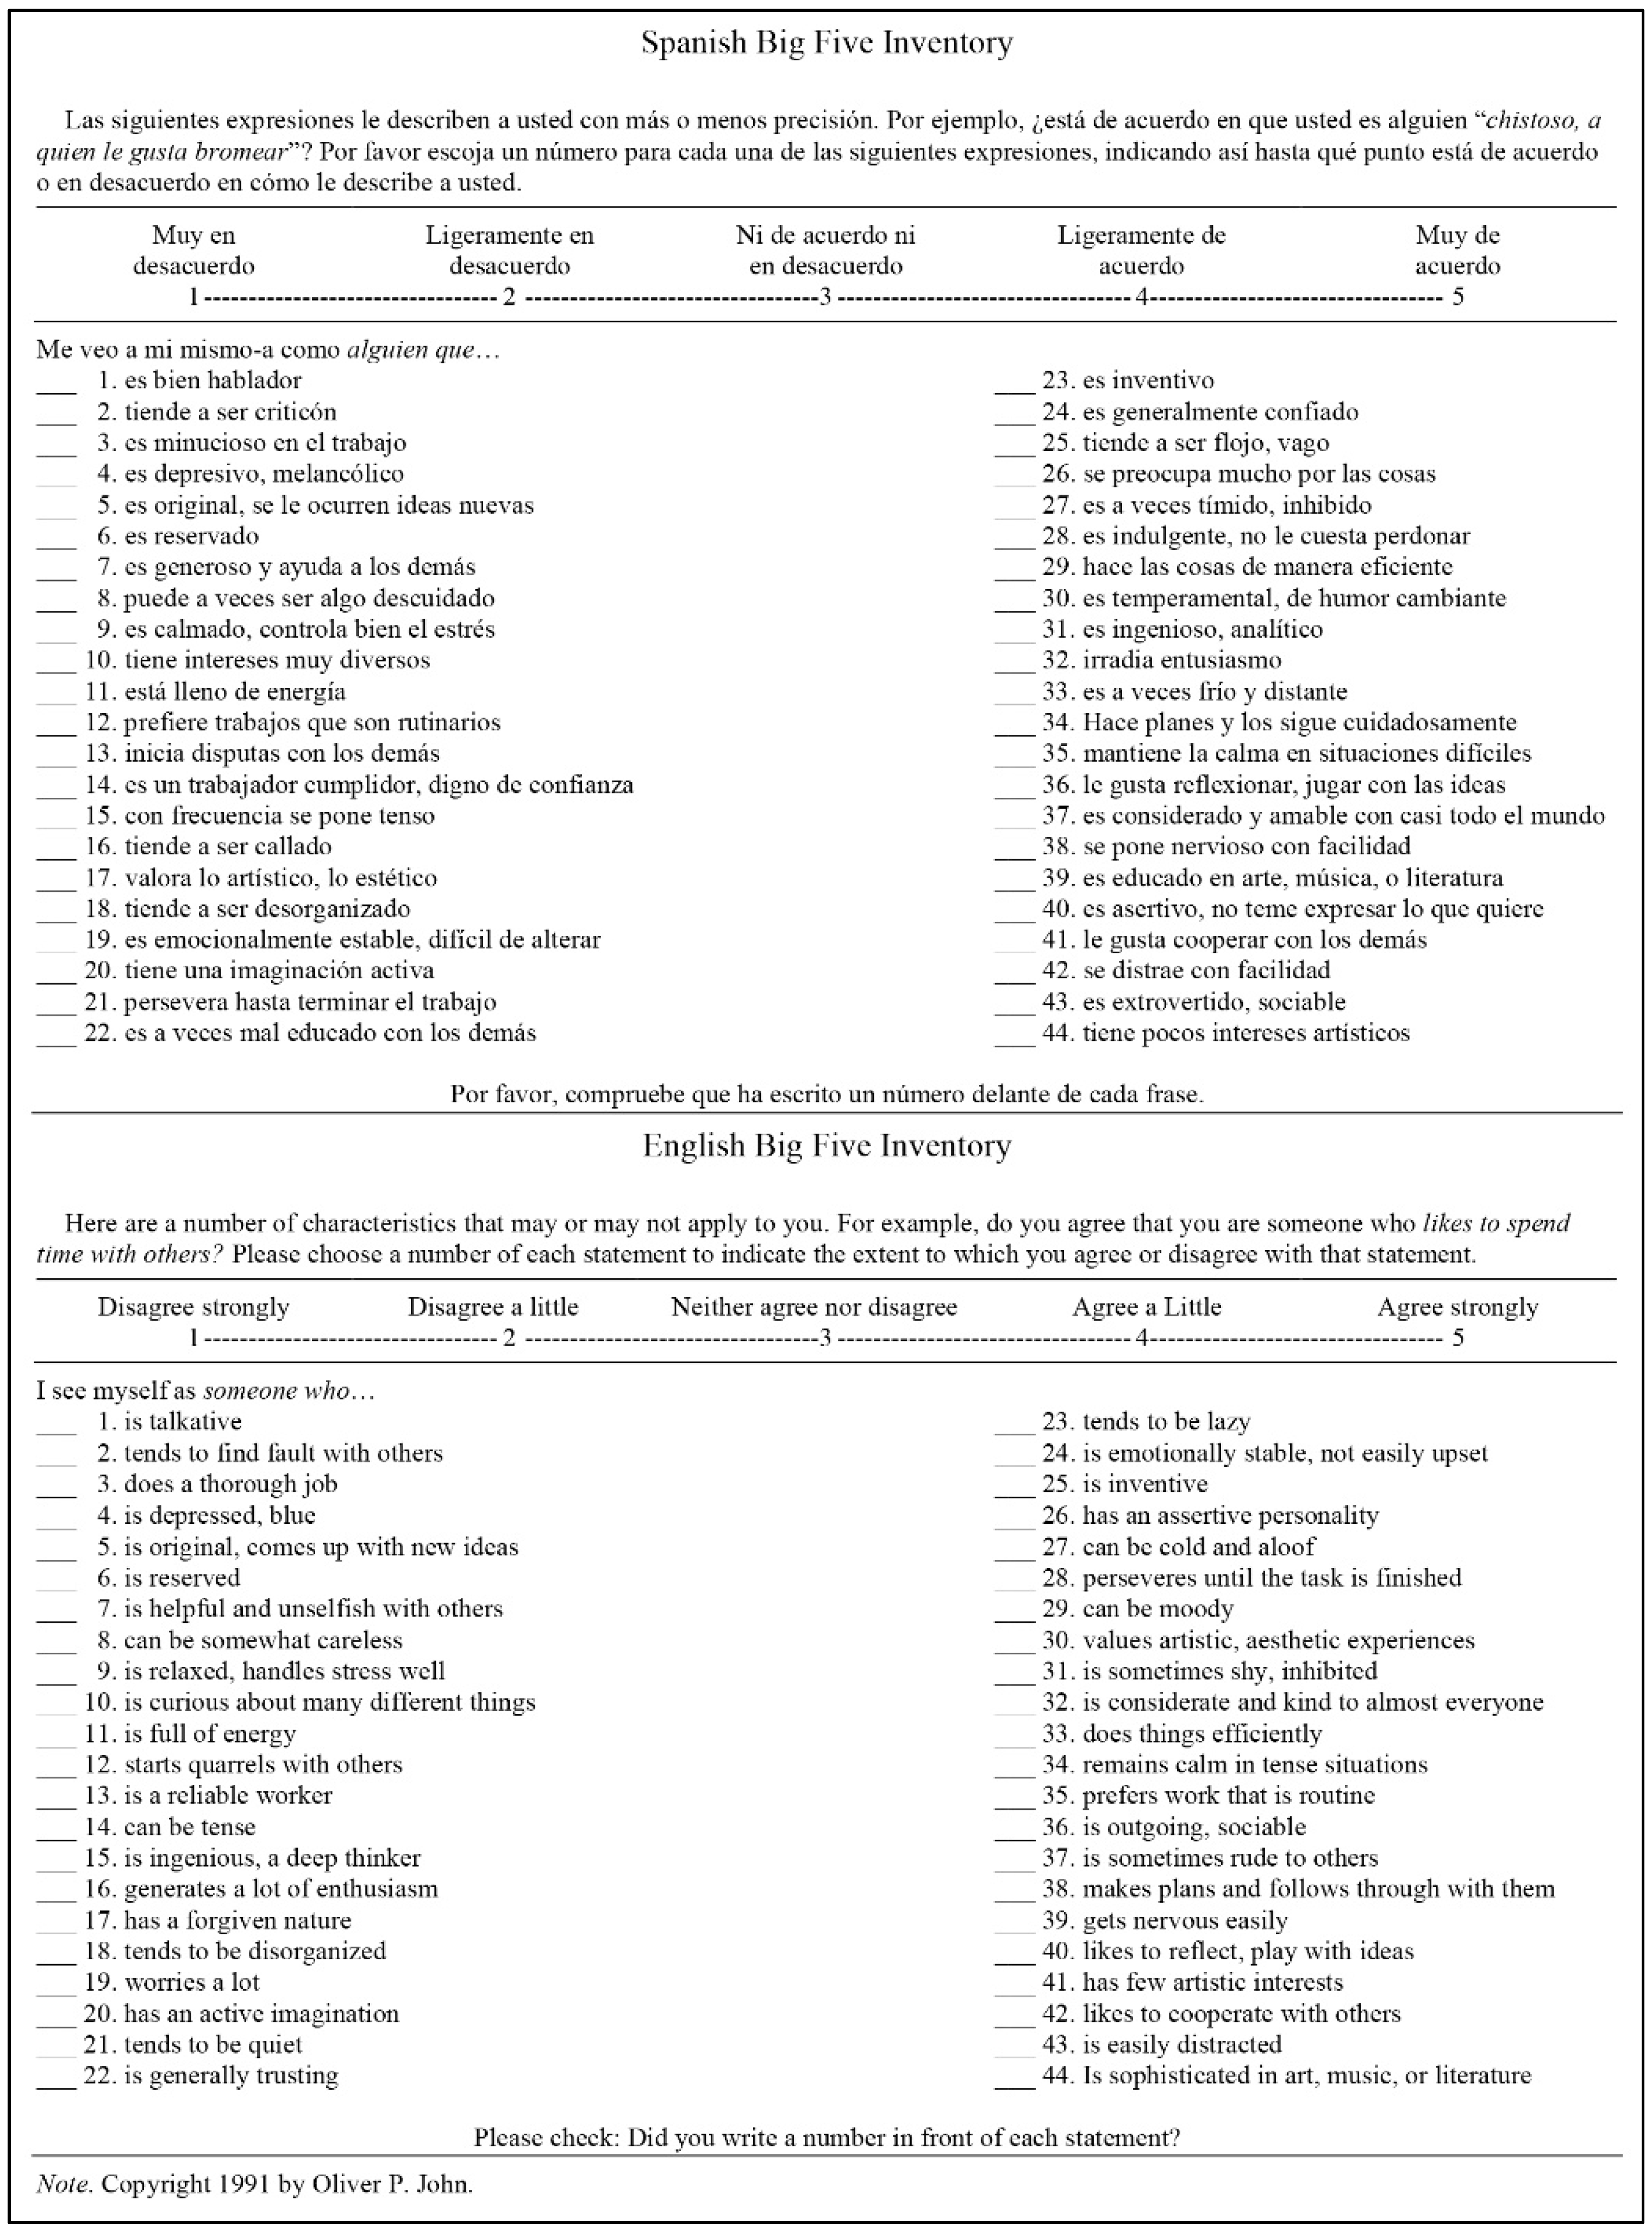
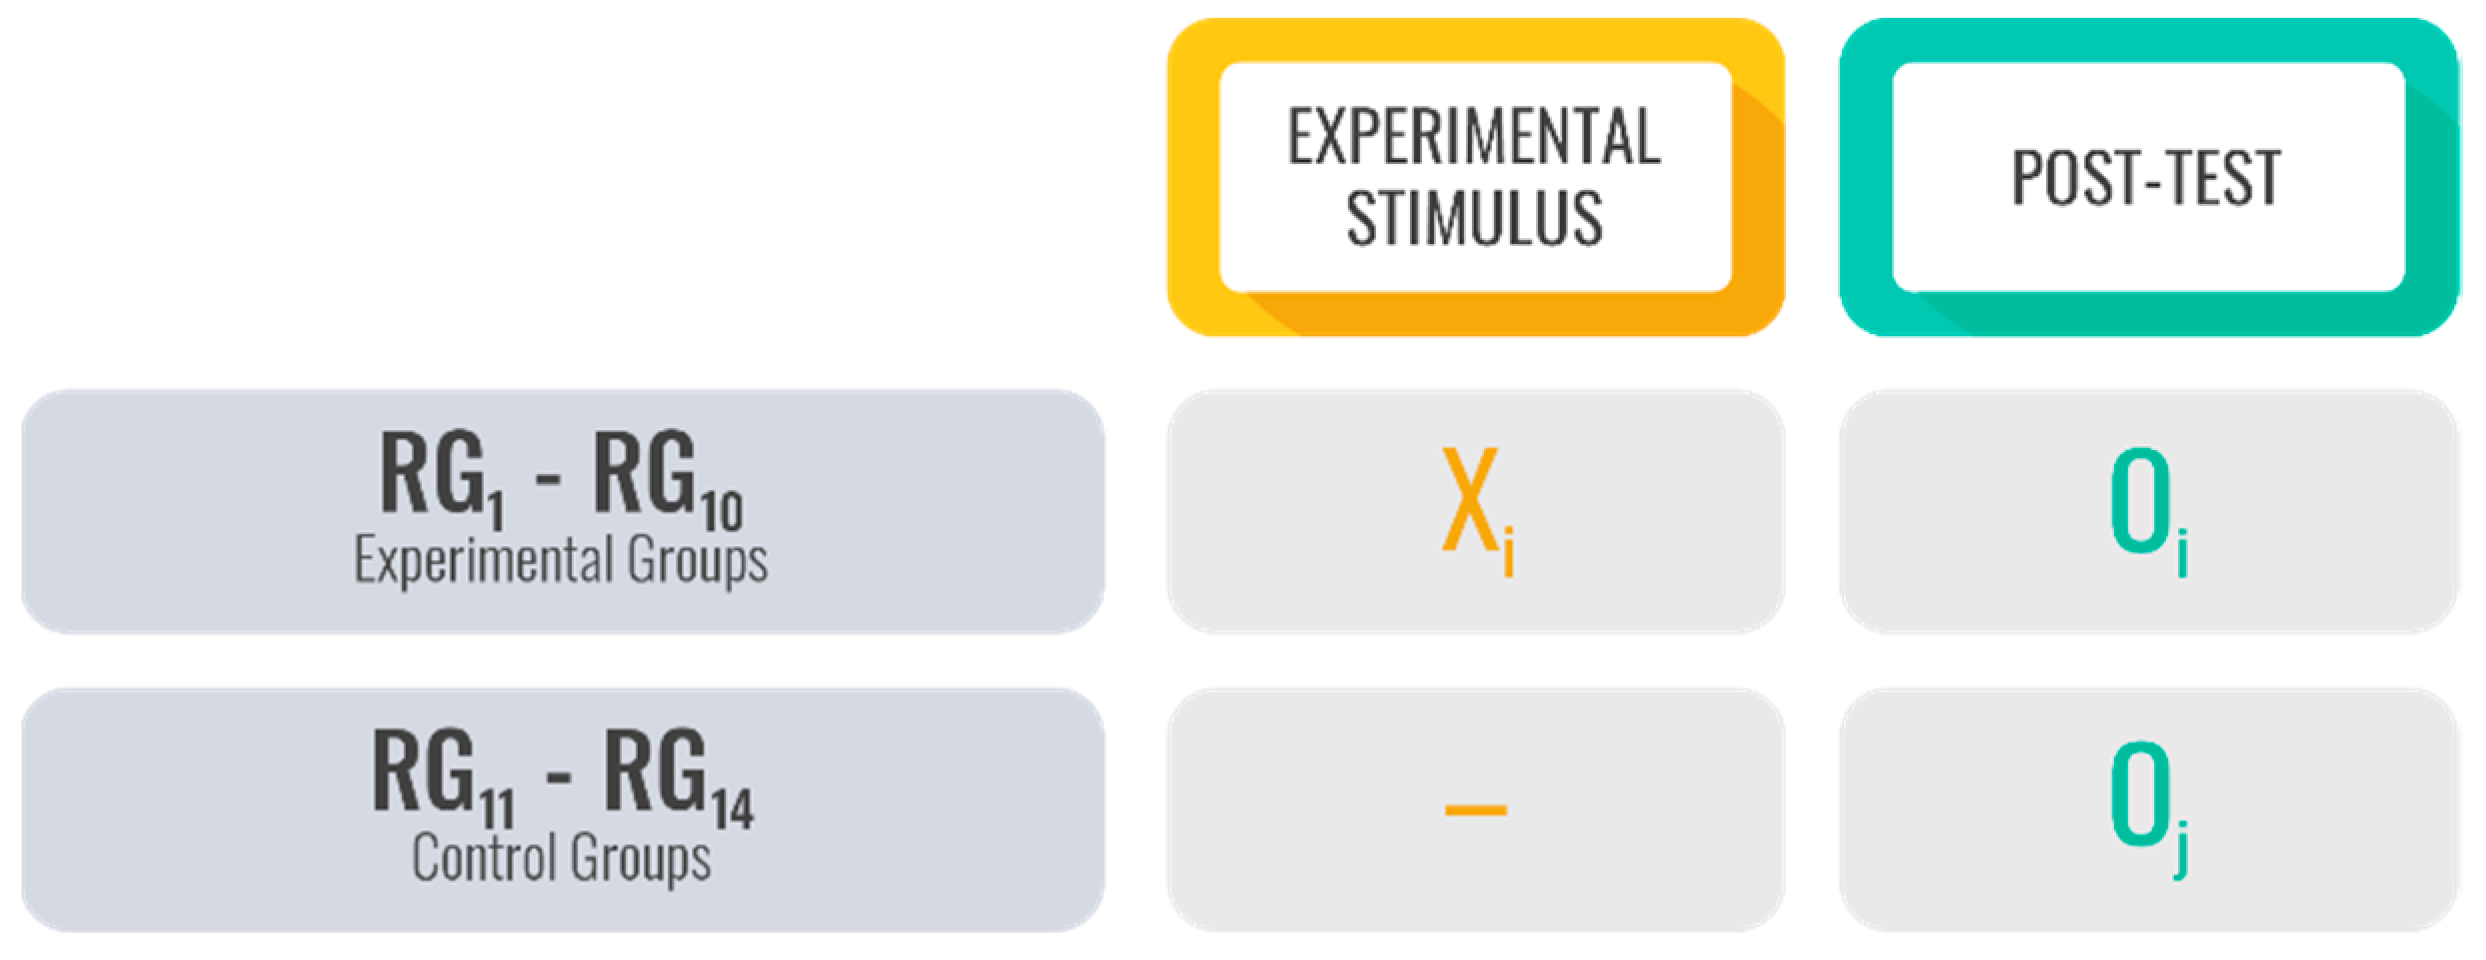
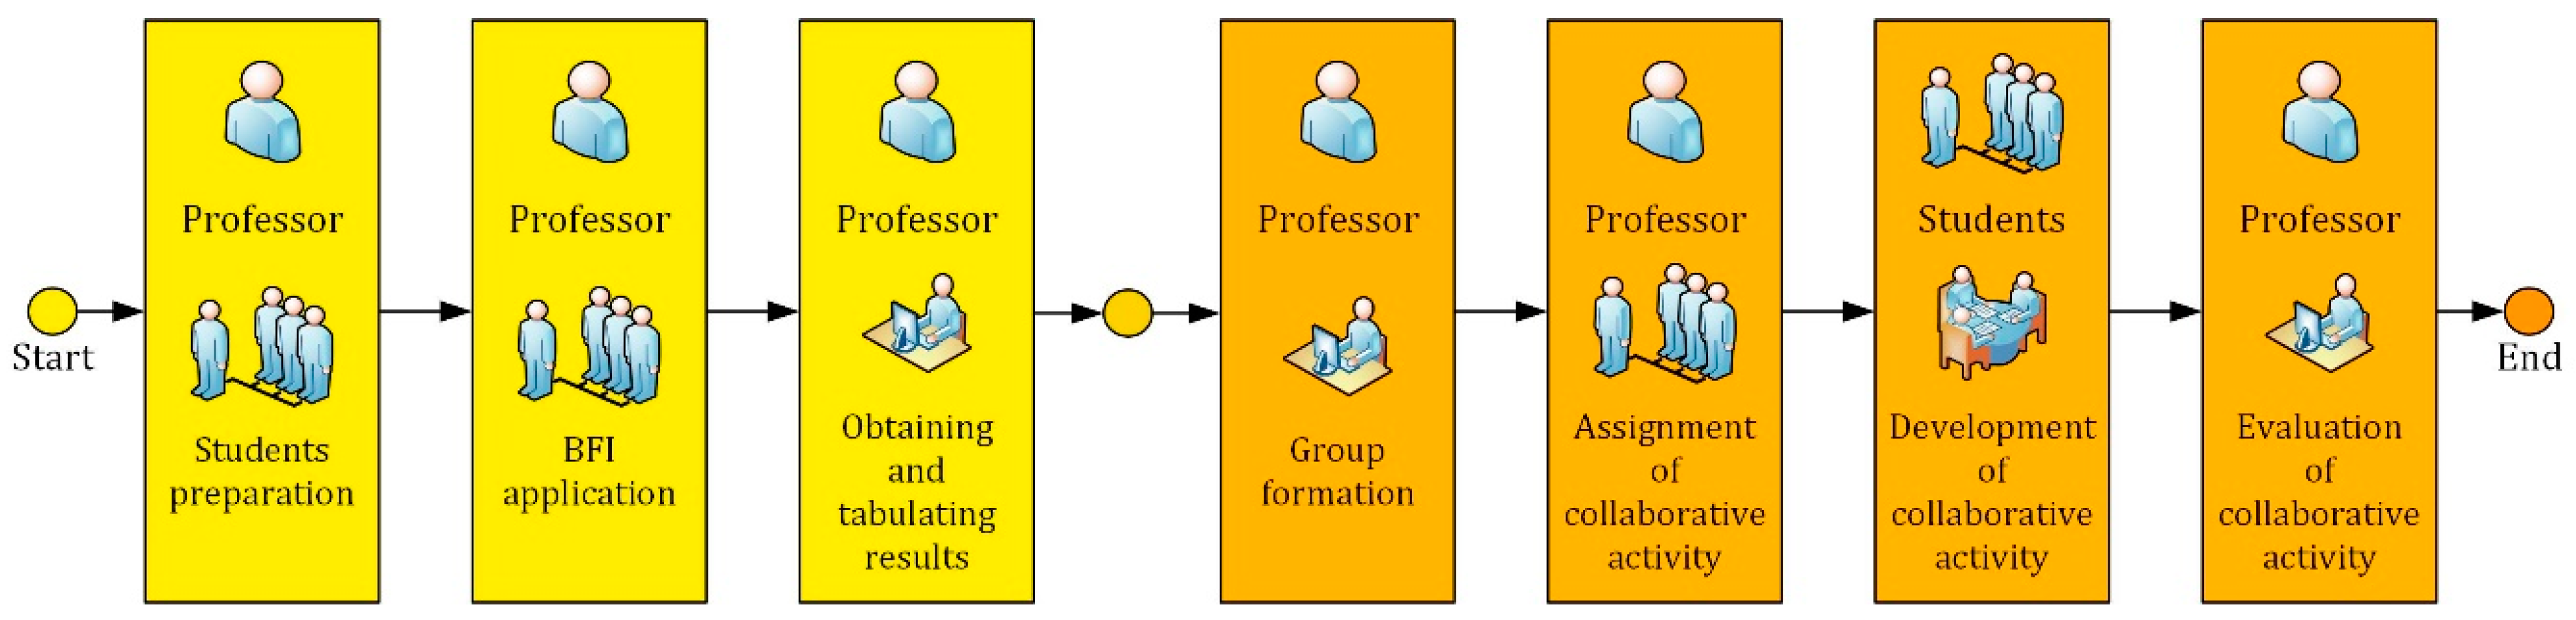
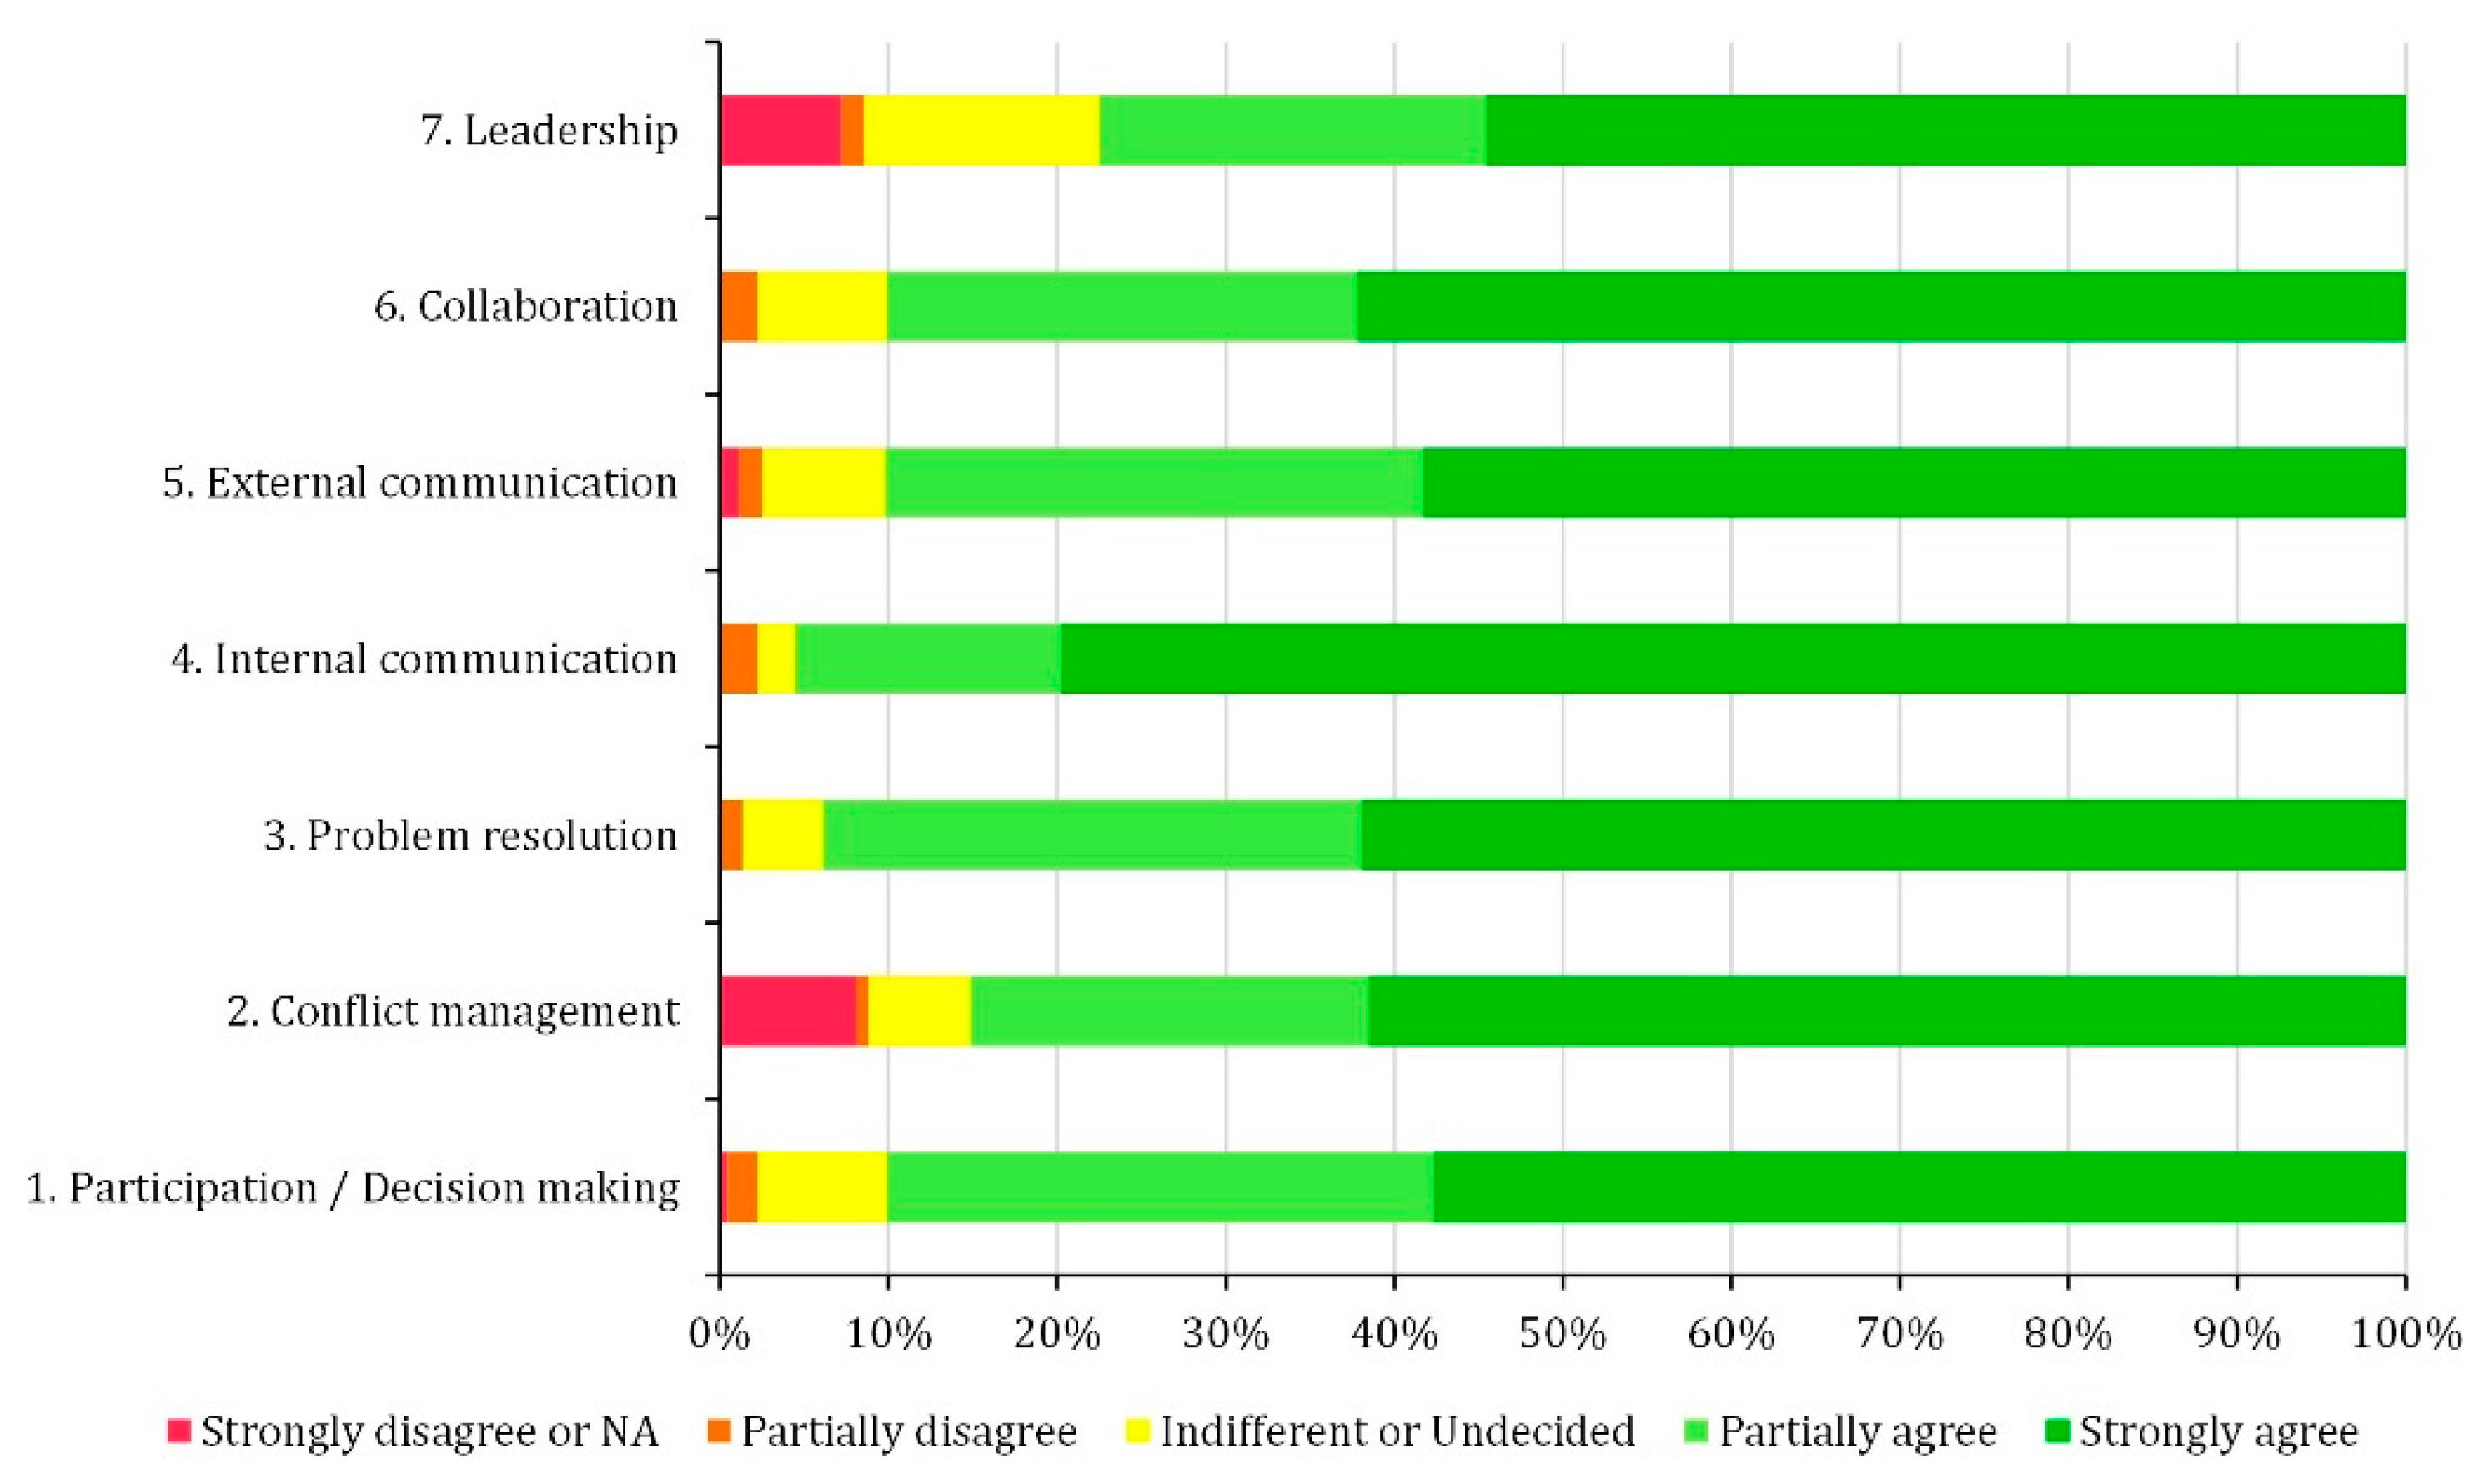
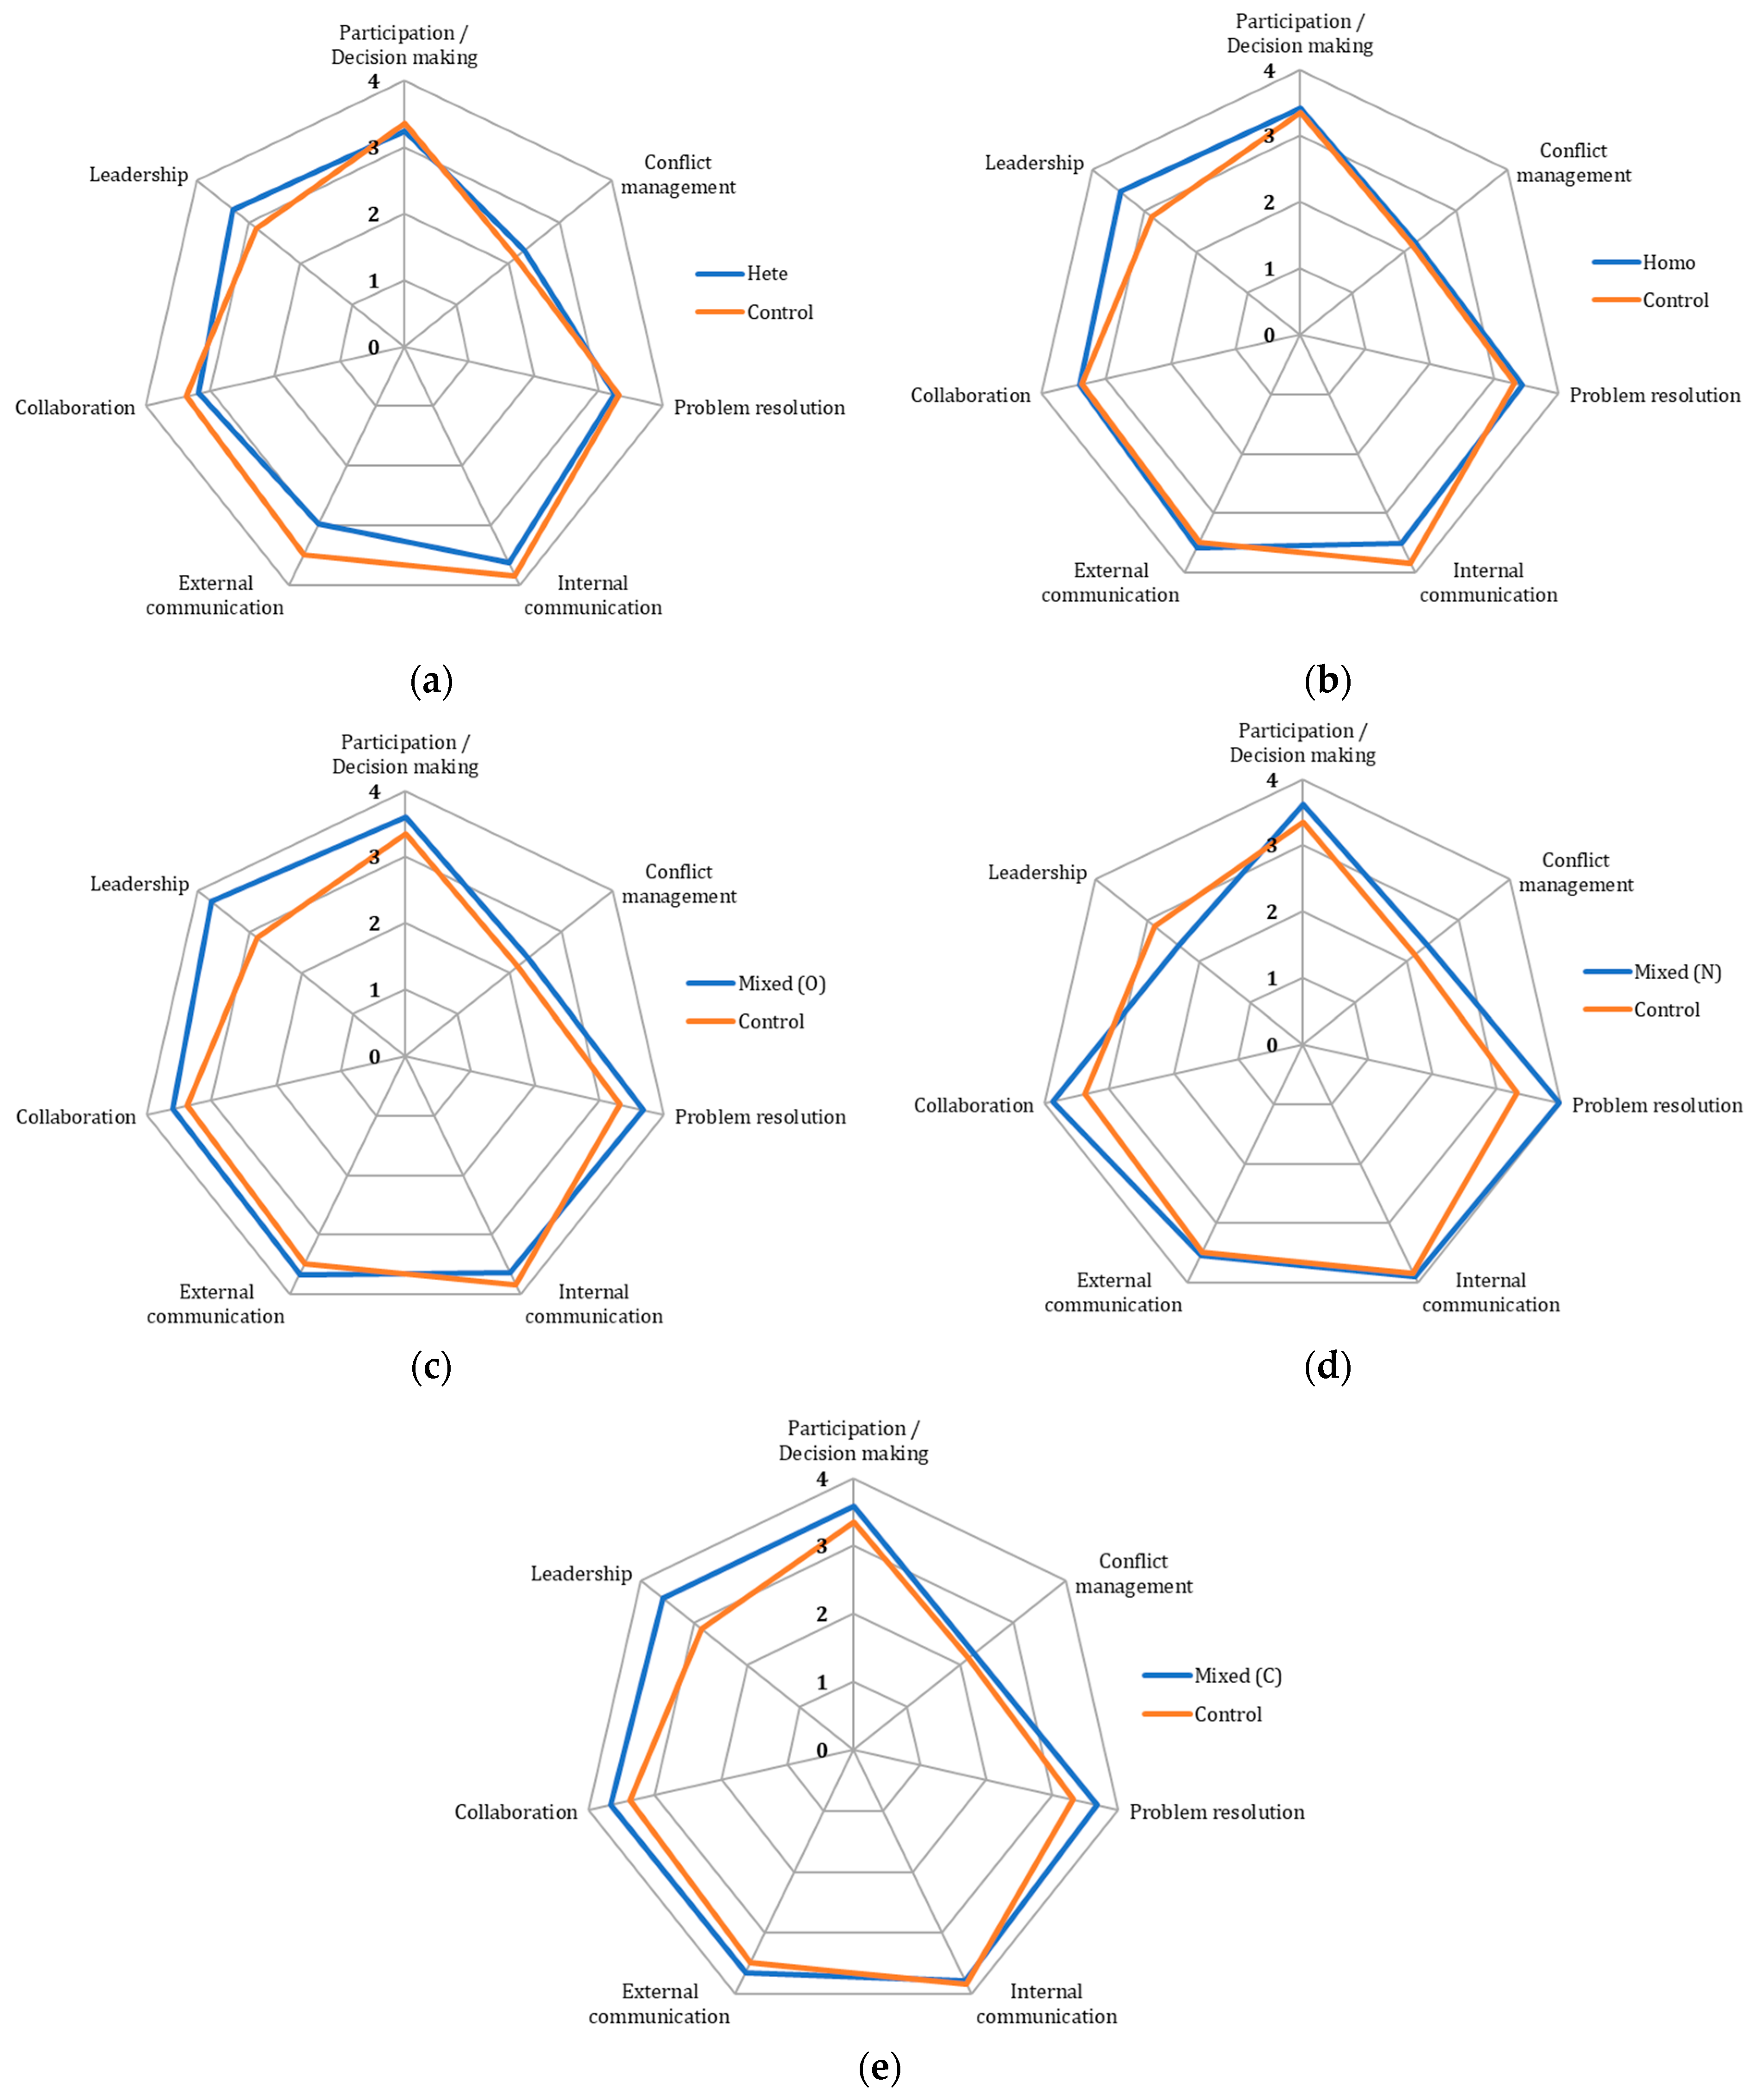
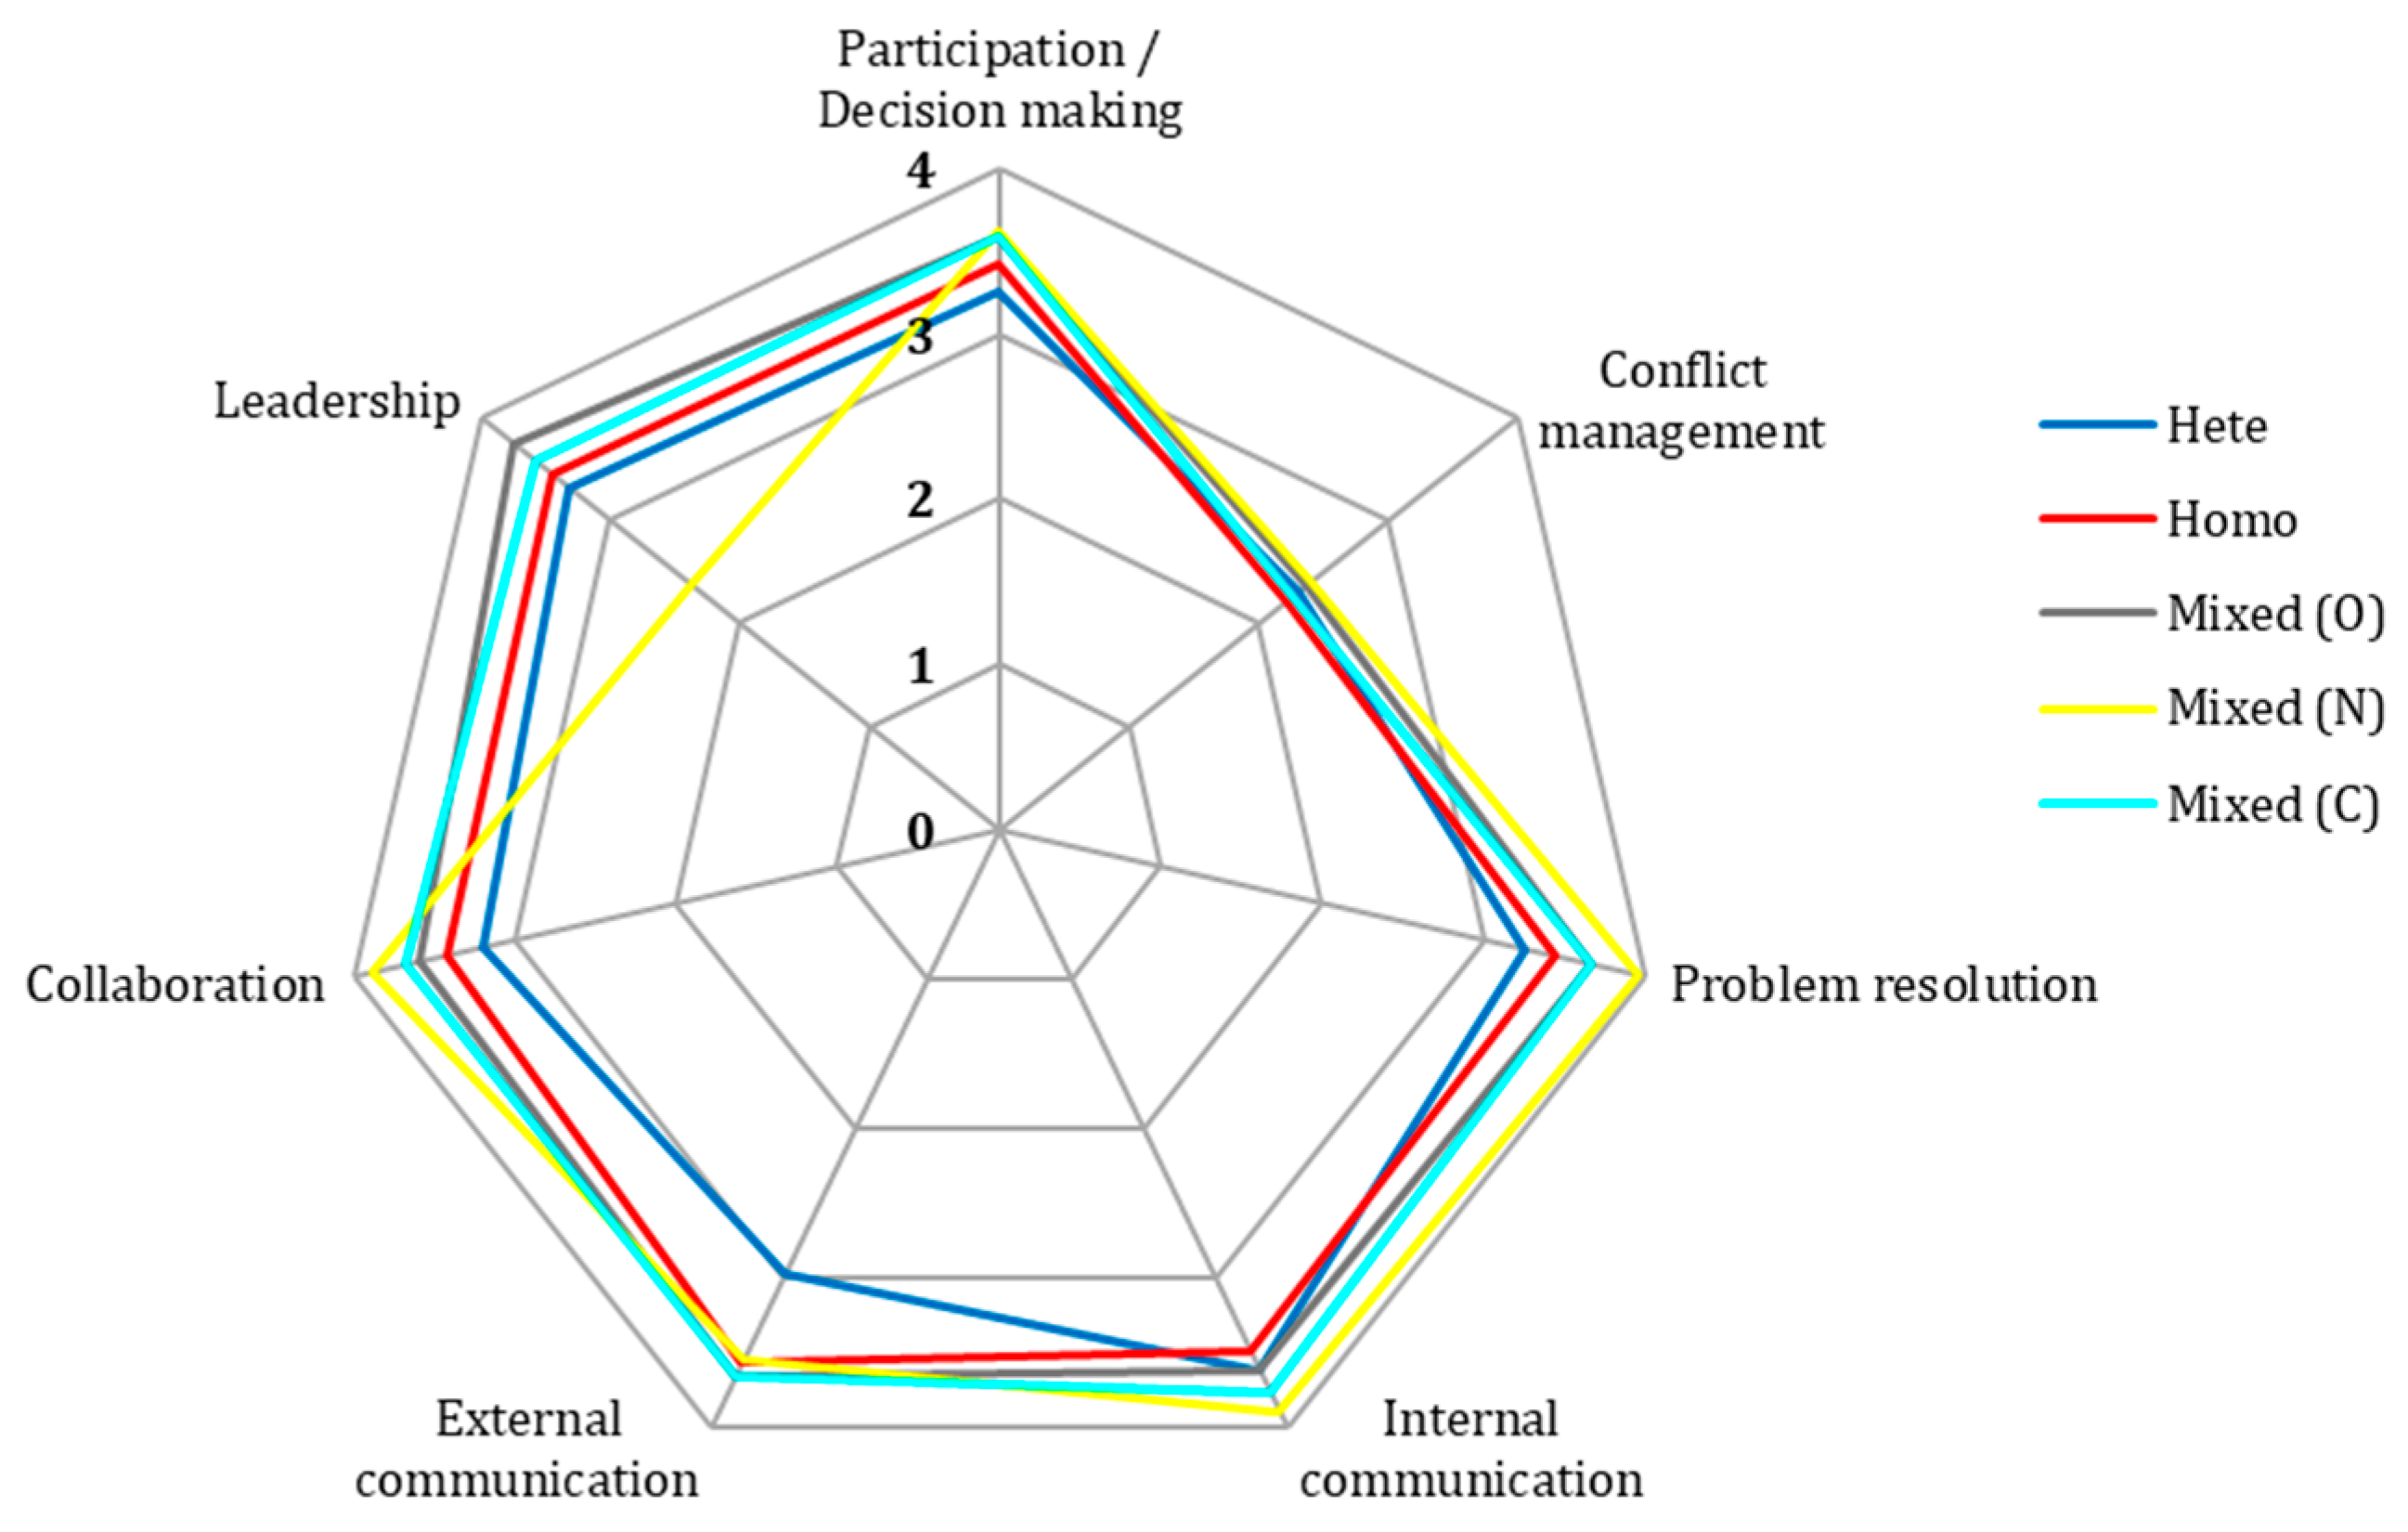