1. Introduction
Enhancing Low Earth Orbit (LEO) satellite communication system with the advanced technologies proposed in 5G will be a promising approach to achieve a high data rate with Gigabit per second (Gbps) broadband, low delay, and massive user access around the world [
1]. It will play a key role in future services scenarios in the sixth generation (6G) era, such as Global-enhanced Mobile Broadband (G-eMBB) in areas with no coverage by Base Stations (BS), or Remote-massive Machine-type Communications (R-mMTC) convergence [
2,
3,
4,
5,
6]. The oncoming network is the LEO Satellite Internet Network (LEO-SIN), which have some characteristics of large constellations with more than 1000 satellite, a high-frequency band with Ku, Ka, Q, and V, and broadband with more than 100 MHz for each user [
7,
8,
9,
10,
11]. The third Group Partnership Project (3GPP) put forward the Non-terrestrial Network (NTN) project to consider the satellite network as an access network within the fifth generation (5G) since 2018 [
12,
13]. Starlink has launched more than 1000 satellites to complete basic network construction and operate internet services for users since 2020 [
14,
15].
The biggest concern regarding the design of LEO-SIN is mainly to make communication systems adapt to the environment with high dynamic, long delay, and serious channel degradation. Therefore, how to describe and model the satellite channel characteristics accurately, would be the key to design systems and radio interfaces for LEO-SIN. There are some proposals in the NTN project focused on the performances and improvements of Orthogonal Frequency Division Multiplexing (OFDM) waveforms, receiver synchronization in satellite scenarios with high dynamic, and long delay [
16].
Some researches demonstrate that the subcarrier bandwidths and receiver synchronization need to suffer more than 100-kHz frequency offsets in LEO-SIN instead of about 20 kHz in earth [
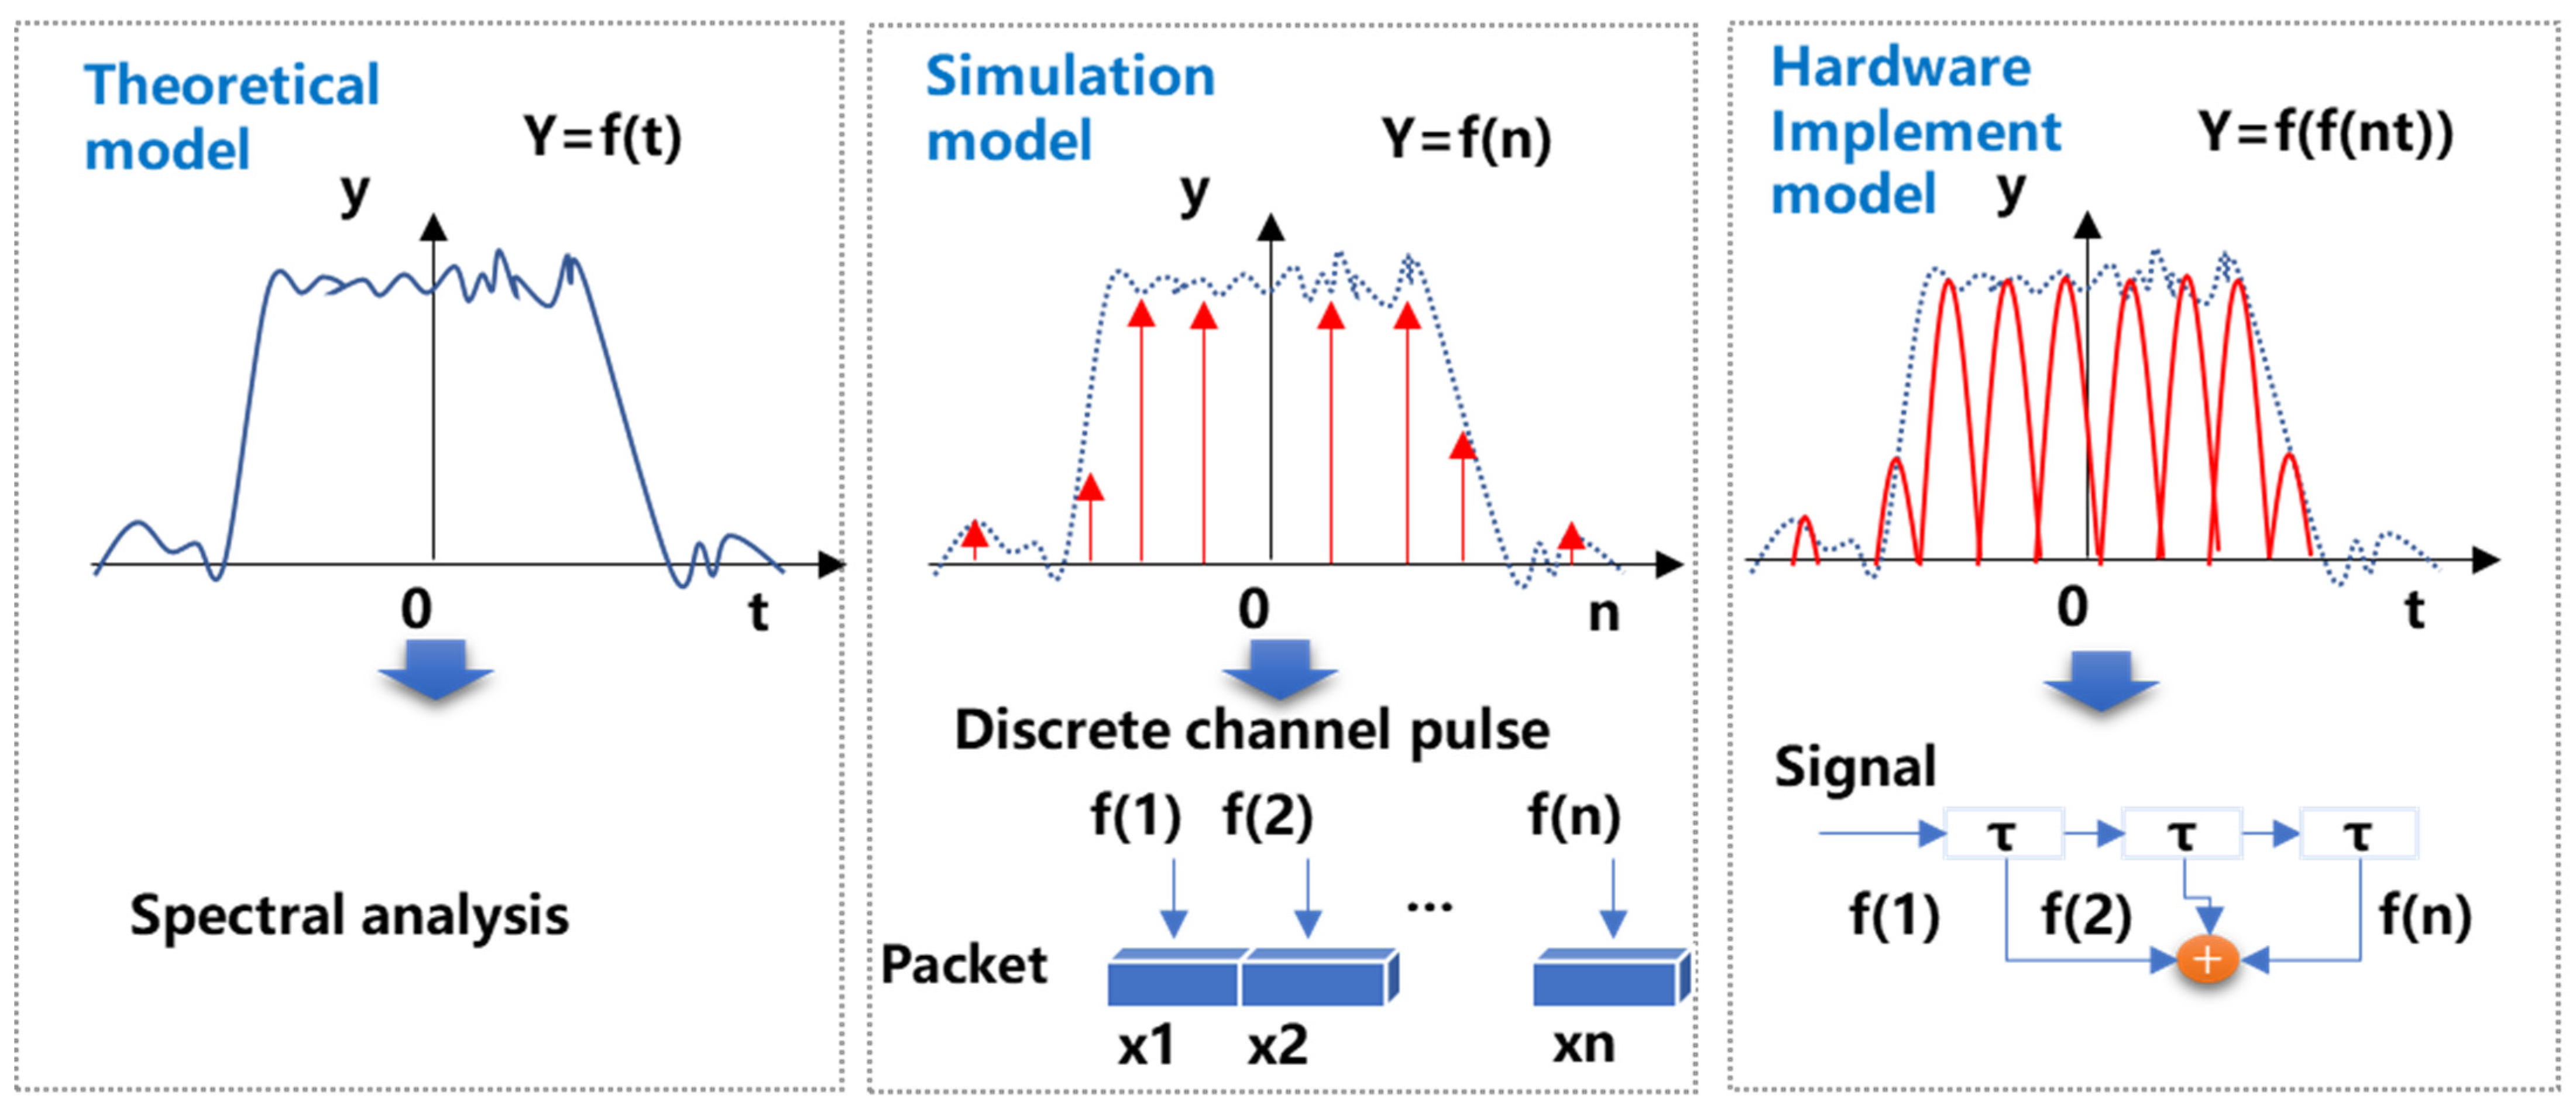
17]. The channel model is considered to describe the probability distributions of signal characteristics through channels, which can support the calculations of signals degradations of a different angle, power, delay, or phase. That is a set of continuous changes. However, in simulations or hardware implementation, all continuous signals would transfer into the form of discrete bits. Therefore, all channel characteristics in the simulations would respond to a set of discrete pulses, which superimpose on each relative filter, as shown in
Figure 1.
The Doppler Power Spectrum (DPS) is a method to describe frequency dispersion for the power superimposing from different paths with different arrival times or angles. The DPS of LEO-SIN is quite different from the DPS of the Geosynchronous Earth Orbit (GEO) satellite and Terrestrial Mobile Communication Network (TMCN). In the scenarios of the GEO satellite, there is an obvious main path, with greater power than that of other paths with long-distance degradations. The PDF of DPS of GEO obeys Rician distribution. In the scenarios of TMCN, the power of each path only has a few differences. The PDF of DPS of TMCN obeys Rayleigh distribution, whose paths have different dependent Doppler frequency offsets. The DPS of TMCN can be described by Jakes’ model. However, in the scenario of LEO-SIN, the power of the main path is not larger than other paths. So, the power of other paths cannot be ignored. In addition, there is a large Doppler-frequency Offset (DFO) delay spread for a large DFO changing rate. Some new characteristics are brought into the model of DPS in LEO-SIN, which are on the main path or not at the center point of DPS, asymmetrical DPS, and multi-path signals with random Angle of Arrival (AOA). The traditional Jake’s model cannot describe the above characteristics, which have obvious deviations from real situations.
Existing methods of simulation implementation of DPS are based on the superpositions of different sinusoids at a different discrete frequency, which are the methods of Sum-of-Sinusoids (SOS) [
18,
19]. To adapt to different scenarios, there are three types of SOS: The SOS with a static amplitude-frequency-phase, the SOS with dynamic amplitude-frequency-phase, the SOS with static amplitude-frequency, and an assembling dynamic phase. The SOS with static amplitude-frequency-phase, such as Method of Exact Doppler Spread (MEDS), assumes that the amplitude, frequency, and phase of the sinusoids are static. MEDS improved the efficiency of simulations and reduced the complexity of model implementation. However, with static amplitude-frequency-phase, MEDS cannot describe and simulate the random phase and AOA of multi-path, which reduces the accuracy of simulations. The SOS with a dynamic amplitude-frequency-phase such as the Random Method of Exact Doppler Spread method (RMEDS), assumes that the amplitude, frequency, and phase of the sinusoids are random. RMEDS can describe and simulate the random phase and AOA of multi-path by the traversal of AOA. However, the simulation with a fixed AOA in the traversal only describes the case of that AOA, which cannot enhance the performance for all cases of AOA, even if we increase the time of simulations. Increasing the number of sinusoids would increase the complexity of the simulation. The SOS with static amplitude-frequency and assembling dynamic phase, such as Method of Exact Doppler Spread-Set Partitioning (MEDS-SP), assembles different AOA to some pieces. Each AOA can be traversal in each piece, the average value of results can balance the simulation accuracy and complexity.
Considering the main path not at the center point of DPS, asymmetrical DPS, and multi-path signals with a random AOA in LEO-SIN, the DPS of LEO-SIN must solve the problem of simulations of random AOA and its variable range. Hence, we combine the advantages of RMEDS and MEDS-SP to design our new method. In the proposed method, SOS would be parted into different sets, then each AOA would be random and operate traversal in the sets. We call our novel method the Random Method of Exact Doppler Spread method Set Partitioning (RMEDS-SP), which has advantages of having a high accuracy of RMEDS and low complexity of RMEDS. In addition, the simulation errors of the simulation model will increase with time. We can compensate for this error by setting a piecewise function to the ACF convergent to the modeling error supposition with time by periodicity, which changes with the satellites moving.
Above all, this paper proposes a novel simulation modeling method and hardware implementation for DPS of LEO-SIN based on error compensations by assembling multi-path signals with random AOA and correlation piecewise convergence.
The main contributions are as follows:
- (a)
We first model the DPS of LEO-SIN. Then RMEDS-SP is firstly proposed to improve the accuracy and efficiency of DPS in simulations and hardware implementation;
- (b)
We exploit piecewise functions to the Autocorrelation Function (ACF) of DPS to converge the modeling error supposition with time by periodic changes, which further improve the accuracy of the DPS model in the scenarios of LEO-SIN;
- (c)
We further demonstrate the hardware implementation of this new method.
The rest of this paper is organized as follows. In
Section 2, the DPS of LEO-SIN is proposed. The Random Method of Exact Doppler Spread method Set Partitioning (RMEDS-SP) is introduced in
Section 3. In addition, the piecewise functions to the ACF of DPS are also introduced. In
Section 4, the proposed model implemented in the real hardware platform and tests is introduced.
2. DPS Modeling of LEO-SIN
LEO Satellite Internet Network (LEO-SIN) has some characteristics of large constellations with more than 1000 satellites, a high-frequency band with Ku, Ka, Q, and V, broadband with more than 100 MHz for each user. Therefore, the system model, channel model, and DPS model would be different from those of a GEO satellite mobile communication network and TMCN. This section introduces the system model, channel model, and DPS model of LEO-SIN.
2.1. System Model of LEO-SIN
According to the design of LEO-SIN from the NTN project, LEO-SIN is composited by satellites, User Equipment (UE), Earth Station (ES), and channels as
Figure 2 shows. In our assumptions, satellites would be the nodes with transparent forwarding, on-board signal regeneration, radio network accessing or switching, and routing [
20,
21]. Those functions of satellite nodes can be dynamically reconstructed. ESs would be the nodes supporting UE access and scheduling and managing all radio resources. UEs would be the nodes with data requests and receptions. The links between different nodes are also very important. There are two types of links, a Uses’ Link (UL) and Feeder Link (FL). ULs are the links between satellites and UEs. FLs are the links between satellites and ESs.
The forward link consists of the uplink of FL and downlink of UL. The reverse link consists of the uplink of UL and downlink of FL. The channels are the degradation of signals from the environment. In this paper, we focus on the downlink of the forward link and its DFO by satellite high-speed moving and the DPS affected by multi-path time spread from refracted and reflected by obstacles.
2.2. Channel Model and DPS Model
The propagation paths of signals in LEO-SIN are composed of air propagation paths and earth-surface propagation paths, which are shown in
Figure 3. The air propagation paths mainly suffer large-scale fading. The path loss is the major fading. The earth-surface propagation paths mainly suffer small-scale fading. The multi-path fading is the major fading, which is caused by the signal’s refractions and reflections by obstacles in the earth. Due to the high-speed movement of LEO satellites, based on the shelter by obstacles, the total fading after the arrival of the signal of the surface would periodically change with the elevation change between satellites and UEs.
The received signals can be considered as one signal with the Light of Sight (LOS) superposing on
N Non-light of Sight (NLOS) paths around the LOS paths. At the moment of
, the received signals can be expressed as,
where,
denotes the LOS component of signals,
denotes the NLOS or multi-path component of signals,
denotes transmitted signals,
denotes channel impulse responses of LOS component,
denotes the channel impulse responses
multi-path component, and
denotes the number of the multi-path signal.
The channel impulse response of the LOS component can be expressed as:
where,
is the power of the LOS component, and
is the value of DFO. The major
is caused by the high-speed relative movement between satellites and UEs, which can be calculated according to ephemeris [
22].
The channel impulse response of multi-path component can be expressed as:
where,
,
, and
are the power, initial phase, and Doppler frequency offset of the
multi-path signal. Here,
,
obeys Rayleigh distribution. In our assumptions for further study,
obeys the uniform distribution range on
. The multi-path signals only need to consider one-time reflection by the nearby scatterers. The power of signal caused by twice or more reflections by far scatterers can be ignored [
23].
Then the ACF of the signal at time
and
can be expressed as:
DPS can be obtained by its Fourier transform,
2.3. DPS Simulation Model
The above theoretical model of DPS needs to make its envelopes discrete on each frequency to load in the simulations and hardware implementation. Existed models such as MEDS, RMEDS, and MEDS-SP, are all based on SOS, which superpose a limited number of sinusoids and control their amplitudes, frequencies, and phases to approximate Gaussian Colored Noise (GCN). They can simulate different signals fading.
In the method of MEDS, the number of sinusoids is limited [
24]. The larger the number
, the better the simulation performances [
25]. The Gaussian random process
can be expressed as,
where,
,
, and
denote the amplitude, phase, and frequency of the
nth sinusoid.
obeys the uniform distribution range on (−
π,
π] and is independent of each other.
Based on SOS,
is set as a constant,
and
are random variables in MEDS, whose random process is divided into two orthogonal components
and
of I and Q components, and the Gaussian process can be expressed as:
where
denotes the number of multi-path, and
is the maximum DFO.
denotes the AOA of the nth path determined by the moving direction of the receiver.
denotes the phase change of the
nth path. With static amplitude-frequency-phase, MEDS cannot describe and simulate the random phase and AOA of multi-path. The reason is that the orthogonality of each superimposed power spectrum of sinusoids would destruct by the introduction of generalized non-stationarity.
The method of RMEDS was proposed to improve the orthogonality of each superimposed power spectrum of sinusoids through setting phase and AOA random [
25,
26]. Based on MEDS, the AOA
of the
nth path in RMEDS is,
where
obeys the uniform distribution of
. However, the simulation at one AOA in the traversal only describes the case of that AOA, which cannot enhance the performance for all the cases of AOA, even if we increase the time of simulations in RMEDS. By increasing the number of sinusoids, the complexity of simulations would increase too. The models and performances of MEDS and RMEDS are shown in
Figure 4.
To reduce the complexity of simulations and implementation, MEDS-SP [
27] was proposed, with part sinusoids into K sets according to AOA and the average of each set to improve the performances. The model of MEDS-SP is shown in
Figure 5.
The Gaussian process can be expressed as,
In each set of sinusoids, the traversal of phase and AOA are exploited to a relatively small scale to improve complexity. Meanwhile, the modeling error can also be compensated by the average of each AOA in the set.
3. Results of the Random Method of Exact Doppler Spread Method Set Partitioning (RMEDS-SP) and Correlation Piecewise Convergence
Traditional DPS modeling methods such as MEDS, RMEDS, and RMEDS-SP cannot provide enough accuracy and efficiency to describe and model the DPS in the simulations for LEO-SIN. Therefore, we propose a novel simulation modeling method for DPS of LEO-SIN based on error compensations by parting multi-path with random AOA and correlation piecewise convergence. First, the novel method of RMEDS-SP is introduced. Then, we would further demonstrate how piecewise functions to the ACF of DPS converge the modeling error supposition with time by periodic changes. The simulations show that the proposed method has better performance of modeling accuracy than other models.
3.1. RMEDS-SP
Considering the main path not at the center point of DPS, asymmetrical DPS, and multi-path with random AOA in LEO-SIN, the DPS of LEO-SIN must solve the problem of simulations of random AOA and its variable range. Hence, we combine advantages of RMEDS and MEDS-SP to design our new method RMEDS-SP. In the proposed RMEDS-SP, SOS would be parted into different sets, then each AOA would be random and be operated traversal in the sets. RMEDS-SP combines the advantages of high accuracy by RMEDS and the low complexity by RMEDS.
In the proposed RMEDS-SP, the AOA would be added into a random number based on MEDS-SP, the model of MEDS-SP is shown in
Figure 6.
The Gaussian process of RMEDS-SP can be expressed as,
where,
and
denotes two orthogonal components of the I component and Q component,
denotes AOA of the nth path determined by the moving direction of UE,
denotes the phase change of the nth path, and
denotes the number of partition sets. Referring to MEDS-SP, the large sets of sinusoids with random phase and AOA would be further parted into small sets of sinusoids. In the small sets, the sinusoids with random AOA
would be superposed and the average would be calculated to obtain the optimal value.
Since the range of AOA is random and not permanent, we set the AOA in the proposed RMEDS-SP independent and obey a uniform distribution range in .
As
Figure 6 shows, the random AOA range in
, has each AOA corresponding to one point on the circle. For example, the AOA of sinusoids are parted into two sets; we have the number of sets
K = 2. These two sets are {
} and {
}. We can configure different AOA and the number of sinusoids in each simulation in the set, and get the suitable AOA with the least error and calculate the time-domain response of that to take as the time-domain response of the whole set. Then, the time-domain response of each set would be superposed to get an overall optimal time-domain response of the signal. Here, the overall number of sinusoids is
. Its ACF can be expressed as,
where,
, 3,
…,
, 3,
…,
, and the overall average ACF is the average of ACF of each set.
3.2. DPS Modeling Accumulated Error Compensations by Converging Piecewise Functions to the ACF
The above proposed RMEDS-SP model can reduce the modeling error to a certain extent, and we still need to further compensate the accumulated modeling errors from the residual error after the compensations by RMEDS-SP at each time. DPS would change with a certain periodicity by the periodicity of a satellite moving in LEO-SIN. Those periodic changes can be introduced into the simulations model. The accumulated errors can be compensated by a group of converging piecewise functions to the ACF of DPS.
First, we analyze the accumulated errors of the DPS simulation model with time. The square error function (SEF)
(
) is observed,
where,
denotes the ACF of a simulation model, and
is the ACF of the reference model. The number of sinusoids is considered permanently. The SEF of RMEDS-SP is shown in
Figure 7. As
Figure 7 shows, we can calculate that when the relative time is smaller than
, the square error of RMEDS-SP is small. Here,
denotes the maximum reliable interval between the observed moment and referenced moment (the relative time). When the relative time exceeds
, the square error of ACF will become obviously larger.
Figure 7 also shows the performance of the square error of MEDS-SP and RMEDS-SP.
The number of sinusoids is set as
, the unit of relative time is set as 1 ms, the maximum Doppler spread caused by multi-path is set as
, and
is set as 126 ms. Such a parameter setting can provide a better accuracy fit with guaranteed efficiency in simulation and subsequent hardware implementation, and a similar parameter setting also appears in [
19,
27]. When relative time is less than 110 ms, the square errors of both models are at a low level of 0.007, and that of RMEDS-SP is lower than that of MEDS-SP. When the relative time is more than 126 ms, the square error would increase obviously, which is more than 0.025. The square error of RMEDS-SP is also lower than that of MEDS-SP. We follow the corresponding relations,
has positive relations with the number of sets
K and the number of sinusoids
N in each set, has negative relation with maximum DFO
[
27]. Therefore, the
of proposed RMEDS-SP is assumed as
,
=
.
Since the limited number of sinusoids is the essential precondition for improvement, we just exploit the periodic features by the periodicity of a satellite moving to improve the DPS model. There are three features:
- (a)
The ratio of LOS power to NLOS power is limited. Since existing LOS signals, the ratio
of LOS power to NLOS power is limited. However, for the randomness power distribution of SOS, some power of multi-path would be larger than that of LOS signals. Therefore, this
can be exploited to control the accumulated errors of the DPS simulation model. According to Equation (19), when the square errors at this moment are more than the maximum of square range from
, maximum of square error range from
would be taken to compensate for the modeling error. When the square errors at this moment are less than the maximum square range from
, the square errors of ACF would be taken to compensate. So, we can eliminate some obvious large error of RMEDS-SP by the power controlling,
- (b)
The DPS modeling error is limited for the limited number of AOA . Since the power of multi-path signals are relatively weak, from multi-path can only contribute a little to the whole DPS. This type of modeling error can be described by the elevation angle. Even if the satellites are moving fast, the serving satellite on the top of UEs still obeys the same track and process. That is, the elevation angle would change from low to 90 degrees, obeys the same rule. When the elevation angle is low, would increase, while the elevation angle is high, would decrease. According to the NTN project, can be set by the constraining of different scenarios.
- (c)
The characteristics of DFO and DPS are periodic. The signals from one satellite to the next satellite the UEs receive suffer from the same environment and process. The channel responses and changes are periodic. That is, the DFO and DPS and their modeling error should only have a few differences between this interval (satellite 1 on the top) and the next interval (satellite 2 on the top). Therefore, the former DPS modeling error can be exploited to compensate for the modeling error of DPS at the next interval. So, we model the periodic maximum DFO
to improve the DPS modeling error. Since there is an obvious large correlation at the moment of observed starting and the moment of
, we design a Converging Piecewise Function (CPF) for the ACF of RMEDS-SP with many simulations. Note that there is not only one CPF. Here, the CPF is,
Equation (21) shows the relation between elevation change and modeling error, where
denotes the relative time. The CPF is introduced to the RMEDS-SP model through multiplication by the ACF, the new model is expressed as,
When is finite, since the number of sinusoids and sets of sinusoids is not enough, the large modeling error is inevitable, and it will directly affect the important ACF. After introducing the proposed CPF, the modeling error would be compensated to a certain extent at the divergence part.
When , since there are lots of sinusoids and sets of sinusoids, the effect of the simulation of the DPS model is very close to the theoretical model. At this moment, we do not need CPF to compensate for the accumulated modeling errors. Here, =, that is, the values of approaches to 1, and the convergence effect in the time-domain is approximately 0.
The ACF of the final model is expressed as follows,
where
. From Equation (26), we can figure out that when
, the effect of the simulation of the DPS model is very close to the theoretical model. When the number of sinusoids
and sets of sinusoids
are small, the CPF can also improve the modeling error. The detailed analysis would be further demonstrated in the next chapter.
3.3. Performance Analysis
We operate the performance analysis of the proposed RMEDS-SP with converging piecewise functions to the ACF. The indicators of analysis are the time-domain envelope, PDF, ACF, and Mean Square Error (MSE) of DPS. The referenced models are MEDS, RMEDS, and MEDS-SP.
3.3.1. The Time-Domain Envelope and PDF Analysis
First, we select the Rayleigh model as the reference model, the PDF of the Rayleigh theoretical model is,
According to Jeffrey’s divergence (J-div) model, the similarity between the theoretical PDF and simulated PDF can be analyzed by the parameter of distance
,
where,
denotes J-div,
denotes discrete PDF of theoretical Rayleigh model, and
is a discrete PDF of the simulated model. Since the real part and imaginary part of the signals in RMEDS-SP satisfy the zero-mean Gaussian random process when the number of sinusoids tends to infinity, the PDF of RMEDS-SP simulated Rayleigh model would also obey Rayleigh distribution, then we have,
According to Equation (29) and the theory of infinite sine, = 1, it can be deduced that is equal to 0, that is, the model conforms to the Rayleigh process.
To characterize the fluctuations of simulation results caused by random phase and AOA better, we design a new first-order PDF of error based on the J-div model [
28], that is,
where,
denotes the similarity between the average simulated PDF error and theoretical PDF error,
denotes the number of simulation times, and
is the number of inter-sample points for calculating the PDF of DPS in the simulations.
Figure 8 shows the results of PDF of different models.
As
Figure 8 shows, the PDF of the signal’s envelope model by RMEDS-SP is more similar to the theoretical PDF of Rayleigh distribution than those of MEDS-SP. The results substitute into Equation (30), we can get the modeling error of each model, as
Table 1 shows.
It can be seen from
Table 1, when the number of sinusoids and the number of simulations time are the same, the similarity
by MEDS, RMEDS, MEDS-SP, and RMEDS-SP are 0.007036, 0.006969, 0.007172, and 0.006807. That shows that the modeling error by the proposed RMEDS-SP has better performance than other models.
3.3.2. ACF Analysis
The ACF of DPS of different models would be furtherly analyzed, as
Figure 9 shows.
When the number of sinusoids are set as and the number of simulation times are the same, the ACF of RMEDS-SP is more similar to the theoretical PDF of Rayleigh distribution than other models. When the relative time is 90 ms, the value of ACF of the theoretical model, RMEDS-SP, MEDS-SP is 0.01646, 0.01631, and 0.01908. We can figure out that the performance of the ACF of RMEDS-SP is better than that of the MEDS-SP.
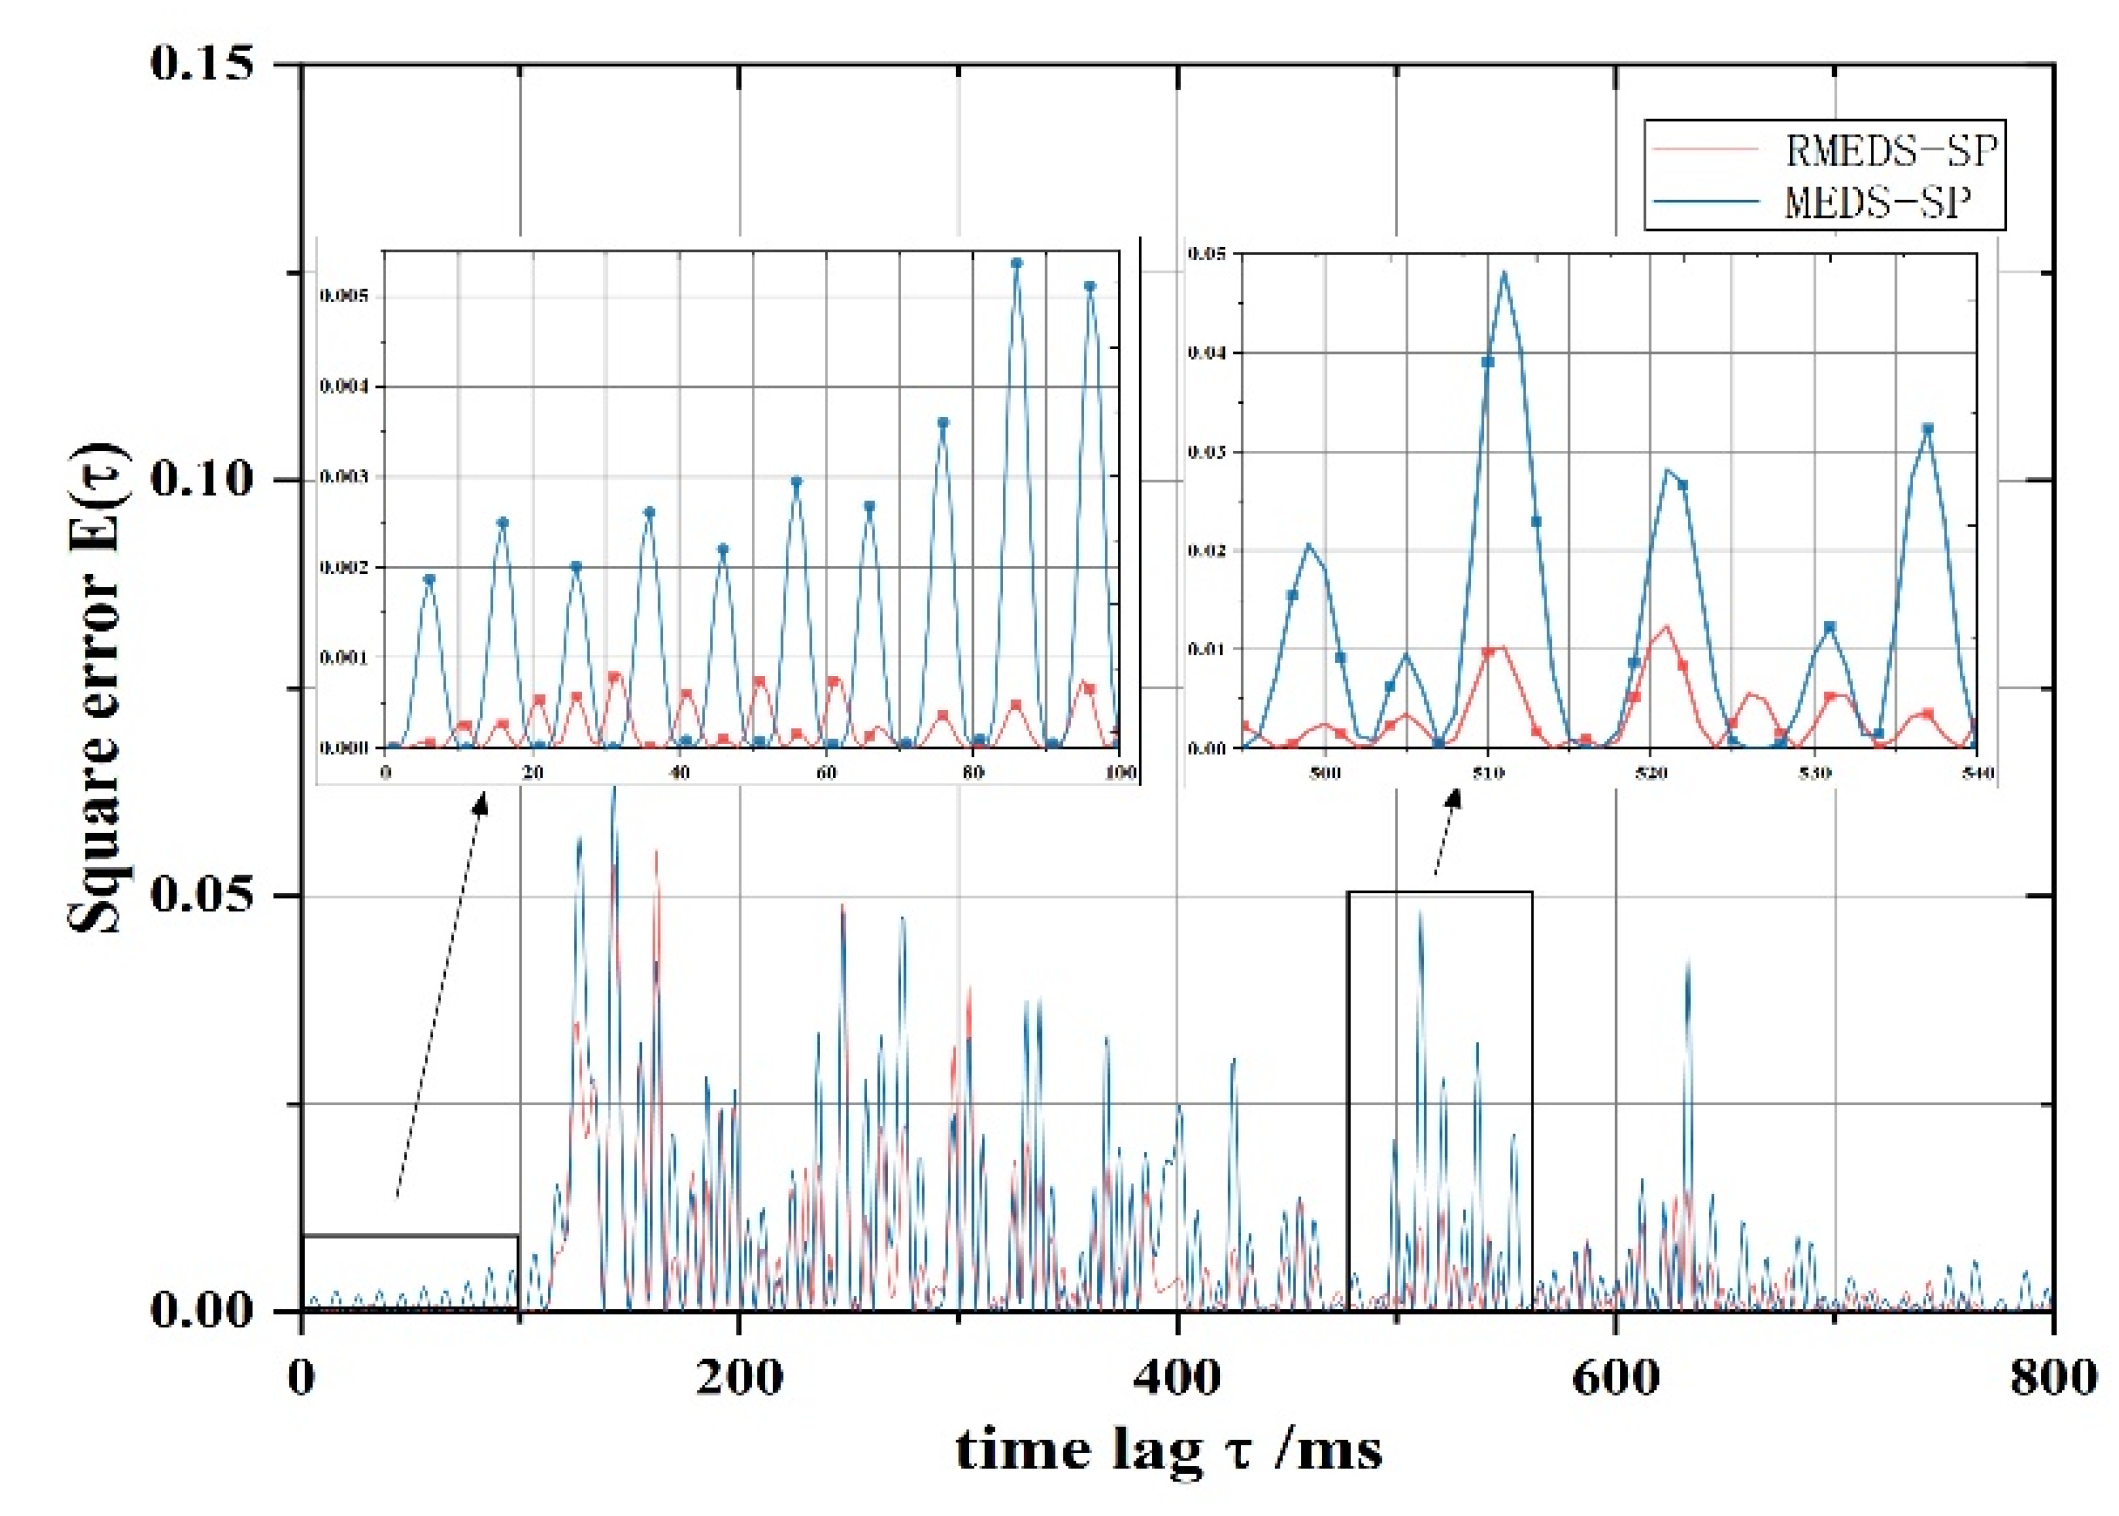
We define SEF for ACF
(
) to analyze the ACF error of different models, which can be substituted into Equation (19). As
Figure 10 shows, when the number of sinusoids and number of simulations time are the same, the ACF error of RMEDS-SP is lower than 0.001 at a relative time from 0 to 110 ms, which have better performance than those of MEDS-SP. At the relative time from 300 ms to 700 ms, the ACF error of RMEDS-SP have an obvious improvement than at a relative time from 0 to 110 ms.
3.3.3. MSE of DPS Analysis
MSE of DPS is used to quantitatively analyze the second-order deviation of different simulation models, which can be expressed as,
where
is the number of sample points within the relative time,
denotes the ACF error of the simulation model,
is the ACF error of the reference model. MSE of ACF of different models is calculated, and the simulation accuracy of the model is reflected by comparison. Since the random results of simulations, we get the average of
,
where,
denotes the number of simulations times, and
is each MSE obtained from each simulation. According to Equation (32), we can obtain
results of MEDS-SP and RMEDS-SP, as
Table 2 shows.
As
Table 2 shows, the number of sinusoids is set as
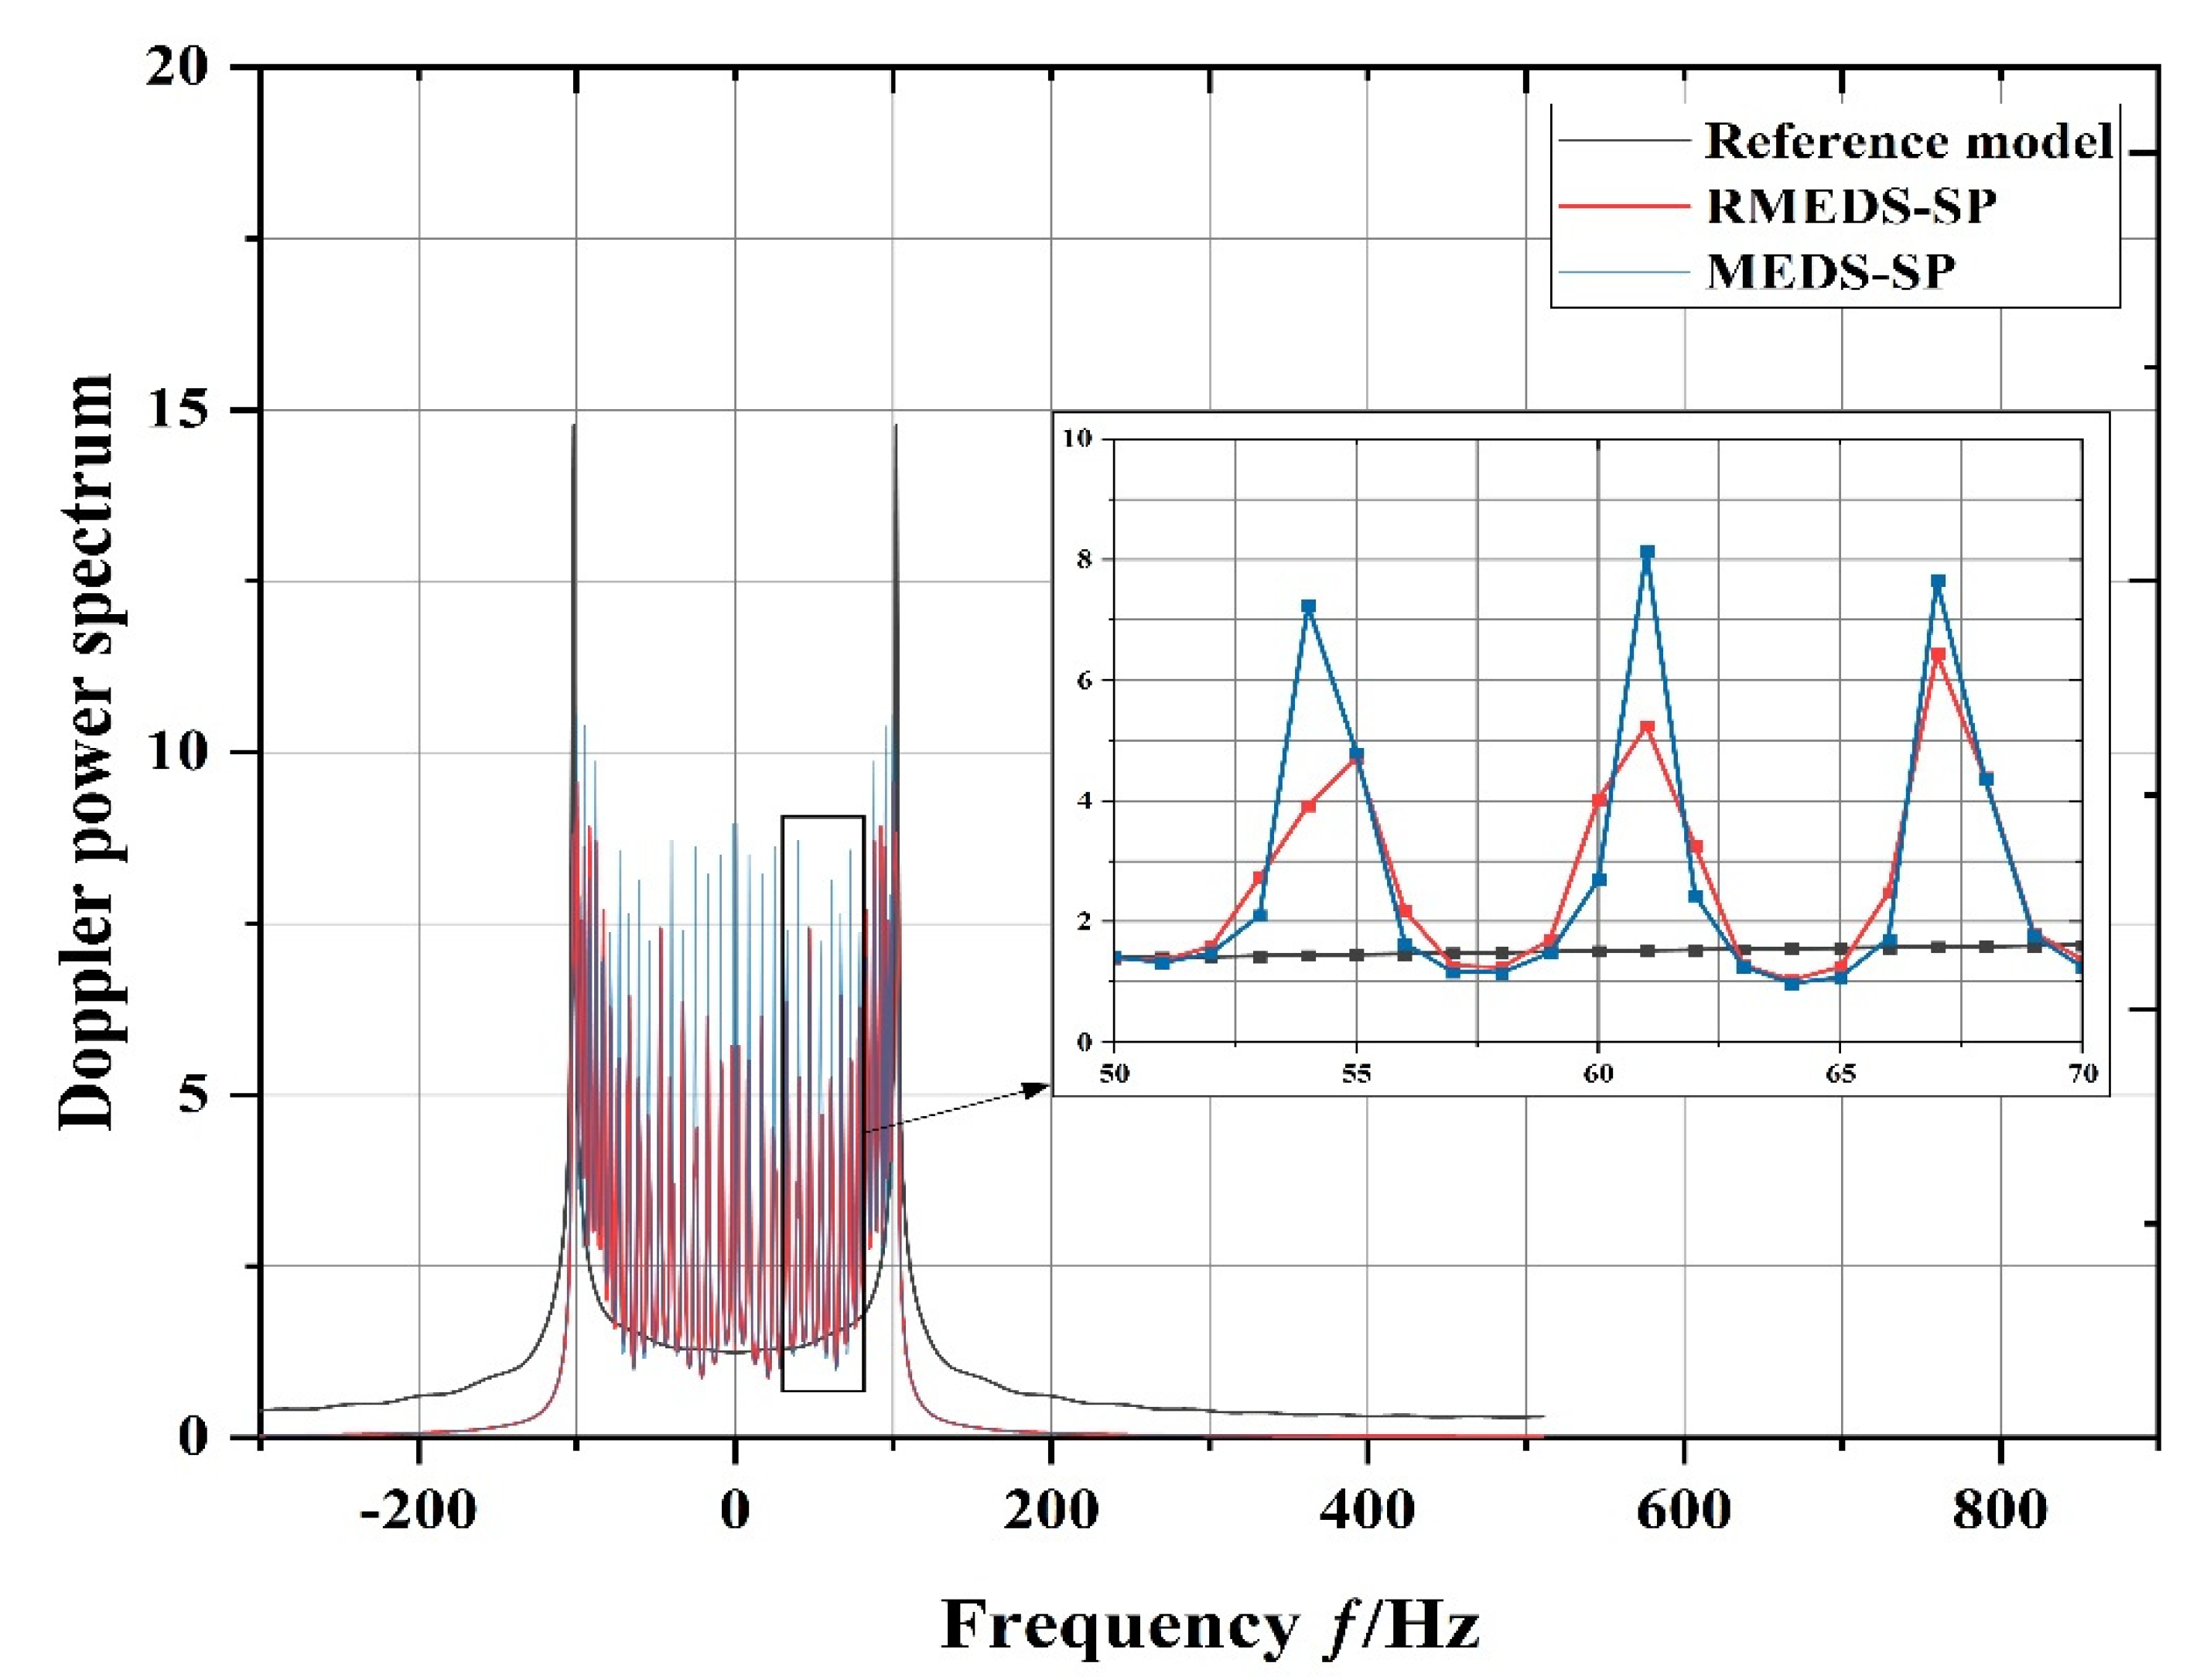
, the MSE of DPS by RMEDS-SP improves the accuracy by about 31.24% compared with the MEDS-SP model. The corresponding DPS of a different model is operated by the Fourier transform of the ACF, which is shown in
Figure 11.
As
Figure 11 shows, the DPS of RMEDS-SP is more similar to the referenced model than the DPS of MEDS-SP. The MSE of DPS of RMEDS-SP and MEDS-SP are 12.85 and 18.95, which have about a 32.19% performance improvement.
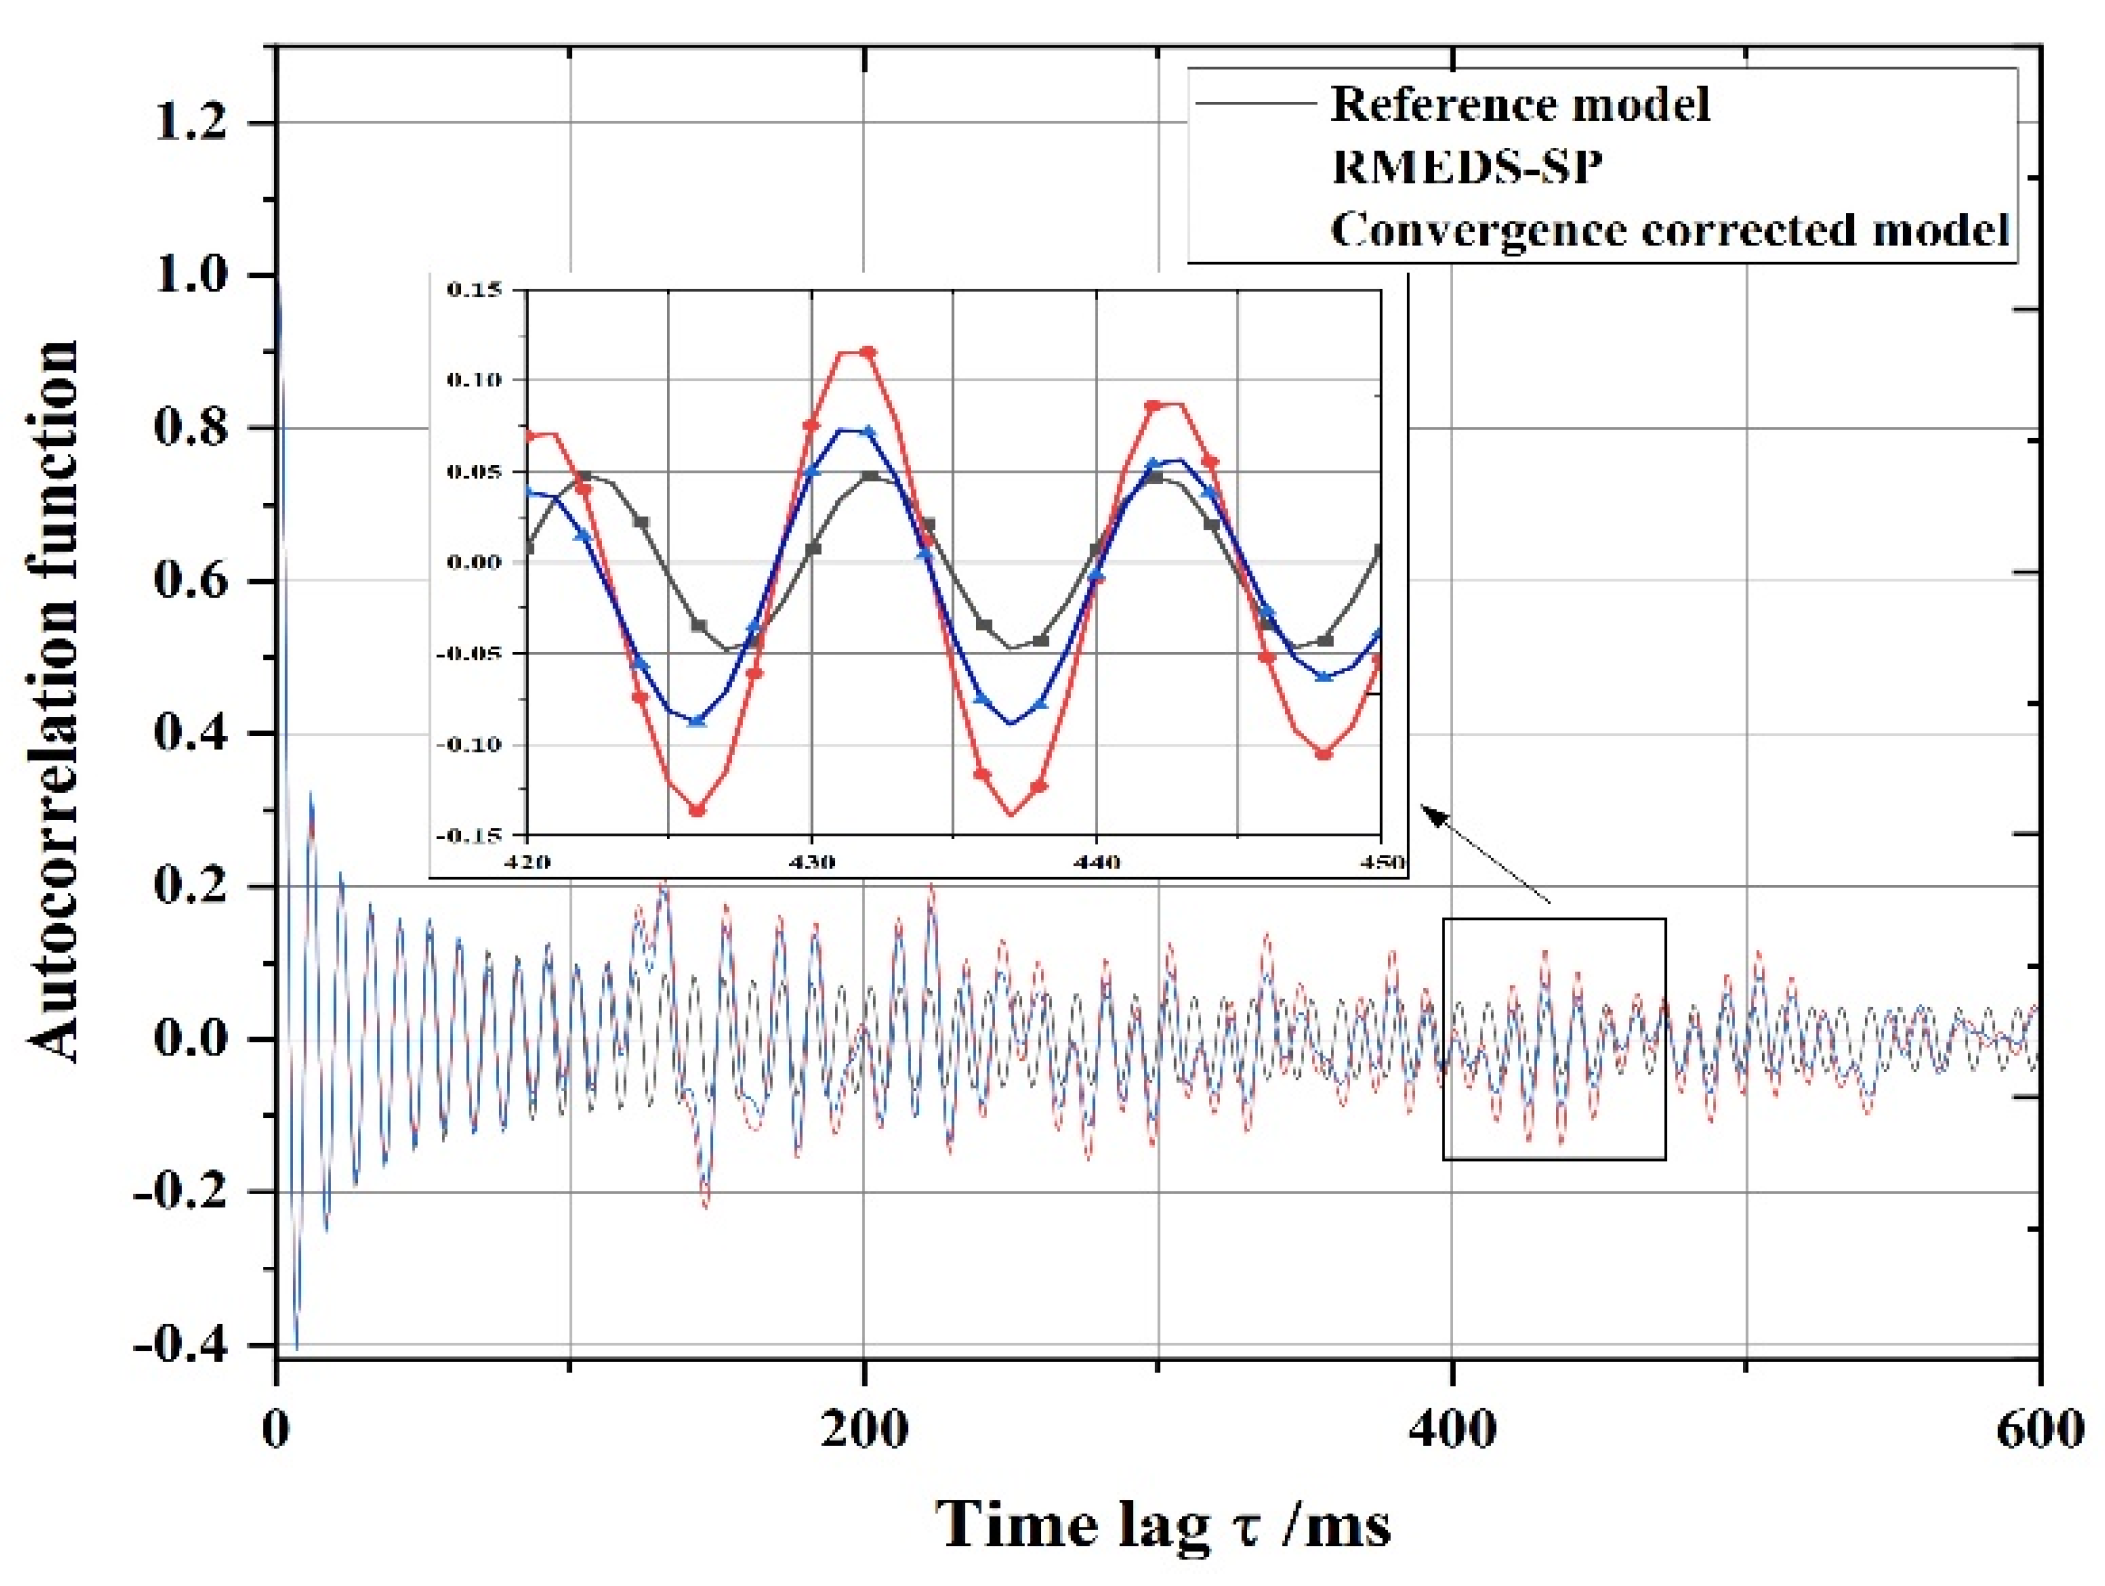
3.3.4. ACF Analysis after Error Compensations by CPF
We further analyze the performance of the RMEDS-SP improved by error compensations by CPF. The conditions and indicators of the analysis would be the same. The results of ACF of RMEDS-SP and after error compensations by CPF are shown in
Figure 12.
The number of sinusoids is set as
. As
Figure 12 shows, the ACF would diverge with the simulation error increasing when the relative time is more than
under this condition. We can figure out that the original simulation error of ACF improved by CPF can be further compensated, which is more similar to the referenced model. According to Equation (32), we can obtain
results of RMEDS-SP and after error compensations, as
Table 3 shows.
As
Table 3 shows, after error compensations by CPF, the MSE of DPS is 0.00293, that of only RMEDS-SP is 0.00394. There is about a 25.63% performance improvement.
The corresponding DPS of a different model is operated by the Fourier transform of the ACF, which is shown in
Figure 13. The proposed RMEDS-SP after error compensations by CPF can improve the similarity between the model and referenced model. The MSE of the DPS of the two models is 12.85 and 10.47. We can figure out that there is an 18.52% performance improvement after error compensations by CPF.
5. Conclusions
This paper mainly focuses on the modeling of DPS in LEO-SIN. In our studies, we found some interesting points. First, the DPS in LEO-SIN suffers from some unique characteristics such as the main path not being at the center point, asymmetrical, and random multi-path with random AOA, which are quite different from the GEO satellite network and TMCN. Second, the traditional SOS model cannot describe and simulate the DPS accurately enough. We proposed a novel RMEDS-SP to solve the above problems to achieve the advantage of MEDS-SP and RMEDS. Third, all the SOS models would have some accumulated modeling errors at a relative time. The periodic features can be exploited by the periodicity of a satellite moving to improve the DPS model. So, we exploit the piecewise functions to the ACF of DPS to converge the modeling error supposition with time by periodic changes. Fourth, the simulation models are aimed towards applications. We further implemented this model to the hardware and construct the test environment to analyze the performance.
Above all, the simulations and analyses have shown that the proposed methods have better performance of modeling accuracy than other models, which is clearly shown in
Table 4. Compared with other models, our new model can have a better error control and resource utilization, but its design difficulty and complexity inevitably increased. Since we use the periodic motion characteristics of satellites to conduct error convergence for ACF of DPS, our model had better adaptability for satellite scenarios and could tolerate larger maximum Doppler extension. In general, our new model would be well applied to low orbit satellite Internet.


 ,
, 


