
Caffe2Unity: Immersive Visualization and Interpretation of Deep Neural Networks


1
Third Institute of Physics—Biophysics, Department of Computational Neuroscience, University of Göttingen, Friedrich-Hund-Platz 1, 37077 Gottingen, Germany
2
Department of Informatics, Vytautas Magnus University, Vileikos 8, 44158 Kaunas, Lithuania
*
Author to whom correspondence should be addressed.
Electronics 2022, 11(1), 83; https://0-doi-org.brum.beds.ac.uk/10.3390/electronics11010083
Submission received: 24 November 2021
/
Revised: 19 December 2021
/
Accepted: 24 December 2021
/
Published: 28 December 2021
(This article belongs to the Special Issue Virtual Reality and Scientific Visualization)
Abstract
:Deep neural networks (DNNs) dominate many tasks in the computer vision domain, but it is still difficult to understand and interpret the information contained within these networks. To gain better insight into how a network learns and operates, there is a strong need to visualize these complex structures, and this remains an important research direction. In this paper, we address the problem of how the interactive display of DNNs in a virtual reality (VR) setup can be used for general understanding and architectural assessment. We compiled a static library as a plugin for the Caffe framework in the Unity gaming engine. We used routines from this plugin to create and visualize a VR-based AlexNet architecture for an image classification task. Our layered interactive model allows the user to freely navigate back and forth within the network during visual exploration. To make the DNN model even more accessible, the user can select certain connections to understand the activity flow at a particular neuron. Our VR setup also allows users to hide the activation maps/filters or even interactively occlude certain features in an image in real-time. Furthermore, we added an interpretation module and reframed the Shapley values to give a deeper understanding of the different layers. Thus, this novel tool offers more direct access to network structures and results, and its immersive operation is especially instructive for both novices and experts in the field of DNNs.
1. Introduction
A virtual reality (VR) environment is a great way to interact with complex scientific visualizations, immense datasets, and complicated 3D structures [1]. Head-mounted displays used in VR have been shown to be a great source of learning in different domains (e.g., complex scientific concepts in astronomy and engineering domains) compared to traditional learning environments [2,3,4,5]. It is believed that a user can learn and explore multifaceted structures more easily by navigating around them and exploring different characteristics for better understanding [1,6].
In this regard, DNNs have gained much popularity in the past decade due to the availability of faster computing devices that can minimize their computationally expensive training times. Although these models can process multidimensional forms of data, including audio, video, images, etc., in the computer vision domain, image analysis has been the most prevalent. In addition, visualizations of different machine learning models, particularly DNNs, have also played a significant role in the understanding of input-output processes between successive layers [7,8]. Until now, DNN visualizations have been restricted to 2D visualization of images, which is not sufficient if we want to visualize the internal representations and interpretations of the network [1,5,6]. Despite their tremendous performance in many computer vision tasks, these models are still considered to be “black-boxes” and require more transparency and interpretation to understand their decision-making process. In this regard, a VR environment can offer many advantageous visualization solutions that can help in understanding deep learning models. Earlier works regarding visualizations have particularly focused on expert users with an in-depth understanding of DNNs and were specially tailored for developers in this field [7,9,10].
In this paper, our primary goal is to provide a general understanding and architectural assessment of DNNs in a VR environment while targeting both non-experts and experts as our audience. We focused on the immersive visualization and interpretation of DNNs and provided a virtual walk through the network layers exploring different image activation features and connections across different layers. Additionally, an interpretation module was used to analyze the network’s decisions by highlighting the positive and negative contributions of different regions of the test input images. Our main contributions in this paper are as follows:
- We compiled a Windows-based Caffe framework as a dynamic link library to be used as a plugin in the Unity gaming engine.
- We designed a simplified, layered GUI for analyzing the AlexNet architecture [11] for novices and experts in the field.
- We developed an interactive real-time module for adding occlusion on the input images to understand the behavior of the network.
- We provided an interpretation module to reframe the Shapley values algorithm [12] for analyzing the network’s decisions based on three hidden layers.
2. Related Work
In order to gain an intuitive understanding of the different features and responses of individual layers, researchers have developed tools and libraries to visualize the neural activations in different layers. In this regard, visualizations can be divided into two categories, namely static 2D image-based visualizations, and browser- and VR-based interactive visualizations, for which a brief description is given in the following sub-sections.
2.1. Static 2D Image-Based Visualizations
In this category, much work has been carried out on the 2D visualization of images. In [7,13], interactive software tools were used for understanding, and an exploratory analysis was done on how we can visualize the activations produced at each layer in response to user input. In [14], layer-wise relevance propagation (LRP)-based heatmaps were used for region perturbation and for highlighting the important parts in an image during a classification task, while in [8,15], it was demonstrated that a single neuron can represent multiple facets and be visualized via a synthetically generated image, highlighting the specific areas in natural images that best activate the neurons. In [16], different visualization techniques based on natural images were studied, involving activation maximization in identifying and highlighting visual patterns. In [17], the visualization of intermediate layers was studied during an image classification task, showing properties such as discriminability, compositionality, and invariance among the features as the higher layers were approached. In [18], an analysis of the information contained in an image was performed by the process of inversion using an optimized gradient descent function. Visualizations were used to show the representations at each convolutional layer while maintaining the photographically realistic representations of the images.
2.2. Web Browser and VR-Based Interactive Visualizations
Other interactive visualization techniques include web-based representations based on the TensorflowJS library called ConvNetJS (http://cs.stanford.edu/people/karpathy/convnetjs/ (accessed on 8 April 2020)) that allows for training the network in the browser. In [19], authors presented a real time interactive tool for convolutional neural networks. In addition, TensorBoard (https://www.tensorflow.org/versions/r0.8/how_tos/graph_viz/index.html (accessed on 8 April 2020)) (Google’s TensorFlow library) and TensorFlow Playground (http://playground.tensorflow.org/ (accessed on 8 April 2020)) also provide web-based interfaces that give the user freedom to interact with and visualize the detailed neural network configurations. NVIDIA has also implemented a web-based deep learning library called DIGITS (https://developer.nvidia.com/digits (accessed on 8 April 2020)) which allows users to design, train, monitor, and visualize neural network models in a browser. The method developed by [20] allows the user to pick and choose certain data and visualize their highest activations in the subsequent layers. In [10], a 3D interactive convolutional network was designed to allow users to draw images and simultaneously visualize the trained network. These methods are intuitive but lack the freedom of navigation, restricting the user’s movements with only mouse and keyboard interactions.
Despite having outstanding tools and methodologies, none of the visualization methods described above provide the user with the freedom to engage in a virtual reality environment. Few studies exist that deal with the visualization of CNNs in the VR domain. The work by [10,21] visualized a simplistic model that gives novices in this field a sense of the basic operations that occur in the different hidden layers. Investigations by [22] led to an immersive node-link diagram-based tool to visualize the internal representations of the CNNs. The work by [23] gave a VR model of DNN, giving the user freedom to move layers and objects in tangible manner. In [24], authors provide interactive tool with various levels of details to explore DNN model, whereas in [25], a hand gestures-based interactive VR interface using DNNs is described using Tensorflow as a deep learning framework.
In our paper, we present immersive visualization and interpretation of CNNs, while focusing on an image classification task using the AlexNet architecture. Our study involves the configuration of Caffe on the .Net framework using Microsoft Visual Studio to provide a plugin for the “Unity” gaming engine. The next sections provide a detailed description of this “Caffe2Unity” plugin and its application for visualizing and interpreting the AlexNet architecture on an image classification task.
3. Methods
A Windows-based Caffe framework was generated in the form of a dynamic link library (DLL) to create a model of the CNN in the gaming engine Unity, details of which are presented next.
3.1. Compilation Process of the Caffe2Unity.dll
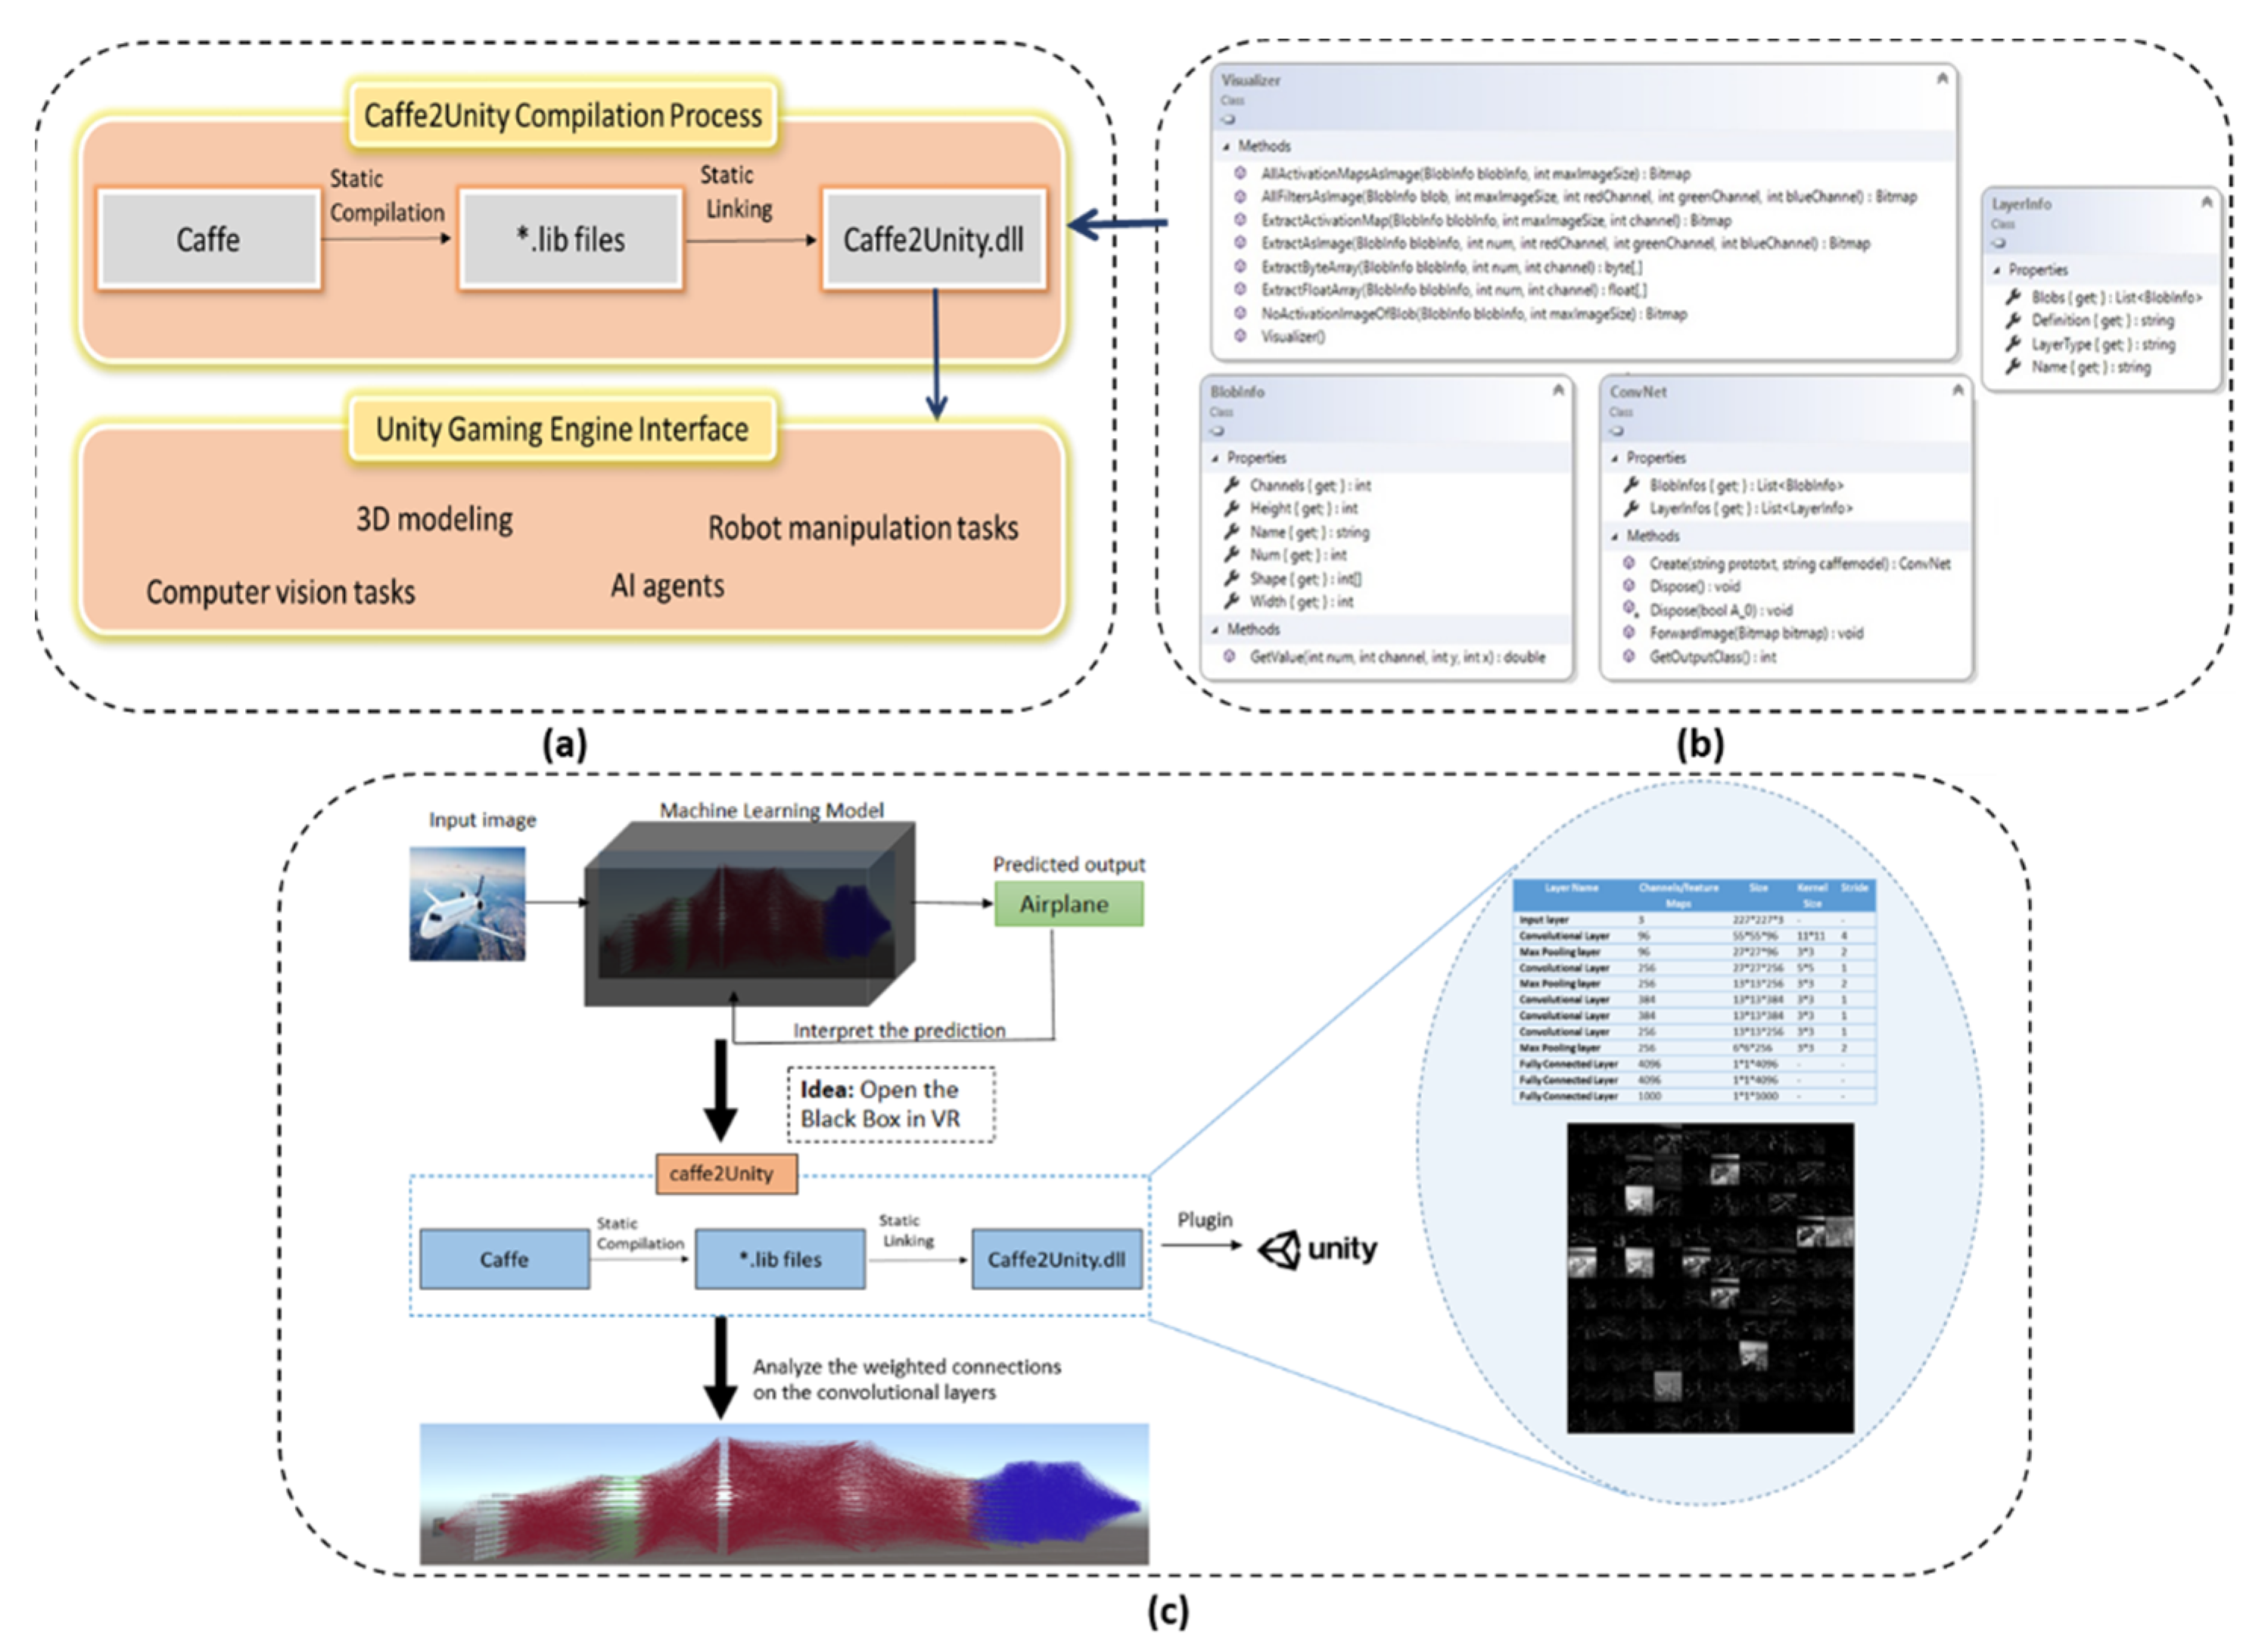
In order to utilize the Caffe framework and its associated functionality to bridge the gap between deep learning and a gaming engine, the Caffe2Unity.dll was developed. Caffe was initially configured on a Windows platform and compiled to create a static library producing *.lib files to make the code platform and application independent. The compilation process was carried out using Microsoft Visual Studio 2015 and CMake to obtain the relevant make files for the compiler environment. Other prerequisites in the compilation process were Git (version 2.151.2), CUDA (version 8.0), Python (version 3.5.4), and NVIDIA CuDNN (version 5). Once the Caffe framework was compiled and *.lib files were created, another C++ mixed-mode DLL project was developed to link statically to the static libraries of Caffe. To use routines from the Caffe static library, a reference was added in the C++ mixed-mode DLL project to utilize the *.lib files of Caffe. For execution of the Caffe2Unity.dll, static library files of Caffe were selected as a default project. To test the current Caffe2Unity.dll, we used a pre-trained ImageNet dataset on the AlexNet architecture but to train a different network architecture with different dataset, levelDB or Lmdb format and caffe.exe is required. Figure 1 shows the conceptualization of the visualization strategy.
The compiled DLL was used as a plugin in the asset folder of the Unity project where routines were called, and the immersive model of deep network was constructed. To give a general overview of the integrated Caffe framework in a DLL, we basically use ConvNet objects that contain two lists (Figure 1b). The LayerInfos list contains information about the layers and weight blobs contained in each layer, and the BlobInfos list contains information about the activation maps. Additionally, we created the Visualizer class with helper functions for creating images from weight and activation blobs to check the correct configuration of the DLL.
After the configuration and compiling process, we chose to test the AlexNet architecture. The reason for its selection is its medium-sized architecture with a total of 11 layers. We made the following assumptions to calculate the size of the output and filters objects designed in Unity. Suppose we have an image size of and a filter size of for convolutional layer, for filters of pooling layer and stride , we can calculate the output size of the convolutional and pooling layers respectively using the expressions: and .
Given that the DLL itself is not an executable file, we had a demonstration program TestCaffe2Unity.exe to check its functionality. The successful execution of the demo confirmed the correct configuration of our framework and was imported as a plugin into the assets folder in the Unity environment (see Figure 1c). We used the extern “C” {…} qualifier and enclosed it in brackets to contain a block of function prototypes used in our DLL project to make it accessible for Unity. The function prototypes used are given in the above Figure 1b. Once a function is added to the DLL project, it can be defined in the Caffe2Unity.cs file in Unity just like any normal function definition.
One interesting feature is that any model trained on the Caffe framework can be used in the DLL and its functionality is independent of the different versions of Unity. In the current settings, the layers of AlexNet are hard-coded to avoid crashes but for customization, a single line of code can add or remove layers, thereby altering the network using a “for loop”. It is currently set to 9 layers + 1 output layer. The following section provides details of the neural network model in the Unity gaming engine.
3.2. Immersive Model, Interactivity, and Navigation Controls
A deep neural network is a hierarchical representation of linear and non-linear transformations between layers. Here, convolutional layers play a key role when applied to input images to produce the corresponding feature maps indicating the learned local features. In this paper, we used a standard convolutional AlexNet model developed in [11] which consists of five convolutional and three fully connected layers. We used image classification as a standard task for this network and for our visualization method. Other classification tasks could be considered, too, but their visualization might be less straightforward. In the current setup, training of CNNs is not part of the visualization procedures. Thus, we work with a pre-trained AlexNet architecture. Deeper network models pre-trained with Caffe framework can also be used in the DLL as the functionality and basic operations remain almost the same. However, since our goal was to interpret, visualize, and give a general understanding of a DNN in a VR environment, the medium-sized AlexNet was an appropriate choice. Moreover, using AlexNet for the goal of assessing and understanding the network features in real time is more efficient with such a medium-sized network as compared to dealing with deeper and more recent networks.
To provide freedom of navigation in the VR environment, the user interacts with a virtual graphical interface and first selects a desired path within the architecture given as a *.prototxt file. This file is in a human-readable format and describes the structure of the CNN in terms of model parameters, layer types, their order, and how these layers interact with each other. Next, the user selects the *. Caffemodel file, which is not human-readable and contains the weights of the trained CNN. This model file is loaded after the structure of the CNN has been defined. Finally, the user selects the output-label file and an input image for forwarding to the network. We introduced a very simple user-friendly GUI in the VR environment so that a user can select the model architecture files from a directory, load the output image-labels, and choose an input image for the network. We also provide an option to edit the image and add an occlusion block of any size on the input images to see how this affects the network in real time. To draw such an occlusion block, the user can press and drag the VR-controller’s trigger button and release the trigger at the end. Both hand-controllers can alternatively be used for navigation in the network, the trackpad on the right-hand controller with laser pointer is used to move forward, backward, left, and right, whereas the left-hand controller allows the user to move up and down in the network. The VR-imagery from the head mounted device is real-time synchronous with the movements of the user. Modeling the architecture in the VR environment gives users the opportunity to navigate within different layers and to visualize filters and connections as often as wished. Hence, the user is truly immersed in the network architecture not being restricted to fixed operations of mouse or keyboard as in non-VR systems. He or she can easily use the hand controllers for “teleportation”, this way moving through the network in all directions with real-time visualization by the headset.
We created a layered VR-representation architecture to keep it as close to the network’s theoretical description and to—this way—allow for a more intuitive understanding because it allows step-by-step access of the structure. This way one can obtain a more detailed intuition for the operation of the different layers as compared to simple non-VR-based visualizations. An additional advantage of this layered structure is that it also makes it easier to interpret neural-specific operations in case of image occlusions.
In addition to this, the user can select to highlight specific connections to understand the activity flow from the input data passing a particular filter with its corresponding feature maps which is then forwarded to the deeper layers of the network. Aside from moving in the forward direction to view the deeper layers, the user can also move to previous layers at any time during visual exploration, which is usually not possible without a VR setup. At the output layer of the network, users can visualize the top five network classification results with their colored legend shown next to the output layer icon in a descending order of relevance.
4. Results and Discussion
Visualizations, Interpretation, and Analysis of the Network Decisions
The immersive AlexNet architecture and its features are presented in Figure 2, which was selected as an example case; however, all methods can also be applied to other DCNNs. In addition, we also provide a graphical user interaction video alongside a step-by-step guide to using the application as a separate Supplementary Materials. Analysis and interpretation of classification results is important as it helps to understand the decisions of the network, because at times even a perfectly trained network model misclassifies an image. Thus, finding the reasons for network decisions can help in improving model accuracy, thereby making it more trustworthy.
In the current paper, we re-framed the use of Shapley values [12] to find those regions in an image which play an important role in the model’s decision. Our layered structure enables us to go to individual layers to identify the highest activation regions that contribute in the Shapley value-based evaluation. The size of the individual features increases as we move to the deeper layers and the Shapley values grow because in the deeper layer, the network gains more confidence about its predictions. This kind of visualization is only possible in a VR environment. An example of the Shapley value results for a weasel as input image is shown in the VR environment in Figure 3. The red color indicates positive contributions to the network’s decision of these image regions while blue stands for negative contributions, which decrease the likelihood for a certain decision. White shows that these pixels have no effect on the decision of the network and occluding those regions will not change the network output. Shapley value-based interpretations are shown for three convolutional layers of the network. The top five potential classification results for the weasel image were “weasel”, “mink”, “polecat”, “black-footed ferret”, and “mongoose”, with highest probability of being a “weasel”. Figure 4 shows a zoomed-in view of Shapley-value results given in the VR environment for the weasel picture representing a “weasel” (left), and for the alternative four classification possibilities. For all five potential recognition hypotheses, red areas are concentrated around the face region of the images, which are, thus, considered as the most important regions of interest for the network.
However, in general, for this image, evidence remains far lower for all four ‘wrong’ classification hypotheses than for weasel. As we move to the deeper layers, features increase in size and become more abstract, finally providing the model confidence to make its decision as shown in Figure 4. To further enhance the usefulness of our VR system, the user can also add an occlusion block on the input images at random locations to hide part of the image. This is simply a black rectangle overlaid on the image using the laser pointer as shown in Figure 5. The user has the option to select an image of his/her choice from the sample image folder, add an occluded block of any size at any random location in the image, and save the image so it can be forward to the network. The classification results can then be interpreted using the Shapley values to see the effect of different image regions responsible for the final decision.
As an example, we calculated the Shapley values for the weasel image by occluding the part that most strongly contributes to the network decision as shown above. The effect of the occluded block is evident in the activation of certain neurons and the feature maps that contribute to the final decision. The network now concludes that this is a “guinea pig”. Shapley value-based interpretation of the partially occluded weasel image can explain this decision (Figure 5). From the remaining image, the network now considers the front of the animal body as most important where “guinea pig” and “weasel” yield high positive values, but a higher one for “guinea pig”. Interestingly, a black occlusion is (necessarily) also interpretable as part of an image and the network suggests that this part may be indicative of the image being a “notebook” with a total score even higher than for “weasel”. This occlusion-based method allows us to analyze network interpretations not only from the correct classification results but also from a such-distorted image, exploring the individual neurons and layers in the architecture.
5. Conclusions
In this paper, we developed a dynamic link library for the Caffe framework of deep neural networks, which was used as a plugin for the Unity gaming engine. Users can interact with the plugin and utilize the functionalities of the Caffe framework. We used this plugin for immersive visualization of the AlexNet architecture with its application in image classification. The interactive immersive neural network model not only offers the freedom of navigation within the network layers but also provides the option to select certain connections to examine the activity flow of particular neurons. The novel aspect of integrating a Caffe framework with a gaming engine allows for using our DLL and the user can visualize the functioning of a deep neural network in a gaming engine without the need for additional programming dependencies. Initially, we used it for image classification tasks. As a future work, one could instead perform other tasks like detection, segmentation, image retrieval, design intelligent games, or other application specific solutions. In general, to get deeper insights as well to understand the learnt representations, this kind of visualization is easy to explore and debug given the design of our model. Our simple layered design is especially well-suited for novices to better understand network function.
To dig deeper into a network’s internal representation, we analyzed and interpreted the network decision using Shapley values to evaluate the regions of interest with and without occluding the input image. We observed a massive shift in the output decision and of the activation maps of the network when we added an occlusion block on the most relevant image features. Note that this is a real-time feature, which is a novel aspect of this work. A user can, in the VR setup, go back and forth many times to compare and visualize the most influential parts of the image features as given by the interpretation module. Without the VR setup, going back to visualize the hidden layers as well the shapely results in parallel is far more difficult. On the other hand, no change in the network decision was seen by occluding less important image regions as calculated by Shapley values (shown in Supplementary Materials). Thus, the interpretation results obtained by the Shapley values provide visual evidence of how different convolutional layers weigh important features in an input image.
In summary, we think that one can better assess and interpret DNN models via immersive exploration of different layers and activation maps rather than by using non-VR based visualization. Being able to visualize the flow from the input image into the network and the changes it undergoes is beneficial for getting a deeper understanding of these complex structures and allows us to some extent to interpret the network’s decision process. We have shown through Shapley values how important the regions of interest are for the network to make its decision. Using such observations, it may be possible to improve the model’s decision by retraining it with different sets of hybrid features associated with the interpretation of decision processes. This could be done, for example, by considering the importance of contextual information and how this affects the classification output, which will be one focus of our future work.
Additional aspects for future work could be to try to arrive at a more formal quantification of the different aspects shown here. The visualization of network function shown here is mainly targeted at human viewers and there is no generally agreed baseline how to assess the quality of systems like ours and formal criteria cannot easily be established. Hence, to address the aspect of usefulness for a user, possibly the best way would be to perform user studies with people who have different backgrounds in understanding network operation and function (e.g., from a novice to an expert). The second aspect shown in this study concerns the visualization of network-decision regions via Shapley values. This lends itself to a more rigorous quality assessment and we are currently performing an assessment of the influence of different aspects in images on a network’s decision. This assessment, however, is very detailed and would exceed the scope of the current study.
Supplementary Materials
The following supporting information can be downloaded at: https://0-www-mdpi-com.brum.beds.ac.uk/article/10.3390/electronics11010083/s1, Video: Caffe2Unity_VR.mp4, supplemental material providing guidelines for using the application.
Author Contributions
Conceptualization, A.A.; methodology, A.A.; software, A.A.; supervision, M.T. and F.W.; writing—original draft, A.A.; writing—review and editing, A.A., M.T. and F.W. All authors have read and agreed to the published version of the manuscript.
Funding
The research leading to these results received funding from the German Science Foundation under grant WO 388-16-1.
Conflicts of Interest
The authors declare no conflict of interest.
References
- Van Dam, A.; Forsberg, A.S.; Laidlaw, D.H.; LaViola, J.J.; Simpson, R.M. Immersive VR for scientific visualization: A progress report. IEEE Comput. Graph. Appl. 2000, 20, 26–52. [Google Scholar] [CrossRef] [Green Version]
- Soliman, M.; Pesyridis, A.; Dalaymani-Zad, D.; Gronfula, M.; Kourmpetis, M. The application of virtual reality in engineering education. Appl. Sci. 2021, 11, 2879. [Google Scholar] [CrossRef]
- Alhalabi, W.S. Virtual reality systems enhance students achievements in engineering education. Behav. Inf. Technol. 2016, 35, 919–925. [Google Scholar] [CrossRef]
- Mintz, R.; Litvak, S.; Yair, Y. 3d-virtual reality in science education: An implication for astronomy teaching. J. Comput. Math. Sci. Teach. 2001, 20, 293–305. Available online: https://www.learntechlib.org/p/9543 (accessed on 6 October 2019).
- Wang, P.; Wu, P.; Wang, J.; Chi, H.-L.; Wang, X. A critical review of the use of virtual reality in construction engineering education and training. Int. J. Environ. Res. Public Health 2018, 15, 1204. [Google Scholar] [CrossRef] [PubMed] [Green Version]
- Haan, G.; Koutek, M.; Post, F. Towards Intuitive Exploration Tools for Data Visualization in VR. In Proceedings of the ACM symposium on Virtual reality software and technology, VRST ’02, Hong Kong, China, 11–13 November 2002. [Google Scholar]
- Yosinski, J.; Clune, J.; Nguyen, A.; Fuchs, T.; Lipson, H. Understanding neural networks through deep visualization. arXiv 2015, arXiv:1506.06579. [Google Scholar]
- Nguyen, A.; Yosinski, J.; Clune, J. Multifaceted feature visualization: Uncovering the different types of features learned by each neuron in deep neural networks. arXiv 2016, arXiv:1602.03616. [Google Scholar]
- Abadi, M.; Agarwal, A.; Barham, P.; Brevdo, E.; Chen, Z.; Citro, C.; Corrado, G.S.; Davis, A.; Dean, J.; Devin, M.; et al. TensorFlow: Large-Scale Machine Learning on Heterogeneous Systems 2015, Software. Available online: https://www.tensorflow.org/ (accessed on 6 October 2019).
- Harley, A.W. An Interactive Node-Link Visualization of Convolutional Neural Networks; Springer International Publishing: Cham, Switzerland, 2015; pp. 867–877. [Google Scholar]
- Krizhevsky, A.; Sutskever, I.; Hinton, G.E. ImageNet Classification with Deep Convolutional Neural Networks. Adv. Neural Inf. Process. Syst. 2012, 25, 1097–1105. [Google Scholar] [CrossRef]
- Lundberg, S.M.; Lee, S.I. A Unified approach to interpreting model predictions. In Proceedings of the 31st Conference on Neural Information Processing Systems (NIPS), Long Beach, CA, USA, 4–9 December 2017. [Google Scholar]
- Bruckner, D.M. ML-o-Scope: A Diagnostic Visualization System for Deep Machine Learning Pipelines. 2014. Available online: https://www2.eecs.berkeley.edu/Pubs/TechRpts/2014/EECS-2014-99.pdf (accessed on 6 October 2019).
- Samek, W.; Binder, A.; Montavon, G.; Bach, S.; Muller, K.R. Evaluating the visualization of what a deep neural network has learned. IEEE Trans. Neural Netw. Learn. Syst. 2015, 11, 2660–2673. [Google Scholar] [CrossRef] [PubMed] [Green Version]
- Zintgraf, L.M.; Cohen, T.; Welling, M. A new method to visualize deep neural networks. workshop on visualization for deep learning. arXiv 2016, arXiv:1603.02518v3. [Google Scholar]
- Mahendran, A.; Vedaldi, A. Visualizing deep convolutional neural networks using natural pre images. Int. J. Comput. Vis. 2016, 120, 233–255. [Google Scholar] [CrossRef] [Green Version]
- Zeiler, M.D.; Fergus, R. Visualizing and Understanding Convolutional Networks. In European Conference on Computer Vision; Springer: Cham, Switzerland, 2014. [Google Scholar]
- Mahendran, A.; Vedaldi, A. Understanding Deep Image Representations by Inverting Them. In Proceedings of the IEEE Conf. on Computer Vision and Pattern Recognition (CVPR), Boston, MA, USA, 7–12 June 2015; pp. 5188–5196. [Google Scholar] [CrossRef] [Green Version]
- Chung, S.; Suh, S.; Park, C.; Kang, K.; Choo, J.; Kwon, B.C. ReVACNN: Real-Time Visual Analytics for Convolutional Neural Network. In Proceedings of the ACM SIGKDD Workshop on Interactive Data Exploration and Analytics (IDEA’16), San Francisco, CA, USA, 14 August 2016. [Google Scholar]
- Zhou, B.; Khosla, A.; Lapedriza, A.; Oliva, A.; Torralba, A. Object Detectors Emerge in Deep Scene CNNs. arXiv 2014, arXiv:1412.6856. [Google Scholar]
- Meissler, N.; Wohlan, A.; Hochgeschwender, N.; Schreiber, A. Using visualization of convolutional neural networks in virtual reality for machine learning newcomers. In 2019 IEEE International Conference on Artificial Intelligence and Virtual Reality (AIVR); IEEE: Piscataway, NJ, USA, 2019; pp. 152–1526. [Google Scholar]
- Bellgardt, M.; Scheiderer, C.; Kuhlen, T.W. An immersive node-link visualization of artificial neural networks for machine learning experts. In Proceedings of the 2020 IEEE International Conference on Artificial Intelligence and Virtual Reality (AIVR), Utrecht, The Netherlands, 14–18 December 2020; pp. 33–36. [Google Scholar] [CrossRef]
- VanHorn, K.C.; Zinn, M.; Cobanoglu, M.C. Deep Learning Development Environment in Virtual Reality. arXiv 2019, arXiv:1906.05925. [Google Scholar]
- Schreiber, A.; Bock, M. Visualization and exploration of deep learning networks in 3D and virtual reality. In International Conference on Human-Computer Interaction; Springer: Berlin/Heidelberg, Germany, 2019; pp. 206–211. [Google Scholar]
- Kang, T.; Chae, M.; Seo, E.; Kim, M.; Kim, J. DeepHandsVR: Hand interface using deep learning in immersive virtual reality. Electronics 2020, 9, 1863. [Google Scholar] [CrossRef]
Figure 1.
(a) Flow chart of the compilation process of the Caffe2Unity.dll and its interfacing with Unity to perform various tasks. In its current form, we used the DLL for image classification as an application domain. (b) Prototypes and attributes of the main classes used in the Caffe2Unity.dll to achieve our goal. (c) Snapshot of the visualization strategy illustrating the immersive model of AlexNet with details of all layers and activation maps that are used in the VR environment.

Figure 2.
(a) An immersive visualization of different layers of the AlexNet architecture in Unity, (b) virtual GUI for selecting paths for model weights, CNN structure, labels, and input image, (c) input layer, (d) first convolutional layer icon, (e) snapshot of activation maps of the 1st convolutional layer, (f) selecting the connection of a particular filter of the 1st convolutional layer to visualize its activity across the network, and (g) deeper layer interactions of the selected filter. The user can visualize and hide filters and activation maps by selecting the corresponding option on the layer icon using a laser pointer.

Figure 3.
Analyzing the network decision using Shapley-value-based interpretations in the VR environment. These interpretations are shown for three hidden layers namely conv1, conv3, and conv5, respectively (see also Figure 4 for zoomed in view).
Figure 3.
Analyzing the network decision using Shapley-value-based interpretations in the VR environment. These interpretations are shown for three hidden layers namely conv1, conv3, and conv5, respectively (see also Figure 4 for zoomed in view).

Figure 4.
Zoomed in view of VR-based Shapley value results from Figure 3 showing individual interpretation of three hidden layers, (a) conv1, (b) conv3, and (c) conv5 of the weasel image.
Figure 4.
Zoomed in view of VR-based Shapley value results from Figure 3 showing individual interpretation of three hidden layers, (a) conv1, (b) conv3, and (c) conv5 of the weasel image.

Figure 5.
Zoomed in view of VR-based results, (a) original image on the left whereas the right image shows the overlaid block occlusion, and (b) Shapley-value-based interpretation of the weasel image after being occluded by the VR user. Results are shown for three hidden convolutional layers, where the network strongly predicted the image as being a “guinea pig” instead of a “weasel”.

Publisher’s Note: MDPI stays neutral with regard to jurisdictional claims in published maps and institutional affiliations. |
© 2021 by the authors. Licensee MDPI, Basel, Switzerland. This article is an open access article distributed under the terms and conditions of the Creative Commons Attribution (CC BY) license (https://creativecommons.org/licenses/by/4.0/).
Share and Cite
MDPI and ACS Style
Aamir, A.; Tamosiunaite, M.; Wörgötter, F. Caffe2Unity: Immersive Visualization and Interpretation of Deep Neural Networks. Electronics 2022, 11, 83. https://0-doi-org.brum.beds.ac.uk/10.3390/electronics11010083
AMA Style
Aamir A, Tamosiunaite M, Wörgötter F. Caffe2Unity: Immersive Visualization and Interpretation of Deep Neural Networks. Electronics. 2022; 11(1):83. https://0-doi-org.brum.beds.ac.uk/10.3390/electronics11010083
Chicago/Turabian StyleAamir, Aisha, Minija Tamosiunaite, and Florentin Wörgötter. 2022. "Caffe2Unity: Immersive Visualization and Interpretation of Deep Neural Networks" Electronics 11, no. 1: 83. https://0-doi-org.brum.beds.ac.uk/10.3390/electronics11010083
Note that from the first issue of 2016, this journal uses article numbers instead of page numbers. See further details here.