


An Event Matching Energy Disaggregation Algorithm Using Smart Meter Data

Department of Electrical Engineering, University of Engineering and Technology Taxila, Taxila 47050, Pakistan
*
Authors to whom correspondence should be addressed.
Electronics 2022, 11(21), 3596; https://0-doi-org.brum.beds.ac.uk/10.3390/electronics11213596
Submission received: 4 October 2022
/
Revised: 28 October 2022
/
Accepted: 28 October 2022
/
Published: 3 November 2022
(This article belongs to the Special Issue Power System Dynamics, Operation, and Control including Renewable Energy Systems and Smart Grid: Technology and Applications)
Abstract
:Energy disaggregation algorithms disintegrate aggregate demand into appliance-level demands. Among various energy disaggregation approaches, non-intrusive load monitoring (NILM) algorithms requiring a single sensor have gained much attention in recent years. Various machine learning and optimization-based NILM approaches are available in the literature, but bulk training data and high computational time are their respective drawbacks. Considering these drawbacks, we devised an event matching energy disaggregation algorithm (EMEDA) for NILM of multistate household appliances using smart meter data. Having limited training data, K-means clustering was employed to estimate appliance power states. These power states were accumulated to generate an event database (EVD) containing all combinations of appliance operations in their various states. Prior to matching, the test samples of aggregate demand events were decreased by event-driven data compression for computational effectiveness. The compressed test events were matched in the sorted EVD to assess the contribution of each appliance in the aggregate demand. To counter the effects of transient spikes and/or dips that occurred during the state transition of appliances, a post-processing algorithm was also developed. The proposed approach was validated using the low-rate data of the Reference Energy Disaggregation Dataset (REDD). With better energy disaggregation performance, the proposed EMEDA exhibited reductions of 97.5 and 61.7% in computational time compared with the recent smart event-based optimization and optimization-based load disaggregation approaches, respectively.
1. Introduction
In the digital age, modern cities have transformed into smart cities. In such cities, big data collected by sensors require sophisticated algorithms for their analysis and security for multidisciplinary applications [1,2]. Due to digitization, the power grid system has evolved into a smart grid. A smart grid offers better options for renewable energy penetration, but the intermittency of renewable generation poses price volatility and grid stability problems [3,4]. In the smart grid, utilities tend to have more installations of smart meters in their advanced metering infrastructure (AMI). Aggregate demand data collected by smart meters assist in understanding consumer behaviors in aggregation, demand forecasts, customer segmentation, etc.; however, improved demand-side management, better policy designs, and sustainable development require disaggregated energy characterization at the appliance level [5,6]. Disaggregated energy characterization can foster economic gains and technical benefits for diverse stakeholders through innovative services [7,8,9]. It also assists in efficient resource usage, conservation of energy and the environment, and improved living in smart sustainable cities [10]. Some of the benefits of this characterization are shown in Figure 1. A detailed review of such benefits in the context of the United Nations’ Sustainable Development Goals of 2030 and deep decarbonization goals of 2050 is presented in [6].
To extract appliance-level energy characterization, intrusive and non-intrusive energy disaggregation techniques are used. The former techniques require dedicated sensors for individual appliances, whereas the latter rely on mathematical programming, artificial intelligence, and statistical approaches after getting aggregate demand data from a single sensor. Due to the involvement of a single sensor, which is usually the smart meter, non-intrusive load monitoring (NILM) approaches are more economical for energy disaggregation [11]. The general concept of NILM is depicted in Figure 2 where household-level aggregate demand measured by the smart meter is disaggregated into appliance level demands (ALDs) through the NILM algorithm implemented on a laptop computer. As smart meters are increasingly being installed for utilities, it seems a better choice to implement NILM solutions on the smart meters [12].
After Hart’s [13] pioneering NILM work, many researchers have implemented NILM using statistical, machine learning (ML), and optimization algorithms employing low- and high-frequency data [14,15]. NILM algorithms based on high-frequency data are more accurate, but these are not practical due to expensive high-frequency sensors and sophisticated data processing equipment. For practical implementation, low-frequency NILM solutions are justified.
Among various statistical approaches, hidden Markov models (HMMs) are well-recognized. HMMs distinguish appliances by modeling variations in low-frequency data of real power [16]. Some HMM variants requiring additional data about state variations have also been developed [17], whereas others have developed models for the characterization of specific appliances [18]. However, scalability is a major drawback of HMM-based models.
ML-based approaches solve NILM as a clustering [19], regression [20], classification [21], \or hybrid problem [22,23]. Due to advances in graphical processing technology, the application of deep learning (DL) techniques for NILM is on the rise [24]. Some recent DL models include convolutional neural networks [25,26], long short-term memory networks [27,28], generative adversarial networks [29], attention-based deep neural networks [22], seq2seq learning [30], seq2point learning [31], deep pair supervising hash [32], etc. The transfer learning concept of DL models is also extended for NILM [31,33]. The performance of DL-based models for NILM is excellent, but efficient computational sources and bulk data for their training are major issues in their implementation.
To escape the need for bulk training data and advanced computing machines, many researchers have employed optimization algorithms. Some optimization-based NILM approaches include integer linear programming [34], integer non-linear programming (INLP) [11], mixed ILNP [35], quadratic programming [36], sparse optimization [37], etc. Egarter and Elmenreich [38] solved NILM using six metaheuristic ealgorithms and found it difficult to identify appliances with overlapping features. This problem can be tackled either by using additional information about appliance usage or by expanding the feature set. To expand the feature set, H. Liu et al. [39] added harmonic currents through geometrical calculations and applied particle swarm optimization to solve NILM. Probabilities of appliance activations as regularized terms were used in the stochastic optimization approach while accommodating for uncertainties in load parameters [40]. The standard least square method was employed for estimation purposes. Azizi et al. [35] devised a smart event-based optimization (SEBO) technique while formulating NILM as a least-square problem. A penalty term was included to consider the appliance transition modes. An optimization-based NILM method based on state transitions was proposed by Zeinal-Kheiri et al. [11]. They formulated NILM as an INLP problem and solved it using the GAMS LINDOGLOBAL solver. Optimization techniques require less prior data during training phase, but extended computational time is the major issue faced in their adoption.
Despite various techniques, practical NILM using low-frequency data is still a challenging problem. Scalability, bulk data requirements, and high computational time are the key issues exhibited by HMMs, ML, and optimization-based NILM techniques, respectively. To address these issues, a smart event matching energy disaggregation algorithm (EMEDA) was presented using smart meter low-frequency data, with the following contributions:
- An algorithm was proposed for the formation of a consumer-specific event database (EVD) containing all aggregate demand events (ADEs), due to the activation of target appliances in all possible states considering their state flags. K-means clustering was applied to determine the power states of appliances using limited data of individual appliance consumption. ADEs in EVD were sorted in ascending order for easy matching.
- An EMEDA was devised to reduce the computational complexity exhibited by metaheuristic and combinatorial optimization techniques. Unlike conventional techniques attempting to match an ADE by aggregating multiple probable appliance combinations, the proposed EMEDA just tallies the test ADE in the sorted EVD to minimize the estimation error.
- Besides computational cost savings during matching in EVD, a data compression algorithm, inspired by event-driven metering, was applied to reduce the number of test samples/events to be matched for energy disaggregation. This data compression led to significant savings in terms of storage memory and computational time.
- A post-processing algorithm was devised to encounter the effects of transient dips/spikes occurring during the state transition of appliances. Erroneous appliance detections due to these transients, which may deteriorate the performance of the proposed algorithm, were handled during post-processing.
The organization of the remaining paper is as follows: Section 2 presents the mathematical modeling of the NILM problem, and the relevant metrics used for the evaluation. Various stages involved in the proposed technique are described in Section 3. NILM results obtained by the proposed EMEDA on the Reference Energy Disaggregation Dataset (REDD) [41] are presented in Section 4. Section 5 covers concluding remarks and some directions for future research.
2. Mathematical Modelling
Let there be a residential dwelling with appliances. At any time instant , if any th appliance consumes power , then the aggregate demand of all the appliances can be given as:
The NILM algorithm is aimed to estimate ALDs from the aggregate demand data measured by the smart meter. If the estimated demand for appliance is represented by , then aggregate demand at time instant can be represented by Equation (2):
where is the estimation error, and the difference between the aggregate demand and sum of estimated ALDs. Let the row vector contain power states of any appliance , which can operate in modes. Suppose = is the row vector with binary variables representing the operational status of any th appliance in a certain mode, such as for and . Using these vectors, the estimated demand for any th appliance can be given by Equation (3):
Here superscript represents the transpose of and , representing the power level of appliance in its th mode of operation. The operational state of the appliance is denoted by the binary variable having unity value when it operates in mode . Otherwise, its value is zero. As an appliance operates in a single state at any time, we can set the unity summation constraint on all as:
As NILM attempts to minimize the estimation error between the aggregate demand and the sum of estimated ALDs, it can be formulated as an optimization problem. The formulation is presented in Equations (5)–(7). The constraint imposed by Equation (6) is used to ensure the operation of all appliances in their single mode only.
where for and .
To evaluate performance, various metrics such as per appliance accuracy (), relative square error (), metric, and relative similarity error () can be used [42]. Mathematical definitions of these metrics for an appliance are given in Equations (8)–(13).
where denotes mean actual demand for appliance during time . The symbols and denote estimated and actual energy fraction indexes for appliance , respectively. Mathematically, these indexes can be formulated using Equations (11) and (12):
Here and represent the estimated and actual energy usage for any th appliance, respectively, such that and for any time index with span length .
3. Proposed Methodology
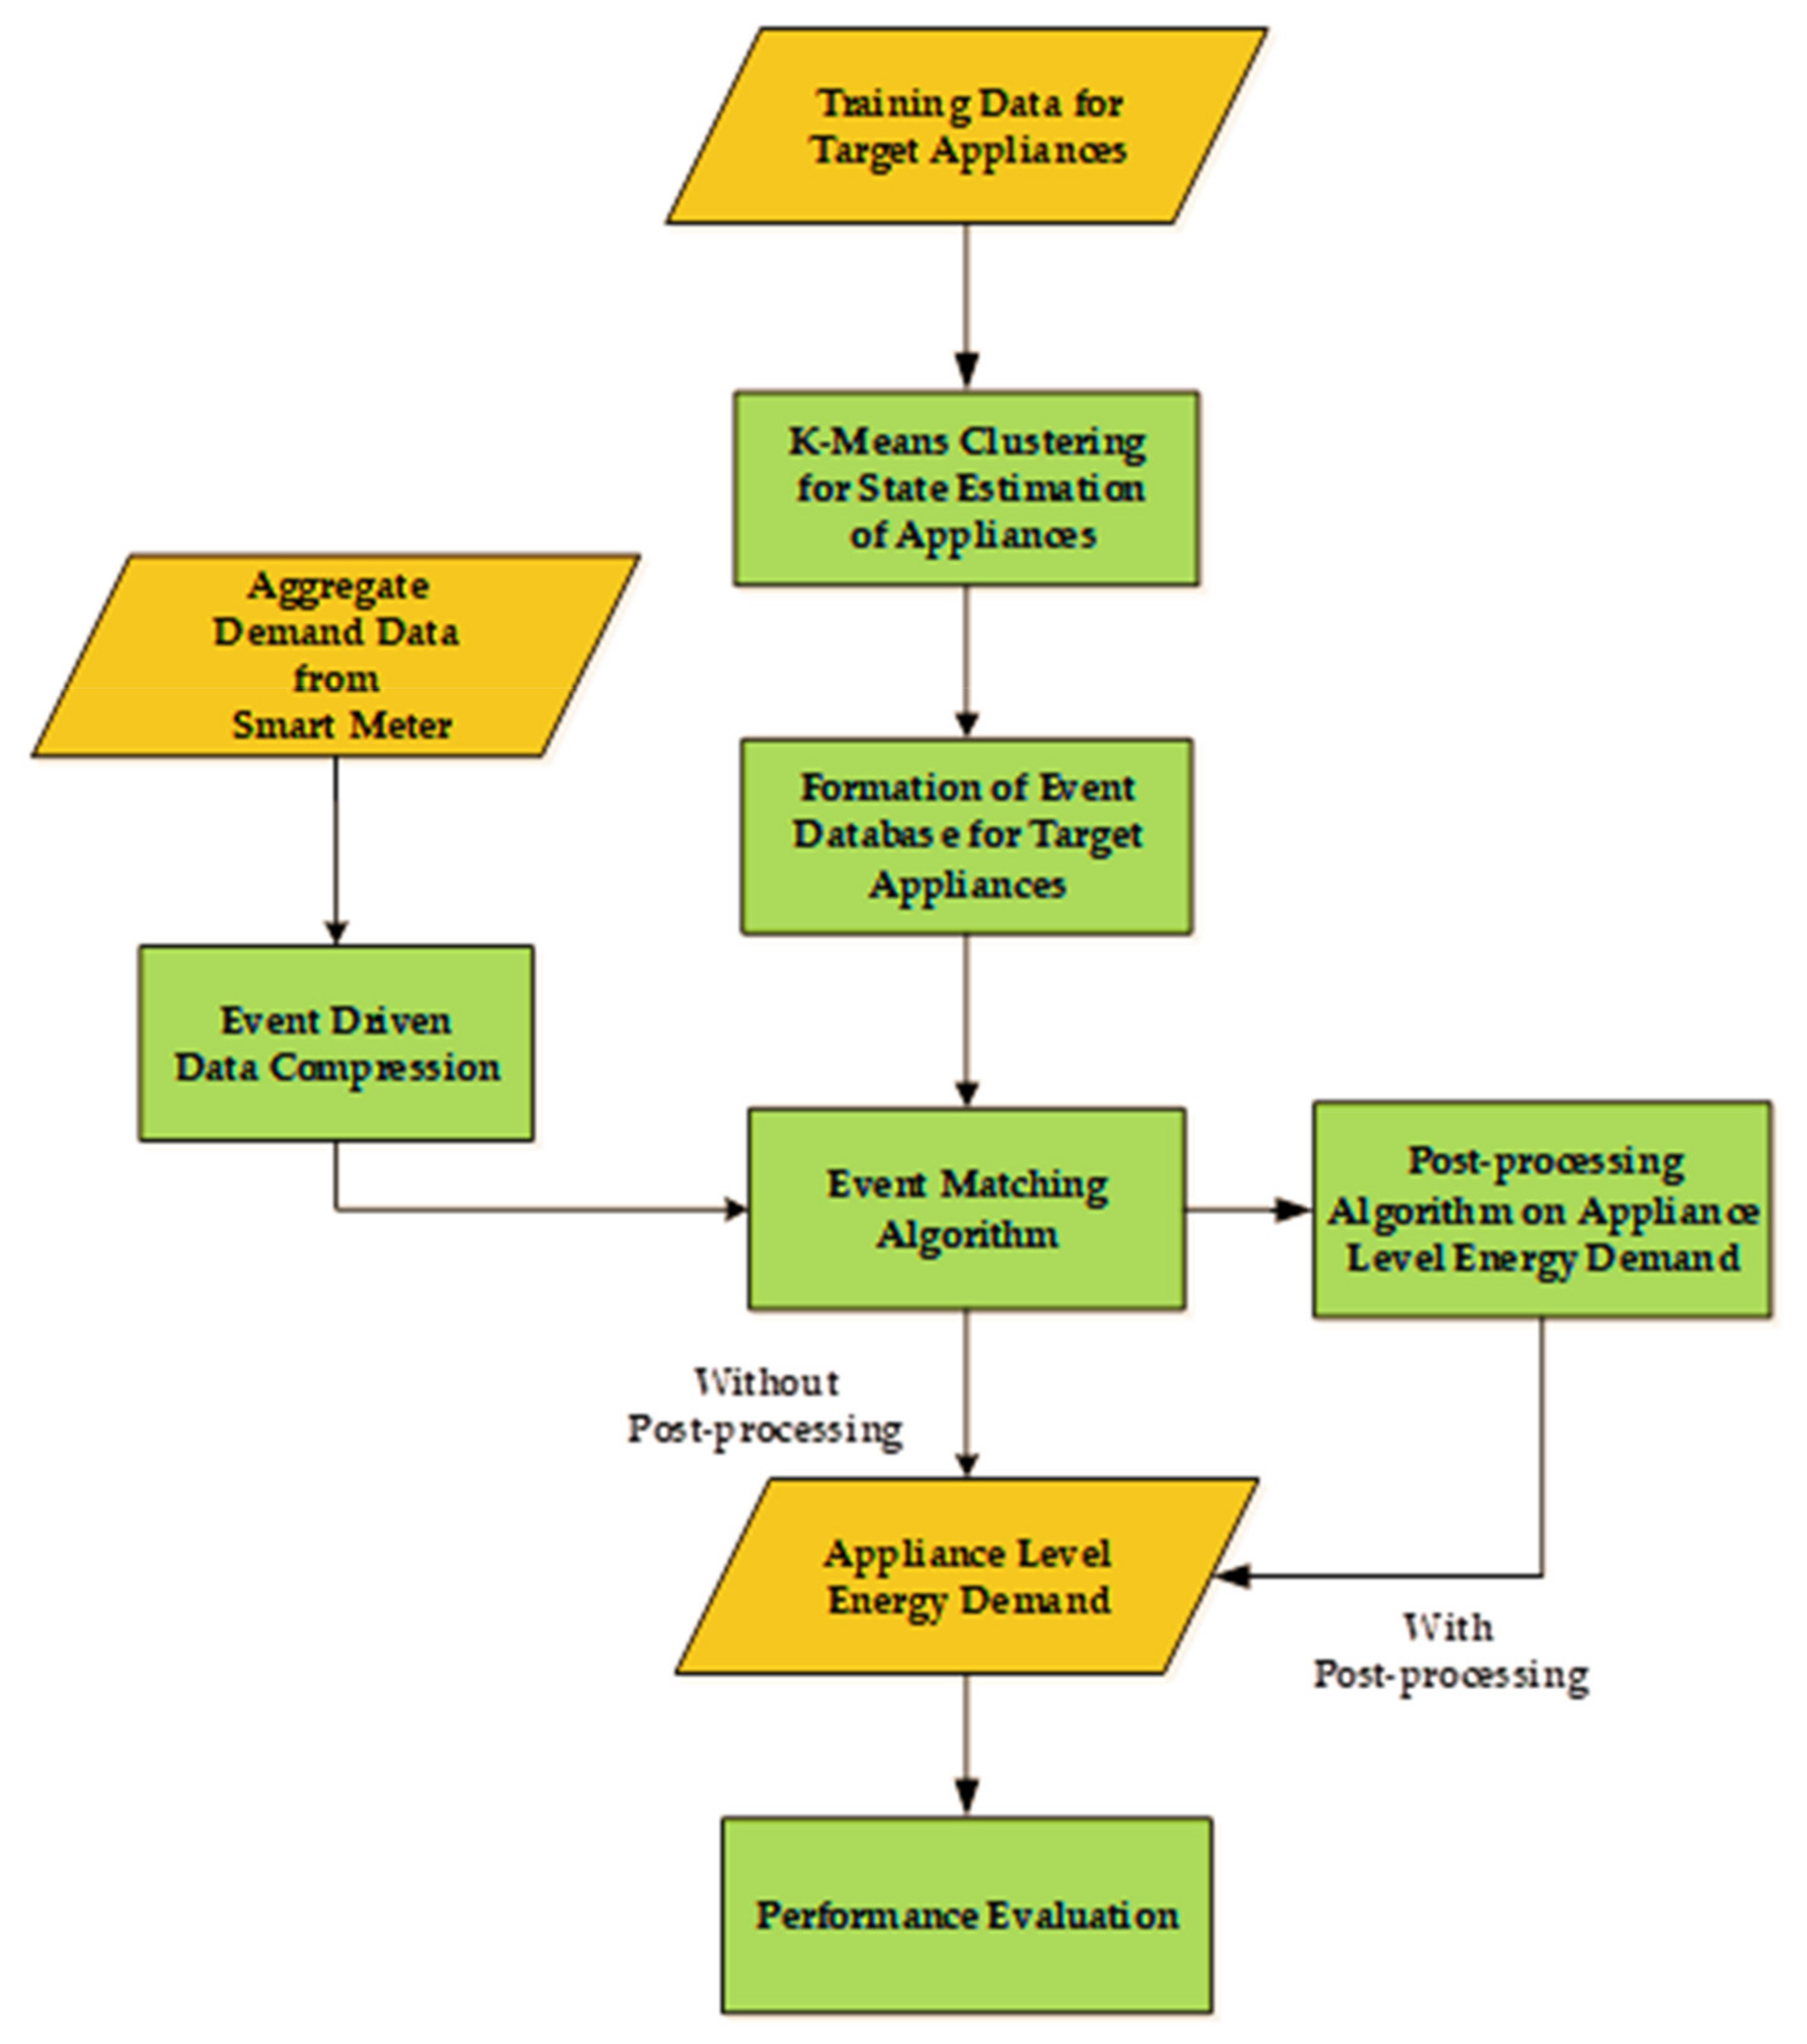
The devised NILM approach is based on EVD containing all the operational appliance groups that can produce an ADE. As the proposed EMEDA relies on the power states of appliances for EVD formation, its performance can be deteriorated due to abnormal power consumption of target appliances. Furthermore, the EMEDA takes low-frequency real power data collected from smart meters; thus, overlapping appliance combinations can result in erroneous results. To avoid these issues, we made two assumptions in this study: (i) All target appliances are healthy. (ii) Simultaneous state transitions do not occur for multiple appliances. This latter assumption is common in most event-based NILM approaches [43]. The methodology of the proposed EMEDA is illustrated using the flowchart shown in Figure 3.
3.1. State Estimation by K-means Clustering
Formation of EVD requires accurate estimation of appliance power states. This state estimation is viable either by having limited training data of individual appliance consumptions or by establishing an appliance signature database with the cooperation of appliance manufacturers and appliance energy labeling agencies. We used the former option and applied K-means clustering to estimate appliance power states. In clustering, suitable selection is an important task. Silhouette score and elbow methods are famous for choosing the appropriate [44]. With some visual judgment and tuning, we used the elbow method to determine the optimal number of clusters. The cluster centers returned by the clustering algorithm acted as appliance power states.
3.2. Algorithm for Event Database Formation
With the appliance power states, an EVD containing all ADEs was constructed. This EVD considered every probable operational state of each appliance to constitute all possible ADEs. As each appliance operates in one distinct state to constitute an ADE, the number of records in the EVD depended on the distinct power states of each appliance. Each record represents an ADE with information on appliance power states and flags representing the operational states of appliances. In a residential dwelling with number of target appliances, with any th appliance operating in modes, the total records () in the EVD can be determined by Equation (14) as:
Records of the EVD, where each record represented an ADE with flags representing operational states of appliances, were arranged in ascending order for easy matching of test aggregate samples in EVD. The matching procedure of test aggregate samples/events is analogous to word matching in a language dictionary. Similarly, the objective of minimizing is similar to the minimization of the objective function in optimization techniques. Due to these resemblances, the proposed technique was termed EMEDA. Different steps involved in the formation of sorted EVD are described in Algorithm 1.
| Algorithm 1: Proposed Algorithm for EVD Formation |
| Inputs: |
| Power states of all target appliances computed by K-means clustering. |
| Outputs: |
| EVD in sorted form. |
| Method: |
| Step 1: Prepare power levels sets () for all target appliances such that and . |
| Step 2: Perform the cartesian product among all acquired in Step 1 to get all the probable state combinations of appliances. |
| Step 3: Designate relevant flags = to represent appliance states in combinations developed in Step 2. |
| Step 4: Take the summation of appliance power levels for all combinations developed in Step 2 to constitute all possible ADEs. |
| Step 5: Arrange the ADEs obtained in Step 4 in ascending order to obtain sorted EVD. |
3.3. Event-Driven Data Compression
As high computational time is the major issue faced in optimization-based NILM solutions, a reduction in test samples of ADEs to be processed by the NILM algorithm could partially resolve this issue. Taking inspiration from the event-driven metering proposed by Simonov, Chicco, and Zanetto [45], we utilized event-driven data compression to reduce the test samples of ADE obtained from smart meters. Each test sample acts as an ADE; therefore, the words “samples” and “ADEs” are used interchangeably. During data compression, demand fluctuations in uncompressed ADEs were continuously observed. When the absolute values of these fluctuations went beyond a specified threshold (), an event transition was perceived due to a switching of appliance states. Usually, the value of was designated by considering the appliance that exhibited the least variation in its demand for state switching. The average value for a compressed ADE ‘’ having time duration could be computed by Equation (15) as:
where represents the actual energy calculated using uncompressed ADEs.
The compression algorithms based on the event-driven metering took the list of uncompressed ADEs as input and gave a list of compressed ADEs as output. The size of was substantially reduced compared with that of . The compressed ADEs in were stored in a three-value format as where , , and denoted the average power, starting time, and ending time of an ADE, respectively. The pseudocode of the event-driven data compression employed in this work to compress uncompressed samples of ADEs is given in Algorithm 2. All the necessary details and descriptions of variables are also presented.
| Algorithm 2: Algorithm for Event-Driven Data Compression |
| Inputs: |
| List containing the uncompressed samples of ADEs as [, ,], where , and represent the index number, timestamp, and power of uncompressed samples, respectively. |
| Power threshold () for event detection. |
| Outputs: |
| A list of compressed samples of aggregate demand as . |
| Dummy Variables and Symbols: |
| : Variable to save the first power sample of uncompressed data upon the detection of an event. |
| q: Pointer variable to iterate through . |
| %: To indicate comments. |
| Method: |
| In , assign from the first entry of . |
| In , assign from the first entry of . |
| Initialize = 0 |
| FOR q Length of |
| IF |
| =() |
| Value computed by Equation (14) taking values of from to . |
| Append by the entry . |
| % Initializing values for the next entry of . |
| () |
| = |
| END IF |
| % To ensure the attainment of the last compressed sample of on arriving at the last sample of |
| % uncompressed time series . |
| IF (q = |
| = () |
| Value computed by Equation (14) taking values of from to . |
| Append by the entry . |
| END IF |
| END FOR |
3.4. Event Matching Optimization Algorithm
Our proposed approach compared each compressed ADE from the testing data in the sorted EVD to determine its closest match. The absolute difference between the compressed ADEs of the testing data and records of EVD was computed. As our assumption avoids simultaneous transition of multiple appliances, an EVD record exhibiting minimum absolute difference with no more than one state transition was recognized as the matched event. The power levels of appliances in the matched record were designated as ALDs. To estimate the number of state transitions occurring between two successive events, the proposed EMEDA needed knowledge about the current operating states of appliances at the start. This information could be provided either by giving information about appliance state flags (ASFs) or by initiating the matching algorithm from the test sample, where accurate information of ASFs was easily accessible. For instance, test ADEs with nearly zero values represented that all appliances were operating in their OFF states. During the matching of compressed ADEs, coming in a three-value format () in the EVD, the events lasting less than a specific threshold time () were detected as transient events. These were left for the post-processing stage by assigning zero power to all appliances. The algorithm of the proposed EMEDA is described in Algorithm 3.
| Algorithm 3: Event Matching Optimization Algorithm |
| Inputs: |
| Consumer-specific EVD. |
| List of compressed testing ADEs as . |
| Initial values of ASFs. |
| Outputs: |
| Array containing estimated ALDs and ASFs. |
| List containing indexes of transient events. |
| Method: |
| Declare an empty array . |
| Declare an empty list . |
| FOR each compressed ADE |
| IF ( for current ADE in ) |
| Declare the current ADE as a transient ADE. |
| Retain initial ASFs and add an entry in with zero powers for all appliances. |
| Append the index of the current ADE according to in . |
| ELSE |
| Step 1: Add two empty columns in EVD to get an extended EVD. |
| Step 2: Put the absolute difference between the test ADE and the records in EVD items in the first empty column. |
| Step 3: Fill the second empty column with the number of state variations obtained by comparing earlier state flags of appliances with ASFs associated with EVD records. |
| Step 4: Arrange the extended EVD with respect to the absolute difference obtained in Step 2. |
| Step 5: Pick the EVD record with the minimum absolute difference and no more than one state variation as matched ADE. |
| Step 6: Extend with the matched ADE obtained in Step 5. |
| Step 7: Reset the initial values of ASFs in accordance with the matched ADE for the next compressed testing ADE. |
| END IF ELSE |
| END FOR |
3.5. Post-Processing Algorithm
Due to their inherent characteristics, certain appliances consume abnormal levels of power when transitioning states. These unusual dips/spikes in power demands cause erroneous estimations and degrade the performance of NILM. To improve the performance, the proposed EMEDA assigned zero power to all appliances when detecting a transient ADE, without changing the earlier state flags of appliances. The post-processing algorithm was then applied for a better estimation of appliance power demands. The pseudocode of this algorithm is given in Algorithm 4.
Apart from the current transient event, the post-processing algorithm considered the two non-transient events preceding and succeeding the current event. More accurate power was assigned based on the supposition that the appliance in the transitioning phase drew irregular power, while the rest of the appliances exhibited no change in their power consumptions. The transitioning appliance was identified by comparing ALDs of non-transient events sandwiching the current transient sample. The appliance with the maximum absolute difference in its power demand in non-transient events was declared as the appliance undergoing a state transition.
| Algorithm 4: Proposed Post-Processing Algorithm |
| Inputs: |
| Array of estimated ALDs and ASFs returned by EMEDA. |
| List containing indexes of transient events in . |
| Outputs: |
| Array of estimated ALDs and ASFs after post-processing. |
| Method: |
| WHILE ( Length of |
| Step 1: Extract the index of the current transient event/sample as = |
| Step 2: Extract the current transient event |
| Step 3: Extract the non-transient events from preceding and succeeding the current transient event. |
| Step 4: Update ALDs and ASFs of the current transient event according to preceding and succeeding non-transient events, respectively. |
| Step 5: Calculate the absolute differences between ALDs of succeeding and preceding non-transient events. |
| Step 6: Pick the appliance in the transient phase based on the maximum value of absolute differences calculated in the previous step. |
| Step 7: Evaluate the absolute difference between the sum of ALDs updated from the preceding non-transient event and aggregate power of the transient event. |
| Step 8: Designate the absolute difference of Step 7 as the estimated demand of the appliance transitioning its state. |
| END WHILE |
4. Results and Discussion
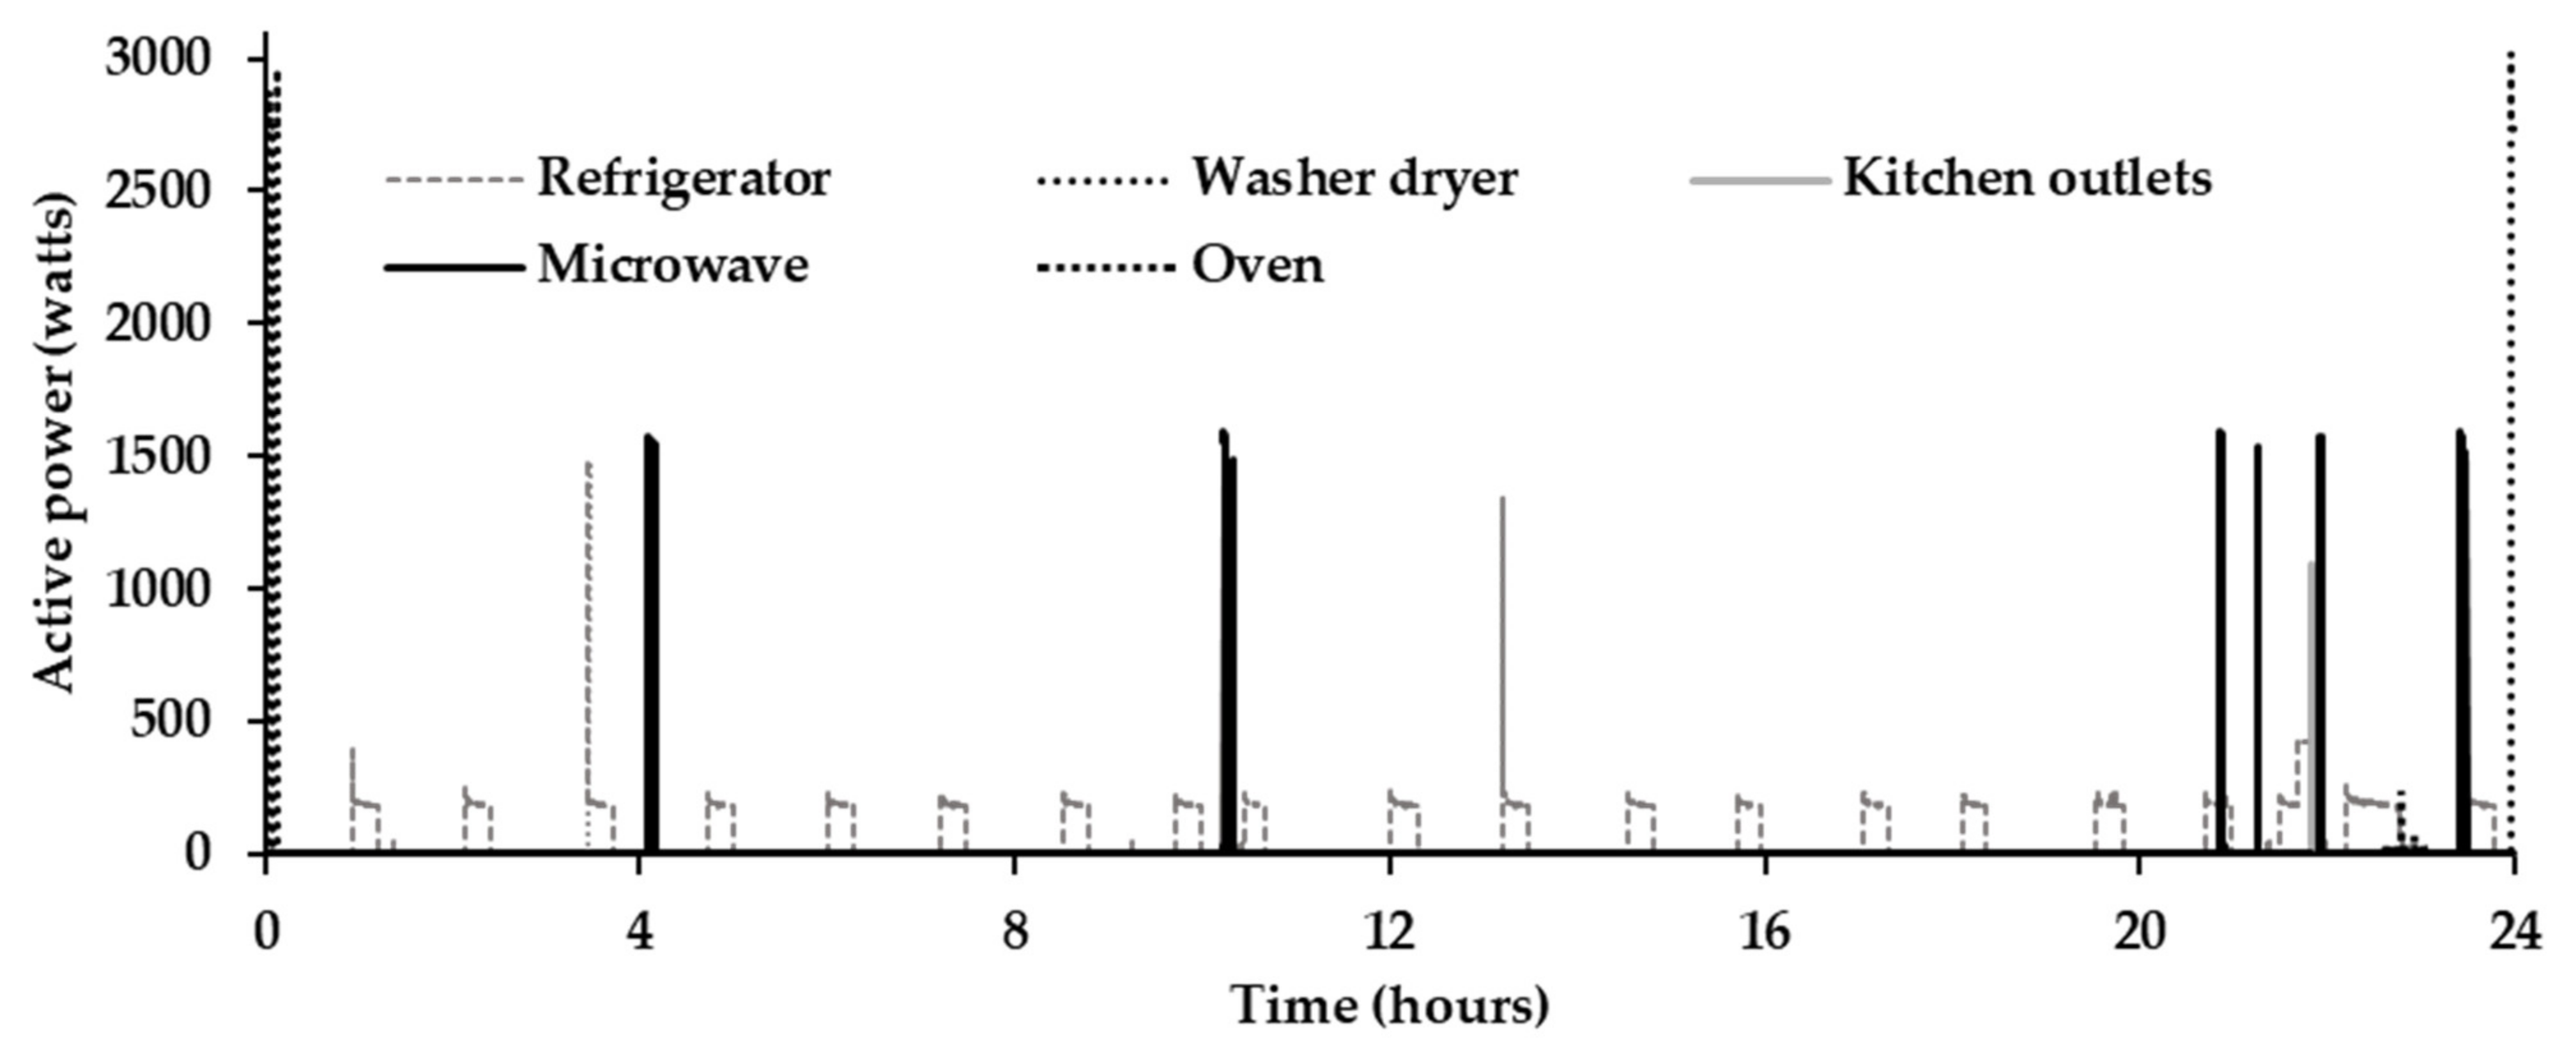
The proposed EMEDA was validated using REDD [41]. REDD contains aggregate and ALDs of six residential houses at a sampling rate of 0.25–0.33 Hz. For fair evaluation, five residential appliances (kitchen outlets, microwave, oven, refrigerator, and washer dryer) considered by [35] were selected as target appliances in house #1. The particulars of training and testing data segments are described in Table 1, and the actual ALDs for testing data 2 are shown in Figure 4. A core i5 system (CPU @ 2.30 GHz) equipped with 8 gigabytes of SSD RAM was employed for simulations using 64-bit Windows 10 Pro as the operating system. Python was used for programming in the Anaconda environment.
4.1. State Estimation and Data Compression Results
The application of k-means clustering on the training data gave estimated power states for appliances. These states are tabulated in Table 2. These states were used to construct consumer-specific EVD using algorithm I. This algorithm used these states as inputs and returned an EVD. The EVD, in our case, contained 72 records of target appliances [2 × 2 × 3 × 3 × 2 = 72].
In the data compression mechanism inspired by event-driven metering [45], demand fluctuations in the aggregate demand samples were continuously monitored. When the fluctuation deviated from the threshold power (), a transitioning of events was anticipated. The value of was selected based on an appliance that exhibited minimum variation during its state variation. In our data, the minimum on-state power of 193 watts occurred for the refrigerator. When the refrigerator went from its off-power mode of 6.5 watts to the first on-power mode of 193 watts, a power variation of 186.5 watts occurred. Half of the 186.5 watts (≅ 93 watts) was selected to detect a state variation. A total of 129,595 samples of test ADEs were compressed into 407 samples, giving a compression ratio of 318, as shown in Table 3. The high compression ratio saved resources for data transmission, storage, and processing.
4.2. NILM Results by EMEDA
The reduced samples of compressed ADEs were matched in the sorted EVD for their closest record. This closest record represents the estimated ALDs. When matching through the proposed EMEDA, transient events were also detected. The REDD dataset contained low-frequency data sampled after 3 or 4 s; therefore, we selected 6 s as the transient identification period (. ADEs lasting lesser than were detected as transient events. Upon detecting transient events, zero power was assigned to these appliances as their estimated demand. Assignment of zero power is evident in Figure 5 compared with Figure 4, which shows actual ALDs. Assigning zero power to transient events for all appliances suppressed the performance of the proposed NILM algorithm. Results of various evaluation metrics before post-processing are given in Table 4 and Table 5.
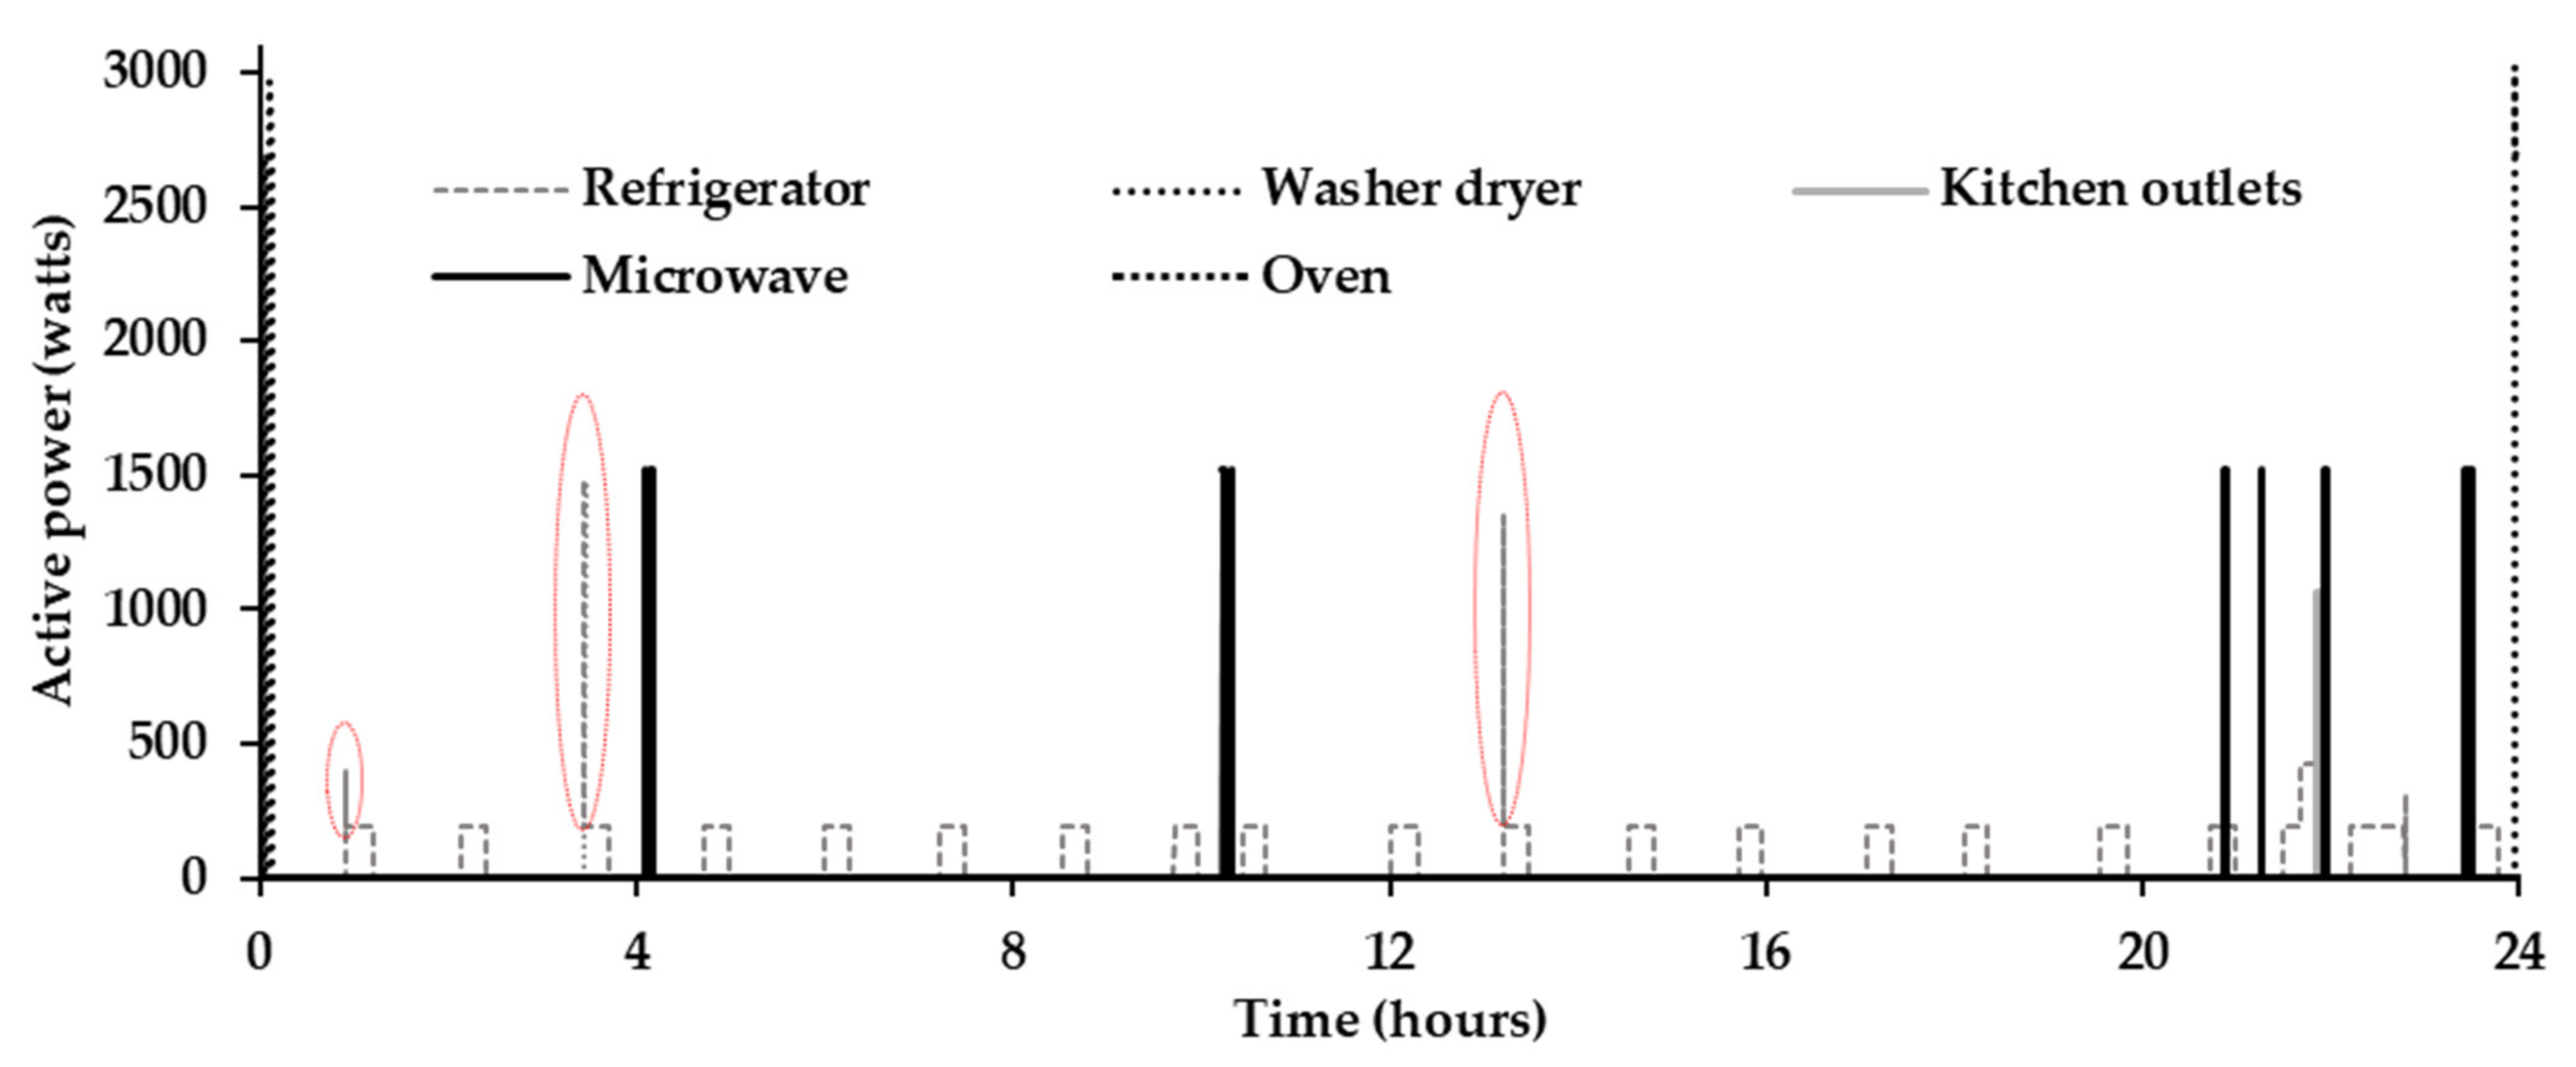
The transient events obtained during event matching were processed during post-processing, which improved the performance of the proposed EMEDA by assigning more accurate power to appliances going through transitions. Due to these more accurate assignments, the values of , and were improved for all residential appliances after post-processing, except for the microwave, where slightly degraded values of and were observed. Similarly, was improved for kitchen outlets, the refrigerator, and washer dryer after post-processing, whereas this value slightly decreased for the microwave and oven. One potential reason for these degraded values is inaccurate power assignments to some samples during the post-processing procedure. As an illustration, a few transient power assignments are highlighted using elliptical shapes for the refrigerator in Figure 6.
4.3. Computational Time Analysis
One of the primary objectives of the proposed EMEDA was to reduce the computational burden of the NILM solution; therefore, its computational time needed to be investigated. Computational time required for various stages of the proposed approach are presented in Table 5. For the observed testing period spanning over 8.5 days, the proposed approach approximately consumed 8.0247 s for data compression, energy disaggregation, and post-processing. Data compression reduced the number of test samples to be processed, whereas the pre-evaluated EVD reduced matching time. Therefore, the computation speed of the proposed approach was significantly improved. From Table 6, it is evident that, on average, the proposed algorithm disaggregated one sample of ADE in approximately 19.35 ms.
4.4. Comparison with Recent Existing Approaches
For performance evaluation, the proposed EMEDA was compared with some recent NILM approaches. For the sake of a fair evaluation, the proposed EMEDA used the same dataset, with similar appliances and training period as used in the SEBO approach [35]. SEBO was evaluated on the data of a single test day, whereas EMEDA considered testing data spanning over 8.5 days. The second comparison technique was optimization-based load disaggregation (OLDA) proposed by Zeinal-Kheiri, Shotorbani and Mohammadi-Ivatloo [11]. This technique considered six target appliances from house 1 of the REDD dataset. The four target appliances considered by OLDA [11] were similar to the appliances considered in the current study for a similar house of the REDD dataset, but we included kitchen outlets as our fifth target appliance for a fair comparison with the SEBO approach [35]. A comparison of the proposed EMEDA with SEBO [35], multi-label K Nearest Neighbors (KNN) [35], OLDA [11], integer programming (IP) [11], and aided linear integer programming (ALIP) [11] before and after post-processing is presented in Table 5 and Table 7. Results in Table 5 indicate that EMEDA surpassed the other techniques in all metrics except for for the microwave, which was slightly higher in the case of OLDA [11] after post-processing. Results of the proposed technique are highlighted using bold text.
From Table 7, it is evident that recently published OLDA [11], IP [11], ALIP [11], and SEBO [35] take 50.52, 38.68, 28.61, and 766.9 ms, respectively, to extract ALDs from one sample of ADE. Our proposed approach can disaggregate one aggregate demand sample in 19.35 ms, on average. This computational effectiveness of the proposed approach is due to event-driven data compression and EVD formation. Data compression reduced the number of samples to be processed and EVD formation eliminated the need to mix different state combinations of appliances over several iterations to reduce estimation error.
5. Conclusions
This work proposes a computationally efficient EMEDA for residential NILM. The proposed approach involves less prior data for training and is viable for practical applications. In the proposed technique, an EVD containing all the potential ADEs of target appliances was pre-established using the appliance power states and test ADEs were matched to estimate ALDs while reducing the estimation error and considering appliance operating states. The pre-evaluated EVD eliminated the need to attempt several combinations of appliance operational modes during each iteration to reduce estimation error, as done in conventional metaheuristic and combinatorial optimization techniques, thus reducing computational complexity. Furthermore, event-driven data compression was applied to reduce samples of ADEs to decrease processing time. In the future, additional low-frequency features, such as apparent power, power factor, reactive power, etc., could be incorporated to overcome performance degradation due to appliances with overlapping active power features. Similarly, mutually exclusive appliance operations could be eliminated in EVD to reduce its event records for further reductions in matching time. By providing ALDs from smart meter data, the proposed EMEDA could support utility and energy managers in devising efficient programs for energy conservation and demand-side management.
Author Contributions
Conceptualization, R.L. and I.A.S.; resources, R.L.; data curation, R.L.; writing—original draft preparation, R.L.; writing—review and editing, R.L. and I.A.S.; visualization, R.L.; supervision, I.A.S.; project administration, I.A.S. All authors have read and agreed to the published version of the manuscript.
Funding
This paper received partial funding from Higher Education Commission (HEC) of Pakistan under grant no. 17014.
Acknowledgments
R.L. and I.A.S. would like to thank the postgraduate office of the Department of Electrical Engineering, University of Engineering and Technology Taxila, for providing the facilities to accomplish this work.
Conflicts of Interest
The authors declare no conflict of interest.
References
- Balta, S.; Zavrak, S.; Eken, S. Real-Time Monitoring and Scalable Messaging of SCADA Networks Data: A Case Study on Cyber-Physical Attack Detection in Water Distribution System. In Proceedings of the Electrical and Computer Engineering, Cham, Switzerland, 9–12 February 2022; pp. 203–215. [Google Scholar]
- Eken, S. An exploratory teaching program in big data analysis for undergraduate students. J. Ambient. Intell. Humaniz. Comput. 2020, 11, 4285–4304. [Google Scholar] [CrossRef]
- Erdem, T.; Eken, S. Layer-Wise Relevance Propagation for Smart-Grid Stability Prediction. In Proceedings of the 5th Mediterranean Conference on Pattern Recognition and Artificial Intelligence, Istanbul, Turkey, 17–18 December 2021; Djeddi, C., Siddiqi, I., Jamil, A., Ali Hameed, A., Kucuk, İ., Eds.; Springer International Publishing: Cham, Switzerland, 2022; pp. 315–328. [Google Scholar]
- Breviglieri, P.; Erdem, T.; Eken, S. Predicting Smart Grid Stability with Optimized Deep Models. SN Comput. Sci. 2021, 2, 1–12. [Google Scholar] [CrossRef]
- Diawuo, F.A.; Sakah, M.; Pina, A.; Baptista, P.C.; Silva, C.A. Disaggregation and characterization of residential electricity use: Analysis for Ghana. Sustain. Cities Soc. 2019, 48, 101586. [Google Scholar] [CrossRef]
- Liaqat, R.; Sajjad, I.A.; Waseem, M.; Alhelou, H.H. Appliance Level Energy Characterization of Residential Electricity Demand: Prospects, Challenges and Recommendations. IEEE Access 2021, 9, 148676–148697. [Google Scholar] [CrossRef]
- Rasool, G.; Ehsan, F.; Shahbaz, M. A systematic literature review on electricity management systems. Renew. Sustain. Energy Rev. 2015, 49, 975–989. [Google Scholar] [CrossRef]
- Khalid, Q.; Arshad, N.; Khan, N.; Hassan, T.; Javed, F.; Ikram, J. Home energy management system using NILM and low-cost HAN. J. Electron. Sci. Technol. 2014, 12, 20–25. [Google Scholar]
- Iqbal, M.M.; Sajjad, M.I.A.; Amin, S.; Haroon, S.S.; Liaqat, R.; Khan, M.F.N.; Waseem, M.; Shah, M.A. Optimal scheduling of residential home appliances by considering energy storage and stochastically modelled photovoltaics in a grid exchange environment using hybrid grey wolf genetic algorithm optimizer. Appl. Sci. 2019, 9, 5226. [Google Scholar] [CrossRef] [Green Version]
- Gopinath, R.; Kumar, M.; Prakash Chandra Joshua, C.; Srinivas, K. Energy management using non-intrusive load monitoring techniques—State-of-the-art and future research directions. Sustain. Cities Soc. 2020, 62, 102411. [Google Scholar] [CrossRef]
- Zeinal-Kheiri, S.; Shotorbani, A.M.; Mohammadi-Ivatloo, B. Residential Load Disaggregation Considering State Transitions. IEEE Trans. Ind. Inform. 2020, 16, 743–753. [Google Scholar] [CrossRef]
- Carrie Armel, K.; Gupta, A.; Shrimali, G.; Albert, A. Is disaggregation the holy grail of energy efficiency? The case of electricity. Energy Policy 2013, 52, 213–234. [Google Scholar] [CrossRef] [Green Version]
- Hart, G.W. Nonintrusive appliance load monitoring. Proc. IEEE 1992, 80, 1870–1891. [Google Scholar] [CrossRef]
- Pereira, L.; Nunes, N. Performance evaluation in non-intrusive load monitoring: Datasets, metrics, and tools—A review. Wiley Interdiscip.Rev. Data Min. Knowl. Discov. 2018, 8, e1265. [Google Scholar] [CrossRef] [Green Version]
- Dash, S.; Sahoo, N. Electric energy disaggregation via non-intrusive load monitoring: A state-of-the-art systematic review. Electr. Power Syst. Res. 2022, 213, 108673. [Google Scholar] [CrossRef]
- Makonin, S.; Popowich, F.; Bajić, I.V.; Gill, B.; Bartram, L. Exploiting HMM sparsity to perform online real-time nonintrusive load monitoring. IEEE Trans. Smart Grid 2015, 7, 2575–2585. [Google Scholar] [CrossRef]
- Kong, W.; Dong, Z.Y.; Hill, D.J.; Ma, J.; Zhao, J.; Luo, F. A hierarchical hidden Markov model framework for home appliance modeling. IEEE Trans. Smart Grid 2016, 9, 3079–3090. [Google Scholar] [CrossRef]
- Parson, O.; Ghosh, S.; Weal, M.; Rogers, A. An unsupervised training method for non-intrusive appliance load monitoring. Artif. Intell. 2014, 217, 1–19. [Google Scholar] [CrossRef]
- Liu, Q.; Kamoto, K.M.; Liu, X.; Sun, M.; Linge, N. Low-Complexity Non-Intrusive Load Monitoring Using Unsupervised Learning and Generalized Appliance Models. IEEE Trans. Consum. Electron. 2019, 65, 28–37. [Google Scholar] [CrossRef]
- Kaselimi, M.; Doulamis, N.; Doulamis, A.; Voulodimos, A.; Protopapadakis, E. Bayesian-optimized Bidirectional LSTM Regression Model for Non-intrusive Load Monitoring. In Proceedings of the ICASSP 2019 IEEE International Conference on Acoustics, Speech and Signal Processing (ICASSP), Brighton, UK, 12–17 May 2019; pp. 2747–2751. [Google Scholar]
- Tabatabaei, S.M.; Dick, S.; Xu, W. Toward Non-Intrusive Load Monitoring via Multi-Label Classification. IEEE Trans. Smart Grid 2017, 8, 26–40. [Google Scholar] [CrossRef]
- Piccialli, V.; Sudoso, A.M. Improving Non-Intrusive Load Disaggregation through an Attention-Based Deep Neural Network. Energies 2021, 14, 847. [Google Scholar] [CrossRef]
- Precioso, D.; Gómez-Ullate, D. NILM as a regression versus classification problem: The importance of thresholding. arXiv 2020, arXiv:2010.16050. [Google Scholar]
- Huber, P.; Calatroni, A.; Rumsch, A.; Paice, A. Review on Deep Neural Networks Applied to Low-Frequency NILM. Energies 2021, 14, 2390. [Google Scholar] [CrossRef]
- Kong, W.; Dong, Z.Y.; Wang, B.; Zhao, J.; Huang, J. A Practical Solution for Non-Intrusive Type II Load Monitoring Based on Deep Learning and Post-Processing. IEEE Trans. Smart Grid 2020, 11, 148–160. [Google Scholar] [CrossRef]
- Yang, D.; Gao, X.; Kong, L.; Pang, Y.; Zhou, B. An Event-Driven Convolutional Neural Architecture for Non-Intrusive Load Monitoring of Residential Appliance. IEEE Trans. Consum. Electron. 2020, 66, 173–182. [Google Scholar] [CrossRef]
- Song, J.; Wang, H.; Du, M.; Peng, L.; Zhang, S.; Xu, G. Non-Intrusive Load Identification Method Based on Improved Long Short Term Memory Network. Energies 2021, 14, 684. [Google Scholar] [CrossRef]
- Kim, I.; Kim, H.; Kim, S.Y.; Shin, S. Spectogram analysis of active power of appliances and LSTM-based energy disaggregation. J. Korea Converg. Soc. 2021, 12, 21–28. [Google Scholar] [CrossRef]
- Chen, K.; Zhang, Y.; Wang, Q.; Hu, J.; Fan, H.; He, J. Scale- and Context-Aware Convolutional Non-Intrusive Load Monitoring. IEEE Trans. Power Syst. 2020, 35, 2362–2373. [Google Scholar] [CrossRef] [Green Version]
- Liang, J.; Ren, Z.; Wang, L.; Tang, B.; Liu, J.; Liu, Y. Deep Neural Network in Sequence to Short Sequence Form for Non-intrusive Load Monitoring. In Proceedings of the 2019 IEEE 3rd Conference on Energy Internet and Energy System Integration (EI2), Changsha, China, 8–10 November 2019; pp. 565–570. [Google Scholar]
- D’Incecco, M.; Squartini, S.; Zhong, M. Transfer Learning for Non-Intrusive Load Monitoring. IEEE Trans. Smart Grid 2020, 11, 1419–1429. [Google Scholar] [CrossRef] [Green Version]
- Zhao, Q.; Xu, Y.; Wei, Z.; Han, Y. Non-Intrusive Load Monitoring Based on Deep Pairwise-Supervised Hashing to Detect Unidentified Appliances. Processes 2021, 9, 505. [Google Scholar] [CrossRef]
- Ahmed, A.M.; Zhang, Y.; Eliassen, F. Generative Adversarial Networks and Transfer Learning for Non-Intrusive Load Monitoring in Smart Grids. In Proceedings of the 2020 IEEE International Conference on Communications, Control, and Computing Technologies for Smart Grids (SmartGridComm), Virtual, 11–13 November 2020; pp. 1–7. [Google Scholar]
- Bhotto, M.Z.A.; Makonin, S.; Bajić, I.V. Load Disaggregation Based on Aided Linear Integer Programming. IEEE Trans. Circuits Syst. II Express Briefs 2017, 64, 792–796. [Google Scholar] [CrossRef] [Green Version]
- Azizi, E.; Shotorbani, A.M.; Hamidi-Beheshti, M.-T.; Mohammadi-Ivatloo, B.; Bolouki, S. Residential Household Non-Intrusive Load Monitoring via Smart Event-based Optimization. IEEE Trans. Consum. Electron. 2020, 66, 233–241. [Google Scholar] [CrossRef]
- Lin, S.; Zhao, L.; Li, F.; Liu, Q.; Li, D.; Fu, Y. A nonintrusive load identification method for residential applications based on quadratic programming. Electr. Power Syst. Res. 2016, 133, 241–248. [Google Scholar] [CrossRef] [Green Version]
- Piga, D.; Cominola, A.; Giuliani, M.; Castelletti, A.; Rizzoli, A.E. Sparse optimization for automated energy end use disaggregation. IEEE Trans. Control. Syst. Technol. 2015, 24, 1044–1051. [Google Scholar] [CrossRef]
- Egarter, D.; Elmenreich, W. Load disaggregation with metaheuristic optimization. In Proceedings of the Energieinformatik, Karlsruhe, Germany, 12–13 November 2015; pp. 1–12. [Google Scholar]
- Liu, H.; Yu, C.; Wu, H.; Chen, C.; Wang, Z. An improved non-intrusive load disaggregation algorithm and its application. Sustain. Cities Soc. 2020, 53, 101918. [Google Scholar] [CrossRef]
- Shahroz, M.; Younis, M.S.; Nasir, H.A. A Scenario-Based Stochastic Optimization Approach for Non-Intrusive Appliance Load Monitoring. IEEE Access 2020, 8, 142205–142217. [Google Scholar] [CrossRef]
- Kolter, J.Z.; Johnson, M.J. REDD: A public data set for energy disaggregation research. In Proceedings of the Workshop on Data Mining Applications in Sustainability (SIGKDD), San Diego, CA, USA, 21 August 2011; pp. 59–62. [Google Scholar]
- Ajani, O.S.; Kumar, A.; Mallipeddi, R.; Das, S.; Suganthan, P.N. Benchmarking Optimization-Based Energy Disaggregation Algorithms. Energies 2022, 15, 1600. [Google Scholar] [CrossRef]
- Hua, D.; Huang, F.; Wang, L.; Chen, W. Simultaneous disaggregation of multiple appliances based on non-intrusive load monitoring. Electr. Power Syst. Res. 2021, 193, 106887. [Google Scholar] [CrossRef]
- Tan, P.-N.; Steinbach, M.; Kumar, V. Introduction to Data Mining; Pearson Education India: New Delhi, India, 2016. [Google Scholar]
- Simonov, M.; Chicco, G.; Zanetto, G. Event-Driven Energy Metering: Principles and Applications. IEEE Trans. Ind. Appl. 2017, 53, 3217–3227. [Google Scholar] [CrossRef]
Figure 1.
Benefits of disaggregated energy characterization in smart cities.

Figure 2.
Illustration of the general NILM concept.

Figure 3.
Methodology flowchart for the proposed EMEDA.

Figure 4.
Actual ALDs for testing data 2.

Figure 5.
Estimated ALDs for testing data 2 before post-processing.

Figure 6.
Estimated ALDs for testing data 2 after post-processing (dotted elliptical shapes represent some samples where transient powers are assigned to the refrigerator).
Figure 6.
Estimated ALDs for testing data 2 after post-processing (dotted elliptical shapes represent some samples where transient powers are assigned to the refrigerator).


Table 1.
Training and testing data.
| Segment | Start (D-M-Y H:M:S) | End (D-M-Y H:M:S) | Length | Weekdays/ Weekend |
|---|---|---|---|---|
| Training data | 19-04-2011 09:30:00 | 02-05-2011 09:29:59 | 14 days | Both |
| Testing data 1 | 23-05-2011 19:00:00 | 24-05-2011 07:00:03 | 12 h | Weekdays |
| Testing data 2 | 07-05-2011 12:00:06 | 08-05-2011 12:00:01 | 1 day | Weekends |
| Testing data 3 | 09-05-2011 00:00:02 | 10-05-2011 23:59:57 | 2 days | Weekdays |
| Testing data 4 | 02-05-2011 09:30:03 | 07-05-2011 09:30:03 | 5 days | Both |
Table 2.
States of appliances, computed by K-means clustering.
| Appliance | Number of Operating Modes | Power Levels in Various Modes (Watts) | |||
|---|---|---|---|---|---|
| 1 | Kitchen outlets | 2 | 1 * | 1068 | |
| 2 | Microwave | 2 | 4 * | 1519 | |
| 3 | Oven | 3 | 0 | 3366 | 4091 |
| 4 | Refrigerator | 3 | 6.5 * | 193 | 424 |
| 5 | Washer dryer | 2 | 0 | 2692 | |
* These non-zero values are aligned with REDD [41] for house 1.
Table 3.
Compression ratios and data compression time.
| Testing Period | Time Span | Uncompressed Samples | Compressed ADEs | Compression Ratio | Computational Time for Data Compression |
|---|---|---|---|---|---|
| Period #1 | 0.5 days | 11,347 | 30 | 378:1 | 0.0130 s |
| Period #2 | 1 day | 22,551 | 87 | 259:1 | 0.0254 s |
| Period #3 | 2 days | 44,562 | 166 | 268:1 | 0.0496 s |
| Period #4 * | 5 days | 51,135 | 124 | 412:1 | 0.0609 s |
| Total | 8.5 days | 129,595 | 407 | 318:1 | 0.1489 s |
* The samples in testing period # 4 of REDD are as per the original data and are fewer in number due to some missing intervals. Therefore, the computational time is also smaller.
Table 4.
Results for different evaluation metrics.
| Appliance | Ground Truth | Before Post-Processing | After Post-Processing | ||||
|---|---|---|---|---|---|---|---|
| Kitchen outlets | 0.0551 | 0.0542 | 0.0029 | 0.0154 | 0.0541 | 0.0004 | 0.0186 |
| Microwave | 0.1947 | 0.1928 | 0.0036 | 0.0093 | 0.1929 | 0.0050 | 0.0090 |
| Oven | 0.0446 | 0.0443 | 0.0001 | 0.0047 | 0.0442 | 0.0001 | 0.0098 |
| Refrigerator | 0.6818 | 0.6860 | 0.0354 | 0.0063 | 0.6855 | 0.0034 | 0.0055 |
| Washer dryer | 0.0238 | 0.0224 | 0.0292 | 0.0585 | 0.0233 | 0.0009 | 0.0216 |
Table 5.
Evaluation results of the proposed EMEDA and their comparison with other techniques.
| Appliance | Before Post-Processing | After Post-Processing | |||||||||||
|---|---|---|---|---|---|---|---|---|---|---|---|---|---|
| Proposed EMEDA | Proposed EMEDA | SEBO [35] | SEBO [35] | Proposed EMEDA | Proposed EMEDA | SEBO [35] | SEBO [35] | OLDA [11] | IP [11] | ALIP [11] | Multi-Label KNN [35] | Multi-Label KNN [35] | |
| Kitchen outlets | 0.9971 | 0.9857 | 0.96 | 0.85 | 0.9996 | 0.9867 | 0.96 | 0.86 | N/A | N/A | N/A | 0.84 | 0.73 |
| Microwave | 0.9963 | 0.9835 | 0.83 | 0.77 | 0.9949 | 0.9844 | 0.84 | 0.80 | 0.99 | 0.50 | 0.50 | 0.81 | 0.79 |
| Oven | 0.9999 | 0.9890 | 0.75 | 0.86 | 0.9999 | 0.9890 | 0.86 | 0.91 | 0.5 | 0.50 | 0.50 | 0.68 | 0.79 |
| Refrigerator | 0.9500 | 0.9793 | 0.83 | 0.94 | 0.9951 | 0.9812 | 0.83 | 0.94 | 0.91 | 0.85 | 0.89 | 0.82 | 0.94 |
| Washer dryer | 0.9707 | 0.9751 | 0.91 | 0.94 | 0.9990 | 0.9886 | 0.92 | 0.96 | 0.87 | 0.52 | 0.50 | 0.91 | 0.93 |
Table 6.
Computational time analysis for the proposed EMEDA.
| Testing Data | Computational Time | |||||
|---|---|---|---|---|---|---|
| Data Compression (DC) | DC+ Energy Disaggregation (ED) | DC+ ED+ Post-Processing | Time/day for DC + ED+ Post-Processing | ED+ Post-Processing | Time/Day for ED+ Post-Processing | |
| Period #1 (12 h) | 0.0130 s | 0.5930 s | 0.7105 s | 1.4210 s | 0.6975 s | 1.3950 s |
| Period #2 (24 h) | 0.0254 s | 1.1974 s | 1.4309 s | 1.4309 s | 1.4055 s | 1.4055 s |
| Period #3 (48 h) | 0.0496 s | 2.2749 s | 2.7010 s | 1.3505 s | 2.6514 s | 1.3257 s |
| Period #4 (5 days) * | 0.0609 s | 2.6792 s | 3.1823 s | 0.6365 s | 3.1214 s | 0.6242 s |
| Total (8.5 days) | 0.1489 s | 6.7445 s | 8.0247 s | 0.9441 s | 7.8758 s | 0.9266 s |
* Computational time for testing period # 4 of REDD is less due to missing samples and less number of event transitions.
Publisher’s Note: MDPI stays neutral with regard to jurisdictional claims in published maps and institutional affiliations. |
© 2022 by the authors. Licensee MDPI, Basel, Switzerland. This article is an open access article distributed under the terms and conditions of the Creative Commons Attribution (CC BY) license (https://creativecommons.org/licenses/by/4.0/).
Share and Cite
MDPI and ACS Style
Liaqat, R.; Sajjad, I.A. An Event Matching Energy Disaggregation Algorithm Using Smart Meter Data. Electronics 2022, 11, 3596. https://0-doi-org.brum.beds.ac.uk/10.3390/electronics11213596
AMA Style
Liaqat R, Sajjad IA. An Event Matching Energy Disaggregation Algorithm Using Smart Meter Data. Electronics. 2022; 11(21):3596. https://0-doi-org.brum.beds.ac.uk/10.3390/electronics11213596
Chicago/Turabian StyleLiaqat, Rehan, and Intisar Ali Sajjad. 2022. "An Event Matching Energy Disaggregation Algorithm Using Smart Meter Data" Electronics 11, no. 21: 3596. https://0-doi-org.brum.beds.ac.uk/10.3390/electronics11213596
Note that from the first issue of 2016, this journal uses article numbers instead of page numbers. See further details here.