Article

A Novel text2IMG Mechanism of Credit Card Fraud Detection: A Deep Learning Approach

1
Department of Information Technology, College of Computers and Information Technology, Taif University, Taif 21944, Saudi Arabia
2
Department of Electrical/Electronics & Computer Engineering, Faculty of Engineering, University of Uyo, Uyo 520103, Nigeria
3
Department of Information Systems, College of Computer and Information Sciences, King Saud University, Riyadh 11451, Saudi Arabia
4
Centre for Smart Systems, AI and Cybersecurity, Staffordshire University, Stoke-on-Trent ST4 2DE, UK
5
Department of Computer Science, College of Computers and Information Technology, Taif University, Taif 21944, Saudi Arabia
6
Department of Computer Science, COMSATS University Islamabad-Wah Campus, Wah Cantt 47040, Pakistan
*
Author to whom correspondence should be addressed.
Submission received: 1 February 2022 / Revised: 21 February 2022 / Accepted: 26 February 2022 / Published: 1 March 2022
(This article belongs to the Special Issue Hybrid Developments in Cyber Security and Threat Analysis)

Abstract

:
Online sales and purchases are increasing daily, and they generally involve credit card transactions. This not only provides convenience to the end-user but also increases the frequency of online credit card fraud. In the recent years, in some countries, this fraud increase has led to an exponential increase in credit card fraud detection, which has become increasingly important to address this security issue. Recent studies have proposed machine learning (ML)-based solutions for detecting fraudulent credit card transactions, but their detection scores still need improvement due to the imbalance of classes in any given dataset. Few approaches have achieved exceptional results on different datasets. In this study, the Kaggle dataset was used to develop a deep learning (DL)-based approach to solve the text data problem. A novel text2IMG conversion technique is proposed that generates small images. The images are fed into a CNN architecture with class weights using the inverse frequency method to resolve the class imbalance issue. DL and ML approaches were applied to verify the robustness and validity of the proposed system. An accuracy of 99.87% was achieved by Coarse-KNN using deep features of the proposed CNN.

1. Introduction

Credit cards are used extensively for online shopping, which has substantially increased due to globalization. However, the higher number of credit card transactions (CCTs) has also resulted in an increased incidence of fraud [1], necessitating the development of novel fraud detection methods. A wrongful or illegal falsehood performed for individual gain is called fraud [2]. The process of stealing someone’s identity and performing fraudulent transactions by pretending to be the card owner is called credit card crime (CCC), and credit card fraud detection (CCFD) methods are applied to detect such fraudulent transactions.
There are two types of fraudulent transactions, i.e., offline fraud and online fraud. Offline fraud is conducted by physically stealing the card and physically using it afterward, whereas online fraud is conducted by stealing the victim’s personal information, such as the card holder’s name, card number, and pin code [3]. Distinguishing between regular and fraudulent transactions is a challenging task, as routine transactions are more common than fraudulent transactions. Therefore, regardless of the fraud identification model (FIM) used, fraudulent transactions should be identified first [3].
Several studies have been performed in which data mining (DM) and machine learning (ML) methods were used to expose credit card fraud (CCF). In these studies, two main types of methods have been developed for the detection and identification of fraudulent transactions, i.e., unsupervised and supervised methods [4]. In a supervised method, classification is performed by an algorithm based on the transactional data record. Hidden Markov models, artificial neural networks [5,6], support vector machines, k-nearest neighbors, random forests, and Bayesian belief networks are some state-of-the-art algorithms used as supervised approaches [4].
In unsupervised methods, algorithms detect hidden patterns in non-labeled transactional data. K-Means and SOMs (self-organized maps) are used as unsupervised approaches [7]. CCFD investigations are restricted to financial organizations, and banks avoid sharing their sensitive records on CCT [8]. For the identification and detection of fraudulent transactions, specificity and accuracy are used as conventional metrics for evaluating the correctness of predictions. However, we cannot rely on these metrics only, so a sensitivity metric is utilized to estimate the model efficiency. For this purpose, the F-score is recognized as a practical metric for measuring the performance of a CCF test by consolidating precision metrics and sensitivity [9].

1.1. Traditional Card-Related Fraud

In this case, significant credit card information, such as the pin code, card number, and owner’s name, is compromised and used for fraudulent transactions. The fraudster impersonates the card owner and performs transactions. However, such transactions can be easily recognized.

1.2. Merchant-Related Fraud

Such fraud is conducted by dishonest employees or owners of merchant companies. Merchant collusion transpires when a client’s credit card details are provided to fraudsters by employees or owners. In triangulation fraud, the customer is attracted by substantial discounts on products, provides their card information to purchase these items, and is deceived by the phishing websites of fraudsters.

1.3. Internet-Related Fraud

This is the easiest method used by fraudsters, and it is often used without the fraudster being caught. Several methods, such as credit card generators, false merchant sites, and site cloning, are used for this purpose. For example, the Luhn algorithm is used to create accurate combinations of credit card numbers [10].

1.4. Other Types of Fraudulent Activities

Other fraud types involve phishing, skimming, cardholder-not-present (CNP), account takeover, etc., can be used by a fraudster.In skimming, data from a card’s magnetic strip are copied by using an electromagnetic card reader, whereas in phishing, the personal information of the card owner is stolen to conduct fraudulent transactions [11].
An effective fraud detection approach is characterized by the following features [11]:
  • Fraudulent activities are reliably and precisely identified.
  • Fraudulent practices are identified as soon as possible.
  • Problems in tracing a fraudulent operation are mitigated by not identifying a standard transaction as fraud.
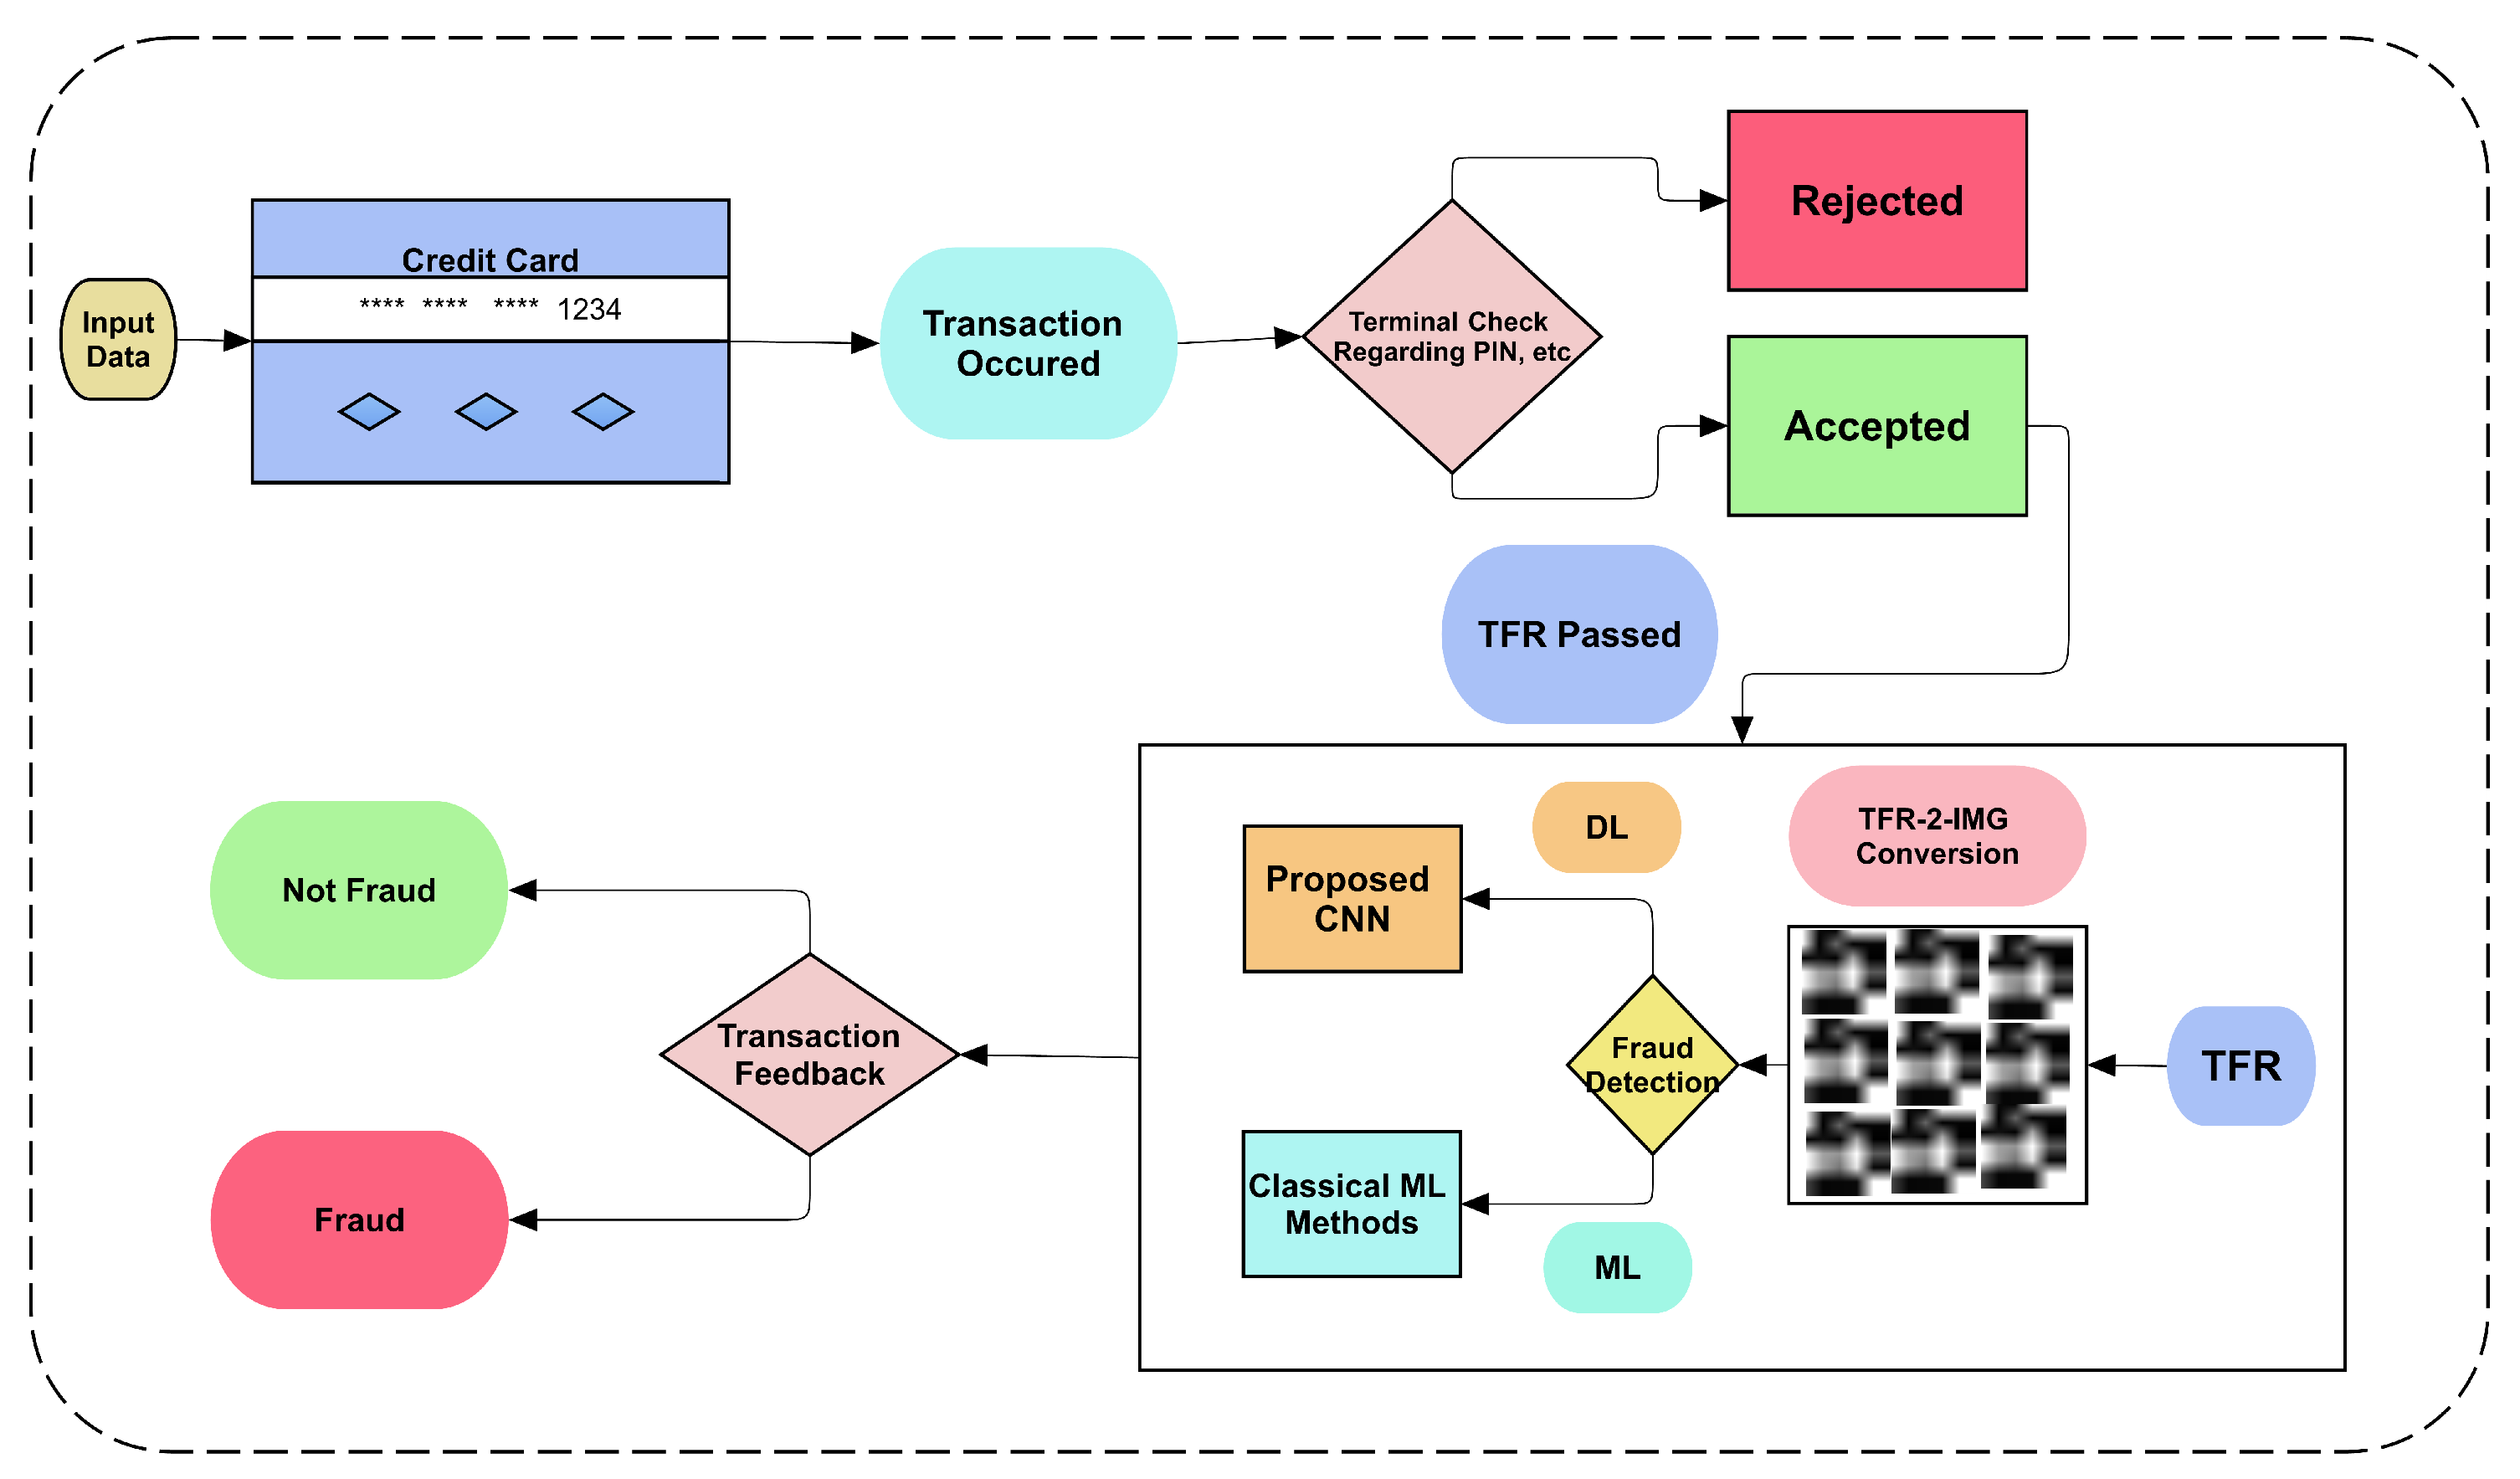
This research proposes a deep learning (DL) strategy to solve the text data problem for online credit card fraud detection using the Kaggle dataset. It was inspired by another study that used binary images data that were generated using ECG signal data [12]. That said, it generated patches from text data. However, another study used a capsuleNet that introduced and utilized deep features to detect the fraud or legal transaction. The pre-trained architecture of CapsuleNet was utilized, and different ML classifiers were applied that gave promising testing results [13].
In this study a novel text2IMG conversion mechanism that generates small images is proposed. The generated images are fed to CNN layers with class weights to tackle the imbalanced target class problem. DL and ML techniques were used to verify the proposed system’s robustness and validity. The used deep features reduced the time complexity for machine learning classifiers. The experimental results show that Coarse-KNN achieved 99.87% accuracy by utilizing deep features provided by the proposed CNN.
The rest of the article consists of four sections. Section 2 and Section 3 contain the all proposed work. Section 4 contains results and discussion that illustrate the working of the proposed method using appropriate evaluation measures. Lastly, the overall work is concluded with contributions, limitations, and future work.

2. Related Work

The authors of a previous study proposed a novel hybrid approach [14] utilizing a divide-and-conquer strategy for solving the issue of imbalanced classes. They trained a model of anomaly detection on the original dataset, and then they utilized a non-linear classifier for a complex subset. Dynamic weighted entropy (DWE) was used to evaluate the quality of the subset. They further tested a real electronic transaction dataset and the Kaggle fraud detection dataset to verify their method.
In another study [15], a sequential modeling-based ensemble model was developed by utilizing deep recurrent neural networks for the detection of fraudulent transactions. The authors utilized two real datasets to verify their model’s performance. Their model performed better than previous models according to all evaluation criteria.
The authors of another study [16] utilized machine learning algorithms such as an artificial neural network (ANN), k-nearest neighbors (KNN), and a support vector machine (SVM) to predict fraud occurrences. Then, they applied deep learning and supervised machine learning techniques to classify regular and fraudulent transactions.
Many other studies on various methods have applied anomaly detection using new and to the point features, such as an efficient method that proposed an IoT2Vec feature. A multi-agent system was proposed that assists cluster the unusual activities using the suggested feature [17]. The large datasets to detect anomalies are scaled using the swarm intelligence method, which makes the algorithms more scalable via parallelism and decentralization approaches. The validation of this evolutionary computing method on synthetic and real-world data was approved, proving its robustness [18].
The random forest classifier-based fraud detection of a Chinese E-Commerce dataset was proposed in [19]. In this study, an improved random forest classifier is also presented, and the class imbalance issue between fraud and non-fraud datasets is also discussed.
Prusti et al. proposed a fraud detection system [20] utilizing a graph database model. In their model, the features of the graph are extracted using the Neo4j tool and then combined with various attributes of transaction databases. Afterward, they applied two unsupervised and five supervised machine learning algorithms. They tested the performances of these machine learning algorithms based on the features extracted from graph and transaction databases.
A novel pattern recognition k-nearest neighbor (PR-KNN) method [21] was developed to resolve fraud detection problems. The intention behind this new extended method was to prevent hackers from tracing anyone’s online transactions. The authors used genetic algorithms to reduce false alarms and improve fraud detection. Customer behavior was studied to detect fraud. Other authors proposed a novel majority vote ensemble classifier [22] to detect fraudulent transactions. They used the Web Markov Skeleton Process (WMSP) model to classify user behaviors from data collected through a bank website to detect fraudulent transactions. They used Support Vector Machine (SVM) and Random Forest (RF) classifiers. The MVE classifier showed highly accurate results.
Another study was carried out [23] to explore various techniques of data engineering to enhance the analytical model’s performance while maintaining features of interpretability. The authors divided their data engineering process into various features and phases of instance engineering. They demonstrated enhanced performance with the data engineering phases on a real dataset of payment transactions.
Seera et al. [24] implemented 13 machine learning and statistical techniques to detect credit card fraud by utilizing actual public records of transactions. They performed a statistical hypothesis test to determine whether the features acquired through the genetic algorithm performed well compared with basic features for fraud detection. The aggregated features showed reliable outcomes.
In another study [25], artificial bee colony (ABC) and k-means algorithms were utilized to propose an enhanced two-level credit card fraud tracking model. The model utilized an integrated rule engine to refine dataset features and detect whether each transaction was normal or fraudulent based on several parameters of customer profiles, such as account balance, usage frequency, and geographical location.
Another study was carried out [26] using three machine learning algorithms, i.e., k-nearest neighbor, naive Bayes, and logistic regression. The authors measured the performances of the algorithms using the area under curve, F-measure, precision, specificity, sensitivity, and accuracy. The results showed that the logistic regression model had the best results.
Zhu et al. carried out a study [27] to implement several methods of intelligent optimization of WELM. Empirical outcomes proved that dandelion algorithm-based WELM had better performance than the others, including self-learning dandelion, dandelion, genetic, bat, and particle swarm optimization algorithms. Their results demonstrated exceptional detection performance.
Other authors proposed a novel framework [28] to analyze a series of credit card transactions from three distinct aspects, i.e., (1) the sequence does or does not contain fraud, (2) the series is acquired by adjusting the payment terminal or cardholder, and (3) the series of time spent between previous and current transactions. A hidden Markov model (HMM) was used to model every sequence.
A hybrid-based credit card fraud detection (CCFD) method [29] was proposed and showed better results than traditional models. The model combines the abilities of synthetic minority oversampling (SMOTE), hyper-parameter optimization (HPO), and recursive feature elimination (RFE). The authors tested their model on several real-world datasets.
A system was proposed [30] in which the authors ignored the non-additivity of the composition of rules in the pool. The authors suggested utilizing a method for predicting every rule’s contribution to the pool’s performance by using the Shapley value (SV). They tested their model on real-world datasets of credit card fraud. Their proposed approach showed more reliable results compared to traditional approaches.
Bagga et al. carried out a study [31] to compare the performances of ensemble learning, pipelining, random forests, quadrant discriminant analysis, Ada boost, multi-layer perceptron, k-nearest neighbors, naive Bayes, and logistic regression in credit card fraud detection. They trained nine classifiers on a real-world dataset. They used the ADASYN approach to balance the dataset.
Other authors proposed a strategy [32] to solve the issue of imbalanced classes in the process of fraud detection while using supervised classification. They trained their model on a dataset with a large number of instances of the minority class compared to the original dataset. They tested their framework on aboveboard datasets and achieved highly accurate results.
In a previous study [33], a hybrid approach was developed by combining unsupervised and supervised techniques to enhance the accuracy of fraud detection systems. The authors tested unsupervised outlier scores collected at several phases of granularity on real, annotated datasets of fraud detection. Empirical outcomes showed very accurate results of detection.
Another study was carried out [34] to develop a fraud detection system using an advanced feature engineering process with a deep learning architecture employing homogeneity-oriented behavior analysis (HOBA). The authors verified their system on a large dataset from a bank in China. Their system efficiently detected fraudulent transactions in the dataset.
Kim et al. carried out a study [35] to compare a deep learning approach and hybrid ensemble by proposing a champion-challenger framework. After development, they tested their models on a massive dataset of a card distribution organization in South Korea. They utilized several evaluation metrics to verify their models and used them as actual fraud detection systems.
A loss function improvement for a deep learning model was presented, and the authors compared the traditional and proposed loss functions [36]. Lightweight models of CNNs are proposed daily. Repetitive feature maps is the mostly used approach in all of these proposed lightweight CNNs. The generalization in all of these models is the biggest problem. However, to create robustness and generalization in a lightweight CNN, a dynamic adaptation algorithm was proposed [37]. It integrates the convolution layers module in it. However, it reduces the floating-point operations by 54% and yet achieved the same accuracy on the CIFAR-10 dataset. It also increased the accuracy on IMAGENET by 1.2%. It also used a credit card fraud detection case study to validate its proposed methods and loss function. Many of the other studies that worked on deep learning model loss functions, such as softmax, used CNNs. However, it shows their relevant weakness when we discuss inter-class compactness rather than inter-class separability. Therefore, the authors proposed a pair-wise Gaussian loss function, and compared the softmax and other loss functions. Their method had greatly superior results [38]. A special domain-specific deep learning model that uses behavioral patterns of transaction record data was proposed [39]. The aggregation strategy is applied in this method. The behavioral pattern algorithm based on a non-linear model of a Gradient boosting decision tree was proposed. A linear regression method at the end was used that utilized the neighbors’ information, behavioral patterns, and cross features. The results on a real dataset showed efficient performance.
A novel method [40] called hierarchical clusters-based deep neural networks (HC-DNN) was proposed for credit card fraud detection. This system performed well and included a description of the type of fraud. Cross-validation of the proposed method showed that it achieved better performance than traditional approaches.
Table 1 summarizes recent studies based on computer vision for credit card fraud detection.
By analyzing all related work discussed above, we can conclude that data imbalance is still an open challenge in order to make an unbiased method of machine learning to detect credit-card fraud. Another problem is to make a time-efficient and more miniature yet complex model to detect fraud detection. Therefore, the class imbalance, time efficiency, and space efficiency must be considered, along with an appropriate evaluation measure that considers the class unbalancing issue. The proposed study solves these problems to some extent with an efficient and less time-consuming method that solves the credit-card fraud detection problem.

3. Methodology

Many research methodologies in the domain of artificial intelligence have been developed for credit card fraud detection and have shown promising performance. The presented method uses image processing and both deep and machine learning-based approaches for credit card fraud detection. The proposed method is a text2IMG conversion approach that converts text data into image format. The digital lattice is then iterated over a mask, and a final image with different intensity levels is prepared. The given data in image format are then fed into the proposed CNN and classical ML methods via pipeline features. The primary steps of the proposed approach are shown in Figure 1.
The figure shows all steps of the proposed work that occur once the transaction occurs on the client-side. The basic steps of the credit card transaction are performed in the usual way. However, after the terminal check of credit card validity, intelligent fraud detection is performed on the obtained transaction record. In this study, a public dataset that lacks class balance was used. It has 284,807 data instances with 28 variables and two classes. There are 284,315 instances of non-fraud data but only 492 fraud records. Therefore, a huge class imbalance issue exists that must be addressed. Some recent studies have also addressed this class imbalance issue using different strategies, such as a Gaussian mixture model (GMM) that utilized a probability density function (PDF) [41]. The minority samples are fitted using the GMM, with which the maximum PDF is selected as threshold for both classes. However, in the proposed method, class weights are assigned to solve this class imbalance issue using the inverse frequency method.

3.1. Text2img Converter

The input data contain 28 variables of different features; the time and the amount are the first and last features and are also considered in text2IMG conversion. Therefore, a total of 30 values were transformed to image format, with output dimensions of 5 × 6. Thus, 5 rows of 6 variables were taken to obtain the transformed (5 × 6)-dimensional image. The proposed method of text2IMG conversion is described below:
I i n p f ( x , y )
The input instance represented as f ( x , y ) is denoted by I i n p , which is the same as the input instance. This input instance contains the 30 variables of feature data of the fraud detection dataset. The transformation is performed on the input instance and is described in Equation (2).
I T T { I i n p }
The transformation of the text instance is applied using T { I i n p } , which results in the transformed instance, denoted by I T . The transformed input instance is represented in Equation (3).
I T = ( W , M )
Equation (3) includes a multiplicative window W, which is further defined in Equation (4). This is an iterative window with ones in it. The other multiplicative mask M represents the conversion of text data into i j d i m e n s i o n data.
W = i , j n ( 1 , 1 )
where i and j are the rows and columns of the input iterative window and mask, and n is the chosen limit for both rows and columns. The window in this study contains 6 rows and 5 columns, and W represents the overall iterative window.
M = i . j n m x ( i , j )
The multiplicative instance is denoted by M, and it is transformed into a matrix format m x ( i , j ) of a particular point x for a corresponding position i j in the matrix. After conversion to a transformed instance I T , the instance is saved in JPG format using a JPG compression [42] method that further converts the matrix into image format using lossy compression.

3.2. Proposed Convolutional Neural Network (CNN)

The convolutional neural network is not only a simple deep neural network. It processes information in a manner similar to the visual cortex of the brain to simulate visual recognition. The convolutional neural network can be applied not only to images but also to many other datasets, but it is mostly used on image-based data, for which it has shown excellent performance. The proposed CNN architecture is visualized in Figure 2.
The proposed CNN uses basic operation-based layers that process the given input patterns. Several basic operation layers are used in the proposed CNN to classify the transformed input data of credit card transactions into fraud and non-fraud categories.

3.2.1. Convolutional Layer

Any deep learning layer is called a convolutional layer when it performs at least one convolution operation on an image. It generates feature patterns and maps them. These maps generate unique patterns for input data that help to classify the data. The CNN contains a number of filters known as convolutional filters. The different sizes of these convolutional filters are 1 × 1, 3 × 3, and 5 × 5, where the number of filters corresponds to the number of output feature maps. The convolution operation is performed on 2D data. Therefore, it can be difficult to explain using text-based descriptions. The mathematical representation is shown in Equation (6) [43].
C i = i j k i , j C [ m j , n k ]
The output C i includes the feature maps assigned in this layer, where the indexes of rows and columns are represented by n and m, and the kernel K i , j is the window that iterates over the given input C i of the image. The kernel size is defined by an odd number (1, 3, 5, etc.). In the proposed method, the kernel size and number of filters vary, as further explained in Table 2.
Table 2 describes the 16 layers in the model with their corresponding weights and activations. Stride and padding are additional parameters that remain constant at [1 1] and [0 0 0 0], respectively, in all layers. Similarly, the kernel size for the pooling operation is [2 2] in both max and average pooling layers. Normally, the feature maps are returned from two types of layers, the convolutional layer and the fully connected layer, where batch normalization and ReLU are used to perform normalization and activation on output feature maps.

3.2.2. Batch Normalization

The batch normalization-based operational functionality is shown in Equation (7).
y i = x i μ B σ B 2 + e
The normalized output form is represented by y i , where i is the instance that is calculated over. x i is the input pattern that originates from the upper convolutional layer, where the mean and standard deviation (square root of variance) are calculated for a given batch, and e is added to avoid 0 and obtain a decimal value greater than 0.

3.2.3. Rectified Linear Unit (ReLU)

ReLU is much simpler than the convolution and batch normalization operations. It can be defined as a type of threshold operation that avoids negative and zero values from the incoming input and provides positive integer values to the next layer. Thus, we can simply write this operation as:
R e L U = max 0 , x { s u c h t h a t x = i n p u t }
The in-bound and out-bound range of a given batch is covered. Any negative values are removed from it.

3.2.4. Pooling Layers

Pooling is a method of downsampling the given input. In the proposed architecture, two types of pooling layers are used, and in the upper layers, max pooling is applied three times. Average pooling is applied at the end in the 4th pooling operation. The pooling window size is [2 2], which means that the maximum or average of 4 pixel positions is taken as the final output of that particular filter.
P o o l i n g = I F S + 1 x D
Equation (9) shows that the pooling output relies on the given input I, the number of filters F, the stride value S, and dimension D. The pooling output strongly depends on the stride value given in the layer. The stride is set to 2 in all pooling layers, which means that the image is downsampled to half of its original size.
Finally, the output is provided to a fully connected layer that is further connected to the softmax activation function, which assigns probabilistic values to the output. Probability-based classification is used in the next pixel classification layer to distinguish between fraud and non-fraud classes. We can also call this the fraud score. If we examine the number of class instances in the dataset, we can see that a significant class imbalance issue is created, which is addressed using the inverse frequency method, in which class weights based on the class frequency are assigned for pixel classification of the proposed CNN. These deep features are further fed into the machine learning classifiers.

3.2.5. Deep Features

The trained CNN model has many layers, and low-level, medium-level, and high-level deep features can be extracted from the trained model. We utilize the fully connected layer as the feature extractor layer and output the features of transformed data by splitting the data into training and testing sets in a 70/30 split ratio. The final fully connected layer in the proposed CNN has two lengths of feature maps. Therefore, the deep features of fraud and non-fraud outputs are in a feature vector with the size n × 2 .

3.2.6. Machine Learning-Based Classification

Deep learning and deep features [44] are extensively applied in many other applications [45,46,47,48]. By looking into their robustness in different aspects of complex problem solutions, the proposed methodology also applied them. However, the extracted output deep feature vector is fed into different machine learning classifiers with two validation schemes applied, namely, 10 and 5-fold cross-validation. Six different types of algorithms are applied to the input deep feature vector. Three variants of the nearest-neighbor method, fine-KNN, medium-KNN, and coarse-KNN; and three variants of ensemble methods, LP-boost, bagged-boost, and subspace ensemble boost, are used. With the 6 classification methods and 2 validation schemes, a total of 12 classification methods in the machine learning domain were used in this study to classify the transformed and transferred features.

4. Results and Discussion

Two methods were used to classify the data in the given dataset by converting text into image format. In particular, both deep and machine learning domains were tested on the proposed text2IMG conversion method. The classification results prove the robustness and confidence of the proposed method for credit card fraud detection.

4.1. Dataset Description

A public dataset [49] of credit card transaction records was utilized in this study. It contains 30 variables as features, including time and the amount that is being debited, to identify fraudulent and non-fraudulent transactions. The dataset was obtained in csv format, where the attribute class is given a value of 0 or 1 for non-fraudulent and fraudulent transactions, respectively. The dataset was then converted into (6 × 5)-dimensional images using the proposed text2IMG conversion method. The details of the dataset are described in Table 3.
Table 3 shows that the input data instances were the same before and after data conversion. No information or data were lost during the conversion of data.

4.2. Evaluation Measures

Several evaluation measures can be used to assess performance. These measures were used to evaluate the trained models in our study. We chose the most commonly used evaluation measures, namely, accuracy, sensitivity, and specificity. These evaluation measures can provide a more in-depth analysis of the predictive ability of the proposed models [50] and are expressed as:
A c c u r a c y = T P + T N T P + T N + F P + F N
S e n s i t i v i t y = T P T P + F N
S p e c i f i c i t y = T N F P + T N
In Equation (10), the general measures include four individual terms: true positives (TP), false positives (FP), true negatives (TN), and false negatives (FN). In the proposed method, the dataset must contain two types of classes, fraud and non-fraud. A TP indicates the correct classification of fraud. Similarly, a TN indicates the correct classification of a non-fraudulent transaction. An FP means that a non-fraud transaction was classified as fraud, whereas an FN indicates that fraud was classified as non-fraud.
Among these four terms, accuracy provides the most intuitive overall measure of the model’s predictive ability. In this measure, the numerator contains all correctly labeled positive and negative class instances. The second measure is sensitivity, which is the ratio of correctly labeled fraud instances over the sum of all actual fraud instances, regardless of whether or not they were correctly predicted. The third measure is specificity, which is a measure of the model’s ability to detect negative instances. It is calculated by dividing the number of correct non-fraud predictions by the sum of all actual non-fraud instances, regardless of whether or not they were correctly predicted.

4.3. CNN Classification Results

The proposed CNN uses data converted into images with the previously discussed layers and parameters. The training and testing data were divided in a 70/30 split ratio, and the fraud detection results on testing data were measured in terms of accuracy, sensitivity, and specificity.
Table 4 shows the three measures used to indicate the overall accuracy and the true positive and true negative prediction ratios. The table shows that the accuracy is higher than the sensitivity. However, these results are from tests on 30% of the data, which might not be highly reliable if big data are input. Although the proposed CNN does not achieve high classification scores for the detection of credit card fraud, the trained CNN extracts meaningful high-level features that can be used in the classification pipeline. These feature maps are transferred from the fully connected layer of the trained CNN model and further fed into classical machine learning classifiers.

4.4. Machine Learning Classification Results

Different types of training and testing variations of the given data can be used to test machine learning methods. Different data splits for cross-correlation can also be applied, but we opted to use 5 and 10-fold cross-validation. This removes any bias involved in the overfitting and underfitting of models, if present.
Table 5 shows the 5-fold-based predictions. The best accuracy was achieved by the KNN variants, as is also shown in the performance graphs in Figure 3. The accuracy values vary slightly but generally remain the same. For KNN methods, the accuracy ranges from 99.80% to 99.87%. However, the accuracy measure range changes for ensemble methods, varying from 80.29% to 99.85%, which is lower compared to the KNN variants. Sensitivity, also known as recall, is an important measure of the model’s ability to detect positive instances. Its low value compared to accuracy and specificity may be explained as follows. The F1-score is an important measure to look in regard to the class imbalance issue. Therefore, if we look at the CNN classified results, the 33.24% is low, whereas in the ML approaches, the F1-score is improved, the highest (57.31%) being achieved via Coarse-KNN. As previously discussed, there is a great class imbalance in the dataset. However, we attempted to solve this problem in the CNN by assigning weights to the classes by using the frequency of each class. Therefore, the CNN’s sensitivity is higher than those of the ML methods. If we look at specificity, we can see that it is slightly higher than the accuracy for all KNN variants and the two best-performing ensemble methods. This explains the rarity of false negatives in the results. Therefore, we can conclude that the model performs well in predicting the negative class. To discuss each class instance in the evaluation, we show a confusion matrix in Table 6 containing all of the above-discussed models.
As indicated in Table 6, among the KNN variants, Coarse-KNN performed the best (fraud case detection) with 249 correctly predicted instances, whereas Fine-KNN and Medium-KNN correctly predicted 210 and 219 instances of the fraud (positive) class, respectively. The ensemble method with the lowest accuracy had better sensitivity than all the KNN methods. Thus, LP-boost is not the worst method in terms of positive class predictions if we compare it to all KNN methods. Similarly, the better performing ensemble methods, the bagged and subspace classifiers, also achieved better results for positive class predictions, as they correctly predicted 264 and 270 instances of the positive class and thus outperformed KNN methods. Next, we explore the numbers of negative class predictions, which were overestimated. For KNN variant-based predictions of the negative class, only 285 class predictions were incorrect, whereas 284,030 were correctly predicted to be normal or non-fraudulent transactions. This number of correct predictions increased for Medium-KNN and Coarse-KNN, which correctly predicted 284,203 and 284,187, respectively, and they produced fewer incorrect predictions than Fine-KNN, with only 112 and 128 wrong predictions. However, if we look at ensemble method-based negative class predictions, then the situation is different. LP-boost has the worst results as compared to the other five classifiers, with 5591 wrong class predictions. However, the bagged and subspace ensemble methods produced 149 and 517 wrong predictions, respectively. It seems that the bagged-boost ensemble method performed best among the ensemble methods, and of all six classifiers, Medium-KNN provided the fewest incorrect predictions of the negative class. To cross-check the robustness of the classifiers, 10-fold validation was also applied to the given set of deep features. The 5-fold prediction results for the six classification methods are presented in Figure 3.
The 10-fold-based results of the same six classification methods are shown in Table 7. Increasing the number of folds means that the confidence of the validation method also increases. If using more folds enhances the confidence of the classifiers, then the accuracy is expected to decrease, but in this case, the accuracy increased for all six classifiers. This suggests that more data require more folds of validation for training and testing, which will ultimately enhance the validation results. For example, the method with the worst accuracy in the 5-fold method improved its accuracy from 80.29 to 90.75, an almost 10% increase. Therefore, we consider this to support our argument. However, let us look at the other 10-fold evaluation measures as compared to 5-fold measures. The sensitivity value increased for all KNN variants, meaning that using more folds not only increased the accuracy of these methods, but also improved their sensitivity. However, the ensemble methods did not show this increase in sensitivity. The specificity values of all six classifiers remained almost the same in both 5 and 10-fold validation. The F1-scores slightly improved as compared to 5-Fold methods, as the F1-score of Coarse-KNN was improved from 57.31% to 57.80%. Kappa is a statistical measure that provides the level of agreement on data integrity. The maximum kappa value achieved in the 5-fold method was 0.5725, which indicates a low level of agreement on data integrity, as the data have a great class imbalance. With the 10-fold method, Coarse-KNN achieved the highest kappa value of 0.5773, which is slightly higher than in the 5-fold case. A plot is shown in Figure 4 for all of these values.
Overall, we can conclude that more data require more folds, which will ultimately improve the evaluation measures.
In Table 8, the confusion matrix of all classification methods using 10-fold validation is shown. Fine-KNN had 215 correct predictions of the positive class (fraud). Medium-KNN and Coarse-KNN achieved better results than Fine-KNN, with 222 and 252 correct predictions. Among the negative class instances predicted by KNN variants, 275, 112, and 128 were incorrect predictions, whereas correct predictions were large in number. The overall performances of KNN variants in predicting the positive class were better using the 10-fold method compared to the 5-fold method.
The ensemble methods correctly predicted 255, 231, and 249 instances of fraud, which was an improvement for bagged-ensemble but not for the other two methods. Among 26,104 negative instance predictions, 137 and 413 were incorrectly predicted with bagged and subspace ensemble methods, which was an improvement. If we analyze the overall results for positive and negative instances, then we can confirm that the results support our hypothesis above: that big data might need more folds for training and testing on positive and negative classes.

5. Conclusions

In previous studies, thousands of approaches have been used on the fraud detection datasets, and some even achieved 100% accurate results with solutions to class imbalance issues. However, the proposed method is a different approach to credit card fraud detection. A novel approach using text2IMG conversion was proposed herein, and it achieved promising credit card fraud detection results. This method provides a new dimension to credit card fraud detection using computer vision techniques and offers future directions to convert other types of text data into images, enabling the classification of data with unique patterns. Many feature engineering approaches are applied to credit card fraud detection to identify new distinguishing features, and this study also proposes new features in this domain.
In the future, the text2IMG-based classification method could be applied to similar credit card fraud detection problems or other text datasets. The inverse frequency method for class imbalancewas used in this study, and further class-imbalance methods could be used in future. The deep features could also be applied to machine learning-based classification methods, which would not reduce the time complexity but would reduce the space complexity. Furthermore, if a text dataset is limited, augmentation techniques can also be applied.

Author Contributions

Conceptualization, A.A. (Abdullah Alharbi), M.A., O.D.O. and A.A. (Amerah Alabrah); funding acquisition, A.A. (Abdullah Alharbi), M.A. and H.A.; methodology, A.A. (Abdullah Alharbi), M.A., O.D.O., A.A. (Amerah Alabrah), H.T.R., H.A. and T.M.; software, A.A. (Abdullah Alharbi), M.A., O.D.O., A.A. (Amerah Alabrah), H.T.R., H.A. and T.M.; writing—original draft, A.A. (Abdullah Alharbi), M.A., O.D.O., A.A. (Amerah Alabrah), H.T.R., H.A. and T.M. All authors have read and agreed to the published version of the manuscript.

Funding

This research was supported by Researchers Supporting Project number (TURSP-2020/231), Taif University, Taif, Saudi Arabia.

Institutional Review Board Statement

Not applicable.

Informed Consent Statement

Not applicable.

Data Availability Statement

Not applicable.

Acknowledgments

We deeply acknowledge Taif University for Supporting this research through Taif University Researchers Supporting Project number (TURSP-2020/231), Taif University, Taif, Saudi Arabia.

Conflicts of Interest

The authors declare that there is no conflict of interest.

References

  1. Pease, K. Crime futures and foresight. In Crime and the Internet; Taylor & Francis: Boca Raton, FL, USA, 2022; pp. 18–28. [Google Scholar] [CrossRef]
  2. Padgett, S. About the association of certified fraud examiners and the report to the nations on occupational fraud and abuse. Profiling Fraud. 2015, 239–242. Available online: https://0-onlinelibrary-wiley-com.brum.beds.ac.uk/doi/10.1002/9781118929773.oth1 (accessed on 1 February 2022).
  3. Makki, S.; Assaghir, Z.; Taher, Y.; Haque, R.; Hacid, M.S.; Zeineddine, H. An experimental study with imbalanced classification approaches for credit card fraud detection. IEEE Access 2019, 7, 93010–93022. [Google Scholar] [CrossRef]
  4. Kültür, Y.; Çağlayan, M.U. Hybrid approaches for detecting credit card fraud. Expert Syst. 2017, 34, e12191. [Google Scholar] [CrossRef]
  5. Lal, S.; Rehman, S.U.; Shah, J.H.; Meraj, T.; Rauf, H.T.; Damaševičius, R.; Mohammed, M.A.; Abdulkareem, K.H. Adversarial Attack and Defence through Adversarial Training and Feature Fusion for Diabetic Retinopathy Recognition. Sensors 2021, 21, 3922. [Google Scholar] [CrossRef] [PubMed]
  6. Alharbi, A.; Alosaimi, W.; Alyami, H.; Rauf, H.T.; Damaševičius, R. Botnet Attack Detection Using Local Global Best Bat Algorithm for Industrial Internet of Things. Electronics 2021, 10, 1341. [Google Scholar] [CrossRef]
  7. Caron, M.; Bojanowski, P.; Joulin, A.; Douze, M. Deep clustering for unsupervised learning of visual features. In Proceedings of the European Conference on Computer Vision (ECCV), Munich, Germany, 8–14 September 2018; pp. 132–149. [Google Scholar]
  8. Zareapoor, M.; Shamsolmoali, P. Application of credit card fraud detection: Based on bagging ensemble classifier. Procedia Comput. Sci. 2015, 48, 679–685. [Google Scholar] [CrossRef] [Green Version]
  9. Lever, J.; Krzywinski, M.; Altman, N. Classification evaluation. Nat. Methods 2016, 13, 603–604. [Google Scholar] [CrossRef]
  10. Hussein, K.W.; Sani, N.F.M.; Mahmod, R.; Abdullah, M.T. Enhance Luhn algorithm for validation of credit cards numbers. Int. J. Comput. Sci. Mob. Comput. 2013, 2, 262–272. [Google Scholar]
  11. Laleh, N.; Azgomi, M.A. A taxonomy of frauds and fraud detection techniques. In International Conference on Information Systems, Technology and Management; Springer: Berlin/Heidelberg, Germany, 2009; pp. 256–267. [Google Scholar]
  12. Naz, M.; Shah, J.H.; Khan, M.A.; Sharif, M.; Raza, M.; Damaševičius, R. From ECG signals to images: A transformation based approach for deep learning. Peerj Comput. Sci. 2021, 7, e386. [Google Scholar] [CrossRef]
  13. Wang, S.; Liu, G.; Li, Z.; Xuan, S.; Yan, C.; Jiang, C. Credit card fraud detection using capsule network. In Proceedings of the 2018 IEEE International Conference on Systems, Man, and Cybernetics (SMC), Miyazaki, Japan, 7–10 October 2018; pp. 3679–3684. [Google Scholar]
  14. Li, Z.; Huang, M.; Liu, G.; Jiang, C. A hybrid method with dynamic weighted entropy for handling the problem of class imbalance with overlap in credit card fraud detection. Expert Syst. Appl. 2021, 175, 114750. [Google Scholar] [CrossRef]
  15. Forough, J.; Momtazi, S. Ensemble of deep sequential models for credit card fraud detection. Appl. Soft Comput. 2021, 99, 106883. [Google Scholar] [CrossRef]
  16. Asha, R.; Kr, S.K. Credit card fraud detection using artificial neural network. Glob. Trans. Proc. 2021, 2, 35–41. [Google Scholar]
  17. Forestiero, A. Metaheuristic algorithm for anomaly detection in Internet of Things leveraging on a neural-driven multiagent system. Knowl. Based Syst. 2021, 228, 107241. [Google Scholar] [CrossRef]
  18. Forestiero, A. Self-organizing anomaly detection in data streams. Inf. Sci. 2016, 373, 321–336. [Google Scholar] [CrossRef]
  19. Xuan, S.; Liu, G.; Li, Z.; Zheng, L.; Wang, S.; Jiang, C. Random forest for credit card fraud detection. In Proceedings of the 2018 IEEE 15th International Conference on Networking, Sensing and Control (ICNSC), Zhuhai, China, 27–29 March 2018; pp. 1–6. [Google Scholar]
  20. Prusti, D.; Das, D.; Rath, S.K. Credit Card Fraud Detection Technique by Applying Graph Database Model. Arab. J. Sci. Eng. 2021, 46, 1–20. [Google Scholar] [CrossRef]
  21. Kannagi, A.; Mohammed, J.G.; Murugan, S.S.G.; Varsha, M. Intelligent mechanical systems and its applications on online fraud detection analysis using pattern recognition K-nearest neighbor algorithm for cloud security applications. Mater. Today Proc. 2021. [Google Scholar] [CrossRef]
  22. Sudha, C.; Akila, D. Majority vote ensemble classifier for accurate detection of credit card frauds. Mater. Today Proc. 2021. [Google Scholar] [CrossRef]
  23. Baesens, B.; Höppner, S.; Verdonck, T. Data engineering for fraud detection. Decis. Support Syst. 2021, 150, 113492. [Google Scholar] [CrossRef]
  24. Seera, M.; Lim, C.P.; Kumar, A.; Dhamotharan, L.; Tan, K.H. An intelligent payment card fraud detection system. Ann. Oper. Res. 2021, 1–23. [Google Scholar] [CrossRef]
  25. Darwish, S.M. A bio-inspired credit card fraud detection model based on user behavior analysis suitable for business management in electronic banking. J. Ambient. Intell. Humaniz. Comput. 2020, 11, 4873–4887. [Google Scholar] [CrossRef]
  26. Itoo, F.; Singh, S. Comparison and analysis of logistic regression, Naïve Bayes and KNN machine learning algorithms for credit card fraud detection. Int. J. Inf. Technol. 2020, 13, 1503–1511. [Google Scholar] [CrossRef]
  27. Zhu, H.; Liu, G.; Zhou, M.; Xie, Y.; Abusorrah, A.; Kang, Q. Optimizing Weighted Extreme Learning Machines for imbalanced classification and application to credit card fraud detection. Neurocomputing 2020, 407, 50–62. [Google Scholar] [CrossRef]
  28. Lucas, Y.; Portier, P.E.; Laporte, L.; He-Guelton, L.; Caelen, O.; Granitzer, M.; Calabretto, S. Towards automated feature engineering for credit card fraud detection using multi-perspective HMMs. Future Gener. Comput. Syst. 2020, 102, 393–402. [Google Scholar] [CrossRef]
  29. Rtayli, N.; Enneya, N. Enhanced credit card fraud detection based on SVM-recursive feature elimination and hyper-parameters optimization. J. Inf. Secur. Appl. 2020, 55, 102596. [Google Scholar] [CrossRef]
  30. Gianini, G.; Fossi, L.G.; Mio, C.; Caelen, O.; Brunie, L.; Damiani, E. Managing a pool of rules for credit card fraud detection by a Game Theory based approach. Future Gener. Comput. Syst. 2020, 102, 549–561. [Google Scholar] [CrossRef]
  31. Bagga, S.; Goyal, A.; Gupta, N.; Goyal, A. Credit Card Fraud Detection using Pipeling and Ensemble Learning. Procedia Comput. Sci. 2020, 173, 104–112. [Google Scholar] [CrossRef]
  32. Fiore, U.; De Santis, A.; Perla, F.; Zanetti, P.; Palmieri, F. Using generative adversarial networks for improving classification effectiveness in credit card fraud detection. Inf. Sci. 2019, 479, 448–455. [Google Scholar] [CrossRef]
  33. Carcillo, F.; Le Borgne, Y.A.; Caelen, O.; Kessaci, Y.; Oblé, F.; Bontempi, G. Combining unsupervised and supervised learning in credit card fraud detection. Inf. Sci. 2019, 557, 317–331. [Google Scholar] [CrossRef]
  34. Zhang, X.; Han, Y.; Xu, W.; Wang, Q. HOBA: A novel feature engineering methodology for credit card fraud detection with a deep learning architecture. Inf. Sci. 2019, 557, 302–316. [Google Scholar] [CrossRef]
  35. Kim, E.; Lee, J.; Shin, H.; Yang, H.; Cho, S.; Nam, S.K.; Song, Y.; Yoon, J.A.; Kim, J.I. Champion-challenger analysis for credit card fraud detection: Hybrid ensemble and deep learning. Expert Syst. Appl. 2019, 128, 214–224. [Google Scholar] [CrossRef]
  36. Li, Z.; Liu, G.; Jiang, C. Deep representation learning with full center loss for credit card fraud detection. IEEE Trans. Comput. Soc. Syst. 2020, 7, 569–579. [Google Scholar] [CrossRef]
  37. Liang, Y.; Li, M.; Jiang, C.; Liu, G. CEModule: A Computation Efficient Module for Lightweight Convolutional Neural Networks. IEEE Trans. Neural Netw. Learn. Syst. 2021. [Google Scholar] [CrossRef] [PubMed]
  38. Qin, Y.; Yan, C.; Liu, G.; Li, Z.; Jiang, C. Pairwise Gaussian loss for convolutional neural networks. IEEE Trans. Ind. Inform. 2020, 16, 6324–6333. [Google Scholar] [CrossRef]
  39. Tian, Y.; Liu, G. MANE: Model-agnostic non-linear explanations for deep learning model. In Proceedings of the 2020 IEEE World Congress on Services (SERVICES), 18–23 October 2020; pp. 33–36. [Google Scholar]
  40. Kim, J.; Kim, H.J.; Kim, H. Fraud detection for job placement using hierarchical clusters-based deep neural networks. Appl. Intell. 2019, 49, 2842–2861. [Google Scholar] [CrossRef]
  41. Zhang, F.; Liu, G.; Li, Z.; Yan, C.; Jiang, C. GMM-based undersampling and its application for credit card fraud detection. In Proceedings of the 2019 International Joint Conference on Neural Networks (IJCNN), Budapest, Hungary, 14–19 July 2019; pp. 1–8. [Google Scholar]
  42. Wallace, G.K. The JPEG still picture compression standard. IEEE Trans. Consum. Electron. 1992, 38, xviii–xxxiv. [Google Scholar] [CrossRef]
  43. Albawi, S.; Mohammed, T.A.; Al-Zawi, S. Understanding of a convolutional neural network. In Proceedings of the 2017 International Conference on Engineering and Technology (ICET), Antalya, Turkey, 21–23 August 2017; pp. 1–6. [Google Scholar]
  44. Mahum, R.; Rehman, S.U.; Meraj, T.; Rauf, H.T.; Irtaza, A.; El-Sherbeeny, A.M.; El-Meligy, M.A. A novel hybrid approach based on deep cnn features to detect knee osteoarthritis. Sensors 2021, 21, 6189. [Google Scholar] [CrossRef] [PubMed]
  45. Meraj, T.; Rauf, H.T.; Zahoor, S.; Hassan, A.; Lali, M.I.; Ali, L.; Bukhari, S.A.C.; Shoaib, U. Lung nodules detection using semantic segmentation and classification with optimal features. Neural Comput. Appl. 2021, 33, 10737–10750. [Google Scholar] [CrossRef]
  46. Mostafa, A.M.; Kumar, S.A.; Meraj, T.; Rauf, H.T.; Alnuaim, A.A.; Alkhayyal, M.A. Guava Disease Detection Using Deep Convolutional Neural Networks: A Case Study of Guava Plants. Appl. Sci. 2022, 12, 239. [Google Scholar] [CrossRef]
  47. Manzoor, K.; Majeed, F.; Siddique, A.; Meraj, T.; Rauf, H.T.; El-Meligy, M.A.; Sharaf, M.; Abd Elgawad, A.E.E. A Lightweight Approach for Skin Lesion Detection Through Optimal Features Fusion. CMC-Comput. Mater. Contin. 2022, 70, 1617–1630. [Google Scholar] [CrossRef]
  48. Alabrah, A.; Alawadh, H.M.; Okon, O.D.; Meraj, T.; Rauf, H.T. Gulf Countries’ Citizens’ Acceptance of COVID-19 Vaccines—A Machine Learning Approach. Mathematics 2022, 10, 467. [Google Scholar] [CrossRef]
  49. Machine Learning Group—ULB. Credit Card Fraud Detection. 2018. Available online: https://www.kaggle.com/mlg-ulb/creditcardfraud/home (accessed on 1 February 2022).
  50. Hossin, M.; Sulaiman, M.N. A review on evaluation metrics for data classification evaluations. Int. J. Data Min. Knowl. Manag. Process 2015, 5, 1. [Google Scholar]
Figure 1. Flowchart of proposed framework.
Electronics 11 00756 g001
Figure 2. The proposed 16-layer CNN architecture.
Electronics 11 00756 g002
Figure 3. Results of 5-fold predictions using 6 classification methods.
Electronics 11 00756 g003
Figure 4. Results of 10-fold predictions using 6 classification methods.
Electronics 11 00756 g004
Table 1. Summary of recent studies based on computer vision for credit card fraud detection.
Ref.DatasetMethodsEvaluation MetricAccuracy
[14]Real electronic transaction dataset and Kaggle fraud detection datasetHybrid method with dynamic weighted entropyDynamic Weighted Entropy (DWE)Achieved promising results
[15]European cards dataset, Brazilian datasetSequential modeling-based ensemble modelPrecision, recall, F1, AUC-ROC, and AUC-PRShowed optimum results for every evaluation metric
[16]Kaggle datasetArtificial neural networkAccuracy, precision, and recallAccuracy approximately equal to 100%
[20]BankSim datasetGraph database modelAccuracy and recall99.541% accuracy, 83.397% recall
[21]Real-world bank datasetPattern Recognition K-Nearest Neighbor (PR-KNN)Time complexity54-second PR-KNN
[22]Real dataset from Bestpay digital imbursement platformMajority vote ensemble classifierAccuracyMVE classifier showed highly accurate results
[23]SMOTE, ADASYN, MWMOTE, and ROSEData engineeringPrecision, recall, F1, FPR, AUPRC, and savingsAchieved satisfying results
[24]Australian dataset13 statistical and machine learning modelsAccuracy99.8%
[25]Real datasetEnhanced two-level credit card fraud tracking modelAccuracyAchieved highly accurate results
[26]Skewed datasetK-nearest neighbor, naive Bayes, and logistic regressionArea under the curve, F-measure, precision, specificity, sensitivity, and accuracyObtained promising results
[27]14 imbalanced datasetsWELMAccuracy, precision, recall, f1, AUC, and G-meanShowed high detection performance
[28]Real-world datasetHidden Markov Model (HMM)AccuracyShowed reliable outcomes
[29]Real-world datasetsHybrid-based Credit Card Fraud Detection (CCFD)Accuracy, sensitivity, AUPR, performanceAchieved satisfying results
[30]Real-world datasetGame theory-based approachPerformanceShowed better performance than traditional approaches
[31]Real-world datasetPipelining and ensemble learningAccuracy, precision, recall, and F1Showed optimal results for every evaluation metric
[32]Aboveboard datasetsGenerative adversarial networksF-measure, precision, specificity, sensitivity, and accuracyAchieved promising results
[33]Real, annotated datasetsHybrid approachAccuracy, precision, recall, and F1Showed reliable outcomes
[34]Extensive dataset of a bank in ChinaHomogeneity-oriented behavior analysis (HOBA)Accuracy, precision, recall, and F1Showed efficient fraud detection results
[35]Dataset of a card distribution organization in South KoreaChampion-challengerPrecision, recall, F1, AUC-ROC, and AUC-PRShowed better performance than traditional approaches
[40]Employment agency datasetHierarchical clusters-based deep neural networksAccuracy, precision, recall, and F1Showed robust results for every evaluation metric
Table 2. The proposed CNN architecture and its parameters.
Serial NumberName of LayerActivationsWeights
1Input6 × 5 × 1-
2Convolution_16 × 5 × 301 × 1 × 1 × 30
3Batch_Normalization_16 × 5 × 301 × 1 × 30
4ReLU_16 × 5 × 30-
5Max_Pooling_15 × 4 × 30-
6Convolution_25 × 4 × 302 × 2 × 30 × 15
7Batch_Normalization_25 × 4 × 151 × 1 × 15
8ReLU_25 × 4 × 15-
9Max_Pooling_24 × 3 × 15-
10Convolution_34 × 3 × 103 × 3 × 15 × 10
11Batch_Normalization_34 × 3 × 101 × 1 × 10
12ReLU_34 × 3 × 10-
13Average_Pool_13 × 2 × 10-
14Fully_Connected_11 × 1 × 2-
15Softmax1 × 1 × 2-
16Class_Output--
Table 3. Input data before and after processing.
DatasetsInstancesFormatCategories
European Credit Card Data284,807TextAll
492TextFraud
284,315TextNon-Fraud
Text2IMG Converted Data284,807JPGAll
492TextFraud
284,315JPGNon-Fraud
Table 4. Prediction results of proposed CNN on testing data.
ClassesAccuracySensitivitySpecificityF1-Score
Overall99.4677.7099.5033.24
Table 5. Results of 5-fold predictions using deep features.
MethodsAccuracySensitivitySpecificityF1-ScoreKappa
Fine-KNN99.8042.6899.9042.550.4245
Medium-KNN99.8644.5199.9653.220.5315
Coarse-KNN99.8750.6199.9557.310.5725
LP-Boost Ensemble80.2953.2580.330.920.0058
Bagged-Boost Ensemble99.8546.3499.9552.470.5240
Subspace Ensemble99.7454.8899.8242.220.4210
Table 6. Confusion matrix of 5-fold classification methods on transformed data.
Fine-KNNMedium-KNNCoarse-KNNLP-Boost EnsembleBagged-Boost EnsembleSubspace Ensemble
ClassesFNFFNFFNFFNFFNFFNF
F210282219273249243262230228264270222
NF2885284,030112284,203128284,18755,911228,404149284,166517283,798
Table 7. Results of 10-fold predictions using deep features.
MethodsAccuracySensitivitySpecificityF1-ScoreKappa
Fine-KNN99.8143.7099.9043.790.4369
Medium-KNN99.8745.1299.9653.750.5369
Coarse-KNN99.8751.2299.9557.800.5773
LP-Boost Ensemble90.7551.8390.820.970.0157
Bagged-Boost Ensemble99.8646.9599.9553.720.5365
Subspace Ensemble99.7750.6199.8543.150.4304
Table 8. Confusion matrix of 10-fold classification methods on transformed data.
Fine-KNNMedium-KNNCoarse-KNNLP-Boost EnsembleBagged-BoostSubspace Ensemble
ClassesFNFFNFFNFFNFFNFFNF
F215277222270252240255237231261249243
NF275284,040112284,203128284,18726104258,211137284,178413283,902
Publisher’s Note: MDPI stays neutral with regard to jurisdictional claims in published maps and institutional affiliations.

