
Attack Graph Generation with Machine Learning for Network Security †


1
Network & System Security Research Section, Electronics and Telecommunications Research Institute (ETRI), Daejeon 34129, Korea
2
Department of Data Science, Korea Maritime and Ocean University, Busan 49112, Korea
3
School of Creative Convergence, Andong National University, Andong 36729, Korea
*
Authors to whom correspondence should be addressed.
†
This paper is an extended version of a conference paper published in Koo, K.; Moon, D.; Jung, S.-H.; Lee, H. Attack Graph Learning with Machine Learning. In Proceedings of the 16th International Conference on Multimedia Information Technology and Applications (MITA 2020), Yeosu, Korea, 20–21 November 2020.
Electronics 2022, 11(9), 1332; https://0-doi-org.brum.beds.ac.uk/10.3390/electronics11091332
Submission received: 25 March 2022
/
Revised: 18 April 2022
/
Accepted: 19 April 2022
/
Published: 22 April 2022
(This article belongs to the Special Issue Applications of Smart Internet of Things)
Abstract
:Recently, with the discovery of various security threats, diversification of hacking attacks, and changes in the network environment such as the Internet of Things, security threats on the network are increasing. Attack graph is being actively studied to cope with the recent increase in cyber threats. However, the conventional attack graph generation method is costly and time-consuming. In this paper, we propose a cheap and simple method for generating the attack graph. The proposed approach consists of learning and generating stages. First, it learns how to generate an attack path from the attack graph, which is created based on the vulnerability database, using machine learning and deep learning. Second, it generates the attack graph using network topology and system information with a machine learning model that is trained with the attack graph generated from the vulnerability database. We construct the dataset for attack graph generation with topological and system information. The attack graph generation problem is recast as a multi-output learning and binary classification problem. It shows attack path detection accuracy of 89.52% in the multi-output learning approach and 80.68% in the binary classification approach using the in-house dataset, respectively.
1. Introduction
Intelligent targeted attacks such as advanced persistent threat (APT) identify vulnerabilities and use them to damage target systems by intelligently and continuously collecting information about a single target with a special purpose [1,2,3]. These kinds of attacks are the most damaging and worrying type of attack because they are difficult to detect and are continuously attempted [4,5,6,7,8]. These attacks come through the vulnerable system in the network, and even if the system containing important assets is primarily protected from the attacker, the system cannot be protected if it is accessible through the vulnerable system inside the network [4,5,6,7,8,9,10,11,12].
Recently, in particular, as the Internet of Things (IoT) has been widely used, more and more vulnerable systems have proliferated inside the network [9,10,11,12,13]. As the risk of cyberattacks increases, companies and institutions are introducing various security systems to protect information assets, and are making efforts to maintain a safe network. However, responding to the latest attack types that are continuously evolving and developing still remain a difficult problem [2,3,8,9,10,11,12]. In particular, the exponentially increasing vulnerabilities of the latest systems are becoming obstacles in keeping the system safe from cyberattacks.
To resolve the aforementioned problems, attack graph technology which predicts the attack path of an attacker is being actively studied. Its main purpose is to predict the attack path and identify the potential attack path from the attacker’s point of view [14,15,16,17,18,19,20,21,22,23]. Through the identification of the attack path, it can help the administrator to identify the target to be protected by focusing first on various information assets in the network system. However, in order to generate an attack graph, not only network topology and system information, but also a vulnerability database must be built in advance, which is a costly and labor-intensive task. In addition, in order to generate an attack graph, a large amount of computation is required because cross-correlation must be calculated for all systems (nodes) connected to the network. Therefore, research on a new attack graph generation method is required to predict possible attack paths and identify potential attack paths by generating an attack graph at low cost based on artificial intelligence techniques. Research and development for a system that generates attack graphs at low cost by introducing artificial intelligence techniques is still in the growing phase [22,24,25,26,27,28,29,30,31,32].
This paper proposes a novel approach for the attack graph generation model using topology and system information, which is trained to predict the attack path with the attack graph generated from the vulnerability database. Once trained, the proposed model generates the attack graph by means of predicting the attack path using only topology and system information. First, we propose a feature extraction and expression method for learning an attack graph generation model using network topology information, system information, and attack path information. Second, we recast an attack graph generation problem as a problem of multi-output learning and binary classification problems. We then employ the machine learning and deep learning models for training the attack graph, which are created based on the vulnerability database, and generate the attack graph. Finally, we present a quantitative and qualitative evaluation metric of the attack path predicted through the attack graph generation model. The proposed approach achieved attack path prediction accuracy of 89.52% in multi-output learning and 80.68% in binary classification with the in-house dataset.
The rest of this paper is organized as follows. In Section 2, we provide the related works. In Section 3, we then propose the attack graph training and generation model based on multi-output learning and binary classification. Experimental results and explanations are provided in Section 4. In Section 5, we present discussions of the proposed approach. Finally, some concluding remarks are given in Section 6.
2. Related Works
In this section, we summarize a literature review that is closely related to this study. This provides basic information on the attack graph generation model and the theoretical background for this paper. It consists of the attack graph generation model, machine learning and deep learning for supporting attack graph training and generation, and the evaluation metrics for attack graph training and generation.
2.1. Attack Graph Generation Model
H.S. Lallie et al., described how attack graphs and attack trees represent cyberattacks in terms of visual syntax in [33]. They showed that although there are many advantages to displaying cyberattacks as an attack graph or attack tree, there is an inconsistency regarding the way cyberattacks are represented in attack graphs and attack trees. Through this, the necessity of visual standardization was explained. This is the first paper to present a detailed critical analysis of the visual syntax of attack modeling techniques. B. Che et al. [34] proposed an estimation mechanism for evaluating the core nodes of IoT systems based on the attack graph. The estimation of the main node includes two parts. One is the utilization relationship between nodes, and the other is the effect on the system after the node is attacked. They quantify these two parts using the node importance value and the node risk value. First, the node importance value is calculated by considering the attack path through the node and the probability that the attacker will give up the attack. Second, they proposed two quantitative indicators to comprehensively evaluate the impact of a node on system security in addition to node vulnerability and attack results, and calculate the node risk value based on the gray correlation analysis method. Third, the core node of the IoT system can be obtained by integrating the node importance value and risk value. J. Zeng et al., introduced the basic concepts of attack graphs, their creation methods, and computational operations in [35]. In addition, they described several types of attack graph analysis methods such as graph-based methods, Bayesian-network-based methods, Markov-model-based methods, cost optimization methods, and uncertainty analysis methods. They provided the basic idea of this study, provided their own research framework, and introduced various methodologies through it.
2.2. Machine Learning and Deep Learning for Supporting Attack Graph Training/Generation
D. Xu et al. [36] presented various research trends on multi-output leaning. They presented the rationale to support the definition of the problem to be solved in this paper. The learning approach of the attack graph introduced in this paper can be defined as a multi-output learning problem, and various machine learning and deep learning problems can be redefined as a multi-output learning problem. The goal of multi-output learning is to simultaneously predict multiple outputs given an input. This is an important learning problem for decision-making, as it involves many complex factors and criteria for making decisions in the real world. Classic cases of multi-output learning include multi-label learning, multi-dimensional learning, and multi-object regression. Through a comprehensive review and analysis of the multiple-output learning paradigm, they present the key mathematical definitions of multiple-output learning, and present the major challenges in the field and corresponding solutions found in the literature. Among the problems of multiple-output learning, various methodologies of the multiple-output regression approach were introduced in [37]. In recent years, many approaches have been proposed to deal with the increasingly demanding multi-output regression task. They introduced various methodologies for state-of-the-art multiple-output regression methods that are classified as problem transformation and algorithm adaptation methods. They also provided information on the most popular performance evaluation measures, publicly available datasets for multi-output regression real-world problems, and open source software frameworks.
2.3. Evaluation Metrics for Attack Graph Training/Generation
D. Xu et al. [36] introduced metrics to evaluate the performance of multi-output learning. In this paper, the problem of learning how to generate an attack graph is defined as a multi-output learning problem. Therefore, the performance evaluation method of multi-output learning is used as basic data that can be referenced in presenting the performance evaluation method for the method proposed in this paper. They divided metrics into classification-based metric and regression-based metric. They introduced various performance evaluation methods such as example-based metrics including hamming loss, label-based metrics including macro averaging and micro averaging, mean absolute error (MAE), mean squared error (MSE), and average correlation coefficient (ACC).
3. Attack Graph Generation Model Based on Machine Learning
3.1. Feature Extraction and Presentation Method for Attack Graph Model Learning
3.1.1. Data Collection and Processing Containing Network Phase Information, System Information, and Attack Path Information
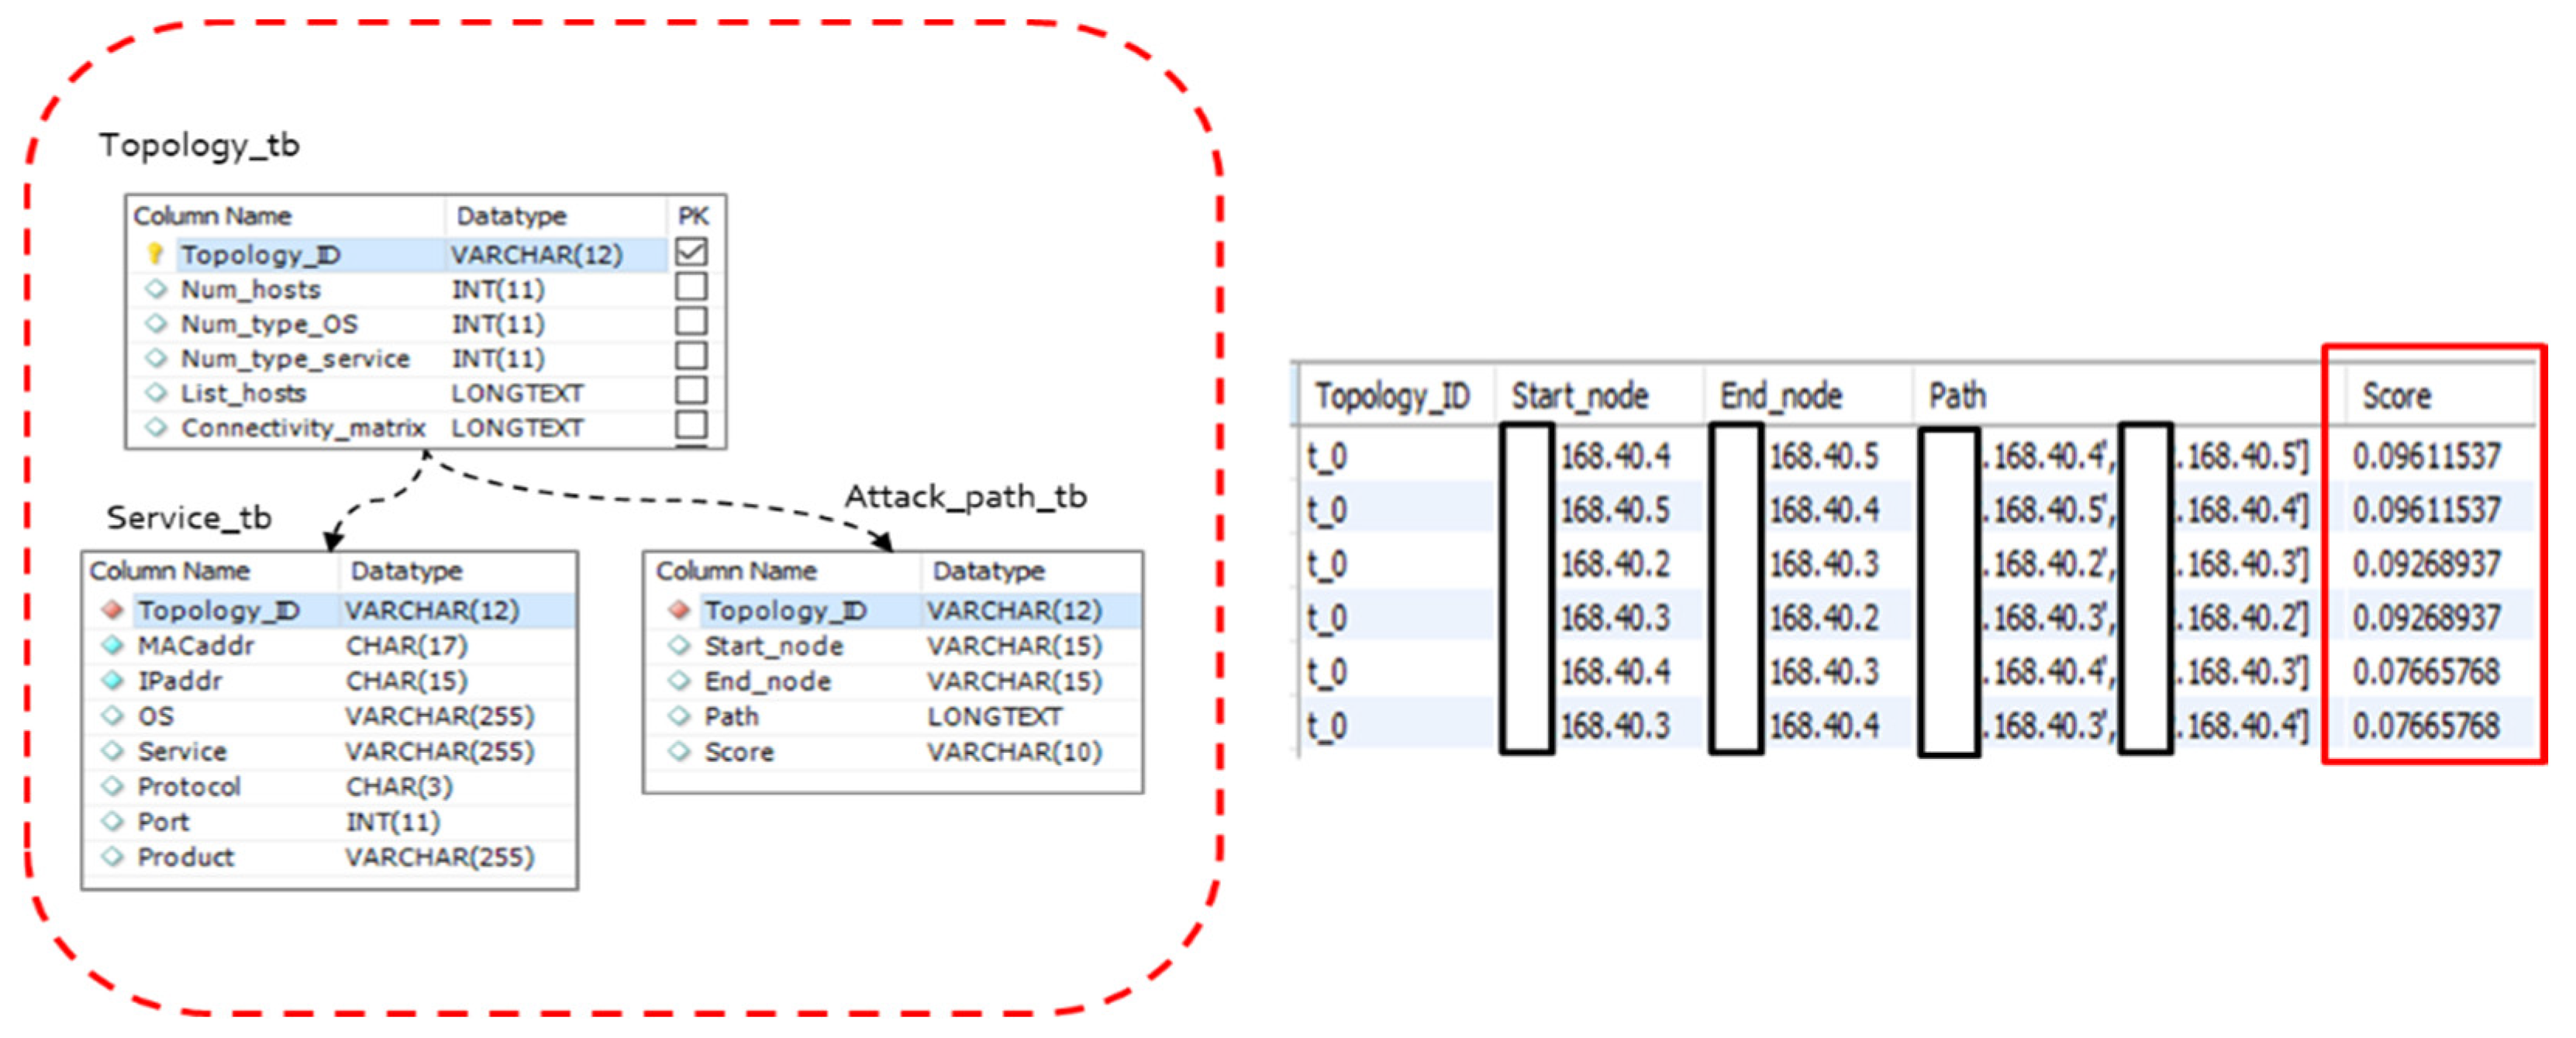
Data are collected about topology and asset information needed to predict the offensive vulnerabilities of or vulnerabilities to cyberattacks targeting a computer network [2]. Collected topology and asset information is saved in a database within an attack graph. The data undergo the preprocessing stage so that they can be used by a machine learning model. In data preprocessing, the texts of the data are converted into numbers, and the rows of numbers are converted into matrixes that can express network connectivity. Randomly generated topology is mapped against a prediction-based attack path and then saved in a database along with the asset information of each topology. Also saved in the database are edges between hosts (e.g., the flow of packets), vulnerability points of each host, and paths generated based on predictions. The topology of a computer network is organized in a virtual environment with the asset information of each host (or network device) randomly organized in a virtual topology to predict the offensive vulnerabilities to a cyberattack of a computer network built virtually. The asset information of a host includes the operating system of the host and the service run on the host. Prediction-based attack paths are based on the right answer data of the asset information of topologies or hosts included in a topology. Topology and asset information is matched to its corresponding prediction-based attack path before being saved in a database. Figure 1 shows the concept map of data collection and processing.
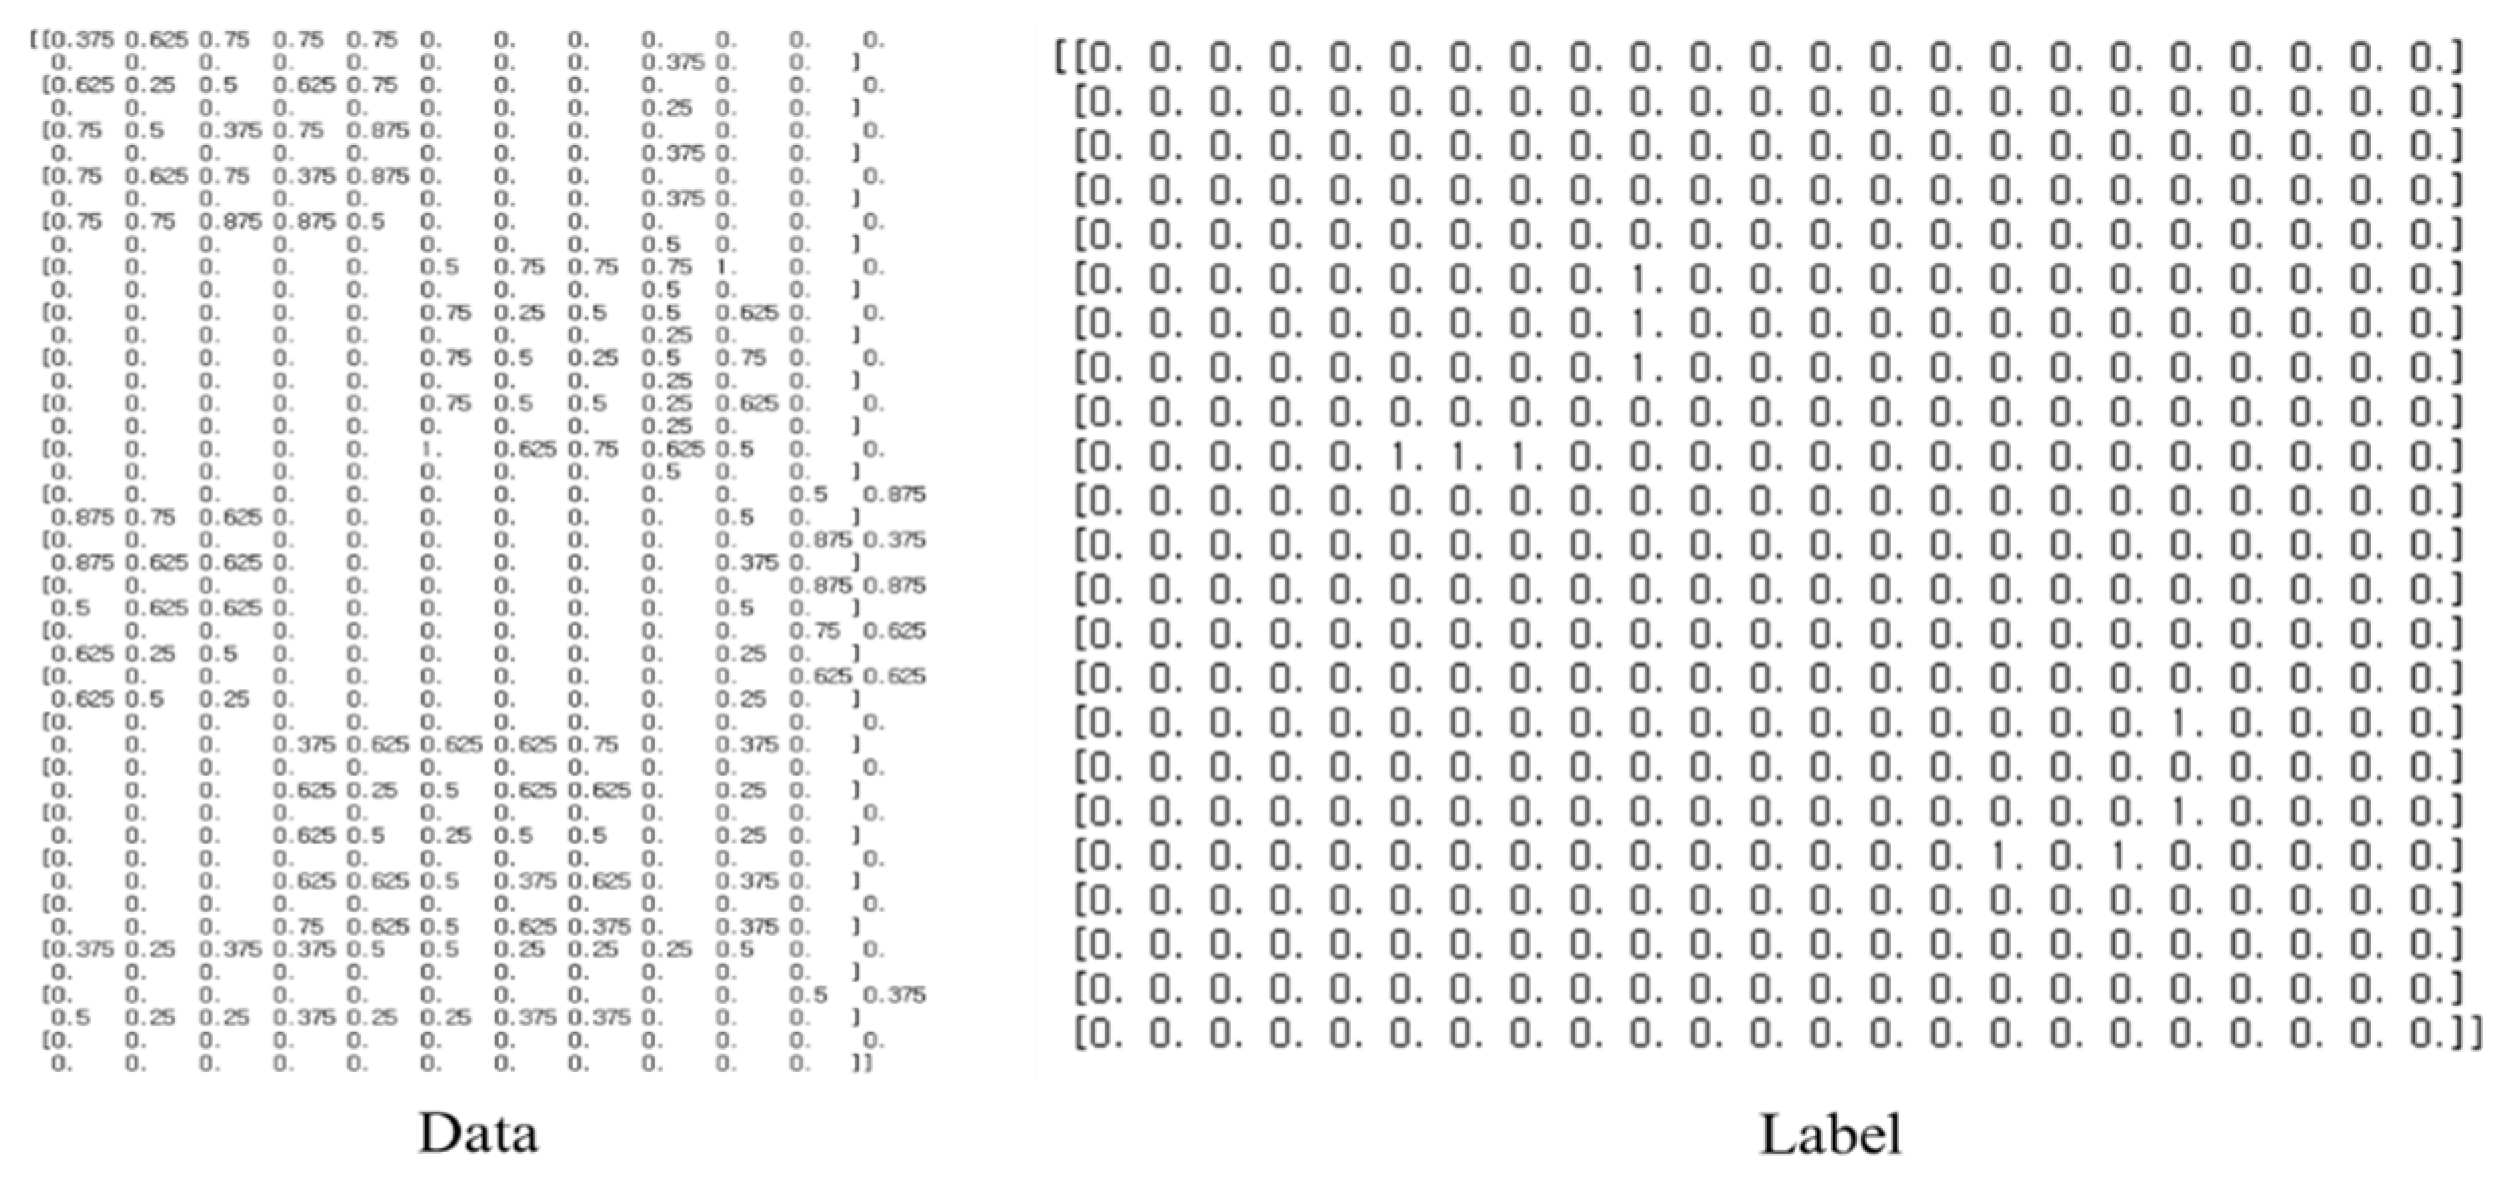
The structure of the final learning and test dataset is organized by the labels that cover data parts and the correct answers used in real learning and inference. Labels represent the attack paths generated based on the vulnerabilities of the systems participating in learning. Figure 2 shows the partial content of a data instance.
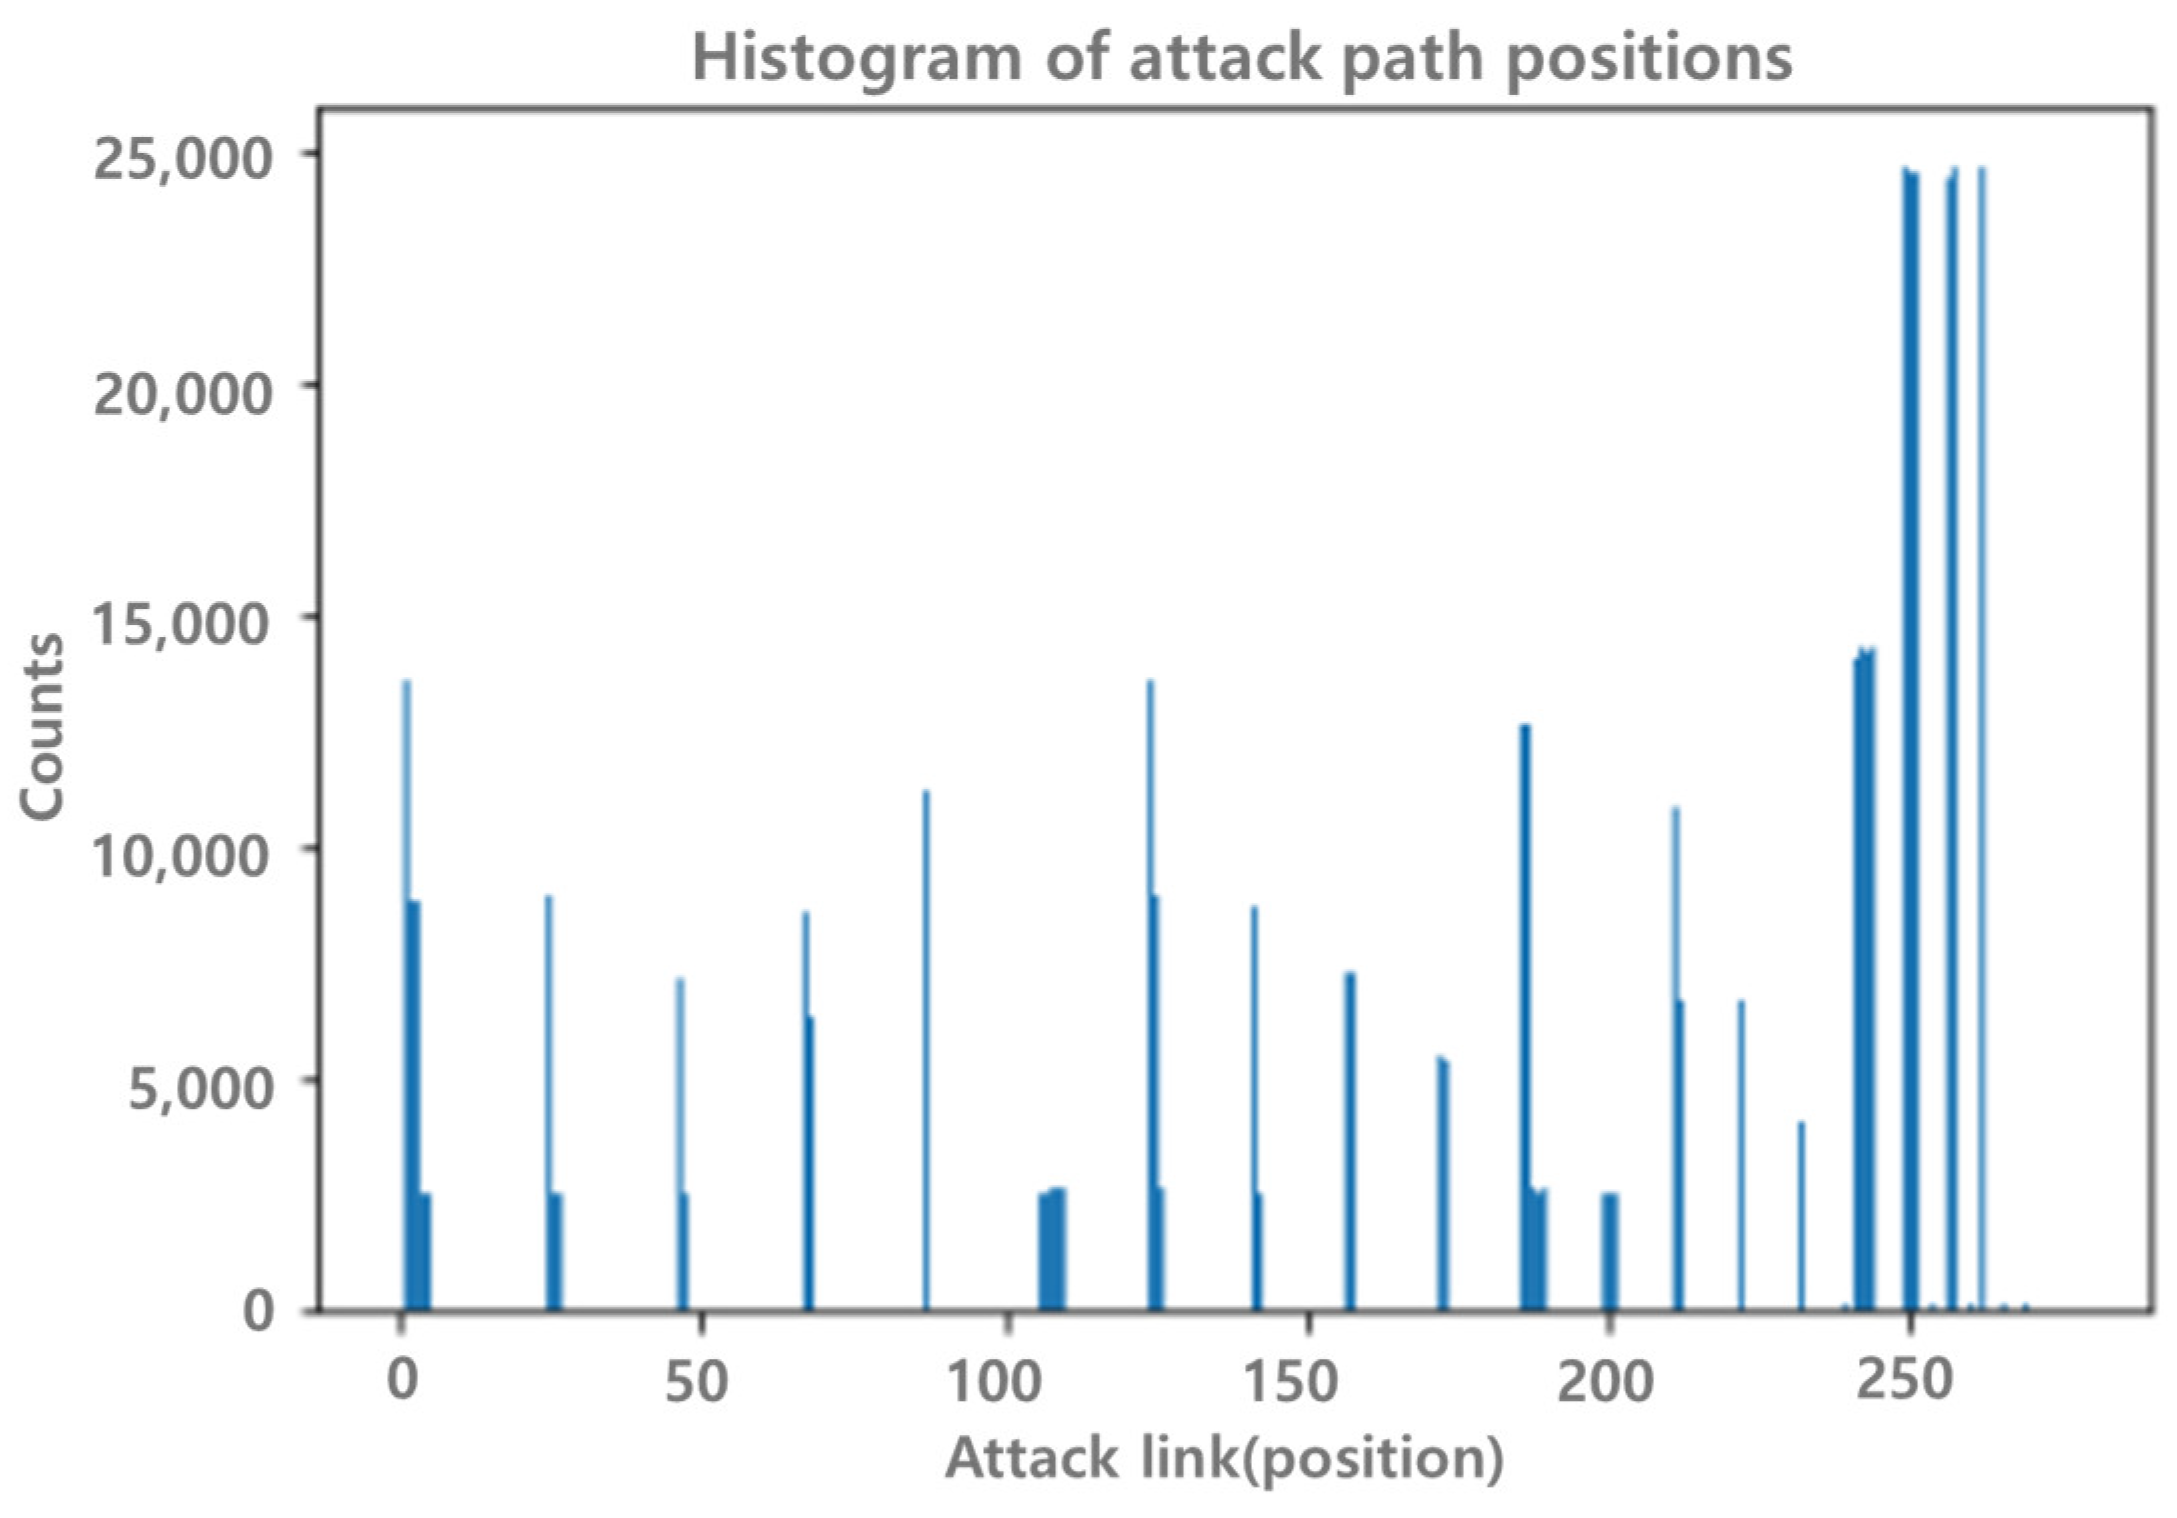
The collected and processed dataset consists of an adjacency matrix of size 23 × 23 for both data parts and labels. Since the adjacency matrix consists of a symmetric square matrix, only the upper triangular part of the matrix is selected and reorganized as the vector of 276 dimensions to save memory and accelerate calculation when it is used as an input of a machine learning/deep learning algorithm. As a result, we have 276 attack path candidates that can be used as attack paths. Figure 3 shows the attack path location of the entire dataset as a histogram. It can be seen that many attack paths are distributed in a specific location among 276 paths.
3.1.2. Attack Graph Feature Extraction and Presentation Method Based on Local Information
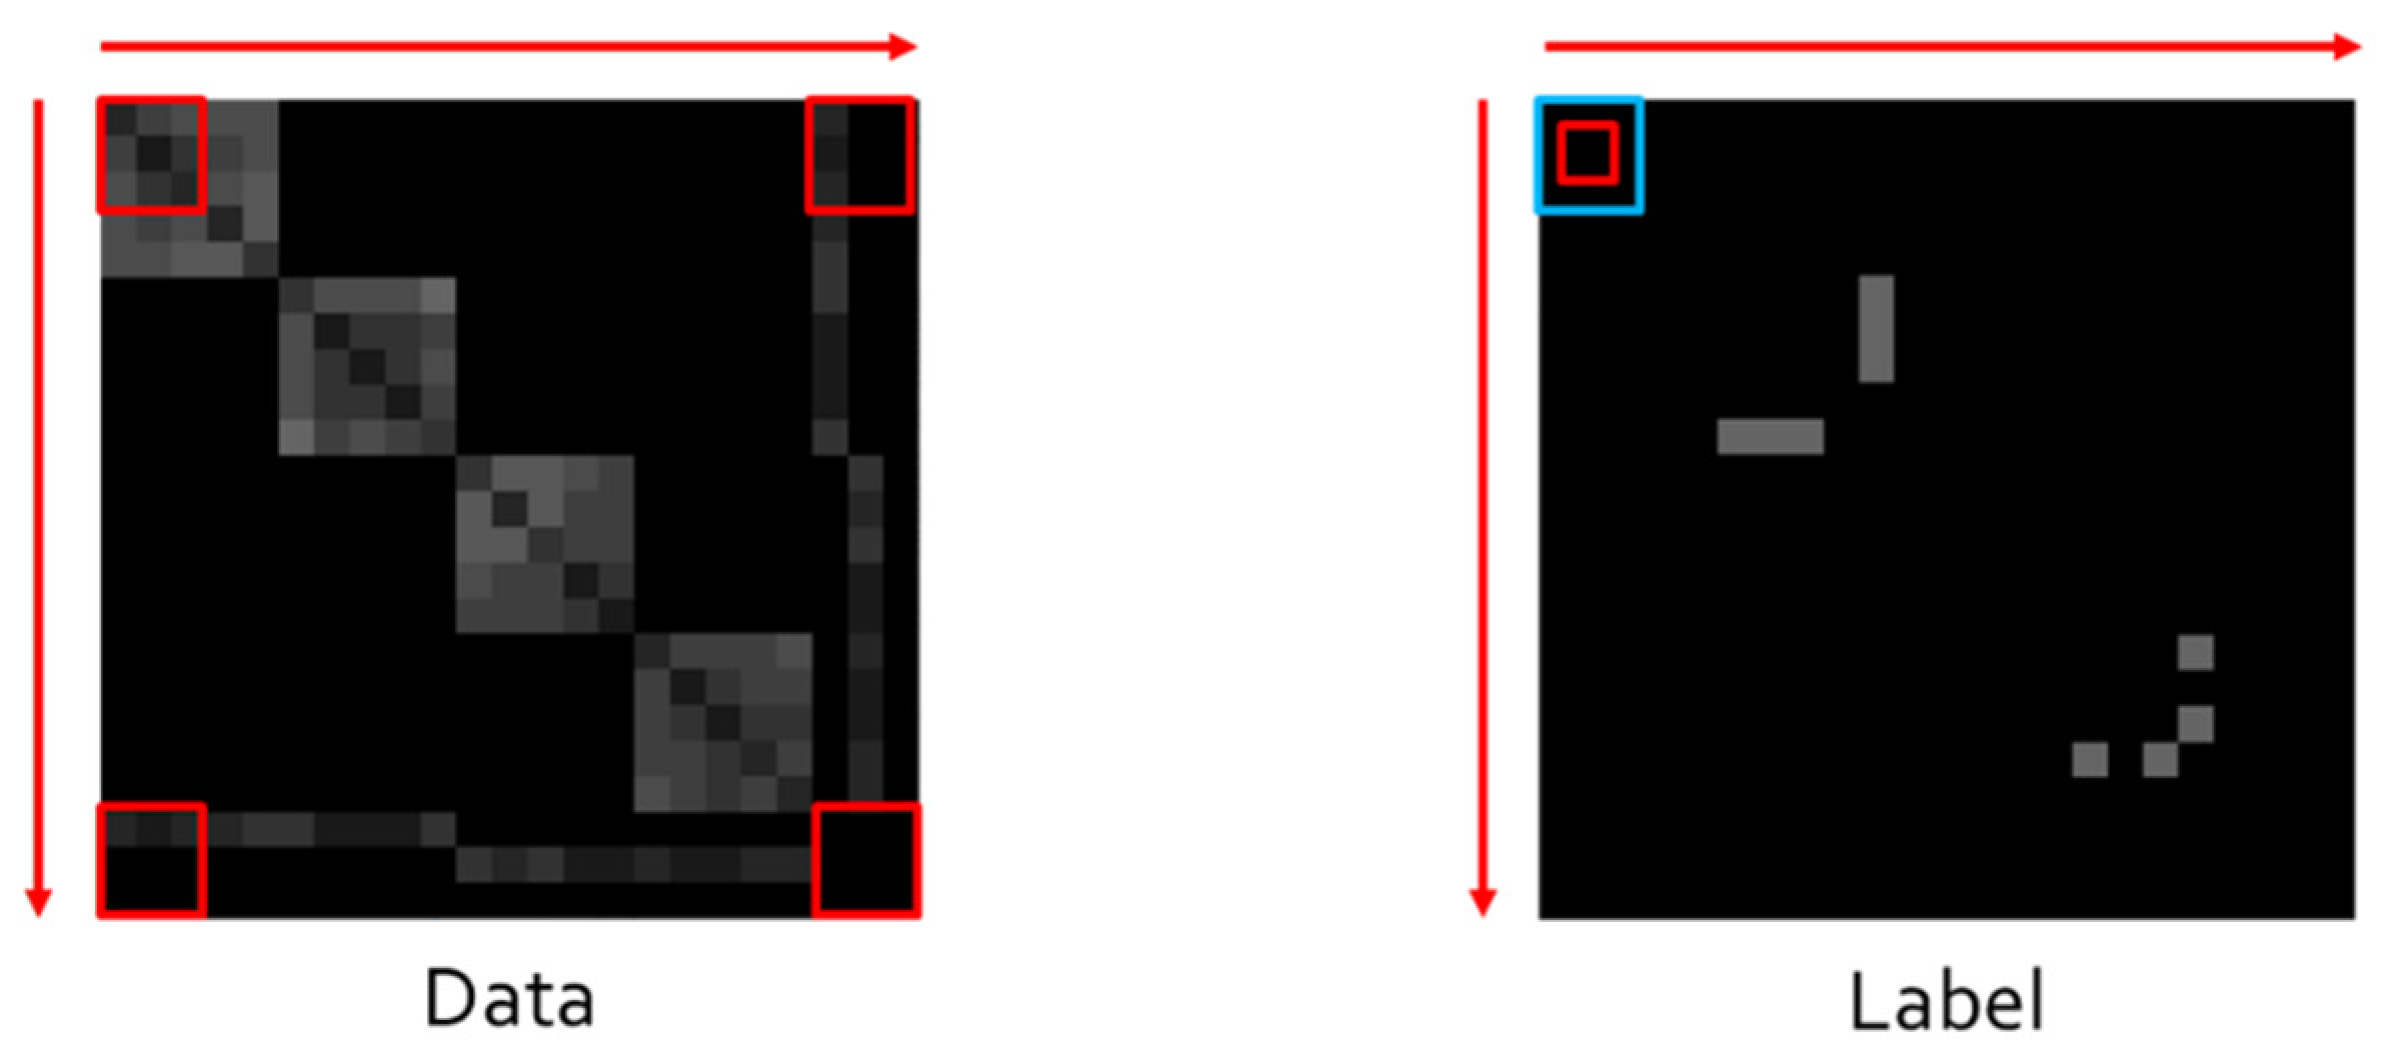
A data representation including network phase, system, and attack path information has 276 dimensions of input data and 267 dimensions of labels, being used as the data of multiple-output learning, in which target variables infer several individual outputs based on the characteristics of the entire input data. In the present study, problems are redefined to check whether the concerned links are included in an attack path through the learning of correlations between adjacent nodes with a focus on the local information of the input data. The input data and labels represented in a vector of 276 dimensions are reorganized as an adjacency matrix of 23 × 23 with the original 23 nodes (computer systems or network devices) to extract the characteristics for the representation of local-information-based attack graphs. Figure 4 shows the visualization and output results of the input data and labels reorganized as an adjacency matrix of 23 × 23.
Each row and column of the reorganized 23 × 23 adjacency matrix means nodes 1~23. Cell organized at row () and column () in the adjacency matrix represents the value of the connection information of nodes and . That is, Cell organized at row () and column () offers scores that take into consideration phase and system information between nodes and . The input and label dataset represented in an adjacency matrix is a graph with no directionality for each, which means that the adjacency matrix of each input dataset and label is organized as a symmetric square matrix. An adjacency matrix representing input data has 0 for a cell with no connections between nodes and real numbers between 0 and 1 for a cell with connections between nodes based on the phase and system information between the nodes. An adjacency matrix representing labels has 0 for a cell with no attack paths between nodes and 1 for a cell with an attack path between nodes. Figure 4 shows that a total of four squares are divided and have values along the diagonal line of an input data adjacency matrix. Here, each square has nodes within each subnet and scores based on phase and system information. Nodes within different subnets have no connections and thus no scores. Cells with the scores of certain columns and rows except for a diagonal line represent connections between the network connection devices and other nodes. A basic model is designed as follows to extract and represent the characteristics of a local-information-based attack graph including network phase, system, and attack path information: first, characteristics including local information are extracted from the connectivity (adjacency) matrix information including network phase and system information. Then, ground truth values are extracted from the connectivity (adjacency) matrix information including attack path information. Here, the characteristic values including local information select all the values overlapping with masks according to the mask size, and labels or ground truth values have the median value of masks. Algorithm 1 shows the algorithm for extracting local characteristics. Figure 5 shows its diagram.
| Algorithm 1. Extraction algorithm of network local-information-based attack graph characteristics. |
| · Extracting local characteristics and their ground truth by sliding mask information on learning data and attack graph ground truth. |
| · In learning data, all the values of mask positions (e.g., 3 × 3 characteristic value for a 3 × 3 mask) are extracted as characteristic values. |
| · The median value of masks is extracted as the ground truth of local characteristics. |
This algorithm performs a local extraction basically on a 3 × 3 mask, but it can grow the mask size variably for a large network and subnet. In the present study, an algorithm is organized on a 3 × 3 mask as data are generated for a relatively small network of 23 nodes. As seen in the figure below, this method of extracting and representing local-information-based attack graph characteristics including network phase, system, and attack path information has a problem of lost information when extracting the top and bottom information right and left of the adjacency matrix of the given input data. This problem can be solved by setting a large size for an adjacency matrix by one cell on a 3 × 3 mask or a larger size than the mask center in the outskirts of input data. In this case, the additionally expanded virtual domain can be filled with 0, 1, or the mean of the entire cells. When such certain values are used to fill it up, however, the non-existent values can bring unexpected results. In the present study, only the local characteristics extracted from the central part are used to generate learning data, with the information extracted from the outermost outskirt discarded. In a test, the outermost outskirt is filled with 0 to generate data.
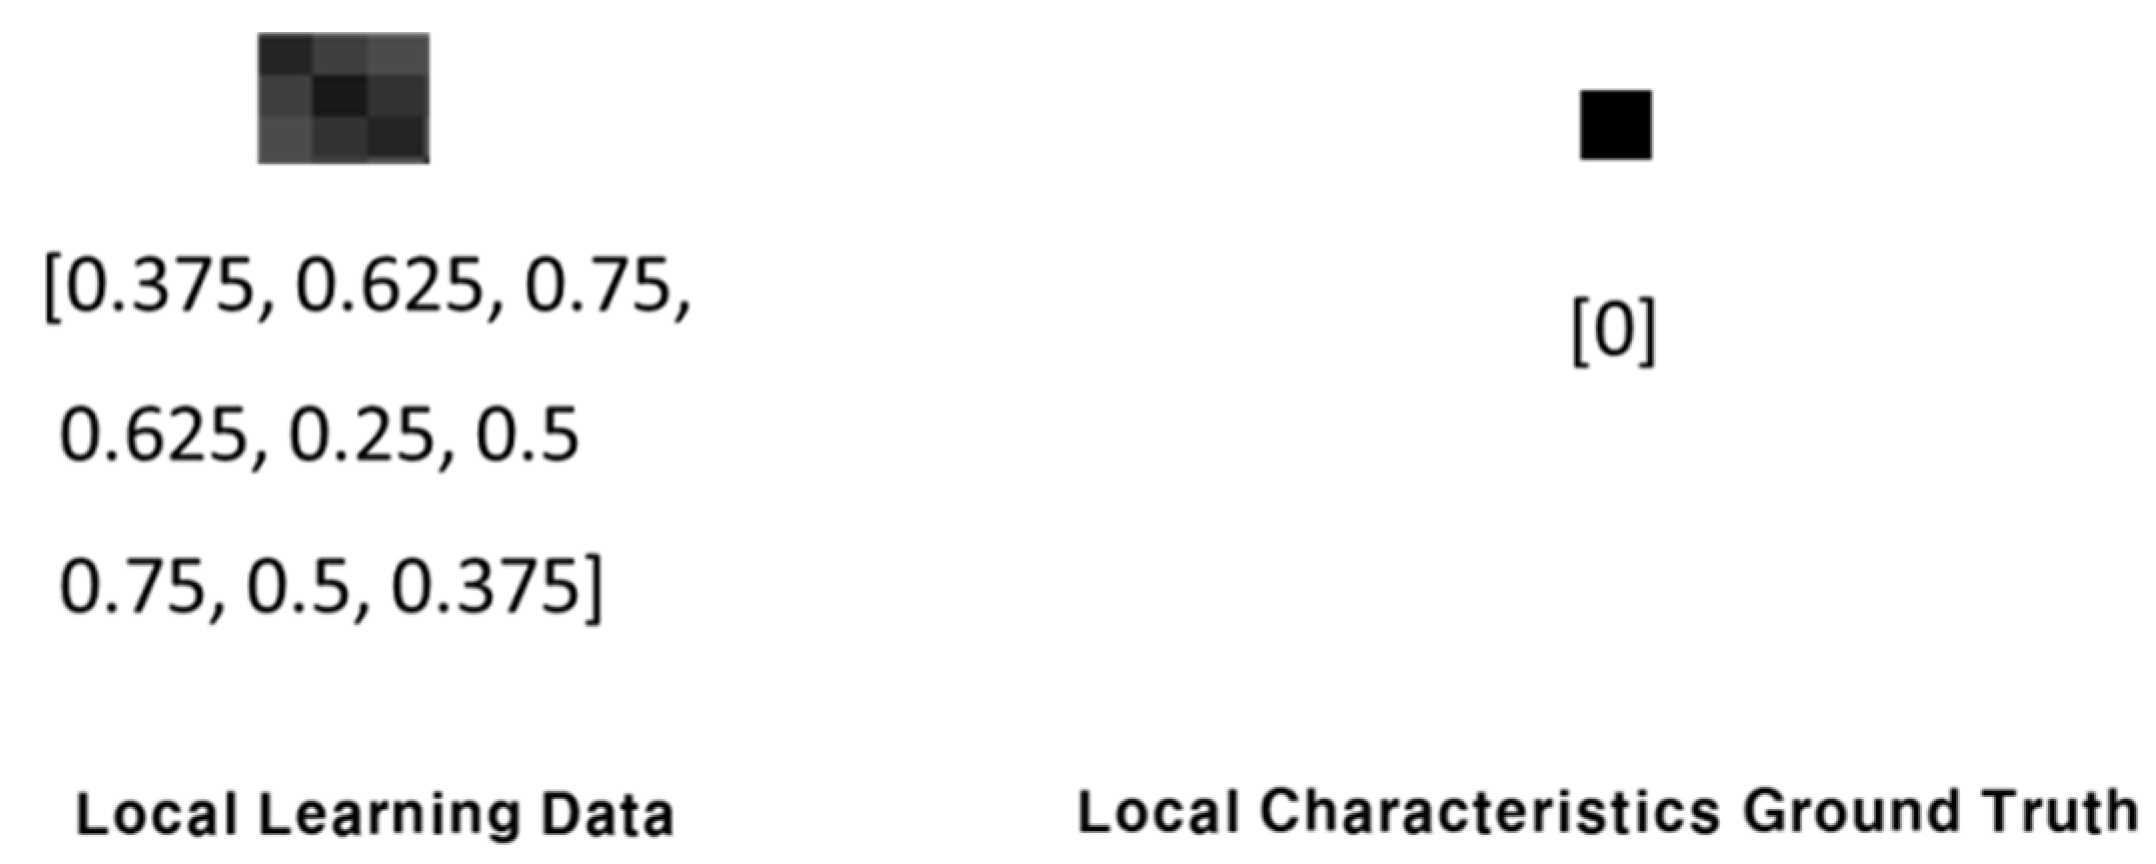
The local characteristics of the extracted input data are in a 3 × 3 matrix, and local labels have scalar values 0 or 1. Local characteristics are converted into a vector of nine dimensions or a matrix of one dimension to be used as the input of a machine learning or deep learning algorithm. Figure 6 shows the examples of the local learning data and characteristic labels of the extracted local characteristics.
The process of collecting and processing data including network phase, system, and attack path information built a dataset of 100,000 data instances in total with the input data of 276 dimensions and labels of 267 dimensions. Of them, 80,000 and 20,000 were used as learning and test data. A mask should move from left to right 20 times and from top to bottom 20 times to extract the local characteristic vector of a data instance. There are a total of 400 mask travels with 400 local characteristics and labels created for a data instance. The local characteristics organized as overall 0 in the input data always lead to 0 labels, which excluded such local characteristics from the extraction process. A total of 320,000,000 local characteristics were extracted from a total of 80,000 learning data. Of them, only the ones not organized as overall 0 were selected to organize 14,356,677 local characteristics and labels for learning purposes. A total of 80,000,000 local characteristics were extracted from a total of 20,000 test data. Of them, only the ones not organized as overall 0 were selected to organize 3,589,331 local characteristics and labels for testing purposes.
3.2. Attack Graph Learning and Generation Method Based on Machine Learning
The present study proposes a learning method for attack graphs with a dataset built in the process of collecting and processing data including network phase, system, and attack path information and two datasets based on the local characteristics proposed in the study. The old dataset was defined with inputs for the multiple output learning method, and the datasets based on local characteristics were defined with inputs for binary classification issues.
3.2.1. Attack Graph Feature Extraction and Presentation Method Based on Local Information
In the present study, an attack graph model can be regarded as a variation of a network analysis model. An adjacency matrix, which is a graph representation of input data, can be used to explore relations and interactions between nodes in a network structure. The prediction of attack paths or links can be defined as an inference operation within its subfield. is a network graph. Here, is a node set for the computer system or network equipment. is a connection set between nodes to represent relations between nodes (or attack path links). Once a network snapshot is given, the goal of link prediction is to infer whether there are connections between two nodes or attack paths. An output vector is a binary vector to show whether there is an edge between node pairs and . is the number of node pairs not showing on the current graph (or new node pairs that have not been observed), and is the number of node pairs not currently connected in each dimension [36,38]. In multiple output learning, a problem is generally defined by mapping each input instance on several outputs. In the present study, input data are supposed as input space of dimensions, and output data are supposed as output label space of dimensions. The goal of multiple output learning to be achieved is to learn in a training set . In the problem definition, is the characteristic vector of dimensions for each training instance . is the output vector of and dimensions for . In the study, multiple output learning is defined as a problem to find based on the training sample of input-output pairs. Here, is a compatible function to assess compatibility between input and output . Equation (1) formalized the compatibility function.
A complex output structure increases the burden on an algorithm to define a model significantly. That is, massive output, complicated output dependency, and complicated loss functions can all be problems. Several algorithms were especially proposed to solve such problems efficiently [36,37]. Many people make use of a classic machine learning model to increase algorithm speed and mitigate the burden of complexity. The four most popular traditional models are k-nearest neighbor (kNN), decision-making tree, k-means, and hashing algorithms. The kNN-based method is a simple and powerful machine learning model in which predictions are based on the nearest k instances to the test instance vector in terms of Euclidean distance. The decision-tree-based method learns a tree in training data by using a hierarchical output label space. Nodes are repeatedly divided until each leaf includes a small number of labels. Each new data point is delivered under a tree until it reaches a leaf. The k-means-based method clusters training data through k-means clustering. SLEEC learns separate embedding for each cluster and classifies new instances only within a cluster. The hashing method curtails prediction time by using hashing in an input or middle embedding space. Co-hashing learns an embedding space to preserve the semantic similarity structure between input and output and generates compressed binary representations for learned embedding for prediction efficiency. DBPC captures the latent non-linear structure of data with ANN and promotes the joint learning of deep latent hamming space and binary prototypes. The learned hamming space and binary prototypes reduce prediction complexity considerably and save memory and storage costs [36]. In the present study, they are broadly used as algorithms to solve multiple output issues. The study also applies an algorithm adjustment method to modify a certain single output method to deal with the first multiple output dataset based on a simple kNN method. The algorithm adjustment method sets a goal of modeling and interpreting dependency among these objects as well as predicting multiple objects in general. The second application involves a problem conversion method to convert a multiple output problem into a single independent one each solved by a single output regression algorithm. Based on the basic idea explained above, the study additionally proposes an algorithm adjustment method on the basis of a neural network and deep learning. It is based on an idea of predicting all the objects at the same time with a single model to capture all dependence and internal relations. This offers a couple of advantages to the problem conversion method: it can interpret a single multi-object model more easily than many single-object models and guarantees better prediction performance for certain objects correlated [37]. In the present study, problems were defined based on the following assumption according to the input and output of a kNN algorithm: input data are an input space of dimensions, and output data are an output label space of dimensions. The kNN algorithm can define a multiple output learning method without additional organization by defining input and output in the structure in multiple dimensions with a multiple output learning method. In the study, the kNN algorithm was applied to multiple output problems with the additional application of algorithms for neural network and deep learning models. As shown in Table 1, the following four models are a summarization of machine learning and deep learning algorithms.
3.2.2. Binary Classification Learning Method
In the present study, attack graph learning and creation issues were solved by defining binary classification problems based on local characteristics to define the issues defined as multiple output learning issues as simpler ones and solve the problems of multiple output learning mentioned above. Local characteristics have a 3 × 3 matrix, and local labels present scalar values 0 and 1. Local characteristics were converted into a vector of nine dimensions or a matrix of one dimension so that they could be used as inputs in a machine learning or deep learning algorithm. Local characteristics are themselves the data for binary classification issues. The present study proposes a simple neural network model to solve them. Like multiple output learning problems, a three-layer neural network that was simple and used most was defined with a binary classification model. The proposed three-layer neural network was composed of an input layer of nine dimensions, hidden layers 1 and 2 of 20 dimensions each, and an output layer of one dimension. ReLU was used as an activation function for the hidden layers 1 and 2. Sigmoid was used for an activation function for the output layer. A loss function used binary_crossentropy usually used for binary classification and applied rmsprop for optimization.
4. Experimental Results
The attack graph learning and creation model proposed in the study was defined with multiple output learning and binary classification issues. The attack graph creation model was studied based on the learning data including network phase, system, and attack path information. A model was proposed to infer and create an attack graph only with network phase and system information. The problems of learning the attack graph creation model mentioned above through machine learning or deep learning were defined as multiple output classification, multiple output regression, and binary classification problems to provide solutions and methods, but the assessment of the model cannot use the performance evaluation method for the traditional multiple output classification, multiple output regression, and binary classification problems. The prediction and inference results of an attack path in the learned attack graph creation model are an attack graph itself. The analysis and assessment of the attack graph’s results require the definition of remedies that exist in a label (ground truth) but not in prediction and inference results and also exist in prediction and inference results but not in attack paths and labels.
4.1. Definition of Performance Evaluation Method of Attack Graph Prediction Path
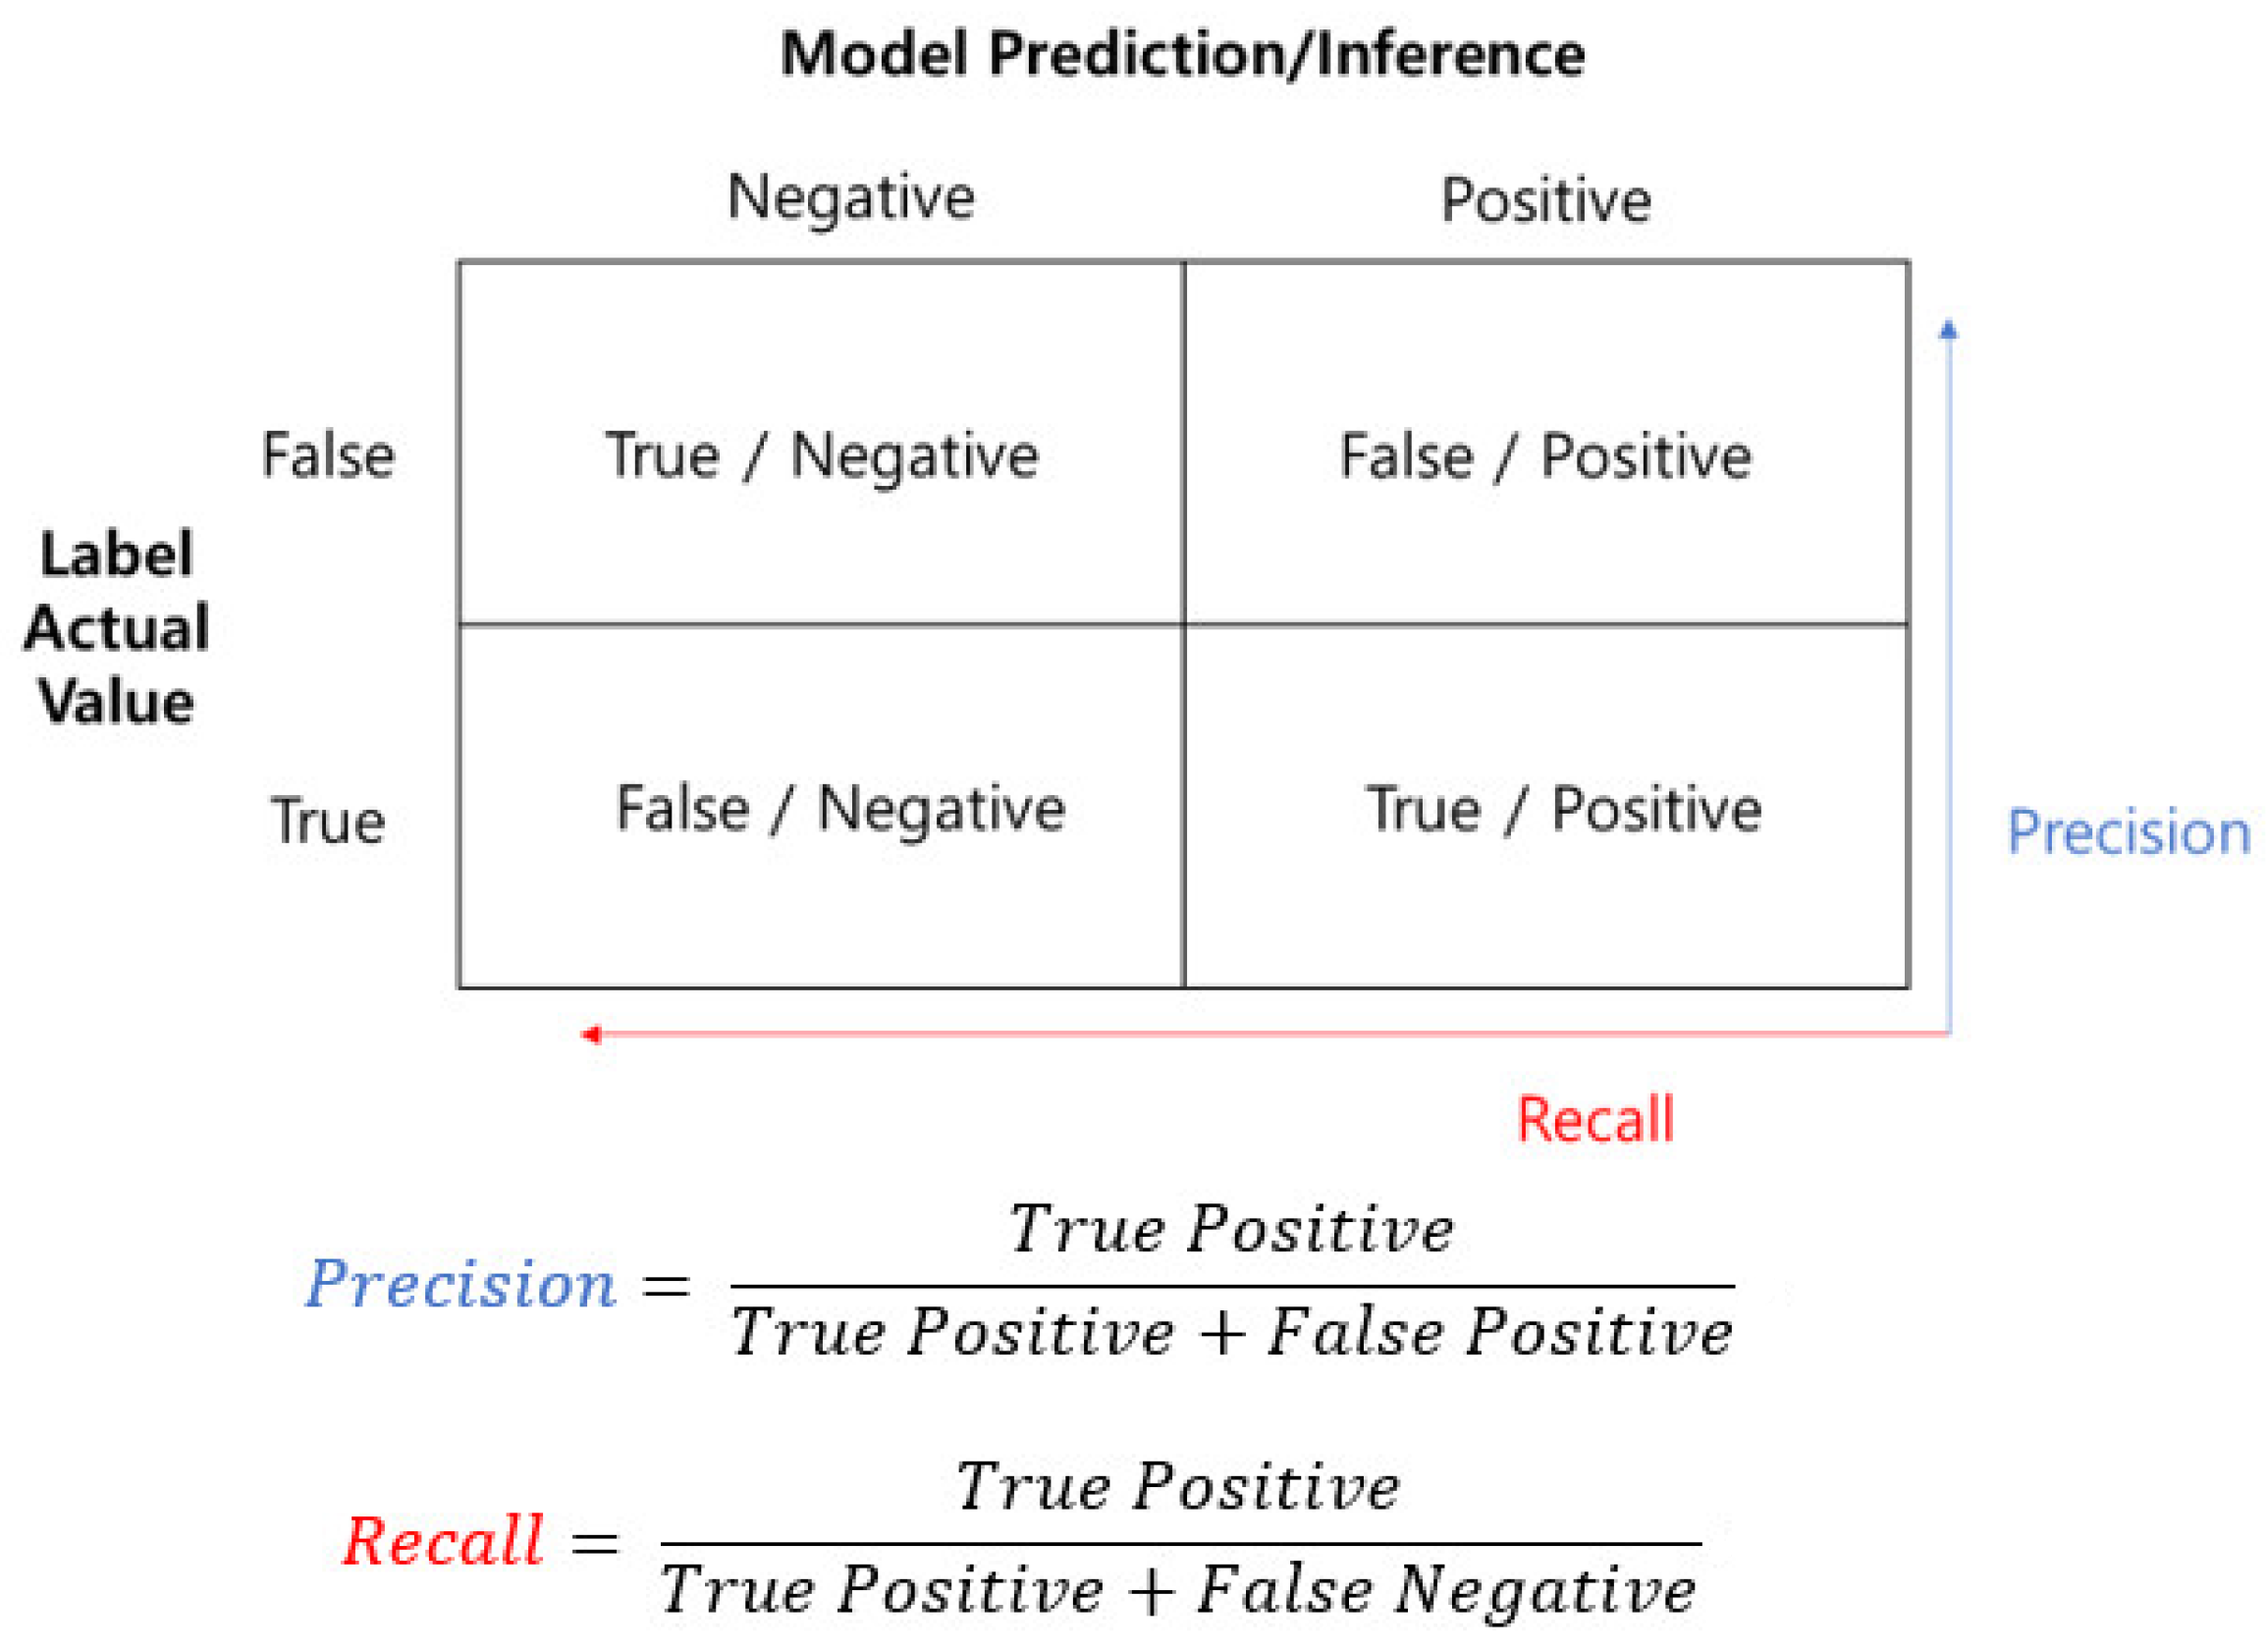
The biggest problem common in machine learning and deep learning research to analyze network traffic and security data is data imbalance. There are few data that contain the same number of learning objects for all the labels/classes in many applications. Data balance breaks when a class or label has too many objects, which happens commonly in many applications. The old models learned in such data tend to depend on a class with a majority of objects for their outcomes. The data imbalance issue has impacts on a learning algorithm and also the stage of measuring outcome performance. Especially in security issues, it is widely different from the performance evaluation criteria of machine learning whose performance measurement is general. The common approach is to apply separate weights for performance evaluation. For instance, an intrusion detection system is assessed for its performance based on the error of detecting no hacker attacks in the system and mistaking them as general acts rather than attacks. The latter type of error issues wrong information to the system administrator, thus causing inconvenience for users. The former type of error causes deadly security outcomes as well as preventing the system from achieving its original purpose. The assessment of an intrusion detection system thus places greater weight on the error of detecting no hacker attacks in the system than that of mistaking normal acts as attacks. By the same logic, an attack graph creation model brings more deadly results when detecting attack path links that do not exist than detecting no real attack path links, which raises a need for a performance evaluation method that takes into consideration the importance of errors. The attack graph learning and creation method proposed in the study defined given problems based on multiple output learning and binary classification learning. Multiple output learning is usually defined based on a multiple output regression analysis method. As the literature review suggests, the performance evaluation method of multiple output regression generally assesses the multiple output learning performance as real number values along with regression issues. Specific evaluation methods include mean absolute error (MAE), which levels off classical single output regression matrixes to calculate absolute differences between the predicted output and the real output for all the outputs and assesses a multiple output regression model, mean squared error (MSE), which expands a regression matrix to calculate mean square differences between the predicted and real output with a multiple output setting, and average correlation coefficient (ACC), which measures the degree of connection between the real and predicted output. The evaluation method proposed in the study interprets each output based on the probability of an attack path on the concerned link and can be applied to overall system performance, but its expansion to performance evaluation considering the importance of errors is difficult in the case of predicting and inferring attack paths explained above. The performance evaluation method of multiple output classification can be considered as an alternative to that of multiple output regression. A metric based on multiple output classification assesses the performance of multiple output learning in relation to multiple label classification issues. Outputs are generally discrete values and can use example- and label-based methods. An example-based metric assesses the performance of a multiple output learning model in relation to each data instance. The individual evaluation of each test instance in performance is followed by the reflection of the model’s overall performance based on the mean of all the individual results. A specific evaluation method is hamming loss, which calculates mean differences between predicted and real outputs by taking into account both prediction and omission errors. A label-based metric assesses performance in relation to each output label. The model is evaluated for its means based on the calculated contributions of all labels across all the measurement items. There are macro-averaging, which calculates the metric of each label independently and obtains the means of all the labels with the same weight, and micro-averaging, which grants the same weight to all the data samples. There are, however, limitations when applying these methods to the attack graph learning and creation model proposed in the study as they are. The learning outcomes predicted and inferred through the model provide multiple output classification, multiple output regression, and binary classification issues according to each proposed methodology. The results of multiple output classification provide 2-class values (1 for an attack path, 0 for no attack path) according to the presence and absence of an attack path between connected nodes in each cell of an adjacency matrix in a created attack graph. The results of multiple output regression provide the probability of an attack path between connected nodes in each cell of an adjacency matrix in a created attack graph. They can be treated the same as those of the multiple output classification above by substituting values over a certain probability value, with 1 meaning the presence of an attack path, and values under a certain probability value, with 0 meaning the absence of an attack path, in order to evaluate the presence and absence of a path. The output of binary classification issues can be assessed using the same method above for the same results of multiple output classification issues except for the algorithm characteristics of binary classification for each cell of an adjacency matrix in an attack graph. As seen in the example of an adjacency matrix in an attack graph, each cell of an adjacency matrix created can be interpreted as an output result itself and also as the result of binary classification to check whether there is an attack path for each cell. The evaluation of an adjacency matrix in an attack graph created can thus be converted into a problem of measuring the classification accuracy of 2-class for the binary issue (1 for an attack path, 0 for no attack path) of the concerned data instance by regarding the output results of each cell in an adjacency matrix as the data instances of each classification problem. For instance, let us assume that an attack graph is created with the input of a certain organization’s network phase and system information. The network contains a total of n nodes, and an adjacency matrix of the attack graph can be organized as an adjacency matrix. The output results can be assessed based on the binary classification (0 or 1) accuracy of data instances in . The same method can be expanded to assess the performance of an attack graph learning and creation model with the simultaneous input of several organizations’ network information. The most common method to assess the performance of binary classification problems is to use a confusion matrix. Precision and recall are usually used as the evaluation indicators to assess performance based on a confusion matrix. The calculation formula based on precision and recall is as Figure 7.
In the present study, attack graph learning and creation issues have the following characteristics in the aspect of binary classification evaluation: first, there is imbalance between classes. The data with a negative (0) label in the number of data used in learning are much more than the data with a positive (1) label, which affects learning outcomes. The number of output results predicted to be negative is considerably bigger than the number of output results predicted to be positive. It is not impossible to evaluate a system only with the imbalance of simple output labels, but there are limitations with the accurate quantitative evaluation of system (model) performance with evaluation results; and secondly, there is an issue of error weights for each label mentioned above. When an attack graph creation model does not detect a real attack path link, it is more deadly than the detection of an attack path link that does not exist, which raises the need for a performance evaluation method that takes into consideration the importance of errors. It is highly critical that an attack graph does not detect an attack path link that does exist in this study, which leads to the proposal of using recall basically for performance evaluation. When it detects an attack path link that does not exist, there can be various interpretations. Qualitative evaluation will be more reasonable than quantitative evaluation. The qualitative evaluation method mentioned below will propose an alternative. The present study proposes a new performance evaluation method by revising the old precision approach to consider the importance of errors to supplement the limitations of recall in order to assess an adjacency matrix in an attack graph only in the viewpoint of attack paths that are actually detected based on the fact that it is more deadly for an attack graph creation model to detect no real attack path links than detecting an attack path link that does not exist. This method grants greater weights to true positive when calculating the revised precision, which is found in Equation (2). Here, and are weights for true positive (TP) and false positive (FP), respectively. The weight and is chosen according to the following conditions: .
Figure 8 presents the examples of input data and labels used for attack graph study. As Section 4 offered specific explanations, an adjacency matrix representing input data has 0 for cells with no connections between nodes and real numbers between 0 and 1 based on the phase and system information between nodes for cells with connections between nodes. An adjacency matrix representing labels has 0 for cells that have no attack path between nodes and 1 for cells that have an attack path between nodes. In the figure below, there are a total of six squares along the diagonal line of the adjacency matrix of input data. Each of the squares represents connections between nodes within each subnet and obtains scores based on phase and system information. Nodes from different subnets have no connections between them and thus no score values. The cells with score values in certain columns and rows except for the diagonal line represent connections between the network connection equipment and other nodes in the network. That is, of the input data cells, the ones with no score values (connection links between nodes with no physical links) have no links along with the ones that correspond with labels (or attack paths).
4.2. Performance Evaluation of Attack Graph Prediction Path
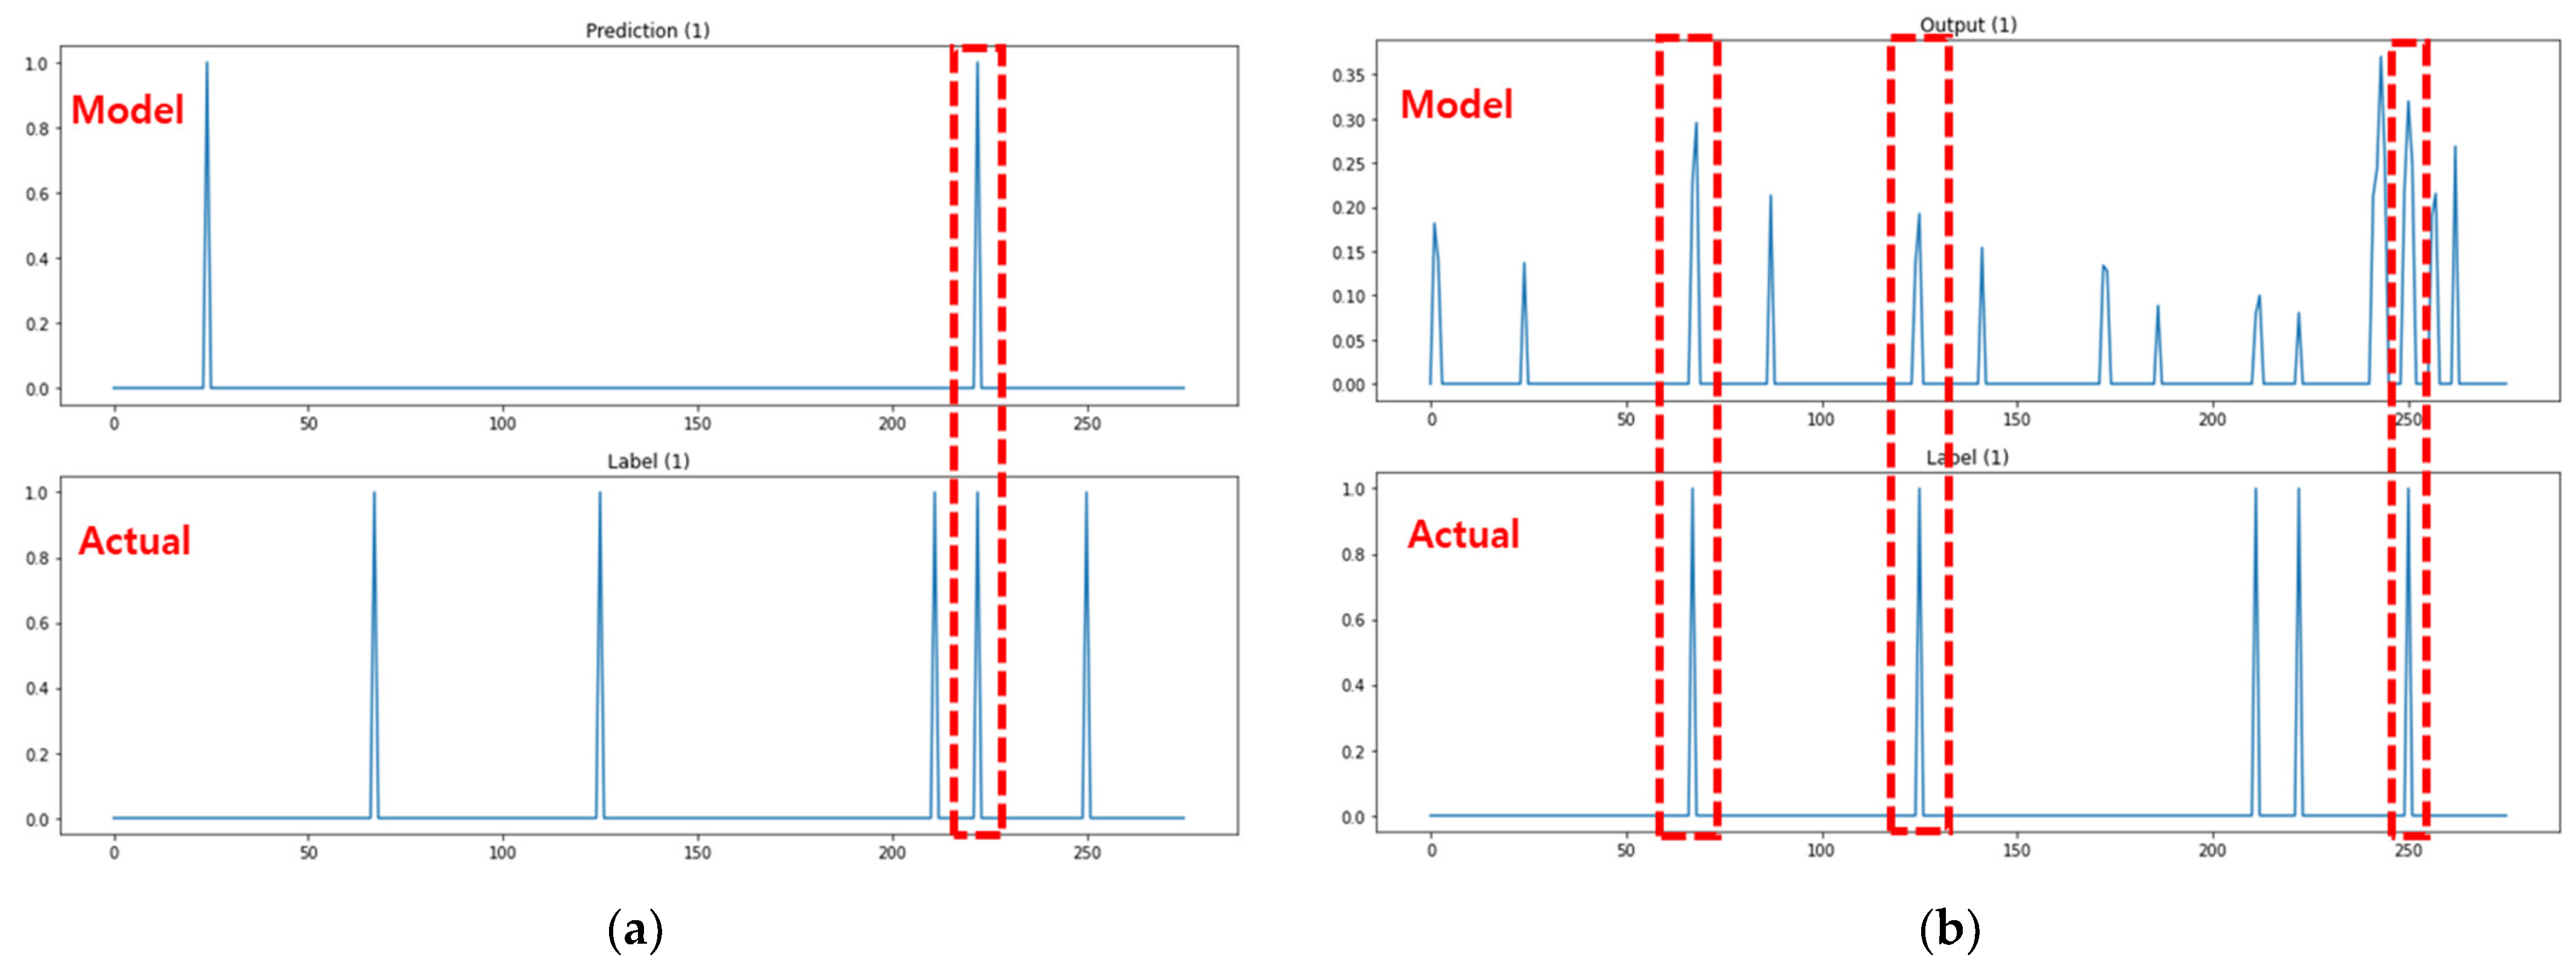
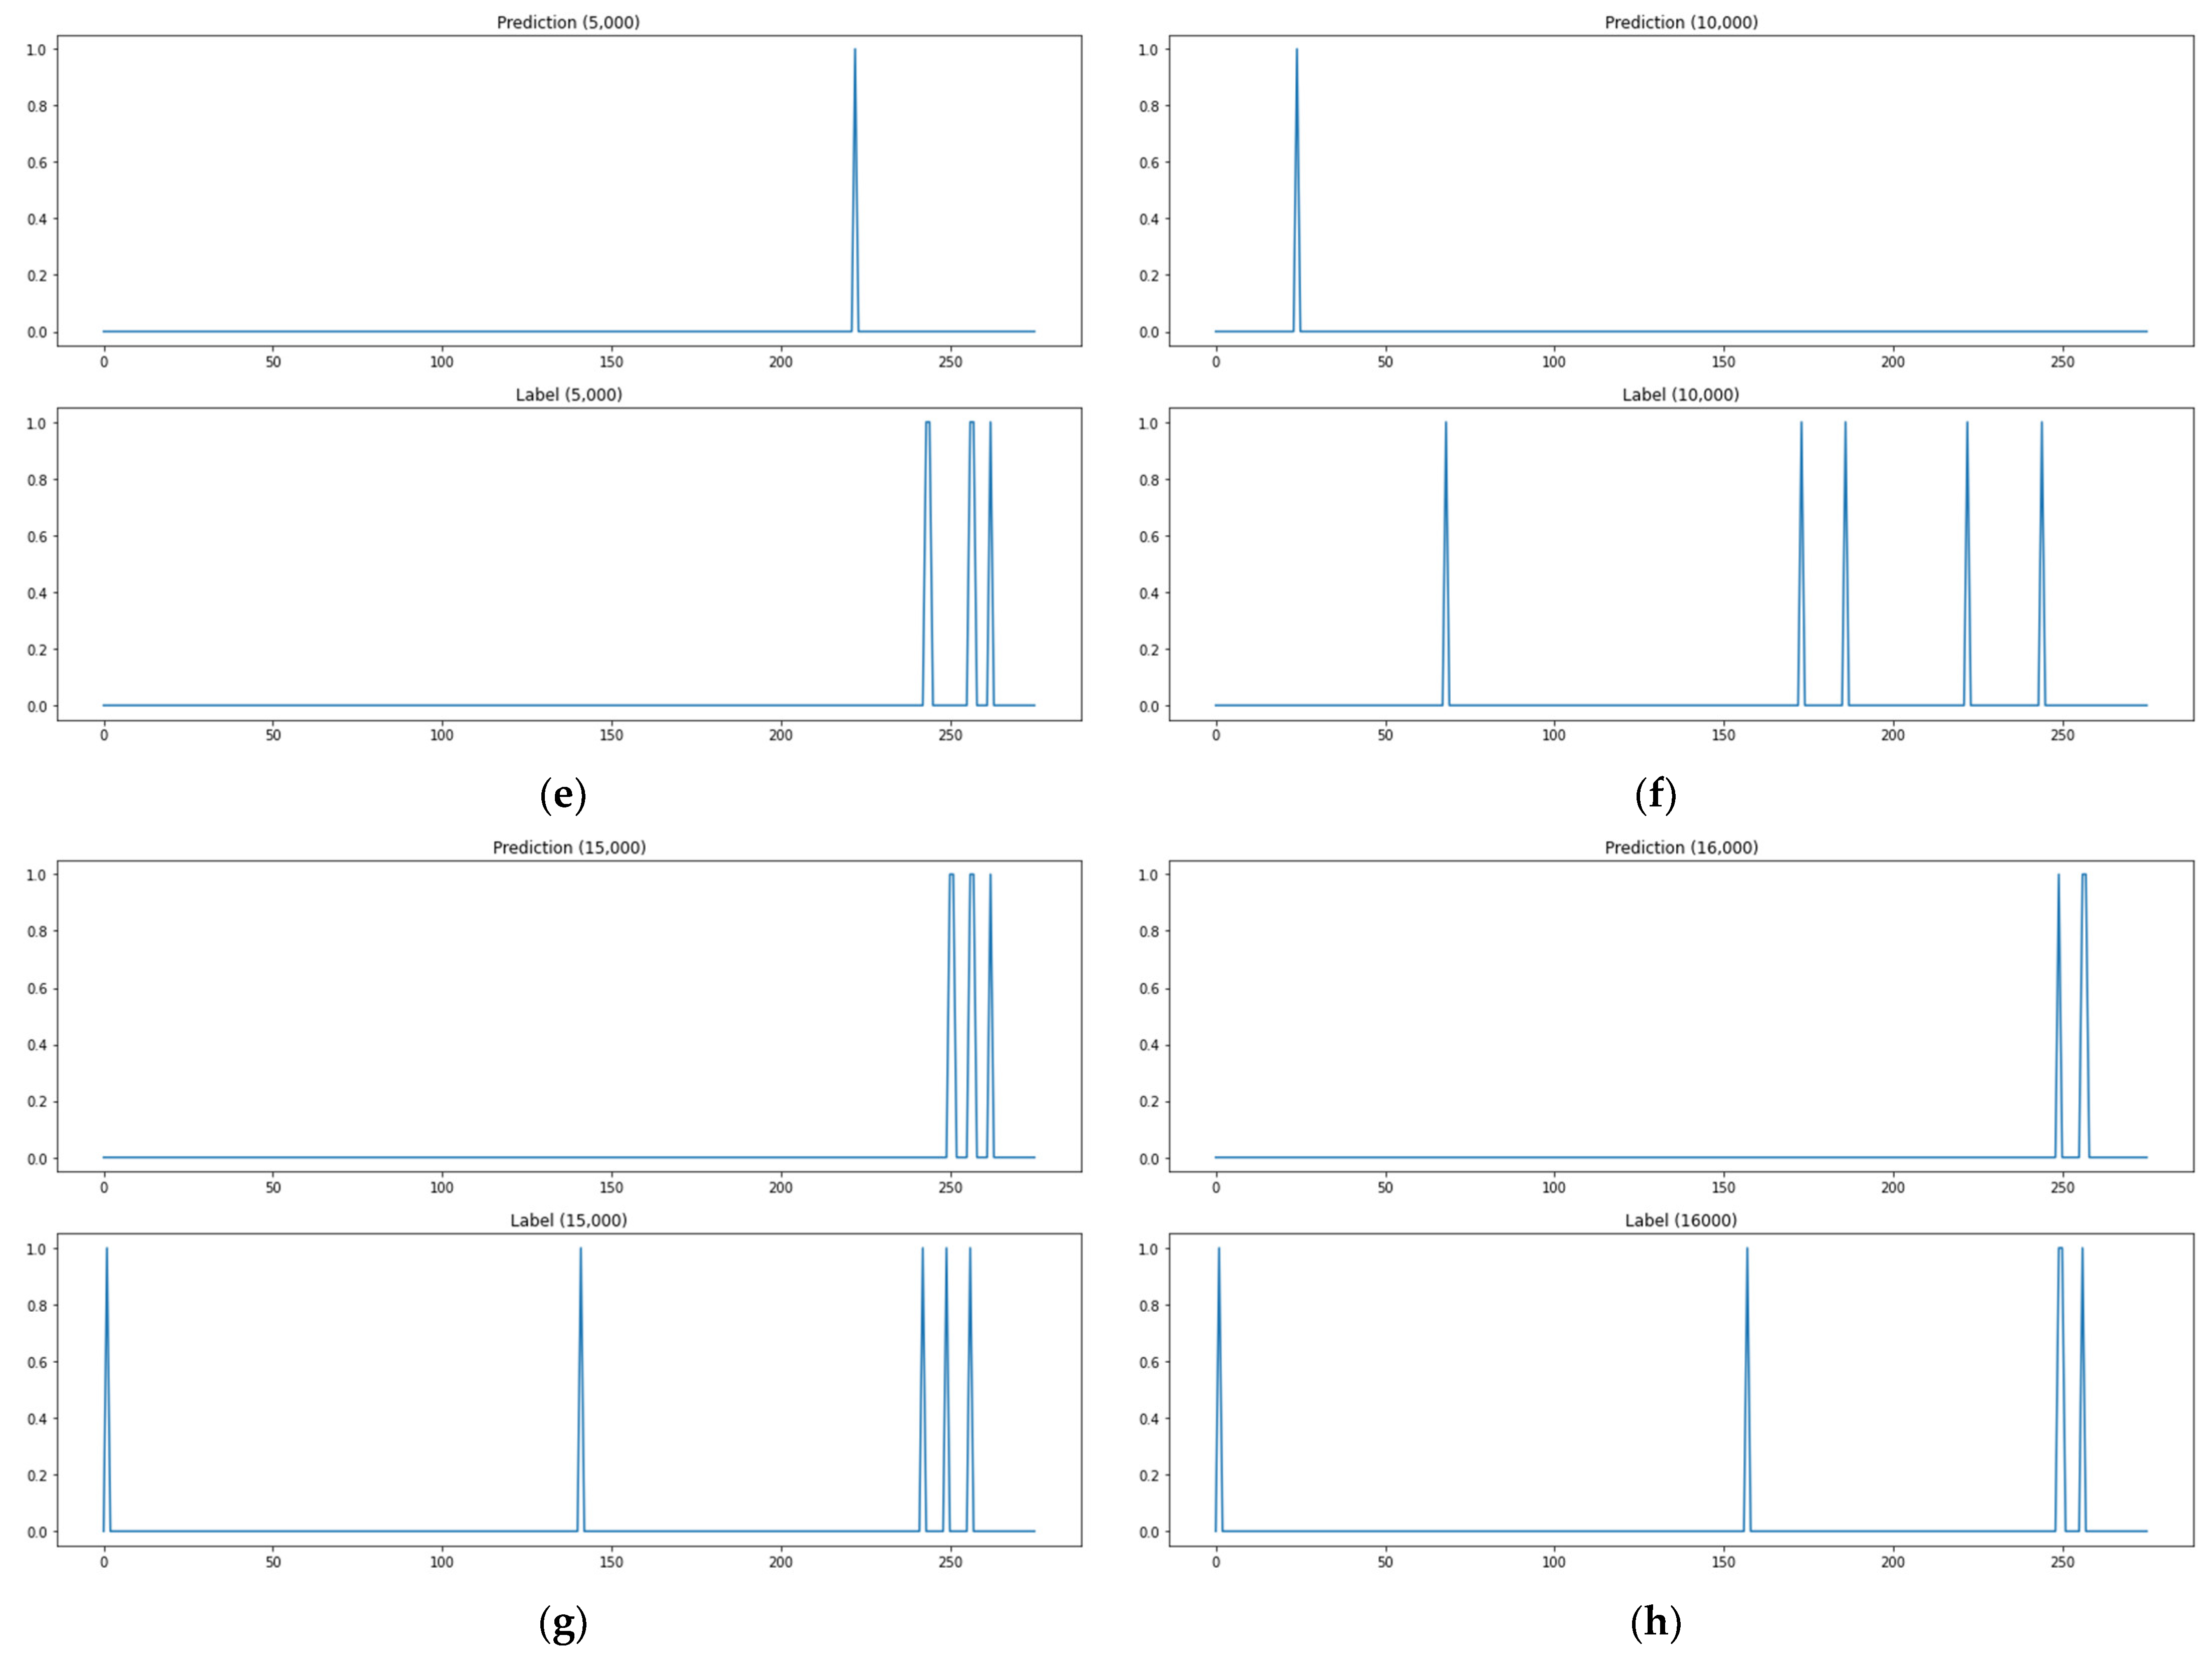
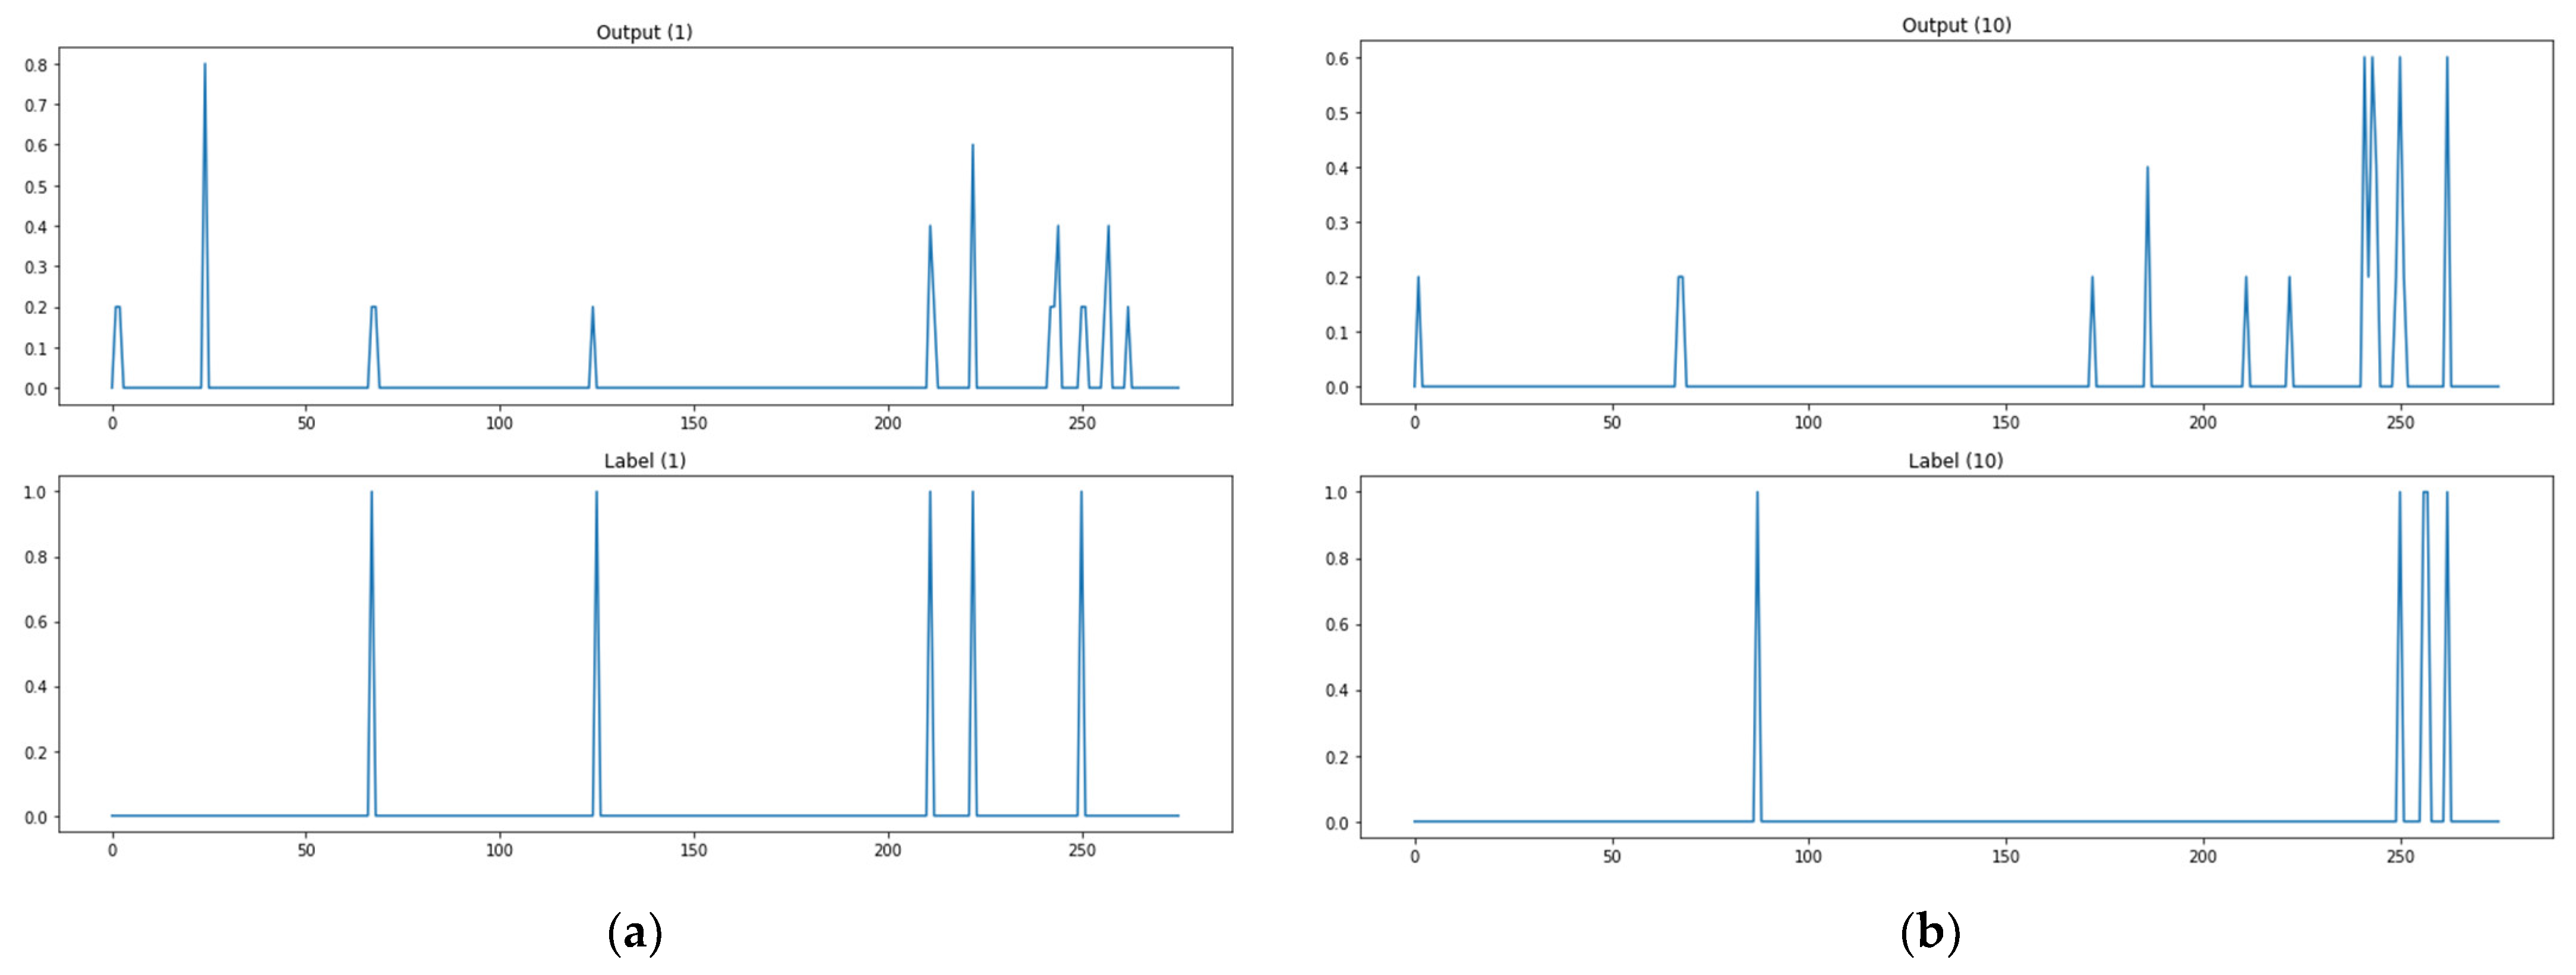
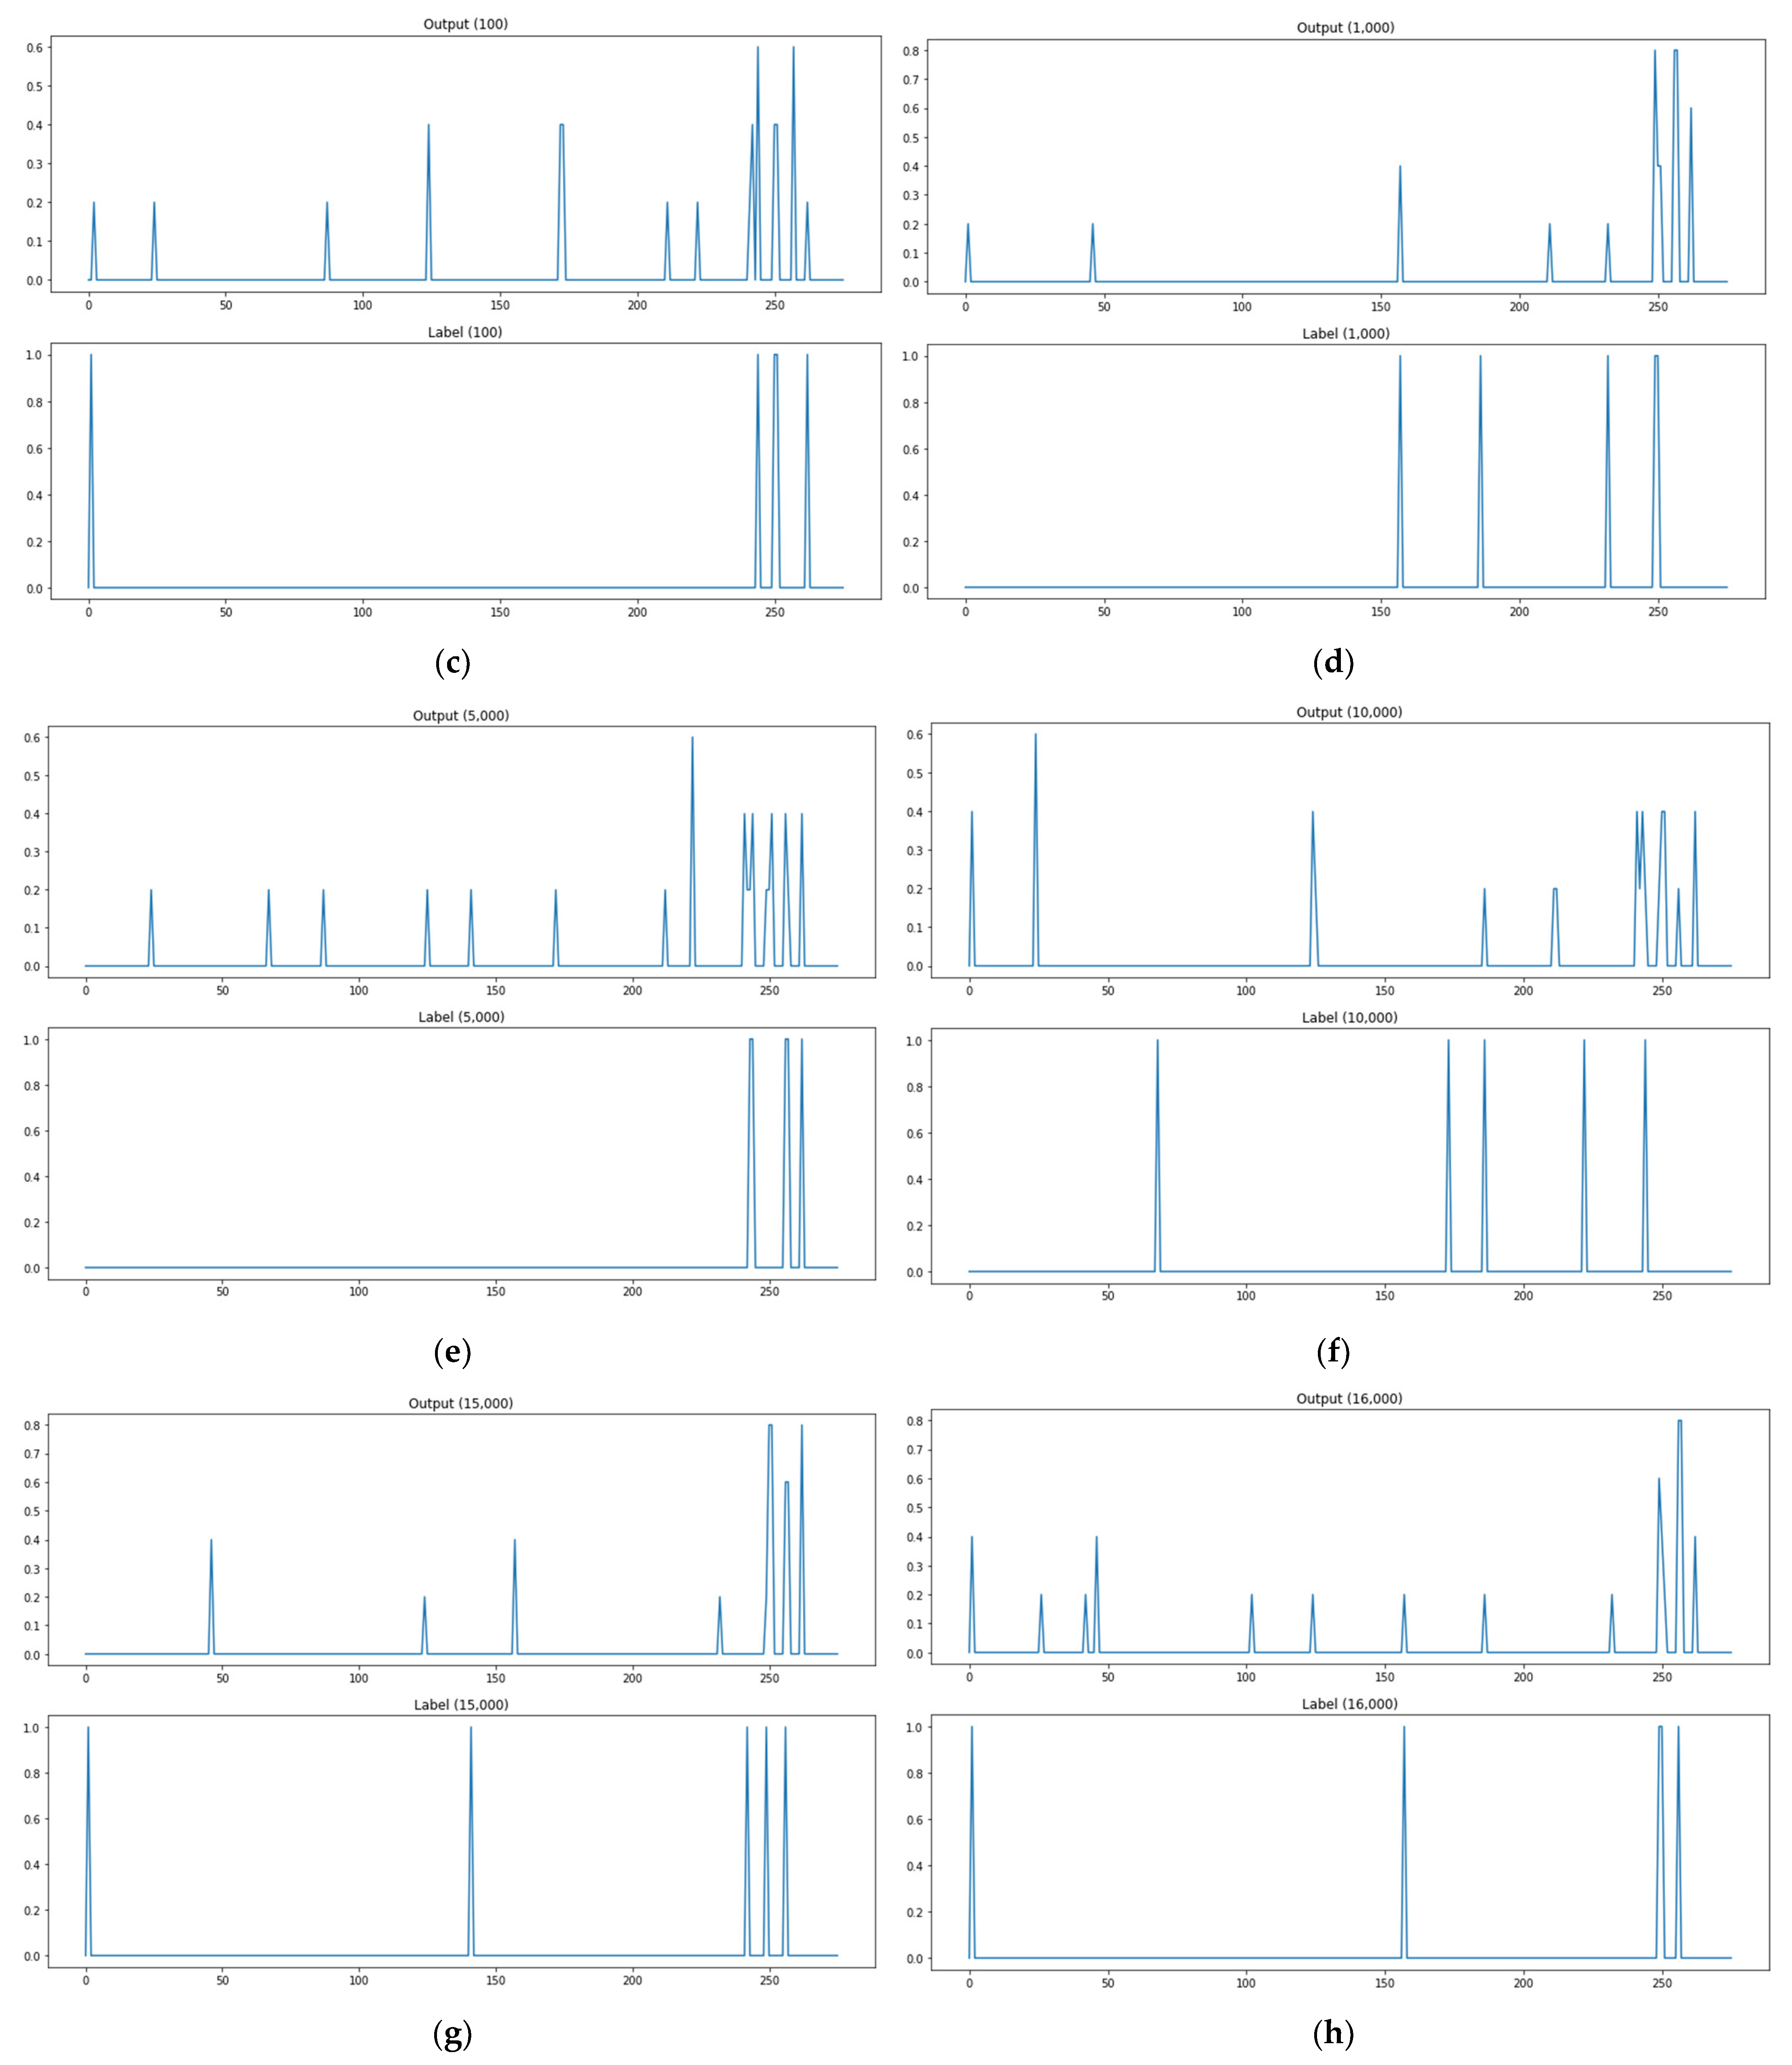
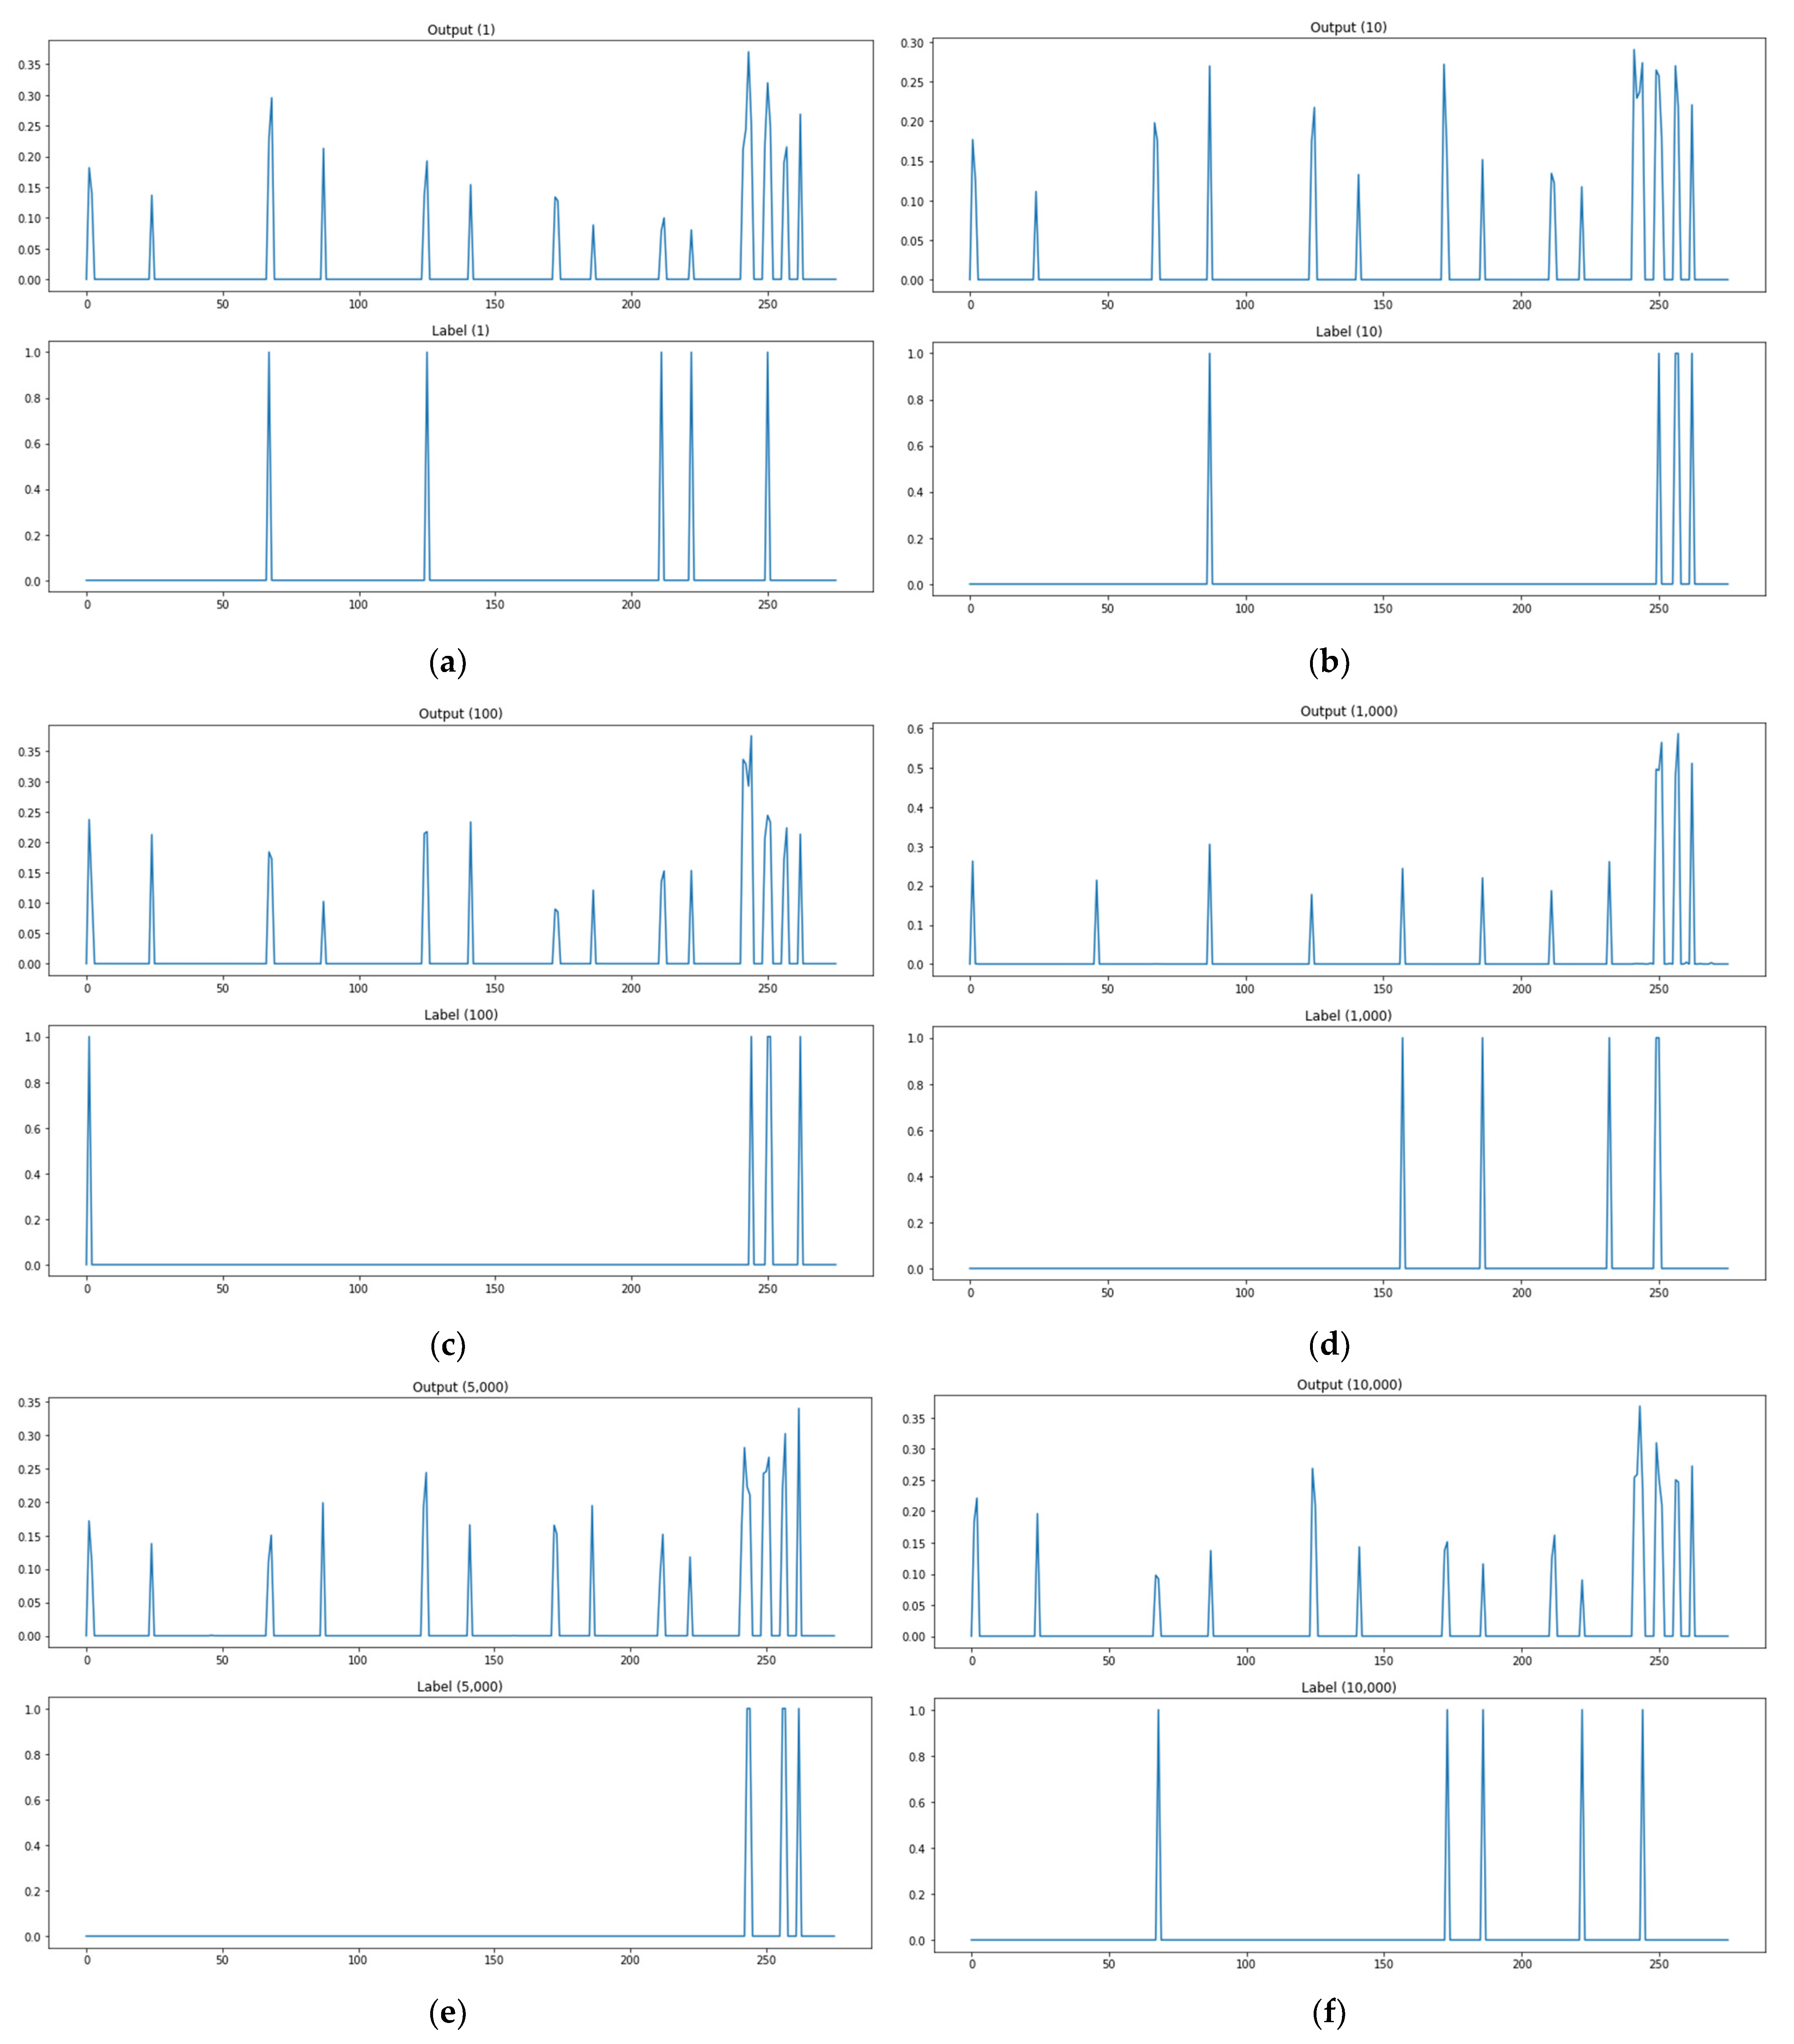
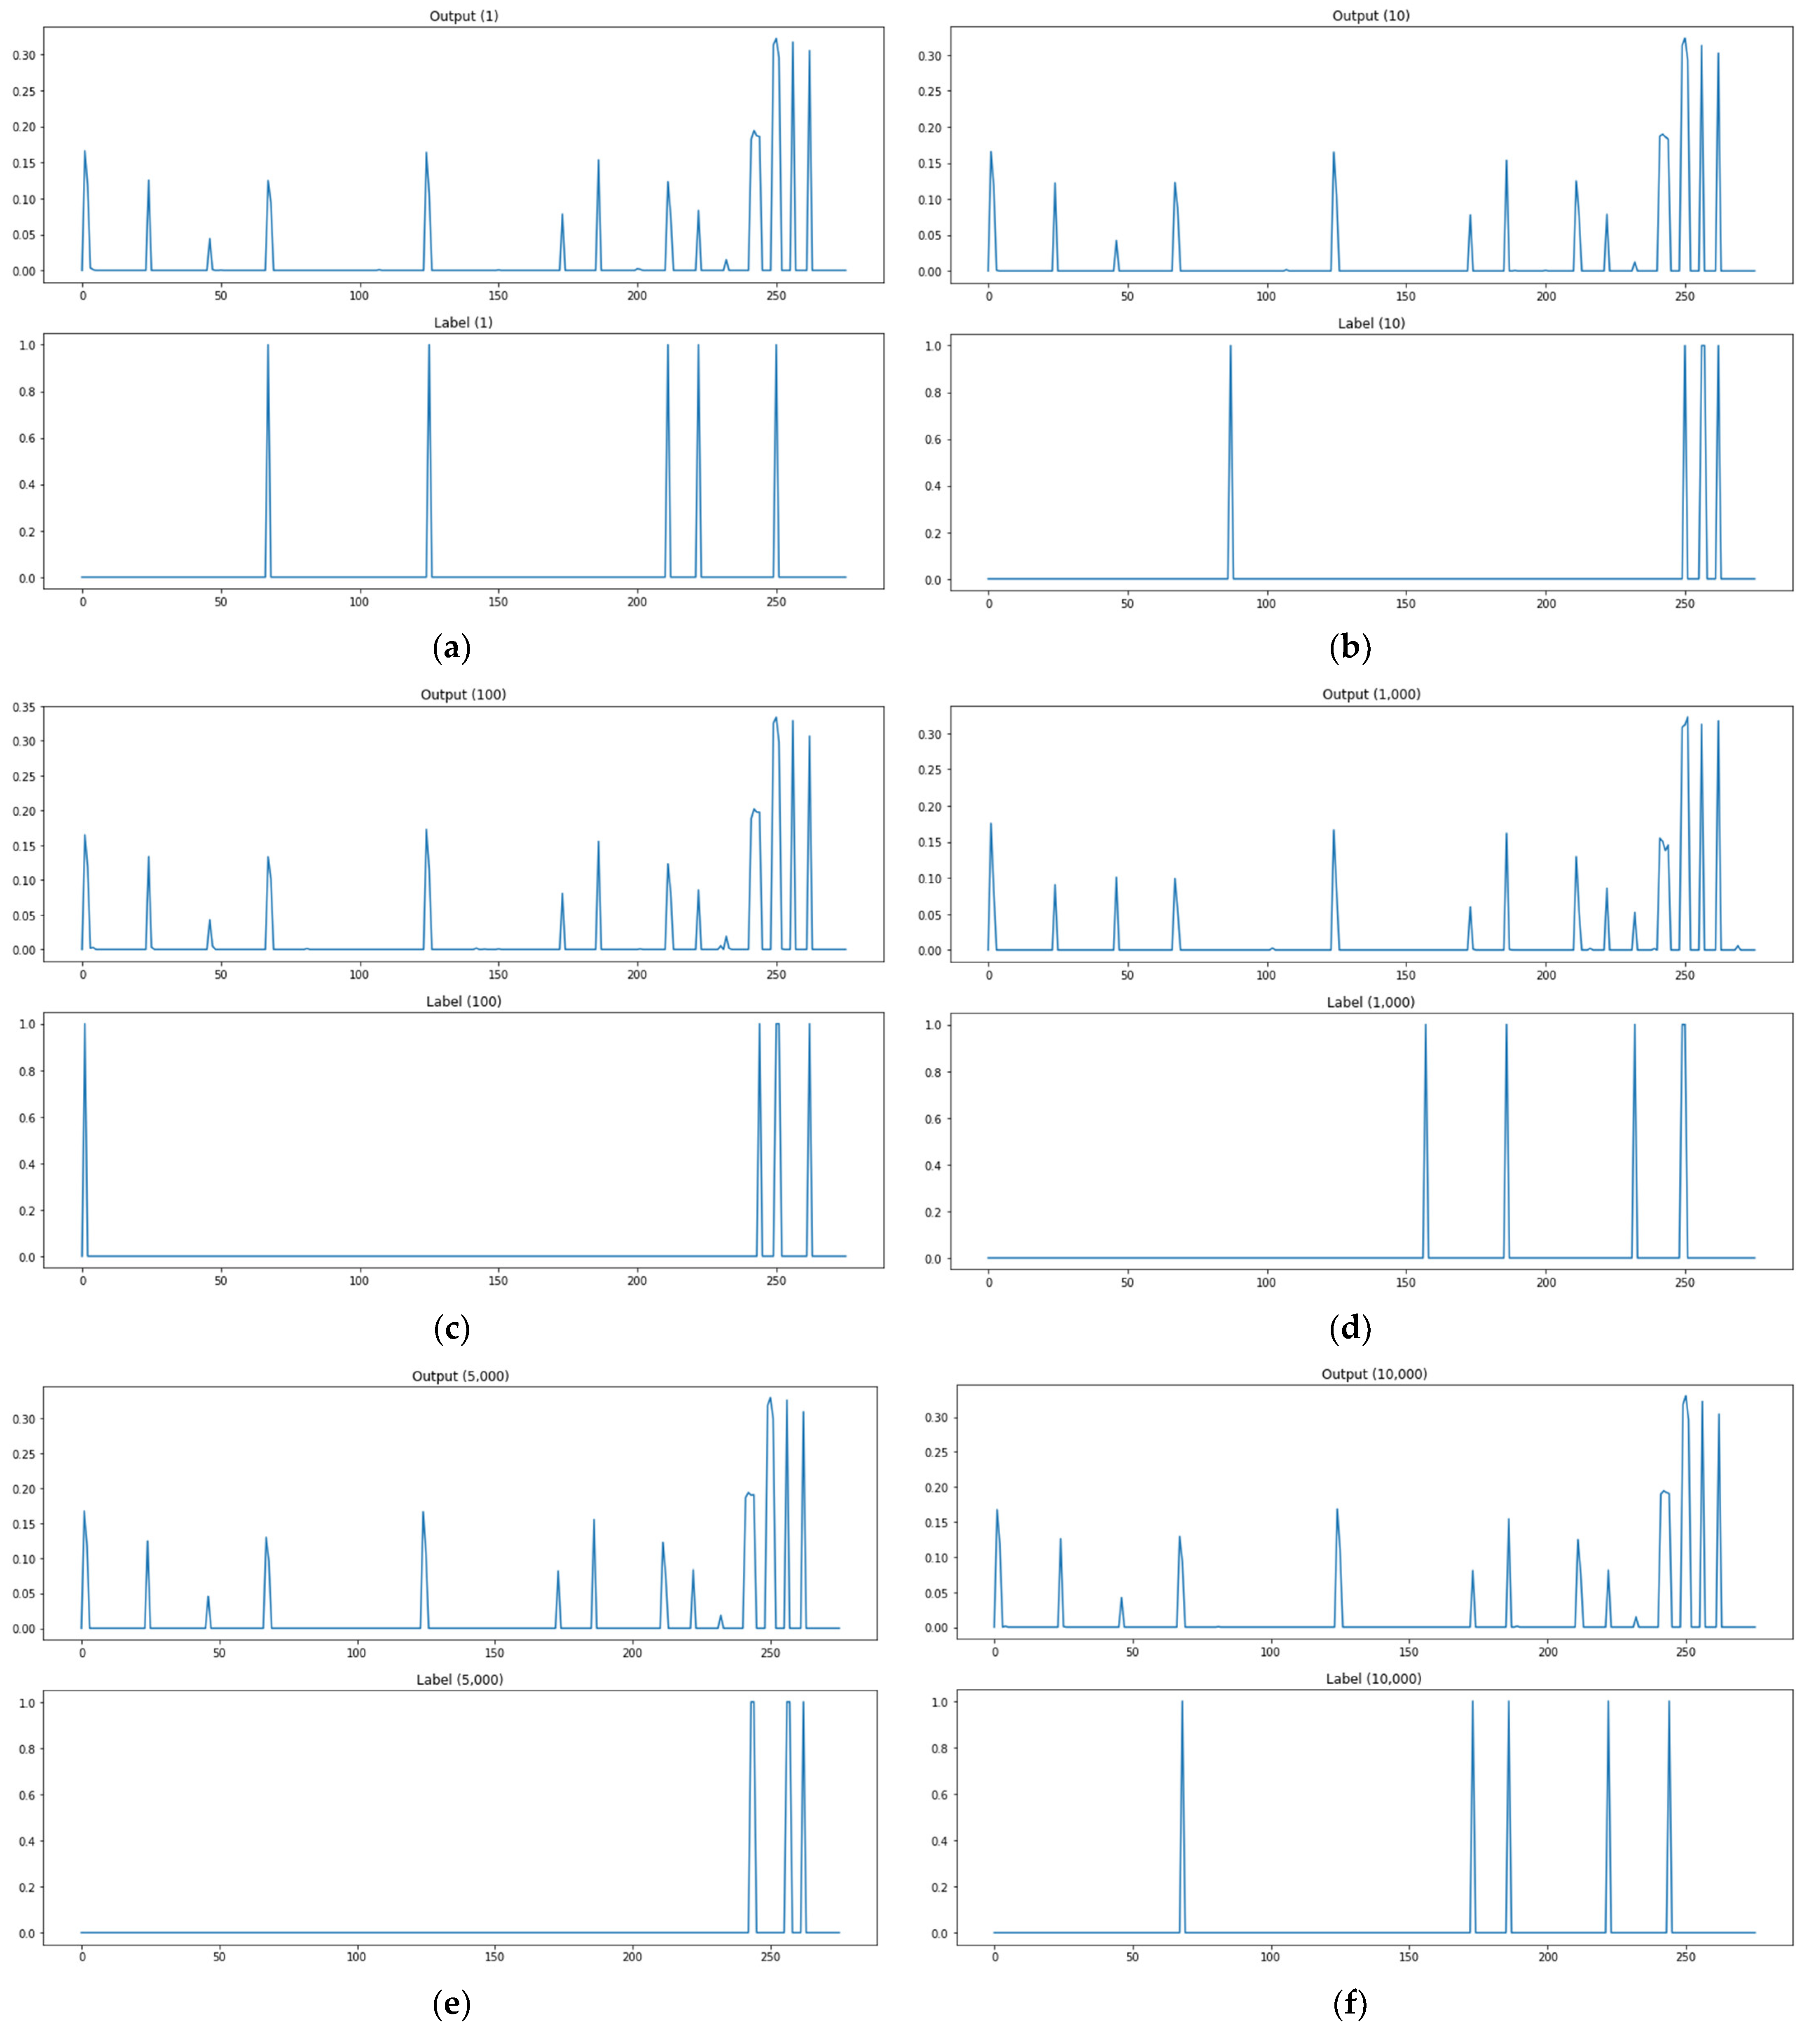
In an attempt to assess multiple output learning methods, the study compared the prediction results of attack paths between the kNN-classification-based algorithm adjustment method and kNN-regression-based algorithm adjustment method proposed in Section 3, the neural-network- and deep-learning-based model, Softmax function for the activation of the base model output layer, ReLU function for the activation of the base model output layer, and encoding-decoding model. The output of the model can be interpreted as the probability that the corresponding path will be used as an attack path. The attack path detection is performed by means of thresholding. The test data explained in Section 3 were used to assess the attack graph learning and creation model proposed in the study. Of the 20,000 test data, the lst, 10th, 100th, 1000th, 5000th, 10,000th, 15,000th, and 16,000th prediction results and labels were presented as prediction result examples. The example graph for each methodology consists of eight rows and two columns in total. A subgraph presents a pair of two rows. The upper row provides prediction results or outputs of the model, and the lower one provides labels (ground truth). Figure 9 shows an image of the performance evaluation result of the classification model (kNN classification) based on consisting of two forms. The label in the lower part is divided into 0 and 1 out of a total of 267 paths and 1 is the actual attack path point. The prediction in the upper part is divided into 0 and 1 out of a total of 267 paths and the point marked as 1 is the attack point predicted through the model. If the attack point of label and the attack point of prediction are the same, it is classified as attack prediction success. Figure 9b shows an image of the performance evaluation result of the prediction model (kNN regression, base model, sigmoid, Softmax, ReLU, encoding-decoding) based on consisting of two forms. The label in the lower part is divided into 0 and 1 out of a total of 267 paths and 1 is the actual attack path point. The prediction in the upper part is a total of 267 path data, and the base model (model 1) presents only points containing 30% or more probability values as a prediction model, and the analysis model (model 2, model 3, model 4) are predicted by classifying only points with 10% or more probability values. As for the criterion of the probability threshold for each model, a section in which the interval between the data generation frequency values was large was selected. If the attack point of label and the attack point of prediction are the same, it is classified as attack prediction success. The experimental results are provided in Figure 10, Figure 11, Figure 12, Figure 13, Figure 14 and Figure 15. Figure 10 shows the attack path prediction results and Figure 11, Figure 12, Figure 13, Figure 14 and Figure 15 present the output of the models 1 to 4 in Table 1.
In the example graph of attack paths for each methodology, the concerned index of each outcome vector was used to check whether there was an attack path for the classification-learning-based methodologies. The concerned index of each outcome vector was regarded as a probability value to be used as an attack path for the regression-learning-based methodologies. The focus of analysis was on how useful it would be to adjust the percentage of detecting no attack paths or mistaking attack paths based on the adjustment of threshold values for the probability of using the attack path of each link. The goal of the analysis was to determine whether the proposed methodologies based on multiple output learning were worth additional research as methods to predict an attack path or learn and create one. It also aimed to explore the possibilities of success, involving no specific performance evaluation. The binary classification issues based on local characteristics proposed in the study are more efficient and easier for application as attack graph learning and creation methods. Specific performance evaluation was carried out for binary classification issues based on local characteristics.
4.2.1. Performance Evaluation of Multi Output Learning Model
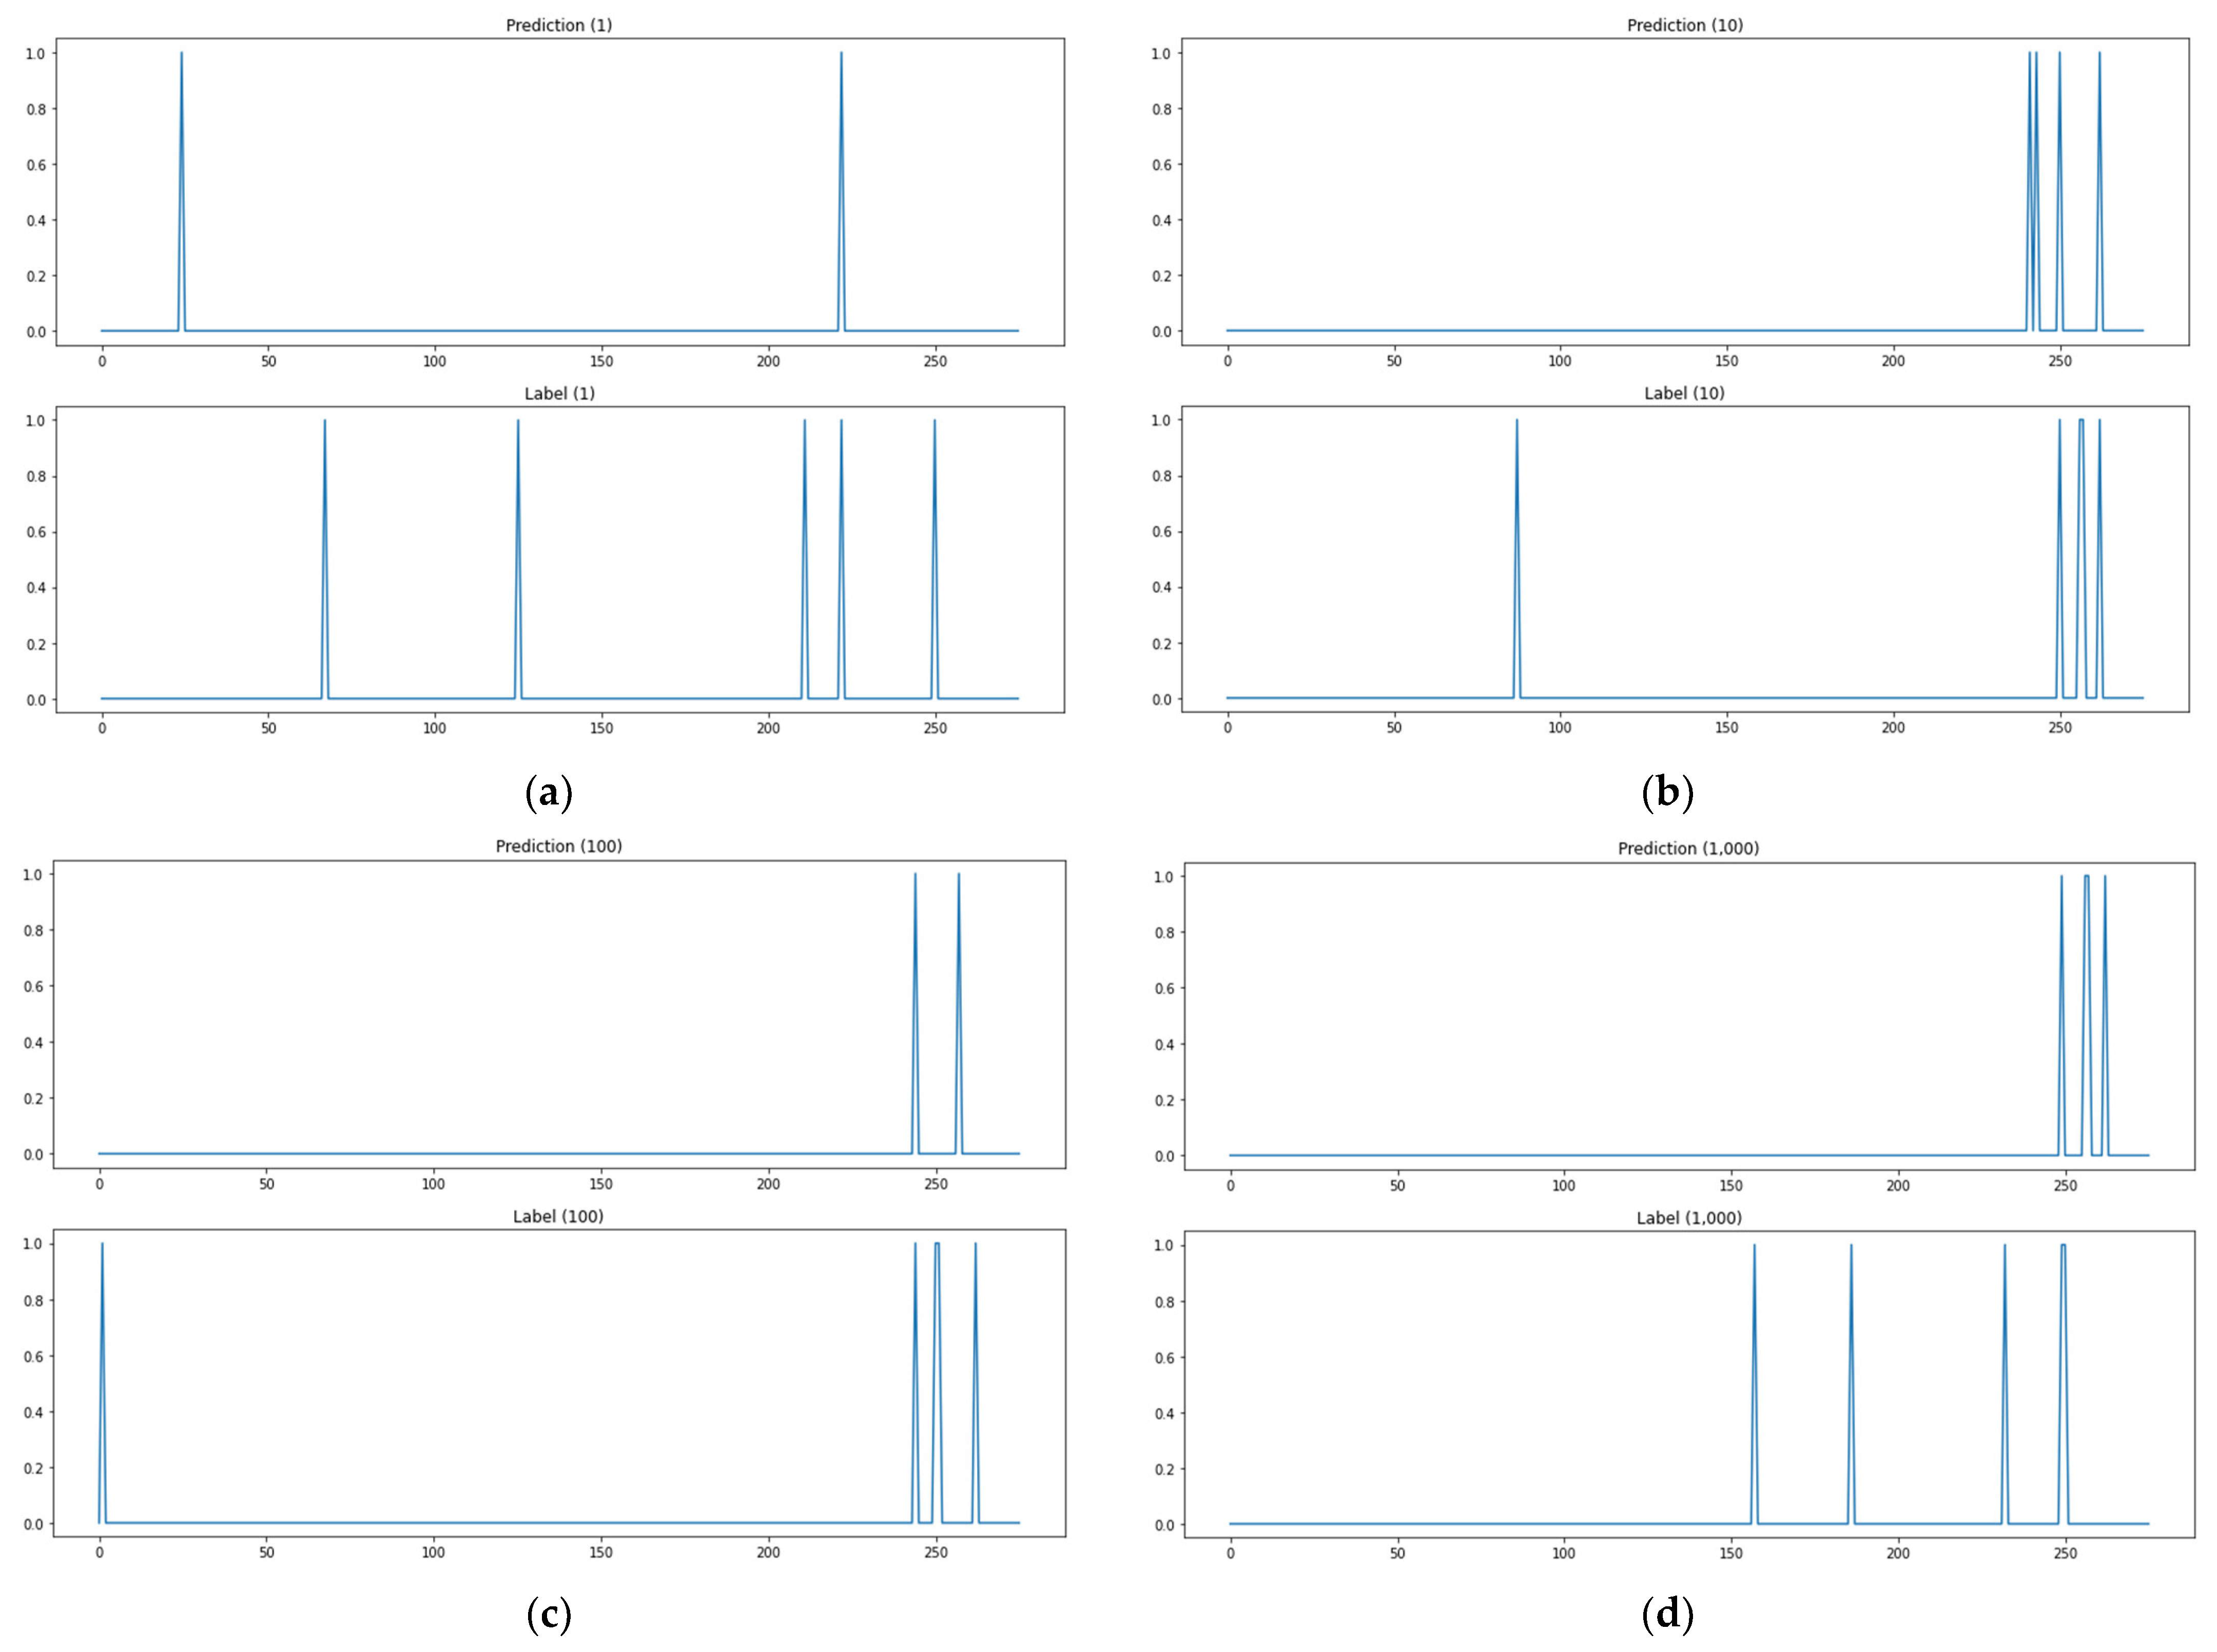
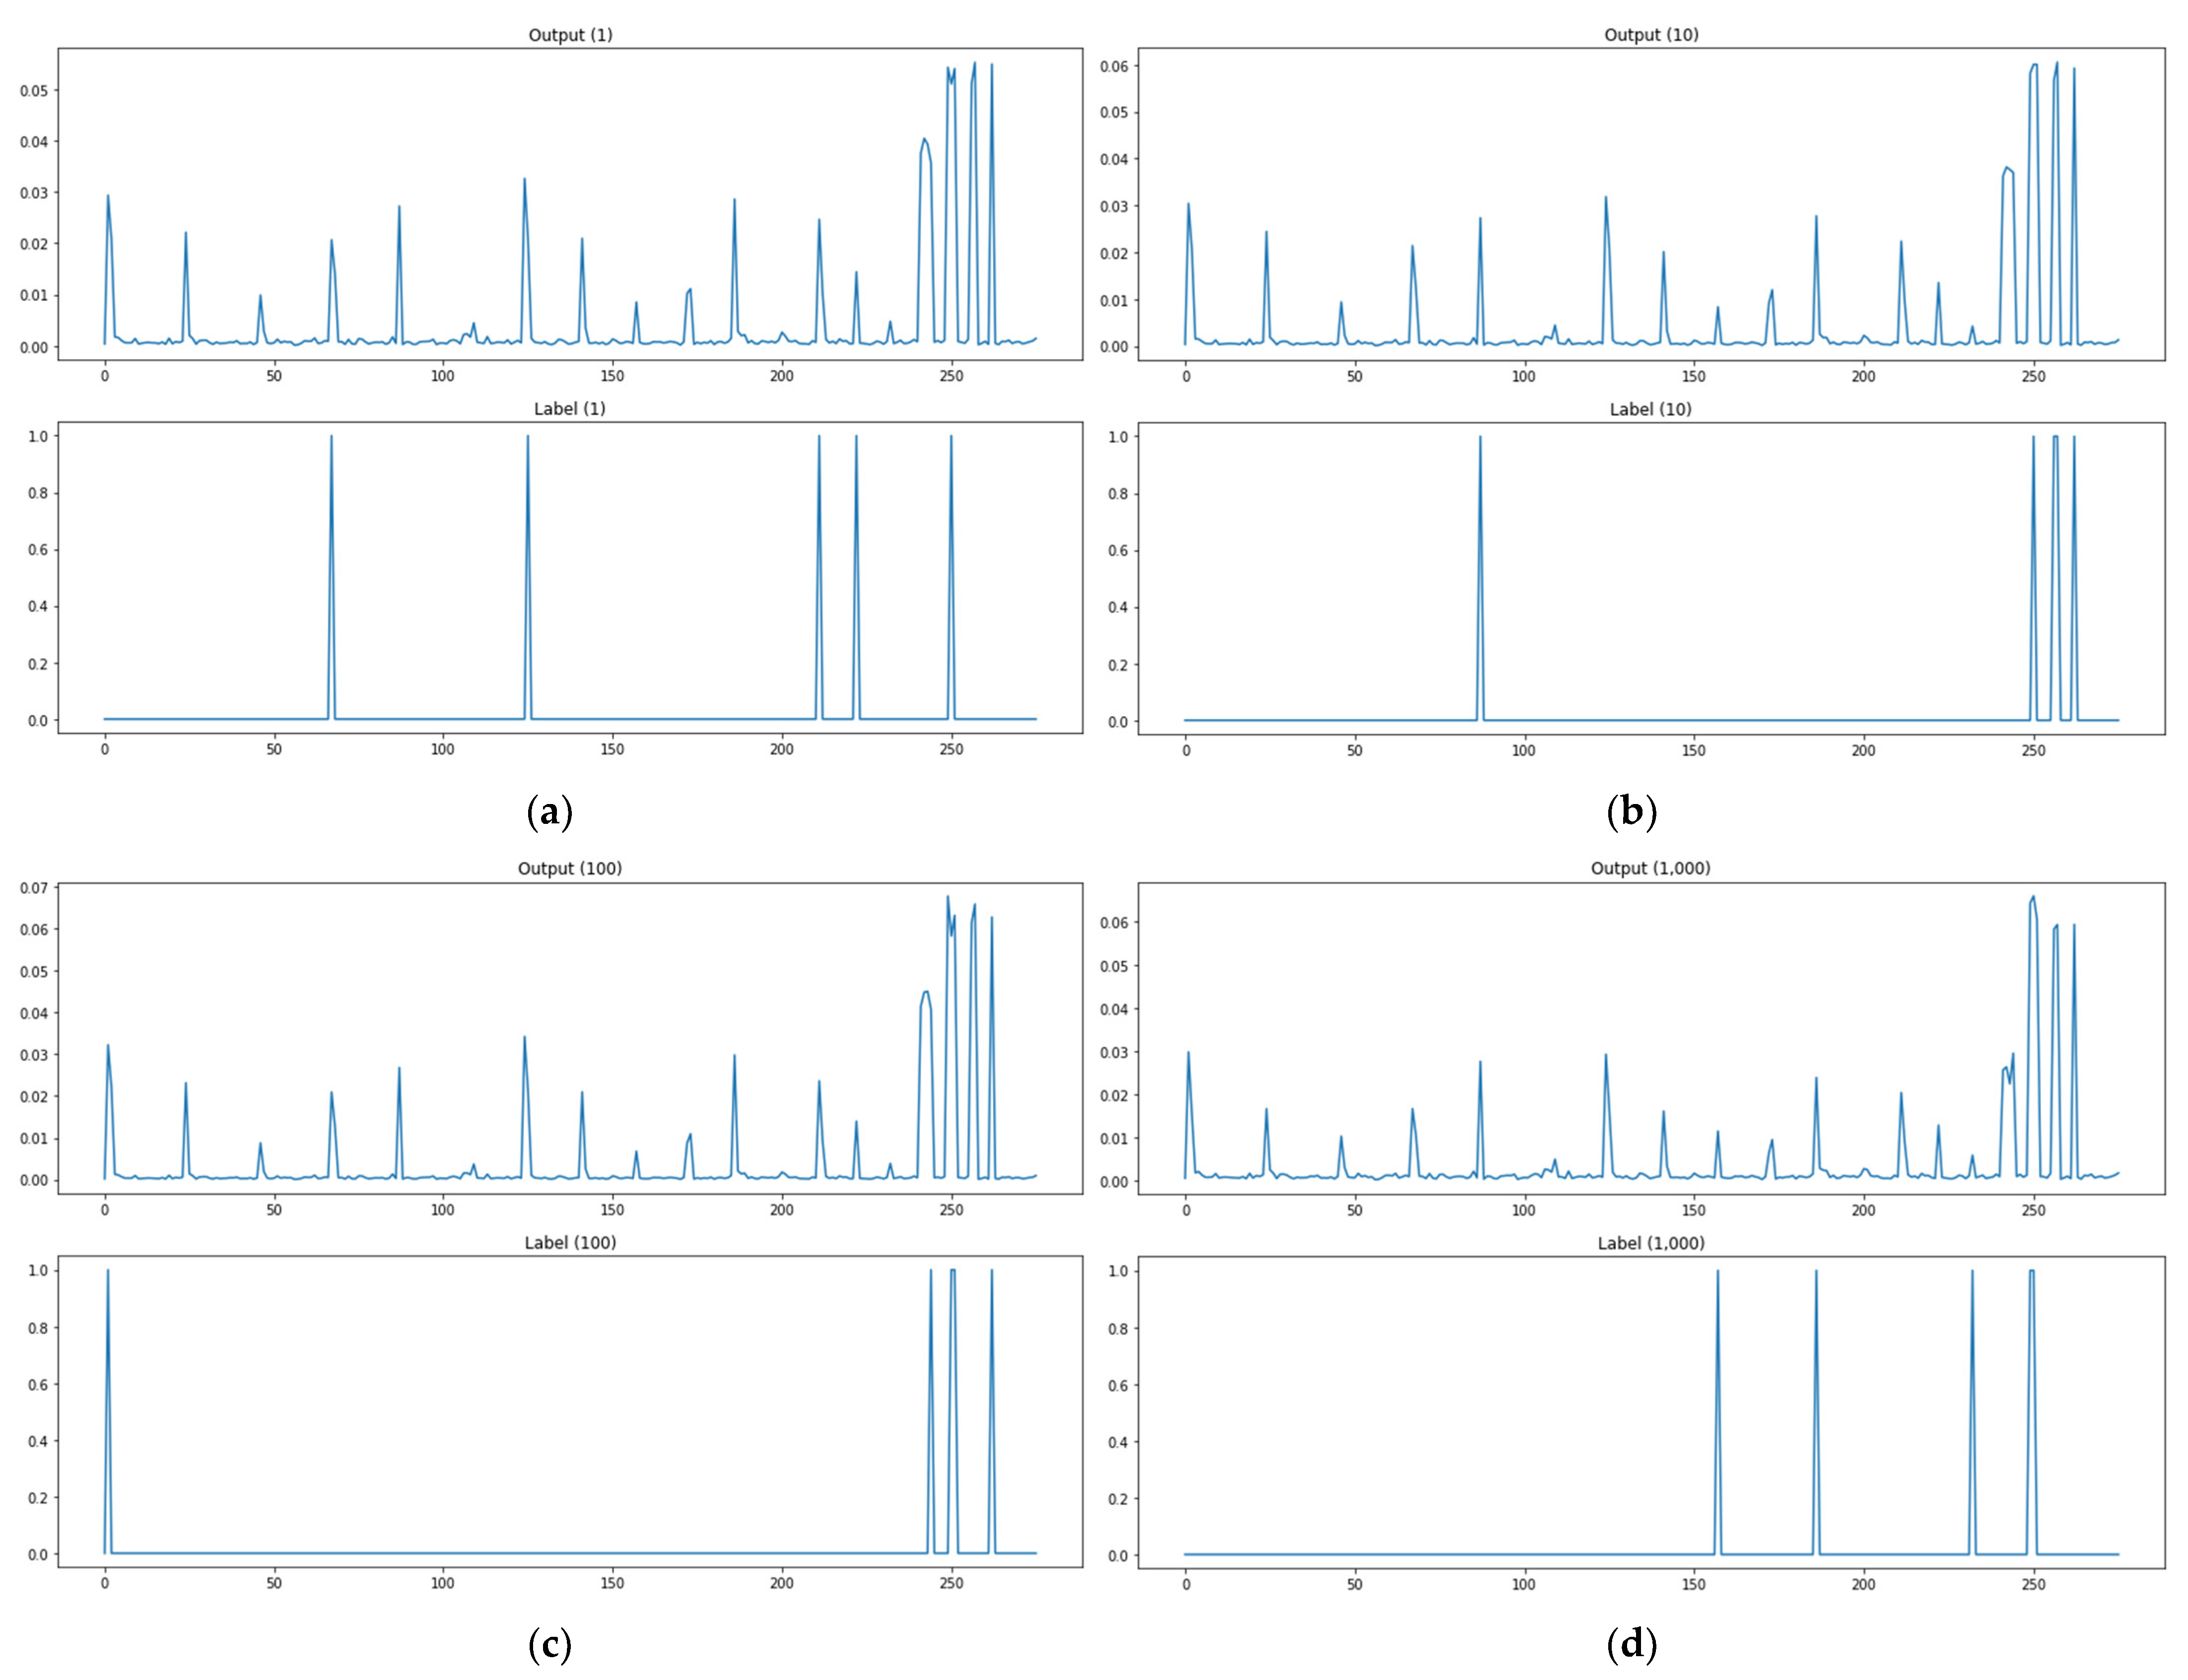
As shown in Figure 10a, when the path test data are 1, the actual attack point is 5 points, but the predicted attack point is 2 points, and the matched point of the actual attack point and the predicted attack point is 1 point. As shown in Figure 10, there are two matched attack points through the model when path test data are 10, and two matched attack points when test data are 100, one for 1000, zero for 5000, zero for 10,000, two for 15,000, and two for 16,000. Figure 10 shows the prediction outcomes of the kNN-classification-based algorithm adjustment method. This methodology has the advantage of analyzing outcomes easily by predicting attack paths, but the number of attack paths it predicted was small as seen in the sample of prediction outcomes in the figure below. The methodology also has high rates of detecting no attack paths and mistaking attack paths. These are data imbalance issues due to the relatively high number of 0 labels as the methodology solves each item of a label as a classification issue for the entire input data.
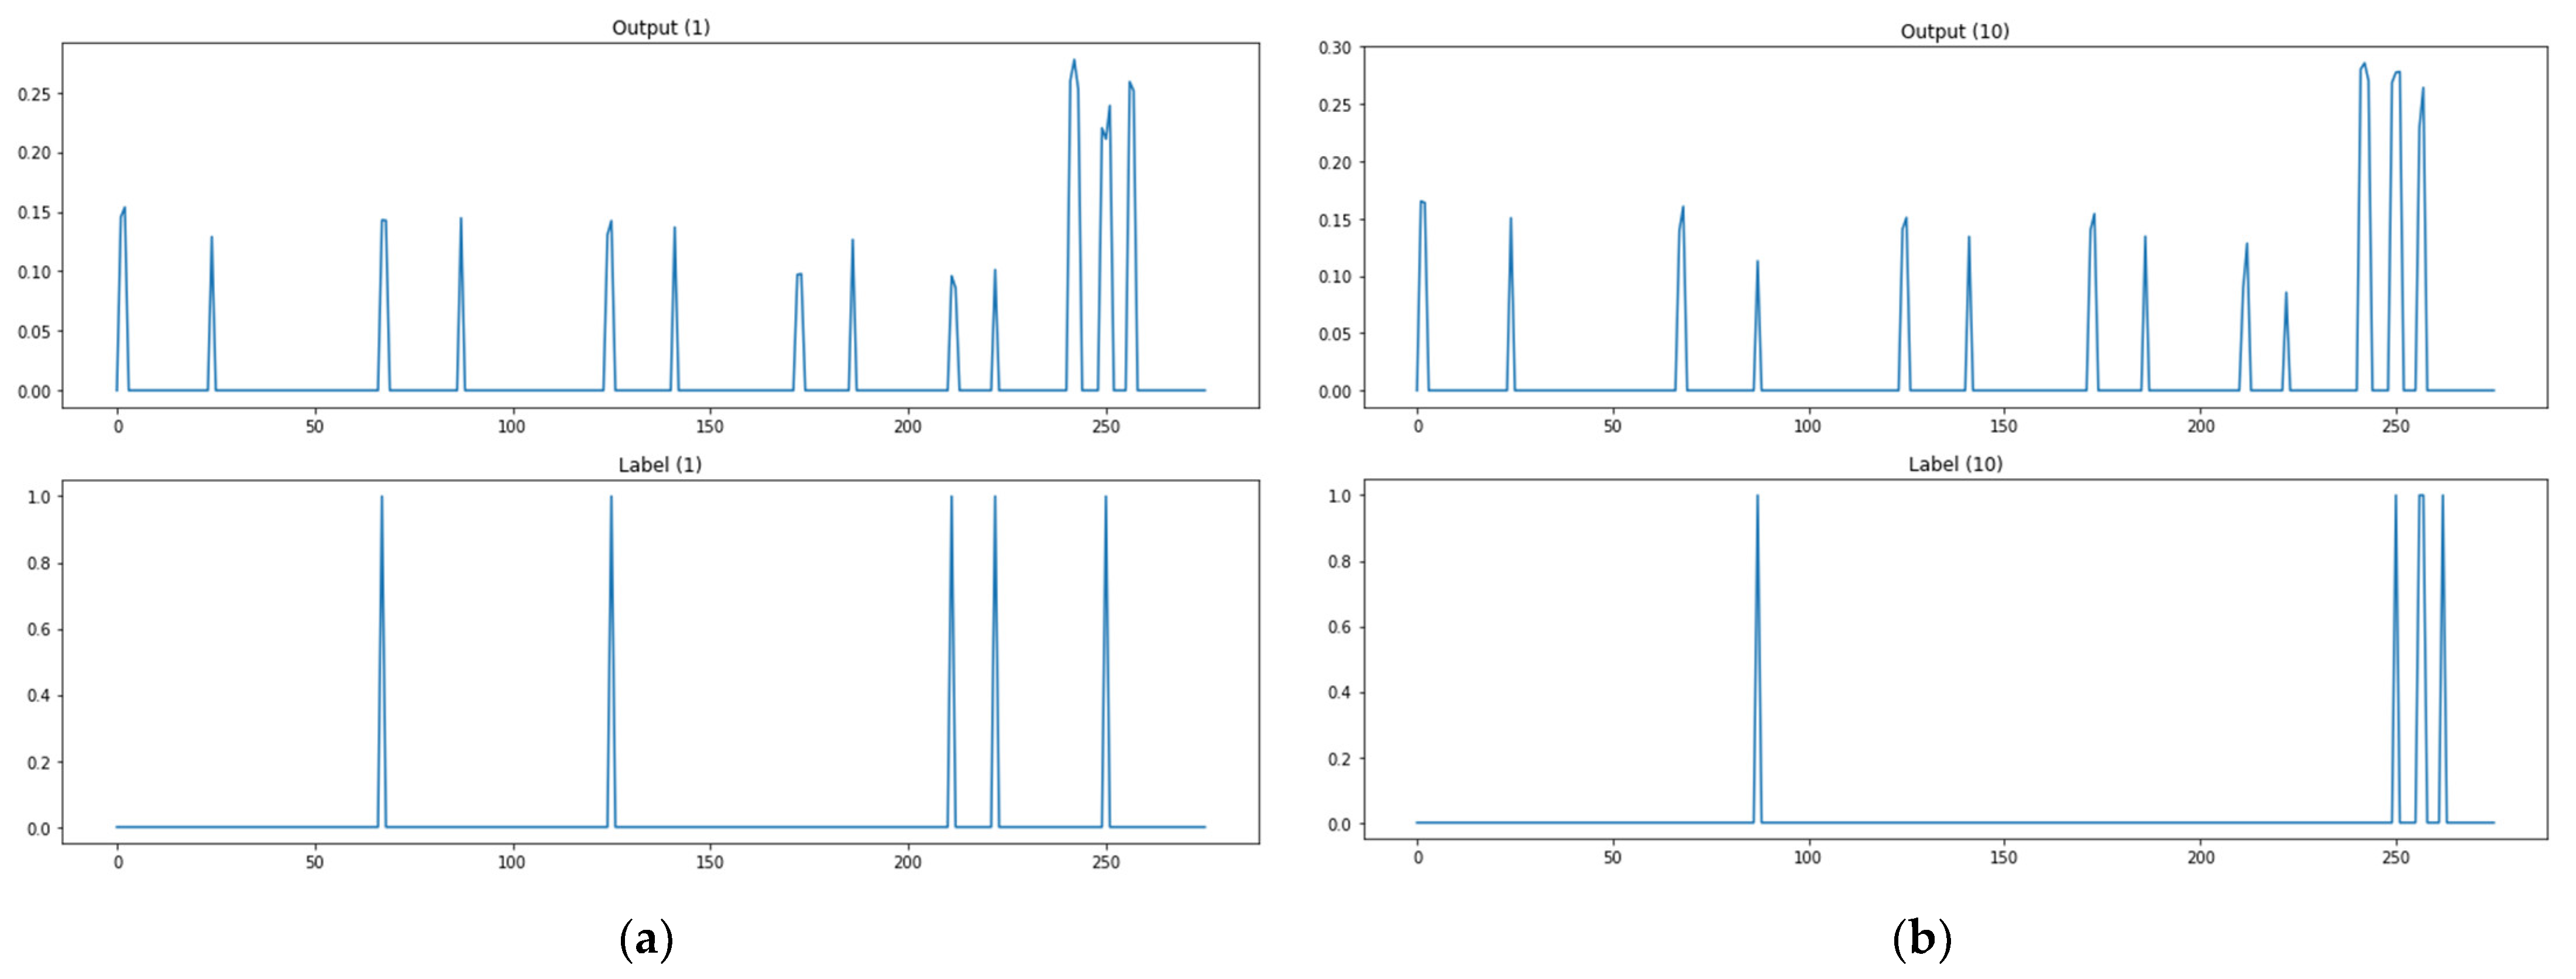
As shown in Figure 11a, when the path test data are 1, the actual attack point is 5 points, but the predicted attack point is 10 points, and the matched point of the actual attack point and the predicted attack point is 5 points. As shown in Figure 11, there are two matched attack points through the model when path test data are 10, and four matched attack points when test data are 100, three for 1000, three for 5000, two for 10,000, two for 15,000, and four for 16,000. Figure 11 shows the prediction results of the kNN-regression-based algorithm adjustment method. This methodology presents output values as probability values to use the concern links as attack paths instead of labels to check whether there are links. It records lower rates of detecting no attack paths and mistaking attack paths than the kNN-classification-based algorithm adjustment method, but it has problems with applying threshold values to extract an attack path. Threshold values that are too low will increase the cases of mistaking attack paths, and threshold values that are too high will increase the cases of detecting no attack paths.
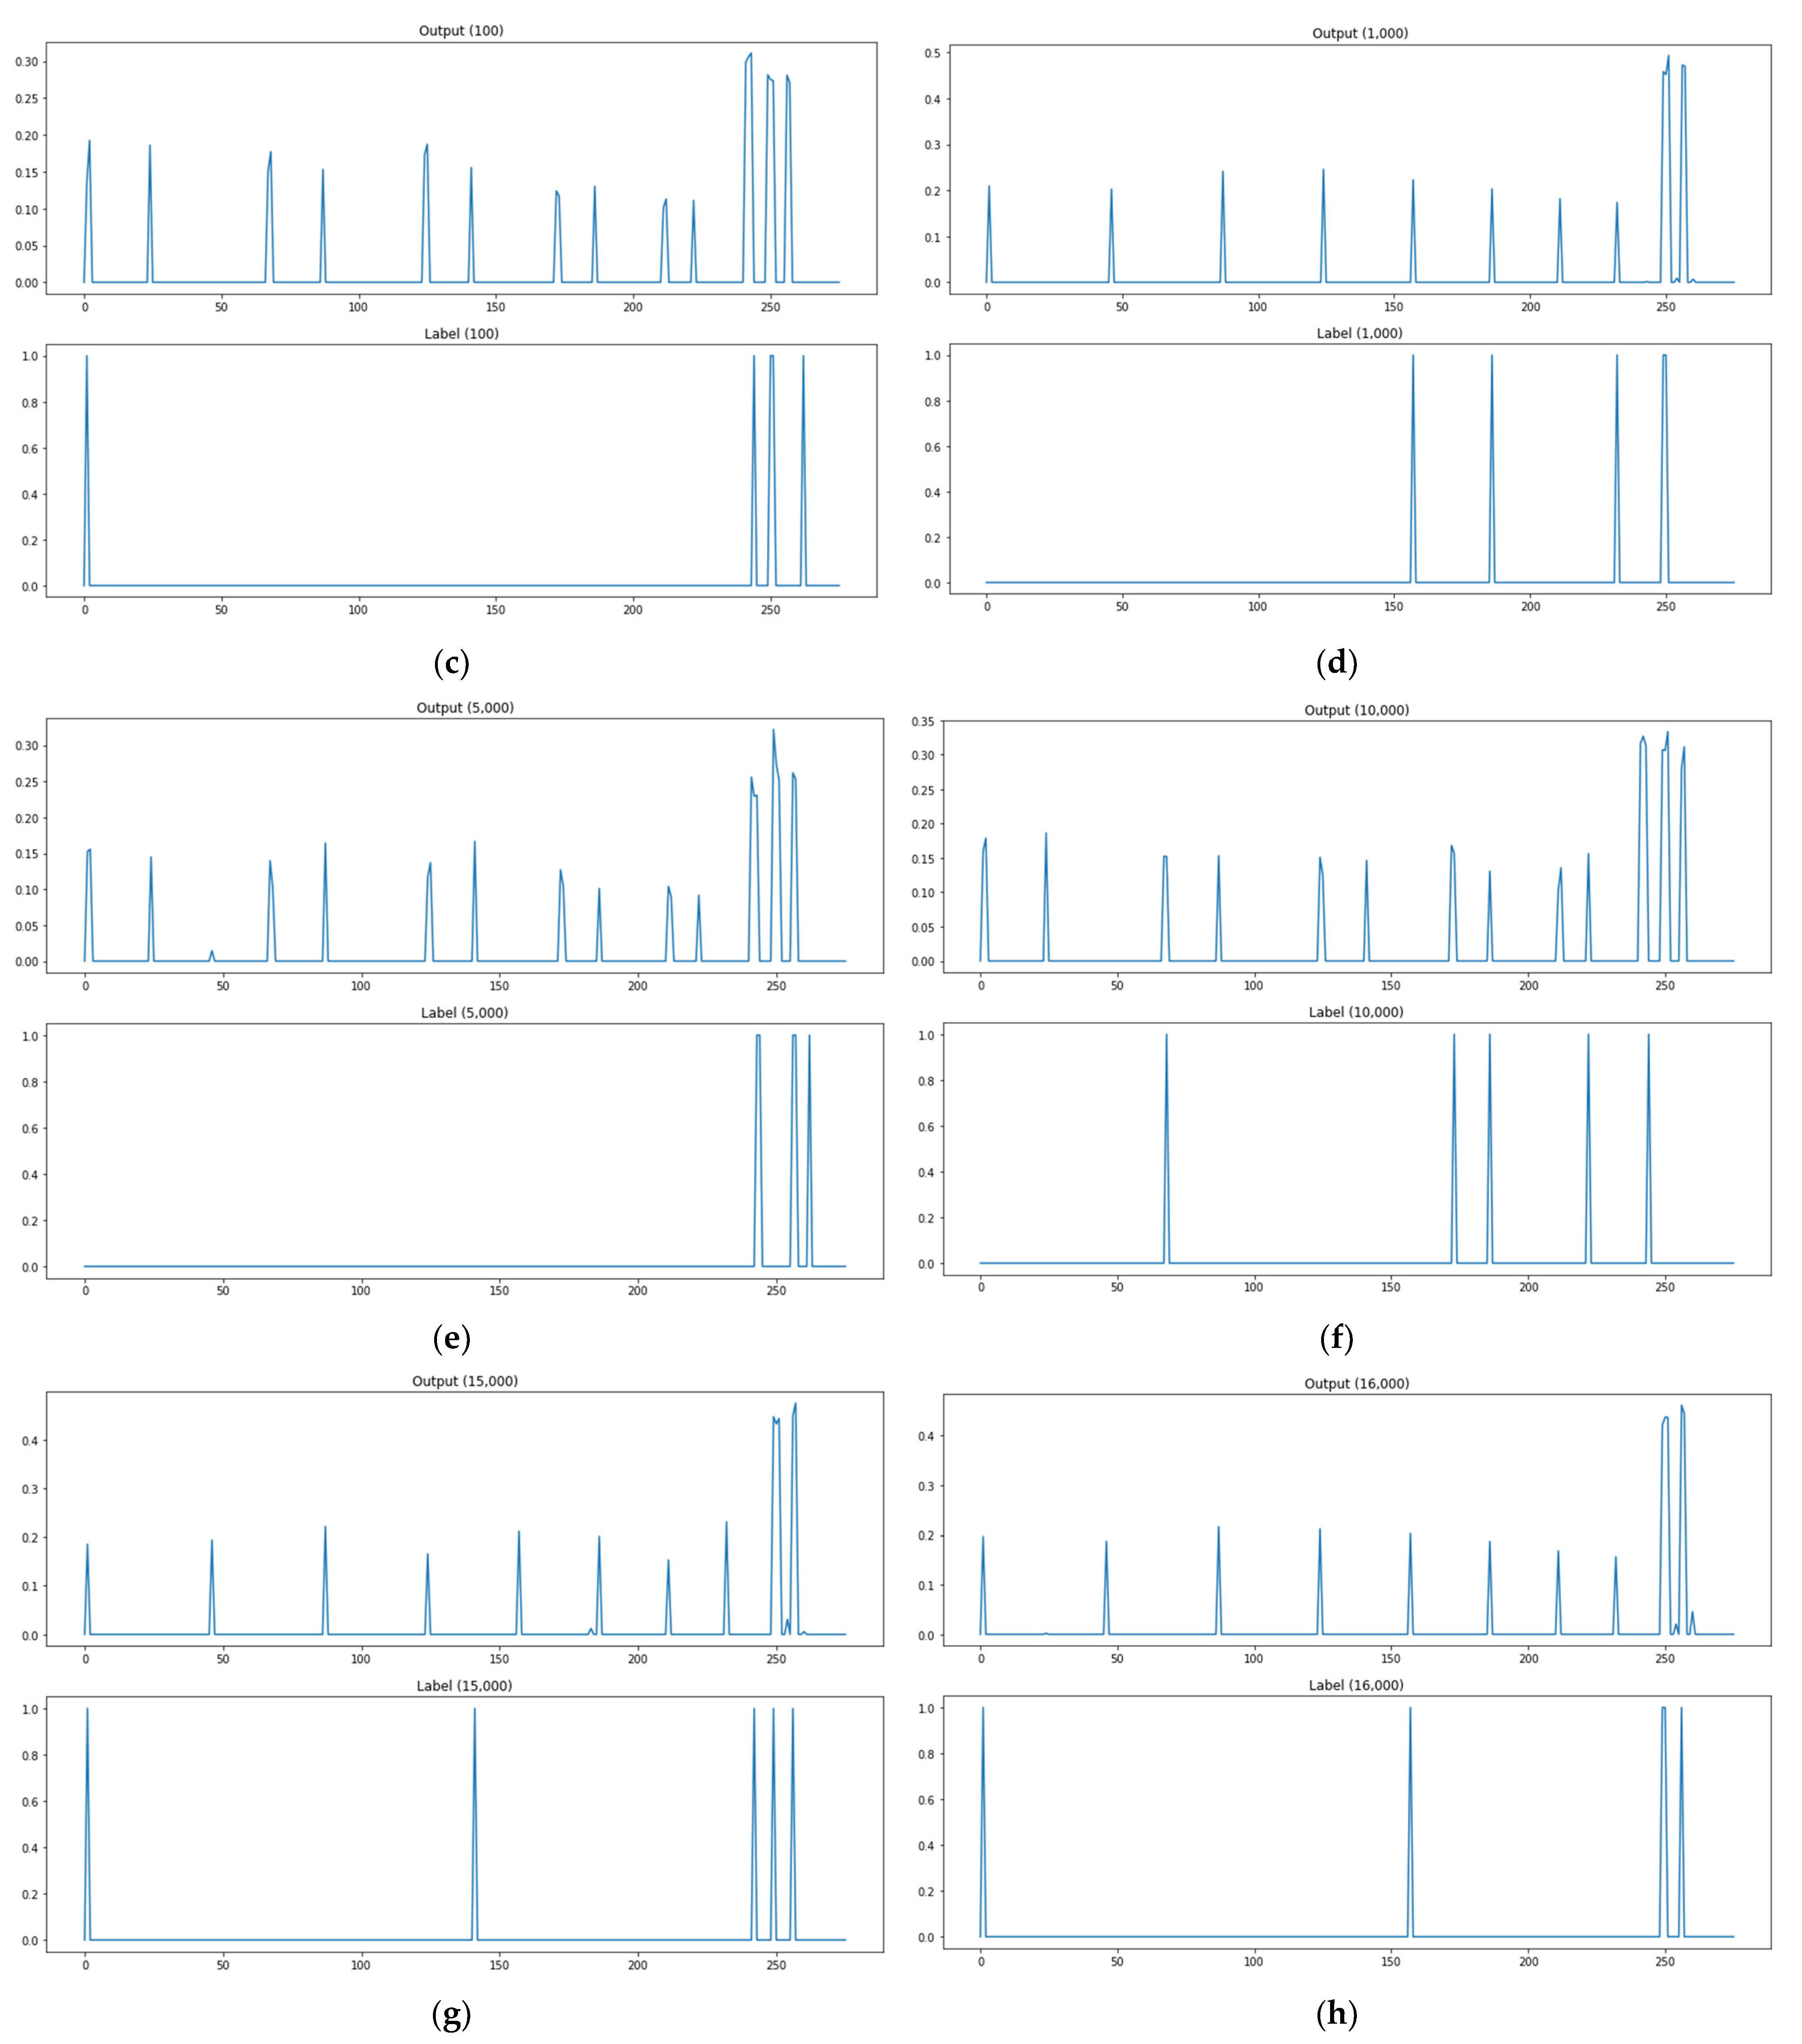
As shown in Figure 12a, when the path test data are 1, the actual attack point is 5 points, but the predicted attack point (more than 0.3) is 3 points, and the matched point of the actual attack point and the predicted attack point is 2 points. As shown in Figure 12, there are zero matched attack points through the model when path test data are 10, and one matched attack point when test data are 100, three for 1000, two for 5000, one for 10,000, two for 15,000, and three for 16,000. Figure 12 shows the prediction results of the neural network and deep-learning-based model. This methodology presents output values as probability values in order to use the concern links as attack paths instead of labels to check whether there are links, as well. Its prediction result examples confirm that it has improved the rates of detecting no attack paths and mistaking attack paths from the kNN-regression-based algorithm adjustment method. This methodology has few cases of detecting no attack paths and relatively many cases of mistaking attack paths. It can be fully used as an attack graph learning and creation method by adjusting threshold values properly.
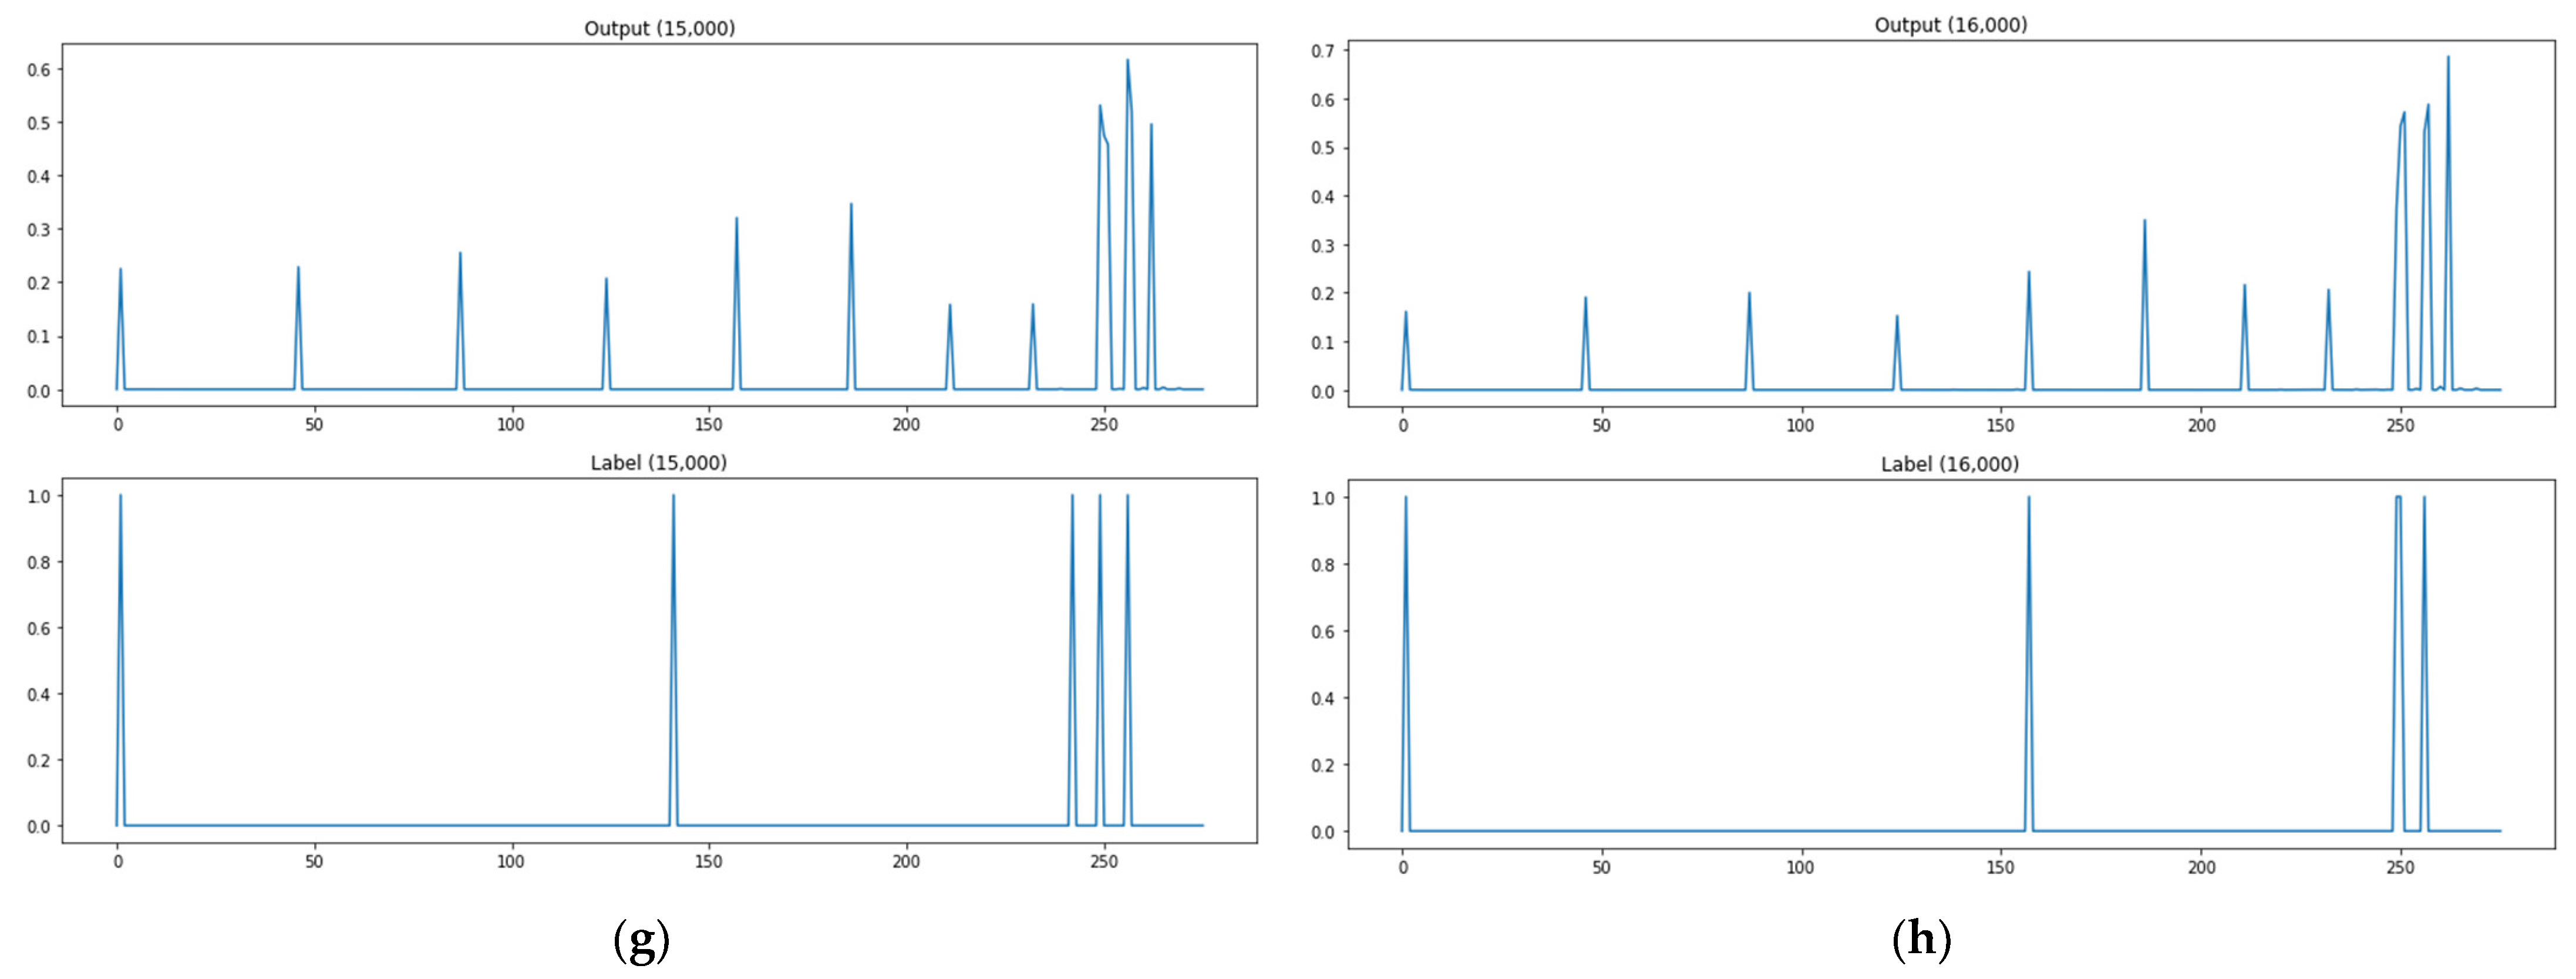
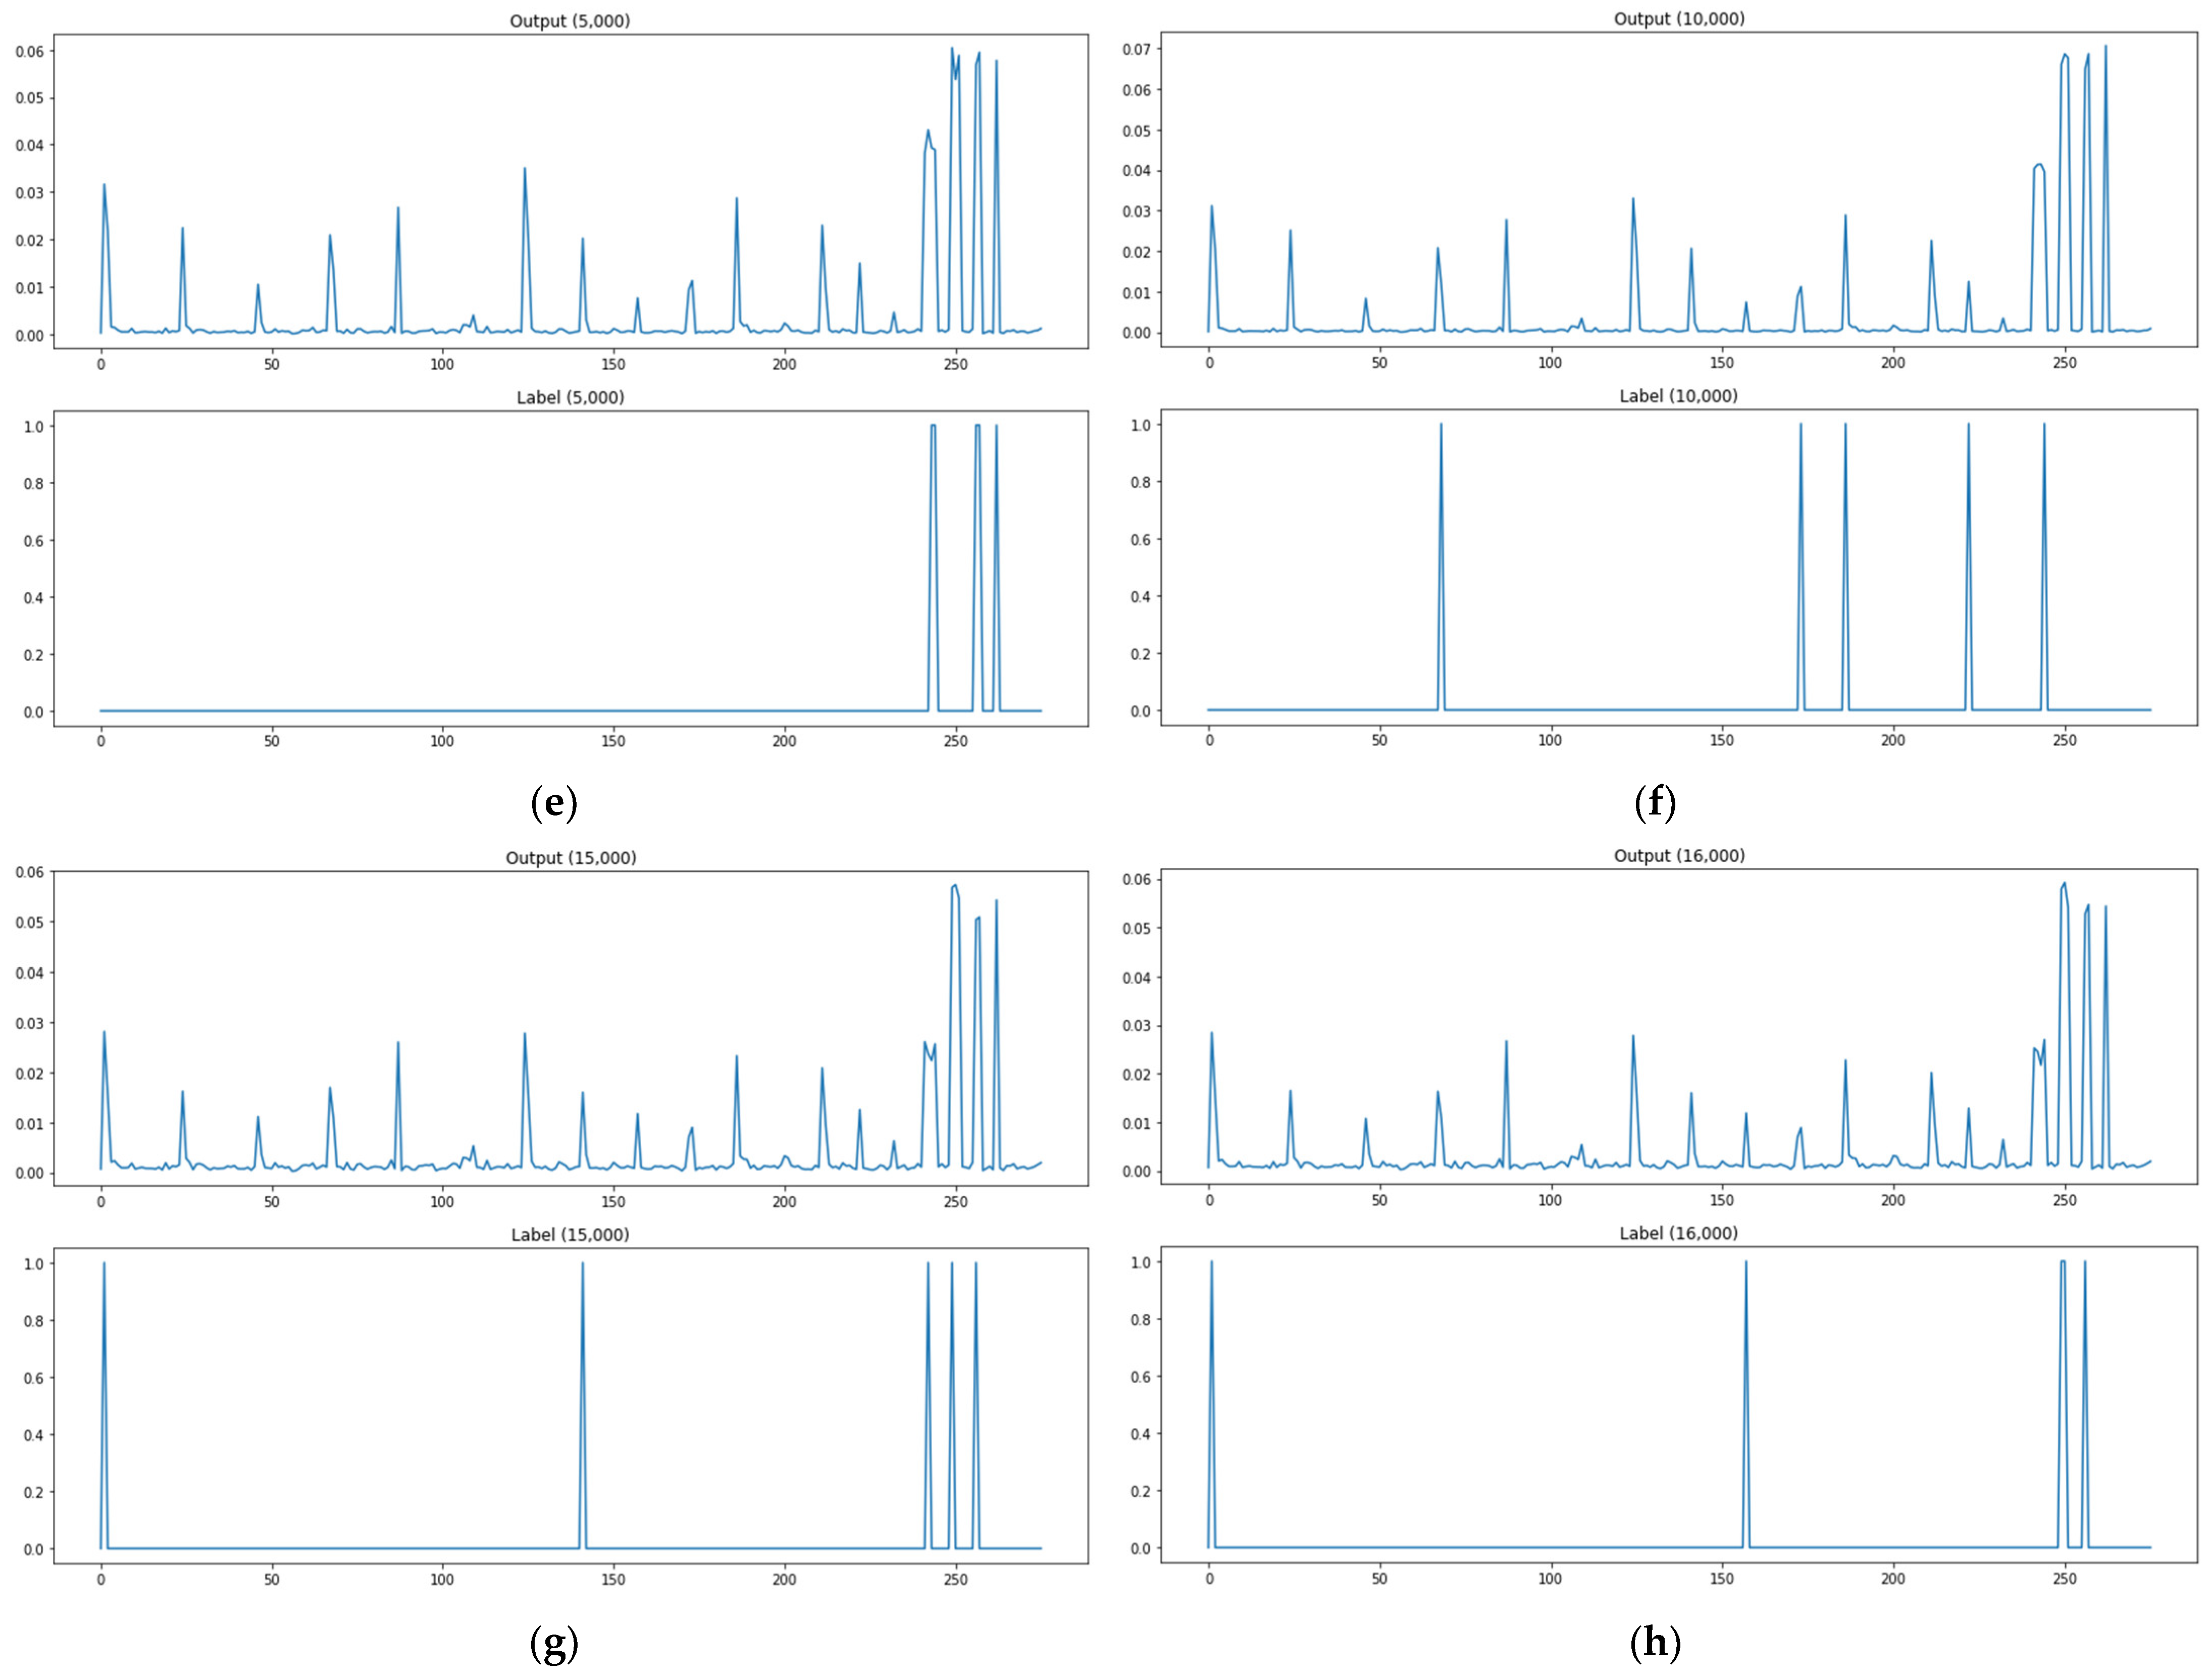
As shown in Figure 13a, when the path test data are 1, the actual attack point is 5 points, but the predicted attack point (more than 0.3) is 0 points, and the matched point of the actual attack point and the predicted attack point is 0 points. As shown in Figure 13, there are zero matched attack points through the model when path test data are 10, and zero matched attack points when test data are 100, zero for 1000, zero for 5000, zero for 10,000, zero for 15,000, and zero for 16,000. Figure 13 shows the prediction results of a changed activation function (Softmax function) in the base model output layer. Compared with the base model, it has lower performance in detecting no attack paths. However, its performance improved from the base model in mistaking attack paths.
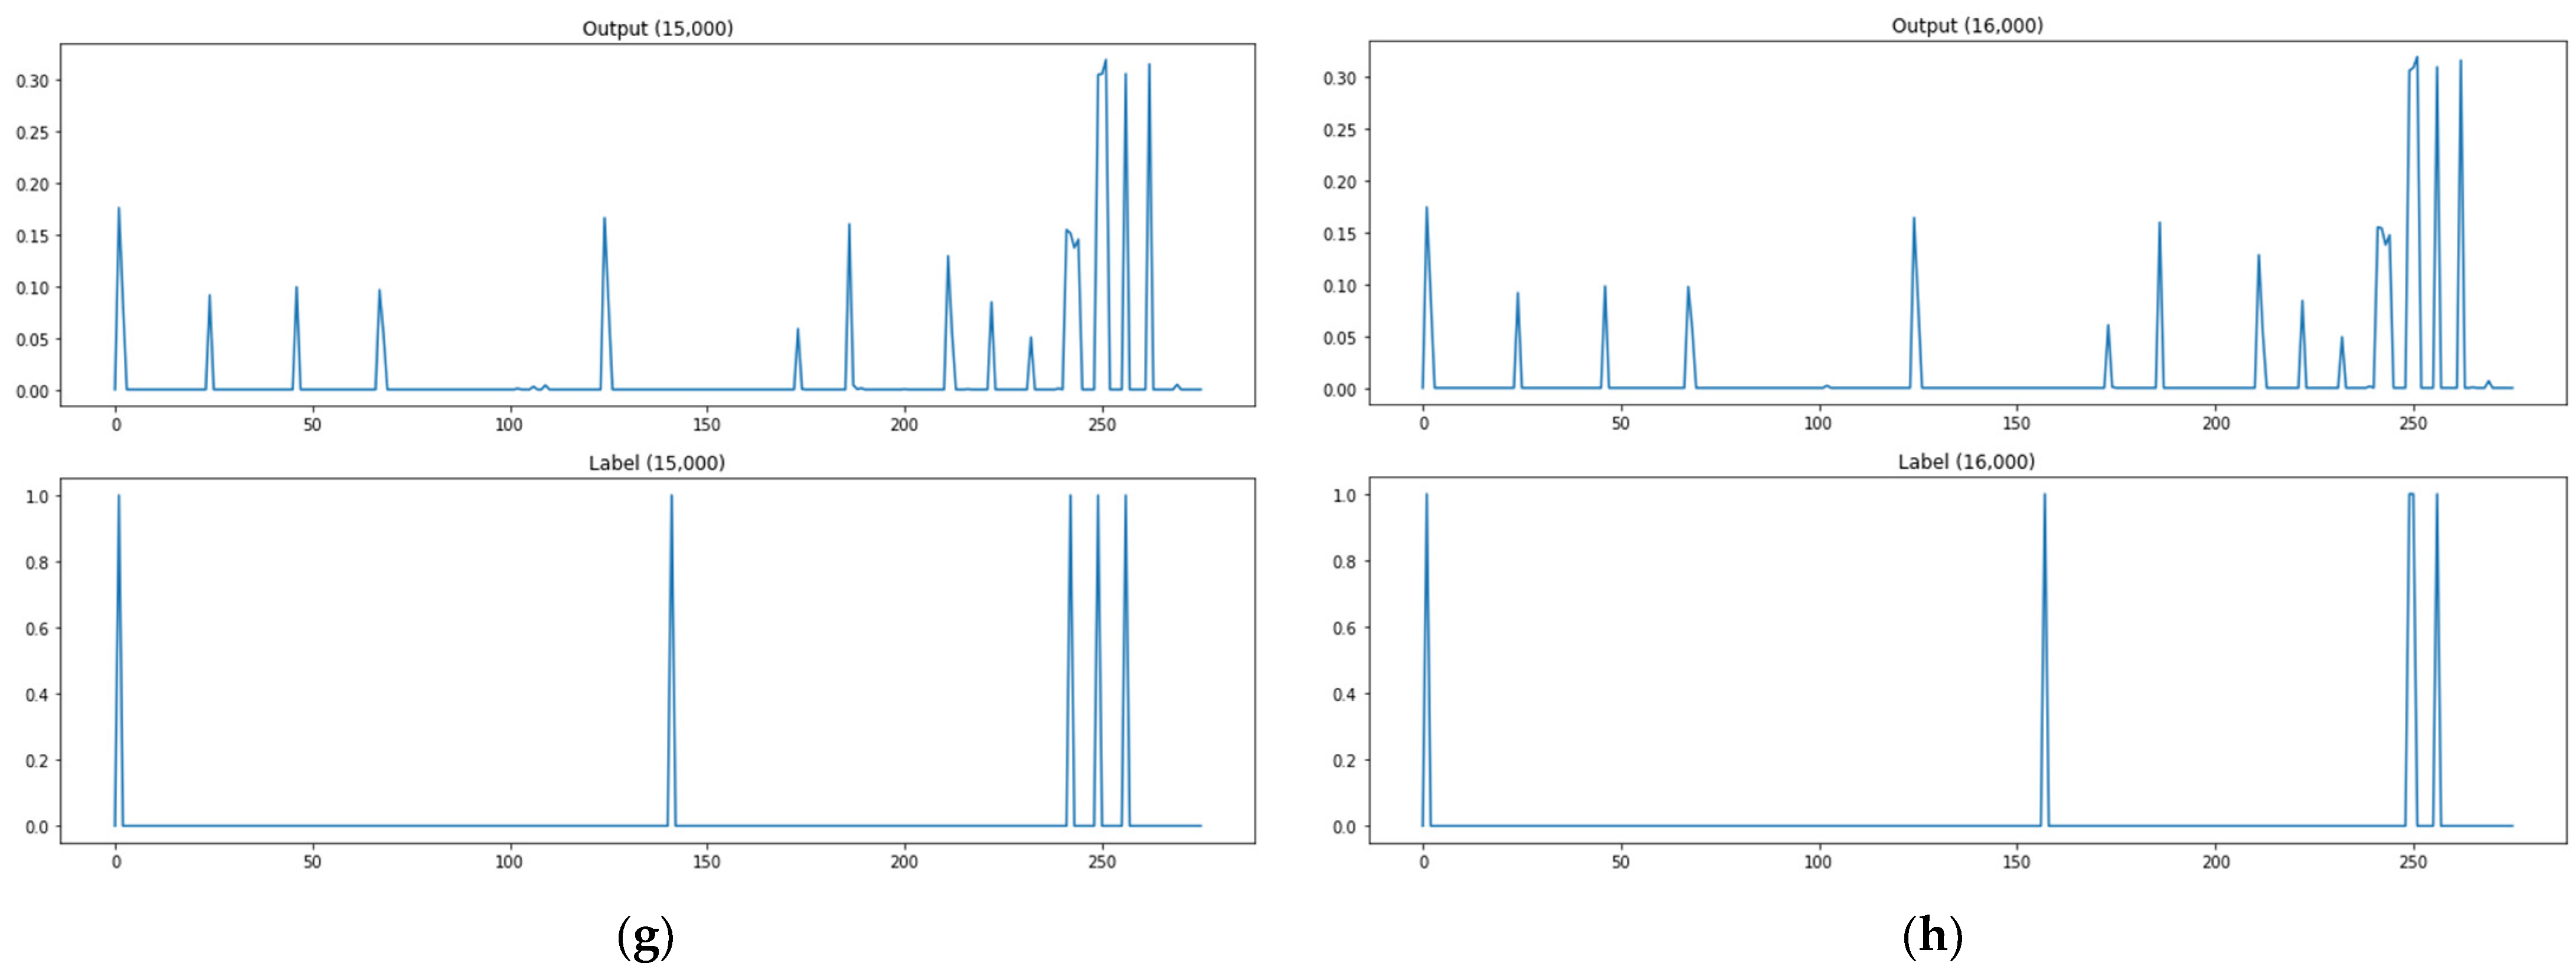
As shown in Figure 14a, when the path test data are 1, the actual attack point is 5 points, but the predicted attack point (more than 0.3) is 23 points, and the matched point of the actual attack point and the predicted attack point is 5 points. As shown in Figure 14, there are four matched attack points through the model when path test data are 10, and four matched attack points when test data are 100, five for 1000, four for 5000, five for 10,000, three for 15,000, and five for 16,000. Figure 14 presents the prediction results of a changed activation function (ReLU function) in the base model output layer. It certainly showed waveform changes compared with the base model and Softmax function, but it had no large differences from the base model in terms of detecting no attack paths and mistaking attack paths as in the Softmax function.
As shown in Figure 15a, when the path test data are 1, the actual attack point is 5 points, but the predicted attack point (more than 0.3) is 14 points, and the matched point of the actual attack point and the predicted attack point is 2 points. As shown in Figure 15, there are three matched attack points through the model when path test data are 10, and five matched attack points when test data are 100, three for 1000, four for 5000, five for 10,000, four for 15,000, and four for 16,000. Figure 15 presents the prediction results of the encoding-decoding model. It shows waveform changes (probability of using an attack path in each link) compared with the base model, but it had no large differences from the base model in terms of detecting no attack paths and mistaking attack paths.
4.2.2. Performance Evaluation of Binary Classification Learning Model
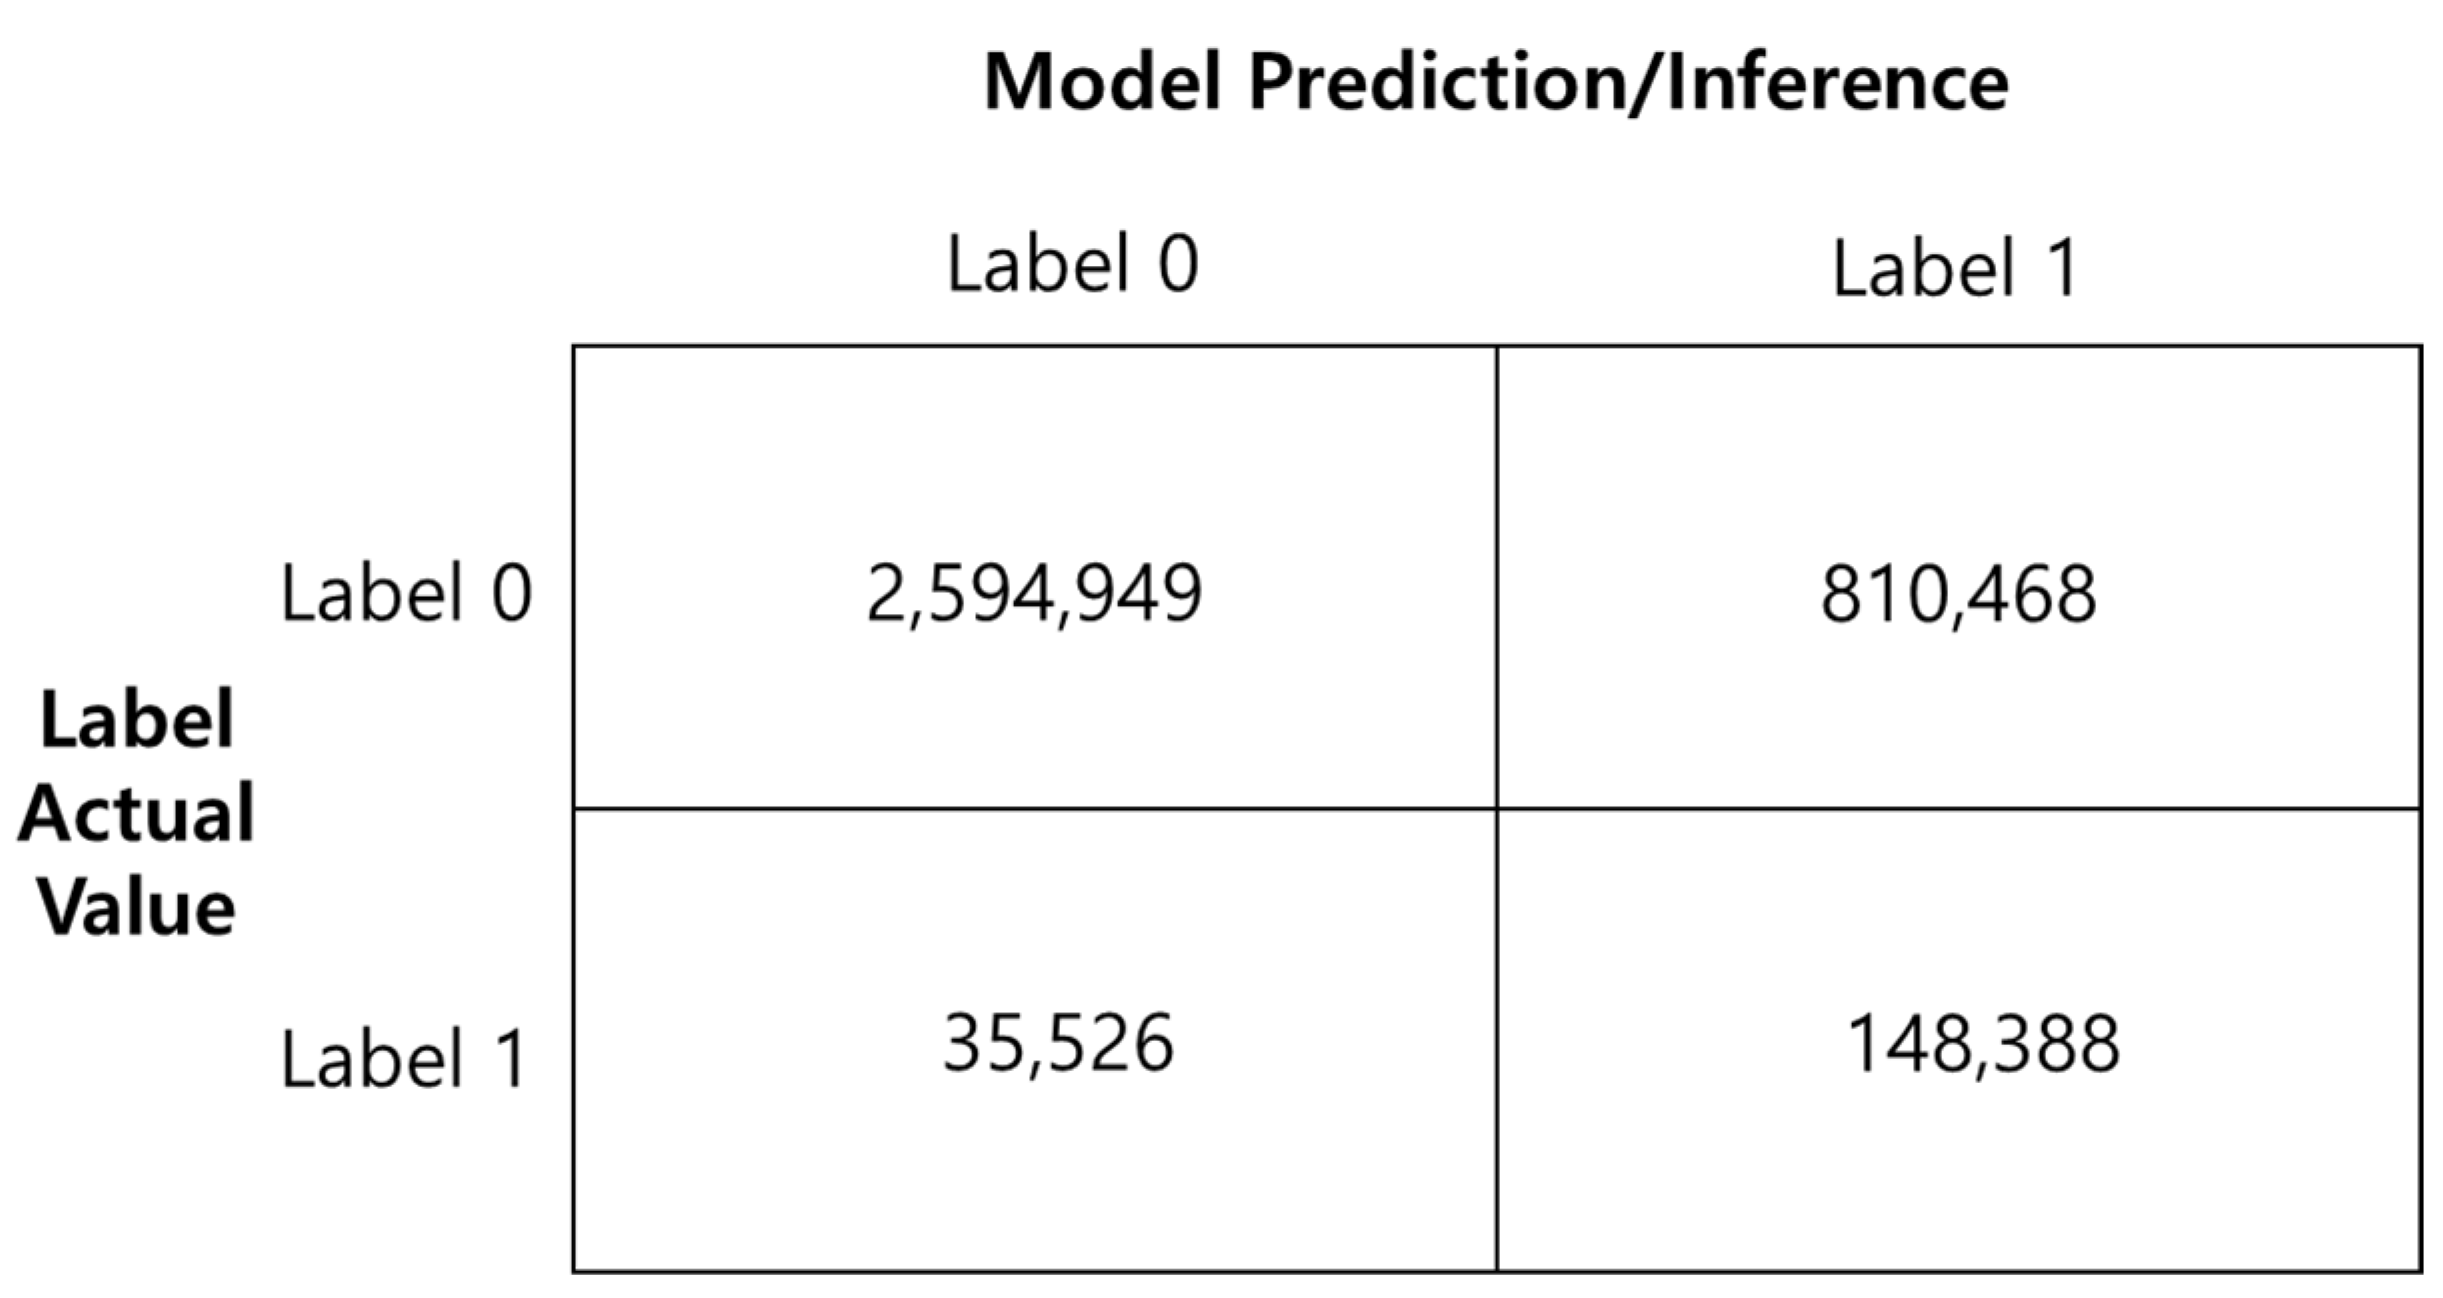
The attack graph learning and creation issue defined as a multiple output learning issue proposed as a basic model in the research task was defined as a simpler issue. To overcome the limitations of multiple output learning, binary classification issues based on local characteristics were defined in order to define an attack graph learning and creation issue. To assess this method, a total of 14,356,677 local characteristics and labels for learning purposes were used to learn an attack graph model as explained in Section 3. A total of 3,589,331 local characteristics and labels for testing purposes were used to assess its performance. Of 14,356,677 learning data used in the learning, 784,026 and 13,608,651 belonged to Label 1 for attack paths and Label 0, respectively. Of 3,589,331 test data, 183,914 and 3,405,417 belonged to Label 1 and 0, respectively. In attacks by hackers, some nodes, i.e., computers or network devices containing vulnerabilities are used as attack paths. As a result, Label 1 representing the attack path is very small compared to Label 0, which is not included in the attack paths. Figure 16 shows a confusion matrix for the evaluation results.
The experiment results indicate that overall accuracy as recalled in terms of the entire system classification was 76.43%. The accuracy of Label 1 as recalled in terms of detecting attack path and Label 0 as recalled in terms of links that were not attack paths was 80.68% and 76.20%, respectively. The revised precision proposed in the research task was 69.14% when it was calculated with the weight of 0.9 and the weight of 0.1. In the research task, detecting no attack paths was considered to be a more important evaluation index than mistaking attack paths on an attack graph, which led to the weights of 0.9 and 0.1 for the cases, respectively.
As for the concentration of the data used in the performance evaluations, the amount of Label 0 data was bigger than the amount of Label 1 data by approximately 18.98 times for learning data. For testing data, the amount of Label 0 data was larger than the amount of Label 1 data by 18.52 times. The cluster data imbalance issue must have exerted negative effects on the learning and performance evaluations explained earlier. In general, data imbalance is a challenging issue that the research communities of machine learning and deep learning should solve. Despite the ongoing stream of various attempts to solve the data imbalance issue, it remains an open issue that has not been solved completely and requires different solutions for the different problem definitions of different domains. This research task for attack graph learning and creation also needs to make continuous efforts to contemplate and solve the issue. Despite the data imbalance issue, the experiment results demonstrated the applicability of the attack graph learning and creation model based on local characteristics proposed in the study of real systems.
5. Discussion
In this paper, we propose an approach to learn the method of attack path generation from the attack graphs that are generated based on the vulnerability database. Table 2 summarizes the performance evaluation results of the machine learning and deep learning models used to learn the method of attack path generation. As described in Section 3, kNN regressor, kNN classifier, the deep learning algorithms summarized in Table 2, and binary classifier were used as ways to learn the method of attack path generation. As we mentioned in Section 4.2, the output of the model can be interpreted as the probability that the corresponding path will be used as an attack path. The attack path detection is performed by means of thresholding. The threshold value is set to 0.3 for model 1, and is set to 0.1 for the algorithm adaptation method based on kNN regression and models 2 to 4. As the performance evaluation metric, attack path detection accuracy is used. According to the experimental results, model 1, a deep learning model, shows the best performance with 89.52%. Binary classifier shows lower performance compared to model 1 with an accuracy of 80.68%.
The neural network/deep-learning-based methodologies show superior performance than traditional machine learning methodologies, i.e., kNN regressor and classifier. In the case of model 1, the output is limited to between 0 and 1, and the output is well expressed as the probability of being used as an attack path. In the case of model 2, the output is normalized so that the sum of all outputs became 1. As a result, the attack paths with a small value are ignored. In the case of model 3, the output value was not limited. Since the output of the model has a small overall value, many attack paths are ignored when determining the attack path based on the threshold. Model 4 is designed to have an encoding and decoding structure. The encoded information is trained to generate new information rather than to restore the original information. That is, it learned to output the attack path by receiving system information as input. However, the encoding information has not been trained enough to generate an attack path. In the case of binary classifier, the amount of negative data is very large compared to the amount of positive data. That is, among the nodes of the entire network, the number of nodes used as an attack path is relatively small, so when all paths are considered, the attack path is very small. As a result, it is thought that the problem of data imbalance by class had a negative effect on the learning and performance evaluation described above. In general, the problem of data imbalance is a challenge to be solved in the machine learning and deep learning research community. Although various attempts to solve the data imbalance problem are ongoing, it is an open problem that has not yet been completely solved, and it must be solved according to the problem definition for each domain. Even in attack graph learning and generation study, it is believed that it is necessary to continuously ponder and solve the problem of data imbalance.
Considering the attack graph generated based on network topology and system information, predicting an attack path that does not actually exist is as follows. First, it is a case of predicting a link between nodes belonging to different subnets as an attack path. Second, it is a case of predicting a link between nodes belonging to the same subnet as an attack path. In the first case, since an attack path that cannot actually exist is predicted, it can be evaluated as a negative factor in the qualitative evaluation of the generated attack graph. In the second case, a detected node can be considered a path that does not exist in the ground truth but can potentially be used as an attack path. If the value of the adjacent matrix of the generated attack graph is considered as a probability value to be used as an attack path, it is considered that the policy can be determined using the probability value as a priority in terms of system security management.
6. Conclusions
This paper proposed a cheap and simple method for generating the attack graph, which consists of learning and generating stages. It learns how to generate an attack path from existing attack graphs using machine learning and deep learning. The trained model generates the attack graph using only network topology and system information. This study proposes a feature extraction and expression method for learning an attack graph generation model using network topology information, system information, and attack path information. The attack graph generation problem is recast as a multi-output learning and binary classification problem and we then employ the machine learning and deep learning models for generating the attack graph. This study also presented a quantitative and qualitative evaluation metric of the attack path predicted through the attack graph generation model.
The proposed approach suggests a low-cost, fast method to generate and evaluate an attack graph suitable for a small organization by learning how to generate an attack path from the attack graph built on the basis of the existing vulnerability database. As a result, it is considered to be a very important study in that it suggests a new alternative for a small organization to build a security system suitable for the characteristics of the organization without a large investment.
Author Contributions
Conceptualization, K.K., D.M., and H.L.; Data curation, K.K.; Formal analysis, J.-H.H., S.-H.J. and H.L.; Funding acquisition, D.M.; Investigation, K.K. and D.M.; Methodology, S.-H.J. and H.L.; Project administration, D.M.; Resources, K.K. and D.M.; Software, S.-H.J. and H.L.; Supervision, K.K.; Validation, K.K., D.M., J.-H.H., S.-H.J. and H.L.; Visualization, K.K., D.M., S.-H.J. and H.L.; Writing—original draft, K.K. and H.L.; Writing—review and editing, J.-H.H., S.-H.J. and H.L. All authors have read and agreed to the published version of the manuscript.
Funding
This work was supported by Institute for Information & Communications Technology Promotion (IITP) grant funded by the Korea government (MSIT) (No.2017-0-00213, Development of Cyber Self Mutation Technologies for Proactive Cyber Defense). This research was also supported by Basic Science Research Program through the National Research Foundation of Korea (NRF) funded by the Ministry of Education (2021R1I1A3050843).
Conflicts of Interest
The authors declare no conflict of interest.
Abbreviations
| AI | Artificial Intelligence |
| APT | Advanced Persistent Threat |
| ANN | Artificial Neural Network |
| MAE | Mean Absolute Error |
| MSE | Mean Squared Error |
| ACC | Average Correlation Coefficient |
| kNN | K-Nearest Neighbor |
| DBPC | Double-Blind Placebo-Controlled |
| SLEEC | Sparse Local Embedding for Extreme Multi-Label Classification |
| ReLU | Rectified Linear Unit |
| TP | True Positive |
| FP | False Positive |
References
- Neupane, R.L.; Neely, T.; Calyam, P.; Chettrim, N.; Vassell, M.; Durairajan, R. Intelligent defense using pretense against targeted attacks in cloud platforms. Future Gener. Comput. Syst. 2019, 93, 609–626. [Google Scholar] [CrossRef]
- Koo, K.; Moon, D.; Jung, S.-H.; Lee, H. Attack Graph Learning with Machine Learning. In Proceedings of the 16th International Conference on Multimedia Information Technology and Applications (MITA 2020), Yeosu, Korea, 20–21 November 2020. [Google Scholar]
- Xiao, L.; Xu, D.; Mandayam, N.B.; Poor, H.V. Attack-Centric view of a detection game against advanced persistent threats. IEEE Trans. Mob. Comput. 2018, 17, 2512–2523. [Google Scholar] [CrossRef]
- Cetinay, H.; Devriendt, K.; Mieghem, P.V. Nodal vulnerability to targeted attacks in power grids. App. Net. Sci. 2018, 3, 34. [Google Scholar] [CrossRef] [PubMed]
- Natalino, C.; Yayimali, A.; Wosinska, L.; Furdek, M. Infrastructure upgrade framework for content delivery networks robust to targeted attacks. Opt. Switch. Netw. 2019, 31, 202–210. [Google Scholar] [CrossRef]
- Ren, X.-L.; Gleninig, N.; Tolic, D.; Nino, A.-F. Underestimated cost of targeted attacks on complex networks. Complexity 2018, 2018, 9826243. [Google Scholar] [CrossRef]
- Calle, E.; Martinez, D.; Mycek, M.; Pioro, M. Resilient backup controller placement in distributed SDN under critical targeted attacks. Int. J. Crit. Infrastruct. Prot. 2021, 33, 100422. [Google Scholar] [CrossRef]
- Liu, R.; Liu, R.; Pugliese, A.; Subrahmanian, V.S. STARS: Defending against Sockpuppet-Based Targeted Attacks on Re-viewing Systems. ACM Trans. Intell. Syst. Technol. 2020, 11, 1–25. [Google Scholar] [CrossRef]
- Papastergiou, S.; Mouratidis, H.; Kalogeraki, E.-M. Handling of advanced persistent threats and complex incidents in healthcare, transportation and energy ICT infrastructures. Evol. Syst. 2021, 12, 91–108. [Google Scholar] [CrossRef] [Green Version]
- Li, Z.; Cheng, X.; Sun, L.; Zhang, j.; Chen, B. A hierarchical approach for advanced persistent threat detection with attention-based graph neural networks. Secur. Commun. Netw. 2021, 2021, 9961342. [Google Scholar] [CrossRef]
- Li, S.; Zhang, Q.; Wu, X.; Han, W.; Tian, Z. Attribution classification method of APT malware in IoT using machine learning techniques. Secur. Commun. Netw. 2021, 2021, 9396141. [Google Scholar]
- Wei, C.; Li, Q.; Guo, D.; Meng, X. Toward identifying APT malware through API system calls. Secur. Commu. Netw. 2021, 2021, 8077220. [Google Scholar] [CrossRef]
- Xiao, L.; Wan, X.; Lu, X.; Zhang, Y.; Wu, D. IoT security techniques based on machine learning: How do IoT devices use AI to enhance security? IEEE Signal Process. Mag. 2018, 35, 41–49. [Google Scholar] [CrossRef]
- Ibrahim, M.; Alsheikh, A.; Matar, A. Attack Graph Modeling for Implantable Pacemaker. Biosensors 2020, 10, 14. [Google Scholar] [CrossRef] [PubMed] [Green Version]
- Matthews, I.; Mace, J.; Soudjani, S.; Moosel, A.V. Cyclic Bayesian Attack Graphs: A Systematic Computational Approach. arXiv 2020, arXiv:2005.06350v1. [Google Scholar]
- Hu, H.; Liu, J.; Zhang, Y.; Liu, Y.; Xu, X.; Tan, J. Attack scenario reconstruction approach using attack graph and alert data mining. J. Inf. Secur. Appl. 2020, 54, 102522. [Google Scholar] [CrossRef]
- Mehdi, Y.; Nhamo, M.; Yan, Z.; Huaglory, T. A Novel Approach for Analysis of Attack Graph. In Proceedings of the 15th IEEE International Conference on Intelligence and Security Informatics, Beijing, China, 22–24 July 2017; pp. 7–12. [Google Scholar]
- Yuan, B.; Pan, Z.; Shi, F.; Li, Z. An Attack Path Generation Methods Based on Graph Database. In Proceedings of the 2020 IEEE 4th Information Technology, Networking, Electronic and Automation Control Conference, Chongqing, China, 12–14 June 2020; pp. 1905–1910. [Google Scholar]
- Wang, L.; Yao, C.; Singhal, A.; Jajodia, S. Implementing interactive analysis of attack graphs using relational databases. J. Comput. Secur. 2008, 16, 419–437. [Google Scholar] [CrossRef] [Green Version]
- Ghosh, N.; Ghosh, S.K. A planner-based approach to generate and analyze minimal attack graph. App. Intell. 2012, 36, 369–390. [Google Scholar] [CrossRef]
- Zeng, S.W.; Wen, Z.H.; Dai, L.W. Analysis of network security based on uncertain attack graph path. Comput. Sci. 2017, 44, 351–355. [Google Scholar]
- Polatidis, N.; Pimenidis, E.; Pavlidis, M.; Papastergiou, S.; Mouratidis, H. From product recommendation to cyber-attack prediction: Generating attack graphs and predicting future attacks. Evol. Syst. 2018, 11, 479–490. [Google Scholar] [CrossRef] [Green Version]
- Mridul, S.B.; Anirban, S.; Chandan, M. Attack Graph Generation and Analysis Techniques. Def. Sci. J. 2016, 66, 559–567. [Google Scholar]
- Liu, H.; Lang, B. Machine Learning and Deep Learning Methods for Intrusion Detection Systems: A Survey. Appl. Sci. 2019, 9, 4396. [Google Scholar]
- Mehdi, Y.; Nhamo, M.; Yan, Z.; Huaglory, T. A Reinforcement Learning Approach for Attack Graph Analysis. In Proceedings of the 2018 17th IEEE International Conference on Trust, Security and Privacy in Computing and Communications/12th IEEE International Conference on Big Data Science and Engineering, New York, NY, USA, 1–3 August 2018; pp. 212–217. [Google Scholar]
- Zhang, Q.; Chang, J.; Meng, G.; Xu, S.; Xiang, S.; Pan, C. Learning graph structure via graph convolutional networks. Patt. Recog. 2019, 95, 308–318. [Google Scholar]
- Vinayakumar, R.; Mamoun, A.; Soman, K.P.; Prabaharan, P.; Ameer, A.N.; Sitalakshmi, V. Deep Learning Approach for Intelligent Intrusion Detection System. IEEE Access 2019, 7, 41525–41550. [Google Scholar] [CrossRef]
- Lu, L.; Safavi-Naini, R.; Hagenbuchner, M.; Susilo, W.; Horton, J.; Yong, S.L.; Tsoi, A.C. Ranking Attack Graphs with Graph Neural Networks. In Information Security Practice and Experience; Bao, F., Li, H., Wang, G., Eds.; ISPEC 2009; LNCS, Springer: Berlin/Heidelberg, Germany, 2009; Volume 5451, pp. 345–359. [Google Scholar]
- Aksu, M.U.; Bicakci, K.; Dilek, M.H.; Ozbayoglu, A.M.; Tatli, E. Automated Generation of Attack Graphs Using NVD. In Proceedings of the CODASPY18, Tempe, AZ, USA, 19–21 March 2018; pp. 135–142. [Google Scholar]
- Cottineau, A. Using Machine Learning to Visualize and Analyze Attack Graphs. Master’s Thesis, KTH Royal Institute of Technology, Stockholm, Sweden, 21 December 2021. [Google Scholar]
- Ghazo, A.T.A.; Ibrahim, M.; Ren, H.; Kumar, R. A2G2V: Automatic attack graph generation and visualization and its applications to computer and SCADA networks. IEEE Trans. Syst. Man Cybern. Syst. 2020, 50, 3488–3498. [Google Scholar] [CrossRef]
- Lee, J.; Moon, D.; Kim, I.; Lee, Y. A semantic approach to improving machine readability of a large-scale attack graph. J. Supercomput. 2019, 75, 3028–3045. [Google Scholar] [CrossRef]
- Lallie, H.S.; Debattista, K.; Bal, J. A review of attack graph and attack tree visual syntax in cyber security. Comput. Sci. Rev. 2020, 35, 100219. [Google Scholar] [CrossRef]
- Che, B.; Liu, L.; Zhang, H. KNEMAG: Key node estimation mechanism based on Attack Graph for IoT security. J. Internet Things 2020, 2, 145–162. [Google Scholar] [CrossRef]
- Zeng, J.; Wu, S.; Chen, Y.; Zeng, R.; Wu, C. Survey of Attack Graph analysis methods from the perspective of data and knowledge processing. Secur. Commu. Netw. 2019, 2019, 2031063. [Google Scholar] [CrossRef] [Green Version]
- Xu, D.; Shi, Y.; Tsang, I.W.; Ong, Y.-S.; Gong, C.; Shen, X. A survey on multi-output learning. arXiv 2019, arXiv:1901.00248v2. [Google Scholar] [CrossRef] [Green Version]
- Borchani, H.; Varando, G.; Bielza, C.; Larranaga, P. A survey on multi-output regression. Wiley Interdiscip. Rev. Data Min. Knowl. Discov. 2015, 5, 216–233. [Google Scholar] [CrossRef] [Green Version]
- Liben-Nowell, D.; Kleinberg, J.M. The link-prediction problem for social networks. J. Am. Soc. Inf. Sci. Technol. 2007, 58, 1019–1031. [Google Scholar] [CrossRef] [Green Version]
Figure 1.
Concept map of data collection and processing.

Figure 2.
Example of data instance.

Figure 3.
Histogram of attack path positions.

Figure 4.
The visualization of data instance.

Figure 5.
Local characteristics extraction method.

Figure 6.
The example of local learning data based on local characteristics and local characteristics label.
Figure 6.
The example of local learning data based on local characteristics and local characteristics label.

Figure 7.
The confusion matrix.

Figure 8.
The examples of input data and labels used for attack graph.

Figure 9.
Example of the classification and prediction model results. (a) Classification model. (b) Prediction model.
Figure 9.
Example of the classification and prediction model results. (a) Classification model. (b) Prediction model.

Figure 10.
The prediction results of the algorithm adaptation method based on kNN classification. (a) Test data 1. (b) Test data 10. (c) Path test data 100. (d) Path test data 1,000. (e) Path test data 5000. (f) Path test data 10,000. (g) Path test data 15,000. (h) Path test data 16,000.
Figure 10.
The prediction results of the algorithm adaptation method based on kNN classification. (a) Test data 1. (b) Test data 10. (c) Path test data 100. (d) Path test data 1,000. (e) Path test data 5000. (f) Path test data 10,000. (g) Path test data 15,000. (h) Path test data 16,000.


Figure 11.
The outputs of algorithm adaptation method based on kNN regression. (a) Test data 1. (b) Test data 10. (c) Path test data 100. (d) Path test data 1000. (e) Path test data 5000. (f) Path test data 10,000. (g) Path test data 15,000. (h) Path test data 16,000.
Figure 11.
The outputs of algorithm adaptation method based on kNN regression. (a) Test data 1. (b) Test data 10. (c) Path test data 100. (d) Path test data 1000. (e) Path test data 5000. (f) Path test data 10,000. (g) Path test data 15,000. (h) Path test data 16,000.


Figure 12.
The outputs of the ANN and deep learning—output layer with sigmoid (model 1). (a) Test data 1. (b) Test data 10. (c) Path test data 100. (d) Path test data 1000. (e) Path test data 5000. (f) Path test data 10,000. (g) Path test data 15,000. (h) Path test data 16,000.
Figure 12.
The outputs of the ANN and deep learning—output layer with sigmoid (model 1). (a) Test data 1. (b) Test data 10. (c) Path test data 100. (d) Path test data 1000. (e) Path test data 5000. (f) Path test data 10,000. (g) Path test data 15,000. (h) Path test data 16,000.


Figure 13.
The outputs of the ANN and deep learning—output layer with Softmax (model 2). (a) Test data 1. (b) Test data 10. (c) Path test data 100. (d) Path test data 1000. (e) Path test data 5000. (f) Path test data 10,000. (g) Path test data 15,000. (h) Path test data 16,000.
Figure 13.
The outputs of the ANN and deep learning—output layer with Softmax (model 2). (a) Test data 1. (b) Test data 10. (c) Path test data 100. (d) Path test data 1000. (e) Path test data 5000. (f) Path test data 10,000. (g) Path test data 15,000. (h) Path test data 16,000.


Figure 14.
The outputs of the ANN and deep learning—output layer with ReLU (model 3). (a) Test data 1. (b) Test data 10. (c) Path test data 100. (d) Path test data 1000. (e) Path test data 5000. (f) Path test data 10,000. (g) Path test data 15,000. (h) Path test data 16,000.
Figure 14.
The outputs of the ANN and deep learning—output layer with ReLU (model 3). (a) Test data 1. (b) Test data 10. (c) Path test data 100. (d) Path test data 1000. (e) Path test data 5000. (f) Path test data 10,000. (g) Path test data 15,000. (h) Path test data 16,000.


Figure 15.
The outputs of the encoding-decoding model (model 4). (a) Test data 1. (b) Test data 10. (c) Path test data 100. (d) Path test data 1000. (e) Path test data 5000. (f) Path test data 10,000. (g) Path test data 15,000. (h) Path test data 16,000.
Figure 15.
The outputs of the encoding-decoding model (model 4). (a) Test data 1. (b) Test data 10. (c) Path test data 100. (d) Path test data 1000. (e) Path test data 5000. (f) Path test data 10,000. (g) Path test data 15,000. (h) Path test data 16,000.


Figure 16.
The confusion matrix of evaluation result using binary classification model.


Table 1.
Summarization of machine learning and deep learning algorithms.
| Models | Description |
|---|---|
| Model1 | Input Layer: 278, Hidden Layer1: 512 with ReLU, Hidden Layer2: 512 with ReLU, Output Layer: 278 with Sigmoid |
| Model2 | Input Layer: 278, Hidden Layer1: 512 with ReLU, Hidden Layer2: 512 with ReLU, Output Layer: 278 with Softmax |
| Model3 | Input Layer: 278, Hidden Layer1: 512 with ReLU, Hidden Layer2: 512 with ReLU, Output Layer: 278 with ReLU |
| Model4 | Input Layer: 278, Hidden Layer1: 1024 with ReLU, Hidden Layer2: 512 with ReLU, Hidden Layer3: 256 with ReLU, Hidden Layer4: 128 with ReLU, Hidden Layer5: 64 with ReLU, Hidden Layer6: 32 with ReLU, Hidden Layer7: 64 with ReLU, Hidden Layer8: 128 with ReLU, Hidden Layer9: 256 with ReLU, Output Layer: 278 with ReLU |
Table 2.
Performance evaluation results of machine learning and deep learning algorithms.
| Models | kNN Regressor | kNN Classifier | Model1 | Model2 | Model3 | Model4 | Binary Classifier |
|---|---|---|---|---|---|---|---|
| APDA * | 69.25% | 14.66% | 89.52% | 0% | 82.66% | 70.06% | 80.68% |
* Attack path detection accuracy.
Publisher’s Note: MDPI stays neutral with regard to jurisdictional claims in published maps and institutional affiliations. |
© 2022 by the authors. Licensee MDPI, Basel, Switzerland. This article is an open access article distributed under the terms and conditions of the Creative Commons Attribution (CC BY) license (https://creativecommons.org/licenses/by/4.0/).
Share and Cite
MDPI and ACS Style
Koo, K.; Moon, D.; Huh, J.-H.; Jung, S.-H.; Lee, H. Attack Graph Generation with Machine Learning for Network Security. Electronics 2022, 11, 1332. https://0-doi-org.brum.beds.ac.uk/10.3390/electronics11091332
AMA Style
Koo K, Moon D, Huh J-H, Jung S-H, Lee H. Attack Graph Generation with Machine Learning for Network Security. Electronics. 2022; 11(9):1332. https://0-doi-org.brum.beds.ac.uk/10.3390/electronics11091332
Chicago/Turabian StyleKoo, Kijong, Daesung Moon, Jun-Ho Huh, Se-Hoon Jung, and Hansung Lee. 2022. "Attack Graph Generation with Machine Learning for Network Security" Electronics 11, no. 9: 1332. https://0-doi-org.brum.beds.ac.uk/10.3390/electronics11091332
Note that from the first issue of 2016, this journal uses article numbers instead of page numbers. See further details here.