
A Master Multi-Slave System Based on Structural Modal Frequencies
by
 , , , and
Alfiero Leoni
 ,
,
Gianluca Barile
,
Paolo Esposito
,
Romina Paolucci
,
Vincenzo Stornelli
* and
Giuseppe Ferri

Department of Industrial and Information Engineering and Economics (DIIIE), University of L’Aquila, Piazzale Pontieri 1, Monteluco di Roio, 67100 L’Aquila, Italy
*
Author to whom correspondence should be addressed.
Electronics 2023, 12(15), 3260; https://0-doi-org.brum.beds.ac.uk/10.3390/electronics12153260
Submission received: 2 June 2023
/
Revised: 25 July 2023
/
Accepted: 26 July 2023
/
Published: 29 July 2023
(This article belongs to the Special Issue Feature Papers in Circuit and Signal Processing)
Abstract
:Structural Health Monitoring (SHM) is a process where, through sensors-based electronic systems and output data analysis, the structural integrity of a building or an infrastructure is observed and determined through periodically sampled measurements for material and geometric variations, ensuring safety and minimizing risk factors. Over the years, the approach to this problem evolved both in terms of system technology, with the use of more accurate sensors, and the parameters used to determine the building status, i.e., the extraction of the damage index. In these terms, structural modal harmonics-based analysis is acquiring more and more relevance. In this paper, we propose a fully custom master multi-slave system used for SHM purposes, capable of acquiring data from six different channels coming from two independent accelerometers suitably configured as to synchronously produce spectrograms and static trim of the monitored structure. A test of the system has been performed on a modular structure subject to random perturbation. Time and frequency domain results were analyzed before and after structural alterations. Their effects were studied in a 500 Hz bandwidth, showing a drift in the resonant frequency of the structure from 145 Hz to 152 Hz, and, additionally, a harmonic displacement: medium-frequency components experienced a 50 Hz drift, while low-frequency components collapsed into two harmonics at 60 Hz and 90 Hz. These tests proved the system’s functionality and the feasibility of this method for structural integrity analysis and, eventually, damage evaluation.
1. Introduction
In this historical period, the theme of “monitoring” is increasingly central. This term refers to the activity of detection, and possible control, of some defined parameters, with the aim of saving lives and people’s well-being.
In this sense, in the scientific literature, there are contributions relating, for example, to environmental monitoring, such as [1], where a monitoring system which provides information on environmental conditions at a more local level (industrial, domestic and office areas) is discussed; this system uses wireless sensor technology including raspberry pi, Arduino Nano, Zigbee, wireless sensor network (WSN) and sensors. Still on the subject of environmental monitoring, a workplace monitoring system is presented in [2]. In particular, the level of fine particles was detected on site during a building demolition activity. The goal is to understand if and how much workers are exposed.
There are also contributions related to energy monitoring, such as in [3], where an IoT energy monitoring system is introduced; the system improves the energy management level of companies, while also playing an important role in energy saving and energy reduction, as well as emissions. Or again, in [4] a system is presented using a modular multifunctional hardware-software complex that includes open interfaces, the original source code and licenses for the free diffusion of the software. The goal is to carry out a long-term observation of the energy parameters together with the production data, in order to arrive at an evaluation of the energy consumption as well.
In addition to the monitoring types just described, there is structural monitoring which, in particular, is the one that has the most significant impact on the protection of human life. It is known in scientific literature by the acronym SHM, which stands for Structural Health Monitoring. It is a central theme because, with a well performed SHM, it is possible not only to monitor, but even “take care” of any structure or infrastructure and, indirectly, of those who use it.
In general, SHM is implemented through a system composed of a series of nodes containing one or more sensors, a data processing system and a health evaluation system [5]. Ideally, this system should be versatile, timely in information transfer, reliable, capable of extremely accurate readings, easy to manage, capable of easily archiving large amounts of data, very cheap and characterized by a non-destructive approach [6,7,8,9].
However, there is an objective difficulty in developing a system that has all these characteristics. The difficulty lies in the fact that the structures and infrastructures that surround us are extremely heterogeneous both from the point of view of the construction period (dating back to the past centuries or brand new and futuristic) and from the point of view of construction technology (stone walls, masonry in concrete blocks, reinforced concrete, wood, steel) and, therefore, of the particular type and extent of stresses undergone [10]. Obviously, if we wanted to take all these aspects into account in time, we would have to develop an “ad-hoc” system for practically each structure.
It is therefore necessary to reach a fair compromise, which from time to time responds to the particular contingent needs, which are extremely heterogeneous. For example, on the one hand, it is necessary to respond to the need to implement continuous monitoring over time, to monitor the natural obsolescence of a given structure. The monitoring system, on the other hand, must be able to intervene even suddenly, downstream of an extreme and sudden event (such as an earthquake or a landslide), to determine if there has been damage and to what extent [11].
From what has been said so far, it is clear enough why SHM has become an extremely multidisciplinary topic over the years, and how complex it is to take into account all the variables involved [10].
For example, in [12] a wireless monitoring system of SHM for real-time data acquisition is presented. However, the system has limitations in the ability to synchronize samples but also in the number of sensors itself, which decreases as the sampling rate increases (only 12 sensors for a 100 Hz sampling rate). In [13], however, a wireless monitoring system integrated into the Zhengdian highway bridge is presented. Analog accelerometers are used. Their weakness, however, is the drift of the output due to temperature. Compensation loops are, therefore, needed. Also, results are limited due to noise interference from analog circuits and transmission data losses. In [14], instead, a low-cost WSN for SHM is proposed. The purpose of the system is the identification of the modal frequency. The problem with this system, however, is the synchronization of the samples. In [15], a WSN is presented to monitor wind excitation from a wind turbine tower. The limits of this system are the maximum sampling frequencies (31 Hz) and the maximum nodes (three). Also, synchronization is a critical issue here as well.
As for wired SHM systems, on the other hand, [16] presents a wired monitoring system with 64 samples per second without synchronization from each node communicating data through an ethernet connection. This system can appreciate the lowest modal frequency of the structures but not the highest due to the low sampling rate. In [17], instead, a single-node wired monitoring system is presented that can identify natural frequency and modal parameters in real time. The system is based on a single board computer which limits the synchronization and the maximum number of connected nodes in the same network. Finally, in [18] a system which acquires data if the event exceeds a certain threshold is presented, with an acquisition duration of 70 s.
Even from the point of view of wired or non-wired systems, there is no solution objectively better than the other, but reference must be made to the particular needs involved. Speaking of strengths and weaknesses, undoubtedly the wired monitoring system generally has a very high cost, a typically low number of sensors that can be connected in the same network, high bandwidth, high data rate of the sensors and very high synchronicity of the sensors. On the other hand, the wireless monitoring system has low cost, a large number of sensors that can be connected in the same network, limited bandwidth, low sensor data rate, and critical node synchronization [19]. However, regardless of the particular characteristics of each of them, all the systems presented up to now are of the master multi-slave type where, practically, a central master unit communicates with several distributed slave units. In an accelerometer-based master multi-slave system, the master unit serves as the central processing hub responsible for managing multiple slave units distributed across the structure and collecting data from them through on-board accelerometers. Beyond SHM, master multi-slave accelerometer-based systems are used in several other fields [20,21,22], proving their versatility.
Among the traditional methods for SHM, modal harmonic analysis emerged as a powerful tool for this field, enabling the extraction of valuable information about the dynamic behavior and static status of structures [23,24]. These kinds of data are extracted by changes in natural frequencies, mode shapes and damping ratios of the structure in function of a determined excitation, which could be controlled or natural, e.g., mechanical stimuli or environmental excitation. Dynamic responses, which makes it possible to extract the aforementioned data through several algorithms [25], are retrieved by a system composed of accelerometers, whose displacement gives information about the dynamic and static situation of the structure.
In this paper, we propose a fully custom master multi-slave accelerometer-based system employed for SHM based on modal harmonic analysis. The aim of our research is to use a number of these devices in a meshed network to detect changes in the structure modal response after an artificially induced alteration.
The paper is organized as follows: in the following section, the internal architecture of the system and its operating principle are discussed, while in Section 3, results extracted from several measurements involving time and frequency domains are reported. Finally, in Section 4, the feasibility of this method and conclusions are discussed, presenting several enhancement points for future implementations.
2. Materials and Methods
In this section details about the system, hardware architecture, operating principle, algorithm and data structure used to address SHM problems reported.
2.1. System Description
The meshed network, whose architecture is represented in Figure 1, is composed of multiple nodes that retrieve acceleration data from multiple on-board accelerometers and communicate with a master data logger. Communication is performed through a redundant architecture. Each node post-processes acquired data from the accelerometers producing a spectrogram and giving the freedom of both retrieving raw data as well as processed data.
As seen in Figure 1, data sending and visualization are implemented through a redundant structure that uses both a wired and a wireless protocol. Communication redundancy allows a robust and wide-range SHM detection system; in particular, a serial standard is used with a wireless protocol. In the first case, RS485 is used; this robust and fast choice allows the positioning of nodes at distances up to several hundreds of meters, guaranteeing good reliability of received packets. However, a limitation of this standard is its wired structure, which requires the nodes to be physically connected. To overcome this constraint, LoRaWAN (Long Range World Area Network) protocol is used. LoRaWAN is a protocol that uses spread spectrum communication to reach very long tx-rx distances, up to several kilometers, depending on terrain and environmental factors, with low power consumption. However, rx-tx times of packets interchanged with this protocol are larger with respect to the serial wired protocol, making it less reliable for real-time measurements with stringent constraints on time. In this system, the user can preset each node to communicate with both protocols when the node distance is under almost a kilometer, which is an estimation of the maximum RS485 range, so this protocol is used as the main communication protocol, and LoRa is considered a backup solution, while if the distance exceeds the aforementioned estimation, LoRaWAN can be selected as the only protocol for communication. For a better understanding of the two protocols used, the main differences that characterize RS485 and LoRaWAN are reported in Table 1.
Thanks to a custom application-level tx-rx protocol (described in Section 2.4) data integrity can be ensured both when using RS485 as well as LoRaWAN thanks to a 16-bit CRC embedded in the custom data packet. Measurement of modal frequencies is finally performed through a spectrogram, chosen because of the possibility to track the changes in modal frequencies through time.
2.2. Hardware Architecture
In this section, an accurate description of the hardware used for the implementation of the proposed system is provided.
A single sensor node is composed of a microcontroller central unit (MCU), two accelerometers for acceleration tracking, a global positioning system (GPS) for node position and synchronization, a Long Range (LoRa) unit for data transferring, an RS485 interfacing unit for communication with other nodes and the master unit, a 1 Gb NAND flash memory for data storage and a specific power path for the supply of each unit.
The ESP32-WROOM-32UE MCU from Espressif Systems [26] is used in this system. This microcontroller, having a 3.3 V supply, is predisposed to wide-range IoT applications due to the internal 2.4 GHz combo chip integrating Wi-Fi and Bluetooth connectivity. This chip, in particular, supports the 802.11 b/g/n Wi-Fi standards, Bluetooth 4.2 and 5.0 with BLE (Bluetooth Low Energy). In addition, this chip presents good computing performance due to the integrated 240 MHz dual-core processor and an internal 4 MB flash memory. The number of supported interfaces comprises UART, SPI, I2C, and several ADC-oriented ones, making this chip suitable for a wide range of applications, including home and industrial automation, smart agriculture, and beyond.
Node position is provided by a Global Positioning System (GPS) unit, the FGPMMOPA6H [27]. This device communicates with the MCU through the National Marine Electronics Association (NMEA) 0183 standard, used in satellite communications. This unit has a power supply ranging from 3 to 4.3 V and is a high-performance GPS module with a −165 dBm signal sensitivity, instant Time-to-First Fix (TTFF), low power consumption (82 mW during signal acquisition and 62 mW during tracking), 10 Hz update rate, and a multi-tone active interference canceller.
Tri-axial node displacement is provided by two accelerometers: the first is used as the main device, and the second, with less resolution but also less current consumption, is used either with an aggressive filtering to determine modifications in the static trim of the structure, or as a backup solution in the case of a failure of the first element. The main accelerometer is an ADXL355 [28], while the backup accelerometer is an ADXL345 [29]. Both accelerometer units need a 3.3 V power supply. The main differences between these two devices can be listed in terms of:
- Sensitivity, as the ADXL355 25 µg/√Hz noise density is less than the 150 µg/√Hz ADXL345 noise density, making the first device more sensitive to changes in acceleration;
- Accuracy, as a consequence of the previous point, and due to the ADXL355 2 mg bias instability, with respect to the ADXL345 20 mg;
- Resolution, because despite the selectable measurement range between ±2 g, ±4 g, or ±8 g for both accelerometers, ADXL355 provides 20-bit strings, while ADXL345 has a 10-bit resolution;
- Power consumption, smaller for ADXL345 (23 µA in measurement mode and 0.1 µA in standby mode) with respect to ADXL355 (200 µA in measurement mode and 21 µA in standby mode);
- Communication with the MCU, as ADXL355 uses the SPI interface, while ADXL345 uses the I2C protocol.
Structural data retrieved from the sensors are stored in a 1 GB NAND flash memory, the IS37SML01G1-LLI [30], which interfaces with the MCU through the SPI protocol and requires 3.3 V to work correctly.
As reported in the previous section, RS485 and LoRa are used for data interchange, so data transceivers for each protocol are used. The RS485 transceiver, a MAX13488EESA+T [31], has a proprietary AutoDirection control, which manages data direction automatically from hardware without the need for additional control signals. This device has an error-free transmission of up to 500 kbps and transmit speeds of up to 16 Mbps. The LoRa transceiver, an RFM95W [32], has a programmable bit rate of up to 300 kbps, a high sensitivity down to −148 dBm, and a relatively low current consumption, up to 10.3 mA in rx mode and down to 200 nA in register retention mode.
Finally, a power path provides the right supply to each unit in use. This stage is composed of a first unit, the VX7805 [33], that converts the 24 V node voltage supply, used for RS485 hardware interfacing, to 5 V; a battery charger unit, the BQ24075 [34], used in case of LiPo battery addition to the sensor node, currently not used; and a 5 V to 3.3 V converter unit, the LM1117MPX [35], to provide the correct supply voltage needed by the aforementioned modules.
Each node component has been designed on a board, manufactured and placed in a metal enclosure. Both accelerometers were placed in proximity of the PCB anchor points to minimize noise caused from PCB oscillations. Figure 2 shows the scheme (a) and the photo (b) of a single node.
2.3. Operating Principle
In this section, the single node sequential operation is examined. We discuss, in particular, the sequence of operations performed by each slave node, from the activation to the stable operation state.
Firstly, after the node is powered for the first time, internal peripherals are set according to the latest parameters sent by the master unit, such as sampling frequency and mission time. After this initial state, the node passes to the idle state, where it waits for a command to be received from the master unit: commands include basic operations involving data sampling, internal memory control, and mission execution. A single mission is the entire time window where data are sampled and processed. Therefore, if a command containing a mission starting request is received by the node, it sets the internal accelerometers with incoming parameters, which are the actual sampling frequency and mission length, and checks for the GPS signals: if a GPS fix is detected, the node links to the satellite and obtains GPS data, such as its geological position (latitude and longitude) and temporal data (year, month, day, hour), and then uses the PPS signal to accurately synchronize the start of the acquisition with the other elements in the network; on the contrary, if no GPS fix is detected, node position remains undetermined for the master system during the execution of the command, and the synchronization loses some accuracy. A graphical representation of this workflow is reported in Figure 3.
2.4. Functional and Data Description
This section describes the main system functionalities and the data structure involved.
First of all, system functionalities are reported. A single slave node can perform several commands depending on the system status. Each node has an identification number (ID), which allows the master to distinguish between them. The master unit, in addition to its ability to vary node ID or bus baud rate, has the functionality to test the system operation through a rollcall function. In this function, a broadcast packet is sent from the master to the node net so that system integrity is deduced from the number of responding nodes. Generally, this command is sent either after the power of the system is turned on for an initial test or between two missions.
The master unit can retrieve several types of data from nodes after a mission, depending on the requested function. The first typology of available data is the raw acceleration throughout the mission (both from ADXL355 and ADXL345). The master can request up to 2048 bytes of payload per packet, formatted as represented in Figure 4a. A second data typology is the cumulative FFT, where FFT is calculated over a temporal average of accelerometric data sampled during the mission. The packet sent consists of a fixed 24.5 kB length equally distributed over 8.2 kB of FFT data for each axis. A single 8.2 kB data chunk, for each spatial axis, is composed of an 8 bytes repetitive sequence. Each sequence is composed in turn by FFT real part for the first 4 bytes and FFT imaginary part for the last 4 bytes. The structure of this packet is reported in Figure 4b.
Finally, the third data type retrievable from the slave node is the spectrogram; it is a single-axis FFT represented with respect to the mission time. The spectrogram allows us to distinguish the building modal harmonics variations over time. This measurement involves time, hence, a programmable time window, as well as a programmable sampling frequency, varying between 100 and 500 Samples Per second (SPs) have been defined. This parameter is very critical, as it affects the measurement resolution and accuracy for damage evaluation on the measured building, as well as the inclination to aliasing-based issues. In addition, results from spectrogram are a 2-dimensional graph: the magnitude of each frequency component is represented by a color gradient. This last feature could cause complications during the reading of the results; hence, in future works we planned to use a 3-dimensional spectrogram.
3. Setup and Results
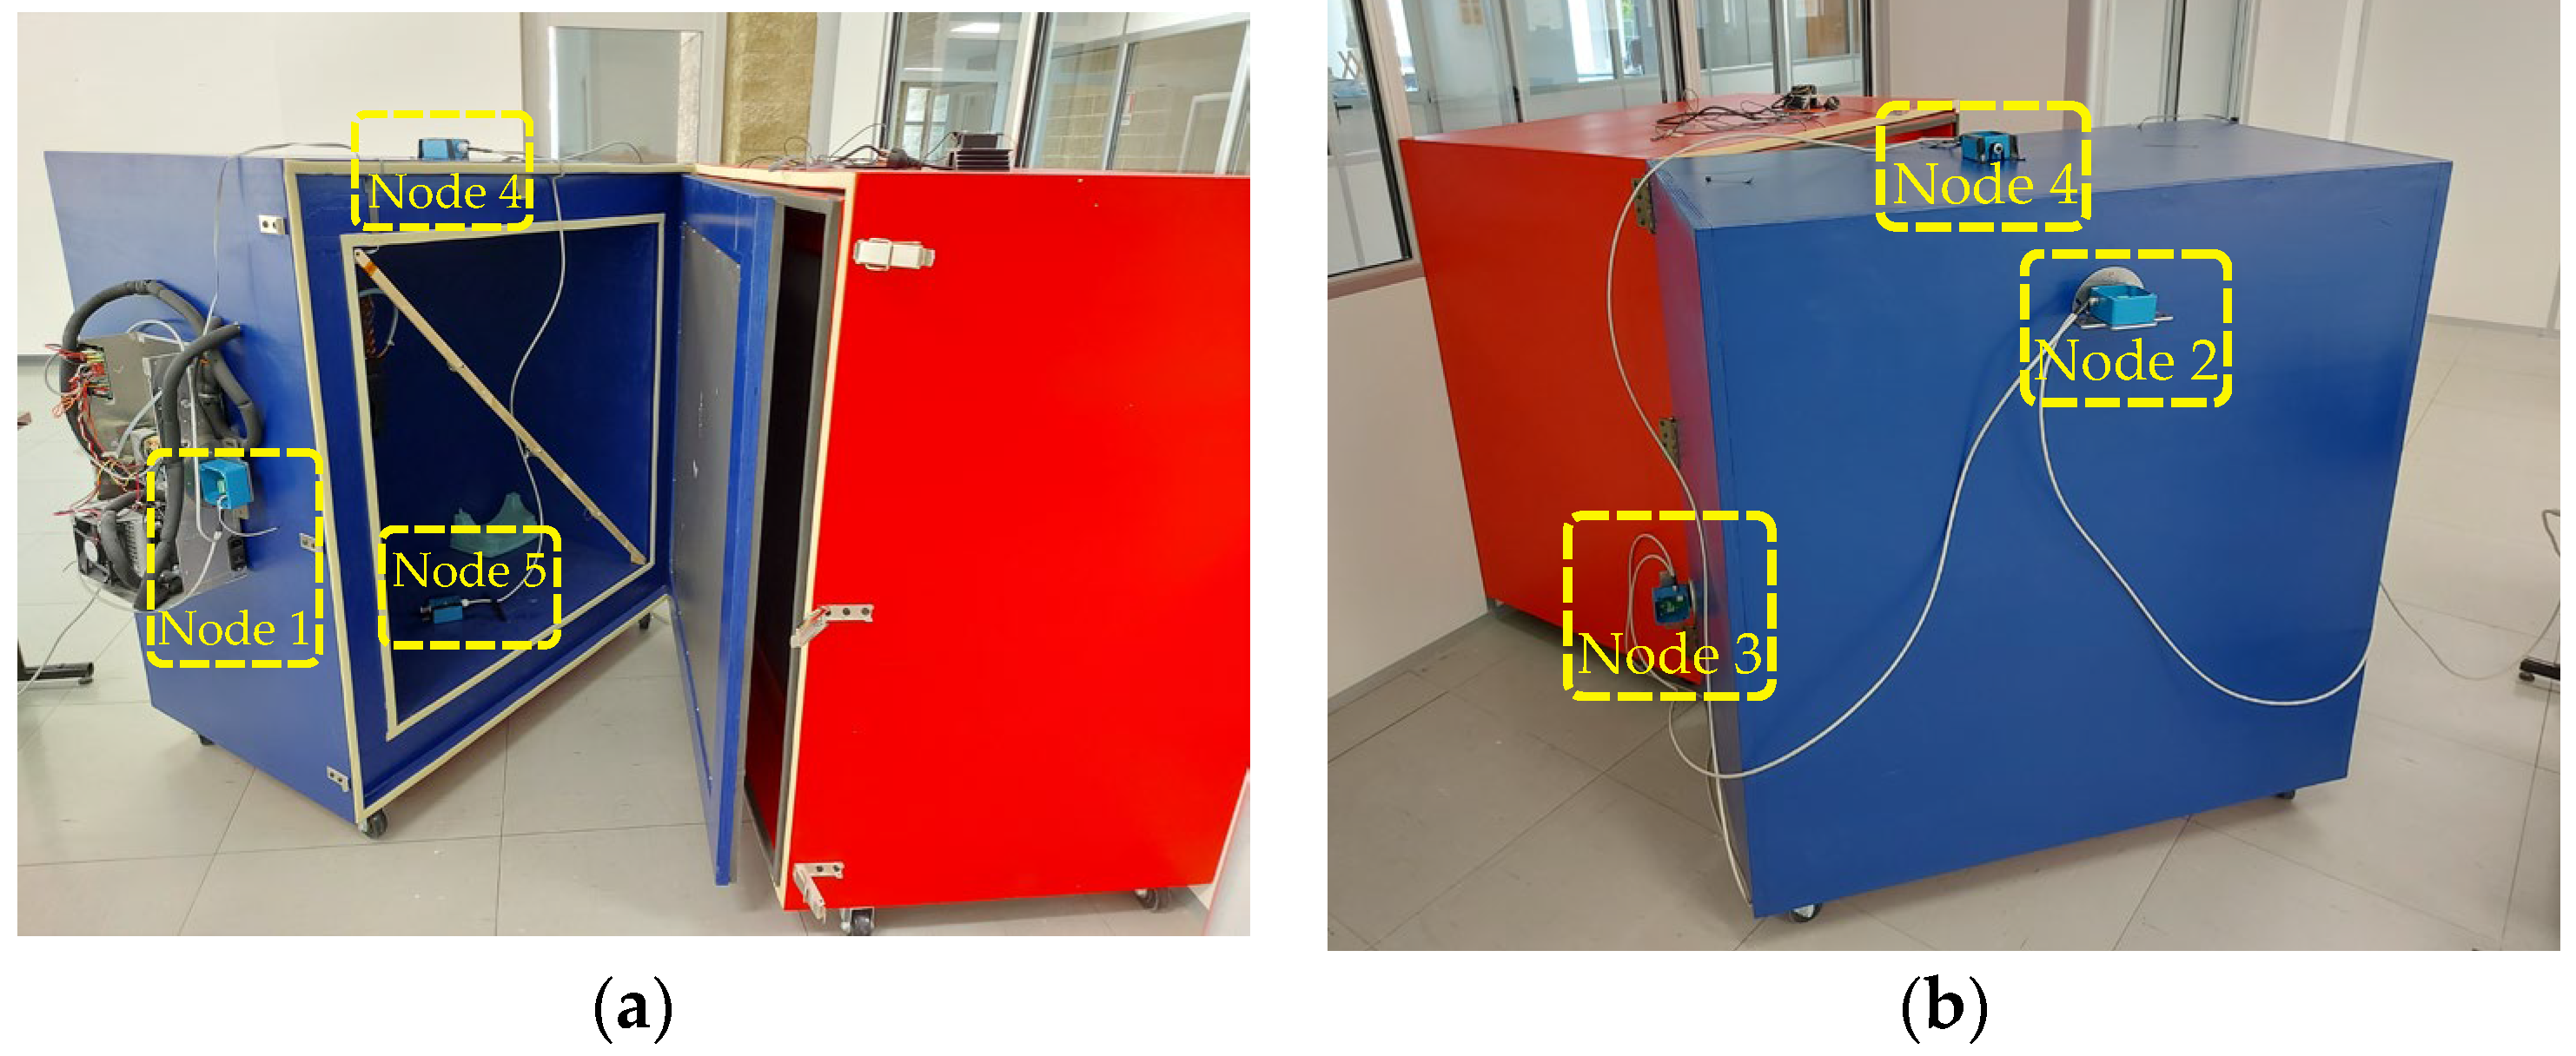
The experiments were performed on a solid wood modular box, in particular, a large cube (Figure 5) formed by two symmetrical parts. These parts are held together, on one side, by three hinges and, on the opposite side, by three large hooks, which allow them to be opened and closed. Thanks to this particular structure, we were able to test two scenarios: the first with the closed box, which represents an “intact” structure, and the second with the open structure, to simulate a damage or, in any case, a change in the state of the structure itself. Figure 6a,b shows the open structure.
The disposition of the nodes with respect to the structure is also visible. Five nodes were used, four of which were placed on the outer sides of the box, the last one placed inside. The main reason for this choice is the non-overlapping of nodal points in order to detect a response as complete as possible. The aim of this setup is to verify the capability of the sensor network to coherently detect a modification in the evaluated structure. This is achieved by comparing the data acquired from each node.
Three tests were carried out: in the first, the system was left to environmental stress alone; in the second, the system was directly disturbed by a randomic stimulus provided by a mechanical piston; in the third test, the structure was opened and subjected to a similar randomic stimulus as that of the previous test. For the first test, a 30 s time window was chosen, while for the last two tests, the parameter was increased to 60 s in order to test the system for a sufficient amount of time. For each repetition, we set a 500 Hz sampling frequency to ensure maximum data reliability and the full scale of both accelerometric sensors to ±2 g because we expect that in an actual application of the system, it is subject to environmental stimuli, characterized by a low amplitude.
The first test has the purpose of demonstrating the difference between main and backup accelerometers. The second and third tests are intended to show the spectral behavior of the box and how it changes as a result of a substantial change in the structure’s layout. From the first test, we expect very good performance from the main sensor with respect to the second because of the different features; in particular, we expect several signals to be detected only by the first accelerometer because of the considerable difference in resolution of both devices.
Results from the first test are reported in Figure 7a,b. It is noticeable how the main accelerometer could detect the minimal indirect structure perturbations, e.g., the passage of pedestrians and vehicles in an on-field application, differently from the backup accelerometer, where these stimuli are buried in noise.
In the second test, the direct perturbation consisted of a periodic system stimulus. Figure 8 shows the comparison between the readings of the main and secondary sensors in node 5.
As can also be seen in this case, the detection of the secondary sensor is much less clean than the main sensor. However, the peaks relating to the periodic stimulus also emerge clearly in the detection of the secondary sensor. From these analyses, it emerges that the secondary accelerometer can be either used in parallel with the main one, to sample the static trim of the structure, or, alternatively, if the main sensor fails, can be used as a backup solution even with a reduced resolution.
Finally, the third test began with the structure intact. After a few seconds, the structure was opened and subsequently subjected to periodic stimulation again. Figure 9a,b shows the difference between the primary and secondary node detections. As can be seen, the conclusions made with regard to Figure 9 are also valid in this case. From these last tests, we expect that a structure alteration causes longer settling times and higher oscillation frequencies because of the lower structure weight and higher inertia.
With regard to this last test, it is interesting to analyze the spectrogram, which gives us direct information about various events. Still taking node 5 as a reference, Figure 10 shows the spectrogram related to the X-axis, the most stressed one, and reports the main test states.
The sequence of states of the structure emerges clearly: rest, structure alteration, rest, impulsive stimulus, rest. Moreover, we can see how the resolution of the single accelerometer consistently affects the detection of modal components related to the structure: a higher resolution allows us to distinguish the frequency components more clearly.
In addition, in Figure 11a, the comparison between the two spectrograms, related to the same test, before and after structural alteration, is reported. As can be seen, the spectrograms, although similar, have some differences. This confirms that in a structure, when changes in attitude occur, the frequencies change immediately, even if the structure itself (apparently) returns to its initial conditions.
Firstly, the different resonant frequency in the perturbed structure is noticeable. This confirms the hypothesis made for time domain tests. A second important difference regards modal harmonics alteration in the two cases, as it is visibly different between the two cases. A first point is the drifting of the harmonics in proximity of the resonant frequency towards higher values, between 150 and 225 Hz, after structure alteration. Low-frequency harmonic components experience an apparently negligible drift, stacking into two harmonics around 60 and 90 Hz, respectively.
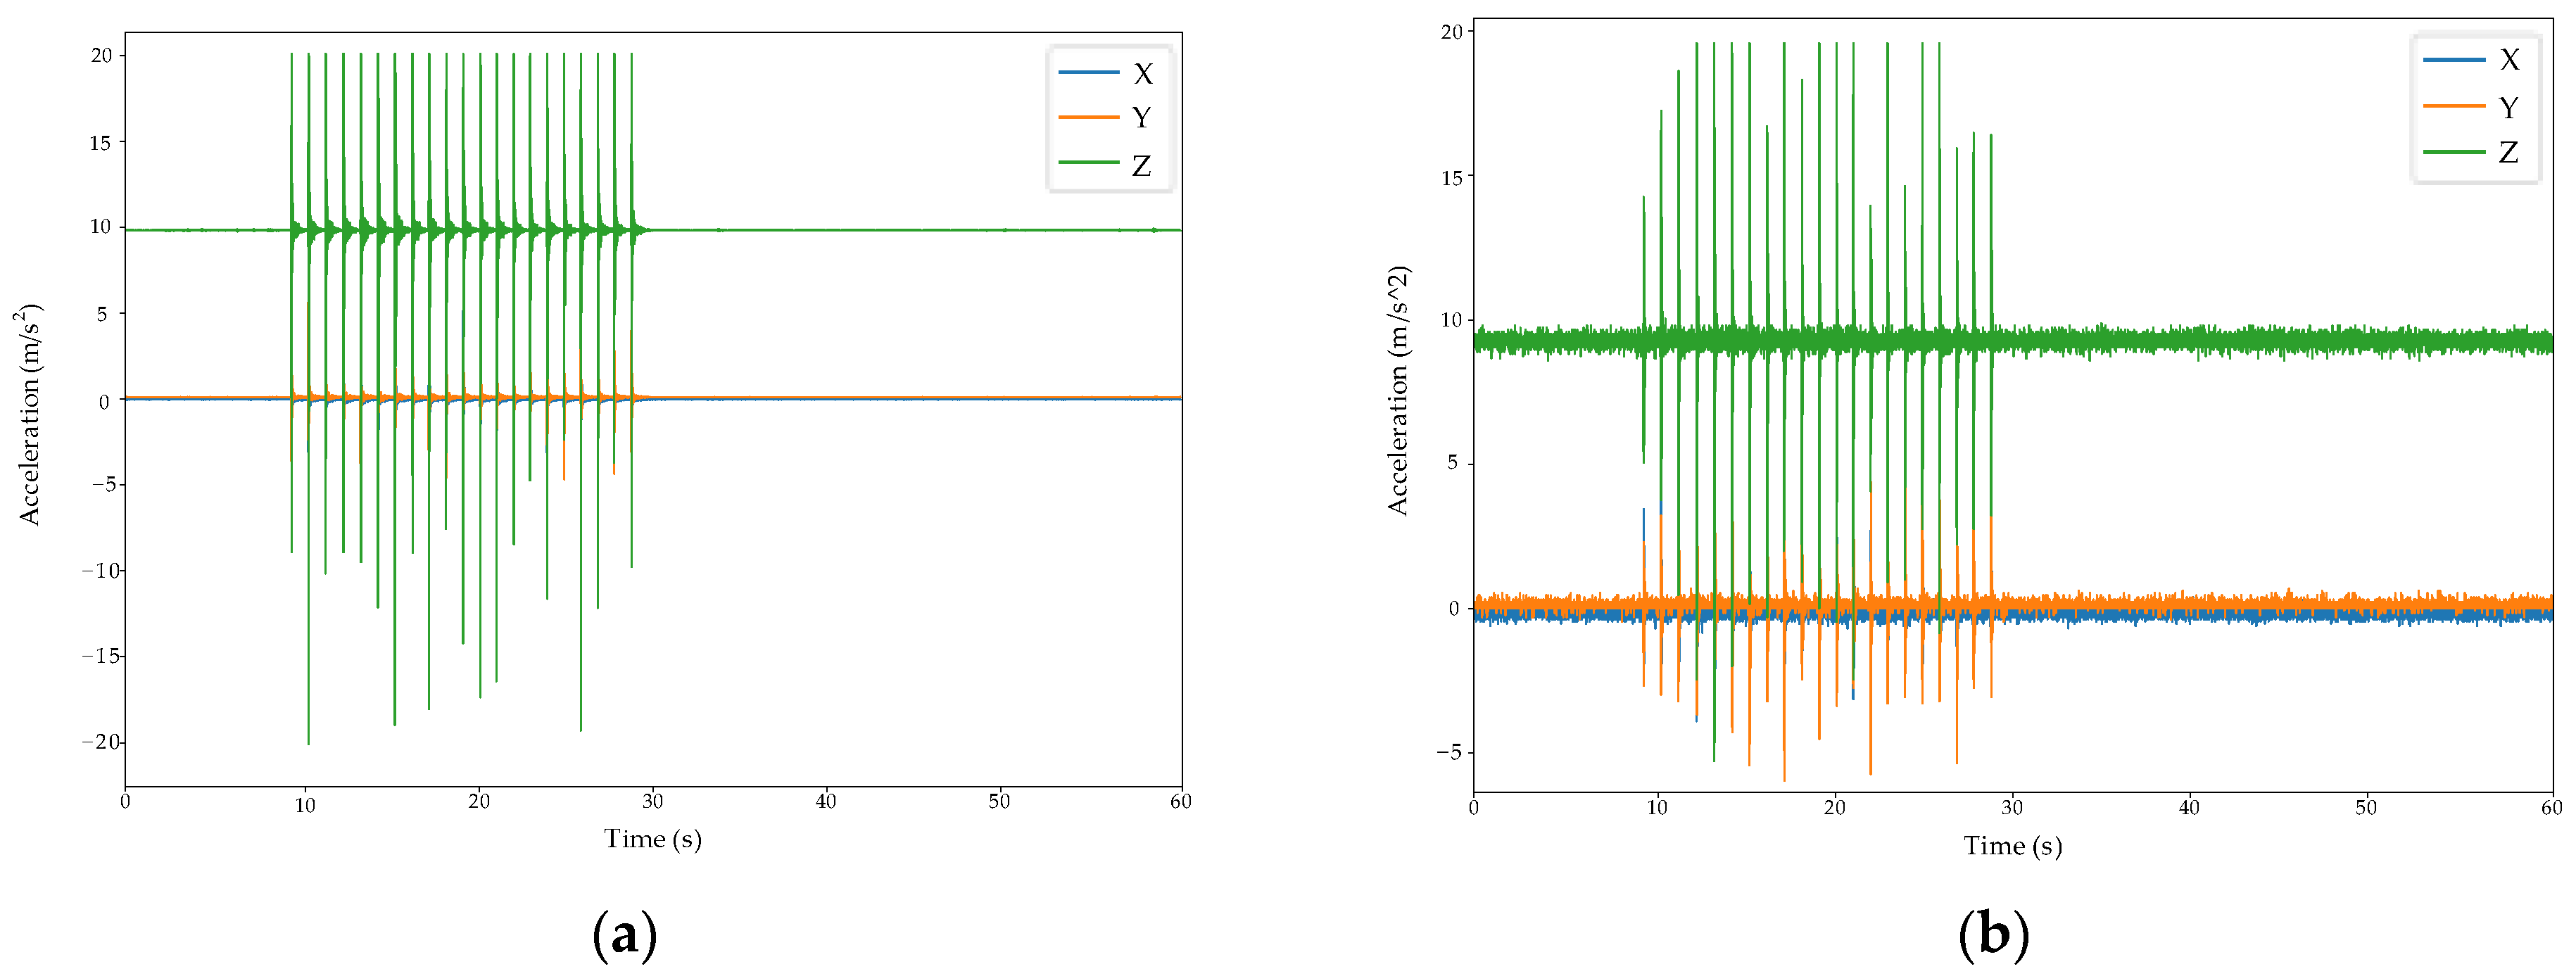
Finally, Figure 12a,b shows another interesting fact; the reported time responses of a node to the aforementioned stimulus, respectively, before and after the box structural alteration.
A first difference in these two cases can be seen in the settling time, which is equal to 100 ms in the first situation and 300 ms in the second one. Another important difference is the different oscillation frequencies, equal to 145 Hz and 152 Hz before and after the structural alteration, respectively. This situation brings us to a slightly different structure main frequency in the two tested cases. From these first results, it is noticeable how the removal of the box’s detachable part causes a less damped and faster response due to the structural lightness obtained in the second case, hence, to its least inertia.
Frequency domain analysis has been performed in the range 0–250 Hz in order to observe modal harmonic changes caused by the introduced alteration.
4. Conclusions
In this paper, a master multi-slave system based on structural modal frequencies having high reliability on data integrity is presented. The proposed system is able to detect dynamic events, e.g., collision with external bodies, as well as static damages, leading to changes in the internal composition of the structure, hence, in its fundamental frequency. The SHM problem has been widely covered, different solutions have been reported, and the employment of the introduced system has been justified. The designed implementation has been deepened; its master multi-slave and single-slave node structures have been reported. The redundancy of this system can be identified from several points of view: the first point is the presence of CRC in every packet exchanged between master and slave nodes as long as the system is working, and the second point is the multiplicity of communication protocols between master and slave, as a fast but wired serial protocol is used in parallel to a long-range wireless one. Finally, the third point where redundancy is encountered is the structure of the single slave node, as it is composed of two accelerometer-based systems: a main high-resolution accelerometer and a less accurate unit that can be used as a backup if a failure occurs in the main element. System functionality is then described, reporting the working statuses and the possible operations that it can perform. The system was tested on a modular structure where the detachment of a part represented structural damage. Responses of the slave nodes were then analyzed considering two scenarios: the first with the intact structure and the second with its alteration. The reliability of the backup accelerometer over the main one was analyzed by observing the system’s response to environmental stresses. Subsequently, periodic stimuli were induced in the first and second scenarios in order to observe the variation in the system response. In these situations, the output from the two accelerometers in the time and frequency domains was analyzed and compared. A difference in damping time, structure main frequency, and modal harmonic collocation were noticed. From this outcome, it was possible to observe and evaluate the system frequency response variation after a structural alteration in accordance with theory. The main limitation of our approach is the lack of methods for the interpretation of the results, motivated by the aim to detect changes in structure frequency response after its damage.
An idea for further work is to use this system for multiple application fields, e.g., weigh-in-motion (WIM). In this sense, the sampling frequency of the system could be a limit as it decreases measurement resolution, especially in FFT and spectrogram setups; hence, the detection of minimum deviations in modal harmonics is not guaranteed. For this reason, in future works, we aim to improve the system both in terms of internal hardware and management of each slave node in order to reach plausible data sampling rates of up to 5 kSPs. The main idea behind this improvement is to integrate an external RAM memory which stores data after each mission as to lighten the workload of the internal flash memory and increase data sampling speed. Another important update to the system is the implementation of an event triggering internal mechanism which automatically activates a mission when an environmental stimulus is detected; this could lead to a better independence of the system in terms of measurements planning and real-time operation. Other factors to be considered for future works are the correlation between retrieved data, as well as several statistical analyses, in order to increase the reliability of our results.
The implementation of this system in a real application scenario is an important topic, as it depends on the shape and composition of the structure. As a matter of fact, firstly, these elements could affect the structure response to damages in the frequency domain, e.g., the natural frequency drift, as well as the position of the nodes and the communication protocol (LoRaWAN or RS485, depending on the distance). Costs, in terms of efforts and resources, are another important variable to take into account, as, in some cases, nodes must be installed in uneasy locations; hence, specialized equipment is needed. A final factor to consider is the hardware maintenance, which is more important for the system functionality than for the hardware itself, as each node case is metallic, hence weather and dust resistant: system functionality maintenance could be performed in future works by integrating a web interface for the monitoring of the system status, so that the system could be accessed and monitored in an easy way, even by non-qualified personnel.
Author Contributions
Conceptualization, A.L.; methodology, A.L.; software, G.B.; validation, A.L. and G.B.; formal analysis, A.L. and P.E.; data curation, P.E. and R.P.; writing—original draft, P.E. and R.P.; writing—review & editing, A.L., G.B., V.S. and G.F.; visualization, R.P.; supervision, A.L., G.B. and G.F.; project administration, V.S. and G.F.; funding acquisition, V.S. All authors have read and agreed to the published version of the manuscript.
Funding
This study was conducted as part of a private, non-grant funded research project by GESTECNO srl.
Data Availability Statement
The data presented in this study are available on request from the corresponding author. The data are not publicly available due to industrial reservations.
Acknowledgments
A special thanks to Francesco Pascarella, GESTECNO srl.
Conflicts of Interest
The authors declare no conflict of interest.
References
- Deshmukh, A.D.; Shinde, U.B. A Low Cost Environment Monitoring System Using Raspberry Pi and Arduino with Zigbee. In Proceedings of the 2016 International Conference on Inventive Computation Technologies (ICICT), Coimbatore, India, 26–27 August 2016; IEEE: Coimbatore, India, 2016; pp. 1–6. [Google Scholar]
- Paolucci, R.; Rotilio, M.; De Berardinis, P.; Ferri, G.; Cucchiella, F.; Stornelli, V. Electronic System for Monitoring of Dust on Construction Sites for the Health of Workers. In Proceedings of the 2021 15th International Conference on Advanced Technologies, Systems and Services in Telecommunications (TELSIKS), Nis, Serbia, 20–22 October 2021; IEEE: Nis, Serbia, 2021; pp. 329–332. [Google Scholar]
- Luan, H.; Leng, J. Design of Energy Monitoring System Based on IOT. In Proceedings of the 2016 Chinese Control and Decision Conference (CCDC), Yinchuan, China, 28–30 May 2016; IEEE: Yinchuan, China, 2016; pp. 6785–6788. [Google Scholar]
- Kychkin, A.V. Synthesizing a System for Remote Energy Monitoring in Manufacturing. Metallurgist 2016, 59, 752–760. [Google Scholar] [CrossRef]
- Mufti, A.A. Structural Health Monitoring of Innovative Canadian Civil Engineering Structures. Struct. Health Monit. 2002, 1, 89–103. [Google Scholar] [CrossRef]
- Ko, J.M.; Ni, Y.Q. Technology Developments in Structural Health Monitoring of Large-Scale Bridges. Eng. Struct. 2005, 27, 1715–1725. [Google Scholar] [CrossRef]
- Paolucci, R.; Muttillo, M.; Di Luzio, M.; Alaggio, R.; Ferri, G. Electronic Sensory System for Structural Health Monitoring Applications. In Proceedings of the 2020 5th International Conference on Smart and Sustainable Technologies (SpliTech), Split, Croatia, 23–26 September 2020; IEEE: Split, Croatia, 2020; pp. 1–5. [Google Scholar]
- Gopalakrishnan, S.; Ruzzene, M.; Hanagud, S.V. Computational Techniques for Structural Health Monitoring; Springer Series in Reliability Engineering; Springer: London, UK, 2011; ISBN 978-0-85729-283-4. [Google Scholar]
- Heslehurst, R.B. Defects and Damage in Composite Materials and Structures, 1st ed.; CRC Press: Boca Raton, FL, USA; Taylor & Francis Group: Boca Raton, FL, USA, 2014; ISBN 978-1-4665-8048-0. [Google Scholar]
- Ooijevaar, T.H. Vibration Based Structural Health Monitoring of Composite Skin-Stiffener Structures. Ph.D. Thesis, University of Twente, Enschede, The Netherlands, 2014. [Google Scholar]
- Li, H.-N.; Ren, L.; Jia, Z.-G.; Yi, T.-H.; Li, D.-S. State-of-the-Art in Structural Health Monitoring of Large and Complex Civil Infrastructures. J. Civ. Struct. Health Monit. 2016, 6, 3–16. [Google Scholar] [CrossRef]
- Wang, Y.; Lynch, J.P.; Law, K.H. A Wireless Structural Health Monitoring System with Multithreaded Sensing Devices: Design and Validation. Struct. Infrastruct. Eng. 2007, 3, 103–120. [Google Scholar] [CrossRef] [Green Version]
- Hu, X.; Wang, B.; Ji, H. A Wireless Sensor Network-Based Structural Health Monitoring System for Highway Bridges: A Wireless Sensor Network-Based SHM System for Highway Bridges. Comput. Aided Civ. Infrastruct. Eng. 2013, 28, 193–209. [Google Scholar] [CrossRef]
- Valenti, S.; Conti, M.; Pierleoni, P.; Zappelli, L.; Belli, A.; Gara, F.; Carbonari, S.; Regni, M. A Low Cost Wireless Sensor Node for Building Monitoring. In Proceedings of the 2018 IEEE Workshop on Environmental, Energy, and Structural Monitoring Systems (EESMS), Salerno, Italy, 21–22 June 2018; IEEE: Salerno, Italy, 2018; pp. 1–6. [Google Scholar]
- Wondra, B.; Malek, S.; Botz, M.; Glaser, S.D.; Grosse, C.U. Wireless High-Resolution Acceleration Measurements for Structural Health Monitoring of Wind Turbine Towers. Data Enabled Discov. Appl. 2019, 3, 4. [Google Scholar] [CrossRef] [Green Version]
- Pierleoni, P.; Conti, M.; Belli, A.; Palma, L.; Incipini, L.; Sabbatini, L.; Valenti, S.; Mercuri, M.; Concetti, R. IoT Solution Based on MQTT Protocol for Real-Time Building Monitoring. In Proceedings of the 2019 IEEE 23rd International Symposium on Consumer Technologies (ISCT), Ancona, Italy, 19–21 June 2019; IEEE: Ancona, Italy, 2019; pp. 57–62. [Google Scholar]
- Quqa, S.; Landi, L.; Diotallevi, P.P. REAL TIME DAMAGE DETECTION THROUGH SINGLE LOW-COST SMART SENSOR. In Proceedings of the 7th International Conference on Computational Methods in Structural Dynamics and Earthquake Engineering (COMPDYN 2019), Crete, Greece, 24–26 June 2019; Institute of Structural Analysis and Antiseismic Research School of Civil Engineering National Technical University of Athens (NTUA) Greece: Crete, Greece, 2019; pp. 3914–3925. [Google Scholar]
- Khan, I.; Choi, S.; Kwon, Y.-W. Earthquake Detection in a Static and Dynamic Environment Using Supervised Machine Learning and a Novel Feature Extraction Method. Sensors 2020, 20, 800. [Google Scholar] [CrossRef] [PubMed] [Green Version]
- Noel, A.B.; Abdaoui, A.; Elfouly, T.; Ahmed, M.H.; Badawy, A.; Shehata, M.S. Structural Health Monitoring Using Wireless Sensor Networks: A Comprehensive Survey. IEEE Commun. Surv. Tutor. 2017, 19, 1403–1423. [Google Scholar] [CrossRef]
- Wang, B.; Li, J.; Ye, W.; Liu, Y.; Qu, C. Design and Development of Flexible Baseline-Based Distributed Position and Orientation Measurement System. In Proceedings of the 2020 IEEE International Instrumentation and Measurement Technology Conference (I2MTC), Dubrovnik, Croatia, 25–28 May 2020; IEEE: Dubrovnik, Croatia, 2020; pp. 1–6. [Google Scholar]
- Ascioglu, G.; Senol, Y. Design of a Wearable Wireless Multi-Sensor Monitoring System and Application for Activity Recognition Using Deep Learning. IEEE Access 2020, 8, 169183–169195. [Google Scholar] [CrossRef]
- Hwang, G.; Szemes, P.T.; Ando, N.; Hashimoto, H. Development of a Single-Master Multi-Slave Tele-Micromanipulation System. Adv. Robot. 2007, 21, 329–349. [Google Scholar] [CrossRef]
- Yan, W.-J.; Zhao, M.-Y.; Sun, Q.; Ren, W.-X. Transmissibility-Based System Identification for Structural Health Monitoring: Fundamentals, Approaches, and Applications. Mech. Syst. Signal Process. 2019, 117, 453–482. [Google Scholar] [CrossRef]
- Magdaleno, A.; Villacorta, J.J.; del-Val, L.; Izquierdo, A.; Lorenzana, A. Measurement of Acceleration Response Functions with Scalable Low-Cost Devices. An Application to the Experimental Modal Analysis. Sensors 2021, 21, 6637. [Google Scholar] [CrossRef] [PubMed]
- Sonbul, O.S.; Rashid, M. Algorithms and Techniques for the Structural Health Monitoring of Bridges: Systematic Literature Review. Sensors 2023, 23, 4230. [Google Scholar] [CrossRef] [PubMed]
- ESP32-WROOM-32 Datasheet. Available online: https://www.espressif.com/sites/default/files/documentation/esp32-wroom-32_datasheet_en.pdf (accessed on 31 May 2023).
- GPS Standalone Module Data Sheet. Available online: https://cdn-shop.adafruit.com/datasheets/GlobalTop-FGPMMOPA6H-Datasheet-V0A.pdf (accessed on 31 May 2023).
- Low Noise, Low Drift, Low Power, 3-Axis MEMS Accelerometers—ADXL354/ADXL355 Data Sheet. Available online: https://www.analog.com/media/en/technical-documentation/data-sheets/adxl354_adxl355.pdf (accessed on 31 May 2023).
- 3-Axis, ±2 g/±4 g/±8 g/±16 g Digital Accelerometer—ADXL345 Data Sheet. Available online: https://www.analog.com/media/en/technical-documentation/data-sheets/adxl345.pdf (accessed on 31 May 2023).
- IS37SML01G1/IS38SML01G1, 1Gb SLC-1b ECC 3.3V Serial NAND Flash Memory with 104 MHz Multi I/O SPI Interface Data Sheet. Available online: https://www.mouser.it/datasheet/2/198/37_38SML01G1-1146770.pdf (accessed on 31 May 2023).
- MAX13487E/MAX13488E Half-Duplex RS-485-/RS-422-Compatible Transceiver with AutoDirection Control. Available online: https://www.analog.com/media/en/technical-documentation/data-sheets/MAX13487E-MAX13488E.pdf (accessed on 31 May 2023).
- RFM95W LoRa Module. Available online: https://www.hoperf.com/modules/lora/RFM95.html (accessed on 31 May 2023).
- VX78-500—Non-Isolated DC Switching Regulator. Available online: https://www.cui.com/product/resource/vx78-500.pdf (accessed on 31 May 2023).
- BQ2407x Standalone 1-Cell 1.5-A Linear Battery Chargers with Power Path. Available online: https://www.ti.com/lit/ds/symlink/bq24074.pdf?ts=1685558712938&ref_url=https%253A%252F%252Fwww.ti.com%252Fsitesearch%252Fen-us%252Fdocs%252Funiversalsearch.tsp%253FlangPref%253Den-US%2526searchTerm%253DBQ2407x%2526nr%253D199 (accessed on 31 May 2023).
- LM1117 800-MA, Low-Dropout Linear Regulator. Available online: https://www.ti.com/lit/ds/symlink/lm1117.pdf?ts=1685485124287&ref_url=https%253A%252F%252Fwww.google.com%252F (accessed on 31 May 2023).
Figure 1.
Architectural scheme of the system.

Figure 2.
Final node scheme (a) and photo (b).

Figure 3.
Flow diagram representing sensor node operation in its on state.

Figure 4.
Packet structure: (a) raw time domain data, (b) cumulative FFT, (c) spectrogram.

Figure 5.
Photo of the intact structure.

Figure 6.
Node arrangement from an inside (a) and outside view (b).

Figure 7.
Time response comparison of main (a) and backup (b) accelerometers in node 5.

Figure 8.
Time response comparison of main (a) and backup (b) accelerometers in node 5 in case of perturbation performed on the intact structure.
Figure 8.
Time response comparison of main (a) and backup (b) accelerometers in node 5 in case of perturbation performed on the intact structure.

Figure 9.
Time response comparison of main (a) and backup (b) accelerometers in node 5 in the case of perturbation performed on the open structure.
Figure 9.
Time response comparison of main (a) and backup (b) accelerometers in node 5 in the case of perturbation performed on the open structure.

Figure 10.
Spectrograms of the primary (a) and secondary (b) sensors from node 5 related to the third test.
Figure 10.
Spectrograms of the primary (a) and secondary (b) sensors from node 5 related to the third test.

Figure 11.
Spectrograms before (a) and after (b) structural alteration retrieved from the Z axis results on node 3.
Figure 11.
Spectrograms before (a) and after (b) structural alteration retrieved from the Z axis results on node 3.

Figure 12.
Time response retrieved from the main accelerometer installed on node 5 before (a) and after (b) the structural alteration.
Figure 12.
Time response retrieved from the main accelerometer installed on node 5 before (a) and after (b) the structural alteration.


Table 1.
Main differences between RS485 and LoRaWAN protocols.
| Protocol | Communication System | Total Driver and Receiver on One Line | Maximum Operational Distance | Maximum Data Transmission Rate | Duplex Mode |
|---|---|---|---|---|---|
| RS485 | Wired, differential | 32 drivers, 32 receivers (one driver active at a time) | 0.36–0.91 km | 10 Mbit/s | Half duplex or Full Duplex |
| LoRaWAN | Wireless | 1 transmitter, 120 receivers (20 bytes each 16.7 min) | 2–8 km | 0.98–12.5 kBit/s (Uplink) 0.98–21.9 kBit/s (Downlink) | Half Duplex |
Disclaimer/Publisher’s Note: The statements, opinions and data contained in all publications are solely those of the individual author(s) and contributor(s) and not of MDPI and/or the editor(s). MDPI and/or the editor(s) disclaim responsibility for any injury to people or property resulting from any ideas, methods, instructions or products referred to in the content. |
© 2023 by the authors. Licensee MDPI, Basel, Switzerland. This article is an open access article distributed under the terms and conditions of the Creative Commons Attribution (CC BY) license (https://creativecommons.org/licenses/by/4.0/).
Share and Cite
MDPI and ACS Style
Leoni, A.; Barile, G.; Esposito, P.; Paolucci, R.; Stornelli, V.; Ferri, G. A Master Multi-Slave System Based on Structural Modal Frequencies. Electronics 2023, 12, 3260. https://0-doi-org.brum.beds.ac.uk/10.3390/electronics12153260
AMA Style
Leoni A, Barile G, Esposito P, Paolucci R, Stornelli V, Ferri G. A Master Multi-Slave System Based on Structural Modal Frequencies. Electronics. 2023; 12(15):3260. https://0-doi-org.brum.beds.ac.uk/10.3390/electronics12153260
Chicago/Turabian StyleLeoni, Alfiero, Gianluca Barile, Paolo Esposito, Romina Paolucci, Vincenzo Stornelli, and Giuseppe Ferri. 2023. "A Master Multi-Slave System Based on Structural Modal Frequencies" Electronics 12, no. 15: 3260. https://0-doi-org.brum.beds.ac.uk/10.3390/electronics12153260
Note that from the first issue of 2016, this journal uses article numbers instead of page numbers. See further details here.