Defect Estimation in Non-Destructive Testing of Composites by Ultrasonic Guided Waves and Image Processing

 ,
,  , ,
, ,
Abstract
:1. Introduction
2. Background
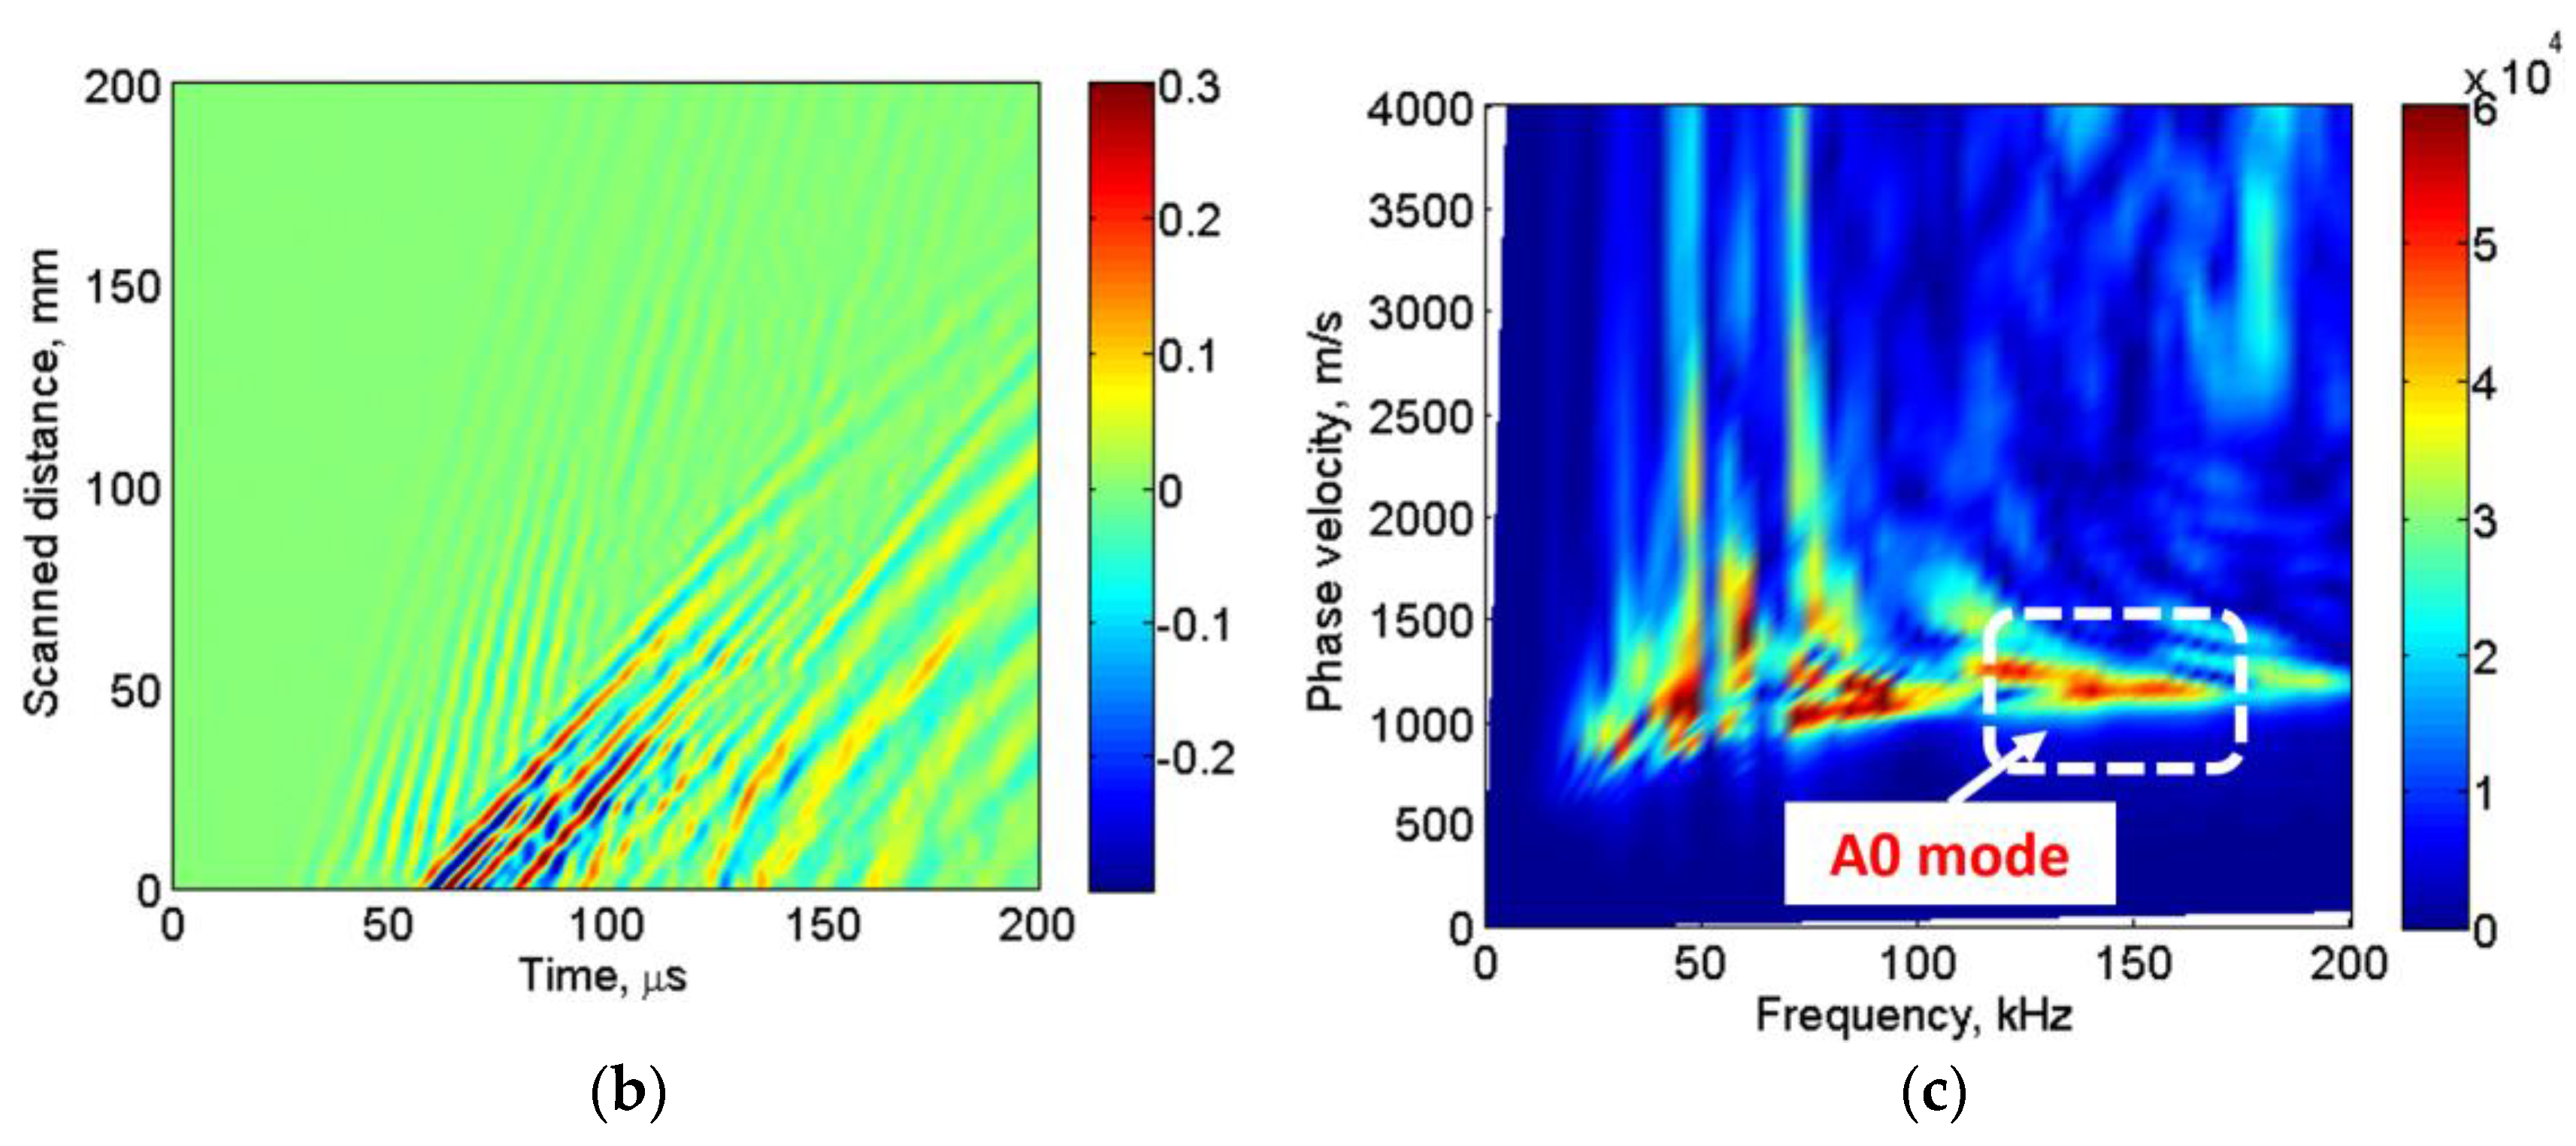
2.1. Guided Wave Propagation in Composite Structures
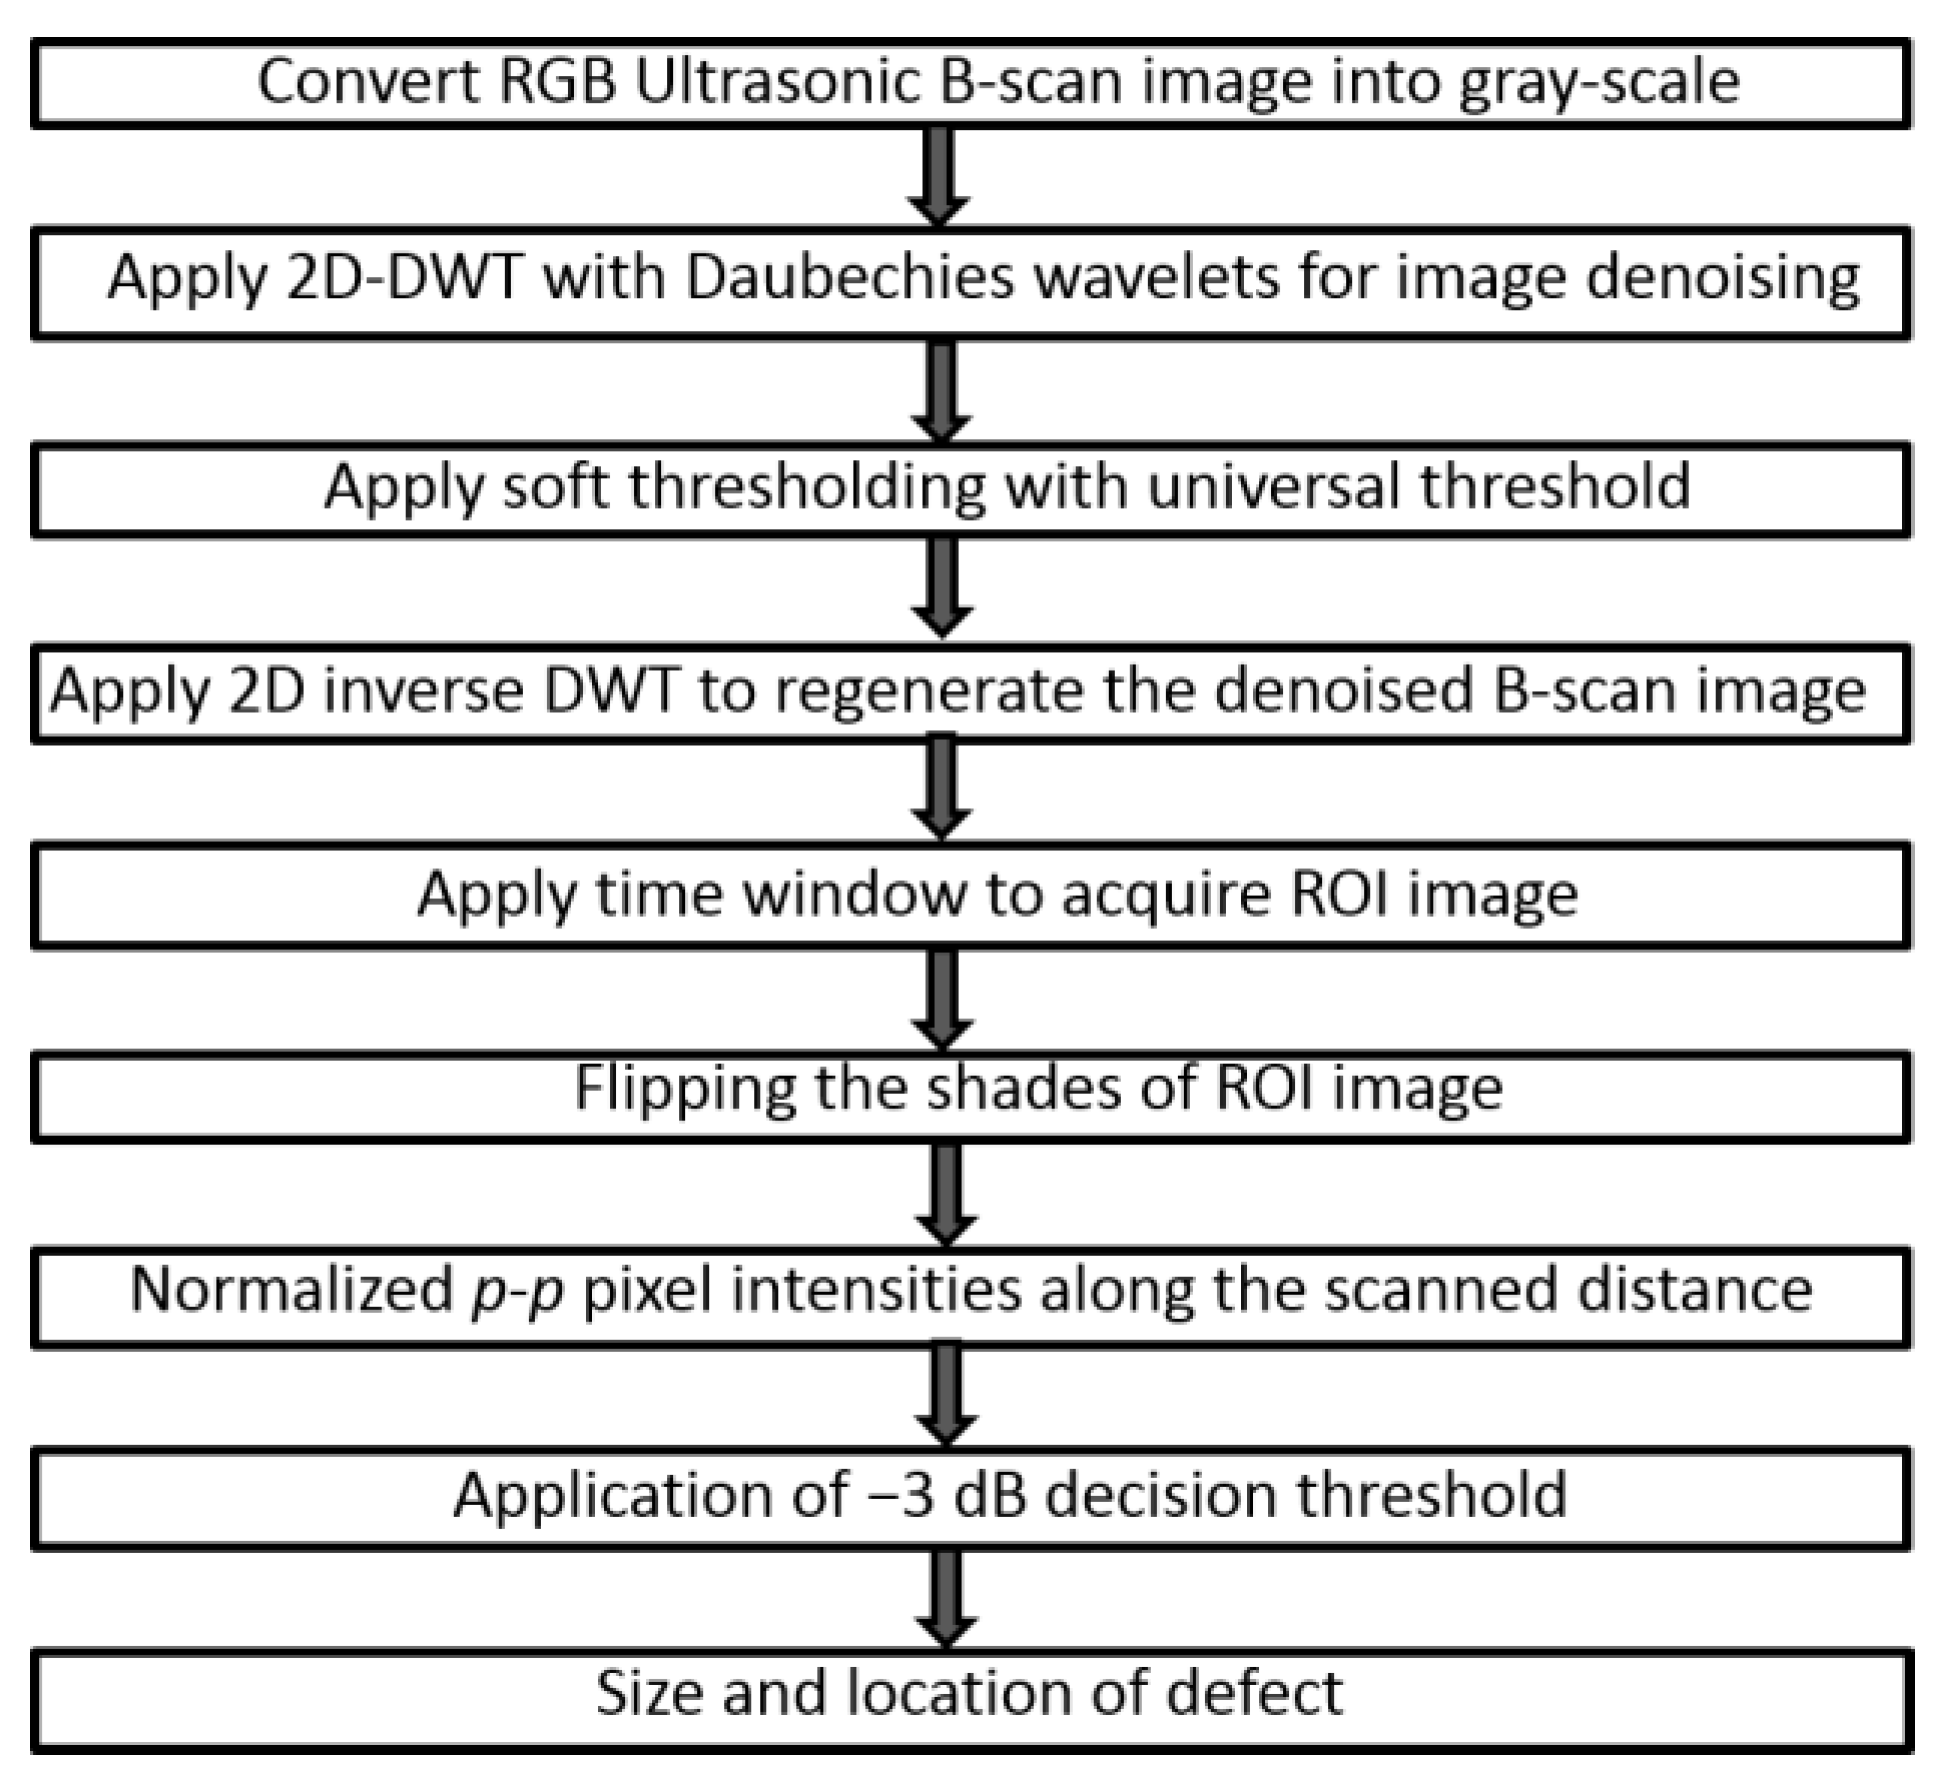
2.2. Image Processing Technique
- There will be four sub-bands LL, LH, HL, and HH in the wavelet domain after one level of 2D decomposition.
- After convolving the LPF in both directions (horizontal and vertical), the LL sub-band is generated, which basically represents the approximated image.
- After convolving the LPF in the horizontal direction and the HPF in the vertical direction, the LH sub-band is produced, which, in general, represents the vertical characteristics of an original image.
- The HL sub-band represents the horizontal characteristics of the image. It is generated by the reverse process of that performed to produce the LH sub-band. Hence, convolving the HPF in the vertical direction and convolving the LPF in the horizontal direction is performed.
- After convolving the HPF in both directions (horizontal and vertical), the HH sub-band is generated, which basically represents the diagonal edge characteristics of the image.
- The noise is mostly concentrated in the HH sub-band, while the LL sub-band contains most of the image features.
3. Experimental Analysis
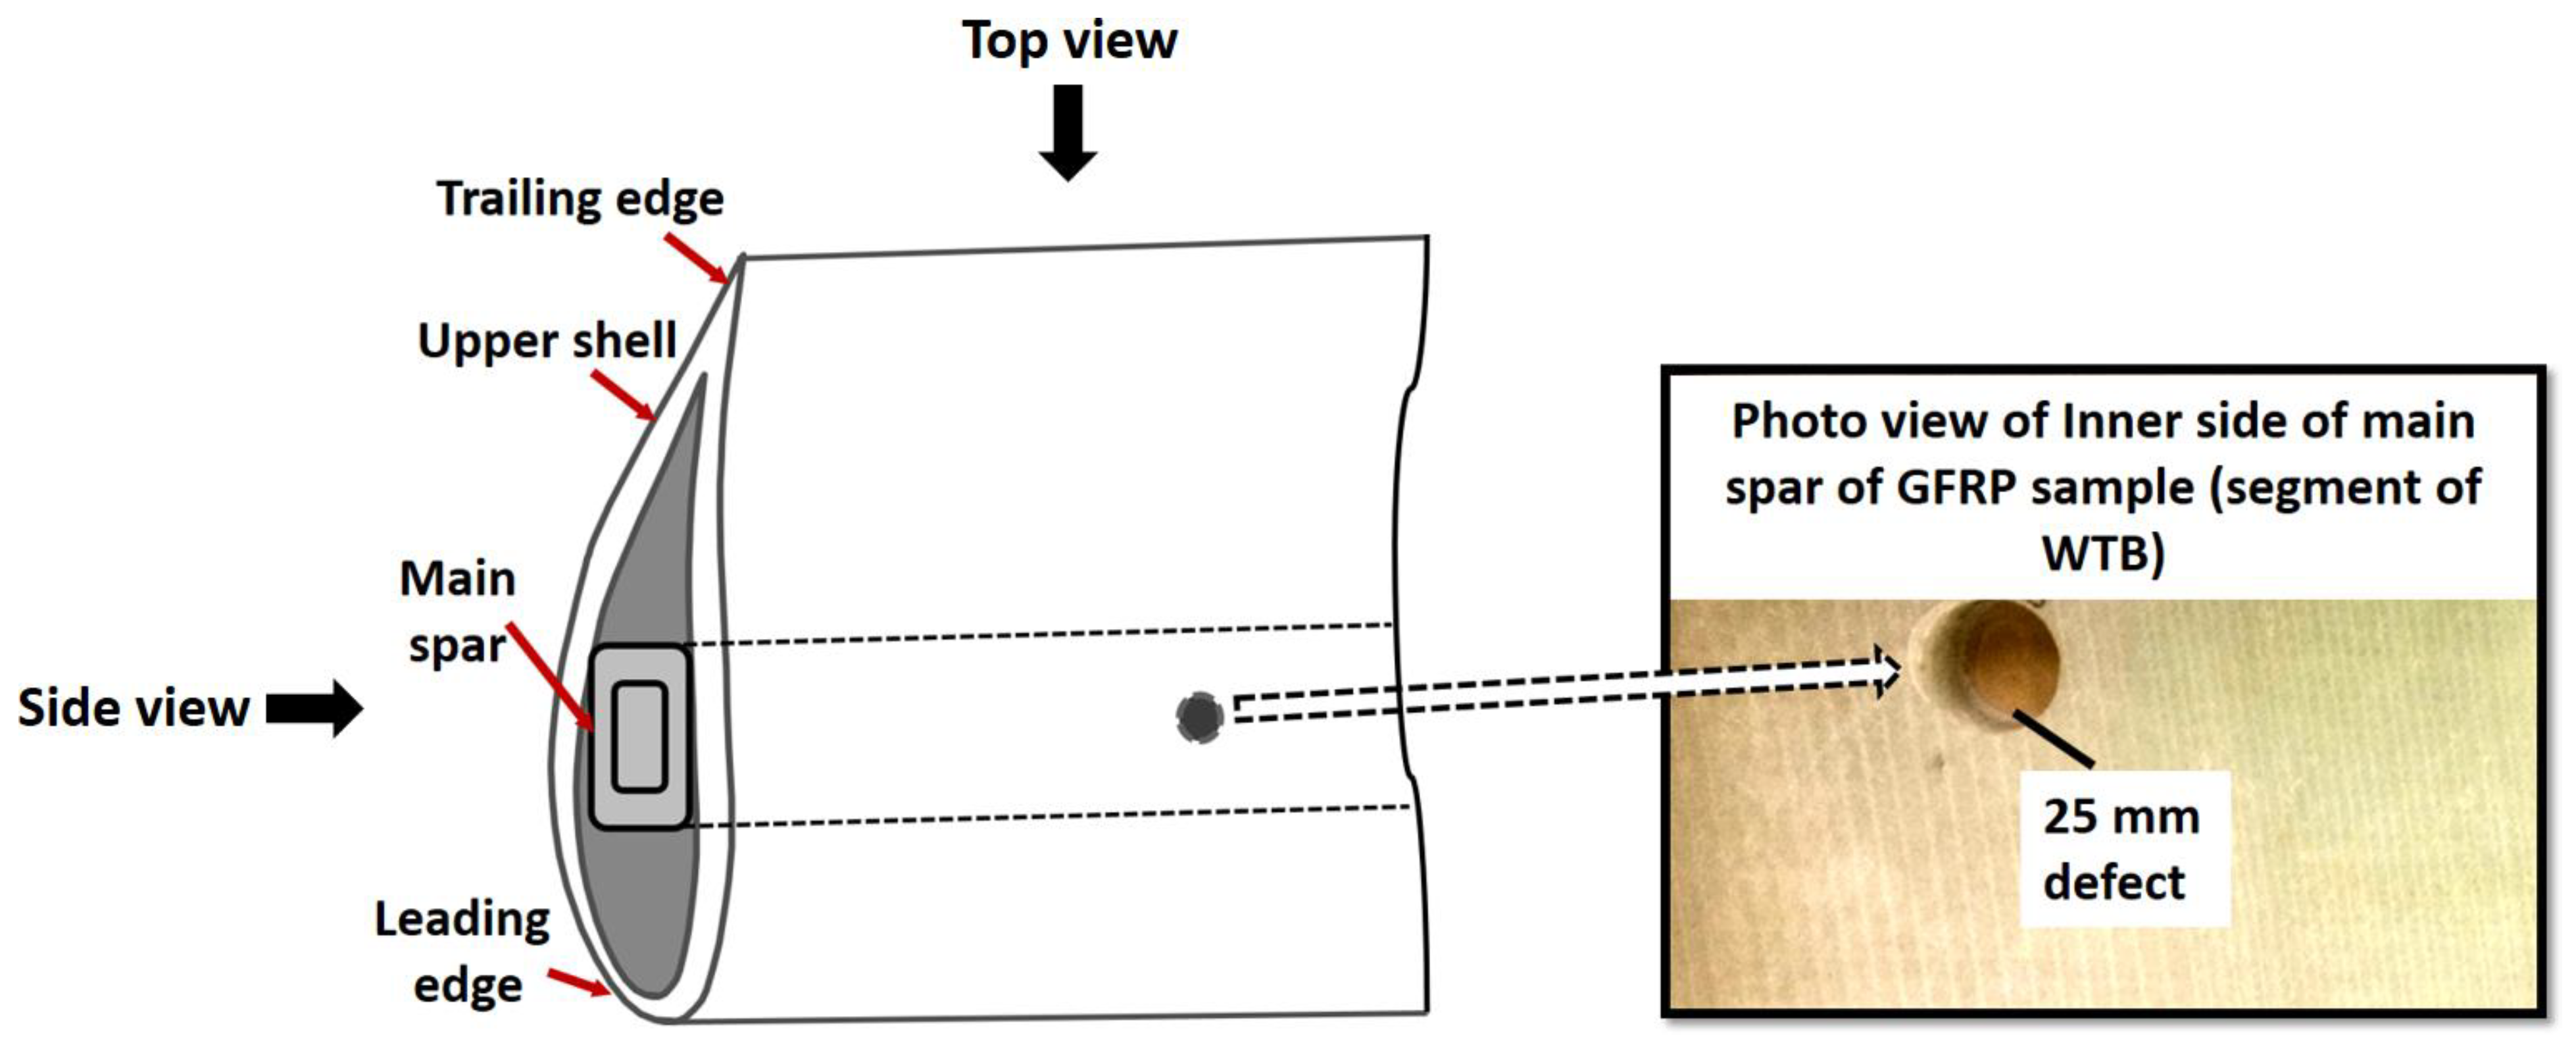
3.1. Object of Investigation
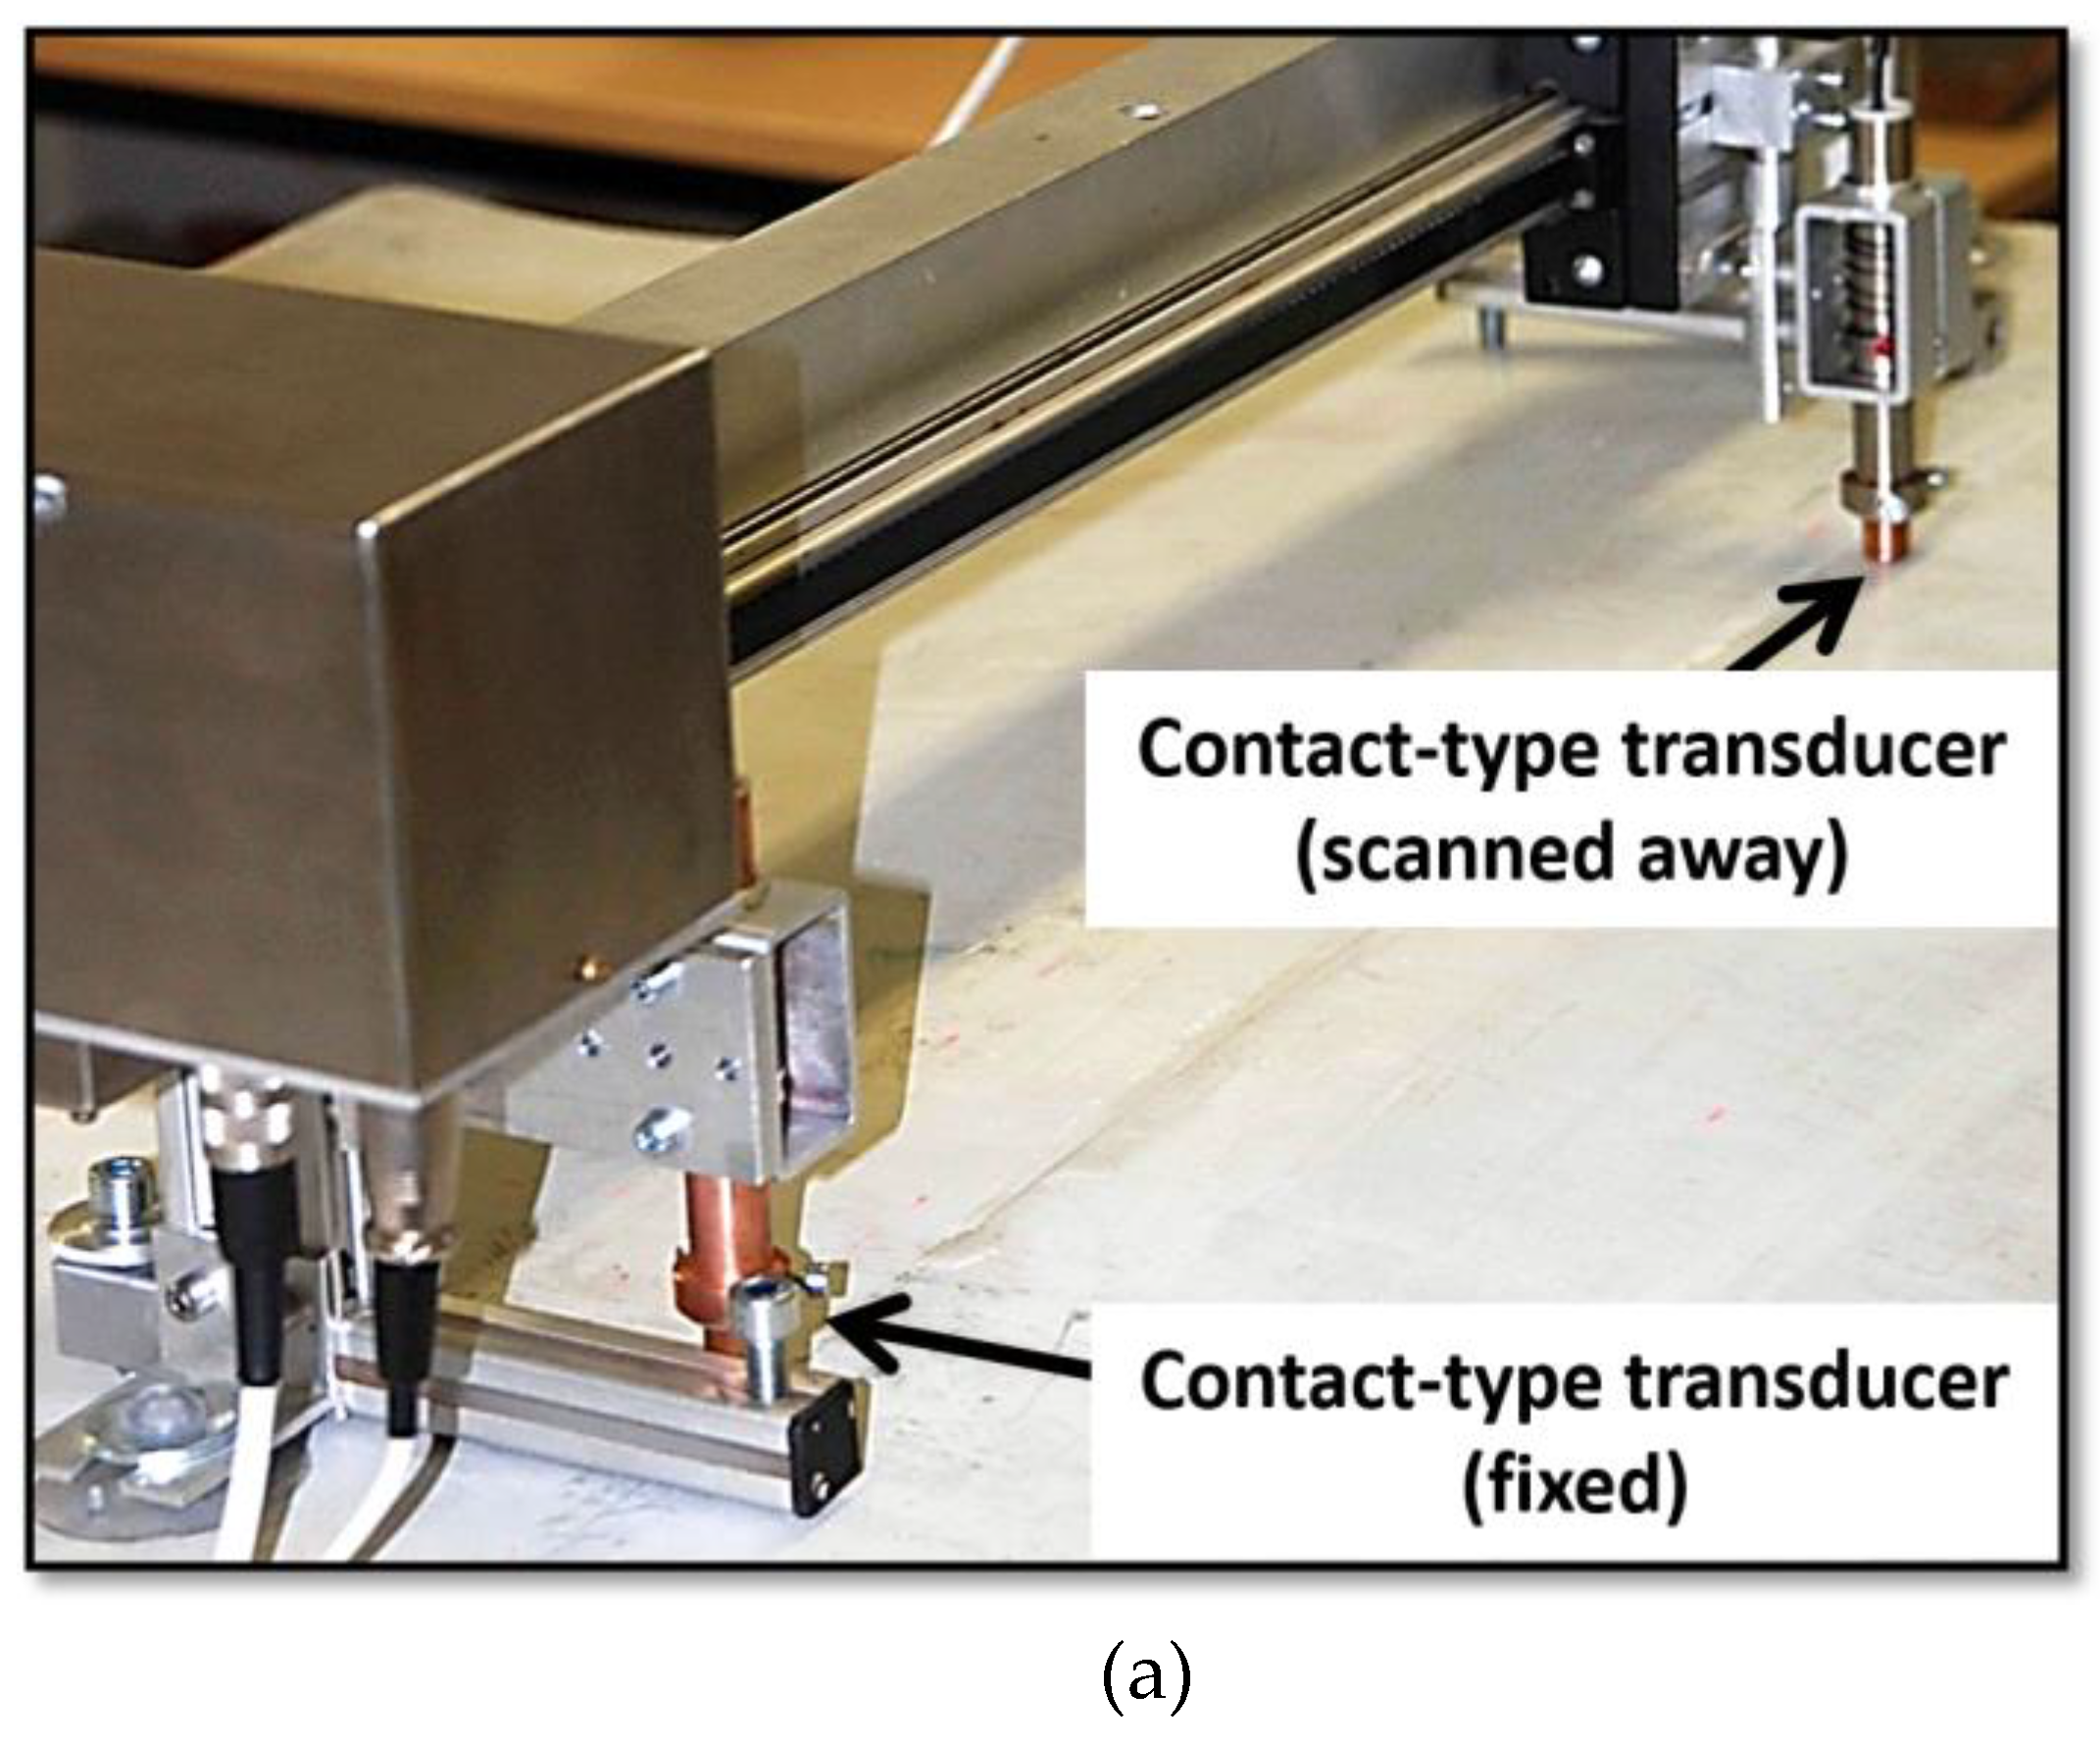
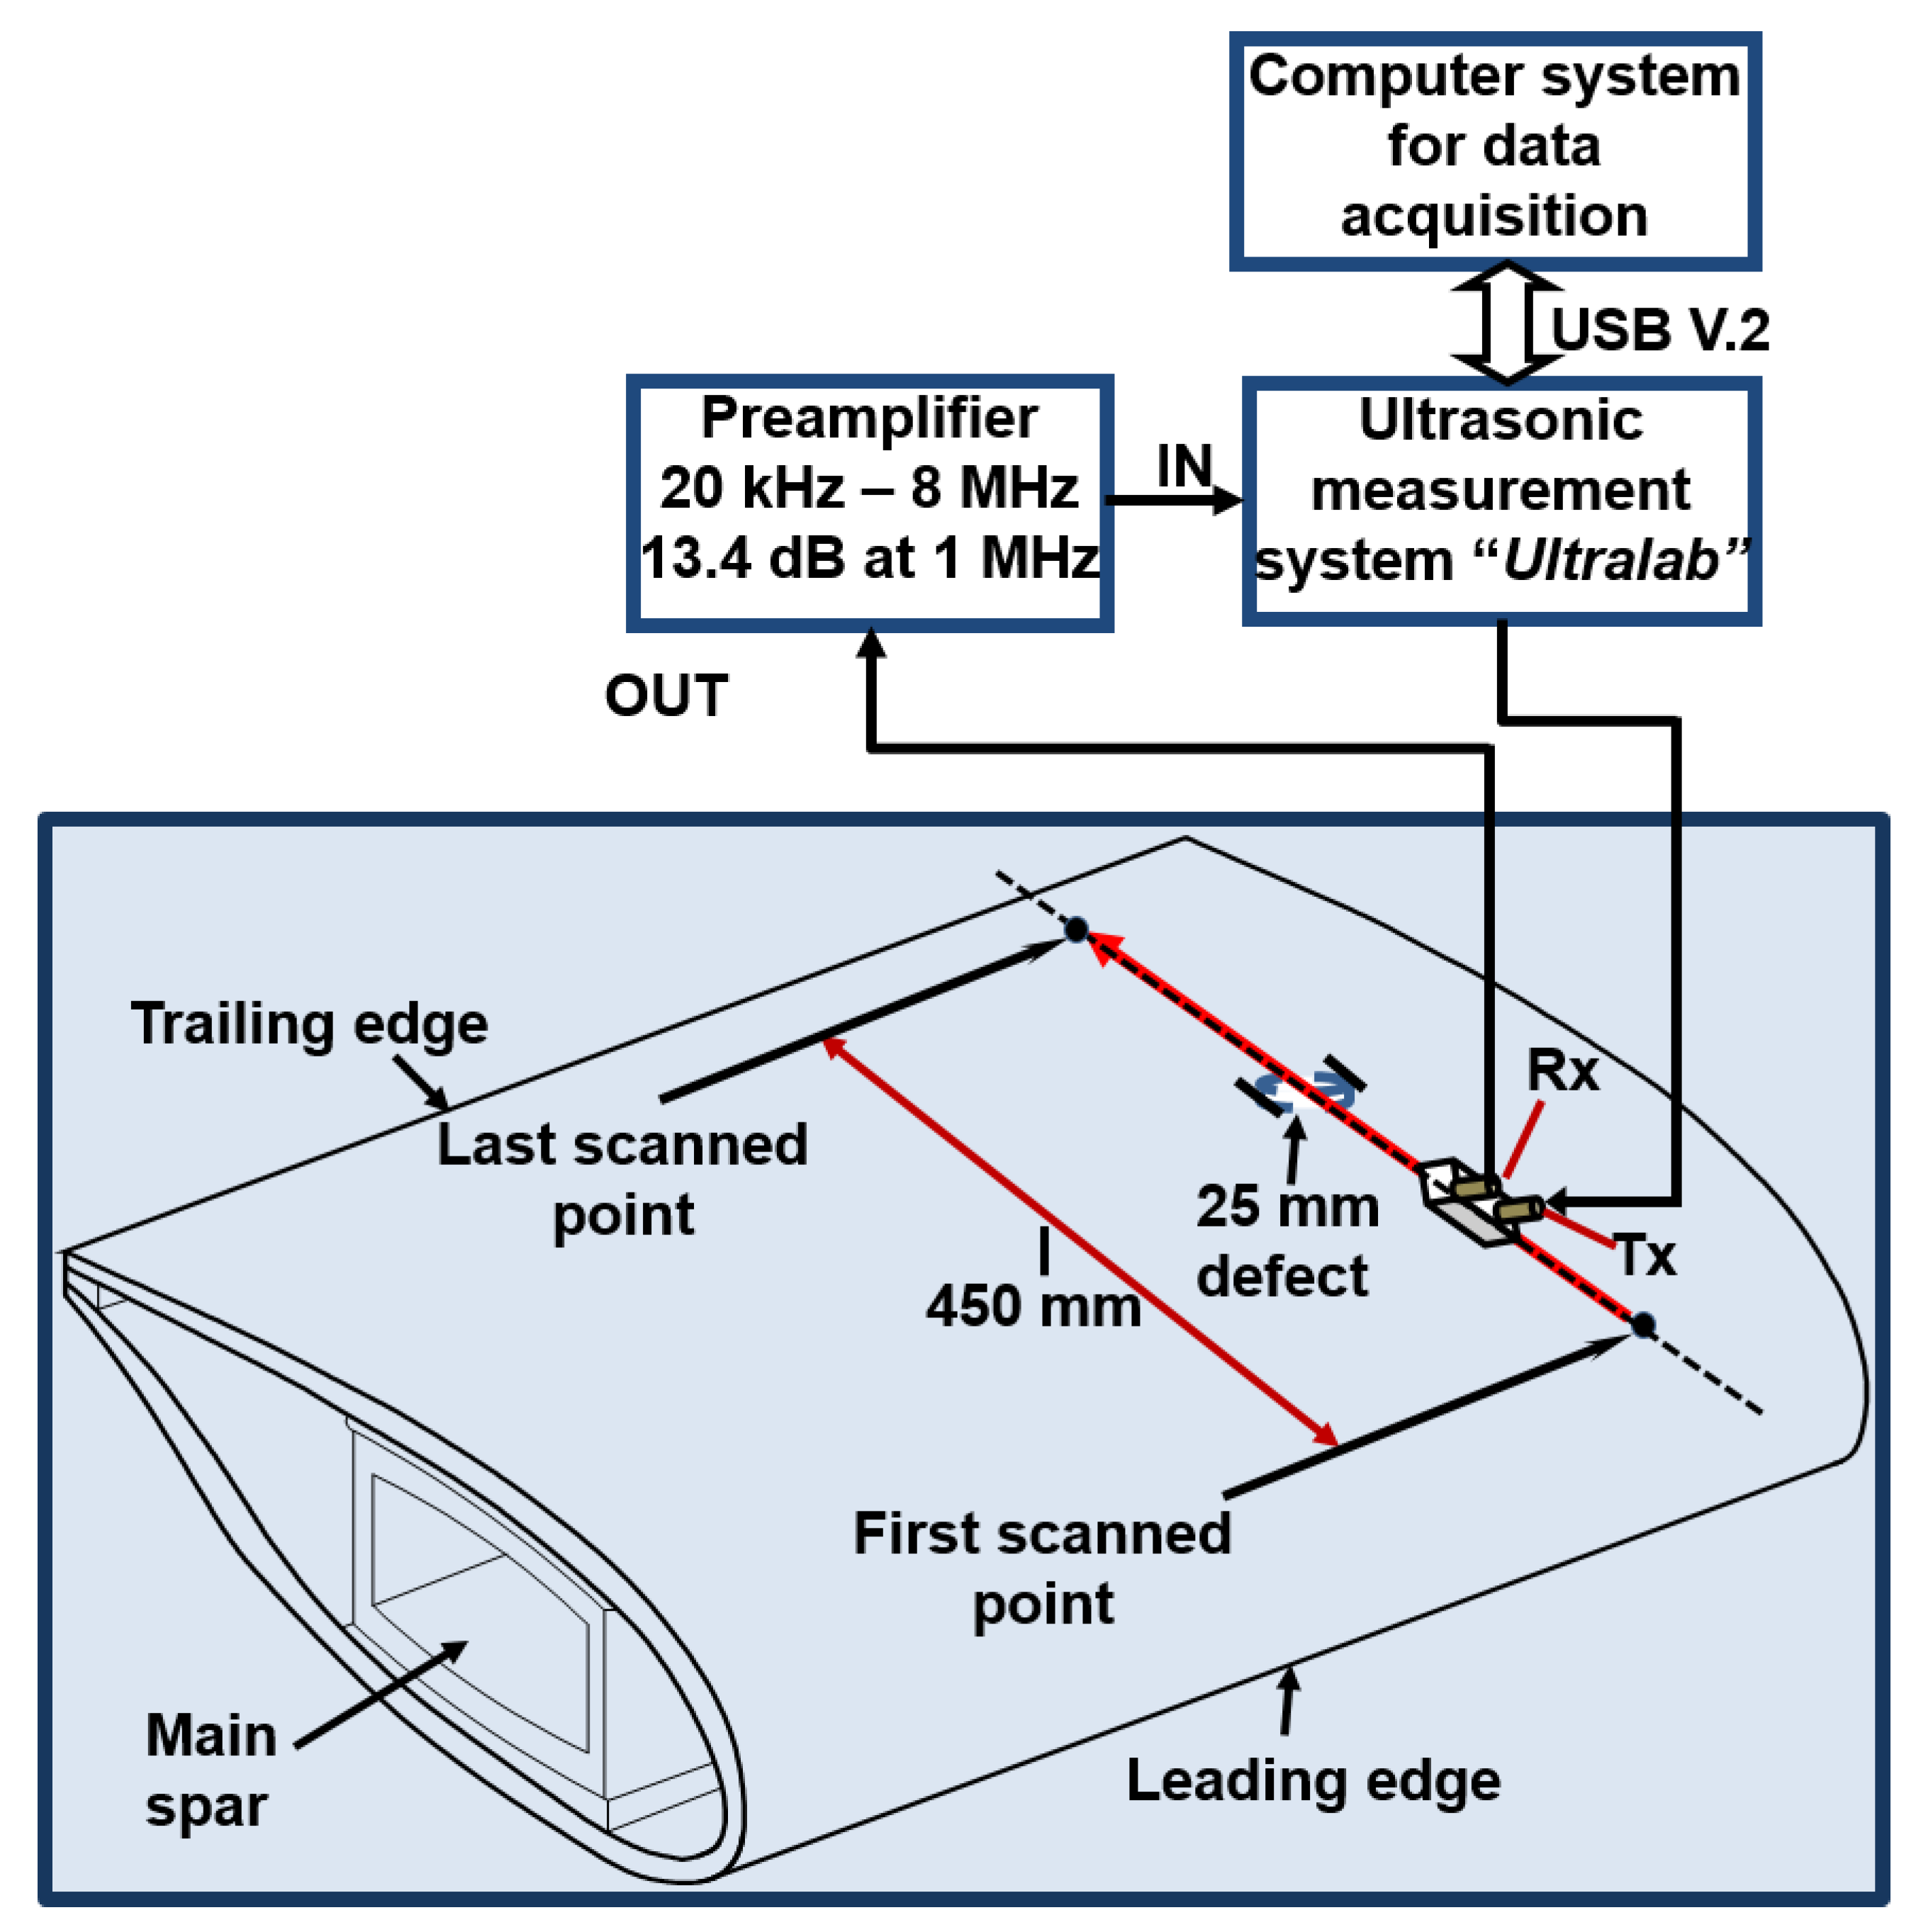
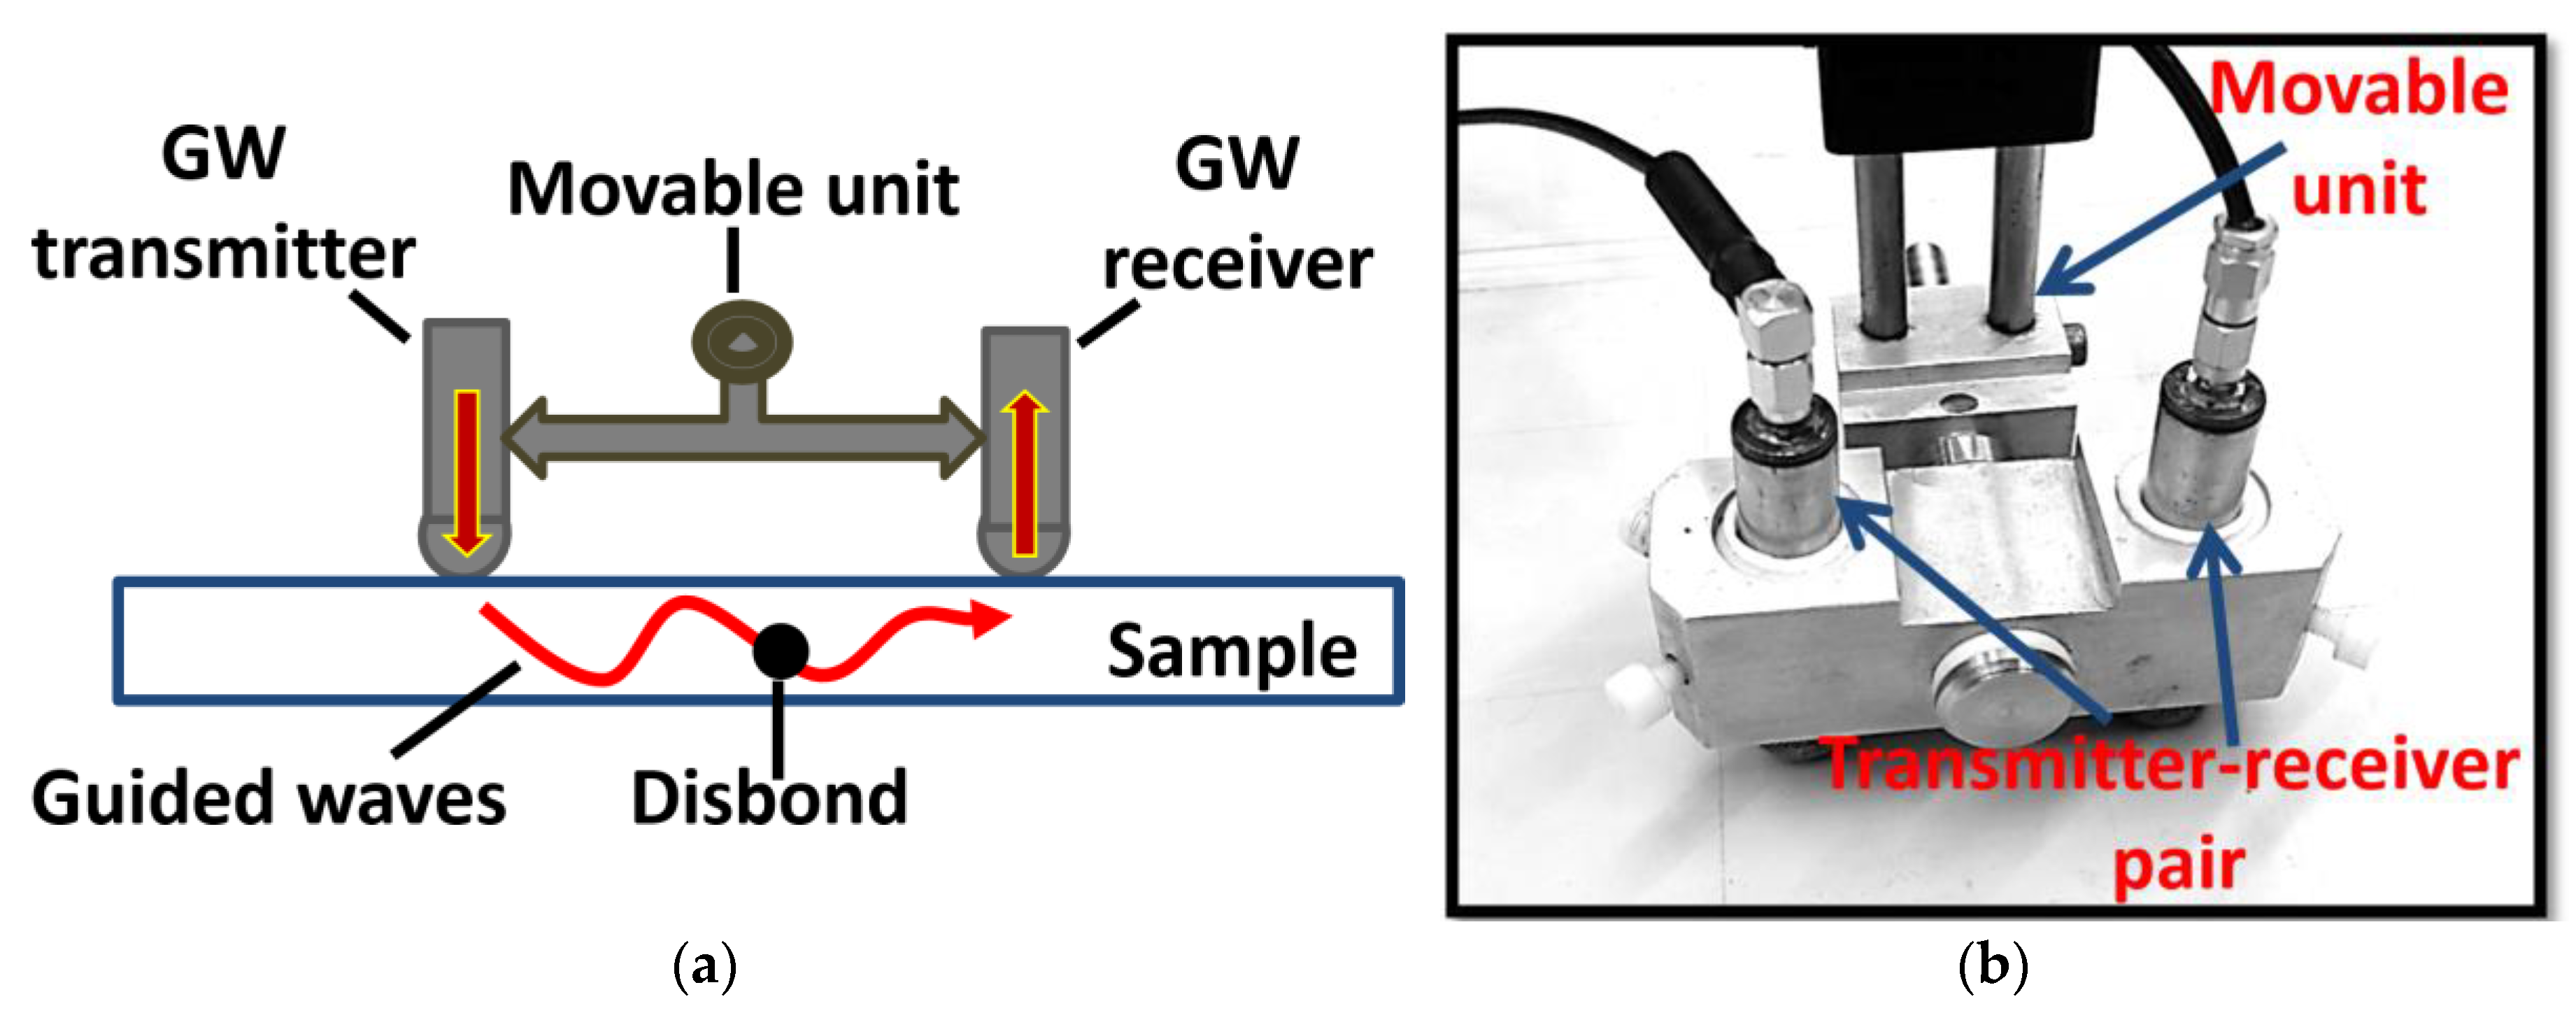
3.2. Devices and Experimental Set-up
- The center frequency of transducers was 190 kHz.
- The −6 dB bandwidth was up to 250 kHz.
- The −10 dB bandwidth was in the range from 35 kHz to 640 kHz.
- The diameter of the conical-shaped protection layer equipped at the bottom of the transducer was 0.2 mm.
4. Results and Discussions
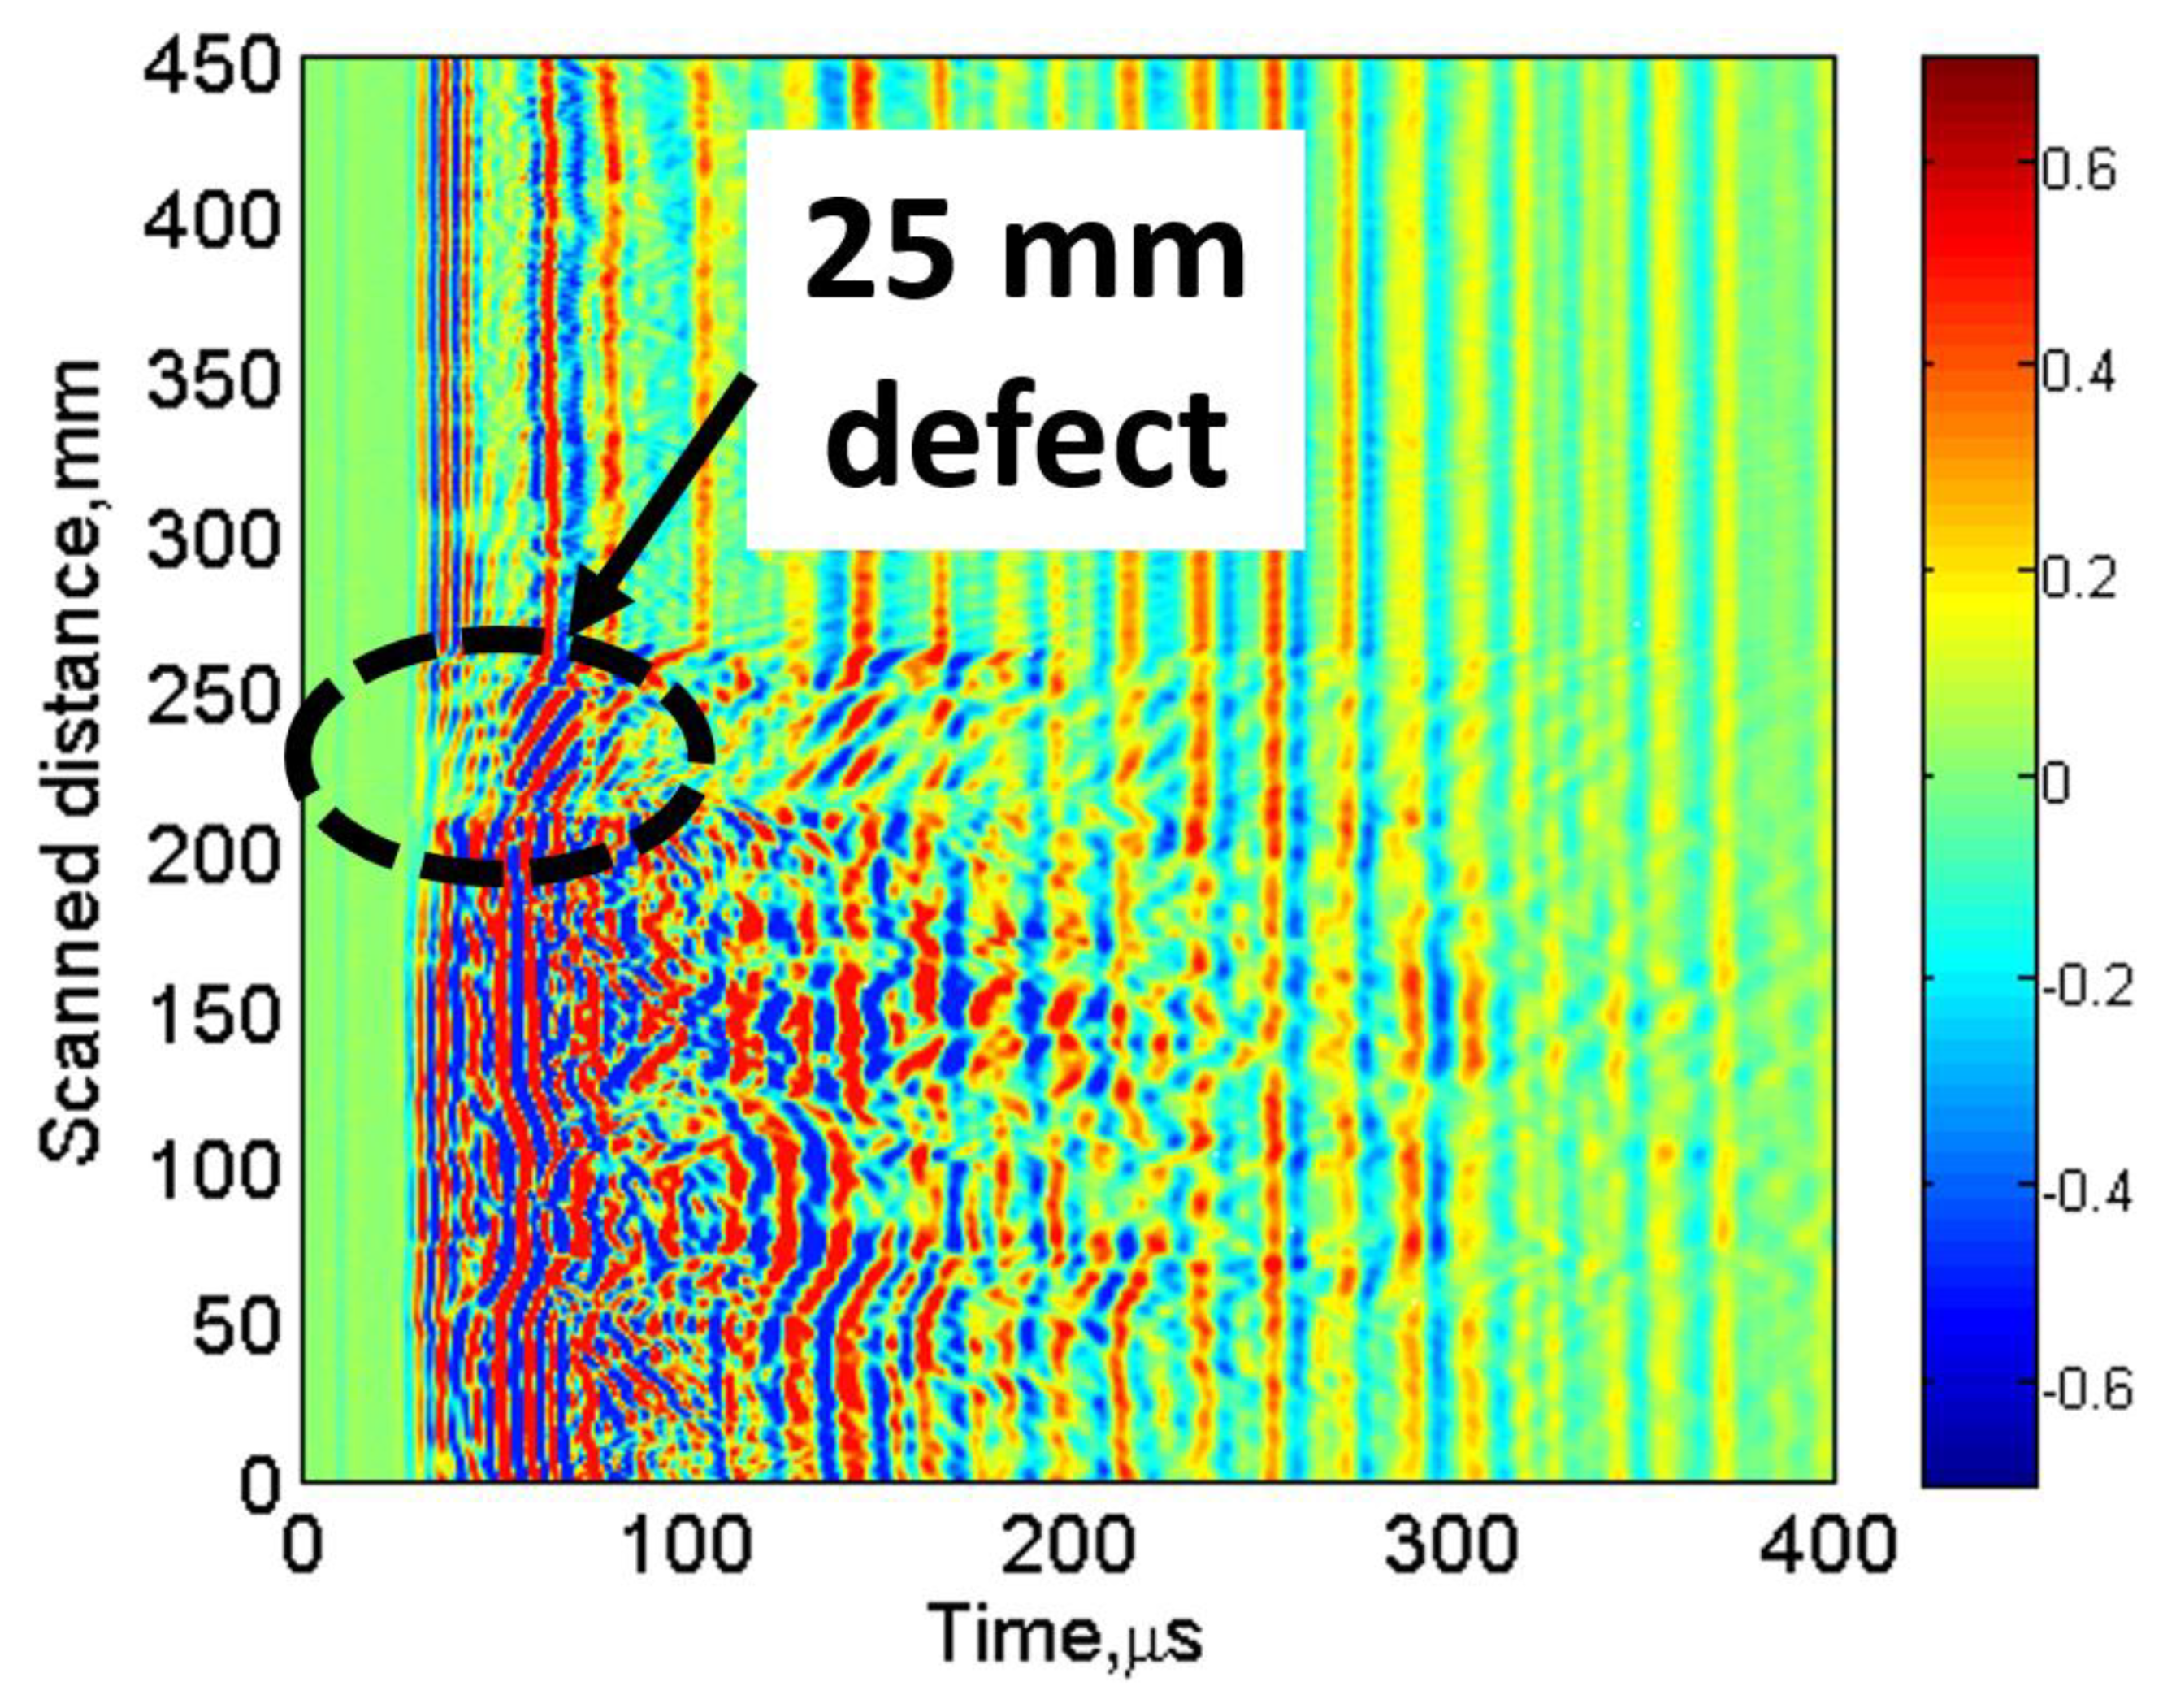
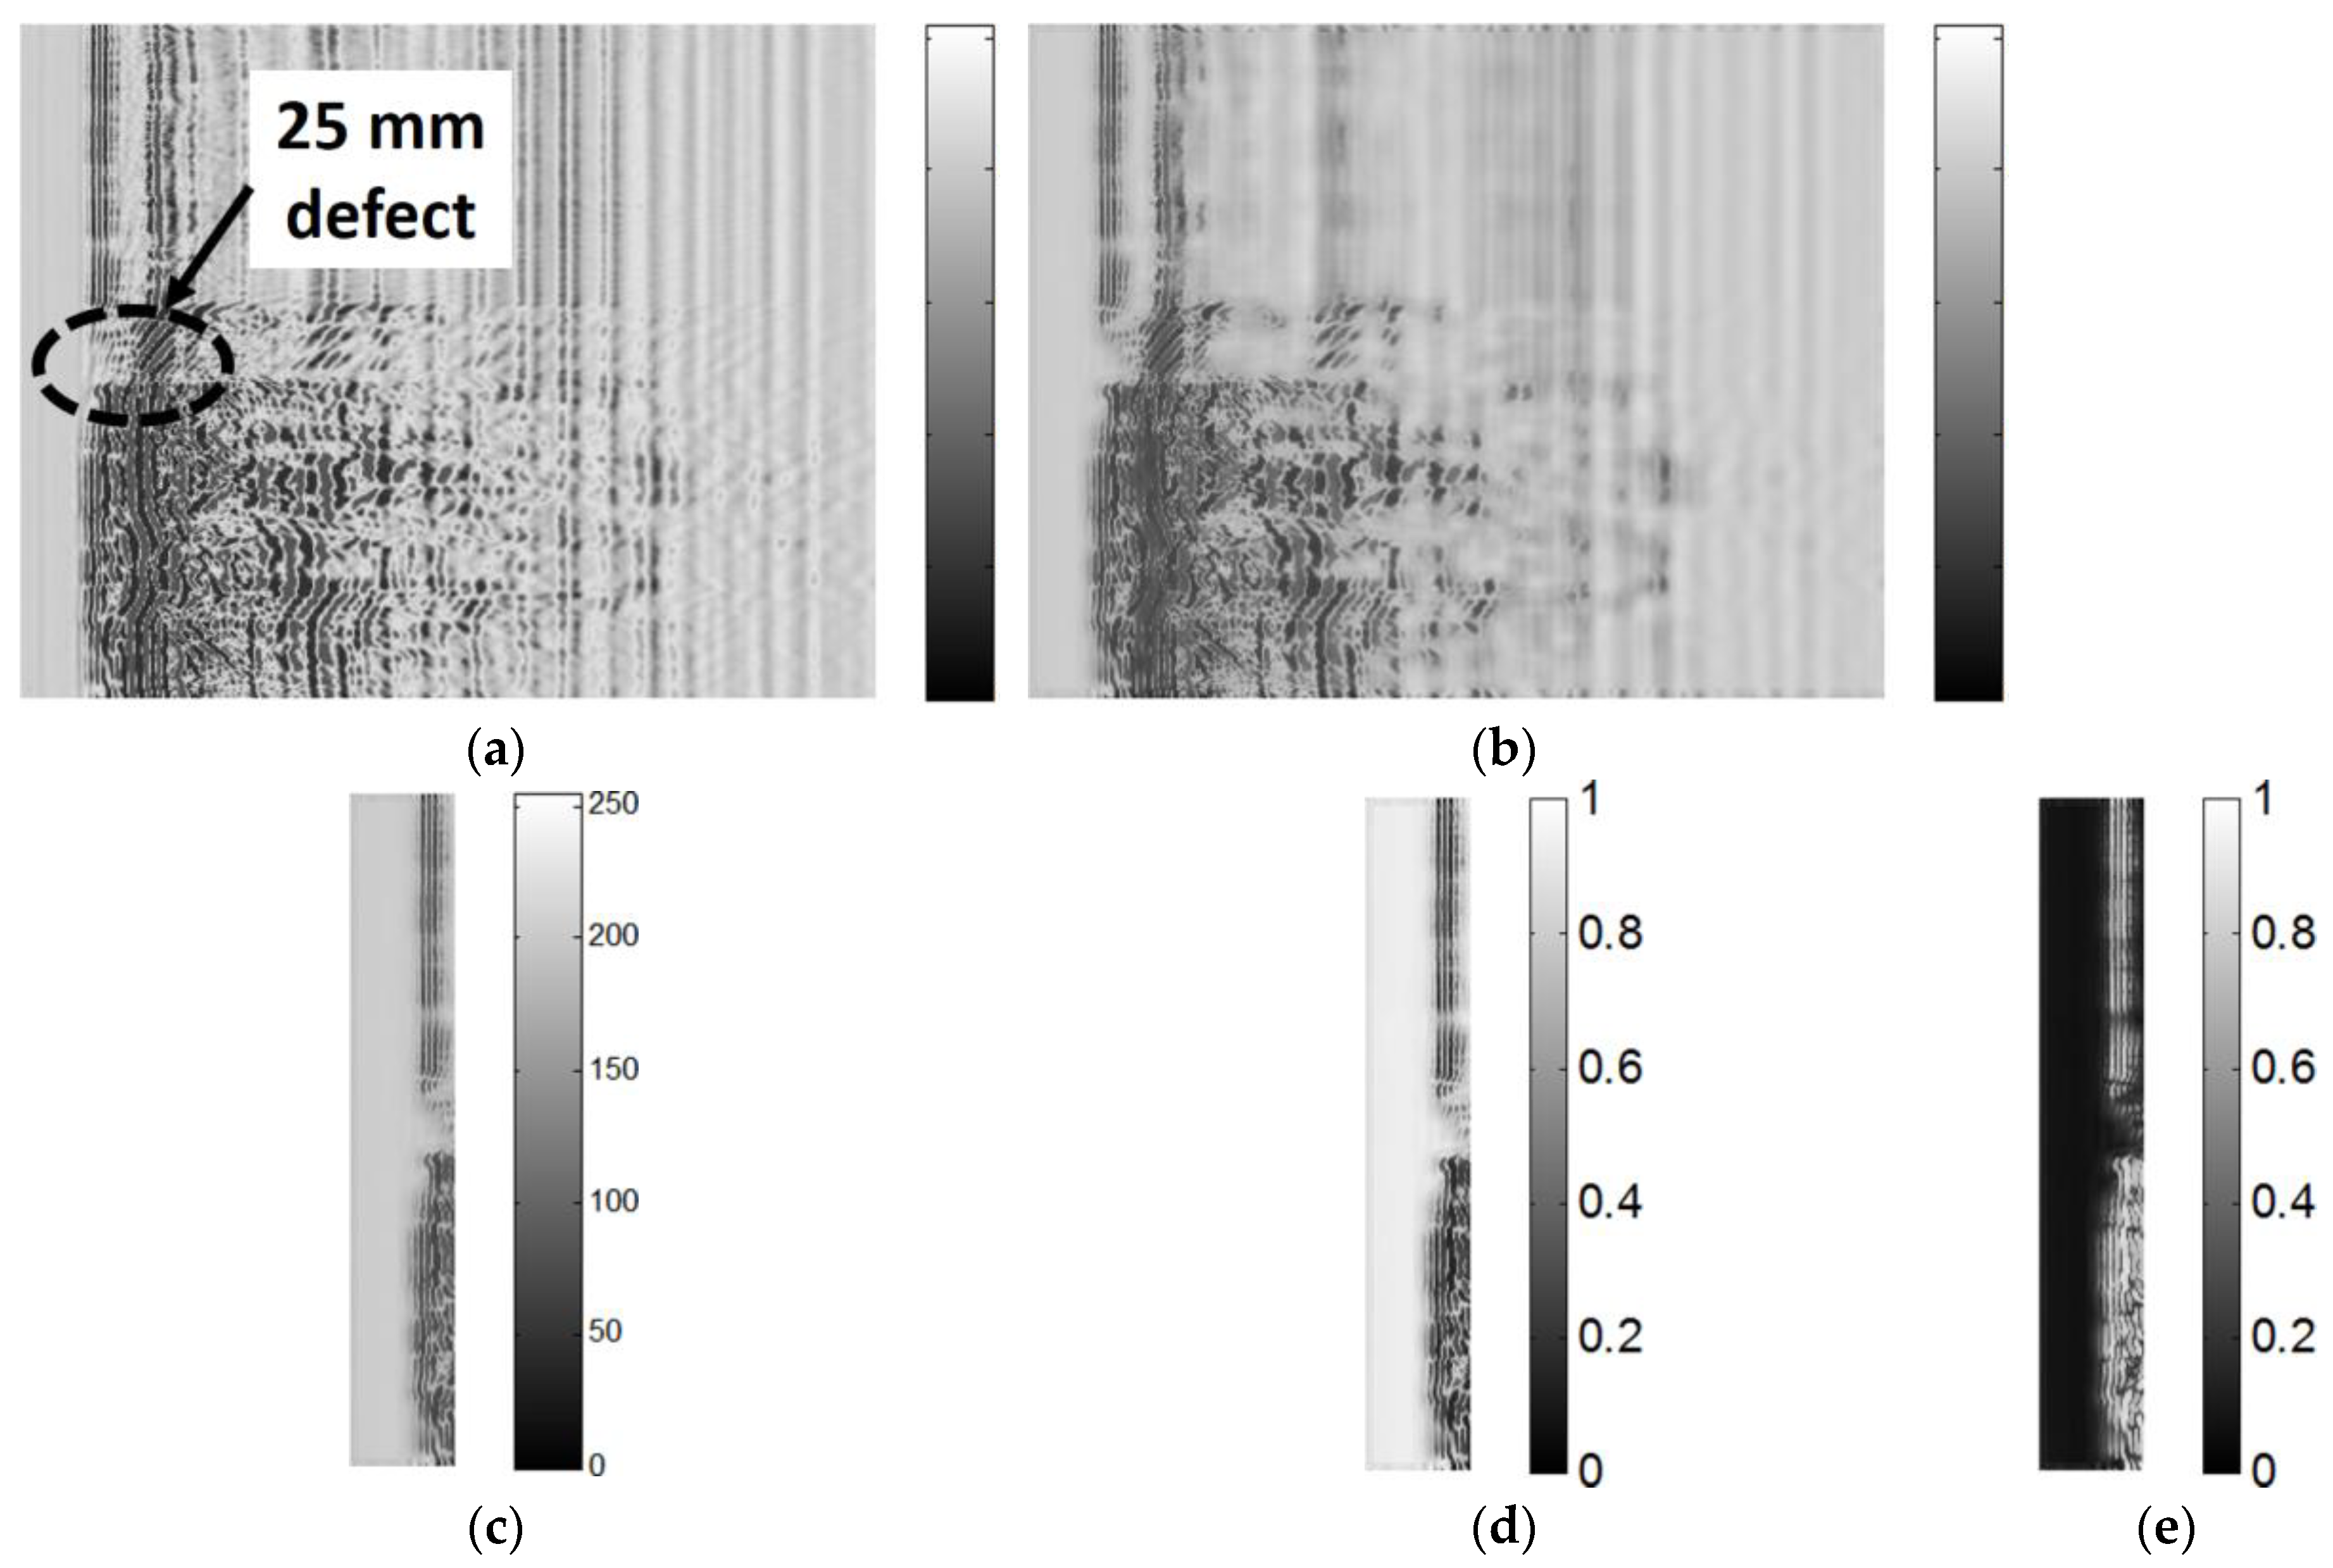
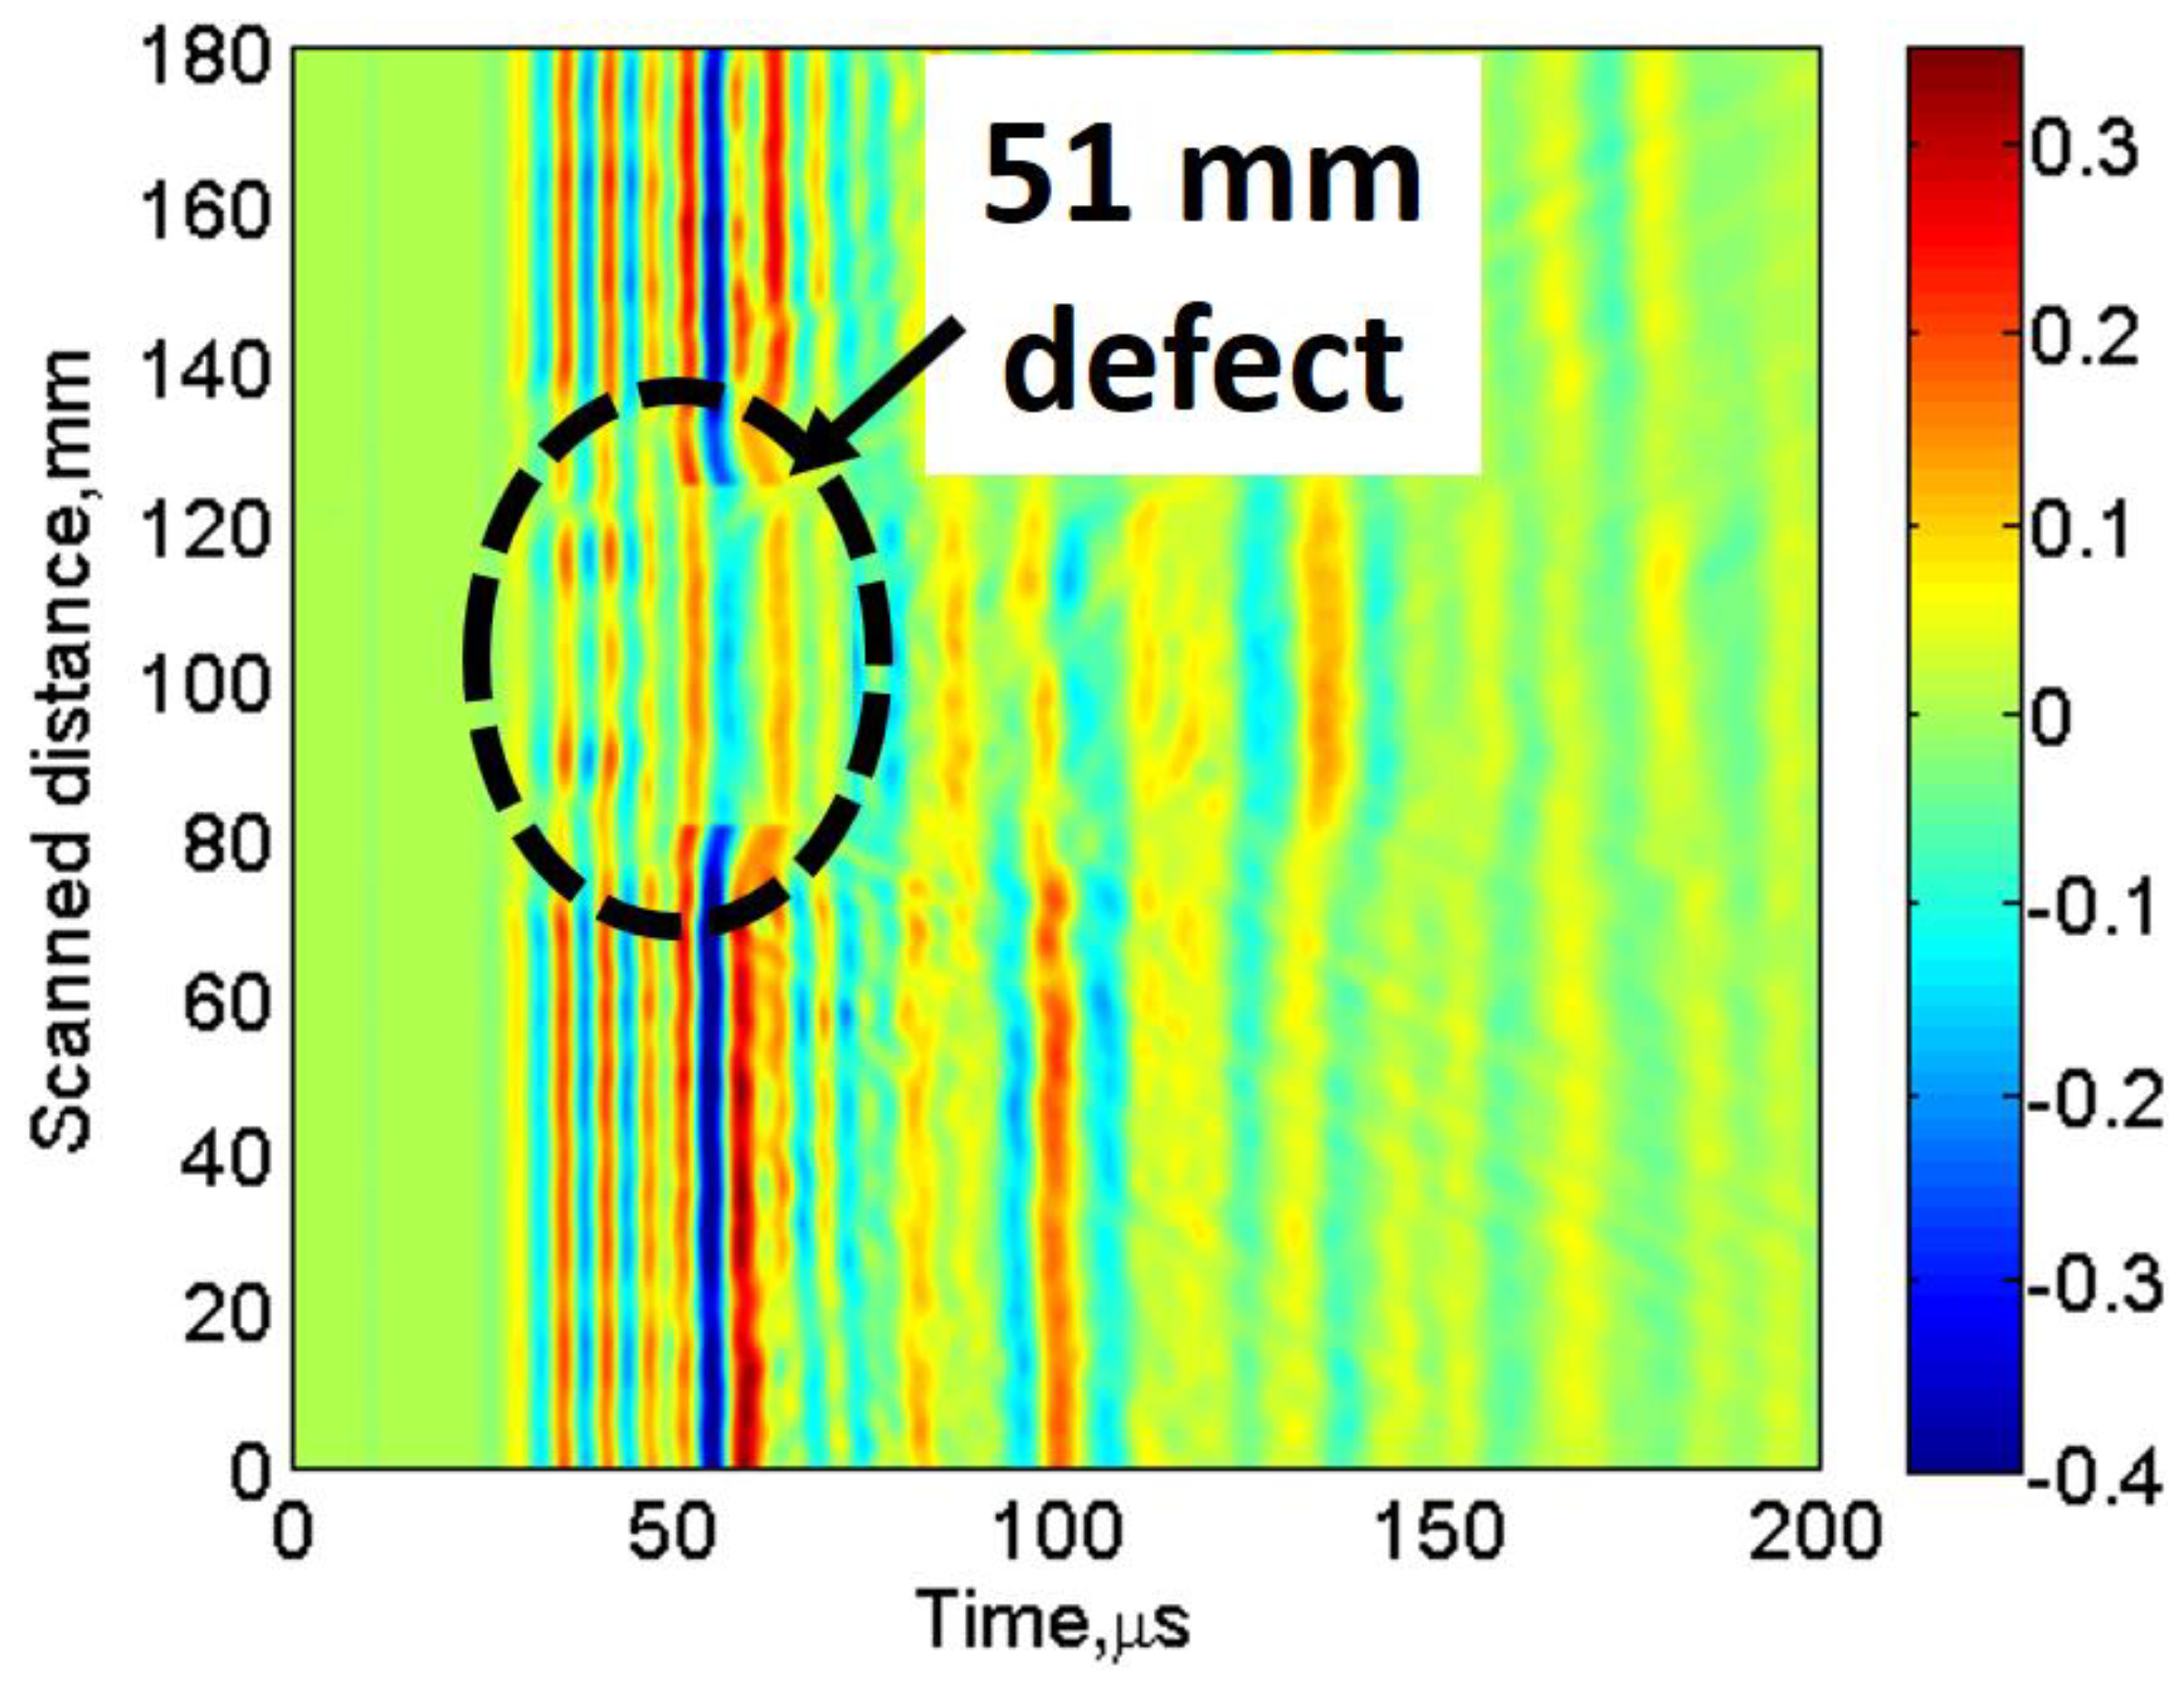
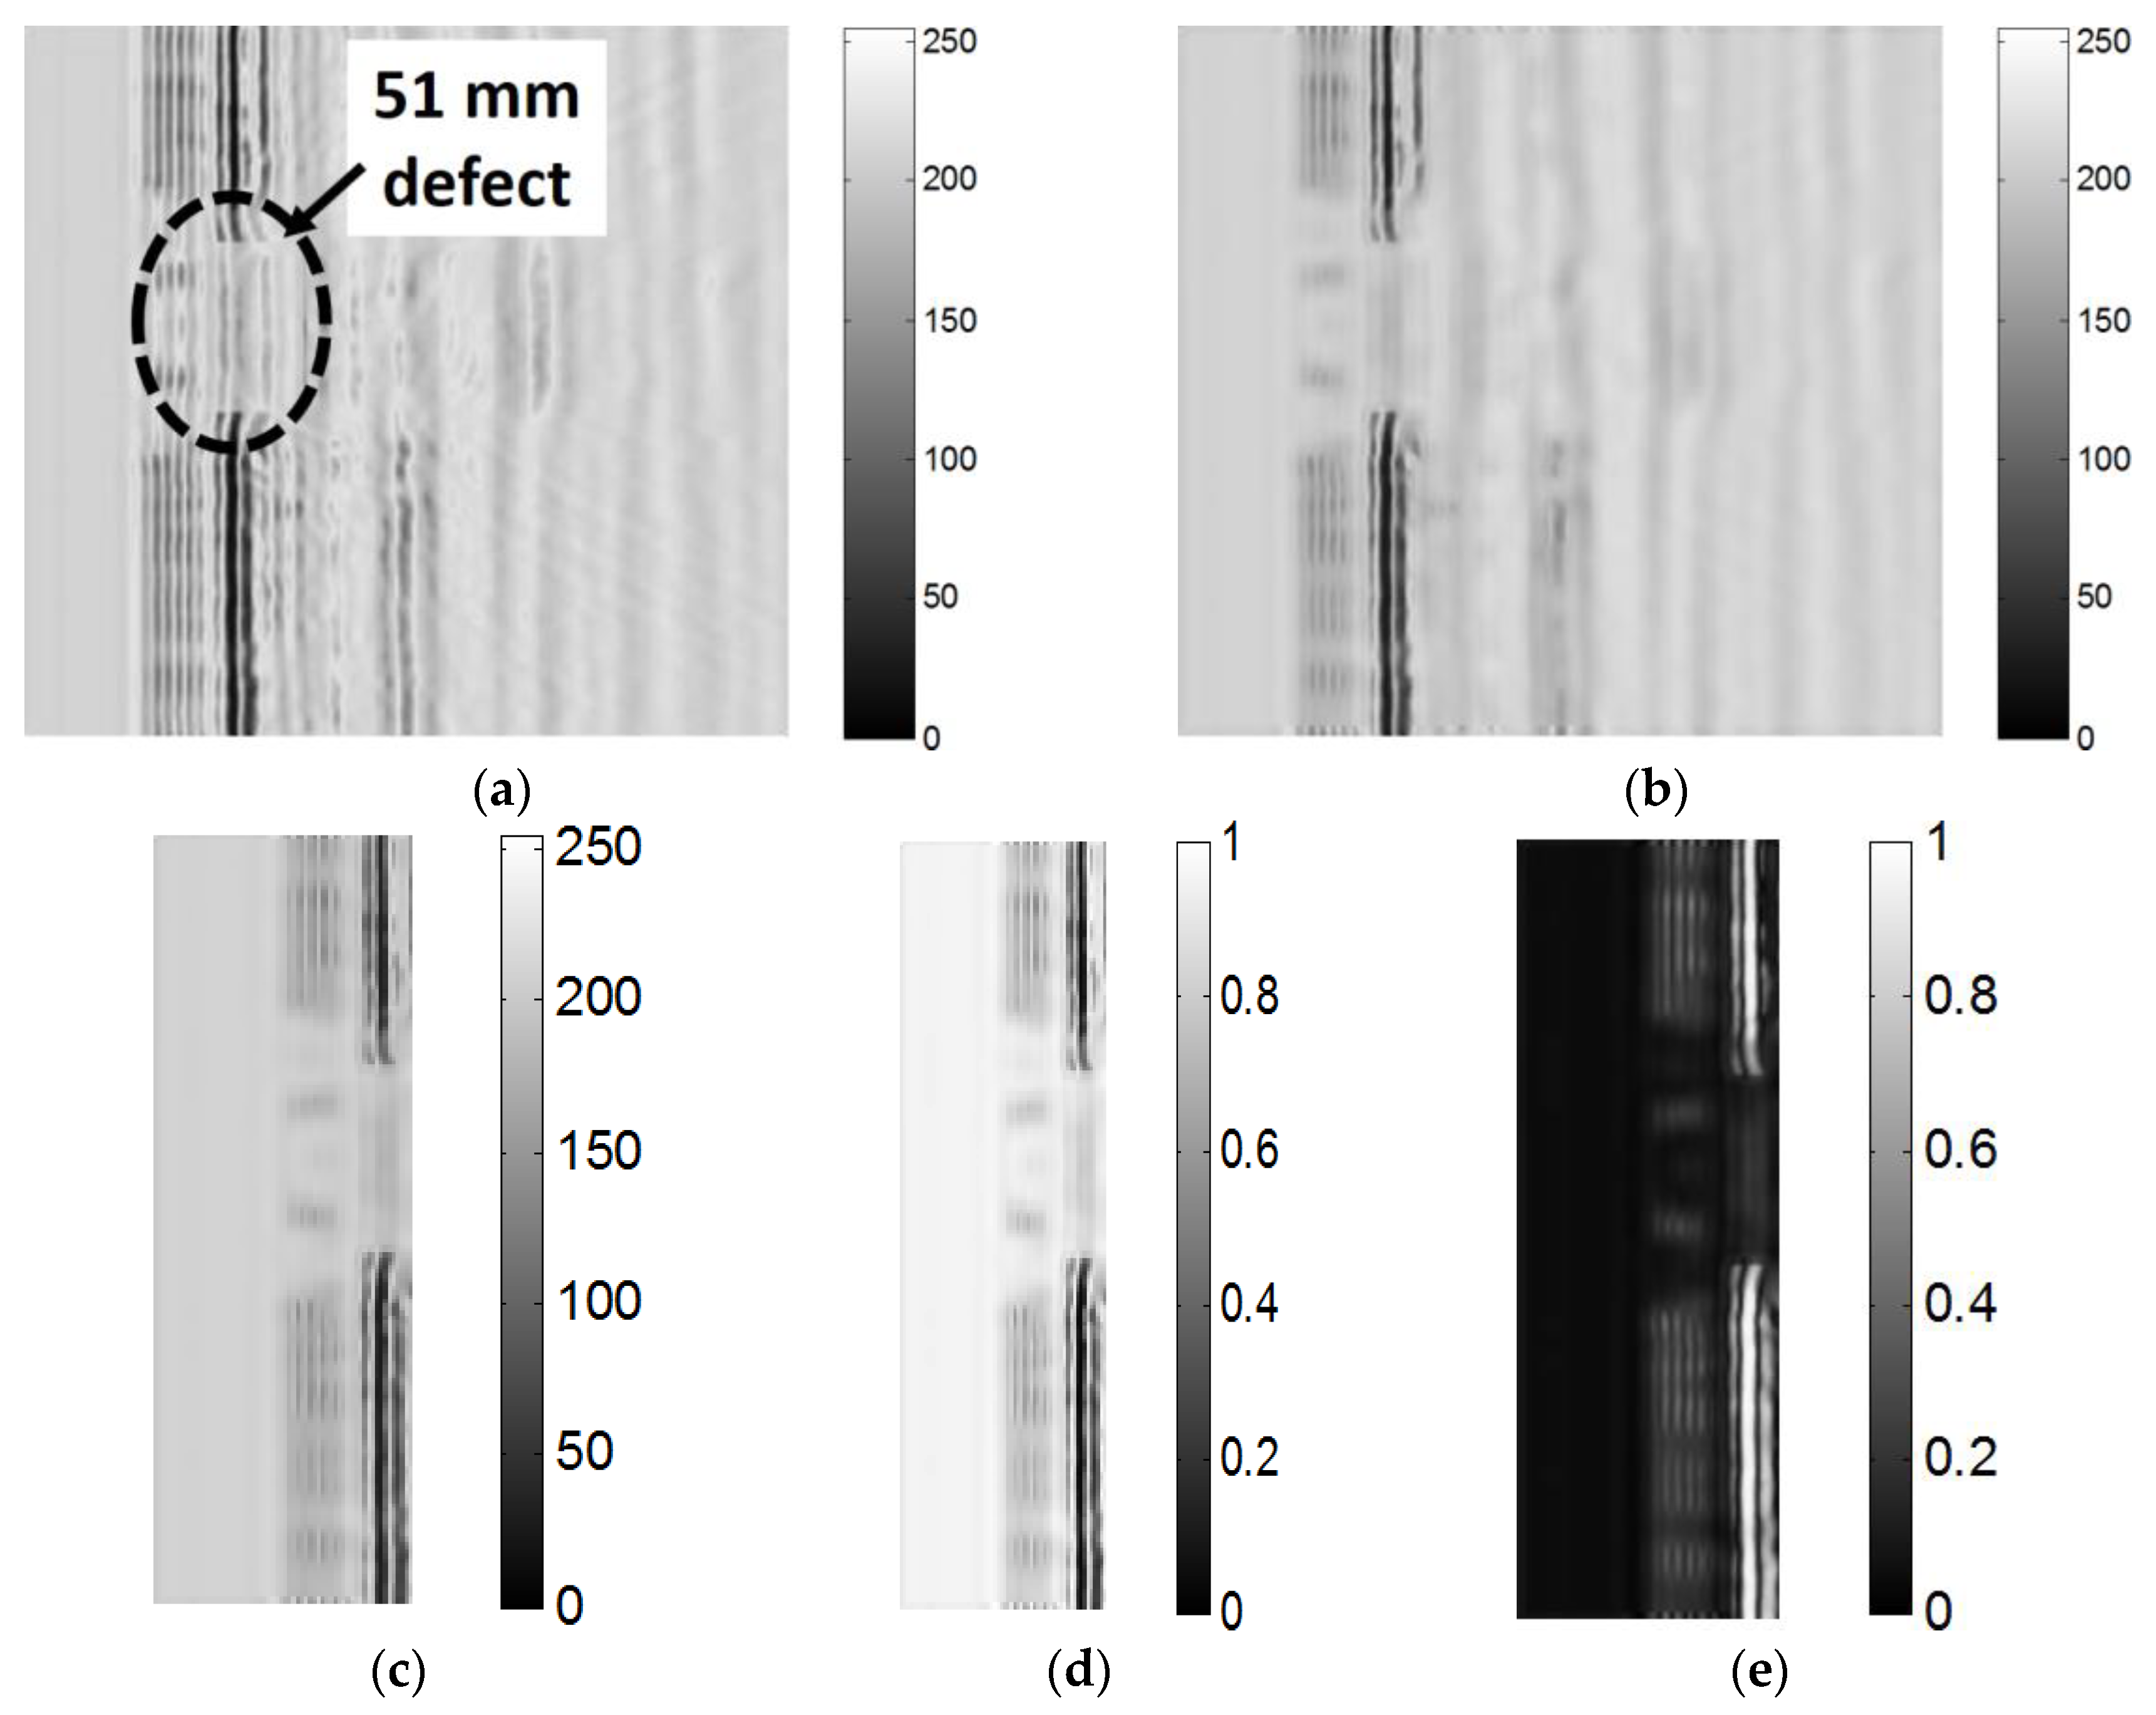
- The first step involves preprocessing the acquired B-scan image from the experiment. The preprocessing of the image is required to convert the image into the compatible format for the denoising. Most of the image denoising processes and transformations work better for a gray-scale image as compared with an RGB image (Figure 4b). Hence the RGB image of the B-scan was converted into a gray-scale image, as shown in Figure 7a.
- The contact-type transducers operate in thickness mode, which is more sensitive to the amplitude variations along the scanned distance. Concerning the image processing, the variations in the orientation and densities of the pixels would be a key factor in the process of estimating the size and location of the defect. The considerable amount of changes in the pixel densities could lead to identifying the location and size of the defect. However, before proceeding to the defect estimation, the first step is to denoise the image in order to remove the structural and non-stationary noise from the B-scan image. As discussed in Section 2, the eight-level decomposition with db8 mother wavelet of DWT and soft threshold with a universal threshold is used for denoising the image. The denoised image after the application of inverse 2D-IDWT is shown in Figure 7b.
- In the next step, the region of interest of the image (ROI) is selected by applying the appropriate time window of (0–55 µs) to the denoised image. The selection of the specific time window was on the basis of intensive interaction of the GWs with the defect in this time interval. The denoised ROI image is presented in Figure 7c.
- The pixel values of the ROI image are normalized between 0 and 1. The image is regenerated and shown in Figure 7d.
- This technique is not suitable to estimate microcracks, because the linear ultrasonic technique used in this research is valid if the diameter of the defects is more than the operating wavelength. Non-linear scanning techniques [55,56], which are very sensitive to the microcracks, can be an alternative for smaller defects.
- The optimal distance between the two transducers (50 mm) is greater than the size of the defect (25 mm), which is one of the major limiting factors to estimate the size of the defect. However, the optimal distance depends on the transducer bandwidth and wavelength of the slowest (A0) mode. The lower value of the optimal distance (closer to the size of the defect) may increase the accuracy in measurement.
- The pixel intensity (amplitude)-based approach is very sensitive to the environmental and operating conditions. Therefore, a constant temperature of 25 °C has been maintained during the experimental process.
Estimation of the Defect Having a Size Greater than Optimal Distance (50 mm) of Transducers
5. Conclusions
- During the experiment, a pair of contact-type piezoceramic transducers fixed on a moving mechanical panel with a separation of 50 mm was used. This reduced the attenuation losses due to the longer distance between the transmitter and receiver during the scanning process.
- The detection of defects from the experimental B-scan image was possible with significant accuracy. The estimation of the size and location of the defects required the post-processing of the B-scan image.
- The B-scan image is denoised and processed in order to estimate the normalized pixel intensity distribution along the scanned distance. This subsequently allows for the analysis of the location and size of the 25 mm and 51 mm defects located on the main spar of the GFRP sample, which was a segment of a wind turbine blade.
- Higher accuracy was achieved in the case of the 51-mm defect, which allowed us to conclude that the accuracy of the defect estimation of the proposed technique depends on the optimal distance between the transducers. The other factors that limit the accuracy of measurement of this technique are also discussed in detail.
- Incorporating this technique into automatic ultrasonic measurement systems will help make a reliable decision about internal defects. It also provides the motivation for the development of a transducer pair with the minimum possible optimal distance for the estimation of small-sized defects.
Author Contributions
Funding
Acknowledgments
Conflicts of Interest
References
- Mrazova, M. Advanced composite materials of the future in aerospace industry. INCAS Bull. 2013, 5, 139–150. [Google Scholar]
- Xu, B.; Li, H.Y. Advanced Composite Materials and Manufacturing Engineering: Selected Peer Reviewed Papers from the 2012 International Conference on Advanced Composite Materials and Manufacturing Engineering (Cmme2012); Trans Tech Publication: Zurich, Switzerland, 2012; pp. 1–430. [Google Scholar]
- Wilcox, P.D.; Konstantinidis, G.; Croxford, A.J.; Drinkwater, B.W. Strategies for Guided Wave Structural Health Monitoring; AIP: London, UK, 2007; pp. 2961–2981.
- Raghavan, A.; Cesnik, C.E. Review of Guided-wave Structural Health Monitoring. Shock Vib. Dig. 2007, 39, 91–114. [Google Scholar] [CrossRef]
- Rose, J.L. Successes and Challenges in Ultrasonic Guided Waves for NDT and SHM. Mater. Eval. 2010, 68, 494–500. [Google Scholar]
- Delrue, S.; Van Den Abeele, K. Detection of defect parameters using nonlinear air-coupled emission by ultrasonic guided waves at contact acoustic nonlinearities. Ultrasonics 2015, 63, 147–154. [Google Scholar] [CrossRef]
- Clarke, T.; Cawley, P.; Wilcox, P.D.; Croxford, A.J. Evaluation of the damage detection capability of a sparse-array guided-wave SHM system applied to a complex structure under varying thermal conditions. IEEE Trans. Ultrason. Ferroelectr. Freq. Control 2009, 56, 2666–2678. [Google Scholar] [CrossRef] [PubMed]
- Cawley, P. Practical Guided Wave Inspection and Applications to Structural Health Monitoring. In Proceedings of the 5th Australasian Congress on Applied Mechanics, Brisbane, Australia, 10–12 December 2007; Martin, V., Faris, A., Daniel, B., Griffiths, J., Hargreaves, D., McAree, R., Meehan, P., Tan, A., Eds.; Engineers Australia: Brisbane, Australia, 2007; pp. 12–21. [Google Scholar]
- Steigmann, R.; Iftimie, N.; Savin, A.; Sturm, R. Wind Turbine Blade Composites Assessment Using Non-Contact Ultrasound Method. J. Clean Energy Technol. 2016, 4, 440–443. [Google Scholar] [CrossRef]
- Raišutis, R.; Jasiūnienė, E.; Žukauskas, E. Ultrasonic NDT of wind turbine blades using guided waves. Ultrasound Ultragas 2008, 63, 7–11. [Google Scholar]
- Jasiūnienė, E.; Raišutis, R.; Šliteris, R.; Voleišis, A.; Jakas, M. Ultrasonic NDT of wind turbine blades using contact pulse-echo immersion testing with moving water container. Ultragarsas (Ultrasound) 2008, 63, 28–32. [Google Scholar]
- Nam, M. Application of Phased Array Ultrasonic Testing to Detect Delamination for Wind Turbine Blade. J. Wind Energy 2018, 9, 33–42. [Google Scholar]
- Bai, Z.; Chen, S.; Jia, L.; Zeng, Z. Phased array ultrasonic signal compressive detection in low-pressure turbine disc. NDT E Int. 2017, 89, 1–13. [Google Scholar] [CrossRef]
- Chady, T. Wind Turbine Blades Inspection Techniques. Prz. Elektrotech. 2016, 1, 3–6. [Google Scholar] [CrossRef]
- Willey, C.L.; Simonetti, F.; Nagy, P.B.; Instanes, G. Guided wave tomography of pipes with high-order helical modes. NDT E Int. 2014, 65, 8–21. [Google Scholar] [CrossRef]
- Løvstad, A.; Cawley, P. The reflection of the fundamental torsional guided wave from multiple circular holes in pipes. NDT E Int. 2011, 44, 553–562. [Google Scholar] [CrossRef]
- Leinov, E.; Lowe, M.J.S.; Cawley, P. Investigation of guided wave propagation and attenuation in pipe buried in sand. J. Sound Vib. 2015, 347, 96–114. [Google Scholar] [CrossRef]
- Sharma, A.; Sharma, S.; Sharma, S.; Mukherjee, A. Ultrasonic guided waves for monitoring corrosion of FRP wrapped concrete structures. Constr. Build. Mater. 2015, 96, 690–702. [Google Scholar] [CrossRef]
- Lu, Y.; Li, J.; Ye, L.; Wang, D. Guided waves for damage detection in rebar-reinforced concrete beams. Constr. Build. Mater. 2013, 47, 370–378. [Google Scholar] [CrossRef]
- Rathod, V.T.; Roy Mahapatra, D. Ultrasonic Lamb wave based monitoring of corrosion type of damage in plate using a circular array of piezoelectric transducers. NDT E Int. 2011, 44, 628–636. [Google Scholar] [CrossRef]
- Mustapha, S.; Ye, L. Propagation behaviour of guided waves in tapered sandwich structures and debonding identification using time reversal. Wave Motion 2015, 57, 154–170. [Google Scholar] [CrossRef]
- Putkis, O.; Dalton, R.P.; Croxford, A.J. The anisotropic propagation of ultrasonic guided waves in composite materials and implications for practical applications. Ultrasonics 2016, 65, 390–399. [Google Scholar] [CrossRef]
- Castaings, M.; Singh, D.; Viot, P. Sizing of impact damages in composite materials using ultrasonic guided waves. NDT E Int. 2012, 46, 22–31. [Google Scholar] [CrossRef]
- Raišutis, R.; Kažys, R.; Žukauskas, E.; Mažeika, L. Ultrasonic air-coupled testing of square-shape CFRP composite rods by means of guided waves. NDT E Int. 2011, 44, 645–654. [Google Scholar] [CrossRef]
- Deng, Q.; Yang, Z. Propagation of guided waves in bonded composite structures with tapered adhesive layer. Appl. Math. Model. 2011, 35, 5369–5381. [Google Scholar] [CrossRef]
- Masserey, B.; Raemy, C.; Fromme, P. High-frequency guided ultrasonic waves for hidden defect detection in multi-layered aircraft structures. Ultrasonics 2014, 54, 1720–1728. [Google Scholar] [CrossRef]
- Puthillath, P.; Rose, J.L. Ultrasonic guided wave inspection of a titanium repair patch bonded to an aluminum aircraft skin. Int. J. Adhes. Adhes. 2010, 30, 566–573. [Google Scholar] [CrossRef]
- Wu, H.C.; Gupta, N.; Mylavarapu, P.S. Blind multiridge detection for automatic nondestructive testing using ultrasonic signals. IEEE Trans. Ultrason. Ferroelectr. Freq. Control 2006, 53, 1902–1911. [Google Scholar] [CrossRef]
- Satyanarayan, L.; Bharath Kumaran, K.; Krishnamurthy, C.V.; Balasubramaniam, K. Inverse method for detection and sizing of cracks in thin sections using a hybrid genetic algorithm based signal parametrisation. Theor. Appl. Fract. Mech. 2008, 49, 185–198. [Google Scholar] [CrossRef]
- Tiwari, K.A.; Raisutis, R.; Samaitis, V. Hybrid Signal Processing Technique to Improve the Defect Estimation in Ultrasonic Non-Destructive Testing of Composite Structures. Sensors 2017, 17, 2858. [Google Scholar] [CrossRef]
- Tiwari, K.A.; Raisutis, R. Post-processing of ultrasonic signals for the analysis of defects in wind turbine blade using guided waves. J. Strain Anal. Eng. Des. 2018. [Google Scholar] [CrossRef]
- Tiwari, K.A.; Raisutis, R. Identification and Characterization of Defects in Glass Fiber Reinforced Plastic by Refining the Guided Lamb Waves. Materials 2018, 11, 1173. [Google Scholar] [CrossRef]
- Yadav, A.K.; Roy, R.; Kumar, A.P.; Kumar, C.S.; Dhakad, S.K. De-noising of ultrasound image using discrete wavelet transform by symlet wavelet and filters. In Proceedings of the 2015 International Conference on Advances in Computing, Communications and Informatics (ICACCI), Kochi, India, 10–13 August 2015; pp. 1204–1208. [Google Scholar]
- Dragomiretskiy, K.; Zosso, D. Two-Dimensional Variational Mode Decomposition. In Lecture Notes in Computer Science; Springer: Berlin/Heidelberg, Germany, 2015; pp. 197–208. [Google Scholar]
- Wan, J.; Ren, L.; Zhao, C. Image Feature Extraction Based on the Two-Dimensional Empirical Mode Decomposition. In Proceedings of the 2008 Congress on Image and Signal Processing, Sanya, China, 27–30 May 2008; pp. 627–631. [Google Scholar]
- Swamy, G.; Baskaran, G.; Balasubramaniam, K. A point source correlation technique for automatic discontinuity identification and sizing using time of flight diffraction. Mater. Eval. 2005, 63, 425–429. [Google Scholar]
- Tiwari, K.A.; Raisutis, R.; Samaitis, V. Signal processing methods to improve the Signal-to-noise ratio (SNR) in ultrasonic non-destructive testing of wind turbine blade. Procedia Struct. Integr. 2017, 5, 1184–1191. [Google Scholar] [CrossRef]
- Kumar, H.P.; Srinivasan, S. Performance analysis of filters for speckle reduction in medical polycystic ovary ultrasound images. In Proceedings of the 2012 Third International Conference on Computing, Communication and Networking Technologies (ICCCNT’12), Karur, India, 26–28 July 2012; pp. 1–5. [Google Scholar]
- Abbate, A.; Koay, J.; Frankel, J.; Schroeder, S.C.; Das, P. Signal detection and noise suppression using a wavelet transform signal processor: Application to ultrasonic flaw detection. IEEE Trans. Ultrason. Ferroelectr. Freq. Control 1997, 44, 14–26. [Google Scholar] [CrossRef]
- Rodriguez, M.A.; San Emeterio, J.L.; Lazaro, J.C.; Ramos, A. Ultrasonic flaw detection in NDE of highly scattering materials using wavelet and Wigner-Ville transform processing. Ultrasonics 2004, 42, 847–851. [Google Scholar] [CrossRef]
- Yu, G.; Wang, X. Ultrasonic signal processing using wavelet transform for automatic rail defect detection. In Proceedings of the 2016 International Forum on Management, Education and Information Technology Application, Guangdong, China, 30–31 January 2016; Kim, Y.H., Ed.; Atlantis Press: Paris, France, 2016; pp. 678–681. [Google Scholar]
- Priya, K.D.; Rao, G.S.; Rao, P.S.V.S. Comparative Analysis of Wavelet Thresholding Techniques with Wavelet-wiener Filter on ECG Signal. Procedia Comput. Sci. 2016, 87, 178–183. [Google Scholar] [CrossRef]
- Jaffery, Z.; Ahmad, K. Performance Comparision of Wavelet Threshold Estimators for ECG Signal Denoising. In Proceedings of the 2010 International Conference on Advances in Recent Technologies in Communication and Computing (ARTCom), Kottayam, India, 16–17 October 2010; pp. 248–251. [Google Scholar]
- Jasim Hussein, N.; Hu, F.; He, F. Multisensor of thermal and visual images to detect concealed weapon using harmony search image fusion approach. Pattern Recognit. Lett. 2017, 94, 219–227. [Google Scholar] [CrossRef]
- Luo, X.; Bhakta, T. Estimating observation error covariance matrix of seismic data from a perspective of image denoising. Comput. Geosci. 2017, 21, 205–222. [Google Scholar] [CrossRef]
- Donoho, D.L.; Johnstone, I.M. Ideal Spatial Adaptation by Wavelet Shrinkage. Biometrika 1994, 81, 425. [Google Scholar] [CrossRef]
- Johnstone, I.M.; Silverman, B.W. Wavelet Threshold Estimators for Data with Correlated Noise. J. R. Stat. Soc. Ser. B (Stat. Methodol.) 2002, 59, 319–351. [Google Scholar] [CrossRef]
- Elfouly, F.; Mahmoud, M.; Dessouky, M.; Deyab, S. Comparison Between Haar and Daubechies Wavelet Transformions on Fpga Technology. World Acad. Sci. Eng. Technol. 2014, 6, 417–422. [Google Scholar]
- Raisutis, R.; Kazys, R.; Mazeika, L.; Zukauskas, E.; Samaitis, V.; Draudviliene, L.; Vladisauskas, A. An Adjustment-Free NDT Technique for Defect Detection in Multilayered Composite Constructions Using Ultrasonic Guided Waves. Int. J. Struct. Stab. Dyn. Feedback 2014, 14, 1440025. [Google Scholar] [CrossRef]
- Tiwari, K.A.; Raisutis, R.; Mazeika, L.; Samaitis, V. 2D Analytical Model for the Directivity Prediction of Ultrasonic Contact Type Transducers in the Generation of Guided Waves. Sensors 2018, 18, 987. [Google Scholar] [CrossRef]
- Su, Z.; Ye, L.; Lu, Y. Guided Lamb waves for identification of damage in composite structures: A review. J. Sound Vib. 2006, 295, 753–780. [Google Scholar] [CrossRef]
- Alleyne, D.; Cawley, P. A two-dimensional Fourier transform method for the measurement of propagating multimode signals. J. Acoust. Soc. Am. 1991, 89, 1159–1168. [Google Scholar] [CrossRef]
- Raišutis, R.; Kažys, R.; Žukauskas, E.; Mažeika, L.; Vladišauskas, A. Application of ultrasonic guided waves for non-destructive testing of defective CFRP rods with multiple delaminations. NDT E Int. 2010, 43, 416–424. [Google Scholar] [CrossRef]
- Raišutis, R.; Tumšys, O.; Kažys, R. Development of the technique for independent dual focusing of contact type ultrasonic phased array transducer in two orthogonal planes. NDT E Int. 2017, 88, 71–80. [Google Scholar] [CrossRef]
- Li, W.; Cho, Y.; Lee, J.; Achenbach, J.D. Assessment of Heat Treated Inconel X-750 Alloy by Nonlinear Ultrasonics. Exp. Mech. 2013, 53, 775–781. [Google Scholar] [CrossRef]
- Cantrell, J.H.; Yost, W.T. Nonlinear ultrasonic characterization of fatigue microstructures. Int. J. Fatigue 2001, 23, 487–490. [Google Scholar] [CrossRef]


| Parameters | Numerical Value |
|---|---|
| Number of channels | 2 |
| Number of bits of the analog-to-digital converter | 10 |
| Frequency range | 20 kHz–2 MHz |
| Maximum system gain | 113 dB |
| Resolution of the mechanical scanner | 20 µm |
| The interface between the system and computer | USB V.2 |
| Parameters | True Value, mm | Measured Value, mm | Relative Error, % |
|---|---|---|---|
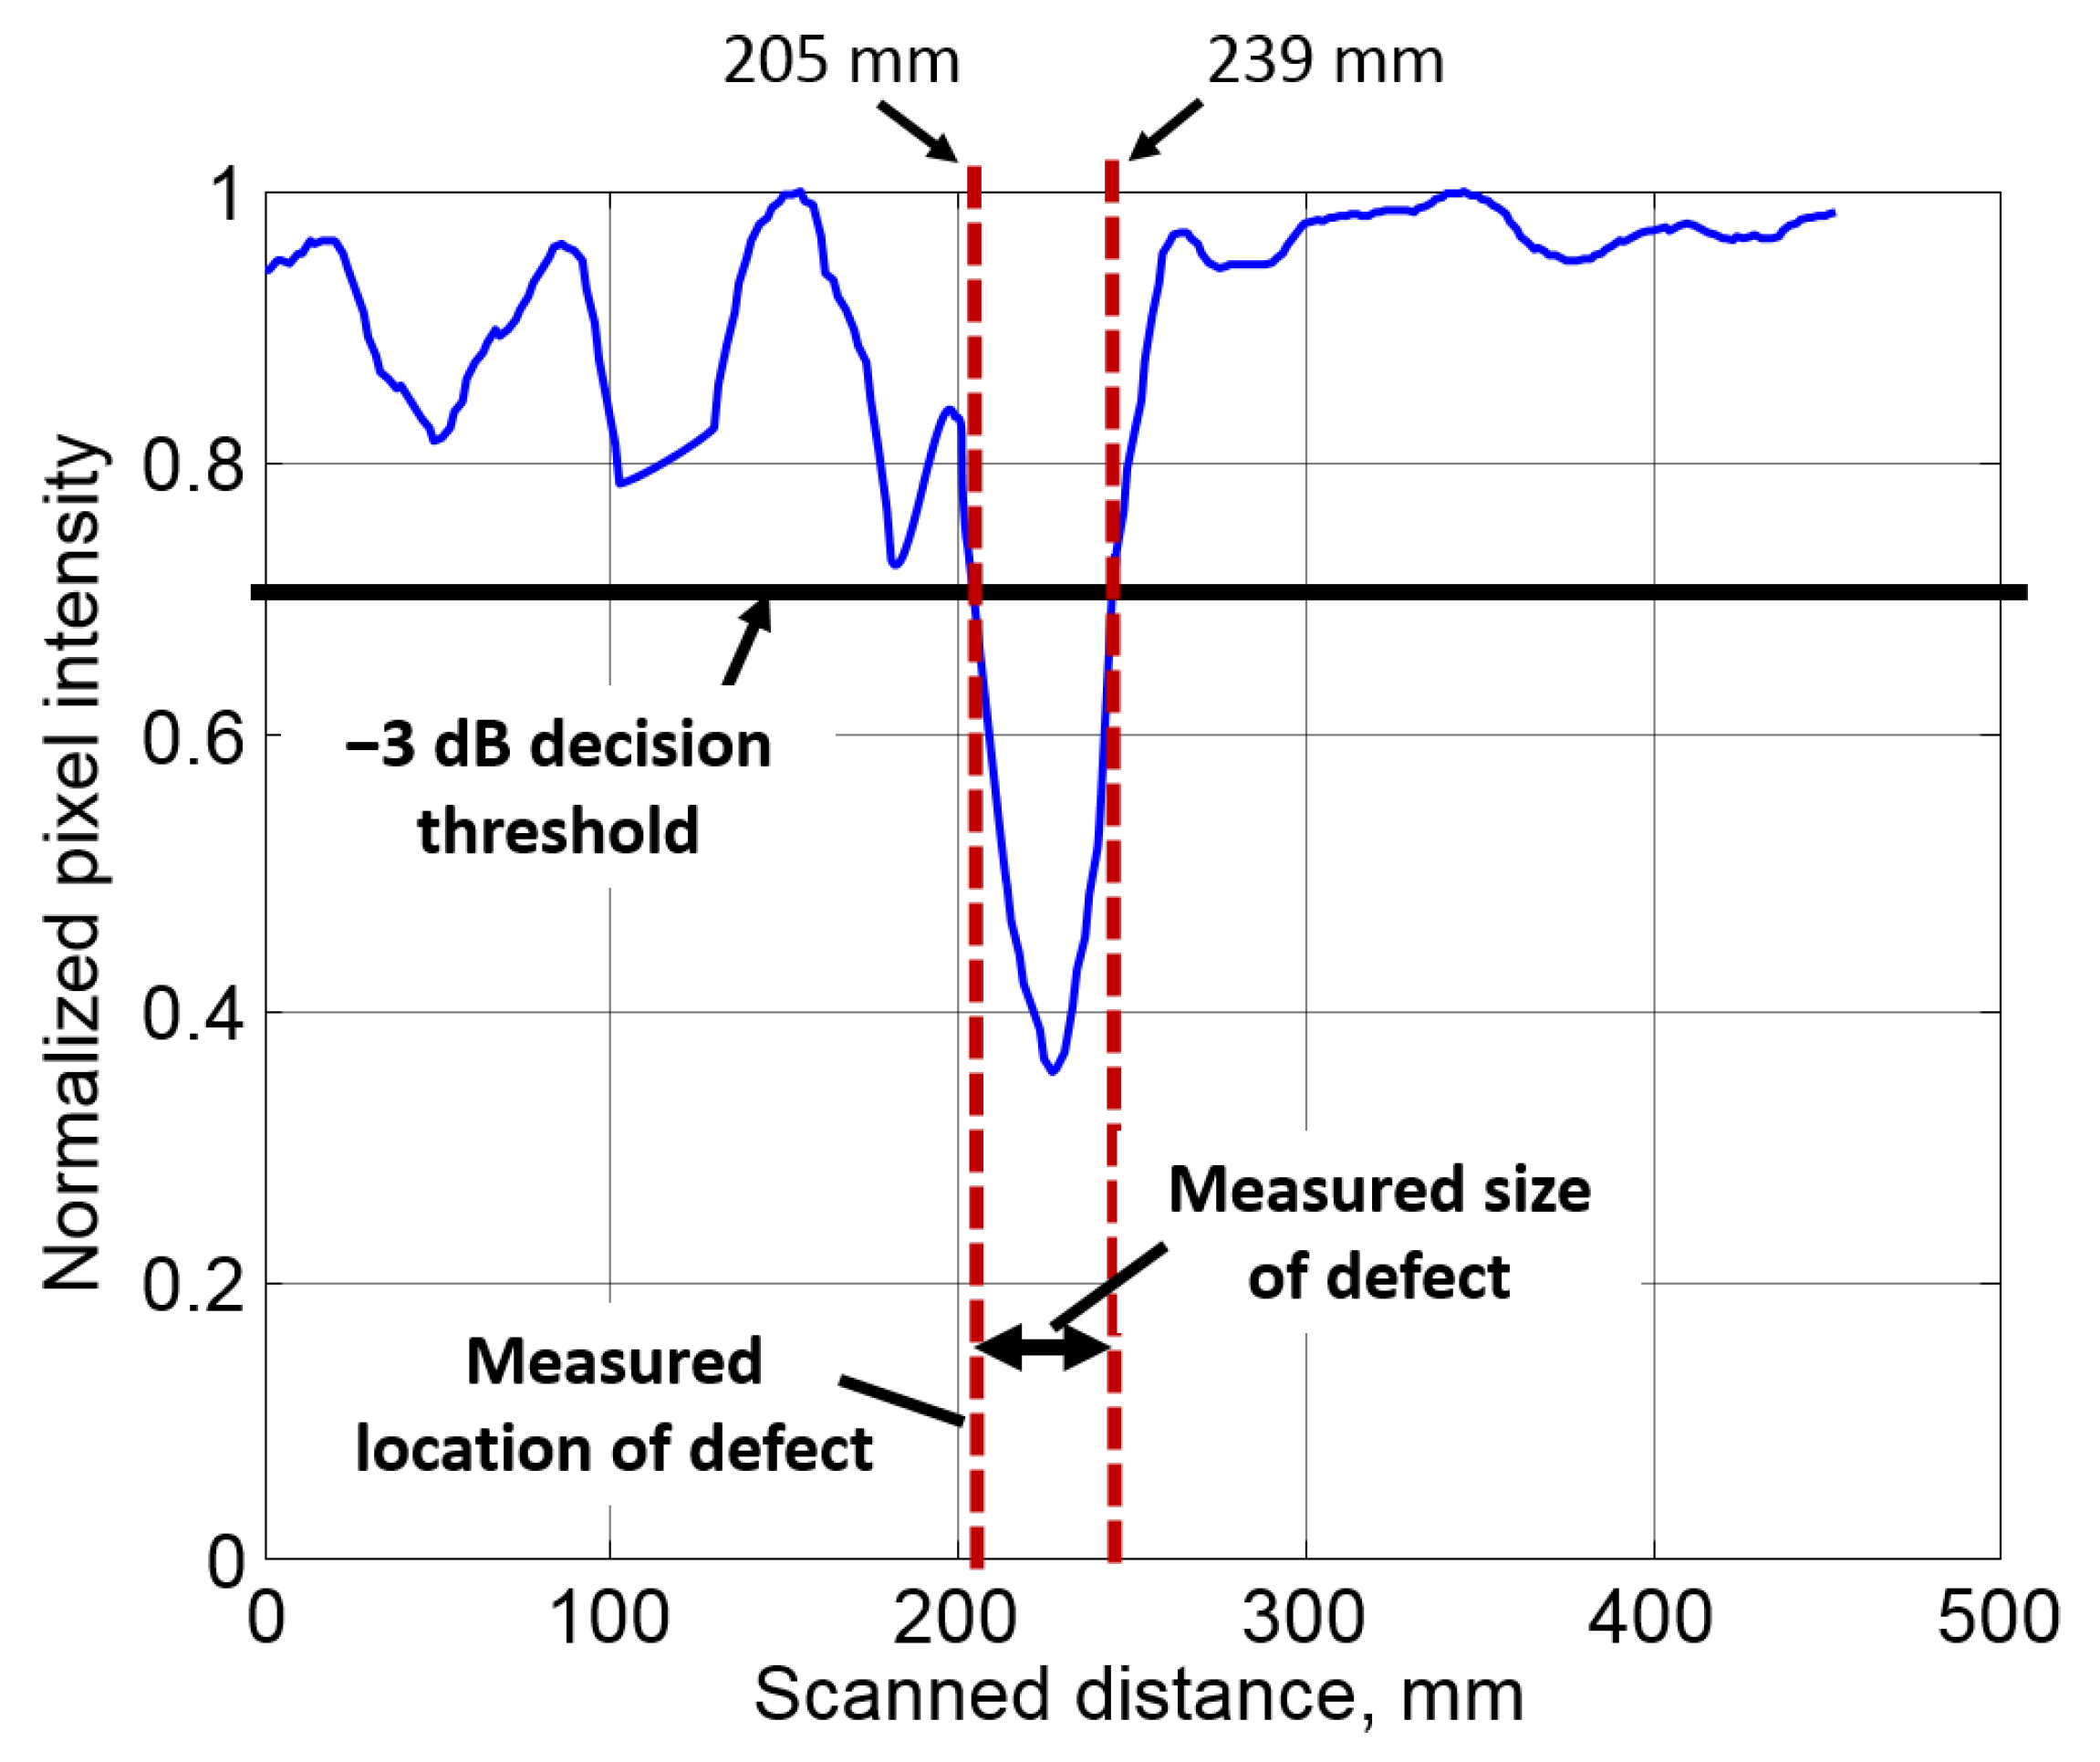
| Location of 25 mm defect | 215 | 205 | 4.65 |
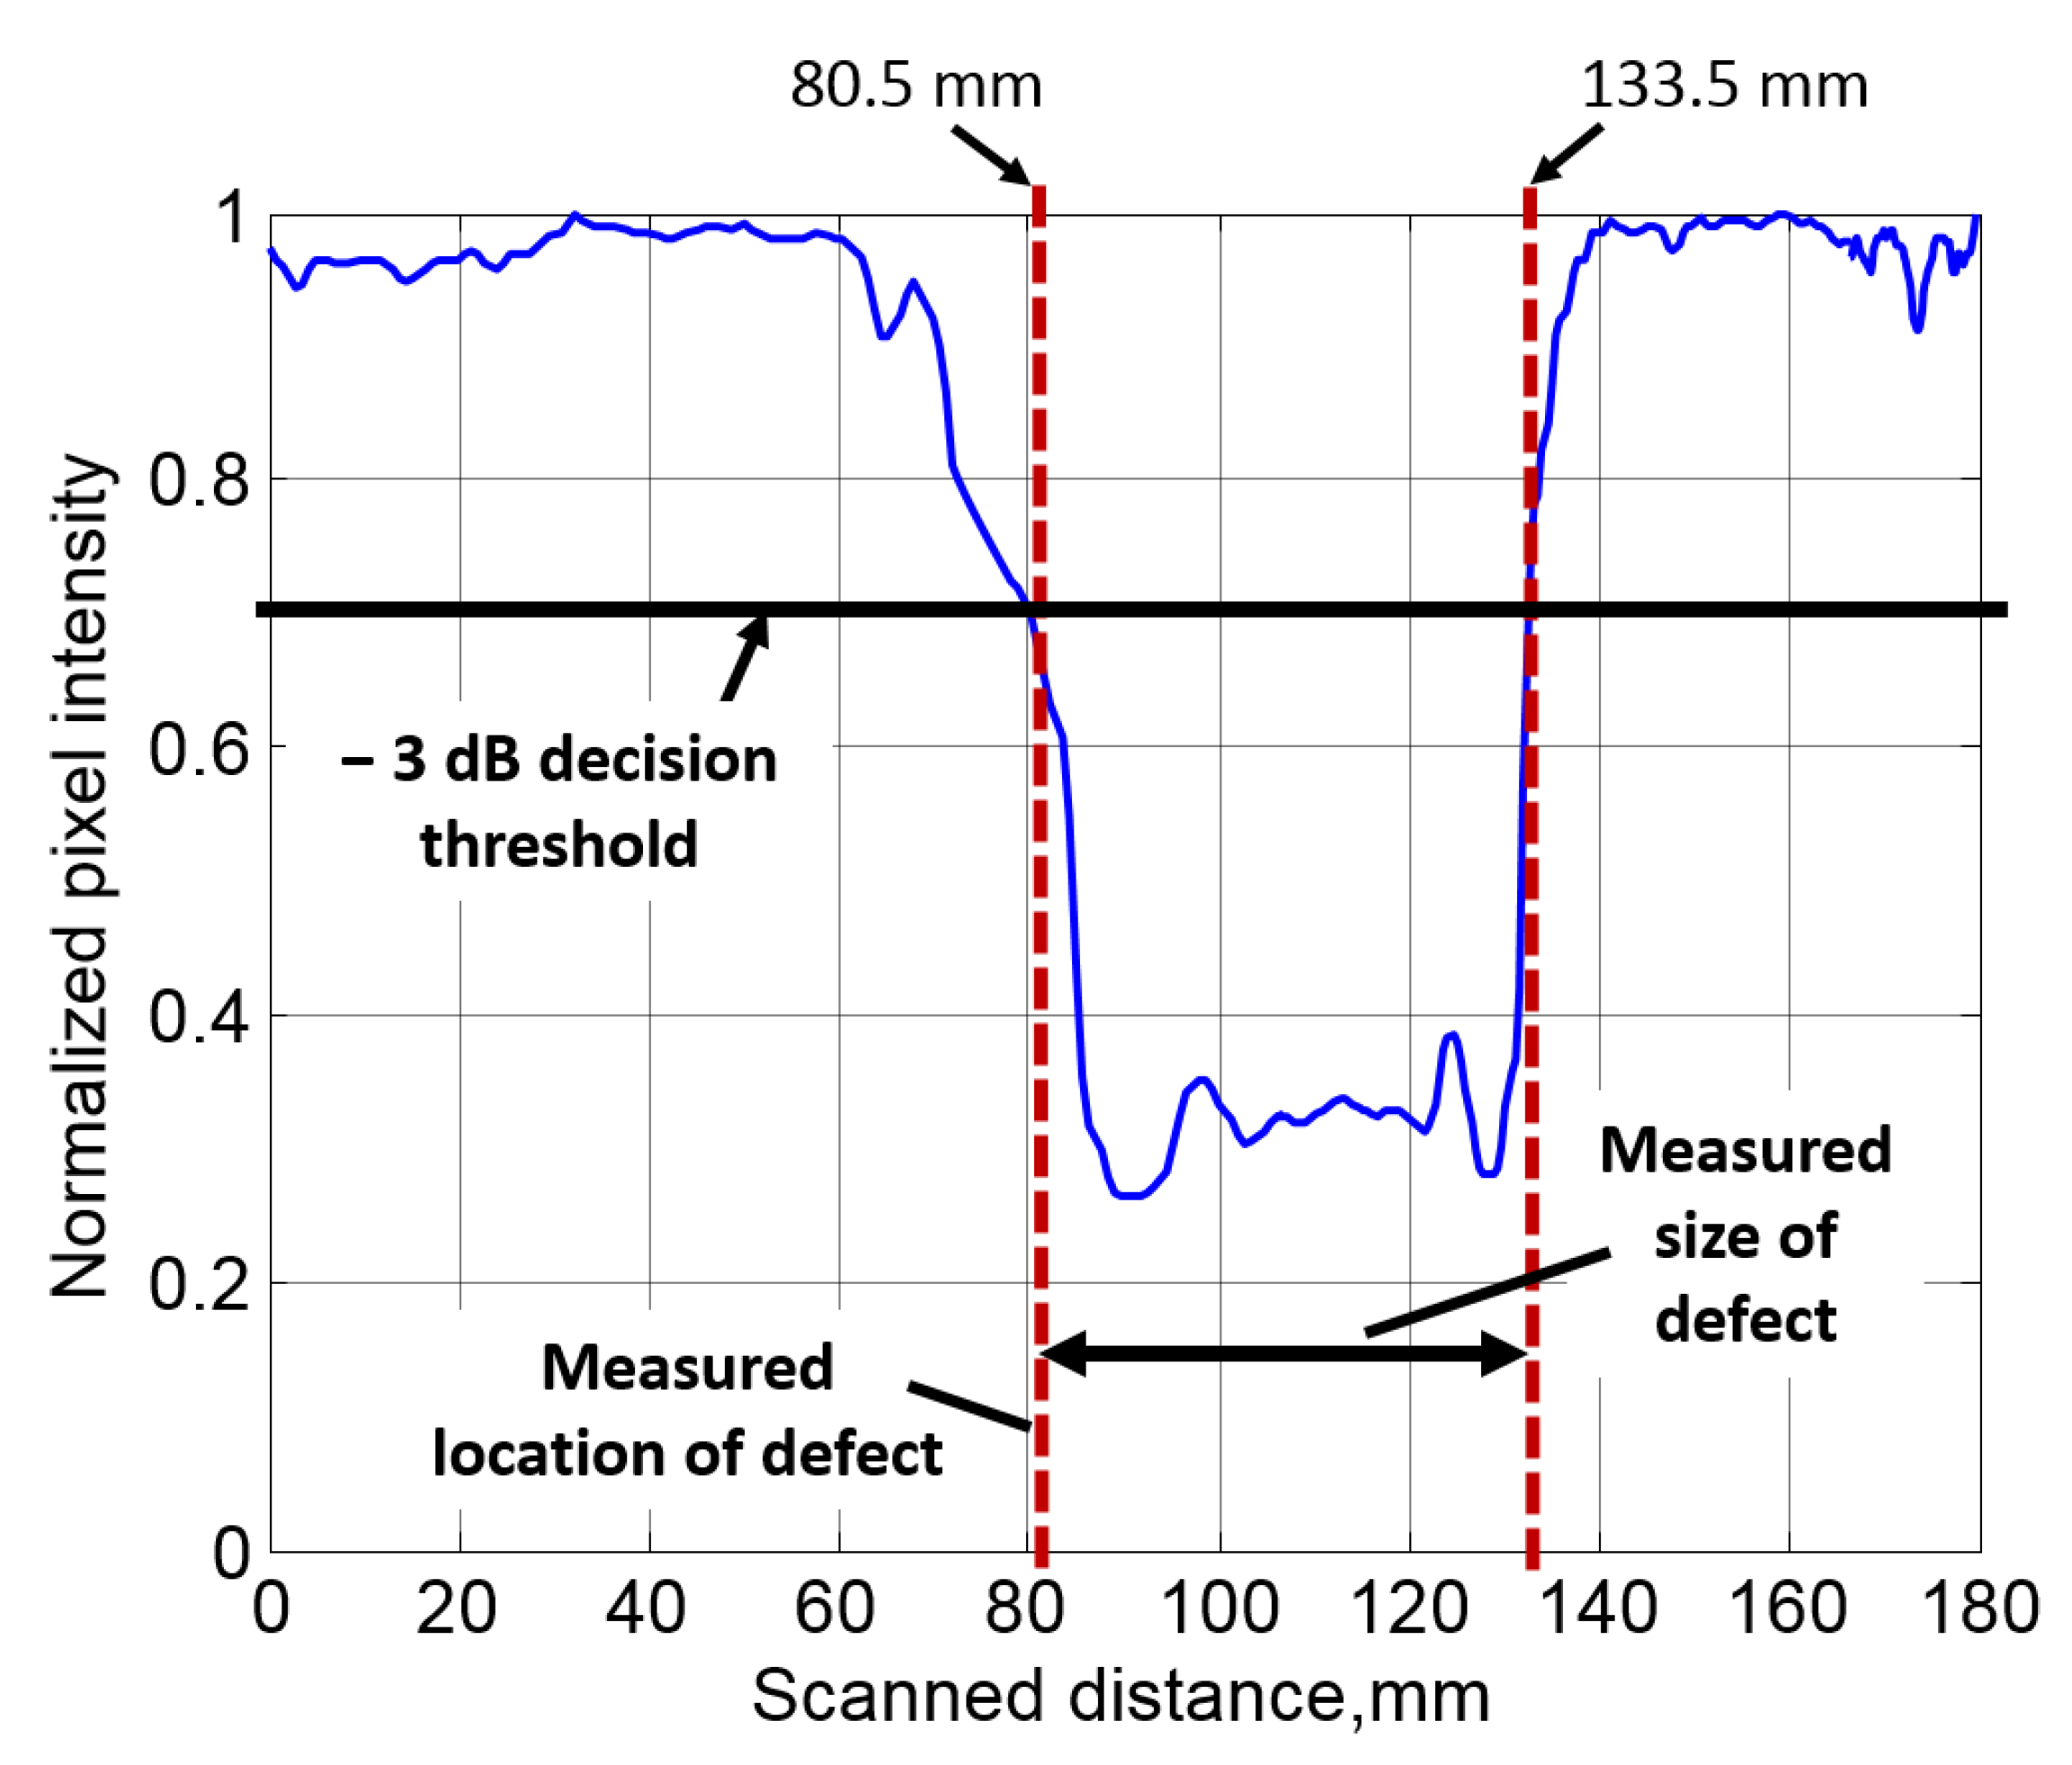
| Location of 51 mm defect | 80.5 | 80.5 | 1.83 |
| Size of 25 mm defect | 25 | 34 | 36 |
| Size of 51 mm defect | 51 | 53 | 3.9 |
© 2019 by the authors. Licensee MDPI, Basel, Switzerland. This article is an open access article distributed under the terms and conditions of the Creative Commons Attribution (CC BY) license (http://creativecommons.org/licenses/by/4.0/).
Share and Cite
Tiwari, K.A.; Raisutis, R.; Tumsys, O.; Ostreika, A.; Jankauskas, K.; Jakutavicius, J. Defect Estimation in Non-Destructive Testing of Composites by Ultrasonic Guided Waves and Image Processing. Electronics 2019, 8, 315. https://0-doi-org.brum.beds.ac.uk/10.3390/electronics8030315
Tiwari KA, Raisutis R, Tumsys O, Ostreika A, Jankauskas K, Jakutavicius J. Defect Estimation in Non-Destructive Testing of Composites by Ultrasonic Guided Waves and Image Processing. Electronics. 2019; 8(3):315. https://0-doi-org.brum.beds.ac.uk/10.3390/electronics8030315
Chicago/Turabian StyleTiwari, Kumar Anubhav, Renaldas Raisutis, Olgirdas Tumsys, Armantas Ostreika, Kestutis Jankauskas, and Julijus Jakutavicius. 2019. "Defect Estimation in Non-Destructive Testing of Composites by Ultrasonic Guided Waves and Image Processing" Electronics 8, no. 3: 315. https://0-doi-org.brum.beds.ac.uk/10.3390/electronics8030315