Maximum Transmit Power for UE in an LTE Small Cell Uplink


Division of Electronics and Electrical Engineering, Dongguk University-Seoul, Seoul 04620, Korea
*
Author to whom correspondence should be addressed.
Electronics 2019, 8(7), 796; https://0-doi-org.brum.beds.ac.uk/10.3390/electronics8070796
Submission received: 19 May 2019
/
Revised: 11 July 2019
/
Accepted: 15 July 2019
/
Published: 16 July 2019
(This article belongs to the Special Issue Recent Technical Developments in Energy-Efficient 5G Mobile Cells)
Abstract
:To furnish the network with small cells, it is vital to consider parameters like cell size, interference in the network, and deployment strategies to maximize the network’s performance gains expected from small cells. With a small cell network, it is critical to analyze the impact of the uplink power control parameters on the network’s performance. In particular, the maximum transmit power (Pmax) for user equipment (UE) needs to be revisited for small cells, since it is a major contributor towards interference. In this work, the network performance was evaluated for different Pmax values for the small cell uplink. Various deployment scenarios for furnishing the existing macro layer in LTE networks with small cells were considered. The Pmax limit for a small cell uplink was evaluated for both homogenous small cell and heterogeneous networks (HetNet). The numerical results showed that it would be appropriate to adopt Pmax = 18 dBm in uniformly distributed small cells rather than Pmax = 23 dBm, as in macro environments. The choice of Pmax = 18 dBm was further validated for three HetNet deployment scenarios. A decrease of 0.52 dBm and an increase of 0.03 dBm and 3.29 dBm in the proposed Pmax = 18 dBm were observed for the three HetNet deployments, respectively. Furthermore, we propose that the fractional power control mode can be employed instead of the full compensation mode in small cell uplinks.
1. Introduction
Mobile broadband traffic has exponentially increased with the advent of modern smart phones, tablets, and communication devices, resulting in an ever-increasing data rate demand by end users. This requires an increase in network capacity and available data rates, power efficient connectivity, and decreased latency in the network. To increase capacity, network densification is necessary for radio access networks [1]. By deploying additional network nodes per unit area, the distance between the eNodeB and the user equipment (UE) can be minimized, which allows accommodating more UE per unit area, resulting in a link–budget improvement [2]. While addressing the capacity demands in areas with a high density of UE, such as urban and metropolitan areas (often referred to as hotspots), it is vital to choose the appropriate deployment option as well as the right configuration regarding the network’s parameters to ensure acceptable data rates, minimum interference generation, and improved service quality for users. To configure network settings with newly furnished small cells, it is necessary to analyze the impact of different parameters such as cell size, distance between UE and the serving eNodeB, inter-site distance among neighboring cells, and the power control parameters particularly in the uplink direction [3].
To ensure power efficient connectivity, mitigate interference, and improve service quality, the 3rd generation partnership project (3GPP) standards introduced transmit power control (TPC) which enables power control for both the downlink and uplink directions in long term evolution (LTE) [4]. A precise control mechanism for the UE uplink transmission power is emphasized to mitigate the adverse impact of the interference on the network performance. There are two methods for TPC in the LTE uplink: open loop (OL) and closed loop (CL). The OP/TPC is the capability of the UE to set its uplink transmit power to a specified value suitable for the receiver. The UE can set its output power level by estimating the pathloss between the UE and the serving eNodeB based on the reference symbol received power (RSRP) and the OL/TPC parameters specified in Equation (1). The CL/TPC is the capability of the UE to adjust the uplink transmit power in accordance with the closed-loop correction value, also known as TPC commands. The eNodeB transmits the TPC commands towards the UE, based on the closed-loop signal-to-interference and noise ratio (SINR) target and measured received SINR. In CL/TPC, the uplink receiver at the eNodeB estimates the SINR of the received signal and compares it with the desired SINR target value. When the received SINR is below the SINR target, a TPC command is transmitted to the UE to request an increase in the transmitter power. Otherwise, the TPC command will request a decrease in transmitter power. The closed-loop power control operates around an open-loop point of operation. The initial transmit power for the UE is set using the open-loop power control. The initial power is further adjusted using a closed-loop correction value via downlink signaling of TPC commands to the UE. In summary, OL/TPC determines the initial power settings of the network while CL/TPC aims to correct errors in OL/TPC configurations. The 3GPP specification defines the UE transmit power PTx (dBm) for the LTE uplink as [5]:
- Pmax is the maximum allowable transmit power for the UE.
- M is the number of physical resource blocks (PRBs). For simplicity, M is set to 1 in this paper.
- Po is the cell/UE specific parameter. Po is assumed to be UE specific in this paper.
- α is the pathloss compensation factor.
- PL is the pathloss between the UE and serving eNodeB.
- ∆mcs and f(i) are the CL/TPC parameters defining the modulation and coding scheme and closed-loop correction, respectively, as defined in the 3GPP standards. To focus our analysis on the OL/TPC, ∆mcs and f(i) are assumed to be zero.
At this point, it is important to specify the role of the pathloss compensation factor α in terms of the mode of TPC being used. The modes of TPC based on the α value are:
- α = 0 implies “no power control” mode.
- α > 0 designates the “fractional power control” mode. In practice, the values from 0.7 to 0.9 are adopted.
- α = 1 indicates a “full compensation’ mode for the uplink pathloss.
To accomplish the task of network densification and optimize the network performance, it is crucial to investigate the uplink power control mechanism for small cells, particularly the maximum transmit power limit Pmax for the case of the small cell uplink. In general, the 3GPP standards define a Pmax limit of 23 dBm regardless of cell size. However, in the case of small cells, the distance between the eNodeB and UE is shorter, as compared to the macro cell, resulting in different transmit power levels for UE in small cells. An increase in the transmit power improves the received signal strength, and consequently, the received signal-to-interference ratio (SIR). However, in the case of small cells, transmitting at a higher power might result in the degradation of the received SIR due to the significant increase in the inter-cell interference [6]. Similarly, choosing a lower value of Pmax can decrease the interference, but might affect the SIR performance as the received signal strength might go below the receiver threshold in the case of choosing too low a value for Pmax. Also, it is important to consider the deployment strategy to furnish the existing macro cell layer with small cells, as the choice of TPC parameters is highly dependent on the location of small cells. This issue implies a need to carefully reconsider the Pmax for small cell deployment.
In general, the fractional power control (FPC) mode is adopted for macro cell deployment, which ensures better service quality for the cell’s average users at the cost of a slight degradation in the cell edge performance [7]. In References [8,9,10], the impact of α and Po on the transmit power was investigated in detail; however, the consideration of variation in the Pmax limit was not considered. In Reference [11], a resource allocation-based uplink transmission energy reduction scheme was presented; however, it is limited only to a macro cell environment and considers the conventional 23 dBm limit for the Pmax. Also, for a small cell deployment, no separate description is available in the literature regarding the TPC mode. In Reference [12], the authors presented a detailed study on the downlink transmit power and bandwidth allocation problem for a small cell eNodeB in HetNet deployment. By considering the downlink scenario, the results indicated that for HetNet deployment, the energy efficiency for small cell users as well as the overall system capacity can be improved by increasing the number of small cells and the number of users per small cell. However, the analysis was limited only for the downlink transmit power of the small cell eNodeB and the inter-cell interference analysis was also left for future consideration. In our previous work [13], we proposed a full compensation mode for small cells in homogenous as well as in heterogeneous network (HetNet) deployment scenarios assuming the standard Pmax limit, i.e., 23 dBm. However, we can expect that, with a lower value of Pmax, the situation might become different. To provide better insight regarding the impact of the Pmax, it is essential to analyze its impact on small and macro cell performances and the TPC mode by adopting OL/TPC. Furthermore, the deployment strategy for small cells in the existing macro layer needs to be considered carefully, as the performance gains offered by small cells are highly dependent on the location of small cells within a macro cell. To optimize the energy efficient resource allocation problem in a HetNet environment, a novel subchannel and power allocation algorithm was presented in Reference [14], by taking the user requirements and inter-cell interference into account. However, the system model considered the heterogenous approach by the co-existence of a software-defined visible light communication (VLC) and radio frequency (RF) small cell network rather than the conventional macro/small cell case. In Reference [15], the authors presented a novel learning-based resource allocation framework for optimizing the use of uplink–downlink decoupling, by operating the small cell in a HetNet network in the LTE unsilenced band (LTE-U). By adopting such an approach, a significant gain in terms of data rates and load balancing can be achieved, However, most existing network deployments consider simple association mechanisms where the small cells operate in the licensed band. Therefore, in this work, we considered the conventional association mechanism for the small cells in the licensed band. Performance analysis of various small cell deployment scenarios was presented in Reference [16,17]; however, the analysis was limited to downlink received SIR and system capacity only, and no details regarding the uplink side were presented. An LTE UE power consumption model was presented in Reference [18], suggesting that the uplink transmit power and the downlink data rate greatly affect the UE power consumption. Therefore, to improve battery life of UE, it is critical to study the impact of Pmax limit for the LTE uplink. A study carried out in Reference [19] concerning the radio frequency electromagnetic field (RF-EMF) exposure from UEs in an LTE network indicated that knowledge on the realistic power levels of UE is important for accurate assessment of RF-EMF exposure, and UE transmit power should be kept lower in order to reduce the emissions. Keeping in view the abovementioned issues, it is vital to investigate the Pmax limit for the LTE uplink specially in the case of small cell networks, as future networks are heterogeneous in nature.
As discussed earlier, small cell deployment in an existing macro layer is a promising solution to meet the capacity demands for future cellular networks, and the energy efficiency for such an ultra-dense small cell network is a challenging issue. In particular, the maximum transmit power limit Pmax for small cell UE needs to be optimized to minimize the battery power consumption and to enable the efficient use of the available power while limiting the interference to neighboring small cells. The main motivation for the work presented in this manuscript was to specify the upper bound for the transmit power of the UE Pmax, not the actual transmit power, as the 3GPP specifications only define Pmax = 23 dBm for the macro cell case and do not explicitly define the Pmax limit in the case of small cells. To the best of our knowledge, this consideration has not been taken into account until now, but it proves to be vital while shifting toward small cells from the current macro cell deployment. Therefore, in this paper, the network performance was evaluated in order to show the need for a different Pmax limit for a small cell uplink compared to a macro cell uplink. The distinctive contributions and innovations of this paper are summarized as follow:
- Outlining four small cell deployment scenarios within the existing macro layer which were:
- ○
- Homogenous small cell deployment;
- ○
- HetNet deployment with uniformly distributed small cells;
- ○
- HetNet deployment with small cells near macro cell eNodeB;
- ○
- HetNet deployment with small cells near macro cell edge.
- Derivation for interference, received SIR and spectral efficiency expressions for homogenous and HetNet deployment scenarios for small cells.
- Numerical computation of reduced Pmax limit for each scenario for the small cell uplink.
- Ensuring similar interference levels as the macro cell deployment at Pmax = 23 dBm, with reduced Pmax limit in each small cell deployment scenario, while achieving similar received SIR performance as in the macro cell deployment.
The rest of the paper is organized in the following way: Section 2 presents the overview of the small cell base station deployment topology and related work. Section 3 presents the network model under consideration. Performance analysis for the proposed model is depicted in Section 4. Finally, the conclusion of this work is presented.
2. Cell Topology and Related Work
Recently, energy-efficient communication in cellular networks has earned tremendous attention [20]. The goals of energy-efficient communication can be categorized to maximize the energy efficiency which is defined as the amount of delivered data per energy consumption and minimizing the total network energy consumption while satisfying the required data rate and other quality of service (QoS) requirements of the users [21]. While deploying small cells in the existing macro layer, one of the major issues under consideration for ultra-dense networks is to minimize the energy consumption of the network. The cell topology adopted under deployment of small cell plays a key role in this respect. Concerning the small cell deployment strategy, there are two approaches to deploying small cell base stations within the macro layer to offload the macro traffic:
- A static small-base station deployment, where once deployed, the small cell base stations cannot be moved to new locations.
- A dynamic small cell base station deployment strategy, where the mobility aided small cell base stations (aerial drones or vehicular mounted) can be moved to new locations depending on various criteria such as high traffic load, disaster management or some mega event, to improve the performance of the network.
Several recent works adopted the static small cell base station deployment strategy due to the fact of its simple implementation as the base stations are fixed and the system modeling can be done by considering the link–budget analysis at the time of deployment by network operators. Most of the downlink parameters and inter-base station communication (termed as backhaul link) are fixed. The performance optimization is mainly considered by optimizing the network parameters based on the uplink measurements from the UE. However, with such static deployment, an important problem that arises in energy-efficient cellular networks is that of meeting a set of specified SIR targets using the minimum possible network power [22,23]. A practical policy introduced by the 3GPP specifications for achieving energy efficiency in such networks is to appropriately turn the small cells on/off. In the literature, several works address the small cell on/off approach to improve energy-efficient communications in dense small cell networks. An interference-aware small cell on/off mechanism was presented in Reference [24], where the small cells can be turned on based on the generated interference in the network for the downlink case. By considering the dormant state of small cells, that is, when no UE is associated to the small cell, a small cell on/off scheme was outlined in Reference [25], where the small cell base stations sense and store the reference signal received power (RSRP) of the neighboring base stations and UEs to determine their activation and deactivation. To reduce the signaling involved in the on/off mechanism of small cells, the authors in Reference [26] presented an interference contribution rate-based algorithm, resulting in a lower inter-cell interference in the downlink. In Reference [27], a dynamic small cell on/off mechanism along with dual connectivity was elaborated, which takes the load balancing and downlink outage probability of the users into account while turning the small cell on or off. Additionally, the dual-connectivity-based seamless handover procedure to transfer the UE from small cell to macro cell was discussed. Although the abovementioned schemes can efficiently mitigate the inter-cell interference and reduce the network energy consumption, the focus was to improve the energy efficiency in the downlink and the energy efficiency improvement for the UE in uplink direction was not considered. In summary, a static base station deployment proves to be simple in terms of implementation, and thus, preferred by the network operators while initializing the network deployment. In terms of uplink power control for the UE, the optimization of the network performance is fundamentally dependent on the uplink measurements. Therefore, from the user’s perspective, energy consumption at the UE needs to be addressed for static small cell deployment. In particular, the maximum transmit power limit Pmax needs to be revisited, as it is the major contributor towards interference.
Similarly, by focusing on reduction of the downlink energy consumption, a dynamic small cell deployment strategy can be considered, where the base station can be deployed in areas with higher UE density to improve the service quality in the case of mega events or disaster management—that is, in the case of network failure. By considering approaches such as stochastic geometry, several recent works presented dynamic base station deployment schemes by considering mobile base stations (aerial drone or vehicular mounted), which can roam in the network coverage area to address capacity issues. In Reference [28], a game theory-based mobility control scheme for flying drone base stations was presented, which can guide the movement of the drones in macro cell hotspots. The results designate that the proposed scheme can efficiently optimize the spectral efficiency by minimizing the number of drones in the network, while maintaining the safety perspectives to avoid the risk of the collision of drones and maintain an optimal altitude. However, the focus was on downlink performance enhancement and the issue of frequent handoffs on the UE’s end was not considered while discussing the user association. Similarly, by considering the recovery of the network infrastructure to sustain user communication for disaster management, the authors in Reference [29] studied the efficient utilization of autonomous mobile base stations (aerial or vehicular) to improve network reachability in emergency situations. A mobile base station fit mechanism was proposed which employs mobile base stations to automatically construct new routes and assess and adaptively respond to the fitness of pause positions, such that mobile base stations can provide links to recover the disconnected network infrastructure based on dynamic and local interaction with the stationary macro and small cells. In Reference [30], an extensive analysis of cell coverage, capacity, and inter-cell interference for an aerial base station was presented. From the coverage results, the optimal altitude for an aerial base station was reported and the coverage dependency for power transmitted by a base station was shown. However, the focus was only on the downlink and the impact on UE association was not considered. Due to the free movement of mobile base stations over the entire service area, UE may frequently find different base stations available for communication, resulting in increased power consumption due to the frequent handoffs. More importantly, the negative impact of base station height relative to the UE discussed in Reference [31] was neglected, which presented a new and significant theoretical discovery, i.e., the serious problem of area spectral efficiency crash. It showed that if the absolute height difference between base station antenna and UE antenna is larger than zero, then the area spectral efficiency performance will continuously decrease with network densification for an ultra-dense small cell network. Thus, the network capacity suffers from severer degradation compared to fixed-cell topology as the drone base station flies higher. Additionally, during the travel period, a mobile small cell is unable to provide service due to the serious channel fading, and thus, a loss in the service time occurs, as discussed in Reference [32]. Due to the mobility of the base station, the availability of reliable wireless backhaul links and the related resource allocation are principal issues that should be considered while adopting the dynamic small cell base station deployment strategy [33]. In summary, dynamic small cell base station deployment can be beneficial to reduce the downlink energy consumption. However, with mobile base stations, the issues of base station location, height, and mobility management will be more complex and will have a great impact on the quality of service in future cellular networks, as these networks will have to handle a large number of UE and their frequent handoffs due to the very dense short-footage small cells.
Conventionally, a static small cell base station deployment strategy is considered while optimizing the UE energy consumption in the uplink direction. In terms of downlink energy efficiency, a small cell on/off scheme can be adopted along with the static small cell base station deployment. Also, the abovementioned downlink-centric design considerations of dynamic small cell base station deployment can be adopted. As the focus of this work was to minimize the UE power consumption by finding the upper bound for the transmit power of UE in the uplink direction only, we adopted the conventional static small cell deployment strategy to model the network.
3. Network and Propagation Model
This paper considered four network configurations to analyze the Pmax in an LTE uplink. As a reference case, the homogenous macro cell deployment was considered, assuming Pmax = 23 dBm in the uplink direction. For the small cell uplink, a homogenous network deployment scenario with uniformly distributed small cells was considered at first and analyzed for different Pmax limits, starting with the current standard limit of 23 dBm. Secondly, a HetNet deployment scenario was considered with uniformly distributed small cells within the homogenous macro cell environment mentioned above. Thirdly, the HetNet deployment scenario with small cells deployed near the macro cell eNodeB was considered, that is, the central area of the macro cell. Finally, the deployment scenario with small cell deployed away from the macro cell eNodeB was considered, that is, on the macro cell edge region.
The uniform macro cell deployment and first scenario for small cell deployment are described in the following subsection together as the only difference among them was the cell size. This is followed by the subsections describing the three HetNet scenarios for small cell deployment separately. A fluid model in Reference [34] was employed to conduct the analysis, and was further extended for each network deployment, as the model was only available for a macro cell deployment scenario. The interference offered to the central small cell was evaluated in each scenario and the power control algorithm was optimized by selecting the optimal Pmax limit. It was obvious that the transmit power for small cell UE must be reduced, since the cell size significantly decreased in the cases with small cells relative to the macro cell deployment. However, the Pmax limit varied from one deployment scenario to the other, as the location of small cells within the macro cell plays a key role in the configuration of the network’s parameters. This is described in detail in the following subsection.
3.1. Homogenous Macro/Small Cell Deployment
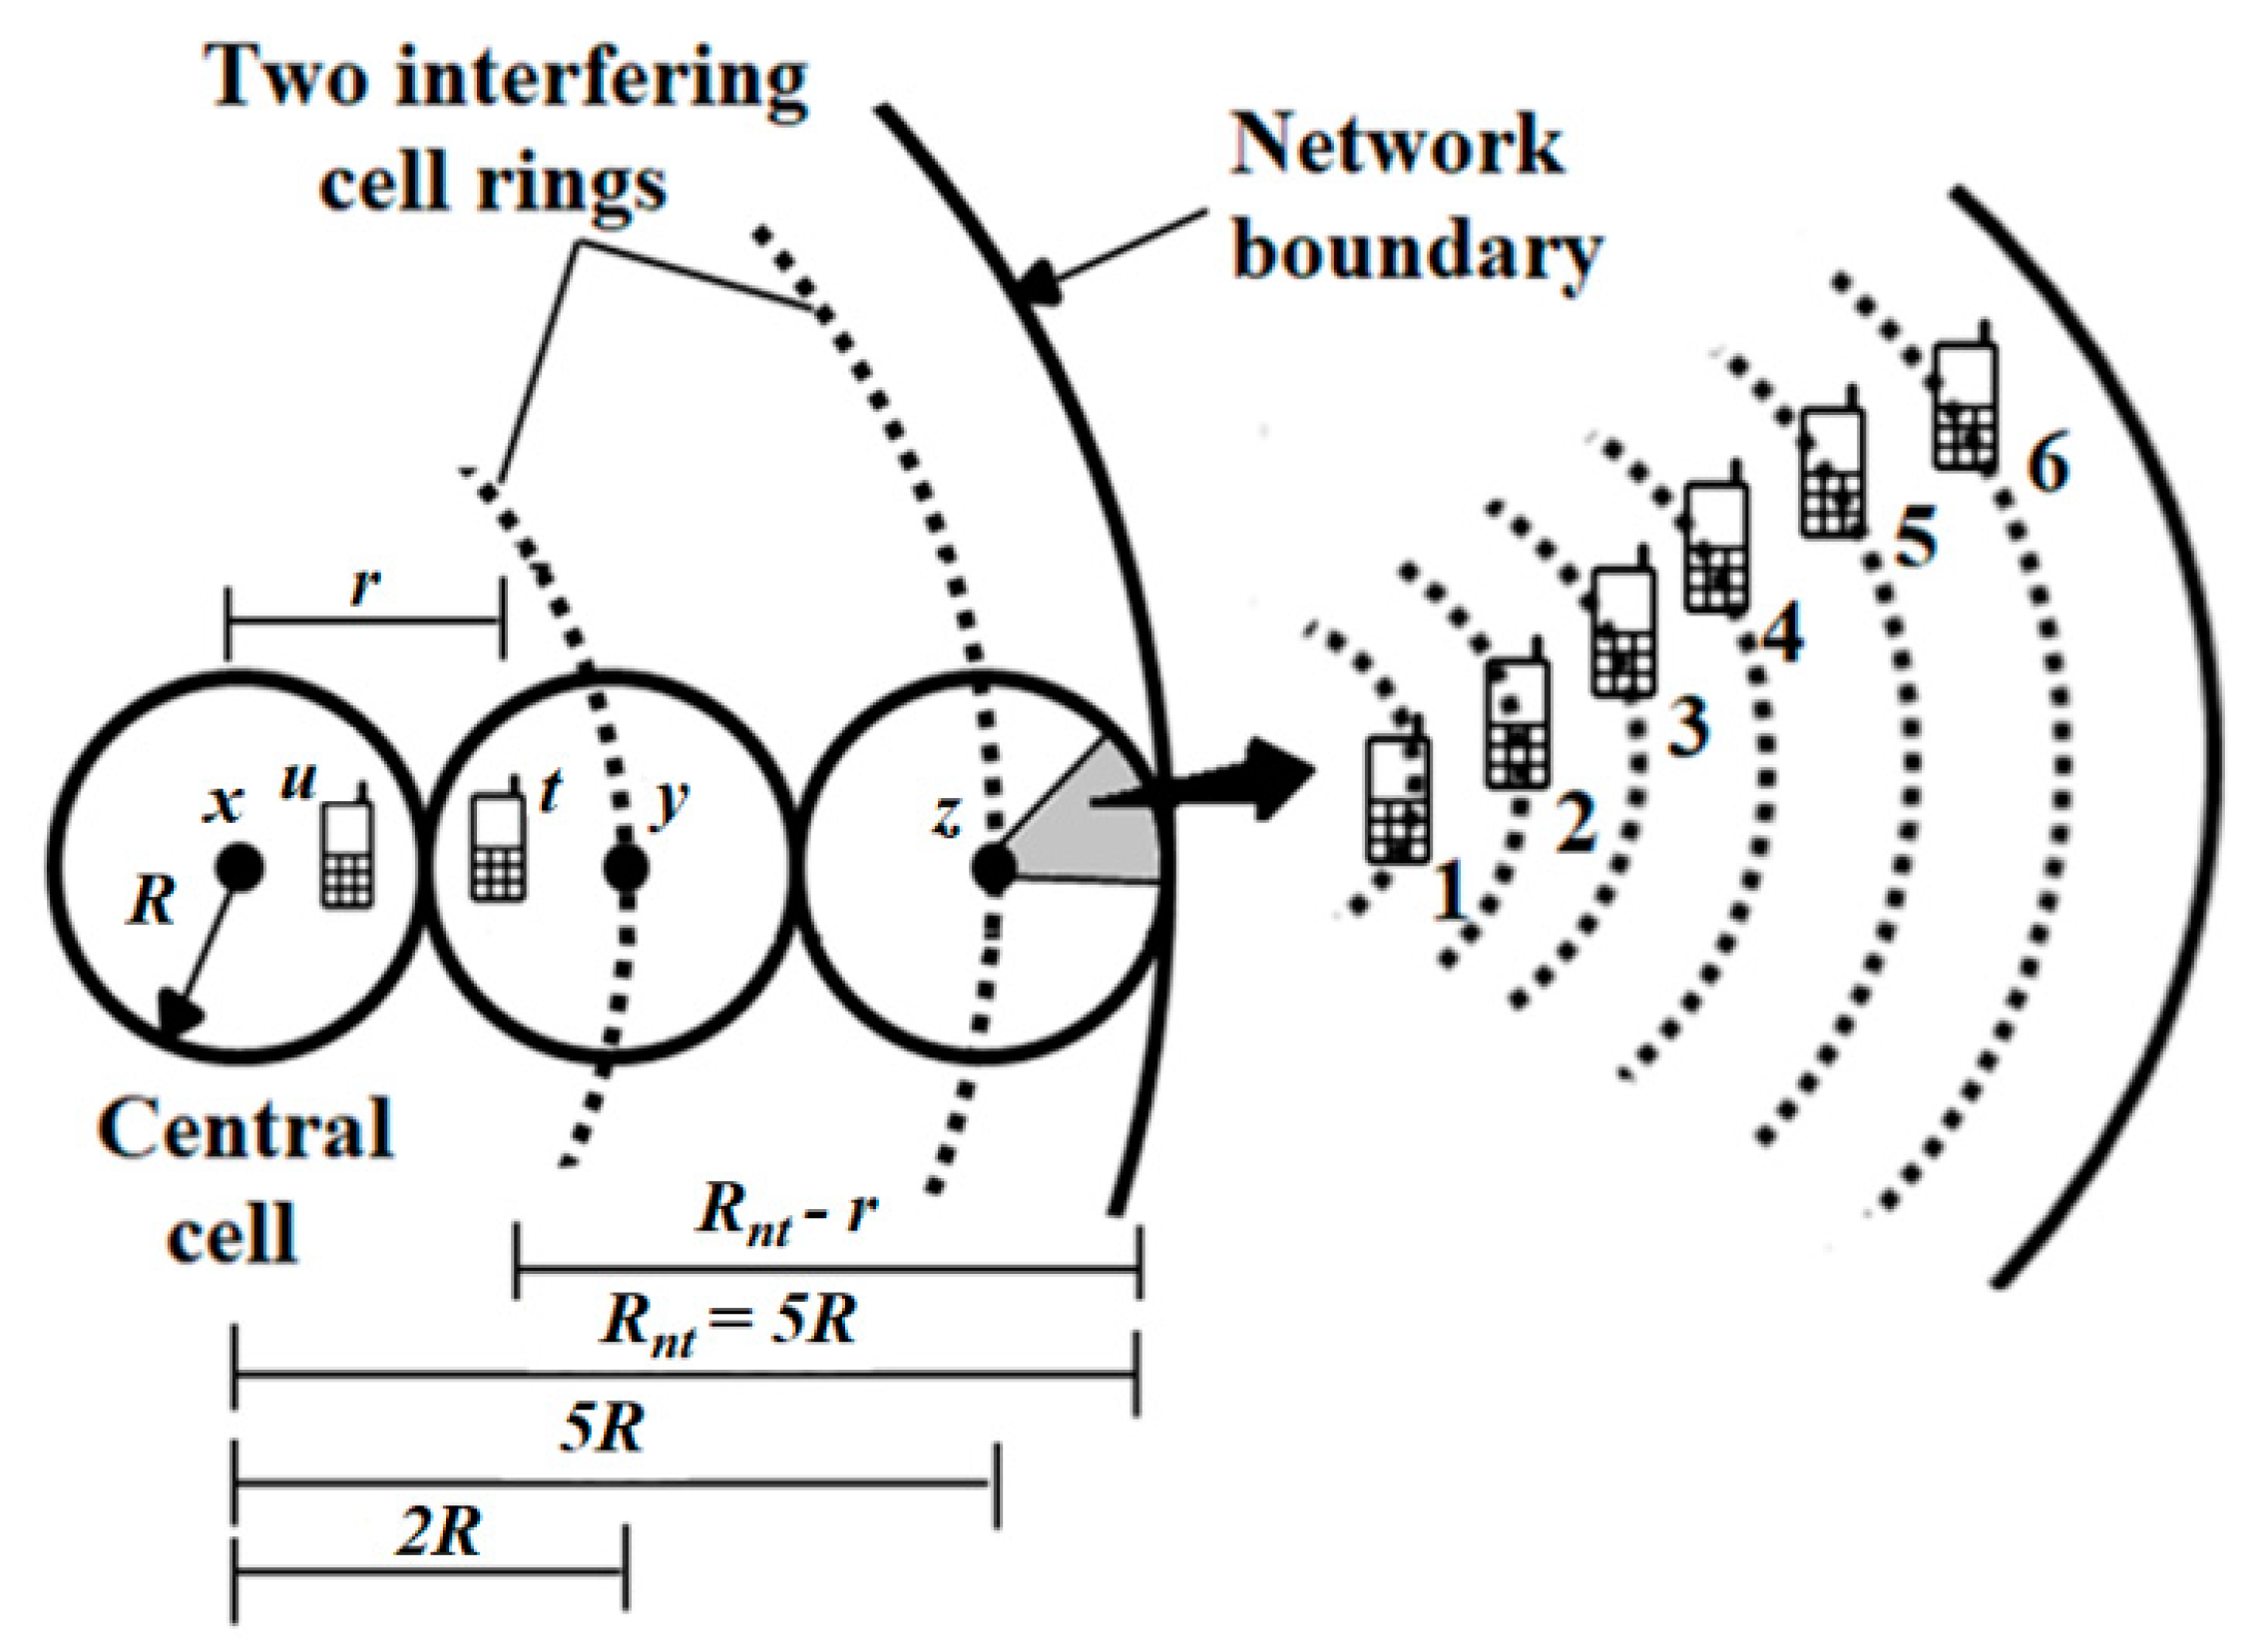
This section describes the network model considered for the homogenous deployment of macro and small cells. To determine the Pmax in small cells, which ensures the same performance when compared to the macro cell deployment, both network deployments were analyzed with similar conditions. In Figure 1, a homogenous distribution of both the macro and small cells is depicted. It is important to mention here that both the macro and small cells were considered independently, that is, the macro cells were considered first, followed by the uniformly distributed small cells. Two rings of neighboring cells were considered around the central cell. At eNodeB, omni-directional antennas were modeled to provide network coverage in each cell. In Figure 1, the central cell has a radius R and is surrounded by two rings of cells termed “interfering rings”, at distance 2nR (n = 1, 2). The network size is given as Rnt = 5R. In this case, R = 200 m and 1000 m specify the cell radius, while Rnt = 1000 m and 5000 m denote the network range for uniformly distributed macro and small cell networks, respectively.
3.1.1. Transmit and Receive Power
For the above described network model, the UE’s transmit power PTx in dBm is given as:
and the received power PRx in dBm at the eNodeB is:
As the network was analyzed for FPC mode as well as the full pathloss compensation mode, the α value varied from 0.7 to 1. To model the wireless channel, a free space model was considered for the pathloss estimation depending on the distance of the UE from the serving eNodeB.
A study carried out in Reference [35] clearly showed that for OL/TPC, the signal degradation due to the distance between UE and the serving eNodeB and the interference generated due to the improper power control settings were dominant. In this work, we investigated Pmax for the uplink using OL/TPC. Therefore, only the pathloss model was considered. The simulation parameters for each deployment scenario are summarized in Table 1. The mathematical expression for the free space model is given as:
where r is the distance of the UE from the serving eNodeB in meters, and fMHz is the operating frequency. Equation (4) can be rewritten to calculate the distance from the UE to its serving eNodeB, when the corresponding pathloss and the frequency values are known:
3.1.2. Interference
The central cell is prone to the interference offered by the cells in the two interfering rings. In each cell, the UEs are uniformly distributed. Following the outage probability in the fluid model presented in Reference [35], 20 UEs can be scheduled by each eNodeB with a 5% outage probability. To quantify the system performance, the analysis was conducted by considering six positions of the UE within a cell. The position of the UE was such that UE with a lower index was near the eNodeB, while a large index indicated an increase in the distance between the UE and the serving eNodeB.
Let us consider UE ui (where i = 1~6 indicates the UE index) scheduled by the central cell eNodeB x. As the frequency reuse factor of unity is assumed, the user ui suffers external interference due only to one UE per PRB from each of the network’s cells. From Equation (3), the received power at the eNodeB x from UE ui can be written as:
where Po = 10log (po) (Po in dBm and po in mW) is the target received power and is the pathloss between the UE ui and eNodeB x. By this approach, the mathematical expression for the external interference offered by the interfering rings to the central cell eNodeB x is approximated from Reference [34] as:
where designates the uniform distribution function of the UE scheduled by eNodeB x. Employing a uniform UE distribution provides a better insight to model and analyze the network as the non-uniform distribution assumption complicates the analysis, especially when the locations of the UE and eNodeBs are dependent. The pathloss pl can be expressed as path gain pg, where pg = 1/pl. The assumption here is that path loss only depends on the distance between the UE and the serving eNodeB. The expression for path gain is given as:
where η = 3.5 is the pathloss coefficient and A is a constant. Consider user t scheduled by eNodeB y, located on the first interfering ring of cells around the central cell. The distance range of user t from eNodeB x is r ∈ (R; 2R). As depicted in Figure 1, the user t is at a distance of 2R-r from eNodeB y. The interference offered by the area 2πrdr around UE t is . Similarly, if UE t is located in the distance range r ∈ (2R; 3R) from eNodeB x, it is at a distance r − 2R from eNodeB y. Hence, the interference offered now by the area 2πrdr around UE t can be estimated to be . Therefore, the generalized expression for the interference offered by the nth interfering ring to the central cell using Equation (7) can be given as:
Hence, the total interference offered to the central cell from the interfering rings can be approximated as:
where Ni represents the number of interfering rings around the central cell. Ni = 2 was considered for this work.
3.1.3. Received SIR
The received SIR for user ui can be obtained by dividing Equation (6) by Equation (10) as:
The impact of the noise and shadowing were not considered in this analysis. If the impact of shadowing and noise need to be included, the variation can be expected as in Reference [36]. The subscript “small” and “macro” are used for parameters in all the above equations, using them for small and macro cells, respectively.
3.1.4. Spectral Efficiency
To see the impact of variation in the Pmax limit on the system performance, the cell (or average) spectral efficiency (in bps/Hz/cell) for the proposed system can be obtained using the classical Shannon formula and Equation (11) as:
where, ro ≠ 0 represents the minimum distance between a UE and its serving eNodeB. Equation (12) can be employed for both a small and macro cell network, where ro = 5 m and 50 m are employed for small and macro cell cases, respectively. To evaluate the spectral efficiency for a UE at a certain distance from the serving eNodeB, Equation (12) can be rewritten as:
3.2. HetNet Deployment with Uniformly Distributed Small Cells
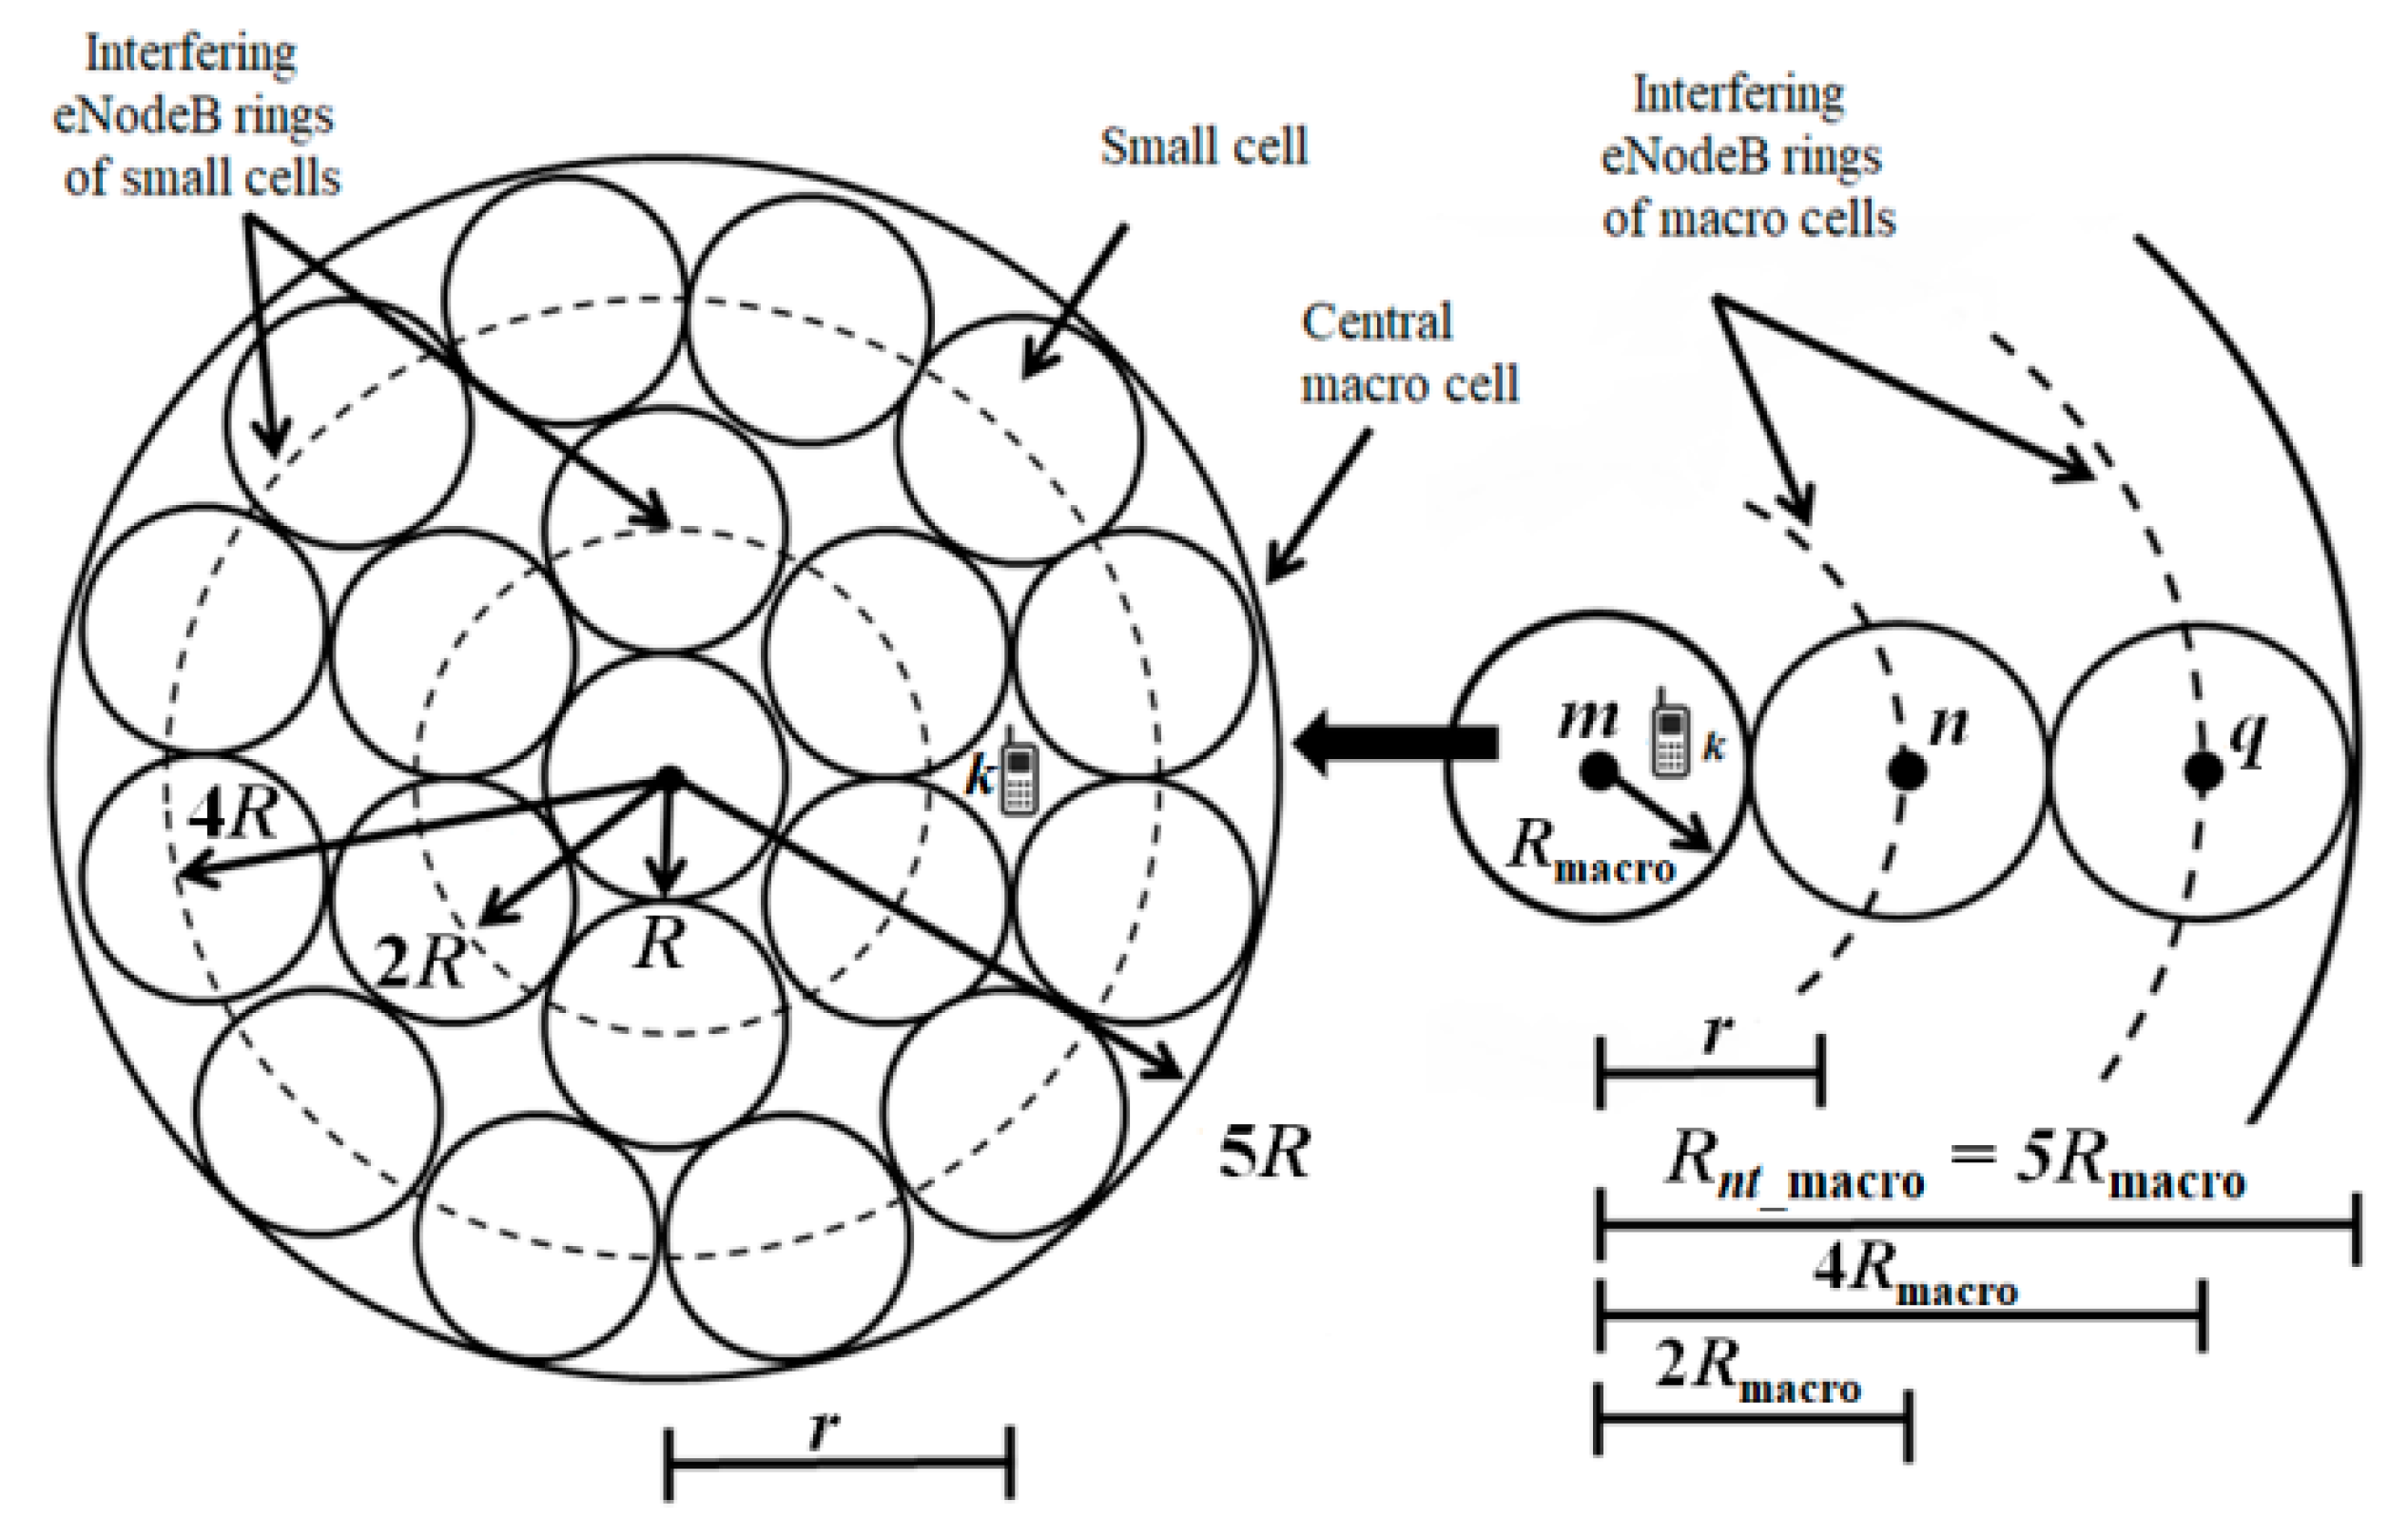
In this section, the HetNet deployment with uniformly distributed small cells within a macro cell was considered. The deployment was considered to be a HetNet environment as the macro and small cells co-exist. The small cells were deployed in the central macro cell, mentioned as the reference case in Section 3.1. The central small cell was placed in the center of the macro cell and was surrounded by a two interfering rings of small cells. Figure 2 depicts the deployment scenario. The focus was on the small cell uplink TPC parameters, in particular the Pmax limit.
For such deployment, the central small cell is prone to interference offered by the small cells in the interfering rings around the central small cell as well as the macro cell interference. It is important to mention here that the impact of interference from the macro cell was considered for the macro cell containing the small cells, as well as the neighboring macro cells. The interference from the neighboring macro cells was expected to be lower, as the distance between the central small cell eNodeB and neighboring macro cell boundary was 5R.
3.2.1. Transmit and Receive Power
The expressions for the transmit and receive power of the macro and macro cells were taken from Equations (2) and (3).
3.2.2. Interference
At first, let us consider the small cell interference offered to the central small cell. The interference In offered by one interfering ring to the central small cell eNodeB x can be given using Equation (9) as:
As there are two interfering rings of small cells at a distance of 2R and 4R, therefore the total interference offered by the interfering rings of small cells to the central small cell eNodeB x can be given using Equation (10) and Equation (14) as:
To compute the macro cell interference, the macro cell containing small cells as well as the neighboring macro cells were also considered. At first, the interference from the macro cell containing the small cells was computed, followed by the interference from the two rings of macro cells around the central macro cell. From Figure 2, it is clear that the central small cell was in the middle of the macro cell. Consider user k scheduled by macro cell eNodeB m, co-located with the central small cell eNodeB x. The distance range of user k from eNodeB x is r ∈ (0; Rmacro) as depicted in Figure 2. The interference offered by the area 2πrdr around UE k is . Therefore, the expression for the interference offered by the central macro cell to the central small cell eNodeB x can be given using Equation (7) as:
To calculate the interference offered by the interfering ring of macro cells, consider user k scheduled by eNodeB n, located on the first interfering ring of cells around the central cell. The distance range of user k from eNodeB x is r ∈ (Rmacro; 2 Rmacro) as depicted in Figure 2. The user k is at a distance of 2Rmacro-r from eNodeB n. The interference offered by the area 2πrdr around UE k is . Similarly, if UE k is located in the distance range r ∈ (2Rmacro; 3Rmacro) from eNodeB x, it is at a distance r − 2Rmacro from eNodeB n. Hence, the interference offered now by the area 2πrdr around UE k can be estimated to be . The interference offered by the nth interfering ring of macro cells around the central small cell can be formulated from Equation (9) as:
Hence, the total macro cell interference offered to the central small cell can be approximated as:
where Ni represents the number of macro cell interfering rings around the central small cell. Ni = 2 was considered for this section as well. The total interferences in the HetNet environment can then be given by using Equation (15) and Equation (18) as:
3.2.3. Received SIR
The received SIR for user ui can be obtained by dividing Equation (6) for small cells by Equation (19) as:
3.2.4. Spectral Efficiency
To see the impact of the variation in the Pmax limit on the system performance, the spectral efficiency for the cell average and at the specific position of the UE in the cell was computed from Equations (12) and (13) by using the received SIR given in Equation (20).
3.3. HetNet Deployment with Small Cells near Macro Cell eNodeB
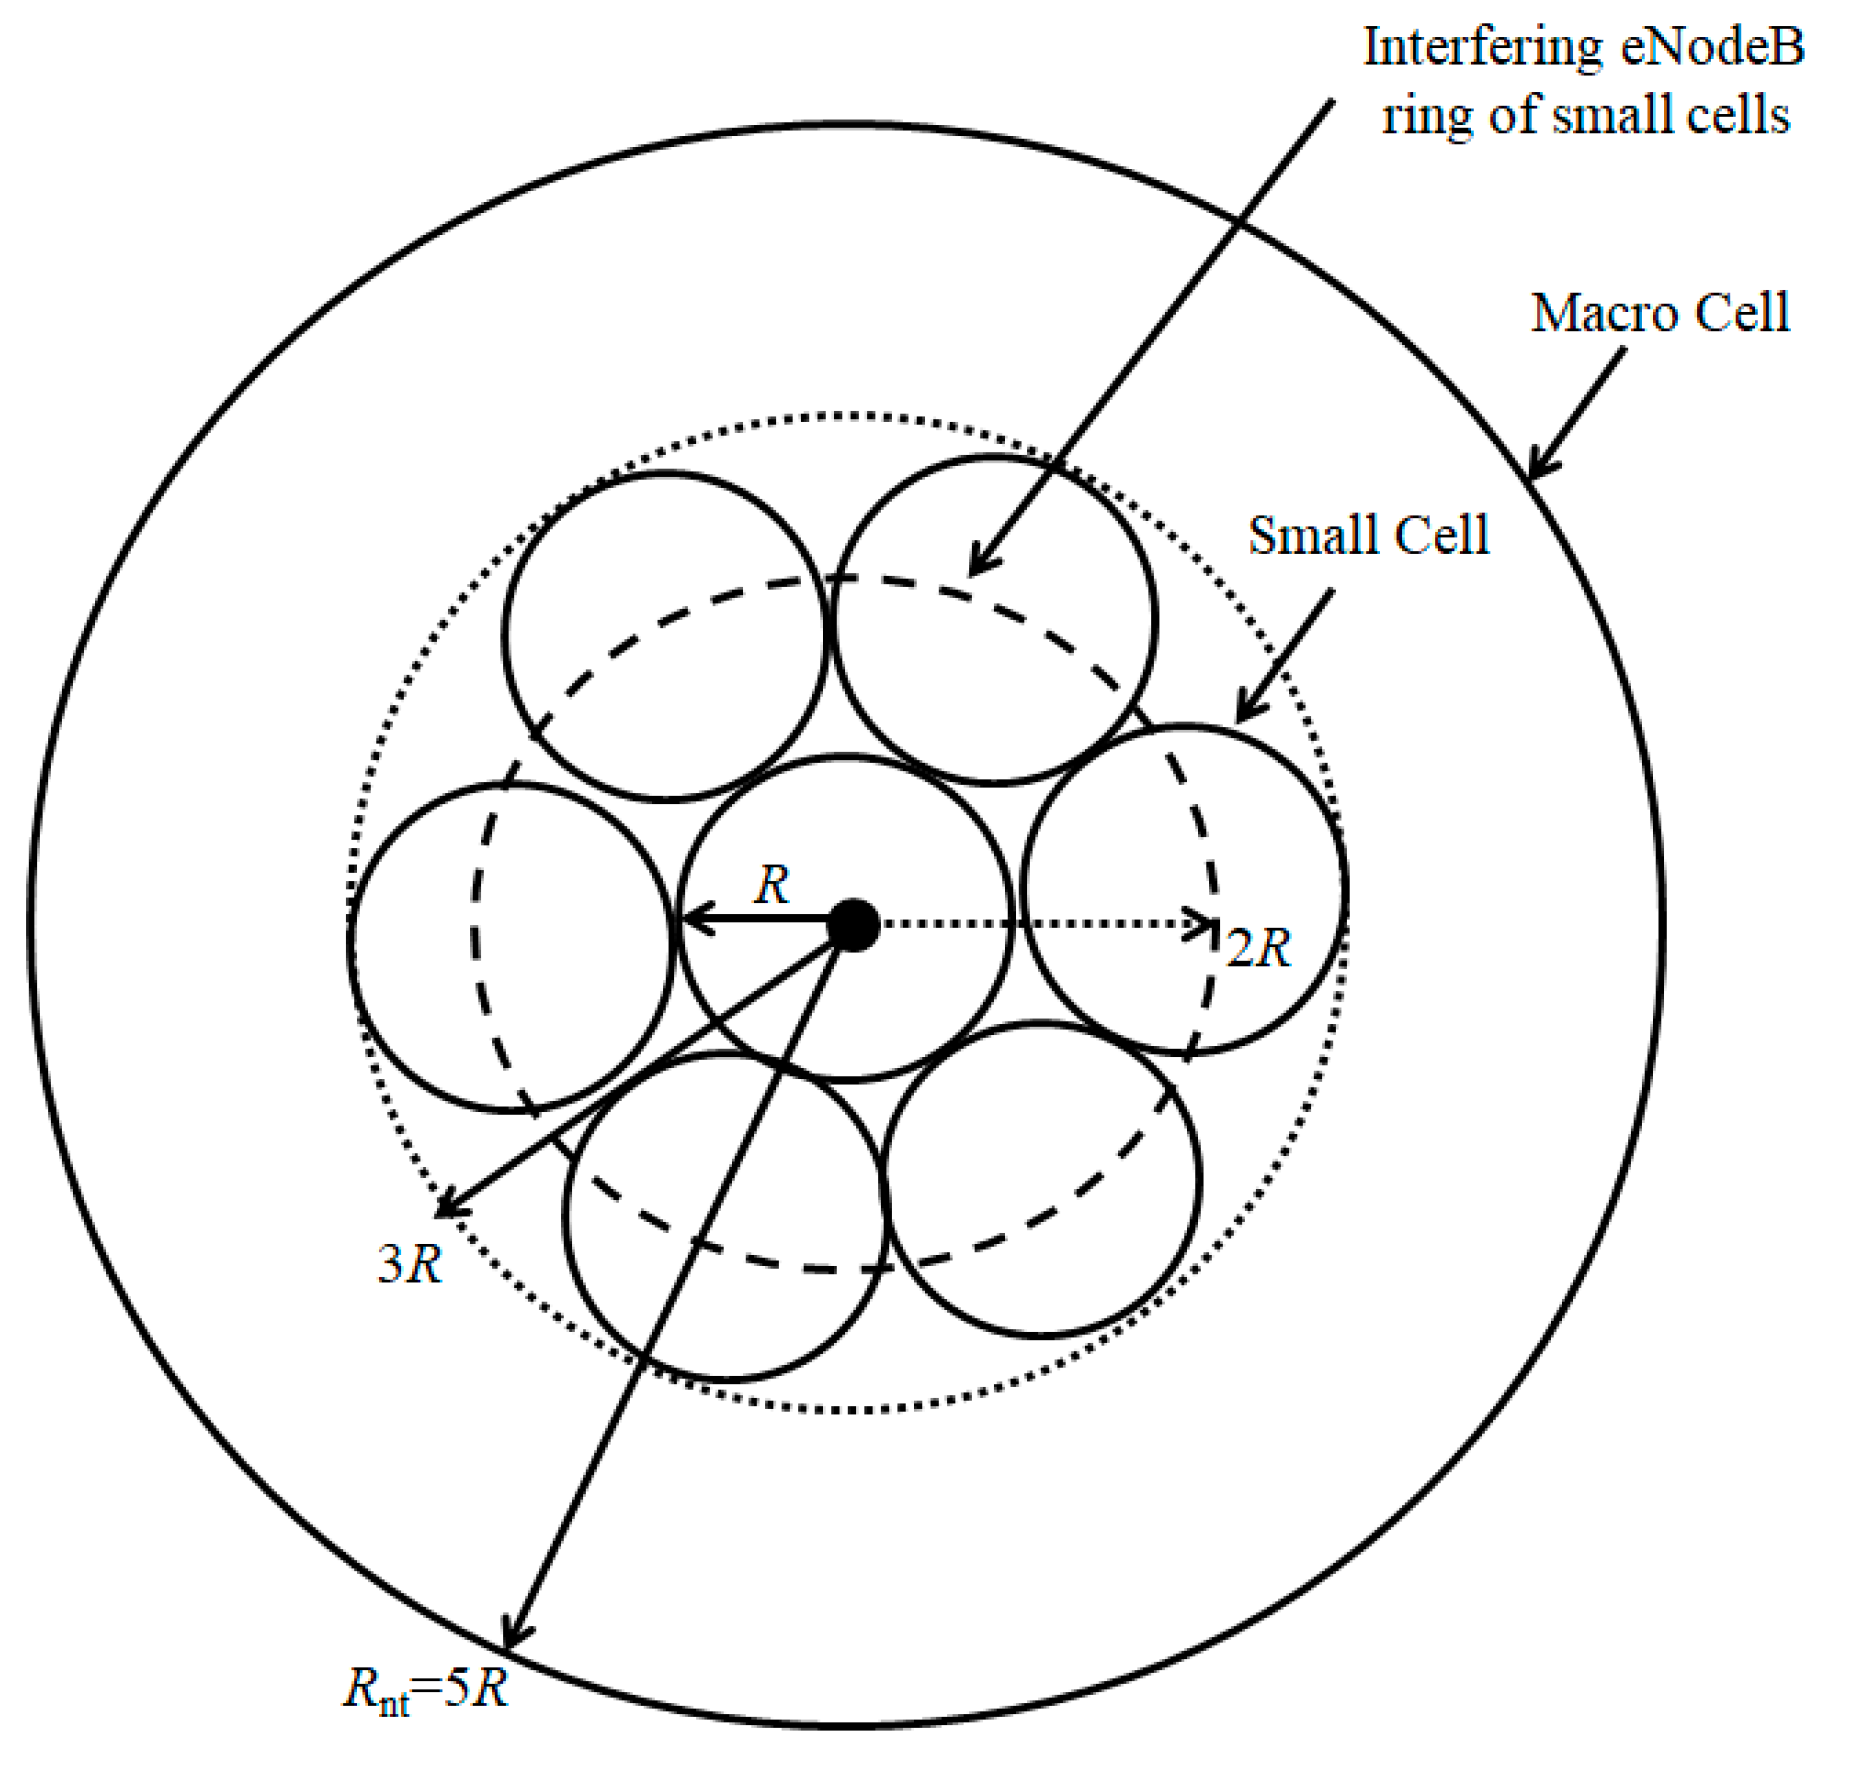
In this section, the HetNet deployment scenario with small cell deployed near macro cell eNodeB inside a macro cell is considered. One interfering ring of small cells is considered around the central small cell. Figure 3 depicts the deployment scenario. The central small cell is prone to interference offered by the small cells in the interfering ring as well as the macro cell in which the small cells are deployed. The macro cell interference is considered from the macro cell containing the small cells as well as the neighboring macro cells.
3.3.1. Transmit and Receive Power
The expressions for transmit and receive power of macro and small cells are taken from Equations (2) and (3).
3.3.2. Interference
The interference Ismall offered by one interfering ring at a distance of 2R from the central small cell eNodeB x can be given using Equation (9) as:
The macro cell interference is similar to that considered in Section 3.2. The total HetNet interference using Equations (18) and (21) is given as:
Compared to homogenous small cell deployment scenario, the interference is expected to be lower as there is only one interfering ring of small cells in this case.
3.3.3. Received SIR
The received SIR for user ui can be obtained by dividing Equation (6) for small cells by Equation (22) as:
3.3.4. Spectral Efficiency
To see the impact of the variation in the Pmax limit on the system performance, the spectral efficiency for the cell average and at the specific position of the UE in the cell was computed from Equations (12) and (13) using the received SIR given in Equation (23).
3.4. HetNet Deployment with Small Cells near Macro Cell Edge
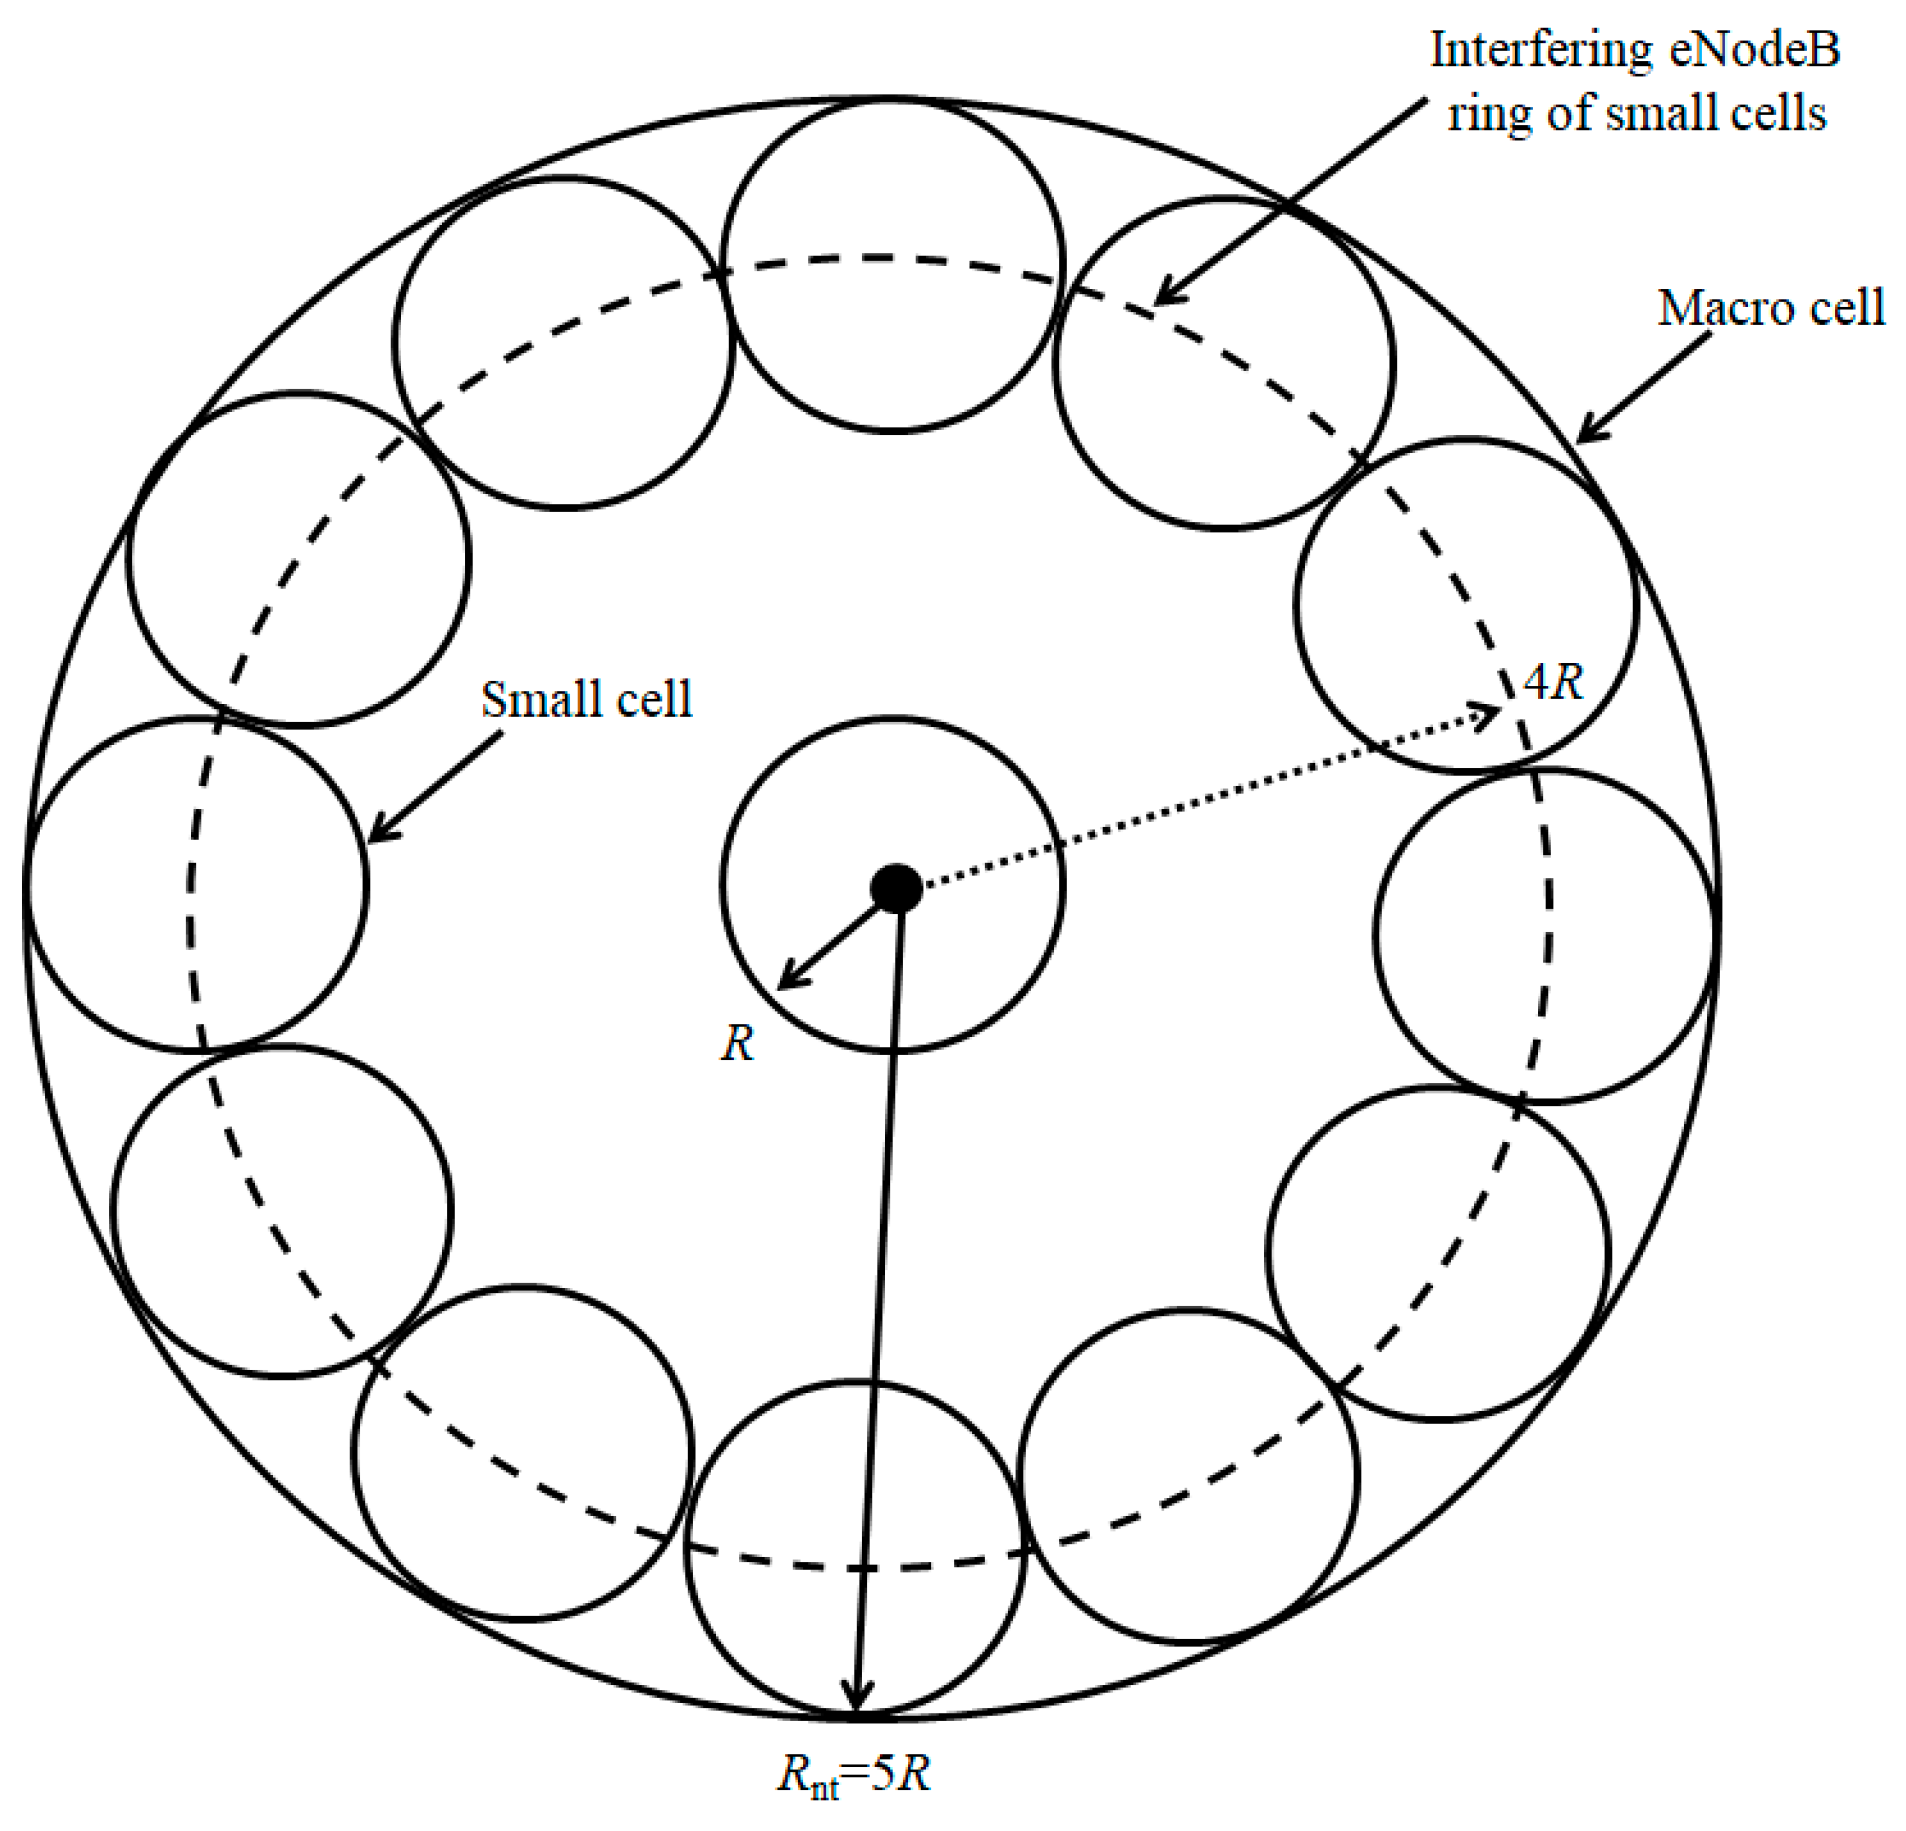
In this section, the HetNet environment with the small cells deployed at the edge of the macro cell was considered, as shown in Figure 4. In practice, this kind of deployment is most effective at decreasing the interference among macro cells, as the UE in the macro cell edge area associated to the macro cell can be scheduled by the small cells. This traffic offloading from the macro layer will result in reduced distance between UE and the serving eNodeB, resulting in a decrease of the transmit power and interference of the UE, hence improving the received SIR. Furthermore, the interfering ring is separated from the central small cell eNodeB x by a distance of 4R, which results in a decreased interference level offered to the central small cell.
3.4.1. Transmit and Receive Power
The expressions for the transmit and receive power of the macro and small cells were taken from Equations (2) and (3).
3.4.2. Interference
The interference Ismall offered by one interfering ring at a distance of 4R from the central small cell eNodeB x can be given using Equation (9) as:
Using Equations (18) and (24), the total interference in the HetNet environment can then be given as:
3.4.3. Received SIR
The received SIR for user ui can be obtained by dividing Equation (6) for small cells by Equation (25) as:
3.4.4. Spectral Efficiency
To see the impact of the variation in the Pmax limit on the system performance, the spectral efficiency for the cell average and at the specific position of the UE in the cell was computed from Equations (12) and (13) using the received SIR given in Equation (26).
4. Performance Evaluation
This section presents the analysis of Pmax for both macro and small cell deployments using OL/TPC. The performance of the system was quantified using the interference generated in the network and the received SIR level at the serving eNodeB. The analysis started with the uniform distribution of macro/small cells followed by the HetNet deployment scenarios which were uniformly distributed small cells within a macro cell, small cells near the macro cell eNodeB, and small cells on the cell edge within a macro cell. Let us consider each deployment scenario one by one.
4.1. Homogenous Macro/Small Cell Deployment
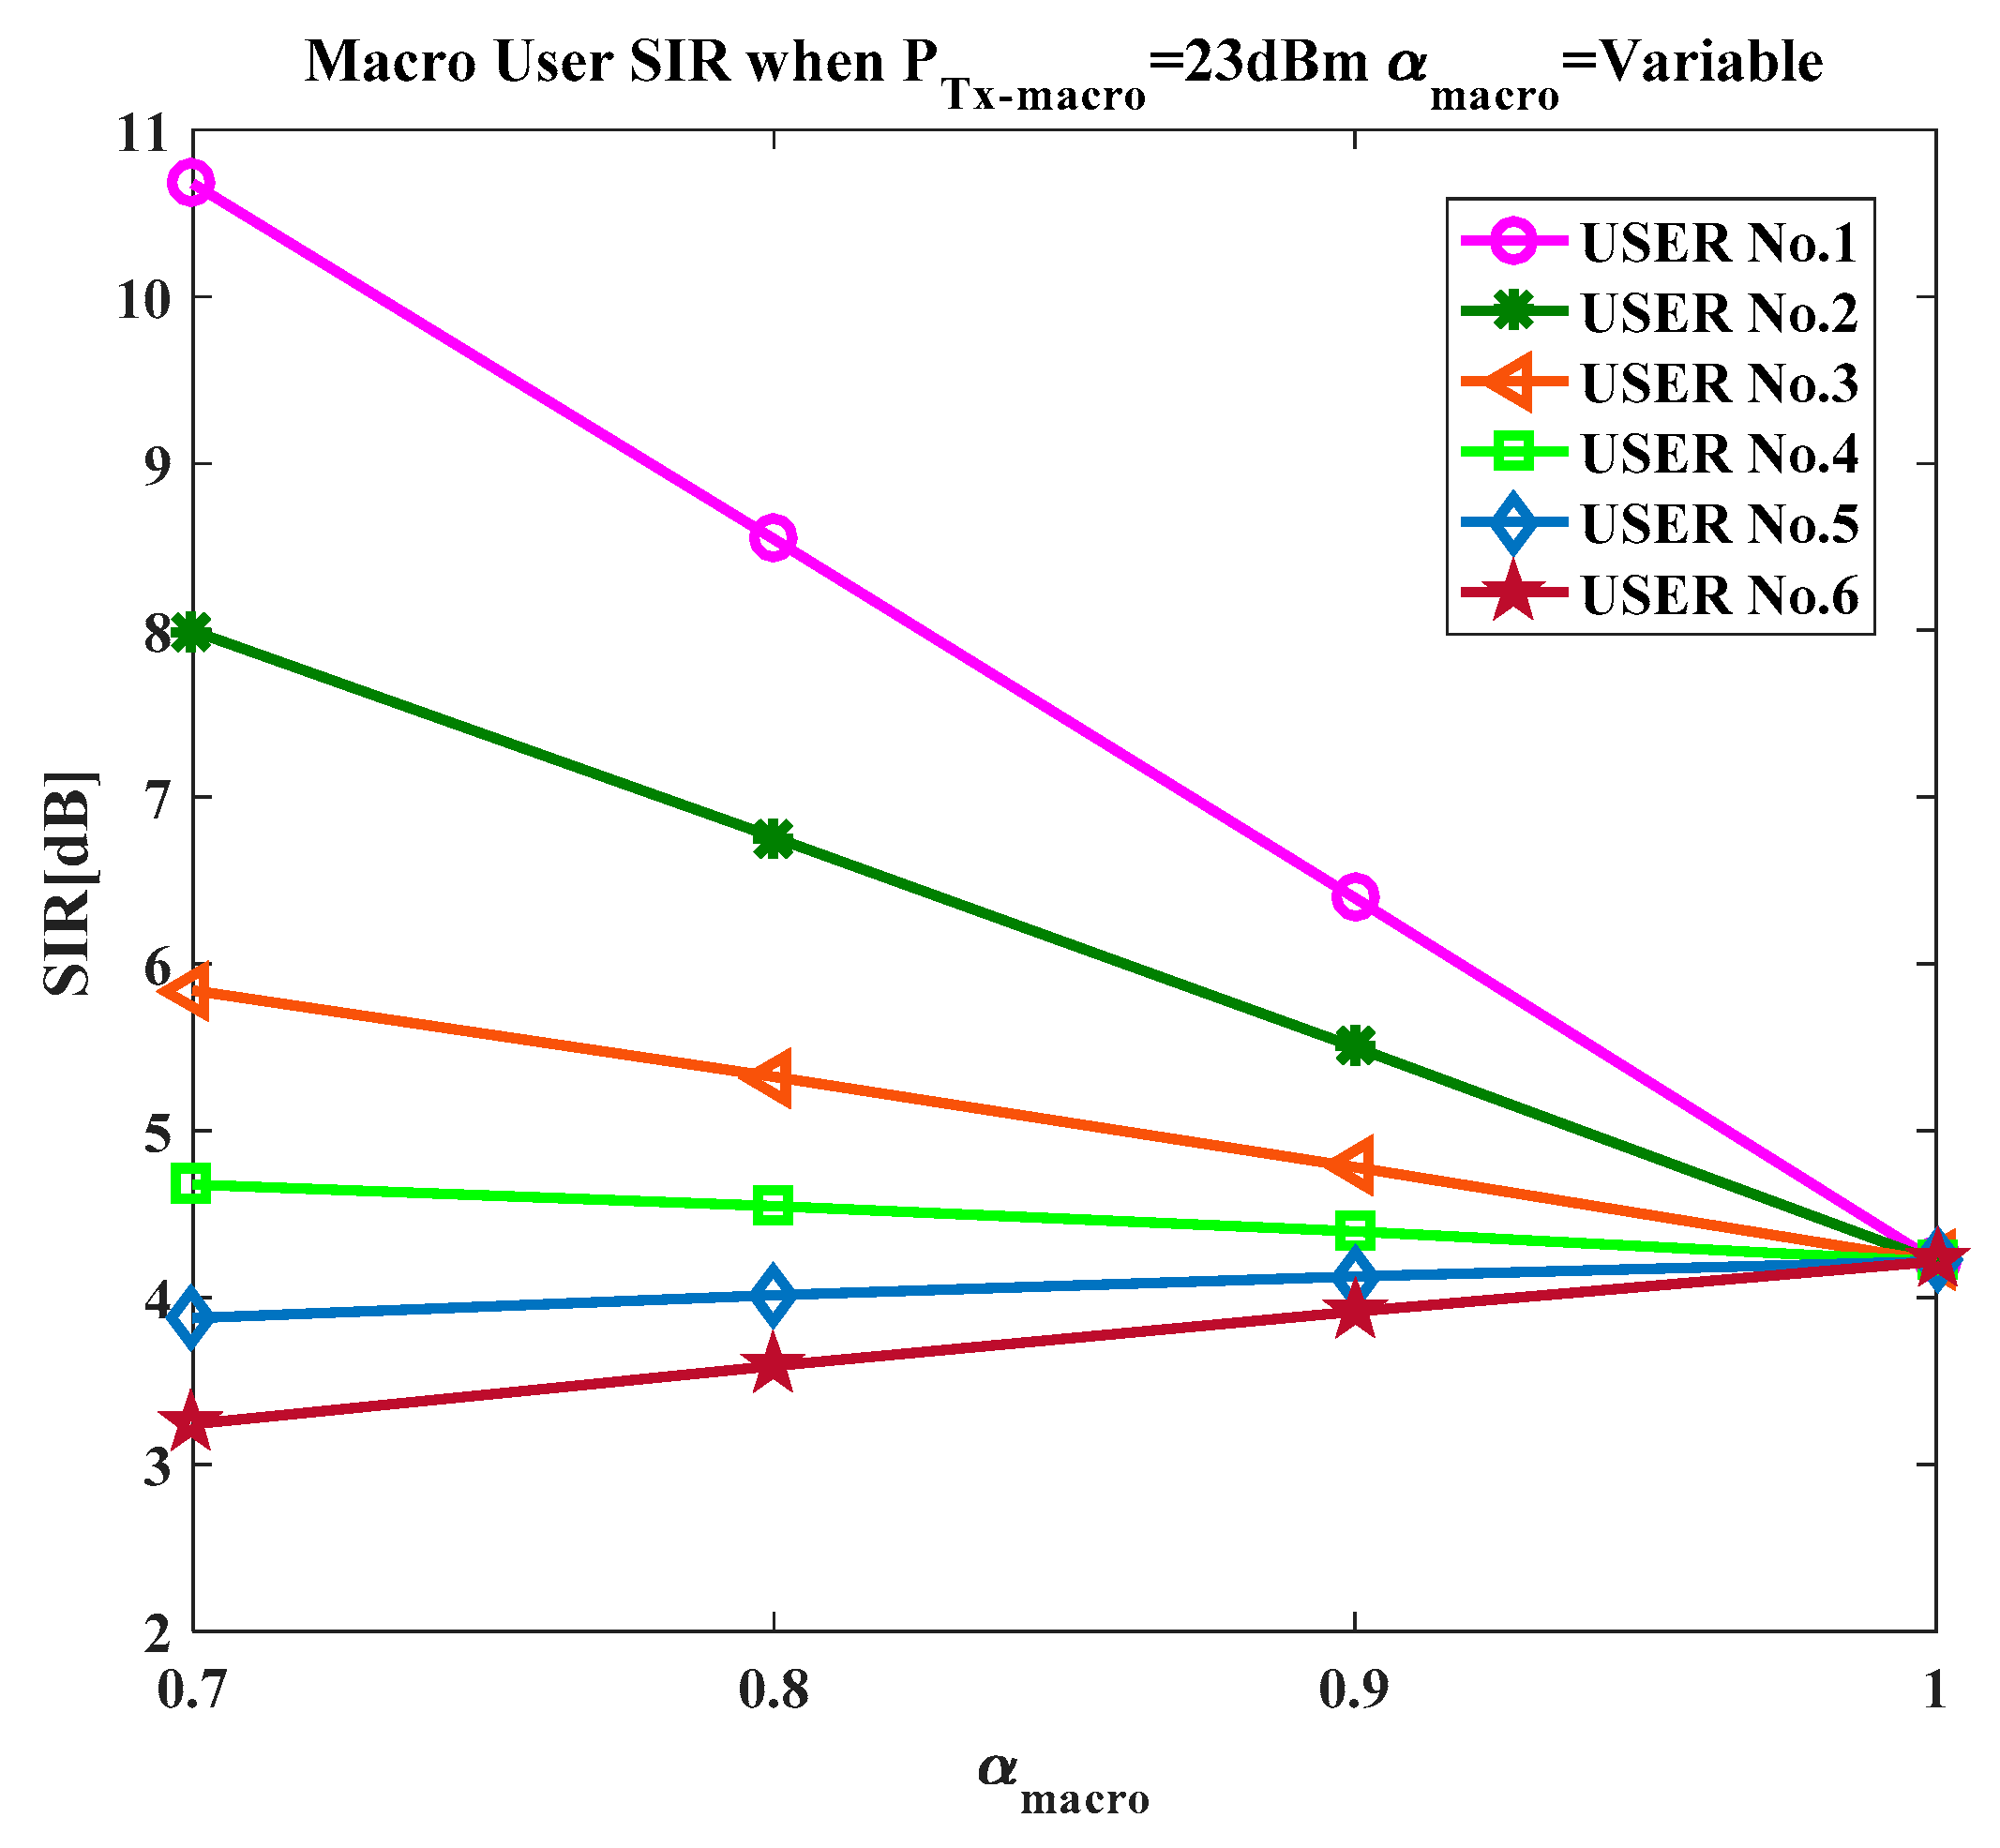
Firstly, the uniform macro cell deployment was considered as the reference case. The Pmax limit was set to be 23 dBm. The Po value for both macro and small cells was computed using Equation (2). The pathloss compensation factor αmacro for the macro cell varied from 0.7 to 1, and the received SIR was obtained using Equation (11), as presented in Figure 5. The trend with an increase in αmacro can be observed clearly for the UE near the eNodeB (i.e., UE with the index 1), where the received SIR decreased from 10.7 dB to 4.2 dB. Meanwhile, for the UE near the cell edge (i.e., UE with the index 6), the SIR improved from 3.2 dB to 4.2 dB. For lower value of αmacro, the UE near the eNodeB had better SIR, while the cell edge UE suffered from degradation in the SIR and vice versa. This is one of the key objectives, to use the FPC to improve the average cell performance at the cost of the degradation in the cell edge UE’s performance. On the other hand, the convergence of all SIR values for αmacro = 1 specifies the advantages of full pathloss compensation, where all users have the same SIR regardless of their position in the cell.
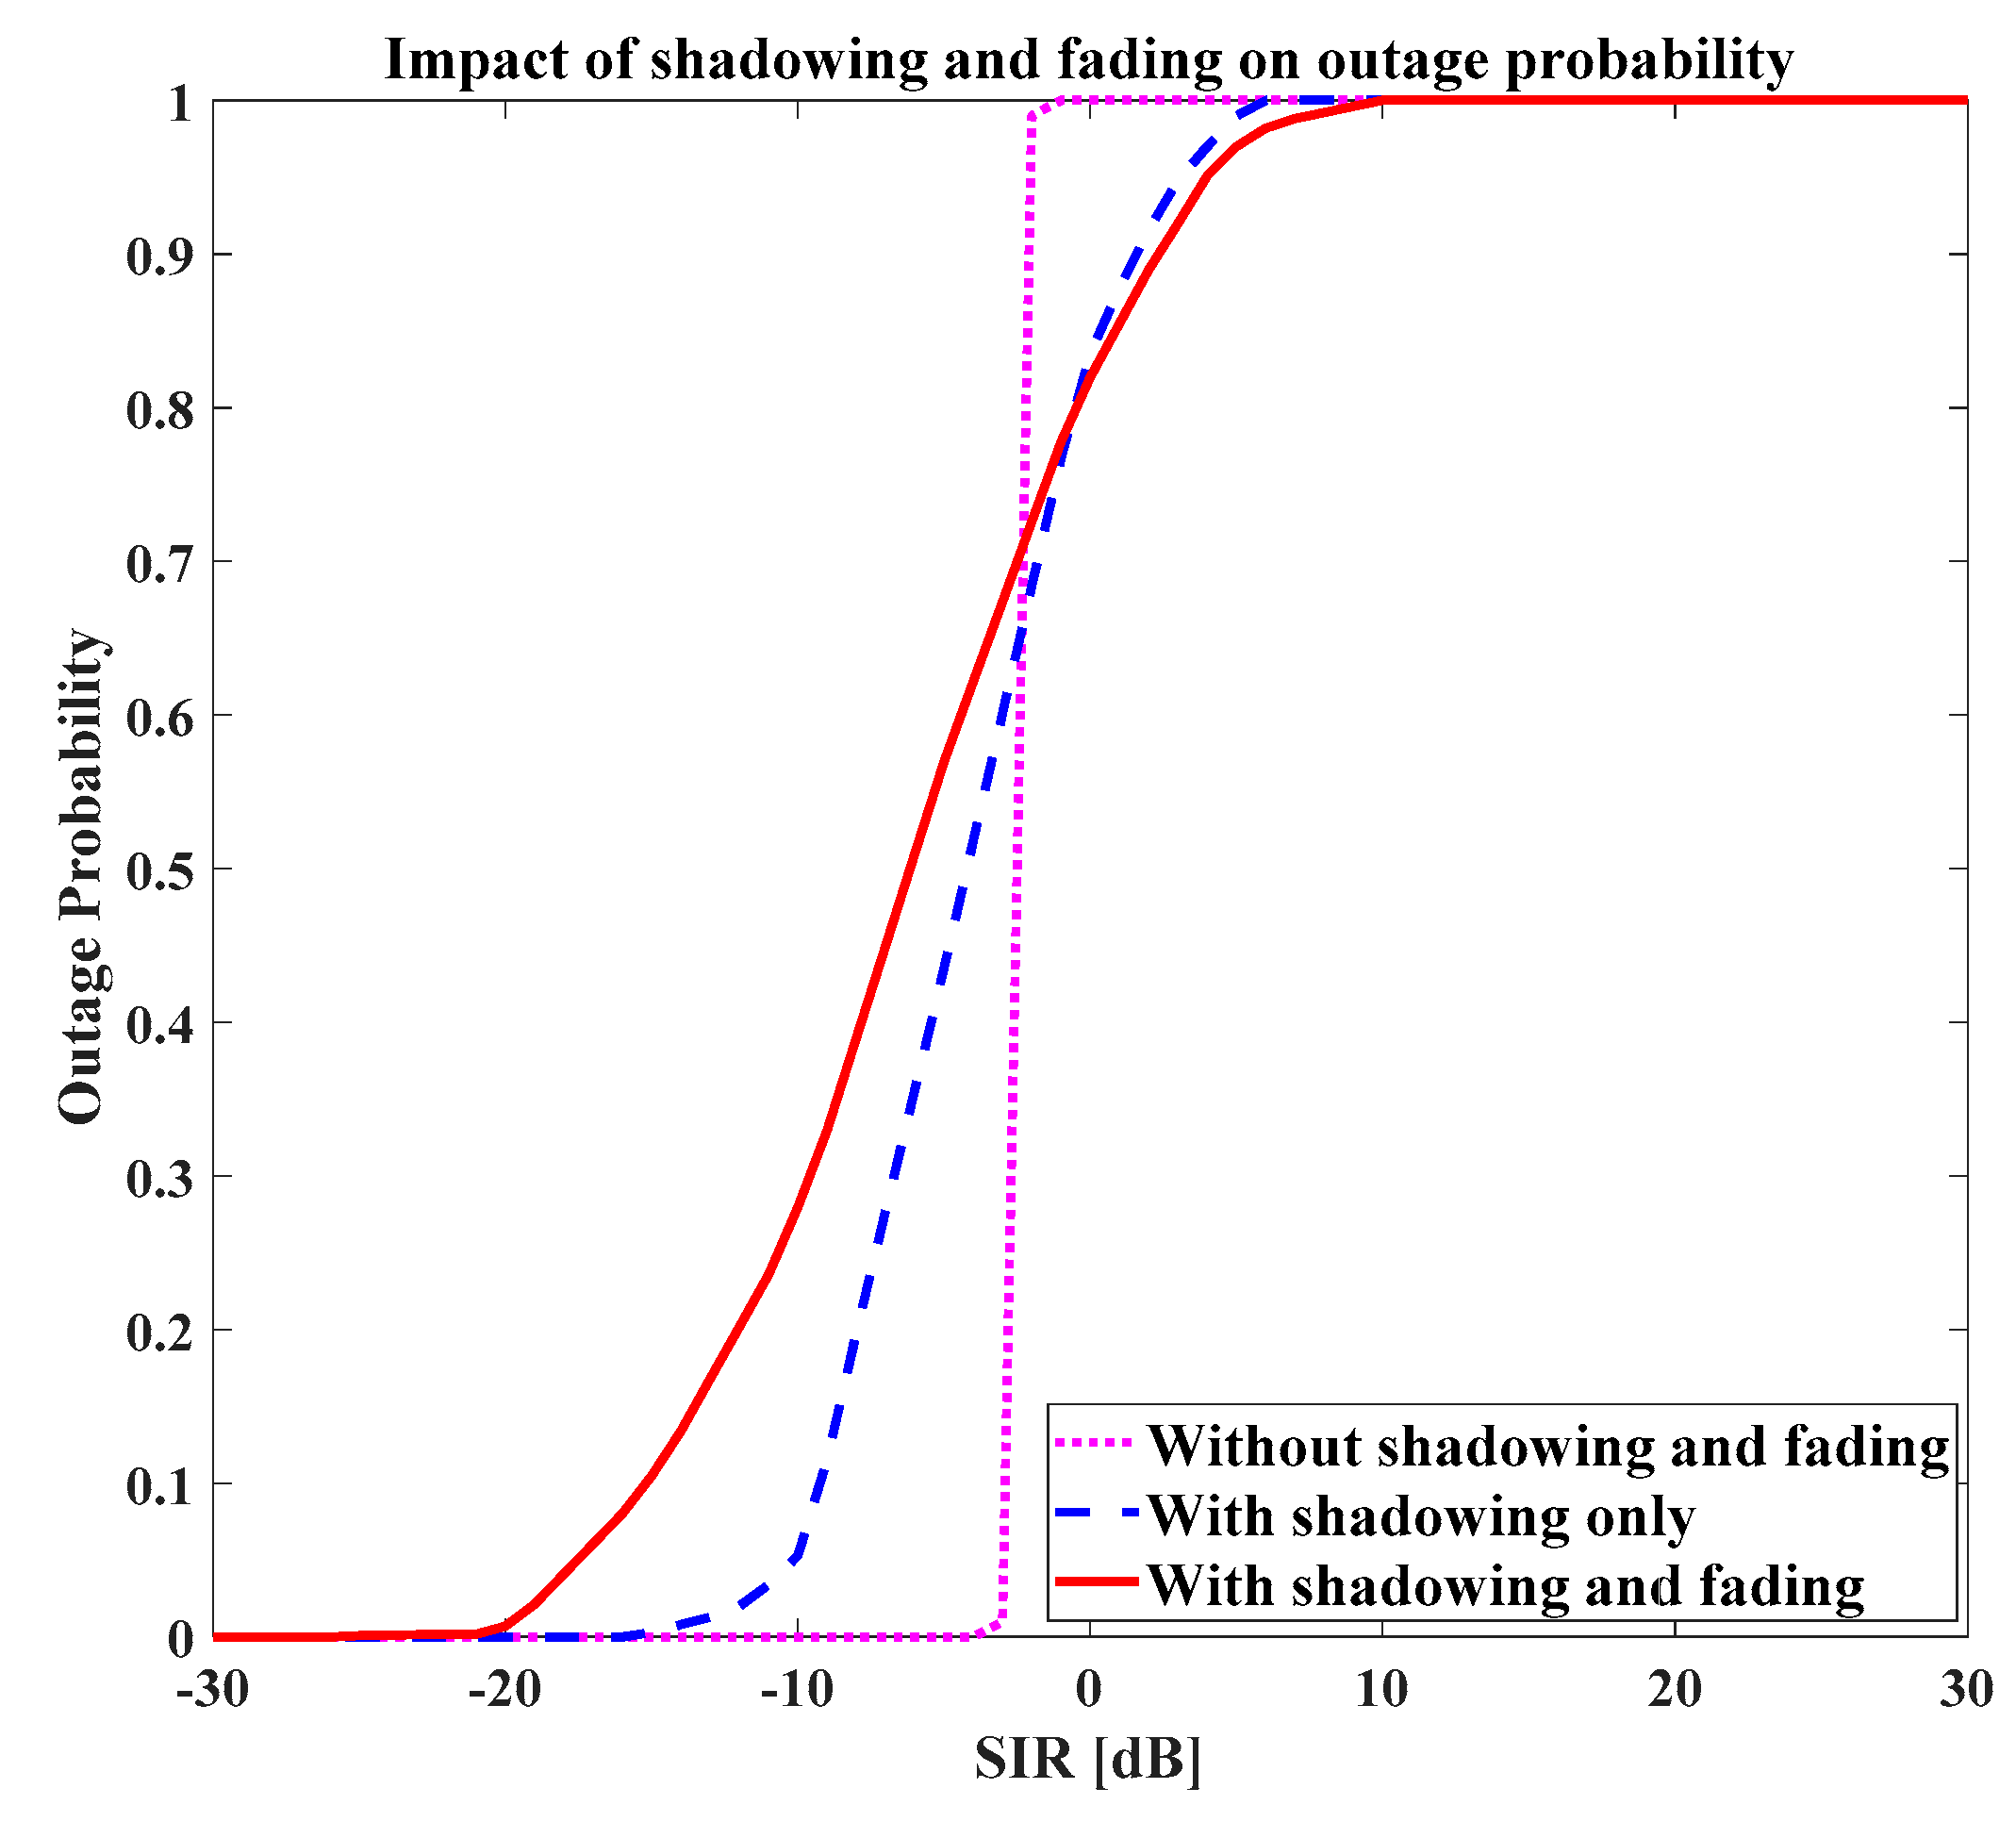
The coverage of a base station is defined as the area where the received SIR by the UE reaches a certain value for a given outage probability. The generic impact of shadowing and fading on outage probability for the macro cell users with a pathloss coefficient η = 3.5 was studied by following the recommendations in Reference [35], as this was not the focus of our work. To see the impact of shadowing and fading on the system performance, the outage probability for the system using a fluid model is depicted in Figure 6. The outage probability was plotted as a function of received SIR at the cell edge UE in the case of the macro cell only i-e at r = Rmacro. Figure 6 shows that without shadowing and fading, the received SIR of the cell edge UE reaches −3 dB. As there was no random variation in the signal propagation, this value was deterministic, that is, the outage was 0% up to −3 dB and 100% for higher values of received SIR. In presence of shadowing (σ = 3 dB) only, the received SIR reached −9 dB with an outage probability of 10%. However, when the impact of fading was also considered along with the shadowing, the received SIR reached only −15 dB for the same outage probability. As the received SIR highly depends on the position and number of the UE in the cell and the environment, that is, the shadowing, power control parameters, cell dimensions, and the type of environment (e.g., urban or rural), such results are helpful for the network operators while admitting or rejecting new connections according to the specific environment for the new entering UE. As in this work our focus was to find the upper bound for the transmit power Pmax for the UE rather than the actual transmit power, therefore, the impact of shadowing and fading was not taken into consideration. However, the analysis of the impact of shadowing and fading on the system performance while setting the actual uplink transmit power for the small cell uplink will be considered in detail in our future work.
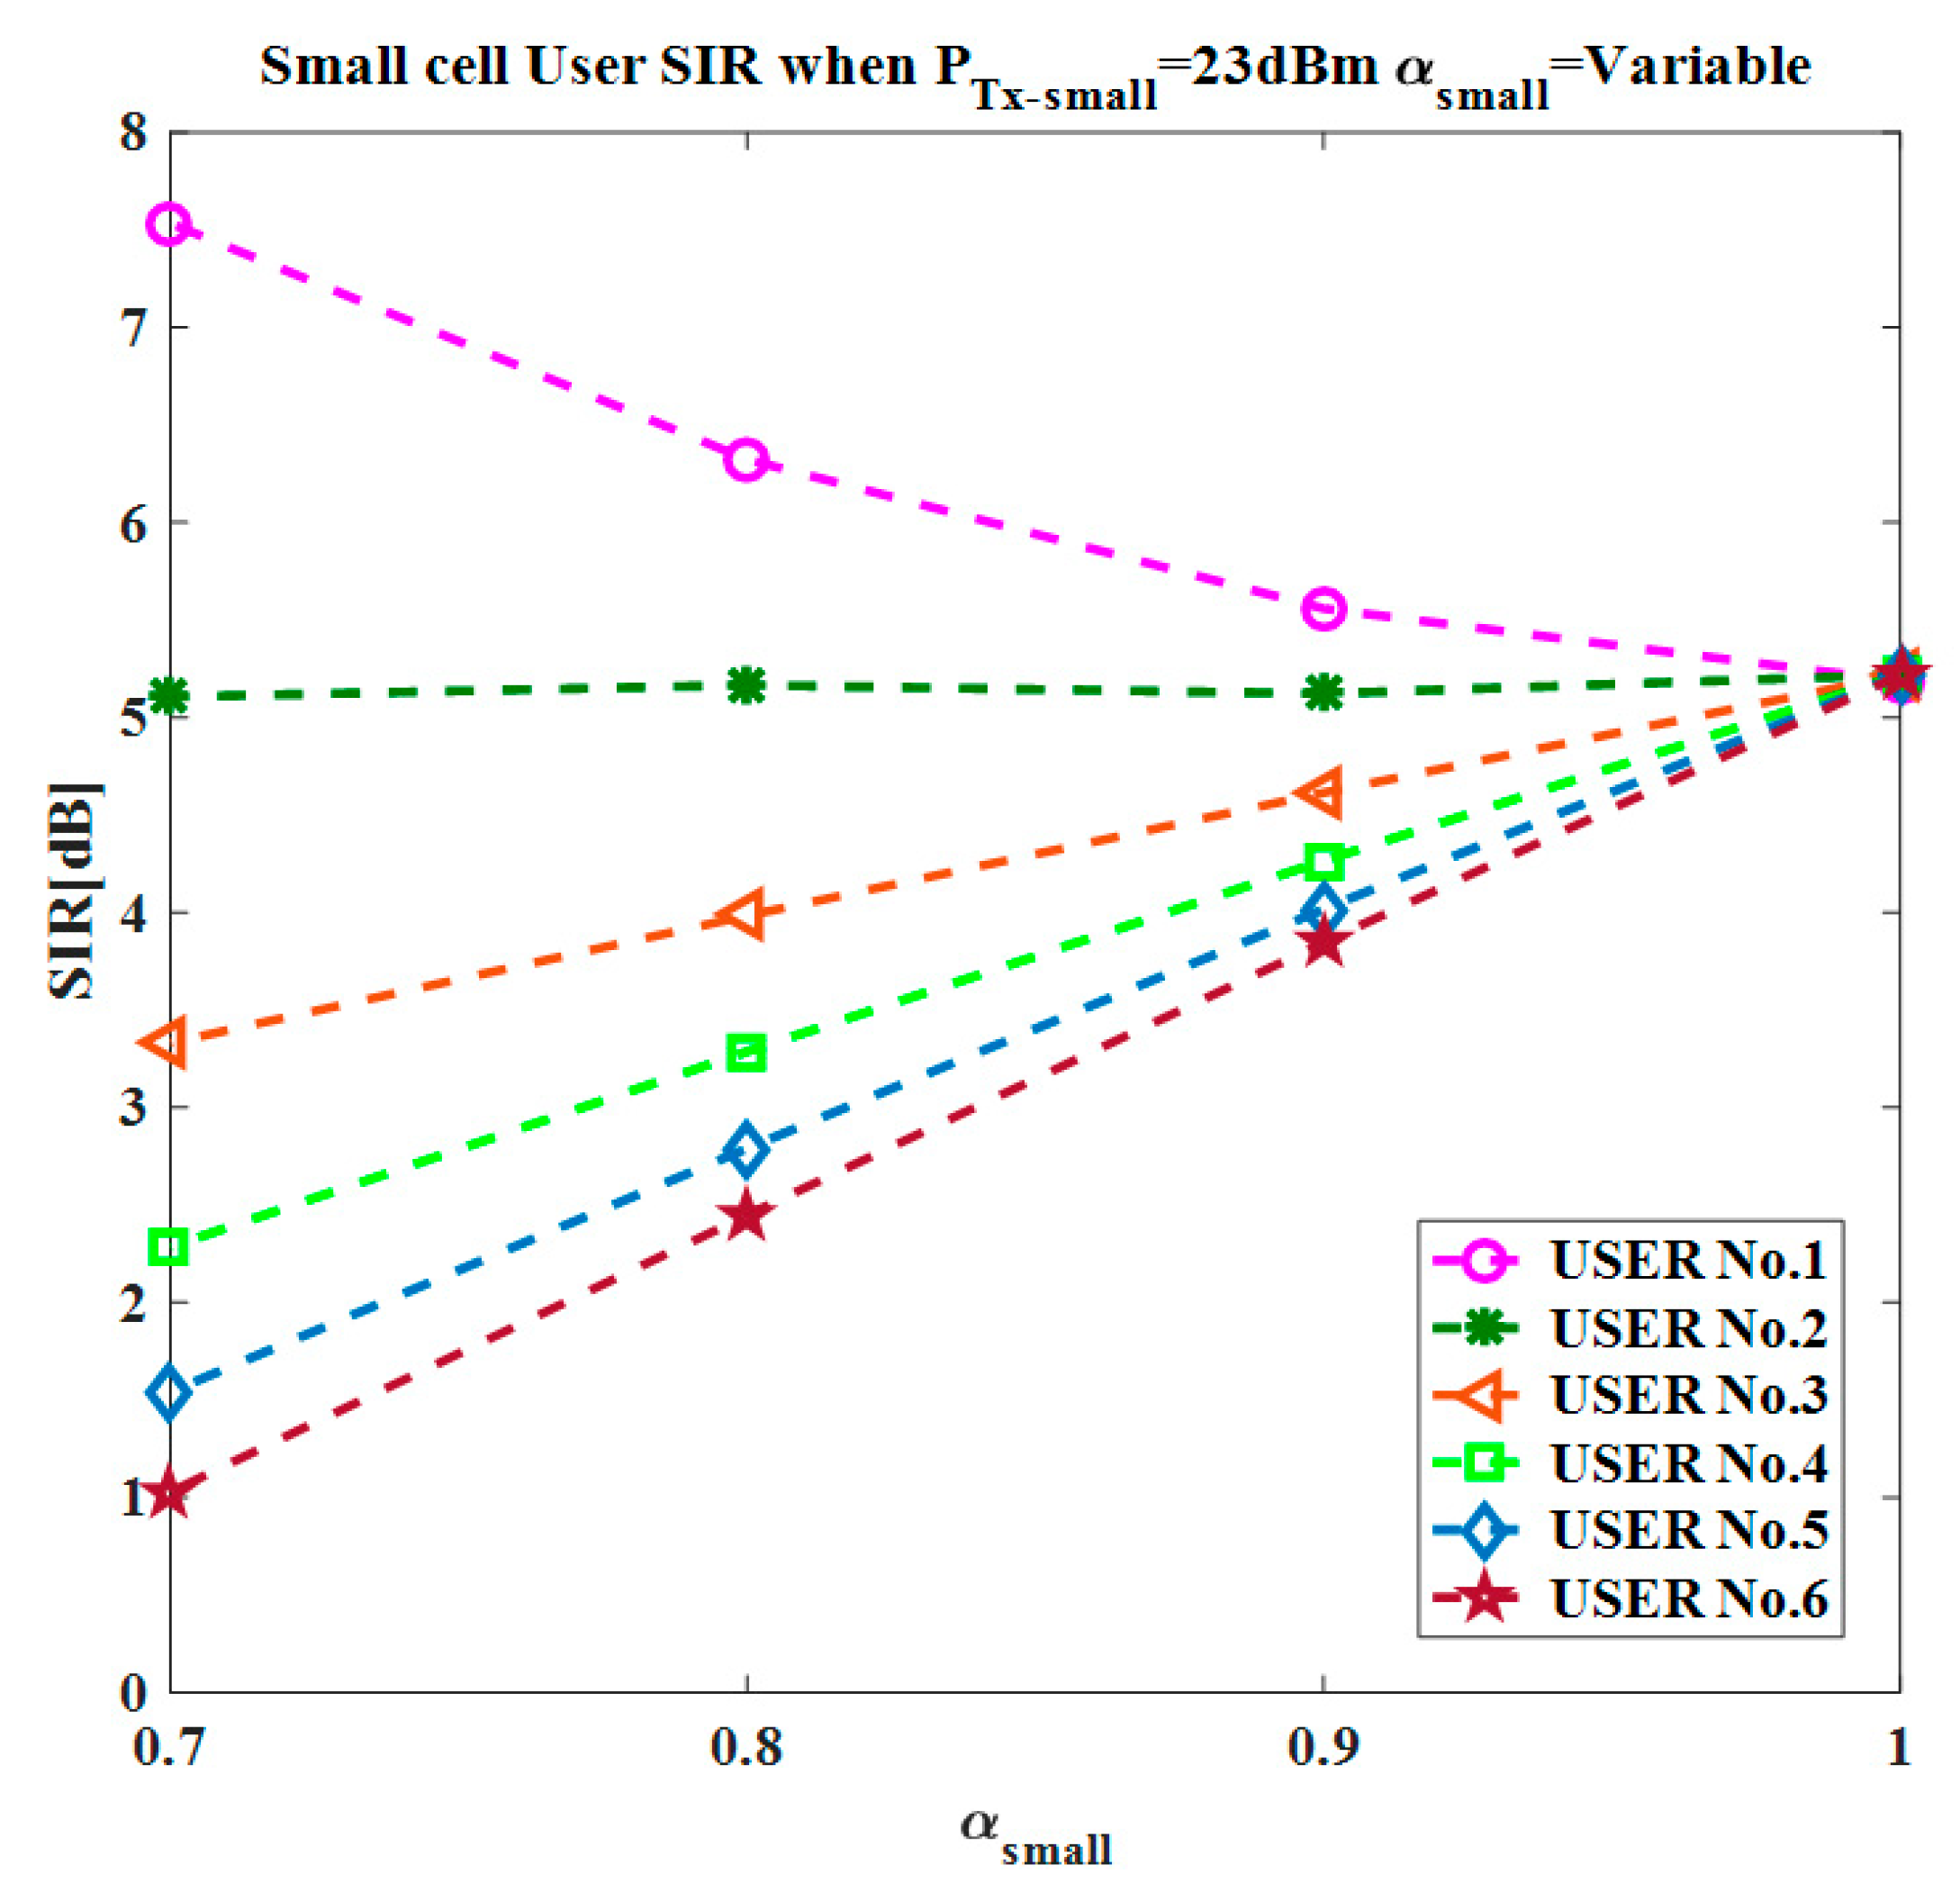
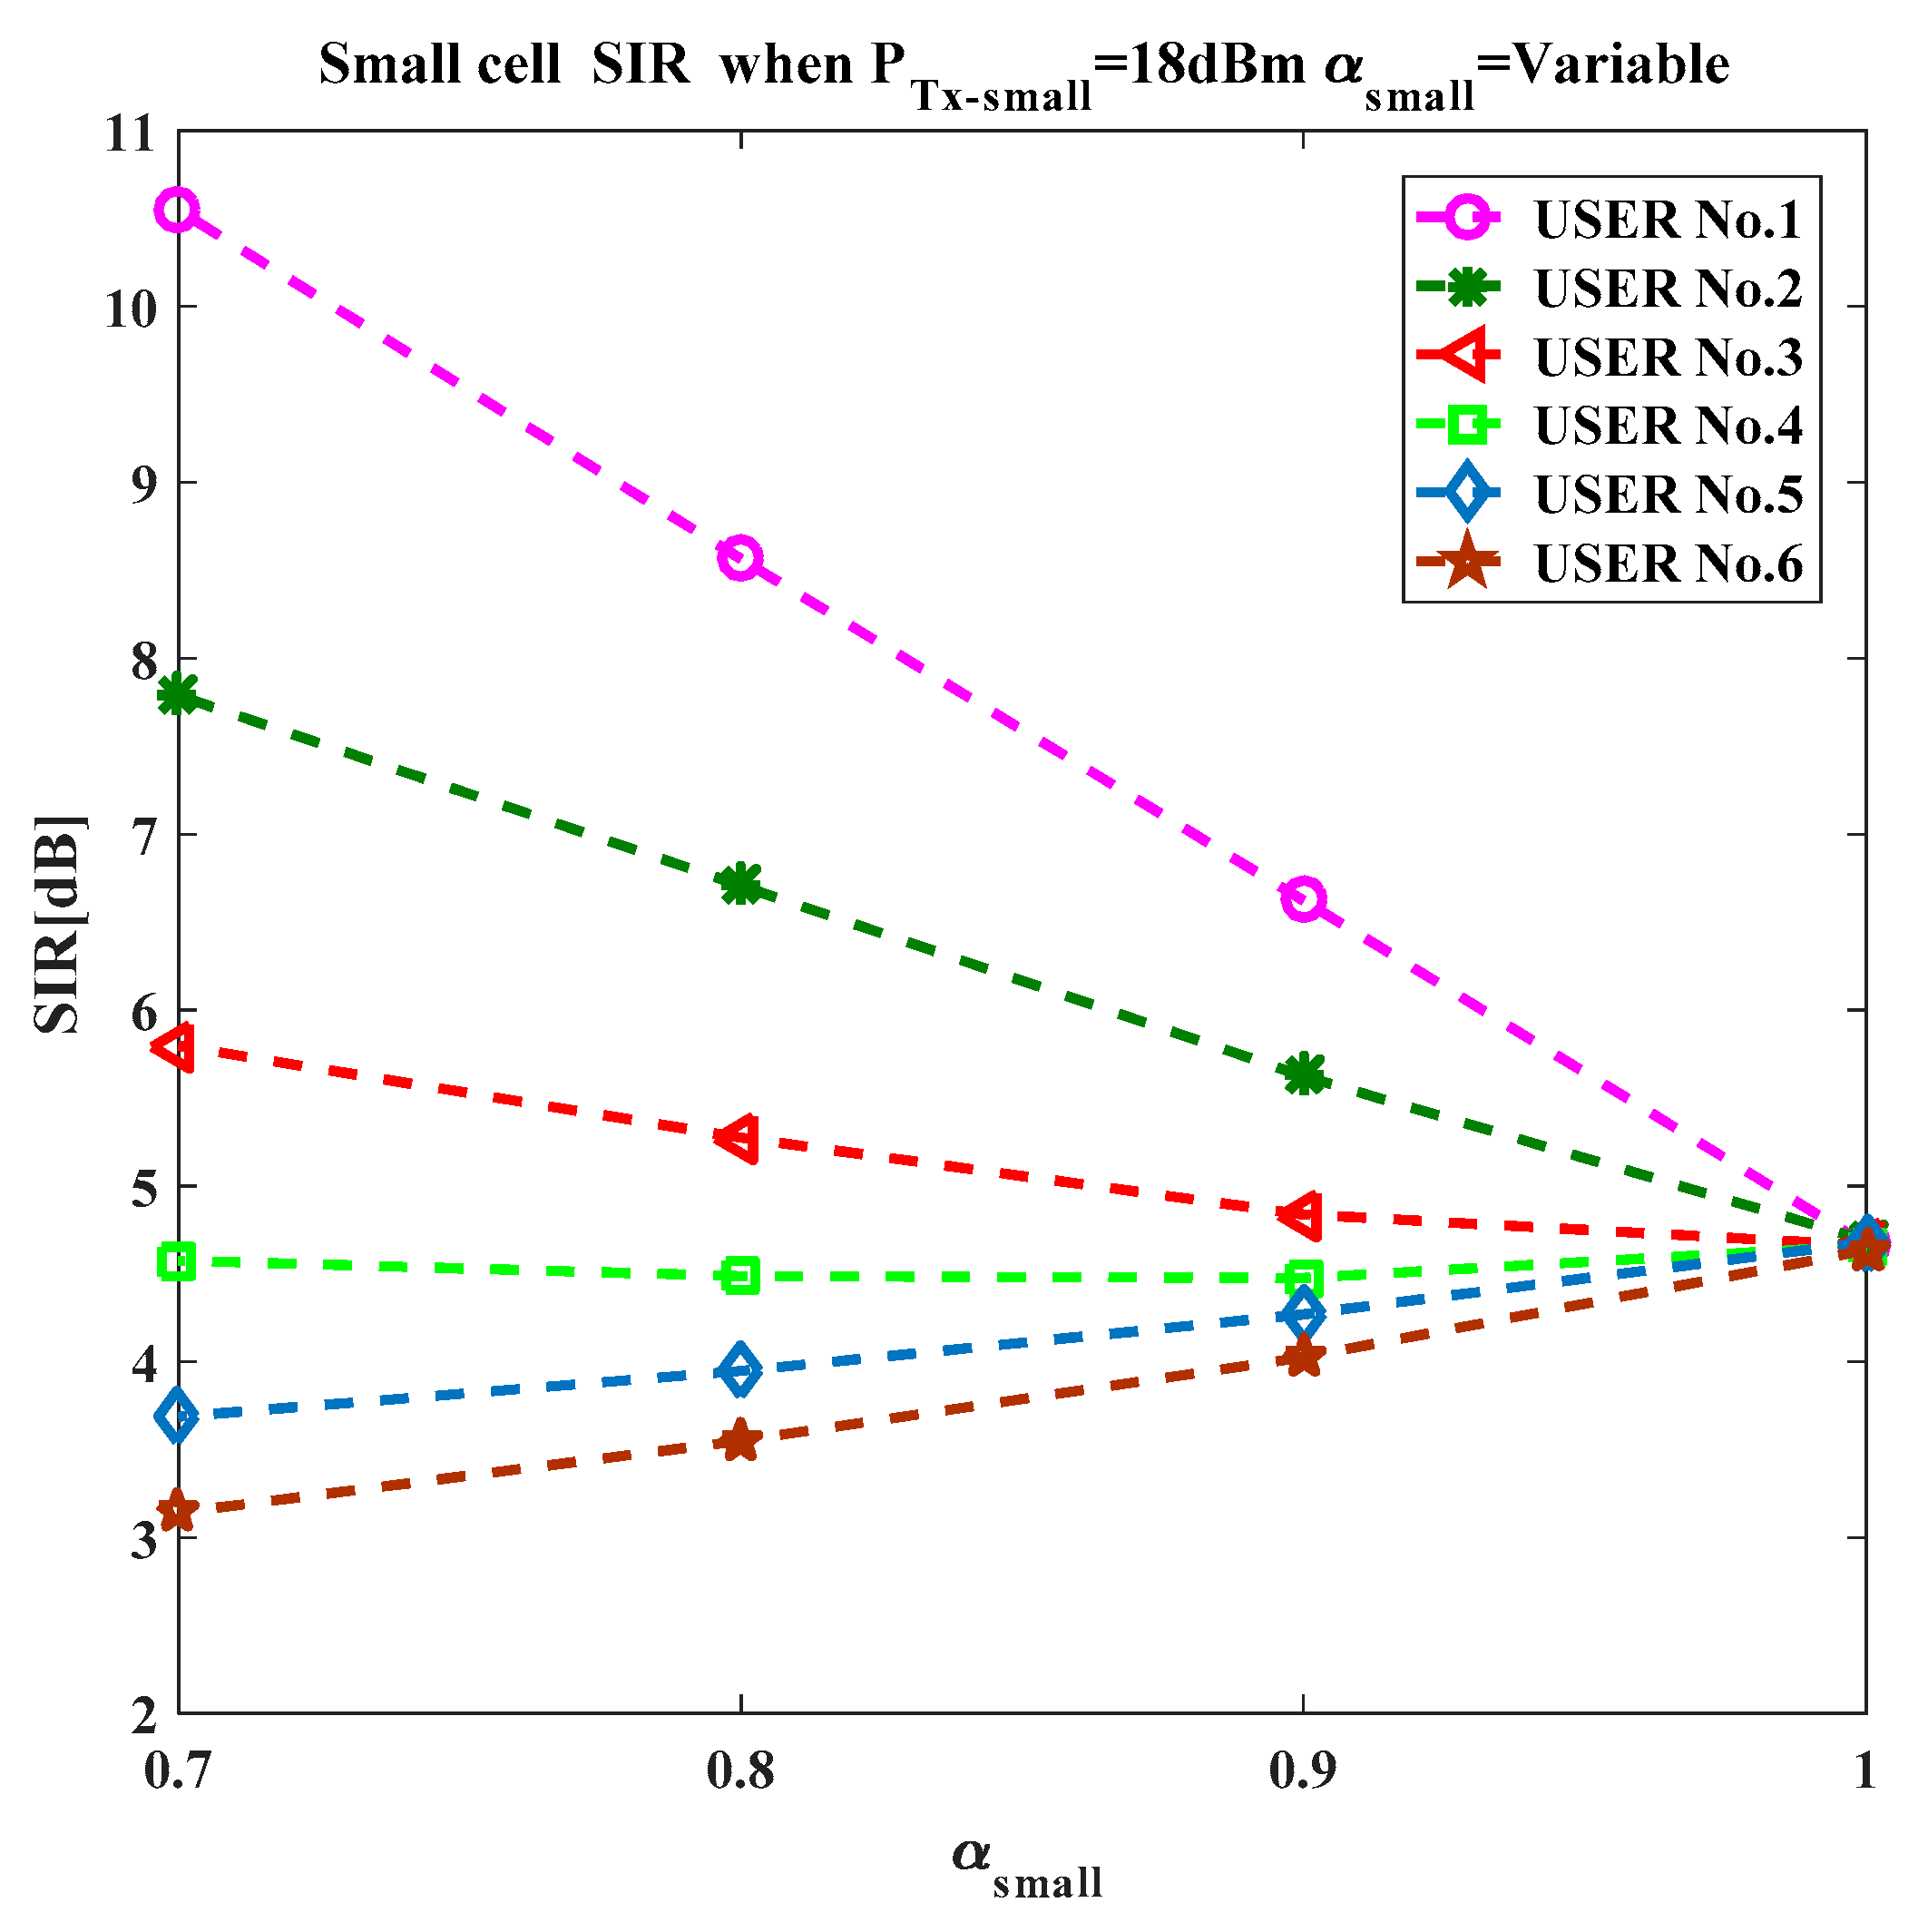
Secondly, a uniform small cell deployment was considered by adopting similar conditions as in the macro cell case. The cell size reduction resulted in an increase in the interference level, as the interfering UE come closer to each other. It can be seen in Figure 7 that the performance for all UE was degraded compared to Figure 5. This indicates that the network interference was more dominant. For lower value of αsmall, the UE near the eNodeB could not achieve enough SIR gain while the cell edge UE suffered from a significant degradation in the SIR. Therefore, it was proposed not to employ the FPC, but the full pathloss compensation in the small cell environment instead [25].
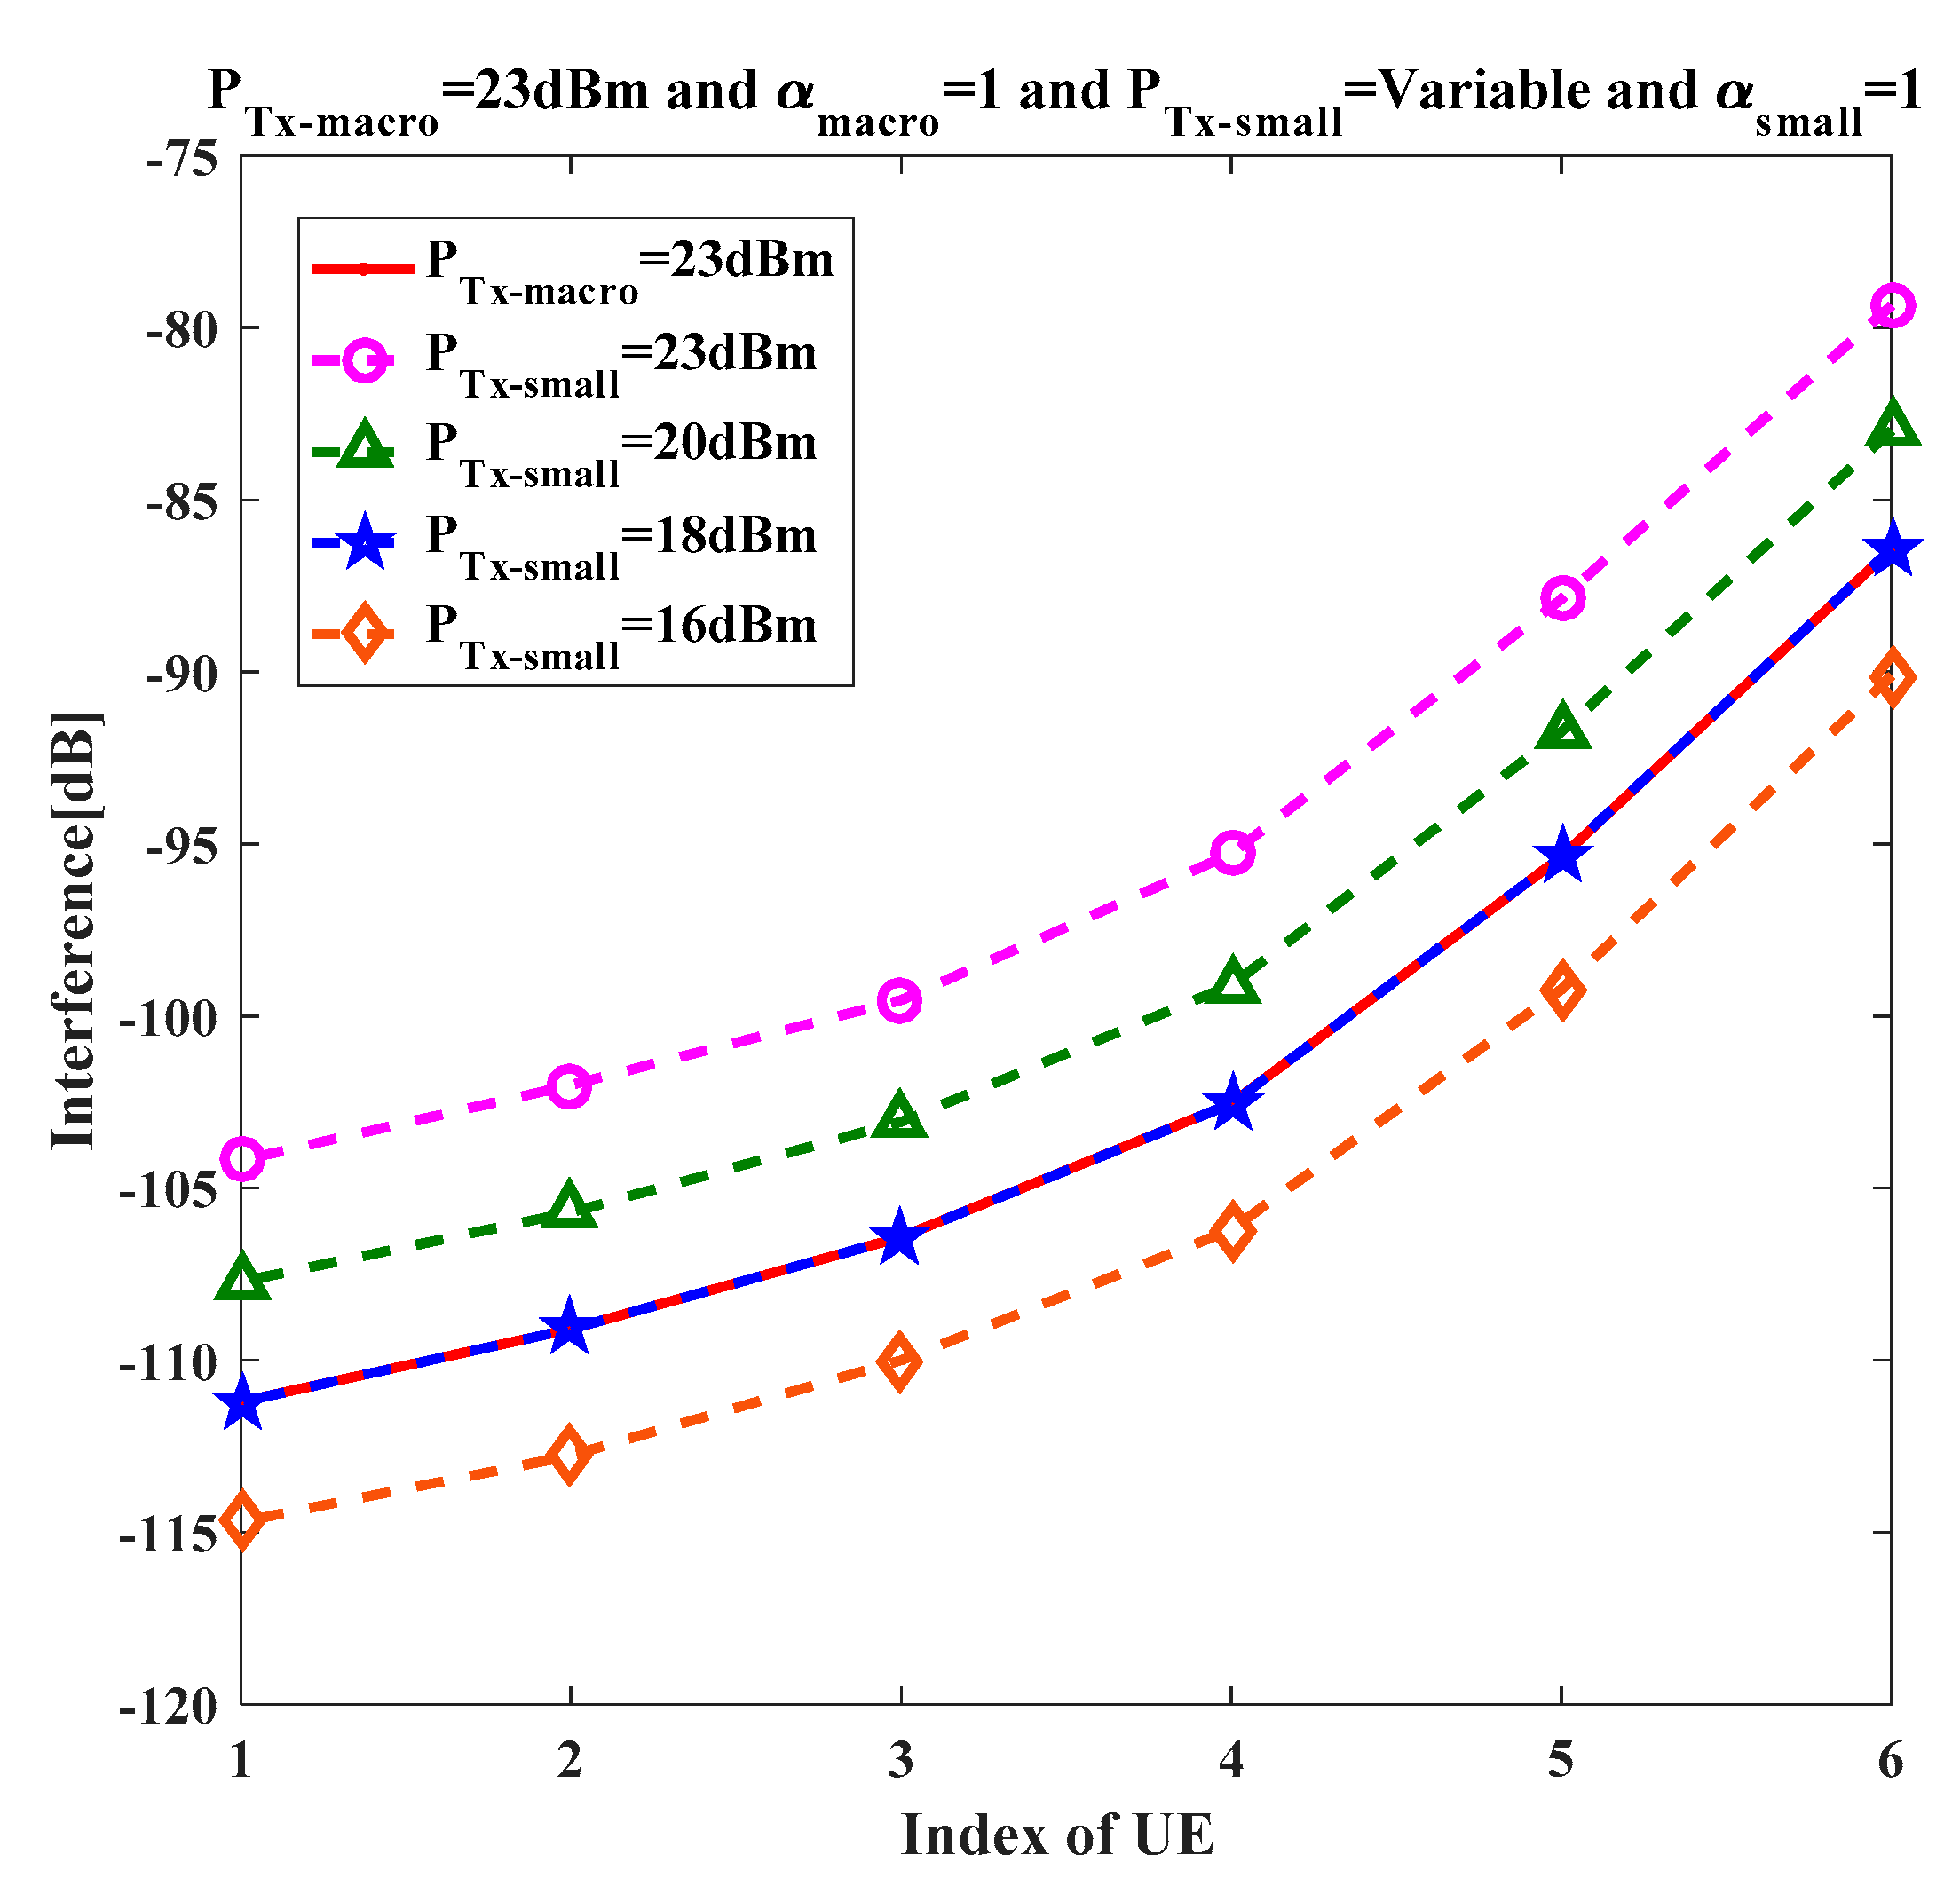
To see the impact of Pmax on the interference generation, Equation (10) was plotted in Figure 8 for both macro and small cell cases. For the small cell case, Pmax = 23 dBm resulted in a very significant increase in interference compared to the macro cell case. The target was to find the Pmax limit which resulted in almost similar received SIR performance as compared to the uniform macro cell deployment with Pmax = 23 dBm. The maximum transmit power for the small cell was varied so that the same interference level as the macro cell could be achieved. Figure 8 shows that a decrease in Pmax resulted in a decrease in the interference. At Pmax = 18 dBm, the received SIR for the small cell was almost similar to that achieved in the macro cell case, as depicted in Figure 9. This justifies our intention of reconsidering the Pmax for the small cell case and not adopting the same value as that adopted in the macro cell case.
Also, it is interesting to note from comparing Figure 5 and Figure 9 that with the FPC, the SIR performance in the case of small cells with Pmax = 18 dBm showed a similar pattern with that in the macro cell case in Figure 5, which suggests that the FPC can be adopted in small cells as well. A comparison between Figure 7 and Figure 9 clearly supports our argument that the FPC mode with Pmax = 18 dBm showed much better performance than the case in which Pmax = 23 dBm, where the cell edge as well as the cell average received SIR showed a clear difference in performance.
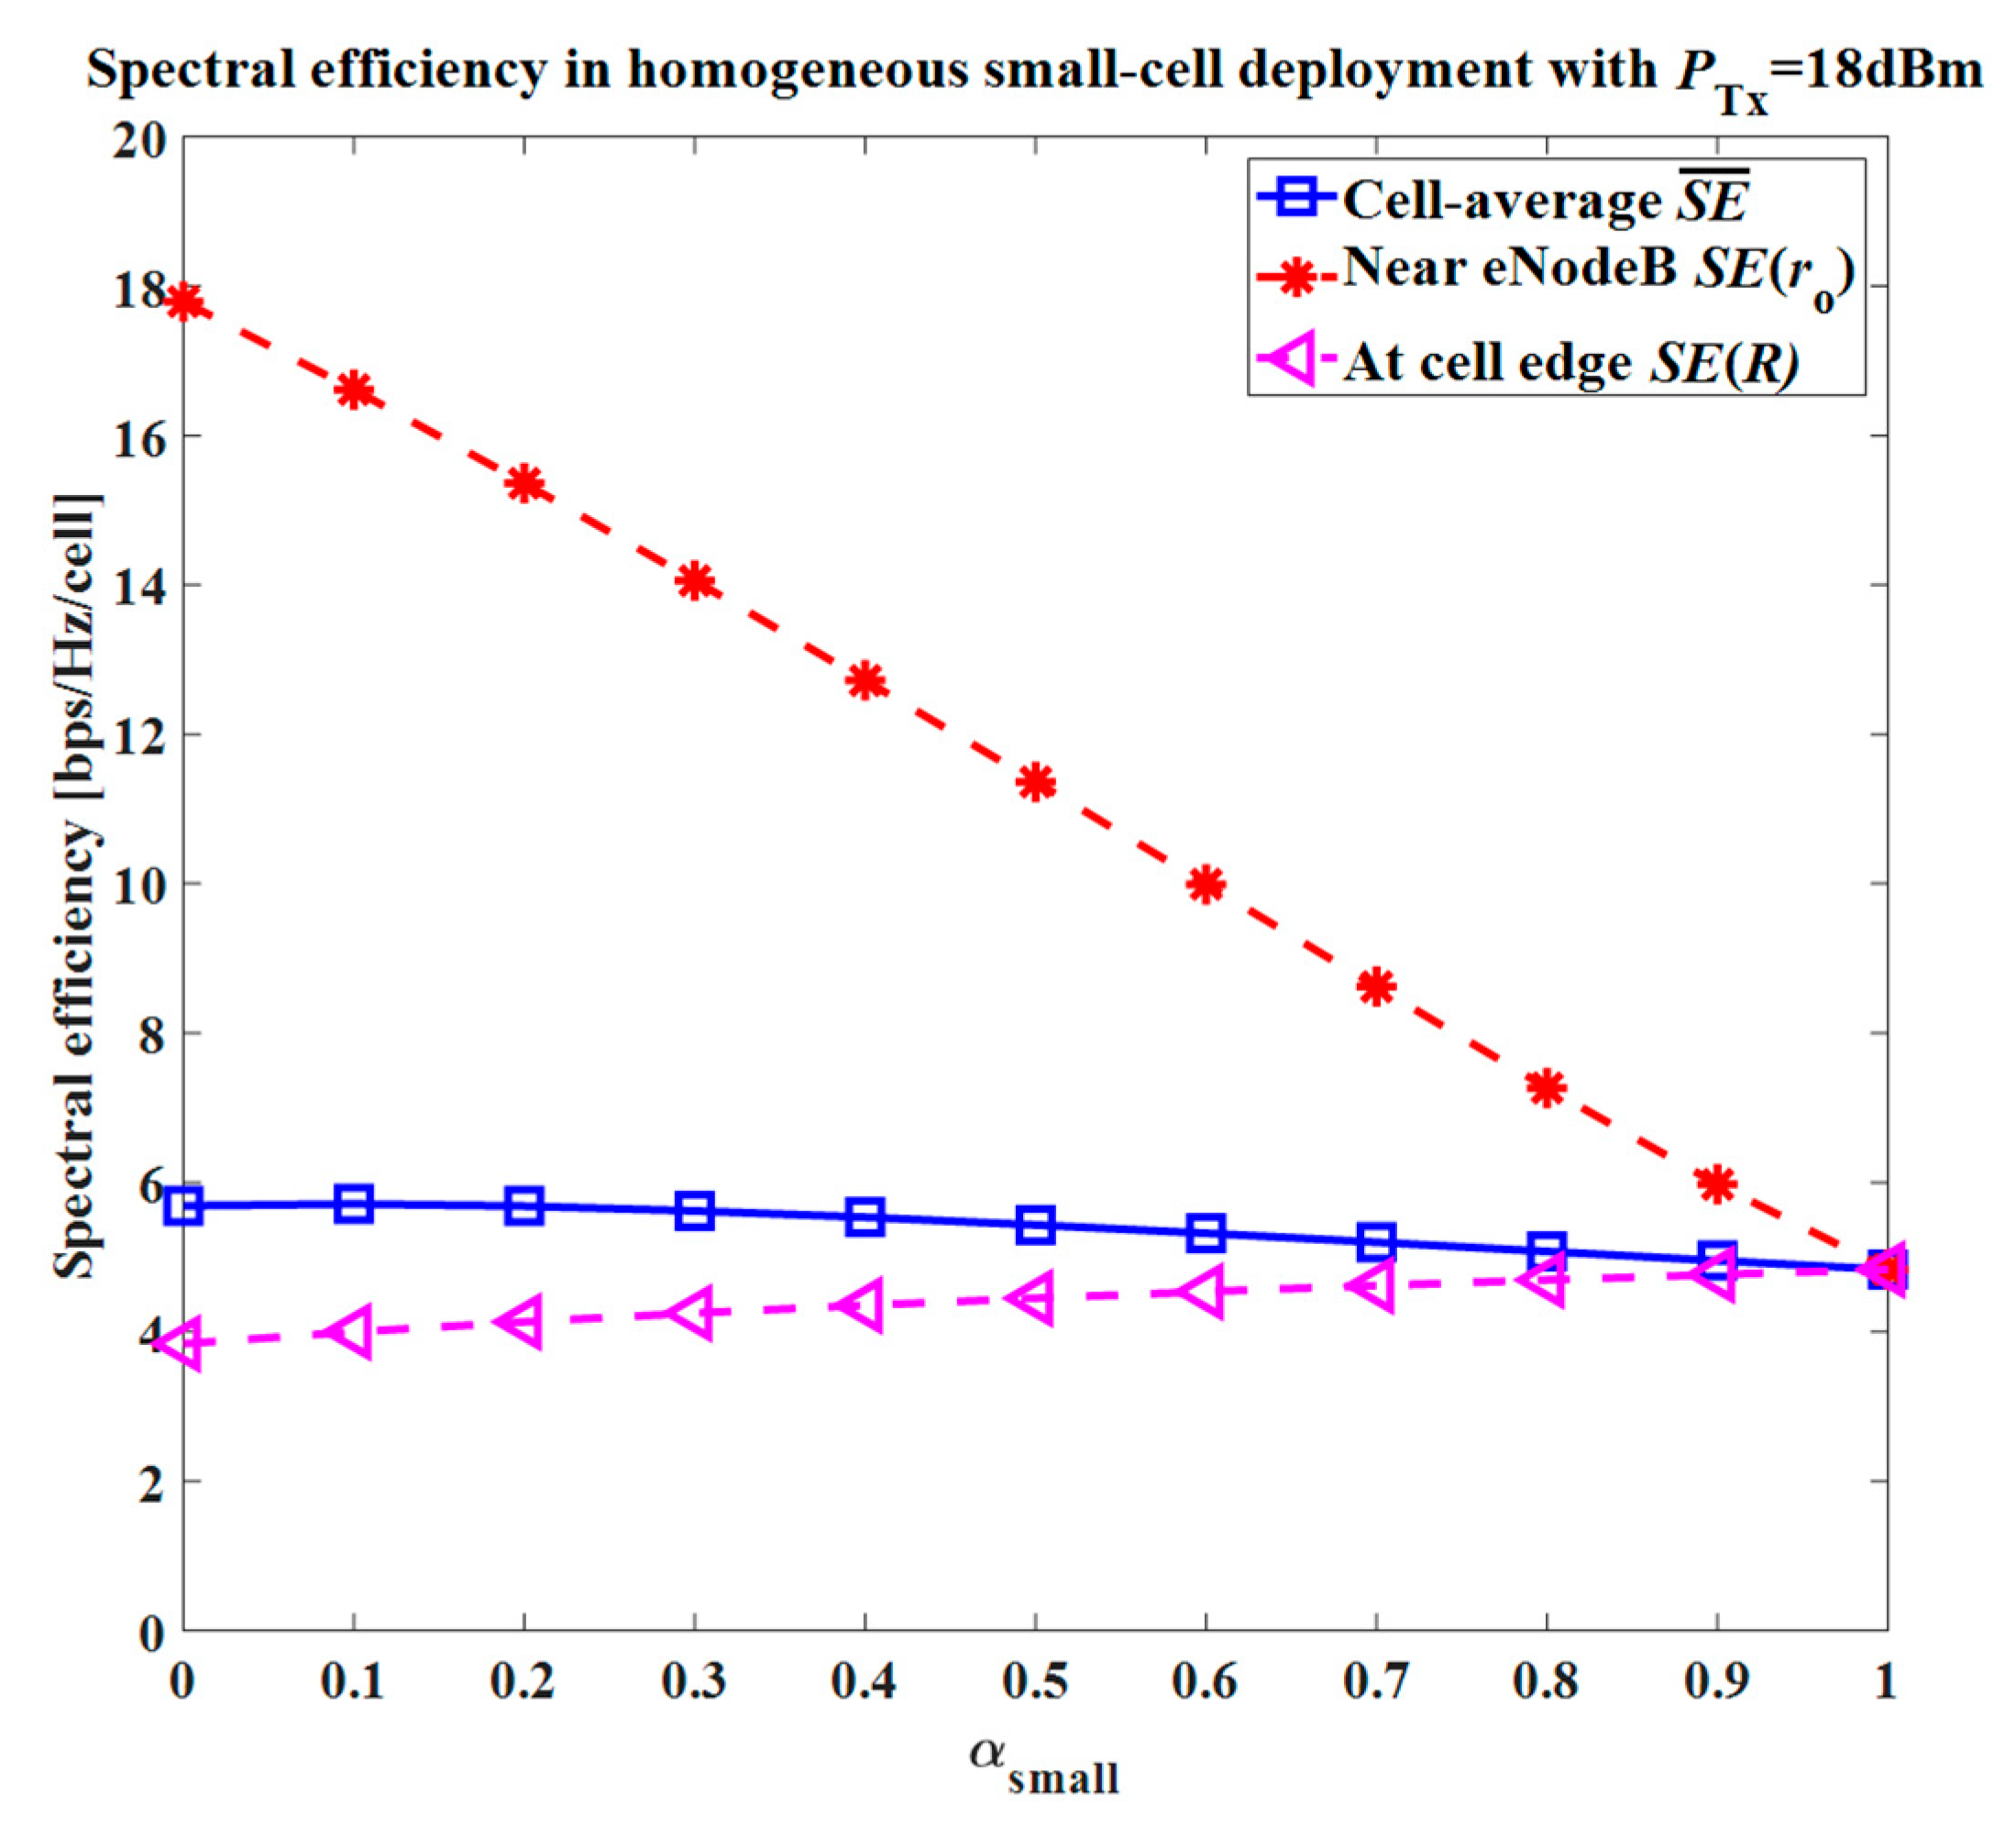
In Figure 10, the spectral efficiency for the cell average as well as for the user near the eNodeB and cell edge computed using Equation (12) and Equation (13) is presented as a function of the pathloss compensation factor αsmall. It can be seen in Figure 10, that for the users near the serving eNodeB, the spectral efficiency dropped as the pathloss compensation factor increased and for cell edge users there was an increase in the spectral efficiency. This trend was attributed to the FPC, where the cell edge user performance can be improved at the cost of a decrease in performance for users near the cell center. The average spectral efficiency showed a slight decrease as the αsmall value approached from 0 to 1. From this trend, we can infer that the FPC mode can be adopted in small cells with a slight trade-off between the cell-average and cell-edge UE performance. The above analysis suggests that for the case with the small cells, the Pmax level must be kept to 18 dBm instead of 23 dBm, and the FPC mode can be employed instead of the full compensation mode since it shows a significant improvement in the network performance.
4.2. HetNet Deployment with Uniformly Distributed Small Cells
In this section, the performance analysis for the first HetNet deployment scenario is presented. Uniform macro/small cell deployments in above section were considered as reference cases. From Figure 2, it is clear that there were two interfering rings of small cells around the central small cell. The Pmax limit was varied for the small cell uplink from 16 dBm to 23 dBm. The target was to find the Pmax value which resulted in the same SIR value as compared to the uniform macro cell deployment with Pmax = 23 dBm and uniform small cell deployment with Pmax = 18 dBm.
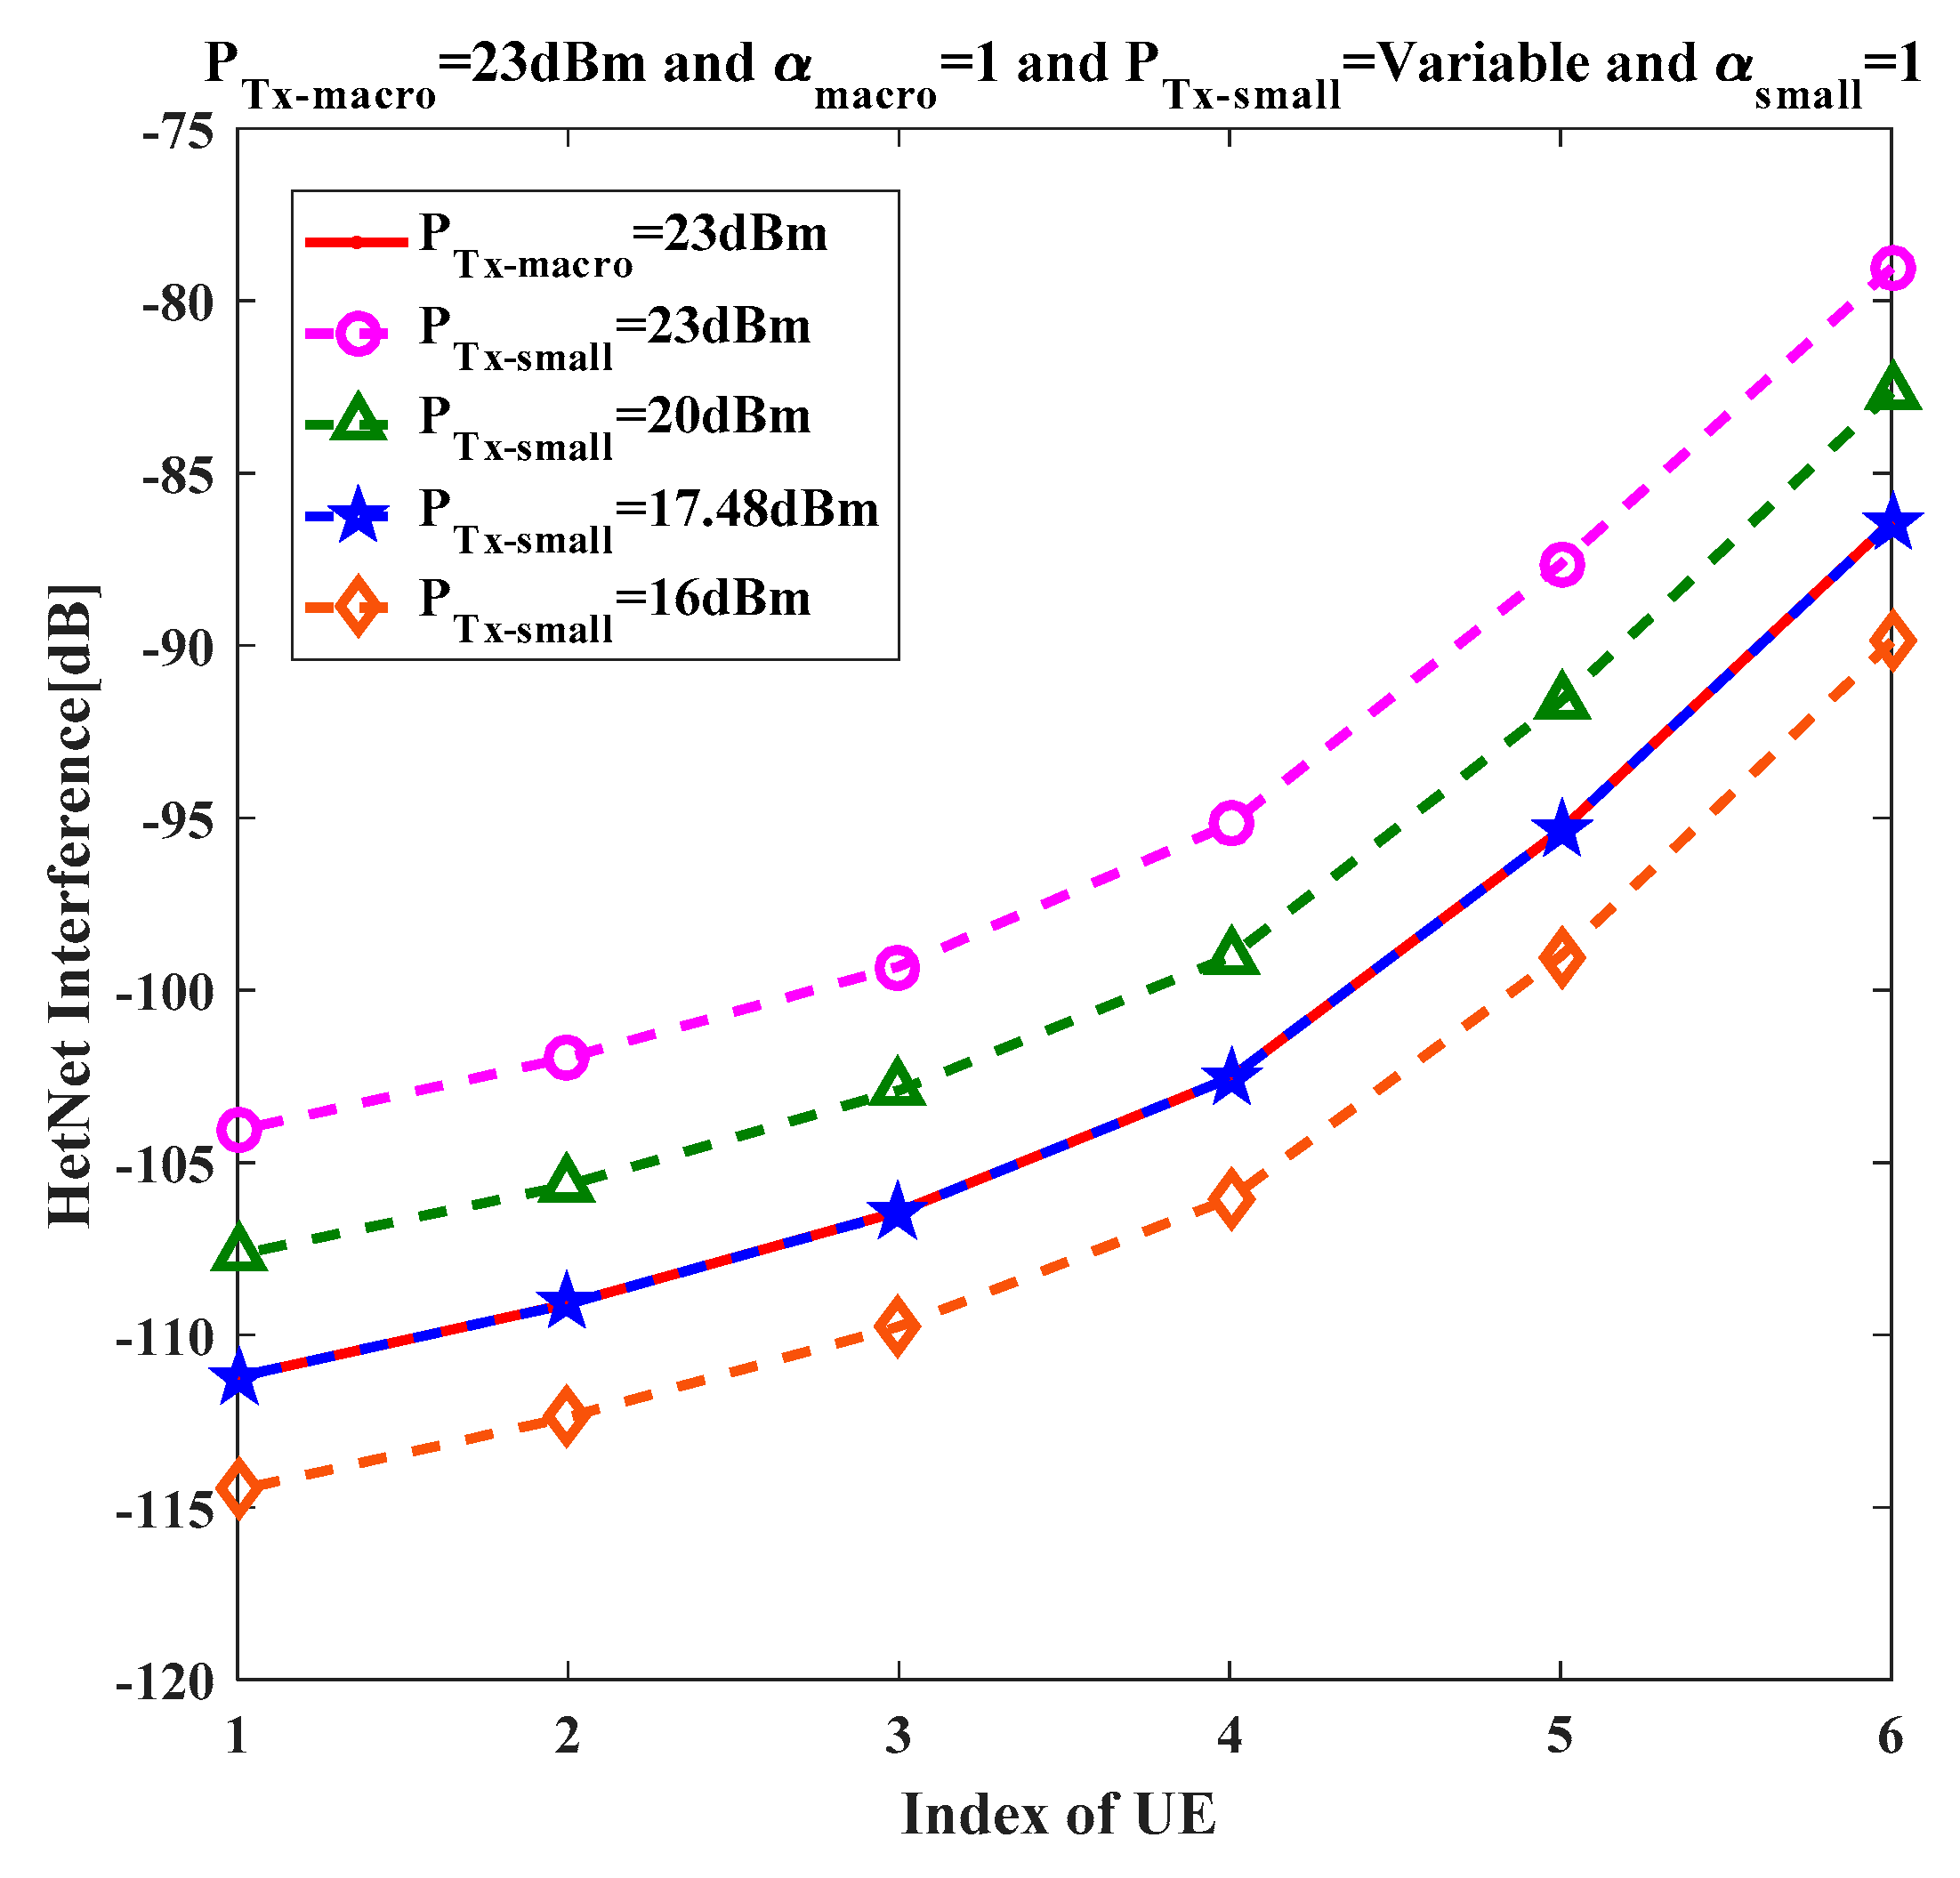
To see the result of interference offered to the central small cell from the interfering rings as well as the macro cells, Equation (19) was plotted in Figure 11. It can be observed that the interference was slightly increased as compared to Figure 8 due to the addition of macro cell interference. However, the interference from the small cells was dominant as compared to the macro cell interference. The macro cell interference was lower, as the major interference was only from the macro cell containing the small cells. The neighboring macro cells were at 5R from the central small cell eNodeB; therefore, their interference had a minor impact on the central small cell. In Figure 11, it can be clearly seen that for small cells, Pmax = 17.48 dBm corresponded to the same interference level as compared to the reference cases with Pmax = 23 dBm and Pmax = 18 dBm in uniformly distributed macro and homogenous small cell deployments, respectively.
To see the impact of increased interference and decreased Pmax value, received SIR was obtained in Figure 12 using Equation (20). The trend with an increase in αsmall can be observed clearly for the UE near eNodeB (i.e., UE with the index 1); the received SIR decreased from 10.53 dB to 4.5 dB. Compared to Figure 5, the received SIR showed a loss of 0.17 dB and a gain of 0.3 dB for αsmall = 0.7 and αsmall = 1, respectively.
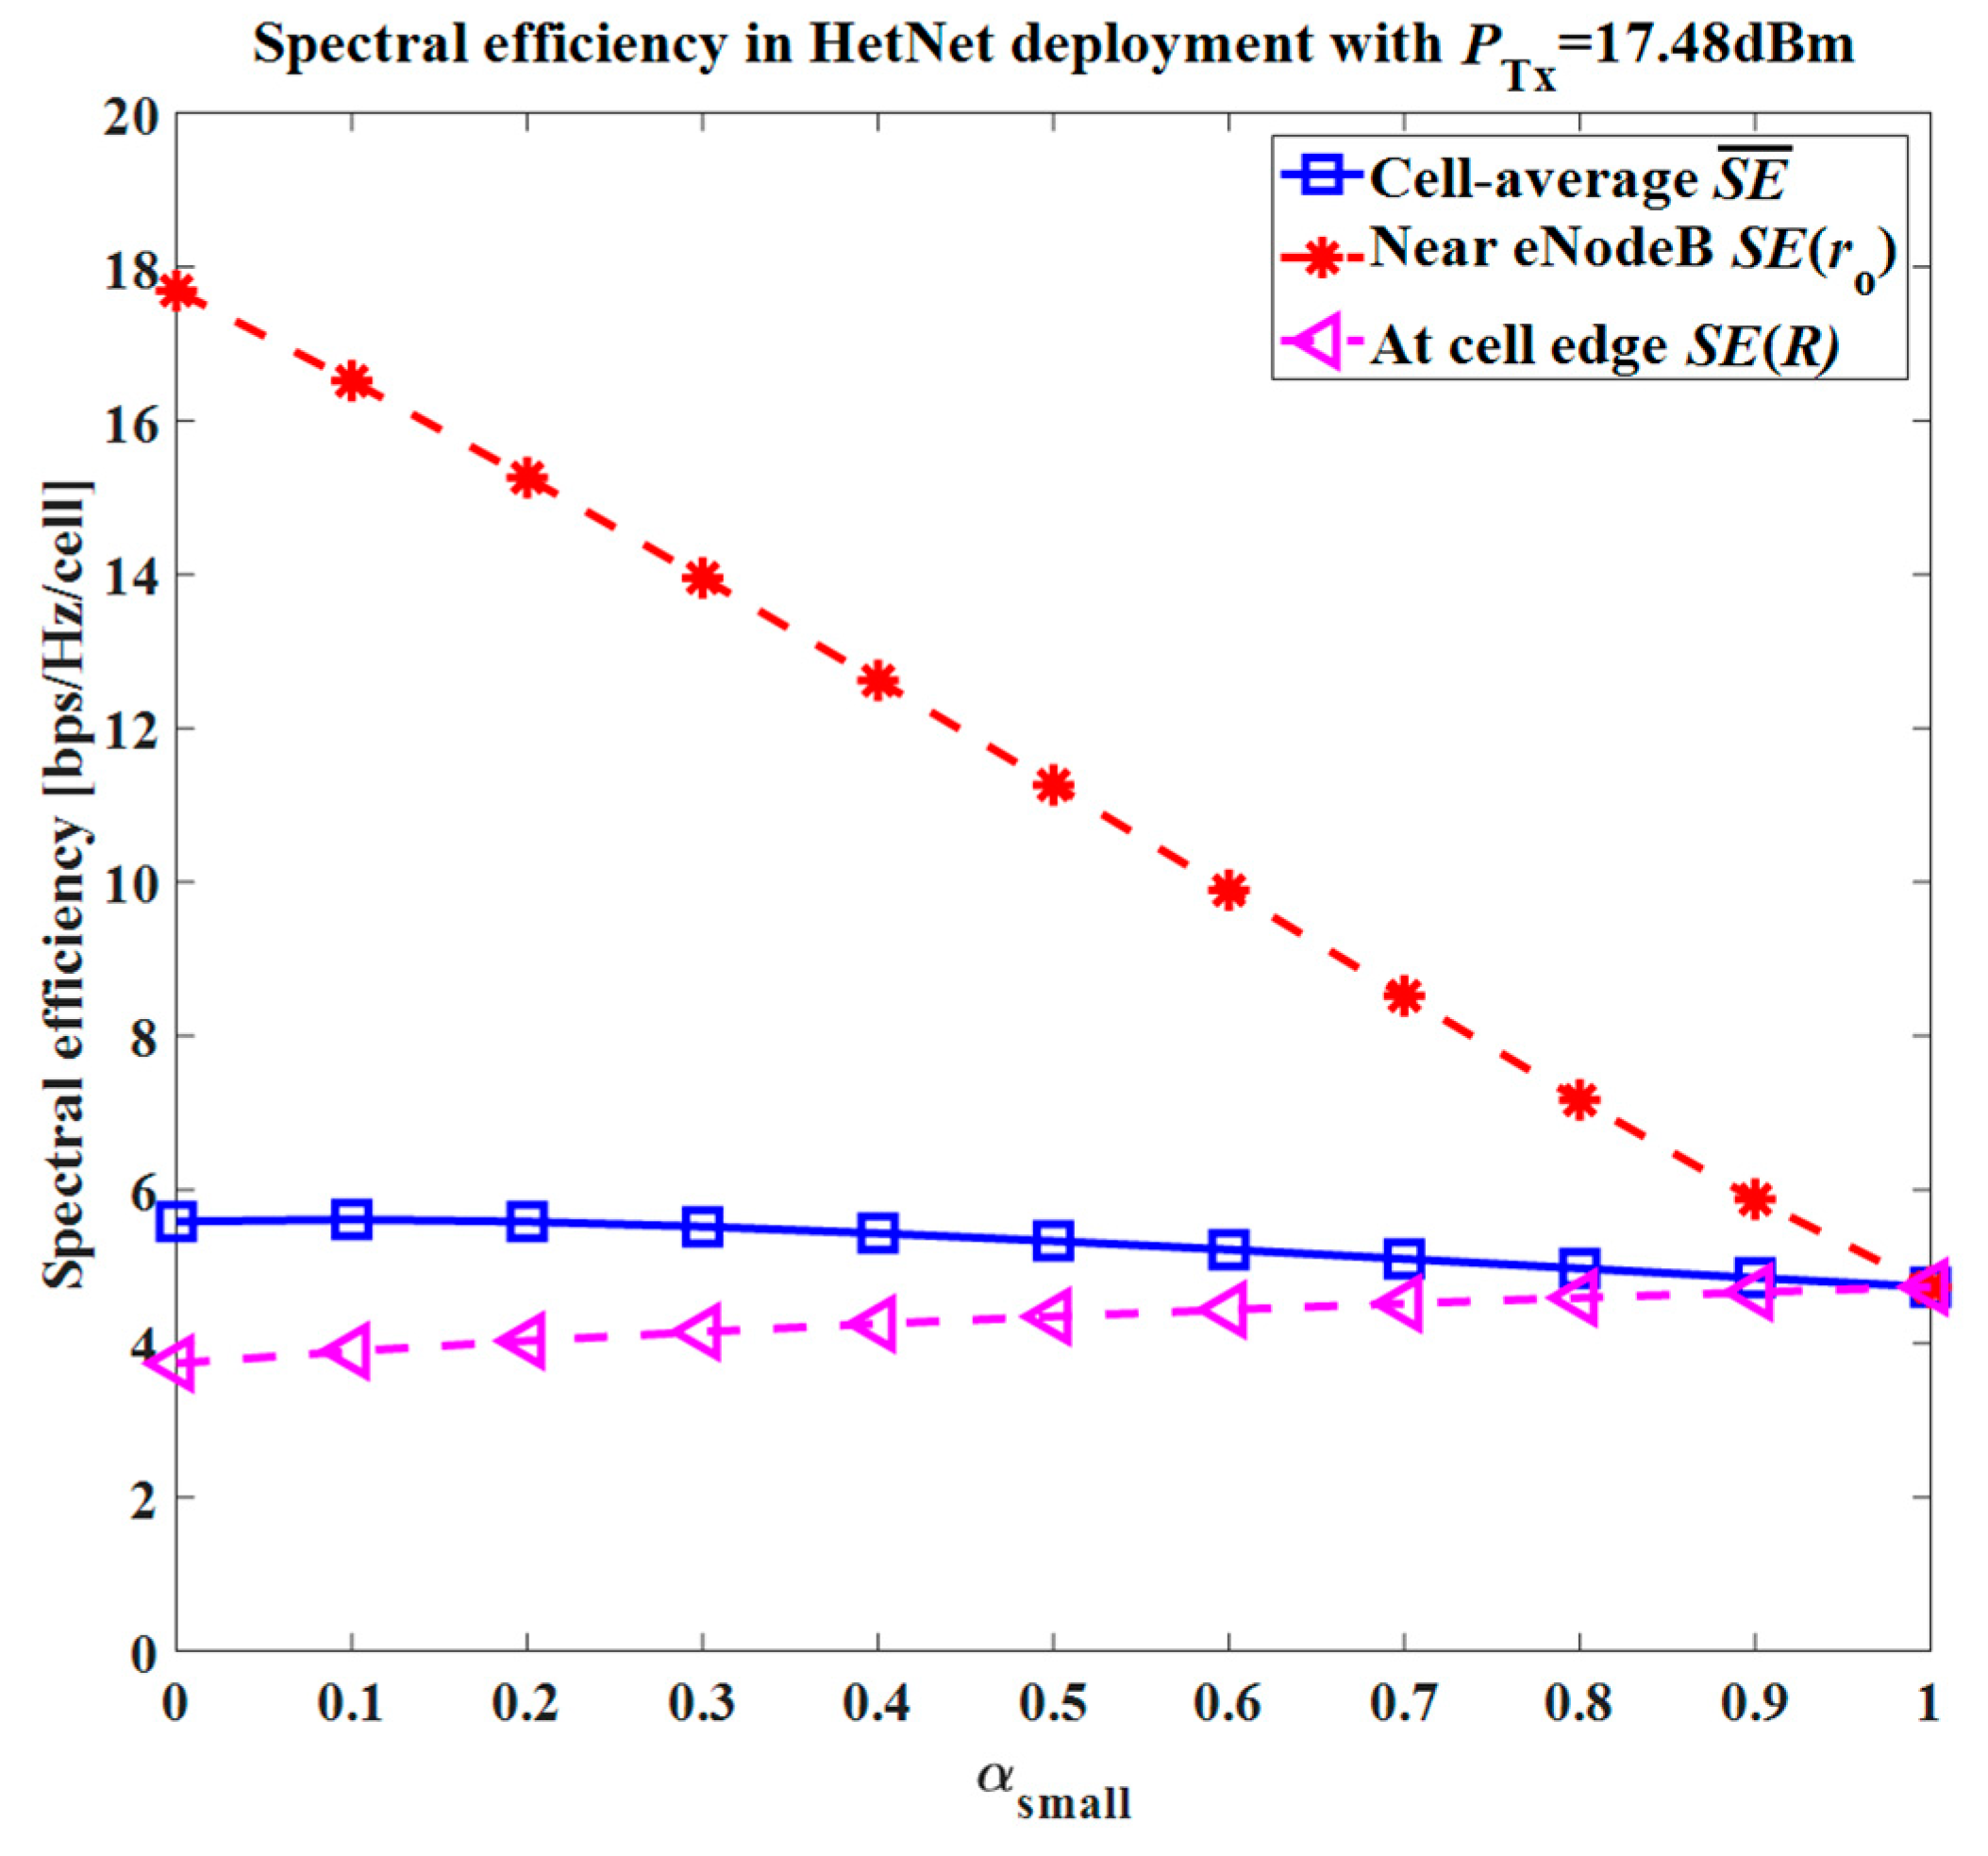
Similarly, compared to Figure 9, the received SIR loss was 0.03 dB and 0.15 dB for αsmall = 0.7 and αsmall = 1, respectively. Meanwhile, for the UE near the cell edge (i.e., UE with the index 6), the received SIR improved from 3.15 dB to 4.5 dB. The received SIR compared to Figure 5 showed a loss of 0.05 dB and a gain of 0.3 dB, for αsmall = 0.7 and αsmall = 1, respectively. While the loss compared to Figure 9 was 0.05 dB and 0.15 dB. Like the previous section, the lower value of αsmall resulted in a better SIR for the UE near the eNodeB, while the UE near the cell edge suffered from degradation in received SIR and vice versa. Also, the results support our argument of adopting FPC instead of full compensation in the small cell uplink in a HetNet environment with a reduced Pmax value, as the comparison of Figure 7 with Figure 12 showed a clear gain in received SIR by adopting FPC. This trend can be validated further by comparing the spectral efficiency in Figure 10 with Figure 13, where the reduced Pmax value in small cells had a negligible impact on the small cell UE’s performance.
4.3. HetNet Deployment with Small Cells near the Macro Cell eNodeB
In this section, the performance analysis for the second HetNet deployment scenario is presented. The uniform macro/small cell deployment described in Section 4.1 was considered as the reference case. Figure 3 shows that there was only one interfering ring of small cells around the central small cell. The Pmax value varied for the small cell uplink from 16 dBm to 23 dBm.
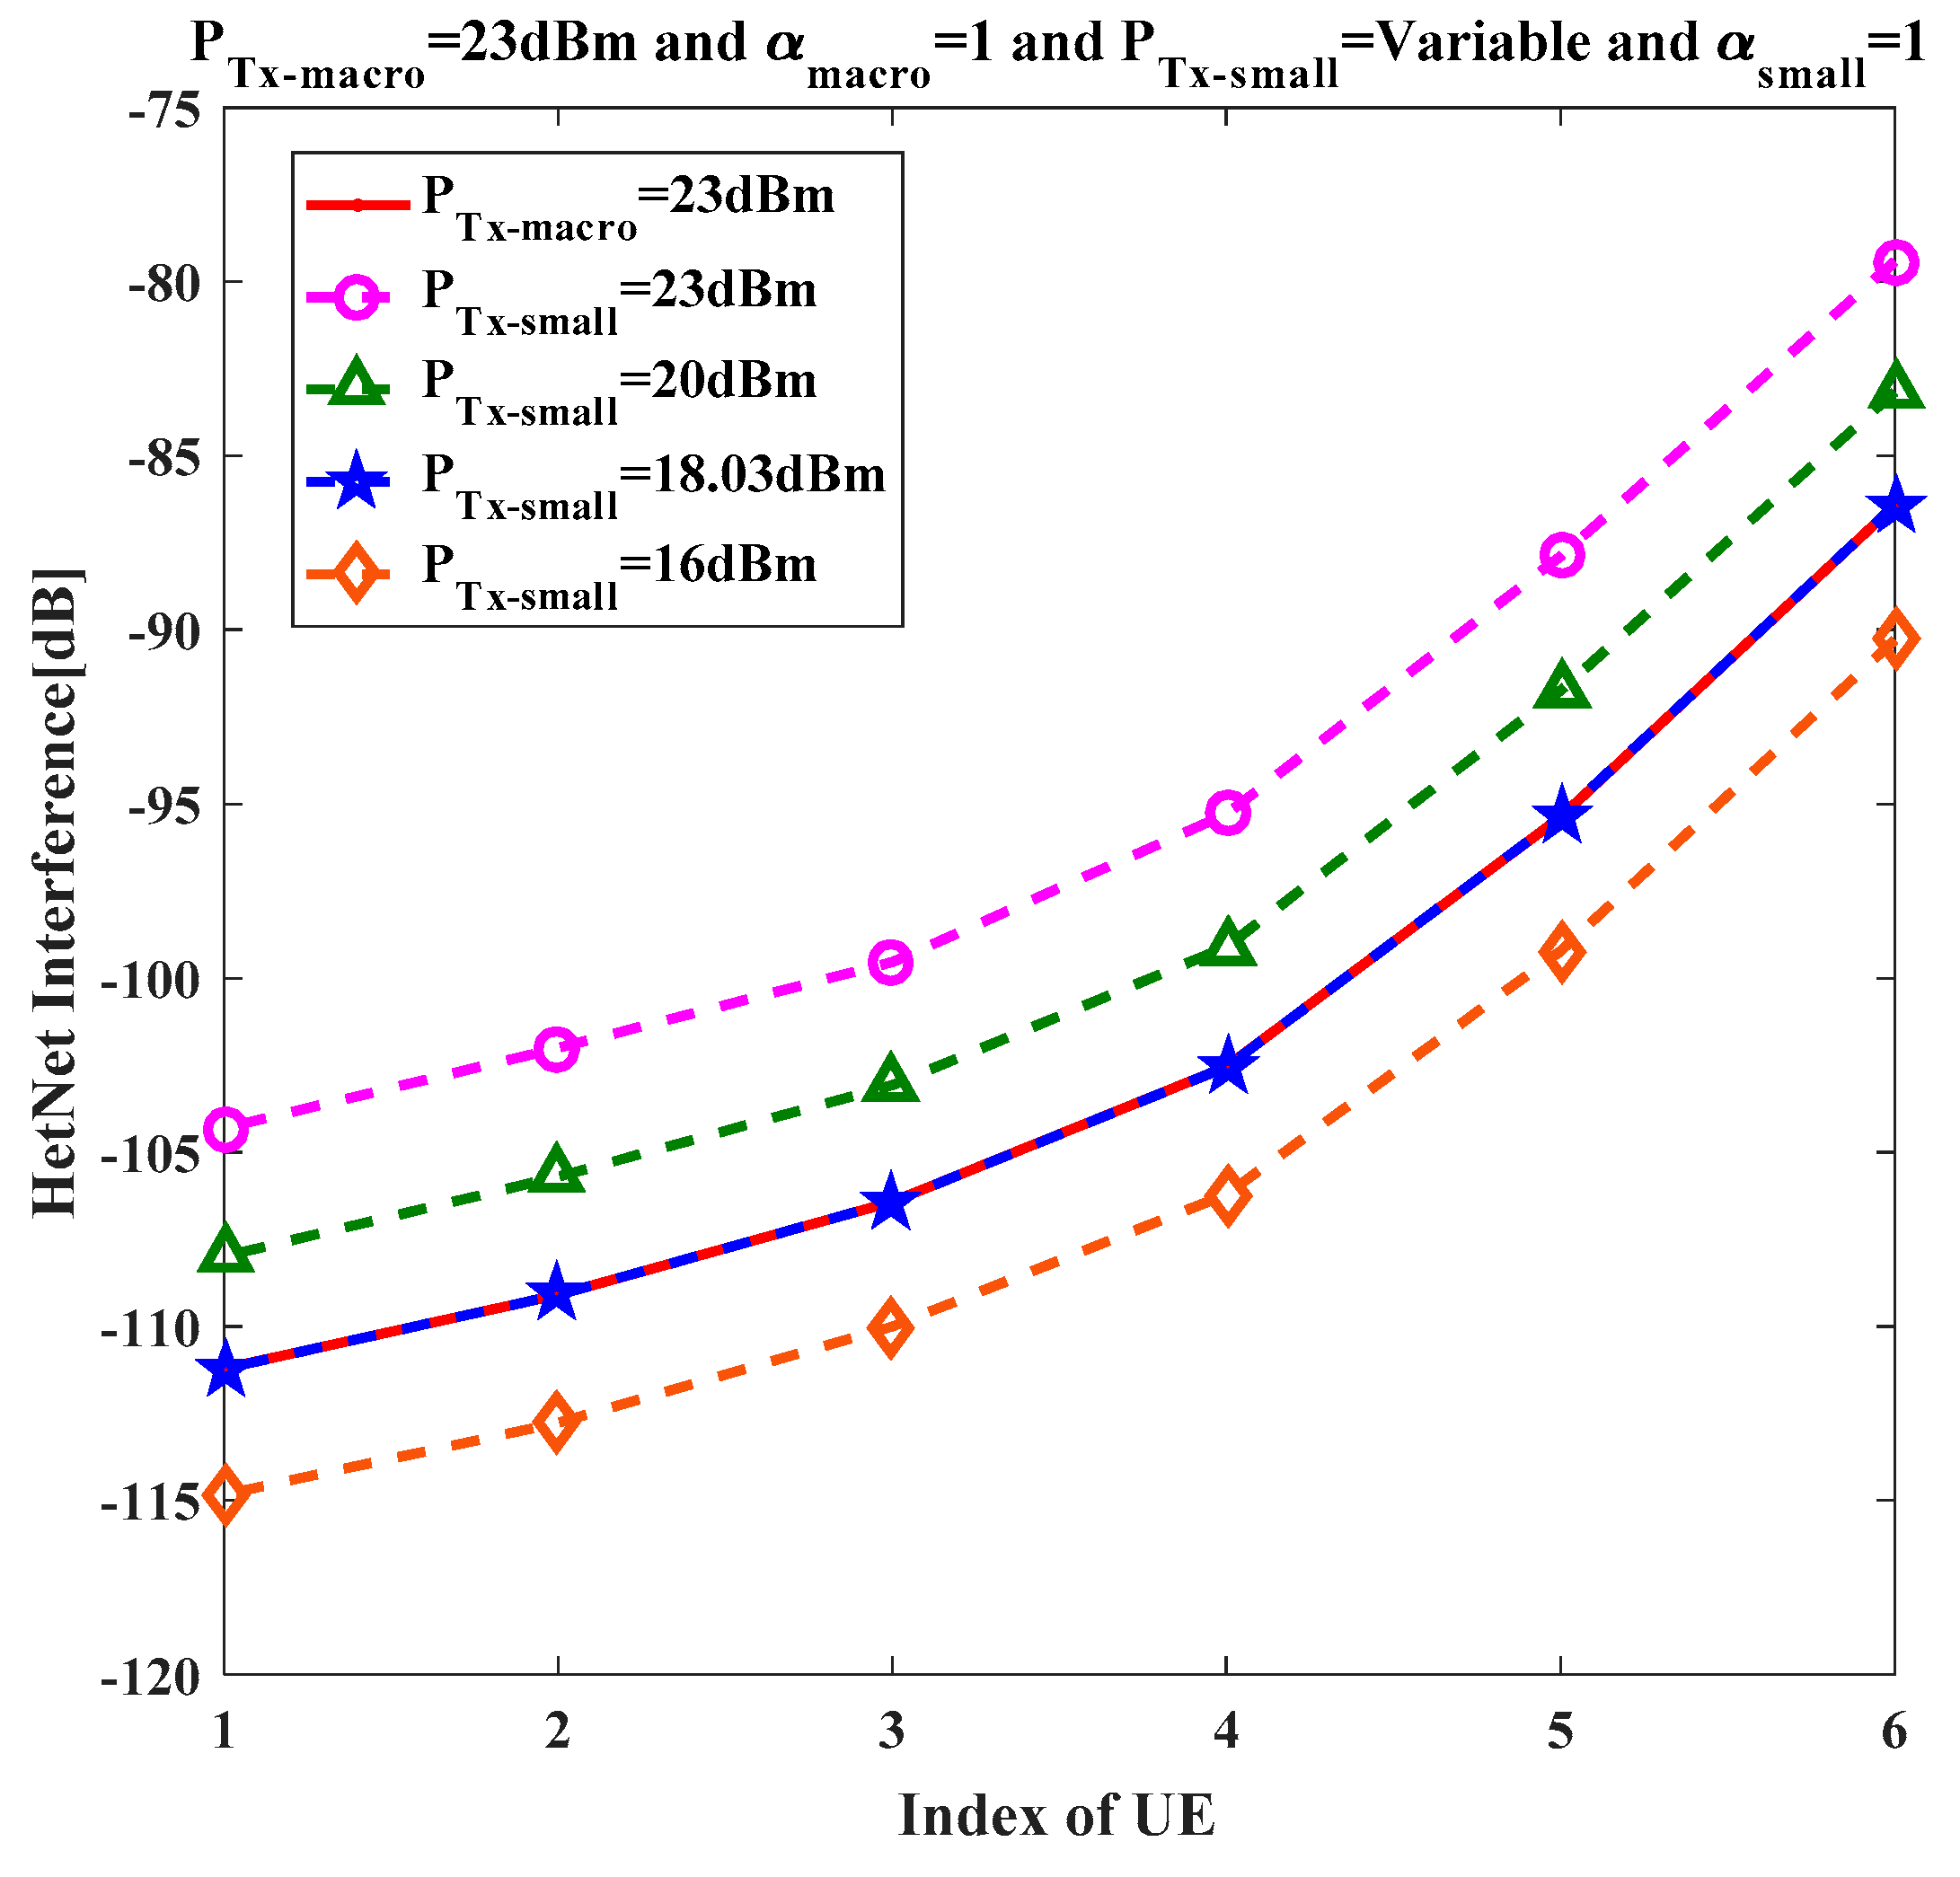
To see the results of the interference offered to the central small cell from the interfering ring as well as the macro cell, Equation (22) was plotted in Figure 14. It is observed that due to the absence of one interfering ring as compared to the previous scenario, the interference offered to the central small cell decreased. This was because the second interfering ring, which was at a distance of 4R from the central cell eNodeB, was not present. The macro cell interference was present, but the dominant interference was the one offered by the first interfering ring of small cells. By comparing Figure 8 and Figure 14, it can be observed that the interference level decreased by 0.9 dB on average. Due to the decrease in interference, the transmit power in the small cells could be increased. In Figure 14, it can clearly be seen that for the small cells, Pmax = 18.03 dBm corresponded to the same interference level as compared to the reference cases with Pmax = 23 dBm and Pmax = 18 dBm in uniformly distributed macro and homogenous small cell deployments, respectively.
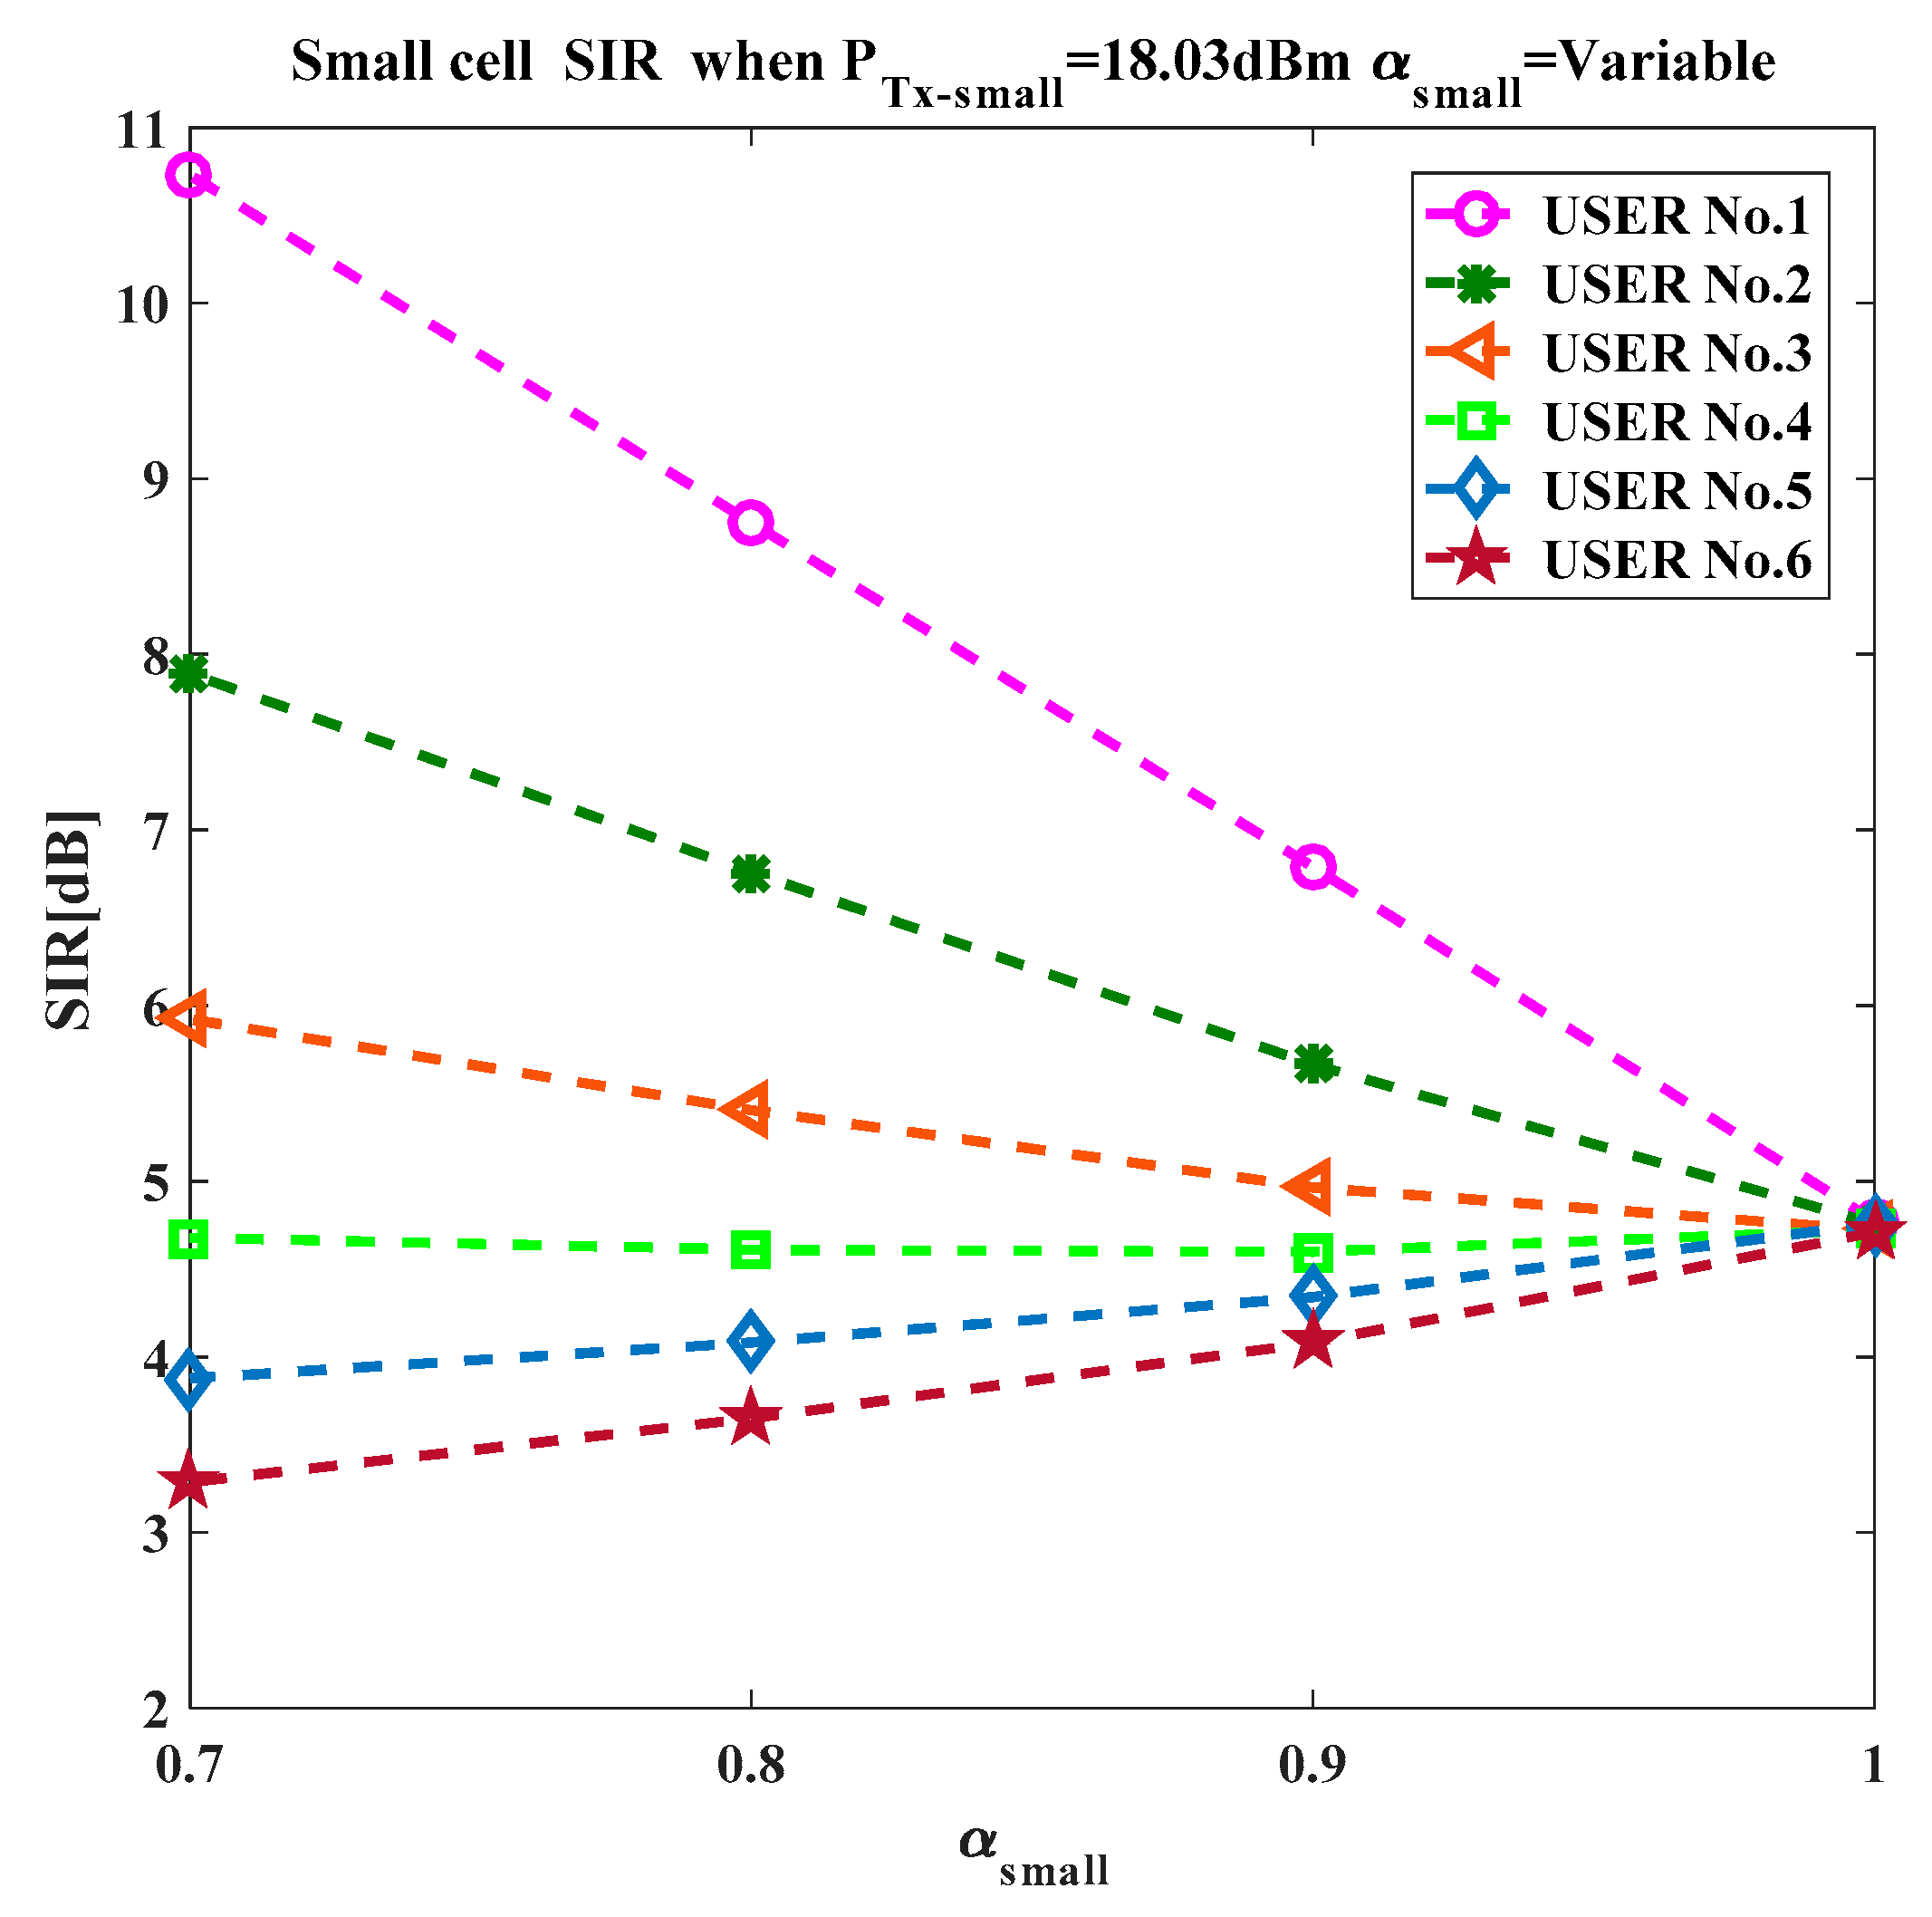
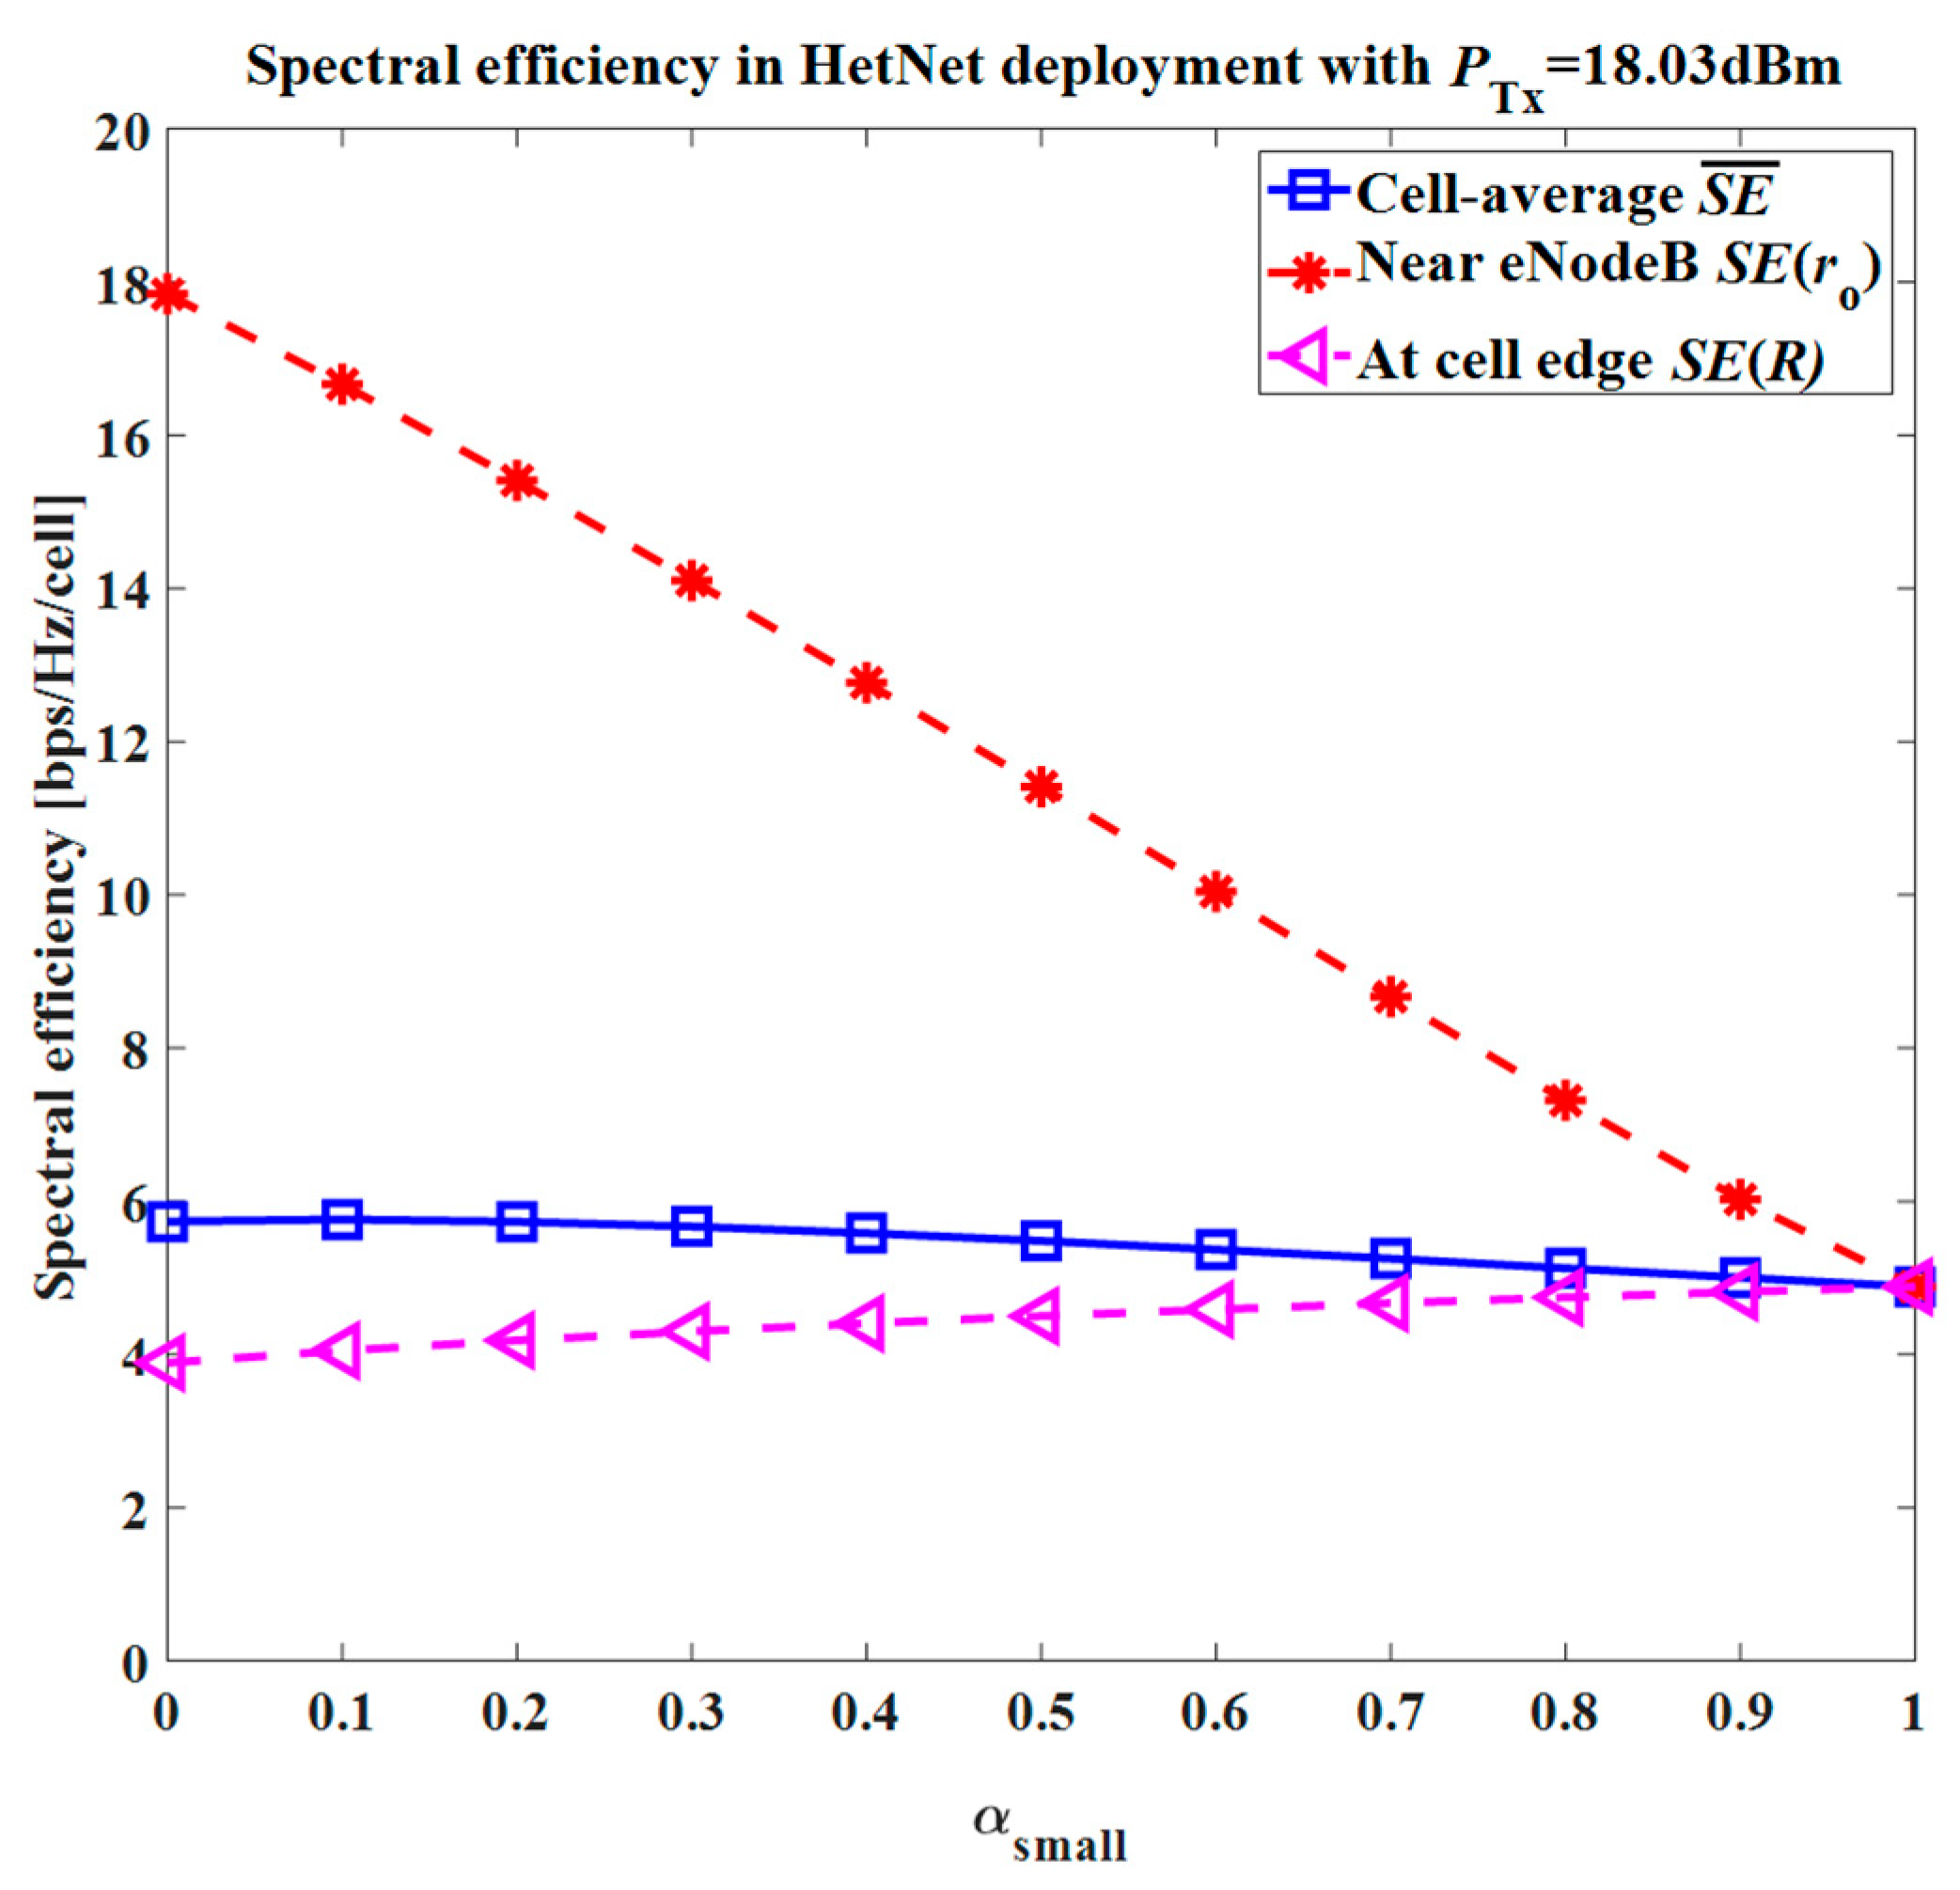
To see the results of the decreased interference and increased Pmax value, received SIR was obtained in Figure 15 using Equation (23). The trend with an increase in αsmall can be observed clearly for the UE near the eNodeB (i.e., UE with the index 1); the received SIR decreased from 10.75 dB to 4.8 dB. Compared to Figure 5, the received SIR gain was 0.05 dB and 0.6 dB for αsmall = 0.7 and αsmall = 1, respectively. Similarly, compared to Figure 9, the received SIR gain was 0.19 dB and 0.15 dB for αsmall = 0.7 and αsmall = 1, respectively. Meanwhile, for the UE near the cell edge (i.e., UE with the index 6), the received SIR improved from 3.3 dB to 4.8 dB. The received SIR gains as compared to Figure 5 were 0.1 dB and 0.6 dB, while the gains compared to Figure 9 were 0.2 dB and 0.15 dB. A slight gain in the spectral efficiency can be observed with the increased Pmax value for the HetNet deployment by comparing Figure 16 with Figure 10 and Figure 13. This gain was attributed to the fact that the received SIR was improved due to the lowered interference level, as only one interfering ring of the small cells was present in this deployment scenario.
4.4. HetNet Deployment with Small Cells near Macro Cell Edge
In this section, the performance analysis for the third HetNet deployment scenario is presented. The uniform macro/small cell deployment was considered as the reference case here as well. From Figure 4, there was only one interfering ring of small cells around the central small cell. However, the interfering ring was at the macro cell edge and at a distance 4R from the central small cell eNodeB. The Pmax value varied for the small cell uplink from 16 dBm to 23 dBm. The target was to find the Pmax value which resulted in the same SIR value as compared to the uniform macro cell deployment with Pmax = 23 dBm and a uniform small cell deployment with Pmax = 18 dBm.
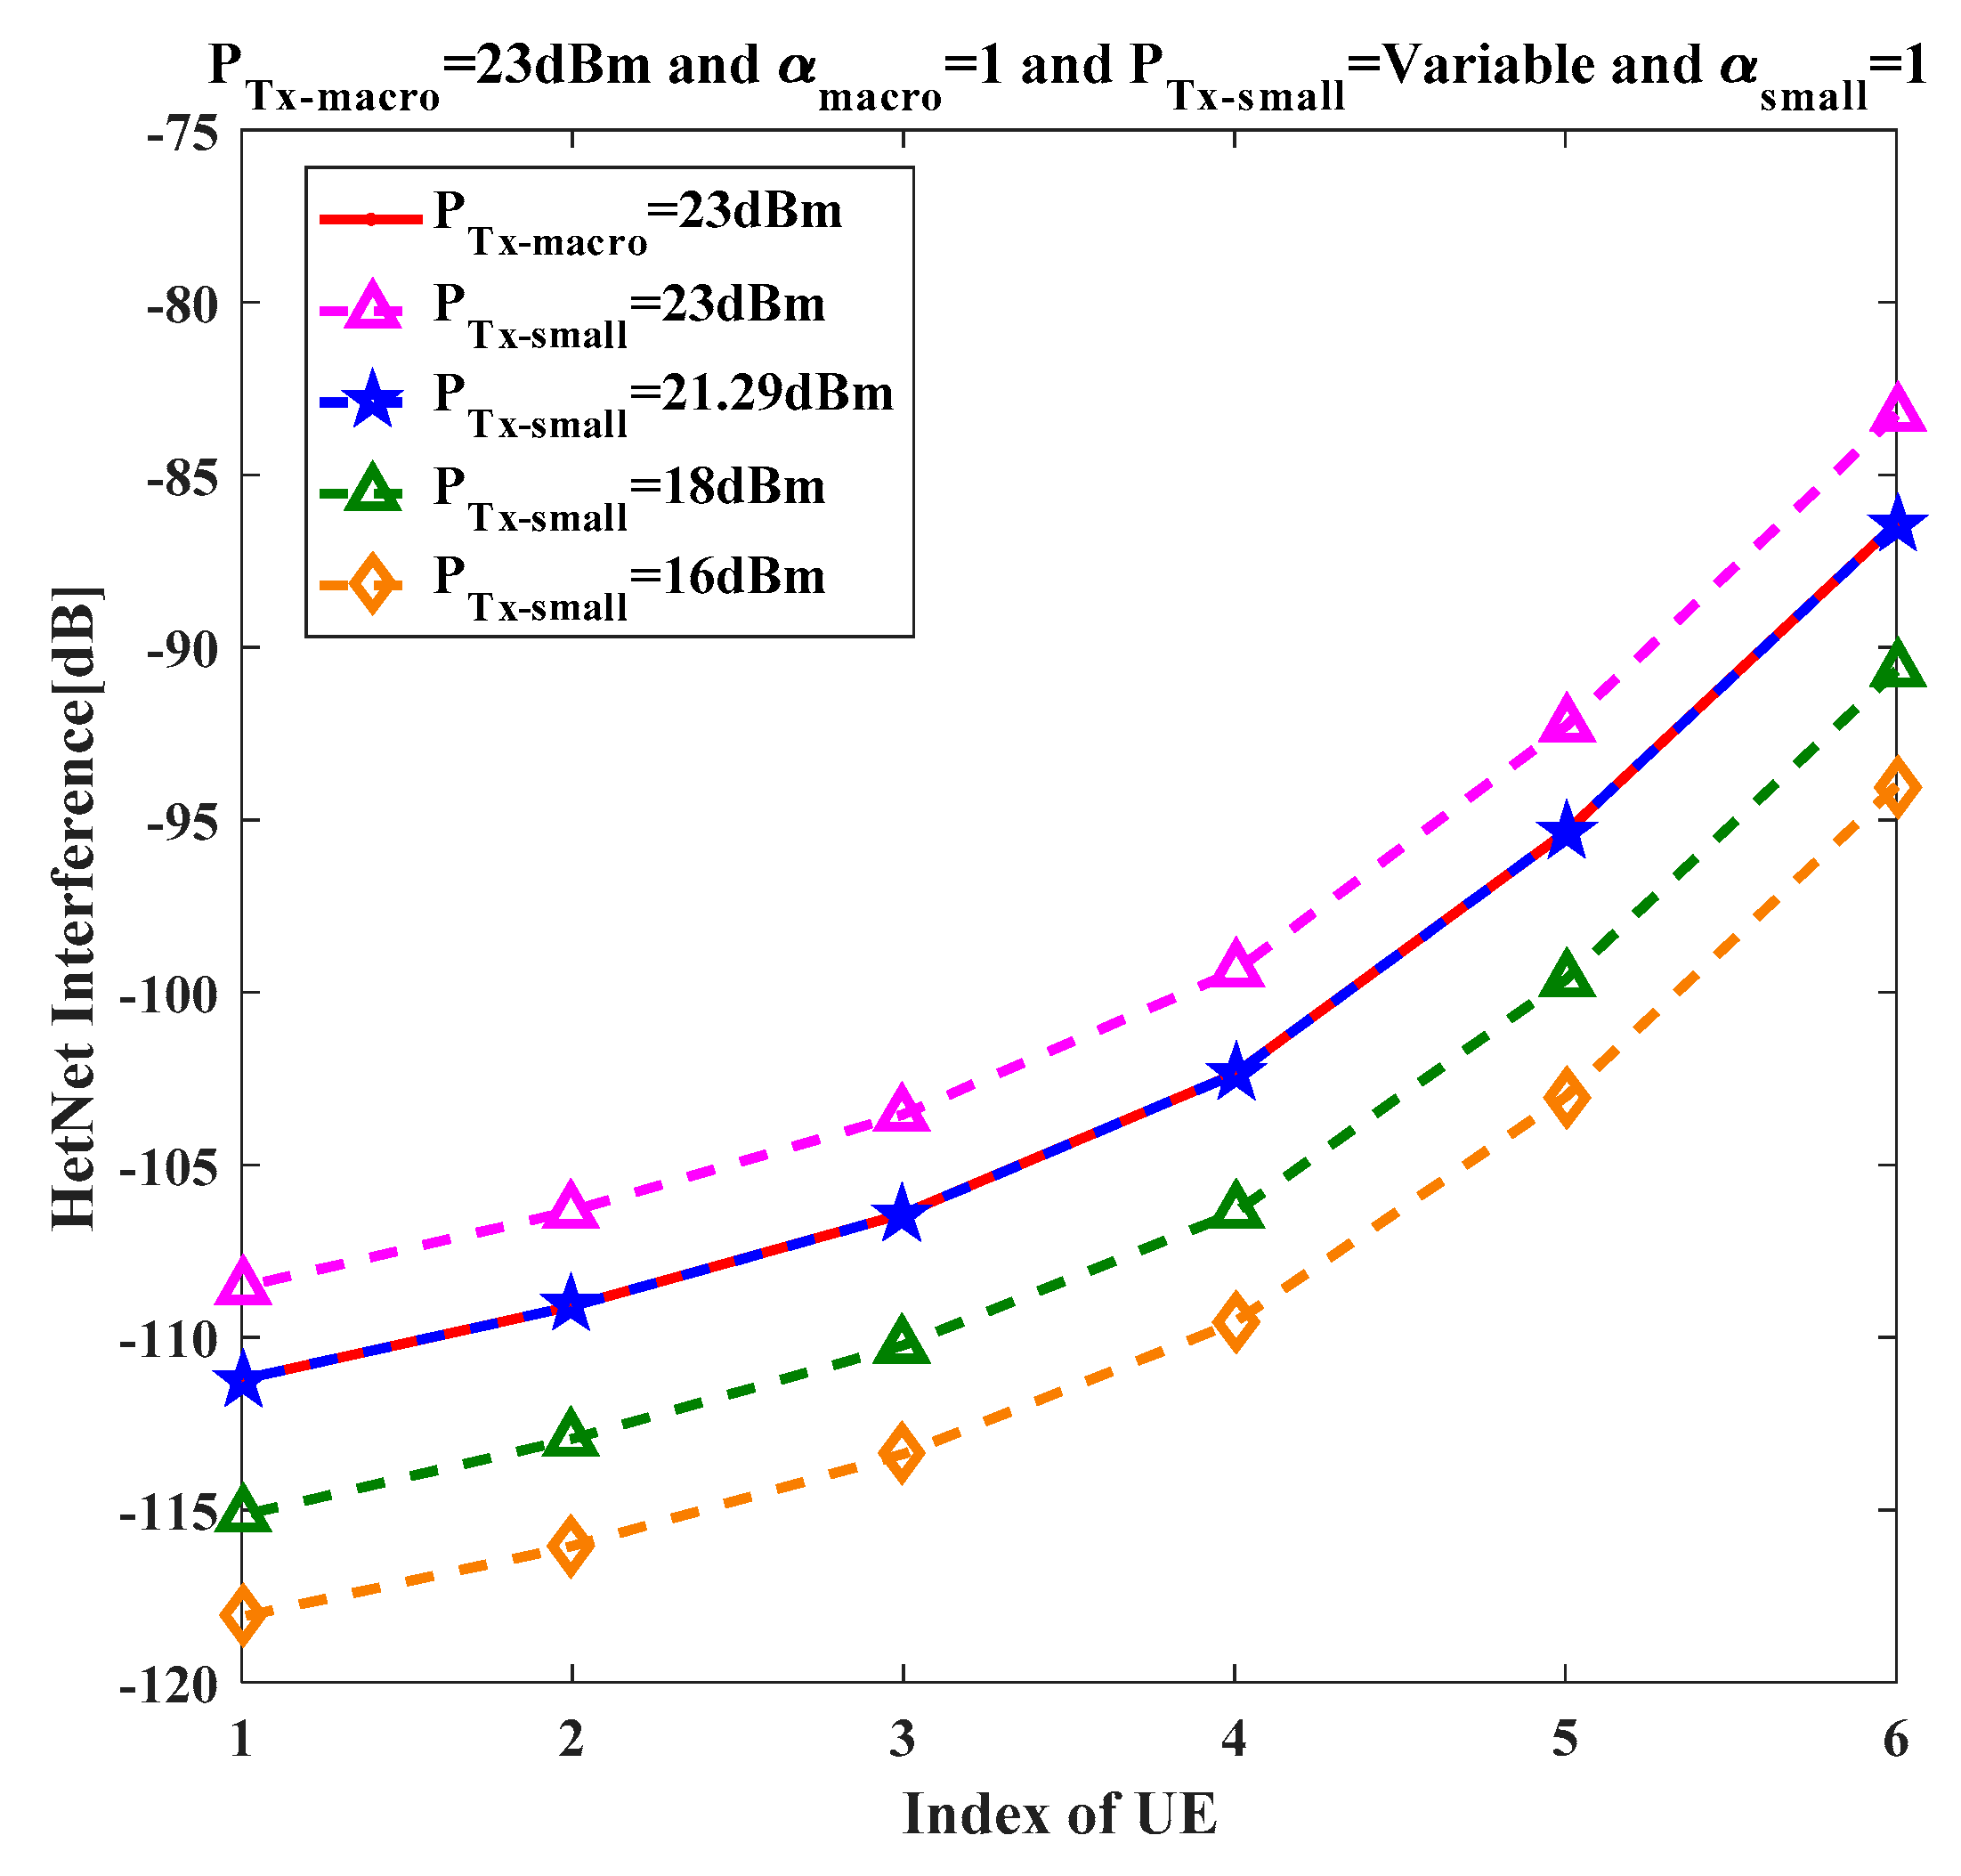
The interference offered to the central small cell is presented in Figure 17 using Equation (25). Compared to Figure 8, Figure 11, and Figure 14, the interference level was lower by 6.5 dB, 6.6 dB, and 5.1 dB, respectively. In Figure 17, it can be seen clearly that for the small cells, Pmax = 21.29 dBm corresponded to the same interference level as compared to the reference cases with Pmax = 23 dBm and Pmax = 18 dBm in the uniformly distributed macro and small cell deployments, respectively.
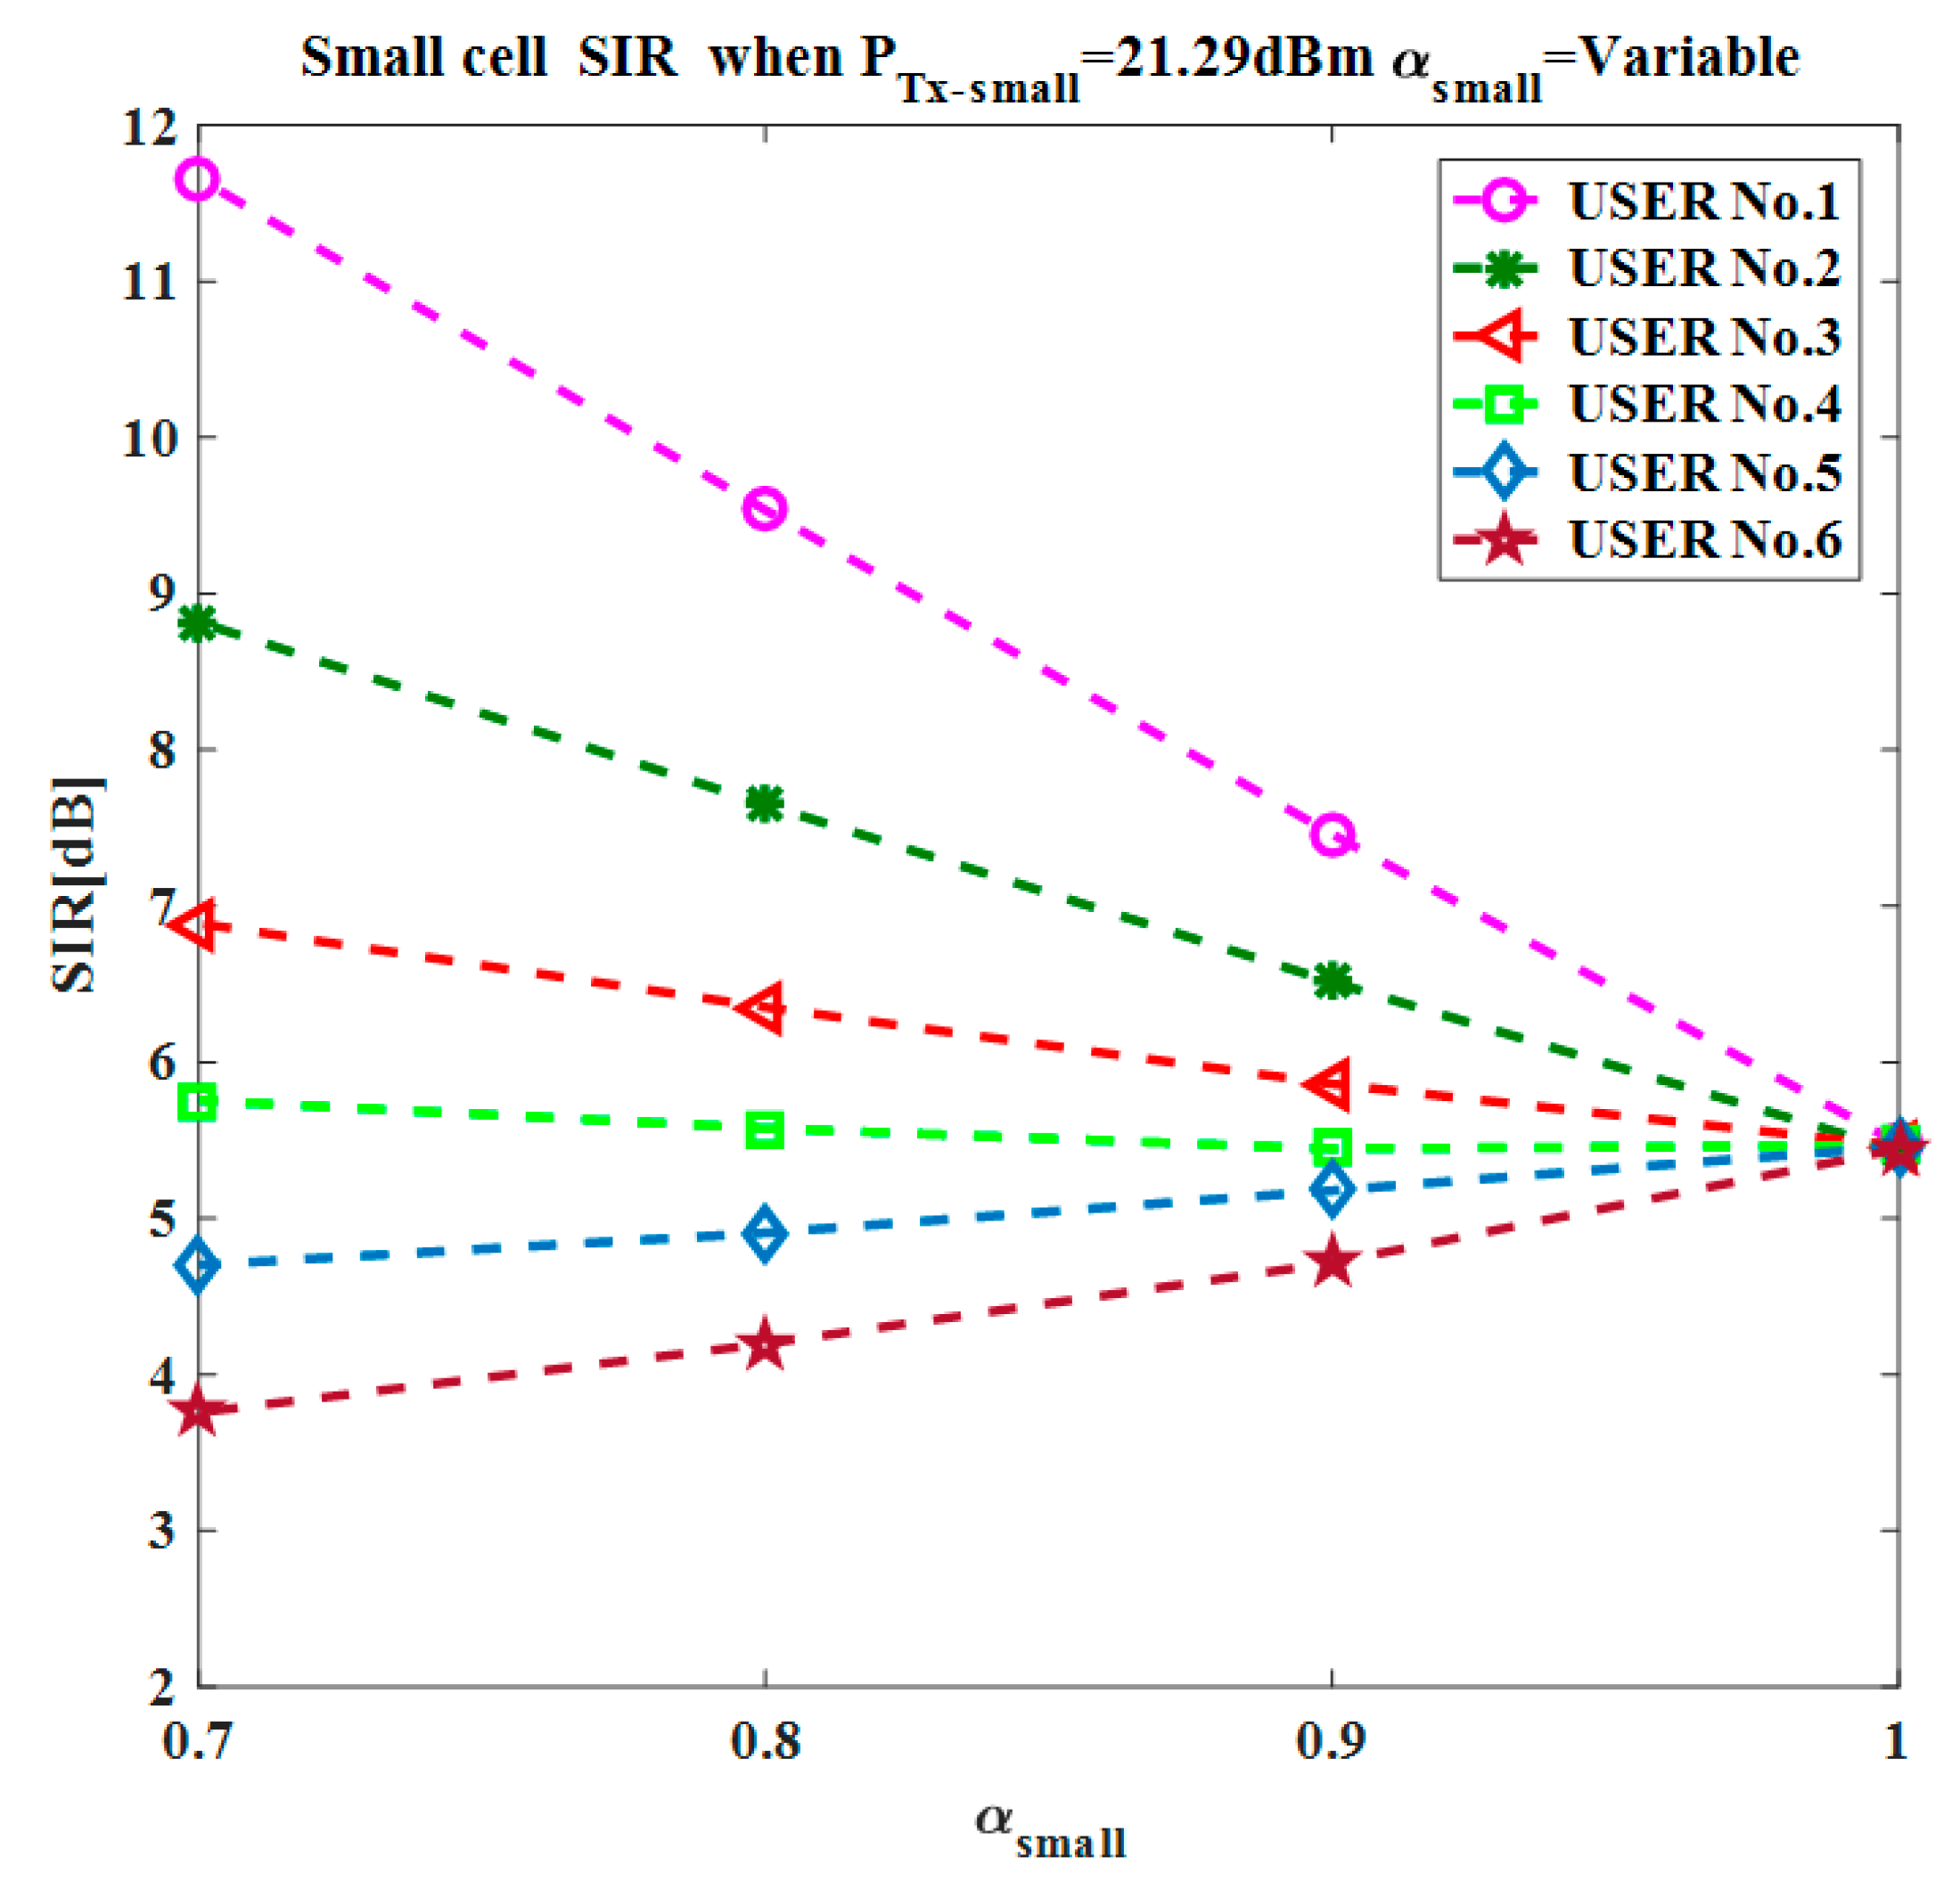
The impact of increased Pmax and decreased interference was observed by plotting the received SIR in Figure 18 using Equation (26). The trend with an increase in αsmall can clearly be observed for the UE near the eNodeB (i.e., UE with the index 1); the received SIR decreased from 11.71 dB to 5.4 dB. Compared to Figure 5, the received SIR gain was 1.01 dB and 1.2 dB for αsmall = 0.7 and αsmall = 1, respectively. Similarly, compared to Figure 9, the received SIR gain was 1.21 dB and 0.8 dB for αsmall = 0.7 and αsmall = 1, respectively. Meanwhile, for the UE near the cell edge (i.e., UE with the index 6), the received SIR improved from 3.7 dB to 5.4 dB. The received SIR gains as compared to Figure 5 were 0.5 dB and 1.2 dB, while the gain compared to Figure 9 were 0.6 dB and 0.8 dB. The results for the spectral efficiency presented in Figure 19 further validate our argument, where a significant gain in the system performance can be observed by revisiting the Pmax limit. This HetNet deployment scenario shows significant gain in system performance, as the interfering ring of the small cell was far away from the central small cell, and the increased Pmax value resulted in higher received SIR for all the UE. The Pmax limits for the considered network deployments are summarized in Table 2.
As expected earlier, such a HetNet deployment with Pmax = 21.29 dBm offers advantages in terms of received SIR by adopting FPC instead of full compensation. The further optimization of the Pmax value by considering various energy efficient deployment strategies such as small cell on/off, non-uniform, and mobile small cell deployment in the macro cell, and other cell-specific features will be continued in future work.
5. Conclusions
In this paper, the maximum transmit power Pmax for a small cell uplink was investigated for OL/TPC in various deployment scenarios. We showed that, to achieve better network performance, Pmax = 18 dBm is the appropriate choice in a uniform small cell deployment, which provides room for FPC operation to compensate for the pathloss. Furthermore, the HetNet environment was investigated with the three most efficient small cell deployments within the existing macro layer. For the HetNet environment, we observed a deviation of Pmax from 18 dBm by −0.52 dBm in the first, +0.03 dBm in the second, and +3.29 dBm in the third HetNet deployment due to the variations in interference. However, significant SIR gain was achieved with an increase in Pmax for the HetNet deployment as compared to the uniform small cell deployment. Use of FPC mode for the HetNet environment was also validated by our analysis. Further research will be conducted to consider the joint optimization of OL and CL/TPC schemes by employing system-level simulations, along with downlink energy efficiency enhancement schemes and event-specific HetNet deployment.
Author Contributions
A.H. and S.-H.H. contributed to the main idea of this research work. A.H. performed the simulations. A.H. and S.-H.H. contributed to the writing of this article. This research activity was planned and executed under the supervision of S.-H.H.
Funding
This work was supported by a grant from the Institute for Information and Communications Technology Promotion (IITP) of the Ministry of Science, ICT, and Future Planning (MSIP), Rep. of Korea (R0101-15-224, Development of 5G Mobile Communication Technologies for Hyper-Connected Smart Services).
Conflicts of Interest
The authors declare no conflicts of interest regarding the publication of this article.
References
- Ge, X.; Tu, S.; Mao, G.; Wang, C.X.; Han, T. 5G Ultra-Dense Cellular Networks. IEEE Wirel. Commun. 2016, 23, 72–79. [Google Scholar] [CrossRef] [Green Version]
- Ge, X.; Cheng, H.; Guizani, M.; Han, T. 5G wireless backhaul networks: Challenges and research advances. IEEE Netw. 2014, 28, 6–11. [Google Scholar] [CrossRef]
- Coupechoux, M.; Kelif, J.M. How to set the fractional power control compensation factor in LTE? In Proceedings of the 34th IEEE Sarnoff Symposium (SARNOFF), Princeton, NJ, USA, 3–4 May 2011; pp. 1–5. [Google Scholar]
- Simonsson, A.; Furuskar, A. Uplink power control in LTE—Overview and performance: Principles and benefits of utilizing rather than compensating for SINR variations. In Proceedings of the 68th IEEE Vehicular Technology Conference (VTC Fall), Calgary, BC, Canada, 21–24 September 2008; pp. 1–5. [Google Scholar]
- Evolved Universal Terrestrial Radio Access (E-UTRA). Physical Layer Procedures ‘TR 36.213’; 3rd Generation Partnership Project (3GPP): Phoenix, AZ, USA, January 2015; Available online: https://portal.3gpp.org/desktopmodules/Specifications/SpecificationDetails.aspx?specificationId=2427 (accessed on 1 May 2019).
- Haider, A.; Seong-Hee, L.; Seung-Hoon, H.; Kim, D.I.; Jee, H.N. Uplink open loop power control for LTE HetNet. In Proceedings of the URSI Asia-Pacific Radio Science Conference (URSI AP-RASC), Seoul, Korea, 21–25 August 2016; pp. 83–85. [Google Scholar]
- Li, J. Uplink power control for heterogeneous networks. In Proceedings of the IEEE Communications and Networking Conference (WCNC), Shanghai, China, 7–10 April 2013; pp. 773–777. [Google Scholar]
- Cîrstea, E.; Ciochină, S. LTE Uplink Power Control and its Impact on System Performance. In Proceedings of the 3rd International Conference on Adaptive and Self-Adaptive Systems and Applications, Rome, Italy, 11–14 September 2011; pp. 57–61. [Google Scholar]
- Koleva, P.; Poulkov, V.; Asenov, O.; Semov, P. Improved open loop power control for LTE uplink. In Proceedings of the 38th International Conference on Telecommunication and Signal Processing, Prague, Czech Republic, 9–11 July 2015; pp. 1–5. [Google Scholar]
- Vallejo-Mora, A.B.; Toril, M.; Luna-Ramirez, S.; Mendo, A.; Pedraza, S. Congestion Relief in Subway Areas by Tuning Uplink Power Control in LTE. IEEE Trans. Veh. Technol. 2017, 66, 6489–6497. [Google Scholar] [CrossRef]
- Lauridsen, M.; Jensen, A.R.; Mogensen, P. Reducing LTE uplink transmission energy by allocating resources. In Proceedings of the IEEE Vehicular Technology Conference (VTC Fall), San Francisco, CA, USA, 5–8 September 2011; pp. 1–5. [Google Scholar]
- Zhang, H.; Liu, H.; Cheng, J.; Leung, V.C.M. Downlink Energy Efficiency of Power Allocation and Wireless Backhaul Bandwidth Allocation in Heterogeneous Small Cell Networks. IEEE Trans. Commun. 2018, 66, 1705–1716. [Google Scholar] [CrossRef]
- Haider, A.; Sinha, R.S.; Hwang, S.H. Investigation of Open-Loop Transmit Power Control Parameters for Homogeneous and Heterogeneous Small-Cell Uplinks. ETRI J. 2018, 40, 51–60. [Google Scholar] [CrossRef]
- Zhang, H.; Liu, N.; Long, K.; Cheng, J.; Leung, V.C.M.; Hanzo, L. Energy Efficient Subchannel and Power Allocation for Software-defined Heterogeneous VLC and RF Networks. IEEE J. Sel. Areas Commun. 2018, 36, 658–670. [Google Scholar] [CrossRef]
- Chen, M.; Saad, W.; Yin, C. Echo State Networks for Self-Organizing Resource Allocation in LTE-U with Uplink-Downlink Decoupling. IEEE Trans. Wirel. Commun. 2017, 16, 3–16. [Google Scholar] [CrossRef]
- Pak, Y.; Min, K.; Choi, S. Performance evaluation of various small-cell deployment scenarios in small-cell networks. In Proceedings of the 18th IEEE Symposium on Consumer Electronics (ISCE), Jeju Island, Korea, 22–25 June 2014; pp. 1–2. [Google Scholar]
- Jung, Y.; Kim, H.; Lee, S.; Hong, D.; Lim, J. Deployment of small cells with biased density in heterogeneous networks. In Proceedings of the 22nd Asia-Pacific Conference on Communications (APCC), Yogyakarta, Indonesia, 25–27 August 2016; pp. 541–544. [Google Scholar]
- Jensen, A.R.; Lauridsen, M.; Mogensen, P.; Sorensen, T.B.; Jensen, P. LTE UE power consumption model: For system level energy and performance optimization. In Proceedings of the IEEE Vehicular Technology Conference (VTC Fall), Quebec City, QC, Canada, 3–6 September 2012; pp. 1–5. [Google Scholar]
- Joshi, P.; Colombi, D.; Thors, B.; Larsson, L.E.; Törnevik, C. Output Power Levels of 4G User Equipment and Implications on Realistic RF EMF Exposure Assessments. IEEE Access 2017, 5, 4545–4550. [Google Scholar] [CrossRef]
- Mahdavi-Doost, H.; Prasad, N.; Rangarajan, S. Optimizing energy efficiency over energy-harvesting LTE cellular networks. In Proceedings of the 2016 IEEE International Symposium on Information Theory (ISIT), Barcelona, Spain, 10–15 July 2016. [Google Scholar]
- Bhardwaj, A.; Agnihotri, S. Energy- and Spectral-Efficiency Trade-Off for D2D-Multicasts in Underlay Cellular Networks. IEEE Wirel. Commun. Lett. 2018, 7, 546–549. [Google Scholar] [CrossRef] [Green Version]
- Madi, N.K.M.; Hanapi, Z.B.M.; Othman, M.; Subramaniam, S. Link Adaptive Power Control and Allocation for Energy-Efficient Downlink Transmissions in LTE Systems. IEEE Access 2018, 6, 18469–18483. [Google Scholar] [CrossRef]
- Triantafyllopoulou, D.; Moessner, K. QoS and energy efficient resource allocation in downlink OFDMA systems. In Proceedings of the 2015 IEEE International Conference on Communications (ICC), London, UK, 8–12 June 2015; pp. 5967–5972. [Google Scholar]
- Tung, L.P.; Wang, L.C.; Chen, K.S. An interference-aware small cell on/off mechanism in hyper dense small cell networks. In Proceedings of the International Conference on Computing, Networking and Communications (ICNC), Santa Clara, CA, USA, 26–29 January 2017; pp. 767–771. [Google Scholar]
- Networks, U.S.C.; Lee, K.; Park, Y.; Heo, J.; Na, M.; Wang, H.; Hong, D. Dual Layer Small Cell On/Off Control for Ultra-Dense Small Cell Networks. In Proceedings of the 85th Vehicular Technology Conference (VTC-Spring), Sydney, NSW, Australia, 4–7 June 2017; pp. 1–5. [Google Scholar]
- Shen, B.; Lei, Z.; Huang, X.; Chen, Q. An Interference Contribution Rate Based Small Cells On/Off Switching Algorithm for 5G Dense Heterogeneous Networks. IEEE Access 2018, 6, 29757–29769. [Google Scholar] [CrossRef]
- Huang, X.; Tang, S.; Zheng, Q.; Zhang, D.; Chen, Q. Dynamic Femtocell gNB On/Off Strategies and Seamless Dual Connectivity in 5G Heterogeneous Cellular Networks. IEEE Access 2018, 6, 21359–21368. [Google Scholar] [CrossRef]
- Fotouhi, A.; Ding, M.; Hassan, M. Flying Drone Base Stations for Macro Hotspots. IEEE Access 2018, 6, 19530–19539. [Google Scholar] [CrossRef]
- Teng, R.; Li, H.B.; Miura, R. Dynamic Recovery of Wireless Multi-Hop Infrastructure with the Autonomous Mobile Base Station. IEEE Access 2016, 4, 627–638. [Google Scholar] [CrossRef]
- Cileo, D.G.; Sharma, N.; Magarini, M. Coverage, capacity and interference analysis for an aerial base station in different environments. In Proceedings of the International Symposium on Wireless Communicasion Systems (ISWCS), Bologna, Italy, 28–31 August 2017; pp. 281–286. [Google Scholar]
- Ding, M.; Perez, D.L. Please lower small cell antenna heights in 5G. In Proceedings of the IEEE Global Communication Conference (GLOBECOM), Washinton, DC, USA, 4–8 December 2016; pp. 1–6. [Google Scholar]
- Chou, S.F.; Yu, Y.J.; Pang, A.C. Mobile Small Cell Deployment for Service Time Maximization over Next-Generation Cellular Networks. IEEE Trans. Veh. Technol. 2017, 66, 5398–5408. [Google Scholar] [CrossRef]
- Kalantari, E.; Bor-Yaliniz, I.; Yongacoglu, A.; Yanikomeroglu, H. User association and bandwidth allocation for terrestrial and aerial base stations with backhaul considerations. In Proceedings of the 28th IEEE Annual International Symposium on Personal, Indoor and Mobile Radio Communications (PIMRC), Montreal, QC, Canada, 8–13 October 2017; pp. 1–6. [Google Scholar]
- Kelif, J.M.; Coupechoux, M.; Godlewski, P. A fluid model for performance analysis in cellular networks. EURASIP J. Wirel. Commun. Netw. 2010, 2010, 435189. [Google Scholar] [CrossRef]
- Kelif, J.-M.; Coupechoux, M. Joint Impact of Pathloss Shadowing and Fast Fading—An Outage Formula for Wireless Networks. arXiv 2010, arXiv:1001.1110. [Google Scholar]
- Kelif, J.M.; Coupechoux, M. Impact of topology and shadowing on the outage probability of cellular networks. In Proceedings of the IEEE International Conference on Communications, Dresden, Germany, 14–18 June 2009; pp. 1–6. [Google Scholar]
Figure 1.
Fluid model for uniformly distributed cells. Zoomed view shows a uniform UE distribution in each cell.
Figure 1.
Fluid model for uniformly distributed cells. Zoomed view shows a uniform UE distribution in each cell.

Figure 2.
HetNet scenario for uniformly distributed small cells within a macro cell.

Figure 3.
HetNet scenario for deployment of small cells near the macro cell eNodeB.

Figure 4.
HetNet scenario for deployment of macro cells near the edge of the macro cell.

Figure 5.
SIR as a function of αmacro in the homogenous macro cell deployment.

Figure 6.
Outage probability as a function of SIR for the UE at the cell edge.

Figure 7.
SIR as a function of αsmall in the homogenous small cell deployment.

Figure 8.
Interference comparison as a function of Pmax in the uniform macro and small cell deployments.
Figure 8.
Interference comparison as a function of Pmax in the uniform macro and small cell deployments.

Figure 9.
SIR as a function of αsmall in the homogenous small cell deployment.

Figure 10.
Spectral efficiency for small cells as a function of distance and αsmall in homogenous small cell deployment.
Figure 10.
Spectral efficiency for small cells as a function of distance and αsmall in homogenous small cell deployment.

Figure 11.
Interference comparison as a function of Pmax in the uniform macro cell and HetNet deployments.
Figure 11.
Interference comparison as a function of Pmax in the uniform macro cell and HetNet deployments.

Figure 12.
SIR as a function of αsmall in the HetNet deployment.

Figure 13.
Spectral efficiency for the small cell as a function of distance and αsmall in the HetNet deployment with uniformly distributed small cells.
Figure 13.
Spectral efficiency for the small cell as a function of distance and αsmall in the HetNet deployment with uniformly distributed small cells.

Figure 14.
Interference comparison as a function of Pmax in the uniform macro cell and HetNet deployments.
Figure 14.
Interference comparison as a function of Pmax in the uniform macro cell and HetNet deployments.

Figure 15.
SIR as a function of αsmall in the HetNet deployment.

Figure 16.
Spectral efficiency for the small cell as a function of distance and αsmall in the HetNet deployment with small cells near the macro cell eNodeB.
Figure 16.
Spectral efficiency for the small cell as a function of distance and αsmall in the HetNet deployment with small cells near the macro cell eNodeB.

Figure 17.
Interference comparison as a function of Pmax in the uniform macro cell and HetNet deployments.
Figure 17.
Interference comparison as a function of Pmax in the uniform macro cell and HetNet deployments.

Figure 18.
SIR as a function of αsmall in the HetNet deployment.

Figure 19.
Spectral efficiency for the small cell as a function of distance and αsmall in the HetNet deployment with small cells near the macro cell edge.
Figure 19.
Spectral efficiency for the small cell as a function of distance and αsmall in the HetNet deployment with small cells near the macro cell edge.


Table 1.
System and simulation parameters for each small cell deployment scenario.
| Parameters | Homogenous Macro Cells | Homogenous Small Cells | HetNet with Uniformly Distributed Small Cells | HetNet with Small Cells Deployed near Macro Cell eNodeB | HetNet with Small Cells Deployed near Macro Cell Edge |
|---|---|---|---|---|---|
| Number of interfering rings (Ni)-cell type | 2-macro | 2-small | 2-small, 2-macro | 1-small, 2-macro | 1-small, 2-macro |
| Number of cells | 19 macro cells | 19 small cells | 19 macro, 19 small cells | 19 macro, 7 small cells | 19 macro, 13 small cells |
| Cell radius | Rmacro = 1000 m | Rsmall = 200 m | Rsmall = 200 m, Rmacro = 1000 m | ||
| UE distribution | Uniform distribution | ||||
| Pathloss model | Free space model PL = 32.45 + 20log10(r) + 20log10(fMHz) | ||||
| Antenna type at eNodeB | Omni-directional antenna | ||||
| Pathloss compensation factor “α” range | αmacro = 0.7, 0.8, 0.9, 1 | αsmall = 0.7, 0.8, 0.9, 1 | αsmall = 0.7, 0.8, 0.9, 1 αmacro = 0.7, 0.8, 0.9, 1 | ||
Table 2.
Pmax limit for various network deployments.
| Deployment Scenario | Pmax |
|---|---|
| Homogenous small cell deployment | 18 dBm |
| HetNet deployment with uniformly distributed small cells | 17.48 dBm |
| HetNet deployment with small cells near the macro cell eNodeB | 18.03 dBm |
| HetNet deployment with small cells near the macro cell edge | 21.29 dBm |
© 2019 by the authors. Licensee MDPI, Basel, Switzerland. This article is an open access article distributed under the terms and conditions of the Creative Commons Attribution (CC BY) license (http://creativecommons.org/licenses/by/4.0/).
Share and Cite
MDPI and ACS Style
Haider, A.; Hwang, S.-H. Maximum Transmit Power for UE in an LTE Small Cell Uplink. Electronics 2019, 8, 796. https://0-doi-org.brum.beds.ac.uk/10.3390/electronics8070796
AMA Style
Haider A, Hwang S-H. Maximum Transmit Power for UE in an LTE Small Cell Uplink. Electronics. 2019; 8(7):796. https://0-doi-org.brum.beds.ac.uk/10.3390/electronics8070796
Chicago/Turabian StyleHaider, Amir, and Seung-Hoon Hwang. 2019. "Maximum Transmit Power for UE in an LTE Small Cell Uplink" Electronics 8, no. 7: 796. https://0-doi-org.brum.beds.ac.uk/10.3390/electronics8070796
Note that from the first issue of 2016, this journal uses article numbers instead of page numbers. See further details here.