Article

Object Detection Based on Center Point Proposals

School of Automation Science and Electrical Engineering, Beihang University, Beijing 100191, China
*
Author to whom correspondence should be addressed.
Submission received: 2 November 2020 / Revised: 28 November 2020 / Accepted: 3 December 2020 / Published: 5 December 2020
(This article belongs to the Special Issue Deep Learning Based Object Detection)

Abstract

:
Anchor-based detectors are widely adopted in object detection. To improve the accuracy of object detection, multiple anchor boxes are intensively placed on the input image, yet most of them are invalid. Although anchor-free methods can reduce the number of useless anchor boxes, the invalid ones still occupy a high proportion. On this basis, this paper proposes an object-detection method based on center point proposals to reduce the number of useless anchor boxes while improving the quality of anchor boxes, balancing the proportion of positive and negative samples. By introducing the differentiation module in the shallow layer, the new method can alleviate the problem of missing detection caused by overlapping of center points. When trained and tested on COCO (Common Objects in Context) dataset, this algorithm records an increase of about 2% in APS (Average Precision of Small Object), reaching 27.8%. The detector designed in this study outperforms most of the state-of-the-art real-time detectors in speed and accuracy trade-off, achieving the AP of 43.2 in 137 ms.

Graphical Abstract

1. Introduction

Object detection is a fundamental, and practical, research branch in the field of computer vision, practicing border and category prediction of each instance object in an image by corresponding algorithms. Compared with earlier detectors, current mainstream real-time anchor-based detectors such as Faster R-CNN [1], SSD (Single Shot Multibox Detector) [2] and YOLOv3 [3] have achieved favorable detection results [4,5]. Current object detectors identify each object through an axis-aligned bounding box that tightly encompasses the object [5,6,7,8], and reduce object detection to image classification of potential object bounding boxes. Specifically, the classifier would classify the image content in each bounding box into specific objects or backgrounds.
Anchor boxes were used in two-stage detectors in the early days, but now they are also widely adopted in one-stage detectors [2,3,5,9], achieving the accuracy of two-stage detectors [1,6,10] under better timeliness. One-stage detectors would score the anchor boxes distributed densely on the image and generate the final bounding box prediction by improving their coordinates through regression. Although these algorithms have proved successful, the following problems are still noteworthy:
1. To achieve high recall rate, anchor-based detectors need densely placed anchor boxes on the input image. For example, more than 40 K anchor boxes are needed in DSSD (Deconvolutional Single Shot Detector) [9], 100 K in RetinaNet [7], and 180 K in feature pyramid networks (FPN) [11] for images with the short side length of 800. Most of these anchor boxes would be labeled as negative samples during training, thus the excessive negative samples may aggravate the imbalance between positive and negative samples in training.
2. During computation of the intersection-over-union (IOU) scores between anchor boxes and ground-truth boxes, the massive anchor boxes may cause the surge of computation and memory consumption, lowering training speed [7] on the COCO benchmark [12].
3. The detection performance is greatly vulnerable to the size, aspect ratio and number of anchor boxes as these hyper-parameters need to be carefully tuned in anchor-based detectors [13], thus the training results may be affected by human experience.
To address the above problems, some improvements have been made. For example, the FCOS [13] algorithm directly predicts 4D vector and category at each spatial location of each layer’s feature map. As shown in 
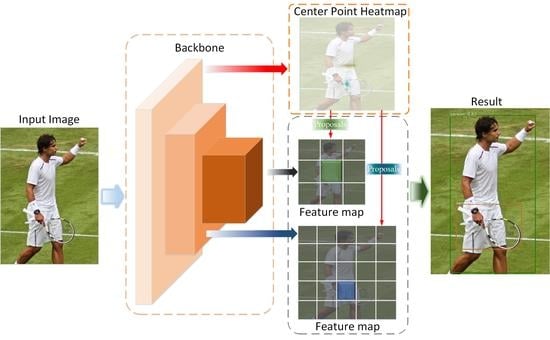
Figure 1, the 4D vector represents the distance from the pixel point to the four borders, while the OaP (Objects as Points) [14] algorithm presents the target by its center point, and then obtains some attributes of the target by regression at the center point. As shown in Figure 1b, this algorithm turns object detection into a standard key point estimation problem. In the algorithm, a heatmap of an image input into the full convolution network is obtained, whose peak point constitutes the center point. The width and height of the target are predicted by position of the peak point of each feature map. The classical supervised learning is adopted for model training, and reasoning is only a single forward propagation network without post-processing such as Non-Maximum Suppression. Although the two anchor-free algorithms could certainly address the disadvantages of anchor boxes algorithm, there is still room for improvement.
FCOS is an object detection algorithm based on semantic segmentation. Under the same network framework, the total number of samples in FCOS is reduced to one-ninth of that of the original anchor boxes algorithm, yet the number of negative samples is still massive. As shown in Figure 2a, the red cell is the positive samples detected, and the remainder are the negative ones. It can be seen that negative samples still occupy a large proportion. When multiple small targets are located in the same cell, only one can be detected, and the remainder would be missed. As shown in Figure 3a, there are two bottles in the cell, and the small bottle in the red area is missed. As for the OaP algorithm focusing on center positioning, if the targets are of the same scale and close distance, overlapping of GT (ground truth) center points may occur during down-sampling. In this case, the two objects could only be trained as one (as there is only one center point) even in the algorithm of CenterNet [14], still leading to missing detection. Figure 3b is the heatmap generated by the OaP algorithm, and (c) the OAP algorithm detection result. Overlapping of the center points of the targets in the red, yellow and blue rectangular boxes appears in the heatmap, and multiple targets in the three rectangular boxes are detected as one target, as shown in Figure 3c.
To address the aforementioned target detection problems, this study proposes an object-detection method based on center point proposals by integrating the advantages of FCOS and OaP (As shown in Figure 2b, OaP algorithm could predict the center point on the heatmap, facilitating positioning and detection of the cell). This method could reduce the number of negative samples in training to balance the ratio of positive and negative samples, enhance the network’s learning of the target, and improve the detection rate. Moreover, the introduction of differentiation module (DM) branches in the method is conducive to solving the problems of center point overlapping and lack of detection cells.
The main tasks of this paper are:
-
To analyze the advantages and disadvantages of existing object detection methods, and propose feasible solutions to the existing object detection problems.
-
To propose an object detection based on center point proposals (CPO), and detail its theoretical formulas and calculation process.
-
To test and verify the method on the COCO dataset [12] and compare the detection results of this method with those of other state-of-the-art methods to demonstrate its performance.
The paper is organized as follows: Section 2 analyzes the advantages and disadvantages of the existing object detection methods and the existing object detection problems. Section 3 introduces the method presented in this paper. In Section 4, the proposed method is verified by experiments, and compared with other methods. Section 5 constitutes a summary of the problems and methods studied in this paper.

2. Related Works

Object detection mainly deals with prediction of the border and category of each instance object in an image. Most of the early algorithms are two-stage detectors using anchor boxes as the main detection method, having a high detection rate yet poor duration. In recent years, one-stage detectors improved based on the two-stage ones become popular, sharing both favorable timeliness and detection rate. As anchor boxes and related hyper-parameters are removed by some of the improved algorithms, the learning characteristics of the machine are fully exploited.

2.1. Anchor-Based Detectors

Resembling the traditional sliding-window and proposals-based detectors, early anchor-based detectors regard anchor boxes as pre-defined sliding windows or proposals, and classify them as positive or negative samples. An additional offset regression is subsequently needed to correct the prediction of the frame position. Therefore, the anchor boxes in these detectors can be viewed as training samples. Fast RCNN [6] would repeatedly calculate image features for each sliding window, while anchor boxes can avoid repeated feature calculations and increase detection speed by virtue of feature maps of convolutional networks. However, end-to-end training is still impossible as the algorithm relies on separate proposals. Faster-RCNN [1] realizes end-to-end training by removing the anchor boxes with low scores through the joint training of a region generation network (RPN) and detection network. In most of the early anchor-based detectors, a set of sparse regions of interest (RoIs) are generated and then classified by the network, which is what we have called the “two-step method”.
To improve the detection speed, the step of region proposals is removed [2,3] by some researchers who intend to detect the target directly in a single network, which is what we have called the “one-stage method”. Anchor boxes are placed densely on the multi-scaled feature maps in SSD algorithm [2], and each anchor box is classified and refined directly. Though the accuracy and speed of operation are somewhat simultaneously ensured, the highest accuracy of the two-stage method still cannot be reached. In YOLOv3, dimension clusters are used as anchor boxes, and multi-scale target regression detection is achieved by feature pyramid [11]. The measured accuracy of YOLOv3 is almost the same as that of the two-stage algorithm, but its time consumption is significantly better than that of the two-stage method. However, multiple hyper-parameters need to be adjusted by anchors, influencing the final accuracy and thereby leaving the detection results of anchor-based detectors vulnerable to artificial presets.

2.2. Anchor-Free Detectors

Anchor-free is not a new concept. As the earliest anchor-free model in the field of target detection, YOLOv1 [8] regards target detection as a problem of spatially separated boundary box and related probabilistic regression, and the bounding box and classification score can be predicted directly from the image. Although this method shares high operation speed, its accuracy is unsatisfactory. After CornerNet [15] was published in 2018, anchor-free target detection models emerged one after another. The principle of the main anchor-free detection methods is to replace anchor boxes with key points or intensive predictions. CornerNet, ExtremeNet [16] and OaP are based on key points, and FASF [17], FCOS and FoveaBox [18] on DenseBox [19].
CornerNet algorithm turns object detection frame into a pair of key points, that is, the upper left corner and the lower right corner, to eliminate design of anchor boxes. Corner pooling technology is also adopted in CornerNet, for Convolutional Neural Networks (CNN)’s better location of corner position. ExtremeNet turns target detection into pure key point estimation issue, in which a target frame is formed by four extreme points and one center point of the target. Resembling the algorithm flow of CornerNet, ExtremeNet generates the target frame only when the response of the five heatmaps predicted by CNN for each target class in the geometric center is large enough. The OaP algorithm takes target as a single point, which is the center point of the bounding box identified by key point estimate, to regress other target attributes through the center point.
Based on the online feature selection ability of FPN, the FSAF algorithm can dynamically allocate each instance to the most suitable feature layer during training, work together with the module branch with anchors during reasoning, and finally output prediction in parallel. Developed from semantic segmentation, FCOS dispenses with the anchor box and region recommendation, avoiding overlapping calculation and performance-sensitive parameter design in model training. FCOS presents a new loss function, “Center-ness”, to lower the score weight of the bounding boxes far from the center of the object, curtailing low-quality detection boxes without introducing other hyper-parameters. Imitating the central fovea of human eyes (that is, the center of view shares the highest visual acuity), FoveaBox predicts where the object’s central area is and the bounding box of each valid location. Due to the characteristic representation of the feature pyramid, targets of different scales can be detected from multiple feature layers. The core of FoveaBox is to directly learn the probability of the existence of targets and the coordinate position of target box, including prediction of category-related semantic maps and generation of category-irrelevant candidate target boxes, whose size is related to representation of the feature pyramid.
Our method is a refined version of the above methods. Taking the structure of Darknet-53 as the backbone, drawing on the idea of FPN, the proposed method detects targets of different sizes by multiple scales. At the same time, network branches are introduced to generate shared center points as proposals to locate cells. When the cell contains multiple overlapping center points, the differentiation module is introduced to provide more cells.

3. Method

3.1. Preliminary

F i H s × W s × C is the feature map at layer i of a backbone CNN, s the total stride before the layer, and H , W height and width of an input image. The ground-truth bounding boxes for an input image are defined as { B i } , where B i = ( x 0 ( i ) , y 0 ( i ) , x 1 ( i ) , y 1 ( i ) , c ( i ) ) 4 × { 1 , 2 C } . Here ( x 0 ( i ) , y 0 ( i ) ) and ( x 1 ( i ) , y 1 ( i ) ) denote the coordinates of the left-top and right-bottom corners of the bounding box. c ( i ) represents the class that the object in the bounding box belongs to, and C the number of classes, which is 80 for the COCO dataset. The key point heatmap generated is P [ 0 , 1 ] H 4 × W 4 × C . For each location ( x , y ) on the feature map P , a prediction P x , y , c = 1 corresponds to a detected keypoint, while P x , y , z = 0 is background [14]. The cell containing detected keypoint is used as a label for training. Except for the classification label, there is also a 4D real vector t = [ l , t , r , b ] , which is used as the regression target for each sample. Here l , t , r and b display the distances from the location to the four sides of the bounding box, as shown in Figure 1a. If a location falls into multiple bounding boxes, it is considered an ambiguous sample. Now we simply choose the bounding box of the minimal area as the regression target [13]. Normally, if location ( x , y ) is associated to a bounding box B i , the training regression targets for the location can be formulated as,
l * = x x 0 ( i )
t * = y y 0 ( i )
r * = x 1 ( i ) x
b * = y 1 ( i ) y

3.2. Network Architecture

The algorithm in this paper is refined based on FCOS and OaP methods in four aspects: (1) The algorithm extracts target attribute features by FCOS method, and converts the backbone to Darknet-53 that bears the same accuracy while higher speed (0.47 times faster) than Resnet-101 [3]; (2) The algorithm uses center points as proposals to filter cells; (3) Differentiation modules are introduced in the shallow layer to provide more effective cells; (4) the IOU loss function is replaced with CIoU [20]. The structure of the algorithm is shown in Figure 4.
As shown in Figure 4, Darknet-53 generates multiscale feature maps and heatmaps. The feature map P2 generates keypoint heatmaps and extracts center points from keypoints as proposals to locate cells. Head contains class subnet and regression subnet. Taking an input feature map with C channels from a given pyramid level, the subnet adopts four 3 × 3 conv layers, each with 256 filters followed by ReLU activations, and one 3 × 3 conv layer with a corresponding number of filters. Finally, sigmoid activations are attached to output the corresponding binary predictions per spatial location [11,13]. Compared with the original FCOS algorithm, this method reduces the number of invalid cells that need to be calculated, alleviating the imbalance between positive and negative samples and improving the network’s target learning ability.

3.3. Differentiation Module

The center points in heatmap can locate cells for heads at different scales. In this process, heatmap needs to be down-sampled to be consistent with the head scale, which may cause overlapping of center points in the heatmap. The center points may fall into multiple bounding boxes, leading to them being classified as ambiguous samples. At this time, the objects mapped by the center points are also obscured. Among the targets of different scales, only the bounding box with the minimal area is selected as regression target. Adoption of multi-level prediction could significantly reduce the number of ambiguous samples [13]. For small objects of the same scale, as shown in Figure 3, missing detection may occur, to which the differentiation module is introduced as a solution, as shown in Figure 5.
As presented in Figure 5, the blue solid line bounding box acts as the first step. Heatmap compares with the results of its own down-sampling, and calculates the number N max of maximum overlapping center points in the cell. If N max > 9 , then N max = 9 . The solid green bounding box serves as the second step. The Hadamard product between the input feature layer P3 and M a s k ¯ ( M a x _ i d ) generates F3. Represented by M a x _ i d , M a s k ( M a x _ i d ) is the position marking layer of the Max value generated by the input feature layer and Max pooling. The value of M a x _ i d is 1, and the value of n o n - M a x _ i d position is 0, as shown in Formula (5). In the back propagation of deep learning, the position of gradient propagation depends on M a s k . M a s k ¯ ( M a x _ i d ) means the inverse value of M a s k ( M a x _ i d ) . The Hadamard product between feature layers P3 and M a s k ¯ ( M a x _ i d ) can be used to filter out the cross-correlation information of the optimal center point. By prediction of F3, the target corresponding to the sub-optimal center point among overlapping center points can be obtained. Similarly, by replacing the original P3 with the newly generated F3 for N max 1 times, the targets corresponding to the remaining center points can be obtained. The gray solid line bounding box acts as the third step, where a total of N max Head is output (consistent with the maximum number of overlapping center points in the cell), and the output head is the same as the head of other scales.
M a i , j c = { 1 , if   M a i , j c = M a x _ i d 0 , otherwise
M a i , j c H s × W s × C is the position variable of the M a s k , i H s , j W s , c C .
Although the differentiation module can somewhat alleviate the overlapping of center points in the cell, the cells with center points less than N max need to be re-judged to avoid unnecessary invalid operations. As center points and F3 correspond to iteration, the judgment condition only needs to ensure that the center point and F3 correspond to each other in turn. Since the bounding box is predicted by four degrees of freedom, i.e., t = [ l , t , r , b ] , the cells can also be filtered by improved Center-ness in the subsequent research.

3.4. Multi-Level Prediction with Feature Pyramid Networks (FPN) for Center Point Proposals (CPO)

Overlaps in ground-truth boxes may cause ambiguity during training, i.e., w.r.t. (with respect to) which bounding box should a location in the overlap to regress? This ambiguity may result in degraded performance of FCN-based detectors. This work proves that the ambiguity can be greatly resolved by multi-level prediction in FCOS, and the FCN-based detector can score the same or even better performance than anchor-based ones [13].
Different sizes of objects on different levels of feature maps were detected based on FPN [11]. Specifically, the four levels of feature map defined as {P3, P4, P5, P6} were adopted, in which P3, P4, P5 and P6 were produced by the backbone CNNs’ feature maps C3, C4, C5 and C6, followed by a 1 × 1 convolutional layer with the lateral connections in [11], as shown in Figure 4. As a result, the strides of P3, P4, P5 and P6 reached 8, 16, 32 and 64, respectively. Unlike anchor-based detectors that assign anchor boxes with different sizes to different feature levels, this method directly limits the range of bounding box regression. Specifically, the regression targets l , t , r and b for each location on all the feature levels were computed firstly. Then, if a location satisfies m a x ( l , t , r , b ) > m i or m a x ( l , t , r , b ) < m i 1 , it is not required to regress a bounding box any more. Here m i is the maximum distance that feature level i needs to regress. In this work, m 2 , m 3 , m 4 , m 5 and m 6 were set as 0, 64, 128, 256 and , respectively. Since objects with different sizes are assigned to different feature levels and most overlaps appear between objects with considerably different sizes, multi-level prediction can largely alleviate the aforementioned ambiguity problem and improve the accuracy of FCN-based detector [13]. If we detect same sizes of objects on different levels of feature maps. Large targets containing enough information could be detected more easily than small targets, while small targets could be detected by virtue of differentiation module.

3.5. Loss Function

The training loss function is defined as follows:
L ( { p x , y , c } , { t x , y , c } ) = 1 N p o s x , y , c L c l s ( p x , y , c , p x , y , c ) + 1 N p o s x , y , c I x , y , c L r e g ( t x , y , c , t x , y , c )
where L c l s represent the focal loss in the Formula (6), p x , y , c predicted classification scores, p x , y , c the class label, N p o s the number of positive samples, L r e g the improved IoU loss function [20], I x , y , c the indicator function (being 1 if there is a center point in the cell and 0 otherwise), and t x , y , c = [ l , t , r , b ] the distances from the location to the four sides of bounding box.
L c l s = { ( 1 p x , y , c ) α log ( p x , y , c ) if   p x , y , c = 1 ( 1 p x , y , c ) β ( p x , y , c ) α log ( 1 p x , y , c ) otherwise
L r e g = 1 I o U + R ( B , B g t )
where α and β are the hyper-parameters of the focal loss [7]. Following Law and Deng [15], α is set to be 2 and β 4 in all our experiments. R ( B , B g t ) denotes the penalty term for predicted box B and target box B g t .
R D I o U ( B , B g t ) = ρ 2 ( b , b g t ) c 2
where b and b g t stand for the central points of B and B g t , ρ ( ) the Euclidean distance, and c the diagonal length of the smallest enclosing box covering the two boxes.
R C I o U ( B , B g t ) = R D I o U ( B , B g t ) + α ν
α = ν 1 I o U + ν
ν = 4 π 2 ( arctan w g t h g t arctan w h ) 2
where α is a positive trade-off parameter, and ν measures the consistency of aspect ratio.

4. Experiments and Discussion

Conducted on the large-scale detection benchmark COCO [5] according to the common practices [10,11,12], our experiments adopted COCO trainval35k split (115 K images) for training and minival split (5 K images) for ablation validation. The training data are the COCO trainval 35 K split, including all the 80 K images from training and a random subset of 35 K images from the 40 K val split. The detection effect of different backbones taking center points as proposals (differentiation module, Centerness-H and CIoU loss functions) has been tested separately. The proposed method’s COCO AP has also been compared to that of state-of-the-art methods on the test-dev split.
The training details are as follows. Unless specified, Darknet-53 [3] was used as the backbone network and the hyper-parameters were set the same as those of RetinaNet [15]. Specifically, the network was trained with stochastic gradient descent (SGD) for 90 K iterations with the initial learning rate of 0.01 and a mini-batch of 16 images. The learning rate was reduced by a factor of 10 at iteration 60 K and 80 K. The values of weight decay and momentum were set as 0.0001 and 0.9, respectively.

4.1. Ablation Study

As the mainstream backbones currently, ResNet-101, Darknet-53, ResNeXt-32 × 8d-101 and Hourglass-104 were adopted in our experiments to output heat maps and feature maps. The test results are compared with YOLOv3 algorithm, FCOS algorithm and OaP algorithm, as shown in Table 1.
It can be observed from Table 1 that by integrating the advantages of other algorithms, CPO detector records better detection results than YOLOv3 detector and FCOS detector. It is faster than FCOS and OaP. Taking center point as proposals, CPO detector could further reduce the number of invalid bounding boxes on the basis of FCOS, balancing the ratio of positive and negative samples. While having similar detection accuracy, Darknet-53 is superior to ResNet-101 in speed. Moreover, as the topology of ResNeXt-32x8d-101 is more conducive to the feature separation and extraction of small targets [21], CPO-RX shares the highest AP among other detectors and significantly higher detection rate of small targets, though its real-time performance is relatively unsatisfactory. The detection effect of CPO-H ranks only second to CPO-RX, as the quality of center points produced by Hourglass-104 is better than those produced by the other three architectures. Yet the feature map extracted by Hourglass-104 is not as good as that by ResNeXt-32x8d-101, and its real-time performance also needs further improvement.
The class-agnostic precision-recall curves on split minival when IOU = 0.50 and 0.75 is presented in Figure 6. As shown in Table 2, having a better bounding box regressor for accurate object detection, CPO performs better than its anchor-free counterpart FCOS and anchor-based counterpart RetinaNet, partly because CPO has the ability to leverage more foreground samples to train the regressor. This also proves that taking the center point as proposals can reduce the number of invalid samples and increase the detection rate. However, as the IOU threshold increases, the improvement effect decreases.
The introduction of additional parameter Center-ness in FCOS detector effectively improves the object detection rate. Center-ness could also be regarded as proposals that could force the network to use the central part of ground-truth bounding boxes as positive sample [13]. Directly related to vector t = [ l , t , r , b ] prediction, the center point in Center-ness is the center point of the cell. If the center point of the target is located near the edge of the cell, as shown in Figure 2a, Center-ness is almost unable to provide effective proposals. Therefore, the center point of the cell was replaced by the center point predicted by the heatmap to generate a new Centerness-H. L r e g usually uses IoU or GIoU as the loss function. As the proposed method uses the center point to locate the cell, substantial invalid cells that need to be calculated were reduced. CIoU [20] may achieve better effect as loss function, improving the target detection rate. Specifically, as a good loss of bounding box regression deals mainly with three important geometric factors, namely, overlap area, center point distance and aspect ratio, and the latter two are only considered by CIoU, CIoU can effectively balance the impact of the object in the loss function. Ablation experiments on differentiation modules, Centerness-H and CIoU were performed separately, as shown in Table 3.
Using the same backbone ResNet-101, FCOS and CPO-R share similar calculation process. In CPO-R, Center-ness is changed into Centerness-H, and the overall AP is improved accordingly as Centerness-H can effectively alleviate the deviation of Center-ness. However, the slight increase of APL indicates that the bounding boxes for detecting large targets are less affected by Center-ness. Overlapping of center points and lack of cells could be alleviated by DM. As the two problems mainly occur during the detection of a small object, APM and APL are less affected, and APS is improved by at least 2%. CIoU has greatly improved the overall AP, because the effect of the combination of the two improved loss functions and the central point is indeed better than that of the original loss function and the central point. This is mainly because the added constraints in the loss function can be better combined with the parameters of the center point, balancing the loss of the target.
In Figure 7a, the center points output by heatmap are almost near the center of the target, thus center points can be used as proposals to locate cells. In Figure 7b–e, the detection effect of OaP and CPO is better than that of YOLOv3 and FCOS. The main reason is that YOLOv3 uses dimension clusters as an priori anchor box to collect samples, and FCOS, based on the idea of semantic segmentation, uses cells instead of anchor boxes to collect samples. The quality and balance of the samples obtained by these two methods are inferior to those of OaP and CPO. Compared with CPO, slight false detection appears in OaP, as it completely relies on center points without constraints. Moreover, compared with CPO, YOLOv3 and FCOS, the bounding boxes output by OaP also appears slightly offset, because its center points have a strong correlation with the two freedom variables (width and height) that affect prediction results, while the predictors of the remaining detectors are independent, leading to better bounding box regression. CPO could detect ambiguous samples in complex scenes. Although missed targets have been reduced, falsely detected targets still exist, as shown in Figure 8. The reason lies partly in the loose constraint on the number of center points.

4.2. Comparison with State-of-the-Art Detectors

The final test results of the proposed method are compared with those of the latest algorithms, as shown in Table 4.
It can be observed from the above table that due to the application of anchor-free methods, current one-stage detectors can almost reach the accuracy of two-stage detectors after years of development, let alone the advantage of speed. The reason why anchor boxes can achieve high accuracy is that preset anchors that can cover almost all the targets are introduced for every point on the feature map. The more presets entail more computation and higher accuracy. However, in the actual scenarios, the utilization rate of these preset anchor boxes is not high, thus many operations are actually invalid, to which the anchor-free method serves as a solution by reducing the calculation caused by massive invalid anchor boxes. The anchor-free method does not explicitly preset the size and scale of various anchor boxes in each location, but the location information is still reserved. It can be considered, equivalently, that anchor-free transforms all kinds of anchor boxes in each position into one anchor. As a result, the number of anchor boxes is linearly reduced, yet most of them are still useless. This study combines the two anchor-free methods by introducing the center point of the heat map as proposals, reducing the number of useless anchor boxes and balancing the training samples. The detection result of this method is better than that of current target detectors in both accuracy and speed, as shown in Figure 9.

5. Conclusions

Using Darknet-53 as the backbone, the detector in this study adopts the feature pyramid and introduces a differentiation module in the shallow layer. The center points generated by the heatmap are taken as proposals to locate the cells on the feature map. Meanwhile, the multi-level prediction in a FCOS detector is employed, Centerness changed into Centerness-H, and IoU into CIoU for better integration with the center point. The detector was trained and tested on the MS COCO dataset. The results show that the combination of proposals and Centerness-H can effectively reduce the number of invalid anchor boxes, improve the quality of anchor boxes, and balance the proportion of positive and negative samples. The differentiation module can alleviate the problem of missing detection caused by the overlapping of center points and improve the detection rate of small objects. The well-combined CIoU and center points could improve the target detection rate. By comparison of the detector designed in this study with the state-of-the-art detectors, it can be concluded that the detector designed in this study outperforms many detectors in speed and accuracy, and the trade-off between speed and accuracy is also satisfactory.

Author Contributions

Conceptualization, H.C. and H.Z.; methodology, H.C.; software, H.C.; validation, H.C. and H.Z.; formal analysis, H.C. and H.Z.; investigation, H.C.; resources, H.Z.; data curation, H.C.; writing—original draft preparation, H.C.; writing—review and editing, H.Z.; visualization, H.C.; supervision, H.Z.; project administration, H.Z.; funding acquisition, H.Z. All authors have read and agreed to the published version of the manuscript.

Funding

This research received no external funding.

Conflicts of Interest

The authors declare no conflict of interest

Abbreviations

The following abbreviations are used in this manuscript:
COCOCommon Objects in COntext
APSAverage Precision of Small Object
Faster R-CNN Faster RCNN: Towards Real-time Object Detection with Region Proposal Networks
SSDSingle Shot Multibox Detector
YOLOv3Yolov3: An Incremental Improvement
DSSDDeconvolutional Single Shot Detector
FCOSFully Convolutional One-Stage Object Detection
OaPObjects as Points
MS COCOMicrosoft Common Objects in COntext
FASFFeature Selective Anchor-Free Module for Single-Shot Object Detection
CNNConvolutional Neural Networks
CIoUDistance-IoU Loss: Faster and Better Learning for Bounding Box Regression

References

  1. Ren, S.; He, K.; Girshick, R.; Sun, J. Faster RCNN: Towards real-time object detection with region proposal networks. In Proceedings of the Advances in Neural Information Processing Systems, Montréal, QC, Canada, 7–10 December 2015; pp. 91–99. [Google Scholar]
  2. Liu, W.; Anguelov, D.; Erhan, D.; Szegedy, C.; Reed, S.; Fu, C.Y.; Berg, A.C. SSD: Single shot multibox detector. In European Conference on Computer Vision; Springer: Berlin/Heidelberg, Germany, 2016; pp. 21–37. [Google Scholar]
  3. Redmon, J.; Farhadi, A. Yolov3: An incremental improvement. arXiv 2018, arXiv:1804.02767. [Google Scholar]
  4. Hinton, G.E.; Krizhevsky, A.; Sutskever, I. Imagenet classification with deep convolutional neural networks. In Proceedings of the Advances in Neural Information Proccessing Systems, Montréal, QC, Canada, 3–8 December 2012; MIT Press: Cambridge, MA, USA, 2012; pp. 1097–1105. [Google Scholar]
  5. Girshick, R.; Donahue, J.; Darrell, T.; Malik, J. Rich feature hierarchies for accurate object detection and semantic segmentation. In Proceedings of the IEEE Conference on Computer Vision and Pattern Recognition, Columbus, OH, USA, 24–27 June 2014; pp. 580–587. [Google Scholar]
  6. Girshic, R. Fast r-cnn. In Proceedings of the IEEE International Conference on Computer Vision, Santiago, Chile, 7–13 December 2015. [Google Scholar]
  7. Lin, T.Y.; Goyal, P.; Girshick, R.; He, K.; Dollár, P. Focal loss for dense object detection. In Proceedings of the IEEE International Conference on Computer Vision, Venice, Italy, 22–29 October 2017; pp. 2980–2988. [Google Scholar]
  8. Redmon, J.; Divvala, S.; Girshick, R.; Farhadi, A. You only look once: Unified, real-time object detection. In Proceedings of the IEEE Conference on Computer Vision and Pattern Recognition, Las Vegas, NV, USA, 27–30 June 2016. [Google Scholar]
  9. Fu, C.-Y.; Liu, W.; Ranga, A.; Tyagi, A.; Berg, A.C. Dssd: Deconvolutional single shot detector. arXiv 2017, arXiv:1701.06659. [Google Scholar]
  10. He, K.; Gkioxari, G.; Dollár, P.; Girshick, R. Mask r-cnn. In Proceedings of the IEEE International Conference on Computer Vision, Venice, Italy, 22–29 October 2017. [Google Scholar]
  11. Lin, T.Y.; Dollár, P.; Girshick, R.; He, K.; Hariharan, B.; Belongie, S. Feature pyramid networks for object detection. In Proceedings of the IEEE Conference on Computer Vision and Pattern Recognition, Honolulu, HI, USA, 21–27 July 2017; pp. 2117–2125. [Google Scholar]
  12. Lin, T.Y.; Maire, M.; Belongie, S.; Hays, J.; Perona, P.; Ramanan, D.; Dollár, P.; Zitnick, C.L. Microsoft COCO: Common objects in context. In European Conference on Computer Vision; Springer: Berlin/Heidelberg, Germany, 2014; pp. 740–755. [Google Scholar]
  13. Tian, Z.; Shen, C.; Chen, H.; He, T. FCOS: Fully Convolutional One-Stage Object Detection. In Proceedings of the IEEE International Conference on Computer Vision (ICCV), Seoul, Korea, 27 October–2 November 2019. [Google Scholar]
  14. Zhou, X.; Wang, D.; Krähenbühl, P. Objects as Points. arXiv 2019, arXiv:1904.07850. [Google Scholar]
  15. Law, H.; Deng, J. Cornernet: Detecting objects as paired keypoints. In Proceedings of the European Conference on Computer Vision (ECCV), Munich, Germany, 8–14 September 2018; pp. 734–750. [Google Scholar]
  16. Zhou, X.; Zhuo, J.; Krähenbühl, P. Bottom-up Object Detection by Grouping Extreme and Center Points. In Proceedings of the IEEE Conference on Computer Vision and Pattern Recognition, Long Beach, CA, USA, 16–20 June 2019. [Google Scholar]
  17. Zhu, C.; He, Y.; Savvides, M. Feature Selective Anchor-Free Module for Single-Shot Object Detection. In Proceedings of the IEEE Conference on Computer Vision and Pattern Recognition (CVPR), Long Beach, CA, USA, 16–20 June 2019. [Google Scholar]
  18. Kong, T.; Sun, F.; Liu, H.; Jiang, Y.; Li, L.; Shi, J. FoveaBox: Beyond Anchor-based Object Detector. IEEE Trans. Image Process. 2019, 29, 7389–7398. [Google Scholar] [CrossRef]
  19. Huang, L.; Yang, Y.; Deng, Y.; Yu, Y. Densebox: Unifying landmark localization with end to end object detection. arXiv 2015, arXiv:1509.04874. [Google Scholar]
  20. Zheng, Z.; Wang, P.; Liu, W.; Li, J.; Ye, R.; Ren, D. Distance-IoU Loss: Faster and Better Learning for Bounding Box Regression. In Proceedings of the AAAI Conference on Artificial Intelligence (AAAI), New York, NY, USA, 7–12 February 2020. [Google Scholar]
  21. Xie, S.; Girshick, R.; Dollár, P.; Tu, Z.; He, K. Aggregated Residual Transformations for Deep Neural Networks. In Proceedings of the IEEE Conference on Computer Vision and Pattern Recognition, Las Vegas, NV, USA, 27–30 June 2016. [Google Scholar]
  22. Wu, Y.; He, K. Group normalization. In Proceedings of the European Conference on Computer Vision, Munich, Germany, 8–14 September 2018; pp. 3–19. [Google Scholar]
  23. Singh, B.; Najibi, M.; Davis, L.S. Sniper: Efficient multi-scale training. In Proceedings of the Advances in neural information processing systems, Montréal, QC, Canada, 2–8 December 2018. [Google Scholar]
  24. Li, Y.; Chen, Y.; Wang, N.; Zhang, Z. Scale-aware trident networks for object detection. arXiv 2019, arXiv:1901.01892. [Google Scholar]
Figure 1. Detection effect of anchor-free algorithm. (a) Prediction of 4D vector by FCOS [13]. (b) Prediction of the center point by OaP [14]. The images are from the MS COCOtrain2017 dataset.
Electronics 09 02075 g001
Figure 2. (a) Cell detection of FCOS algorithm. (b) Heatmap of OaP algorithm.
Electronics 09 02075 g002
Figure 3. (a) Test result of FCOS. (b) Heatmap of OaP, (c) test result of OaP. In (b) (c), the red, yellow and blue rectangular boxes correspond to each other. There is a missing target in the rectangular boxes.
Electronics 09 02075 g003
Figure 4. The network architecture of model C2–C6 denote the feature maps of the backbone network and P3-P6 the feature levels used for the final prediction. P2 is used to generate keypoint heatmap. Differentiation means differentiation module, and H × W the height and width of feature maps. ‘/s’ (s = 4, 8, 16, ..., 64) is the down-sampling ratio of the level of feature maps to the input image. All the numbers are computed with an input of 512 × 512.
Electronics 09 02075 g004
Figure 5. Workflow of differentiation module. The differentiation module mainly includes 3 steps. The output result is composed of N max Heads.
Electronics 09 02075 g005
Figure 6. Class-agnostic precision-recall curves when intersection-over-union (IOU) = 0.50 and 0.75.
Electronics 09 02075 g006
Figure 7. Experimental test results. (a) Heatmap output result. (b) YOLOv3 detector test result. (c) FCOS detector test result. (d) OaP detector test result. (e) CPO detector test result.
Electronics 09 02075 g007
Figure 8. Test result of ambiguous samples. (a) Heatmap output results. (b) FCOS detector test result. (c) CPO detector test result. The black bounding box represents missed targets and the red bounding box the falsely detected targets.
Electronics 09 02075 g008
Figure 9. Speed-accuracy trade-off on COCO validation for real-time detectors (CPO outperforms many algorithms).
Electronics 09 02075 g009
Table 1. Comparison of backbone outputs. The backbone of (center point proposal) CPO-R is ResNet-101, the backbone of CPO-RX is ResNeXt-32x8d-101, the backbone of CPO-H is Hourglass-104 and the backbone of CPO is Darknet-53.
MethodBackboneAPAP50AP75APSAPMAPLTime
YOLOv3Darknet-5333.057.934.418.335.441.951 ms
FCOSResNet-10141.060.744.124.044.151.074 ms
OaPHourglass-10442.161.145.924.145.552.8128 ms
CPO-RResNet-10141.160.944.124.144.251.070 ms
CPODarknet-5341.261.044.224.144.351.165 ms
CPO-RXResNeXt-32x8d-10142.362.345.425.645.252.3231 ms
CPO-HHourglass-10442.261.246.124.245.752.8145 ms
Table 2. Class-agnostic detection performance.
MethodAPAP50AP75
Orginal RetinaNet39.563.641.8
RetinaNet w/GN [22]40.064.542.2
FCOS40.564.742.6
CPO41.065.042.8
+0.3+0.2
Table 3. Ablation results (DM: differentiation module, CH: Centerness-H).
MethodDMCHCIoUAPAP50AP75APSAPMAPL
FCOS 41.060.744.124.044.151.0
CPO-R 41.160.944.124.144.251.0
CPO-R 41.961.744.624.845.151.2
CPO 42.261.245.826.844.351.1
42.962.746.327.445.351.3
43.263.146.527.845.551.4
OaP 42.161.145.924.145.552.8
OaP 42.662.146.126.245.552.8
Table 4. CPO vs. other state-of-the-art detectors on COCO test-dev. (Top: two-stage detectors; bottom: one-stage detectors. Multi-scale test is conducted for most one-stage detectors).
MethodBackboneAPAP50AP75APSAPMAPLTime (ms)
Two-stage methods:
Faster R-CNN w/FPNResNet-101-FPN36.259.139.018.239.048.2172
MaskRCNNResNeXt-10139.862.343.422.143.251.291
SNIPER [23]DPN-9846.167.051.629.648.958.1400
TridentNet [24]ResNet-101-DCN48.469.753.531.851.360.31429
One-stage methods:
SSD513ResNet-101-SSD31.250.433.310.234.549.8125
YOLOv3Darknet-5333.057.934.418.335.441.951
RetinaNetResNeXt-101-FPN40.861.144.124.144.251.2185
CornerNet(multi)Hourglass-10442.157.845.320.844.856.7244
ExtremeNet(multi)Hourglass-10443.760.547.024.146.957.6323
FASF(multi)ResNeXt-10144.665.248.629.747.154.6370
FCOSResNet-101-FPN41.060.744.124.044.151.074
OaPHourglass-10442.161.145.924.145.552.8128
CPODarknet-5343.263.146.527.845.551.4137
Publisher’s Note: MDPI stays neutral with regard to jurisdictional claims in published maps and institutional affiliations.

