The Detection of Black Ice Accidents for Preventative Automated Vehicles Using Convolutional Neural Networks


1
Department of Urban Design & Planning, Hongik University, Seoul 04066, Korea
2
Department of Smartcity, Hongik University Graduate School, Seoul 04066, Korea
3
Research Institute of Science and Technology, Hongik University, Seoul 04066, Korea
*
Author to whom correspondence should be addressed.
Electronics 2020, 9(12), 2178; https://0-doi-org.brum.beds.ac.uk/10.3390/electronics9122178
Submission received: 13 November 2020
/
Revised: 7 December 2020
/
Accepted: 16 December 2020
/
Published: 18 December 2020
(This article belongs to the Special Issue AI-Based Transportation Planning and Operation)
Abstract
:Automated Vehicles (AVs) are expected to dramatically reduce traffic accidents that have occurred when using human driving vehicles (HVs). However, despite the rapid development of AVs, accidents involving AVs can occur even in ideal situations. Therefore, in order to enhance their safety, “preventive design” for accidents is continuously required. Accordingly, the “preventive design” that prevents accidents in advance is continuously required to enhance the safety of AVs. Specially, black ice with characteristics that are difficult to identify with the naked eye—the main cause of major accidents in winter vehicles—is expected to cause serious injuries in the era of AVs, and measures are needed to prevent them. Therefore, this study presents a Convolutional Neural Network (CNN)-based black ice detection plan to prevent traffic accidents of AVs caused by black ice. Due to the characteristic of black ice that is formed only in a certain environment, we augmented image data and learned road environment images. Tests showed that the proposed CNN model detected black ice with 96% accuracy and reproducibility. It is expected that the CNN model for black ice detection proposed in this study will contribute to improving the safety of AVs and prevent black ice accidents in advance.
1. Introduction
As discussions on the fourth industrial revolution become more active, there is a movement to utilize big data, artificial intelligence, and 5G. Among them, Automated Vehicles (AVs), a collection of various technologies, are attracting attention in the transportation field. AVs are expected to bring effects such as improving mobility for the vulnerable and reducing traffic congestion costs and are expected to minimize human and material losses in terms of preventing traffic accidents caused by driver negligence [1,2]. Currently, various companies such as Google, NVIDIA, and Tesla are developing and experimenting with AV systems, and each country is reorganizing its institutional foundation to prepare for the commercialization of AVs. Despite these efforts, however, traffic accidents continue to occur in autonomous driving situations, and the social acceptability of AVs has emerged due to Uber’s pedestrian deaths in 2018 [3,4,5]. In order to solve these problems fundamentally, Germany and the United States have issued an ethics guideline for AVs [6,7]. The guidelines specify the need to develop principles to cope with dilemma situations, along with information on the preventive design of the AVs to avoid accidents. Preventive design of AVs is an issue about risk management that can occur in a realistic driving environment, changing from passive safety systems to active safety systems research [8]. In addition, recently, there has been a change in the tendency toward preventing accidents themselves by learning all the accident situations related to AVs [9]. While various preventive design studies are being carried out, there is a lack of research on preventing black ice accidents, which are the main cause of large-scale traffic accidents in winter. Black ice is a thin ice film formed on the road by combining rain and snow with pollutants such as dust, which is likely to lead to fatal accidents because it is difficult to identify with the naked eye. As black ice is considered to be a potential accident factor even in the era of commercialization of AVs, it is expected that technologies that can detect it in advance, and thus prevent accidents, will be required. Therefore, we will adopt the Convolutional Neural Network method, which is known to detect object’s images most effectively, to present measures for preventing AV-related black ice accidents in the study.
This study is conducted in the following order: Section 2 discusses the research on the use of Convolutional Neural Networks (CNN) in the field of transportation and derives the differentiation of this research, while Section 3 sets up the CNN model learning environment for the detection of black ice. Section 4 identifies and analyzes learning results through models, and Section 5 presents implications and future studies with a brief summary.
2. Literature Review
In this chapter, we consider existing detection methods for black ice and studies using CNN in the transportation field to derive the differentiation of this study.
2.1. Black Ice Detection Methods
Methods for detecting black ice include sensors [10,11,12], sound waves [13,14], and light sources [15]. Habib Tabatabai et al. (2017) [10] conducted a study to detect black ice, ice and water in roads and bridges using sensors embedded in concrete. In this study, a sensor that detects the road surface condition was proposed through the change of electrical resistance between stainless steel columns inside concrete. As a result of conducting experiments under various surface conditions, it was suggested that the proposed sensor can effectively detect the road condition, thereby preventing various accidents. Nuerasimuguli ALIMASI et al. (2012) [11] conducted a study to develop a black ice detector consisting of an optical sensor and an infrared thermometer. The study was conducted in Route 39 around Sekihoku Pass, Hokkaido, and was conducted on a total of six road conditions (dry, wet, “sherbet”, compact snow, glossy compacted snow, black ice) and diffuse reflection and reflection. As a result of the experiment, black ice had a large specular reflection () and a small diffuse reflection () was measured, resulting in a low (/) value. Youngis E. Abdalla et al. (2017) [12] proposed a system for detecting black ice using Kinect. The types of ice (Soft Ice, Wet Snow, Hard Ice, Black Ice) were classified and the thickness and volume of the ice were measured using Kinect. Experiments have shown that the types of ice formed in the range of 0.82 m to 1.52 m from the camera can be distinguished, and the error rate of measured thickness and volume is very low, suggesting that black ice can be detected by utilizing Kinect. Xinxu Ma et al. (2020) [15] studied a black ice detection method using a three-wavelength non-contact optical technology. The study conducted an experiment to distinguish dry, wet, black ice, ice and snowy conditions using three wavelengths (1310 nm, 1430 nm, 1550 nm). As a result of the experiment, it was confirmed that black ice was detected through the reflectance of each wavelength, and it was suggested that it can be used as basic data for the development of equipment to detect road conditions.
2.2. Deep Learning Applications to Intelligent Transportation
Artificial Intelligence (AI) methodologies are currently being used in various fields, and CNN studies using image data for the detection of vehicles and pedestrians, detection of traffic signs, and detection of road surface are actively carried out in the transportation field.
First of all, for vehicle and pedestrian detection, studies using AlexNet [16,17], VGG (Visual Geometry Group) 16 [18], Mask R-CNN [19], and Faster R-CNN [20,21] existed, and a comparative analysis of the performance of Faster R-CNN and YOLO (You Only Look Once) [22,23]. Lele Xie et al. (2018) [24] conducted a vehicle license plate detection study at various angles using CNN-based Multi-Directive YOLO (MD-YOLO). The study proposed an ALMD-YOLO structure combining CNN and MD-YOLO, and compared the performance of various models (ALMD-YOLO, Faster R-CNN, SSD (Single Shot multibox Detector), MD-YOLO, etc.) and found that the newly proposed ALMD-YOLO had the best performance. It also suggested that the simple structure of the model reduced the computational time and that a high-performance multi-way license plate detection model could be established. Ye Yu et al. (2018) [25] proposed a CNN-based Feature Fusion based Car Model Classification Net (FF-CMNET) for the precise classification of vehicle models. The above study utilized FF-CMNET, which combines UpNet to extract the upper features of the car’s frontal image and DownNet to extract the lower features. Experiments have shown performance better than traditional CNN methodologies (AlexNet, GoogLeNet, and Network in Network (NIN)) in terms of extracting the car’s fine features. M. H. Putra et al. (2018) [26] conducted a study using YOLO to detect people and cars. Unlike the traditional YOLO structure, the above study proposed a modified YOLO structure using seven convolutional layers and compared their performance. As a result of the study, the modified YOLO’s 11 × 11 grid cells model had a lower mAP compared to the traditional YOLO model, but had better processing speed. In addition, tests with actual images showed that small-sized people and cars could be extracted.
Second, in the case of traffic sign detection, there have been many studies using the basic CNN structure [27,28,29,30], Mask R-CNN [31,32], and Faster R-CNN [33,34]. Rongqiang Qian et al. (2016) [35] conducted a study using Fast R-CNN to recognize traffic signs on road surfaces. To enhance the performance of the model, the experiment was conducted by utilizing MDERs (Maximally Stable Extremal Regions) and EdgeBoxes algorithms in the object recognition process. The results of the experiment showed that the Recall rate was improved, with an average precision of 85.58%. Alexander Shustanov and Yakimov, P. (2017) [36] conducted a CNN model design study for real-time traffic sign recognition. The study used modified Generalized Hough Transform (GHT) and CNN, with 99.94% accuracy. It was also confirmed that the proposed algorithm could process high-definition images in real time and accurately recognize traffic signs farther away than similar traffic sign recognition systems. Lee, H.S. and Kim, K. (2018) [37] conducted a study using CNN to recognize the boundaries of traffic signs. They designed CNN based on SSD architecture, and unlike previous studies, they proposed a method of estimating the positions of signs and converting them into boundary estimates. Experiments have confirmed that various types of traffic sign boundaries can be detected quickly.
Finally, studies of road surface detection were reviewed to identify road surface conditions and to detect road cracks. Juan Carrillo et al. (2020) [38] and Guangyuan Pan et al. (2020) [39] are both studies that identify road surface conditions. The above studies divided the data into three and four classes and compared the performance of the CNN model. Studies found that up to 91% accuracy was derived, and CNN showed excellent performance in road surface identification. In the road crack detection study, Janpreet Singh et al. (2018) [40] conducted a study using Mask R-CNN to detect road damage in images taken with smartphones. The data utilized 9053 road damage images taken with smartphones, and the CNN’s structure utilized Mask R-CNN. Experiments have confirmed that road damage is detected effectively, showing high accuracy and 0.1 s processing speed. Zheng Tong et al. (2018) [41] conducted a study to classify the length of asphalt cracks using DCNN (Deep Convolutional neural networks). Data collection was conducted in various places and weather conditions, and the data were divided into eight classes from 0 cm to 8 cm in 1 cm increments. As a result of the experiment, the accuracy was 94.36% and the maximum length error was 1 cm, and it was suggested that the length of the crack can be classified as well as the existence of a simple crack. Baoxian Li et al. (2020) [42] conducted a study using CNN to classify road crack types. Road cracks were classified into a total of five types (non-crack, transverse crack, longitude crack, block crack, alligator crack) and four models were designed using the basic CNN structure. As a result of the experiment, the accuracy of the four models designed was 94% or more. It was also confirmed that CNN, which has a 7 × 7 size of the reactive field, was the best choice for crack detection.
2.3. Summary
In summary, it was confirmed that various studies using black ice detection research and CNN in the transportation field are in progress. In addition, a study on CNN in the transportation sector has been conducted to detect the most important objects that make up road environment, such as pedestrians, vehicles, traffic signs, and road surfaces, and object detection using CNN shows a fast processing speed and high accuracy. In spite of such studies, it is expected that there is a limit to preventing black ice accidents in advance due to problems such as the installation of traditional black ice detection systems. Accordingly, this study proposes a method to detect black ice by identifying road conditions based on the CNN technique to prevent black ice accidents in AVs
3. Learning Environment Setting
CNN is a type of AI that uses convolutional computation, which emerged in 1998 when Yann LeCun proposed the LeNet-5 [43]. CNN is one of the most popular methodologies in image analysis, with features that maintain and deliver spatial information on images by adding synthetic and pooling layers to existing Artificial Neural Networks (ANN) to understand dimensional characteristics. As we considered earlier, there are various studies using CNN in the transportation sector, but the study of black ice detection on the road has only thus far been conducted using other methodologies (sensors and optics) [10,11,12,13,14,15] other than research using AI. Black ice is reckoned to be a potential accident factor in the future era of AVs as it leads to large-scale collisions in winter due to features that are hard to distinguish with the naked eye. Accordingly, we will perform the detection of black ice by utilizing the CNN technique, which is considered to have excellent performance in object detection using images, rather than the traditional black ice detection methods.
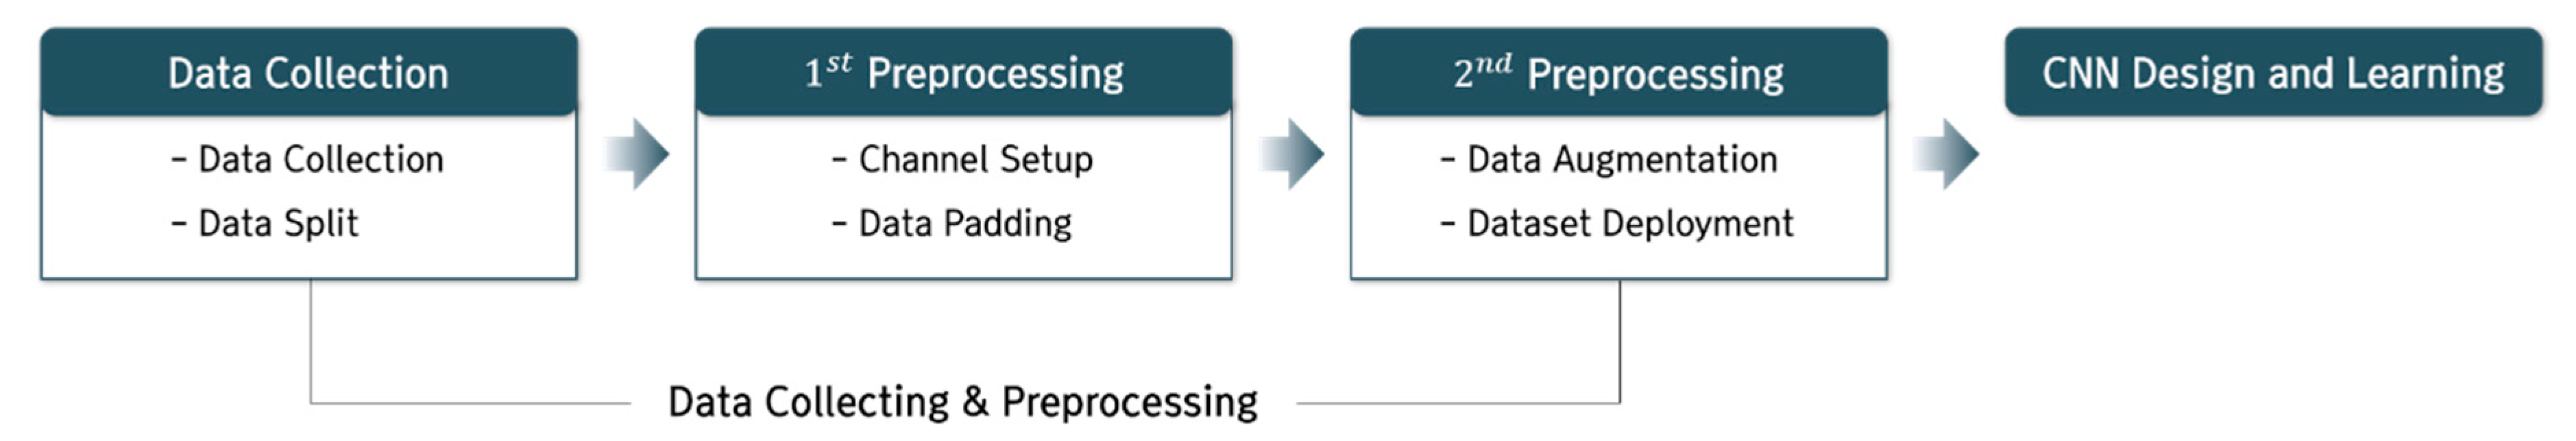
The proposed learning environment of the CNN model for black ice detection consists largely of data collection and preprocessing, model design and the learning process. In this chapter, we set up the data collection, 1st preprocessing, and 2nd preprocessing, and the model was designed and learning undertaken (see Figure 1).
3.1. Data Collecting and Preprocessing
This chapter consists of data collection for learning black ice detection, 1st preprocessing, and 2nd preprocessing.
3.1.1. Data Collection
In data collection, the method of data collection and the splits on the collected data were performed.
- Data Collection
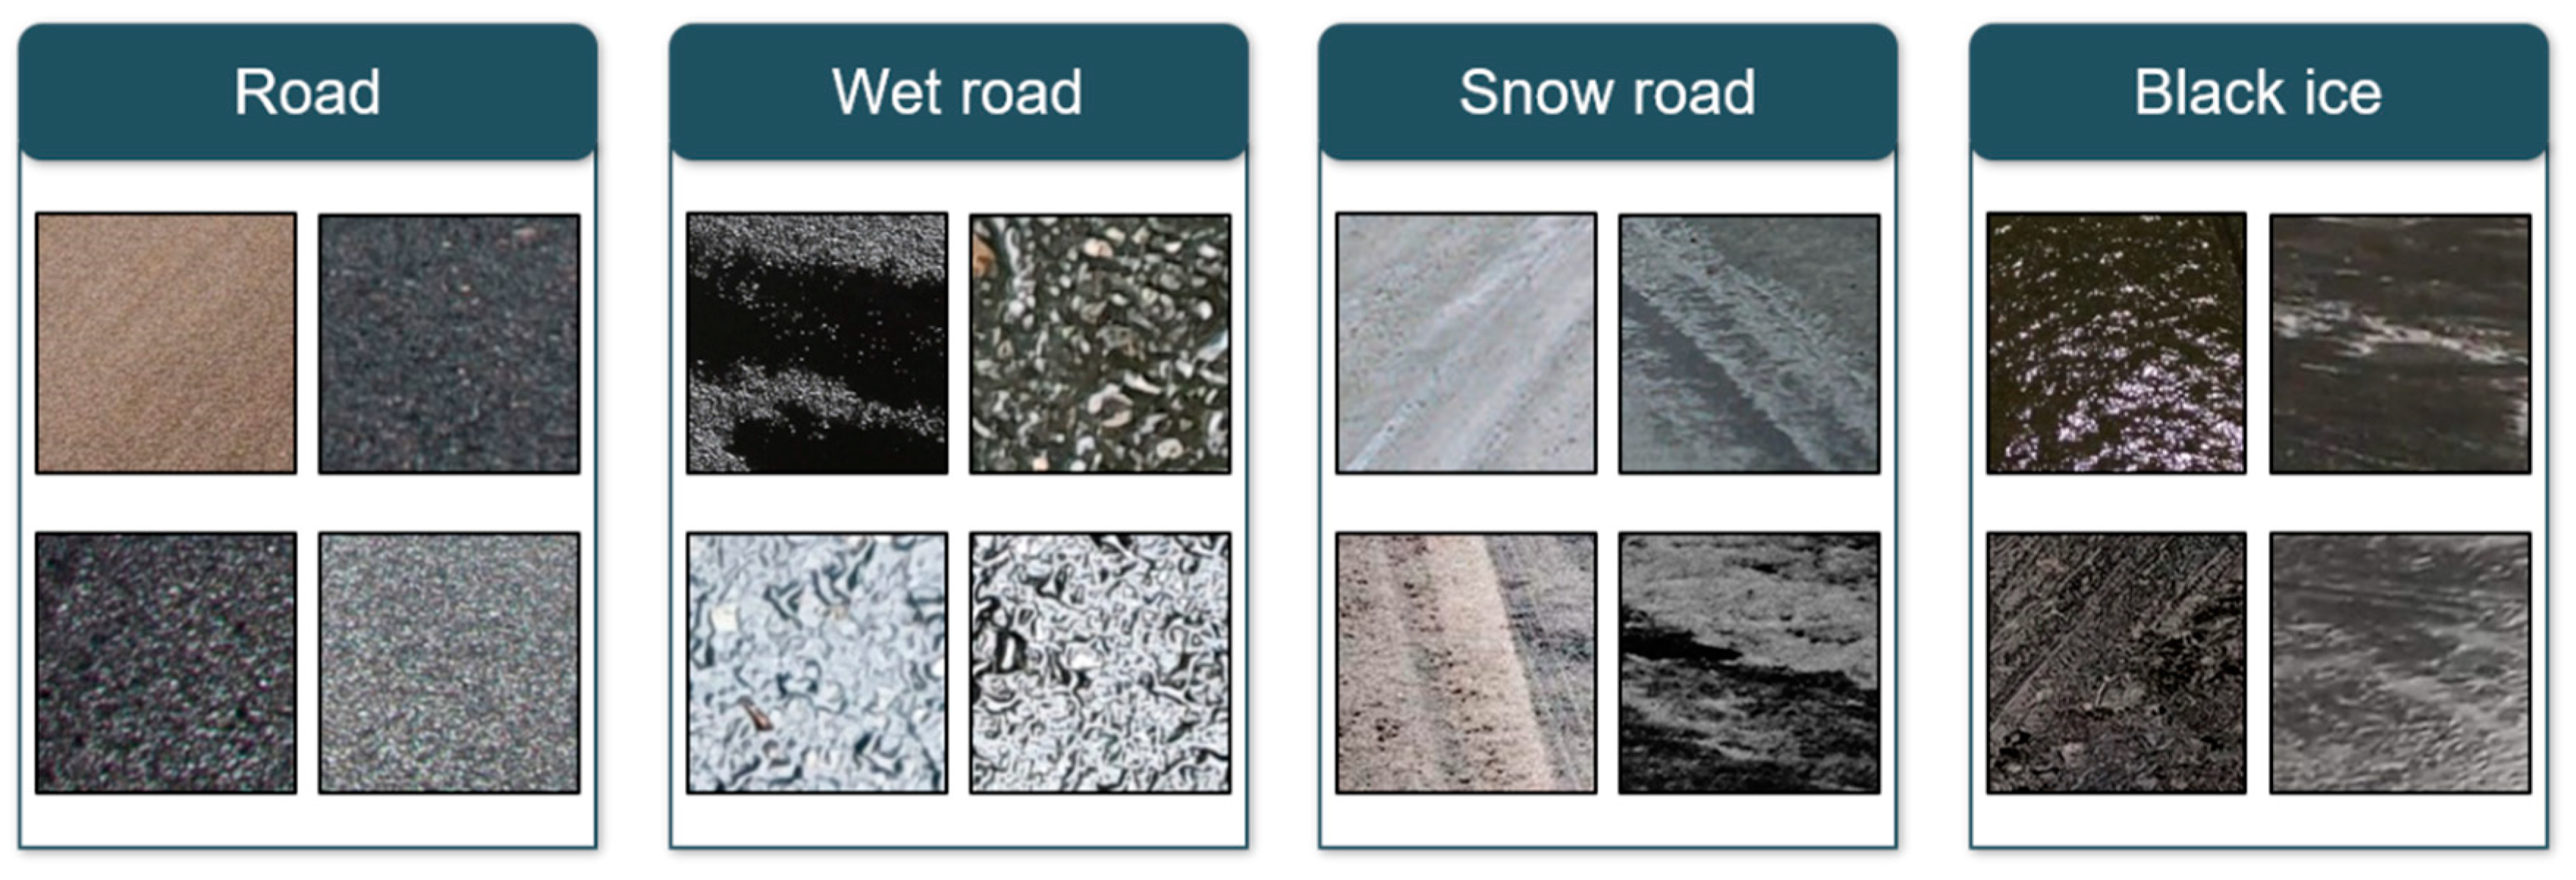
For learning, image data was collected using Google Image Search, and data was collected in four categories: road, wet road, snow road and black ice. During the collection process, image data taken in various regions and road environments were obtained, and a total of 2230 image data were collected as shown in Table 1.
- 2.
- Data Split
We split various regional and road environment data collected through Google Image Search. This is the process of removing objects that interfere with the extraction of features, such as road structures, lanes, and shoulder, within the image so that the characteristics of each category can be clearly identified. In this process, there were pros and cons depending on the size of the data (see Table 2). Smaller data sizes have disadvantages in identifying image characteristics compared to larger cases, but they have the advantages of having a large number of images and having deep neural network implementations. On the other hand, when the data are large, feature extraction can be more accurate because it can clearly identify the characteristics of the image compared to the smaller image, but the disadvantage is that the number of images is reduced and the deep neural network is difficult to implement. Accordingly, in this study, data crop was carried out in 128 × 128 px size to proceed with learning through deep neural network and large number of images. The results of the data split are shown in Figure 2.
3.1.2. 1st Preprocessing
In the 1st Preprocess, the channel setup and data padding for learning were performed.
- Channel Setup
The color image of 128 × 128 px obtained earlier through data split has the advantage of being easy to identify the characteristics of the data in the form of three channels. However, since there are three channels of data, the size of the data is large, which limits the number of learning data and the implementation of deep neural networks, this study has transformed the data into black and white image data to conduct learning (see Table 3).
- 2.
- Data Padding
Data padding is one of the ways to resize learning images by adding spaces and meaningless symbols to the end of existing data. As a result of learning without data padding in the augmentation conducted during the 2nd preprocess of this study, very low accuracy (25%) and high loss values were identified (Table 4). This is because the edges of the image data are distorted by the data enhancement. Accordingly, in this study, the image data were padded to prevent distortion of the edges of the data.
During the 1st preprocessing, during which channel setup and data padding were performed, image data of 150 × 150 px in GRAYSCALE format were obtained as follows: There are 4900 road and wet road image data and 4900 snow road and black ice image data (Table 5).
3.1.3. 2nd Preprocessing
In the 2nd preprocessing, there was a limit to collecting more diverse image data through Google Image Search, so data sets were built through data augmentation to increase their accuracy.
For AI learning models, large amounts of data are essential for high accuracy and prevention of overfitting [44]. In particular, black ice, which is intended to be detected in this study, is characterized by seasonal characteristics and unusual forming conditions that do not occur in many places. As a result, the data collection process did not collect a large amount of data compared to the other data. Accordingly, to improve the accuracy of CNN proposed in this study, the ImageDataGenerator function provided by the Keras library [45] was used to augment the data under the conditions in (Table 6).
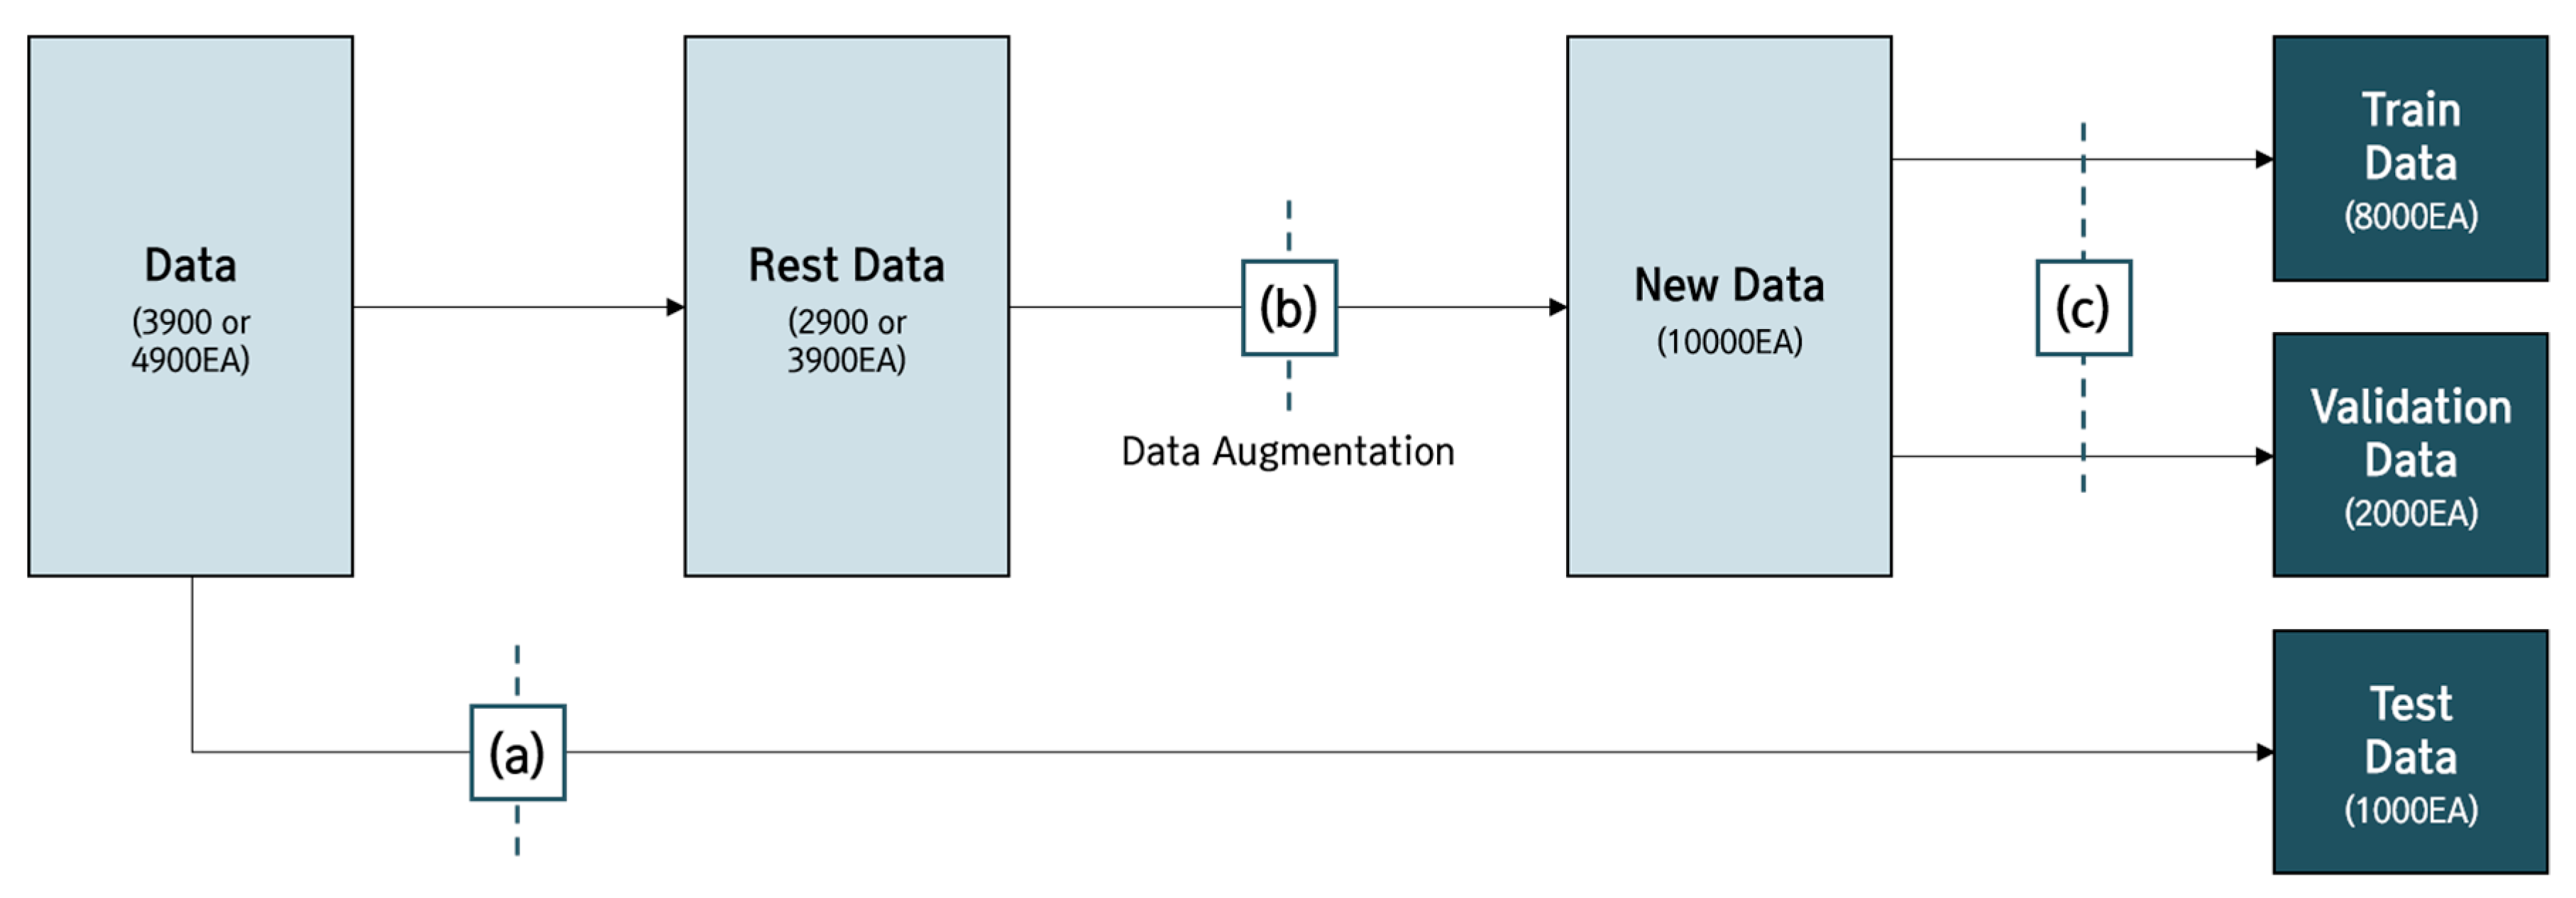
The process of building a data set through data augmentation is as follows. From the previously obtained 17,600 sheets of data, 1000 were randomly extracted per class and set as test data. Since then, the data have been augmented using the ImageDataGenerator function for the rest data, which has built 10,000 data per class. The train data and validation data were then set at 8:2. Accordingly, the final data set was set to 8:2:1 in all classes to proceed with the learning (Figure 3 and Table 7).
3.2. CNN Design and Learning
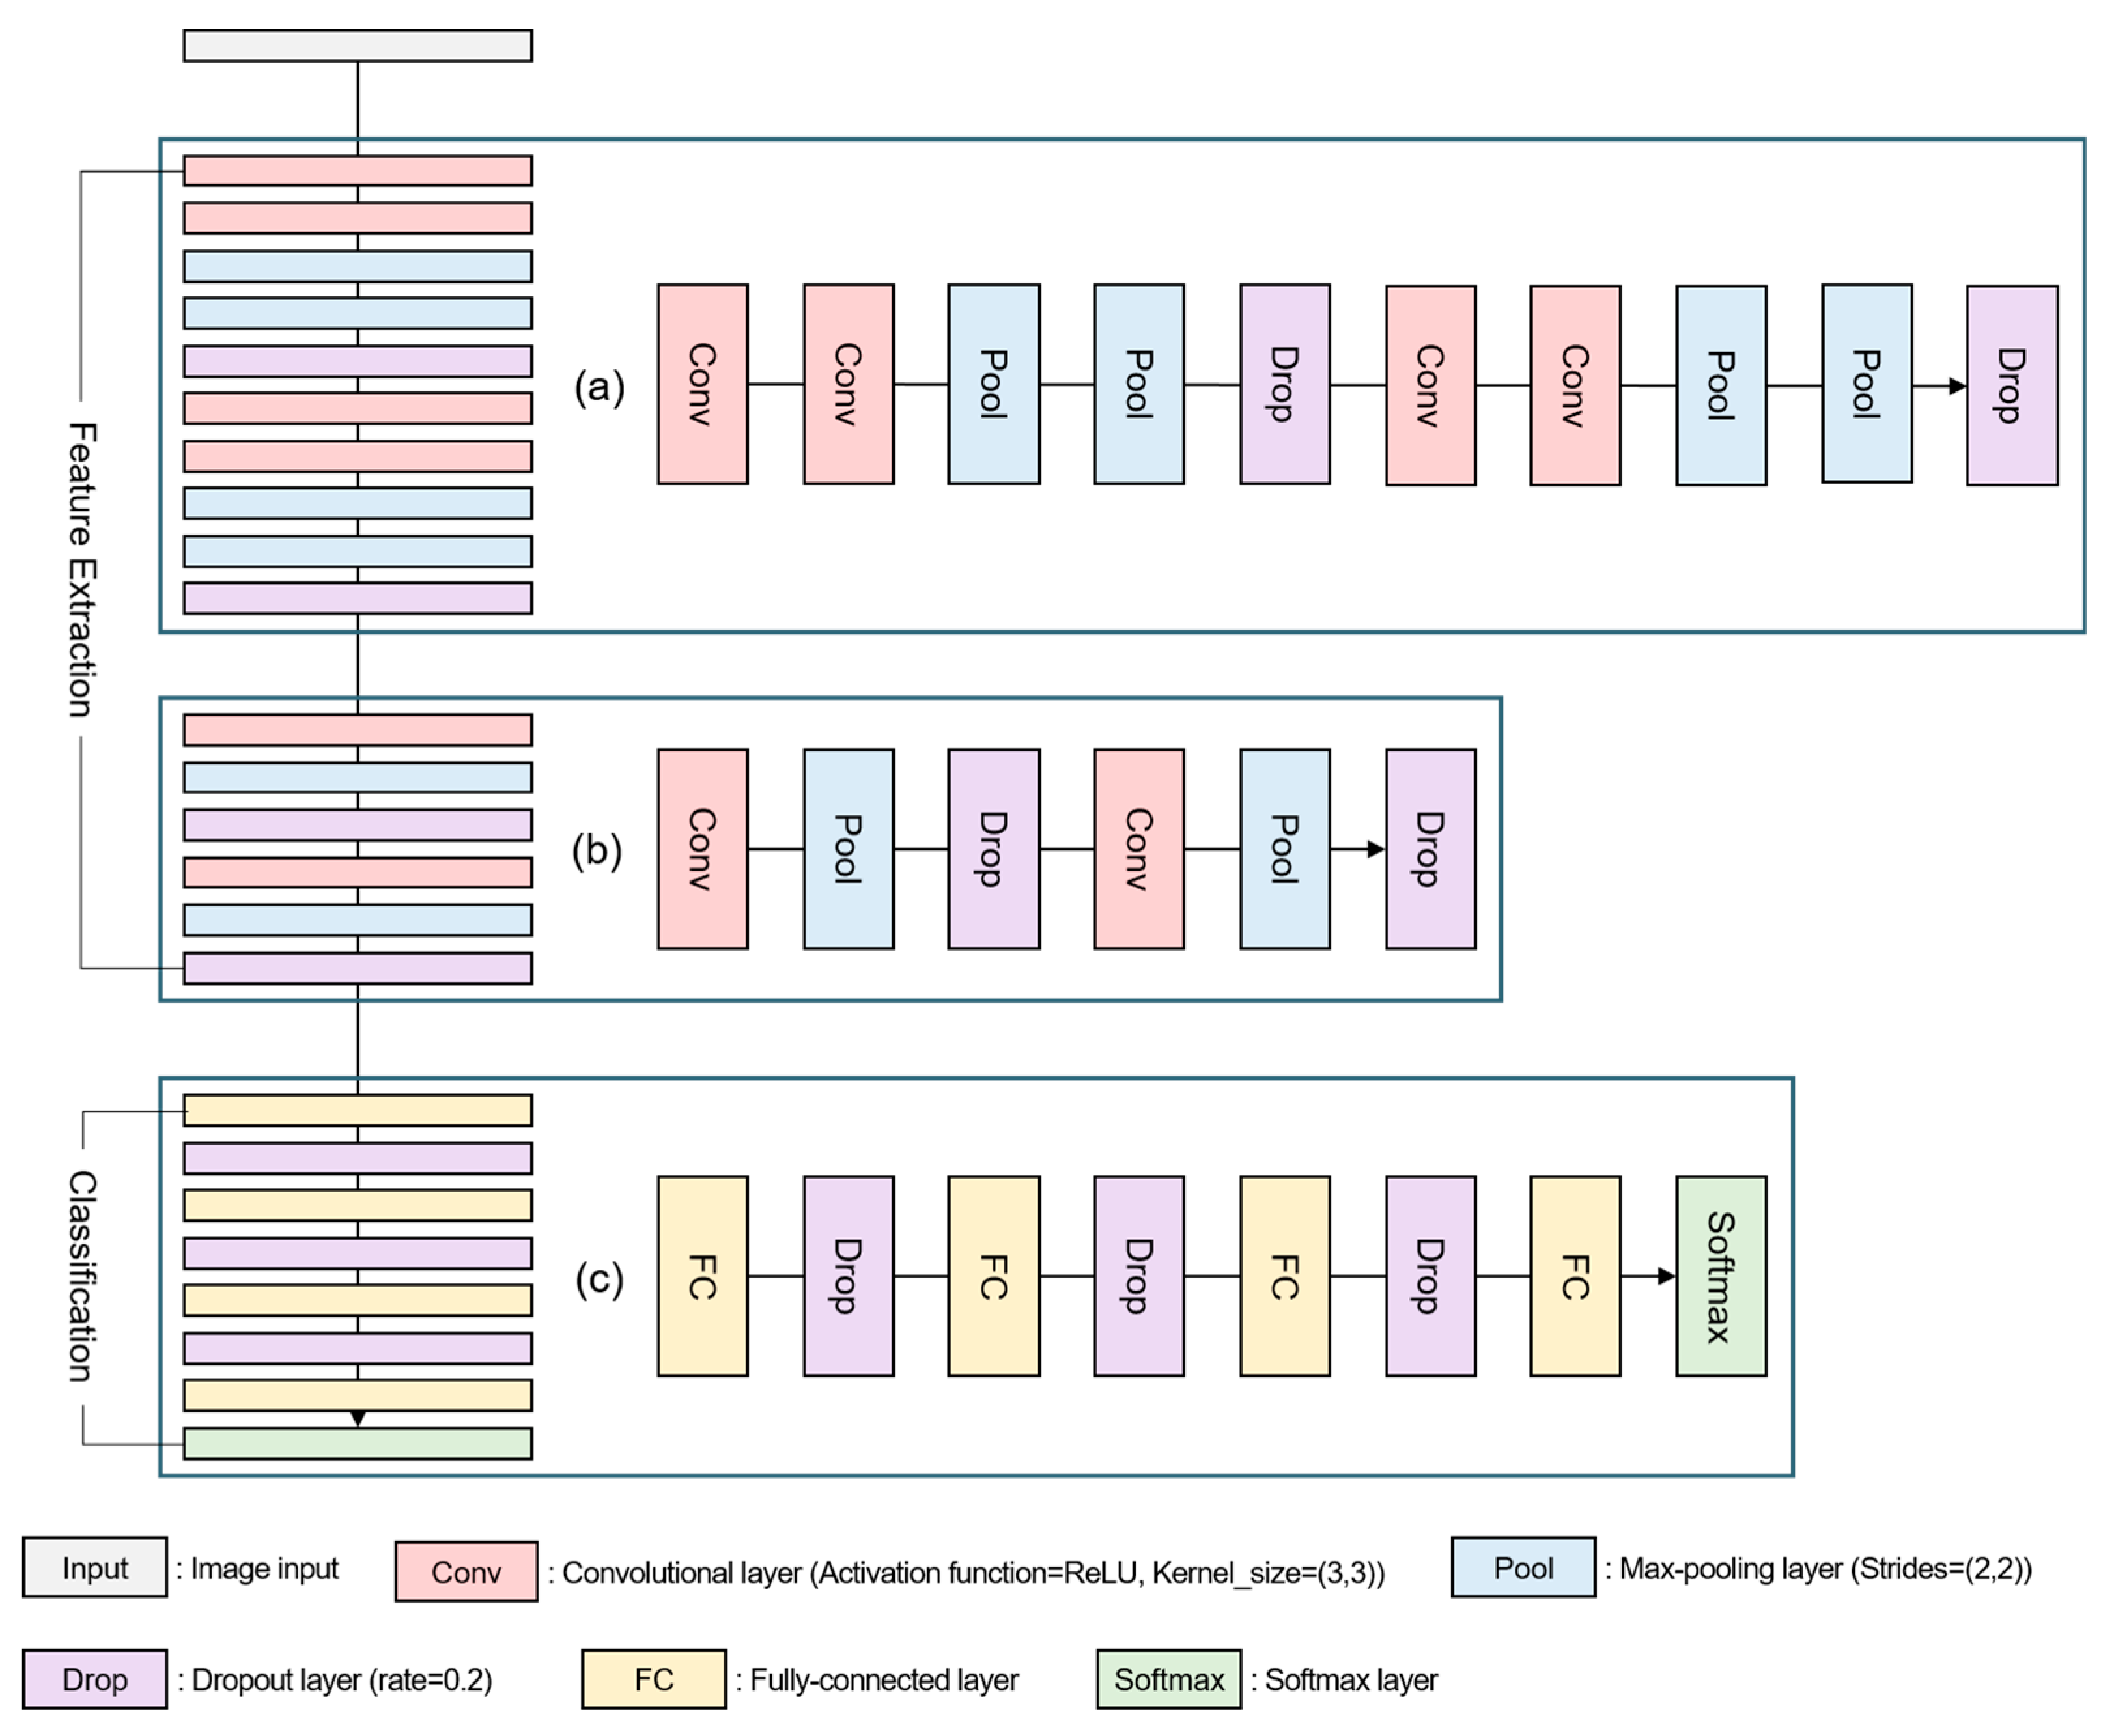
The structure of the CNN model used in this study consists of the Feature Extraction and Classification as shown in Figure 4. In the feature extraction, two convolutional layers, two max-pooling layers, and one dropout layer were arranged to conduct two iterations (Figure 4a). Each layer was then arranged once and repeated twice (Figure 4b). In addition, we used ReLU (Rectified Linear Unit), which has a fast learning speed and prevents gradient vanishing [46], as the activation function. In the case of kernel size of the convolutional layer, (3,3) was applied because the repetition of (3,3) has a fast learning speed and extracts features well [47]. The Stride of the max pooling layer was (2,2), and the Dropout rate of the dropout layer was experimentally applied 0.2. In the classification, the Fully-Connected layer and the Dropout layer were alternately placed, Softmax was applied to the output layer (Figure 4c), and the SGD (Stochastic Gradient Descent) Optimizer was used for high experimental accuracy. In addition, we applied 200 epochs, 32 batch size and the earlystopping function for optimizing the model and preventing overfitting. The earlystopping function terminates learning when there is no room for improvement in the model. Therefore, we designed this study to stop learning if the validation loss does not update the minimum value within 20 times (see Table 8)
4. Result
4.1. Result
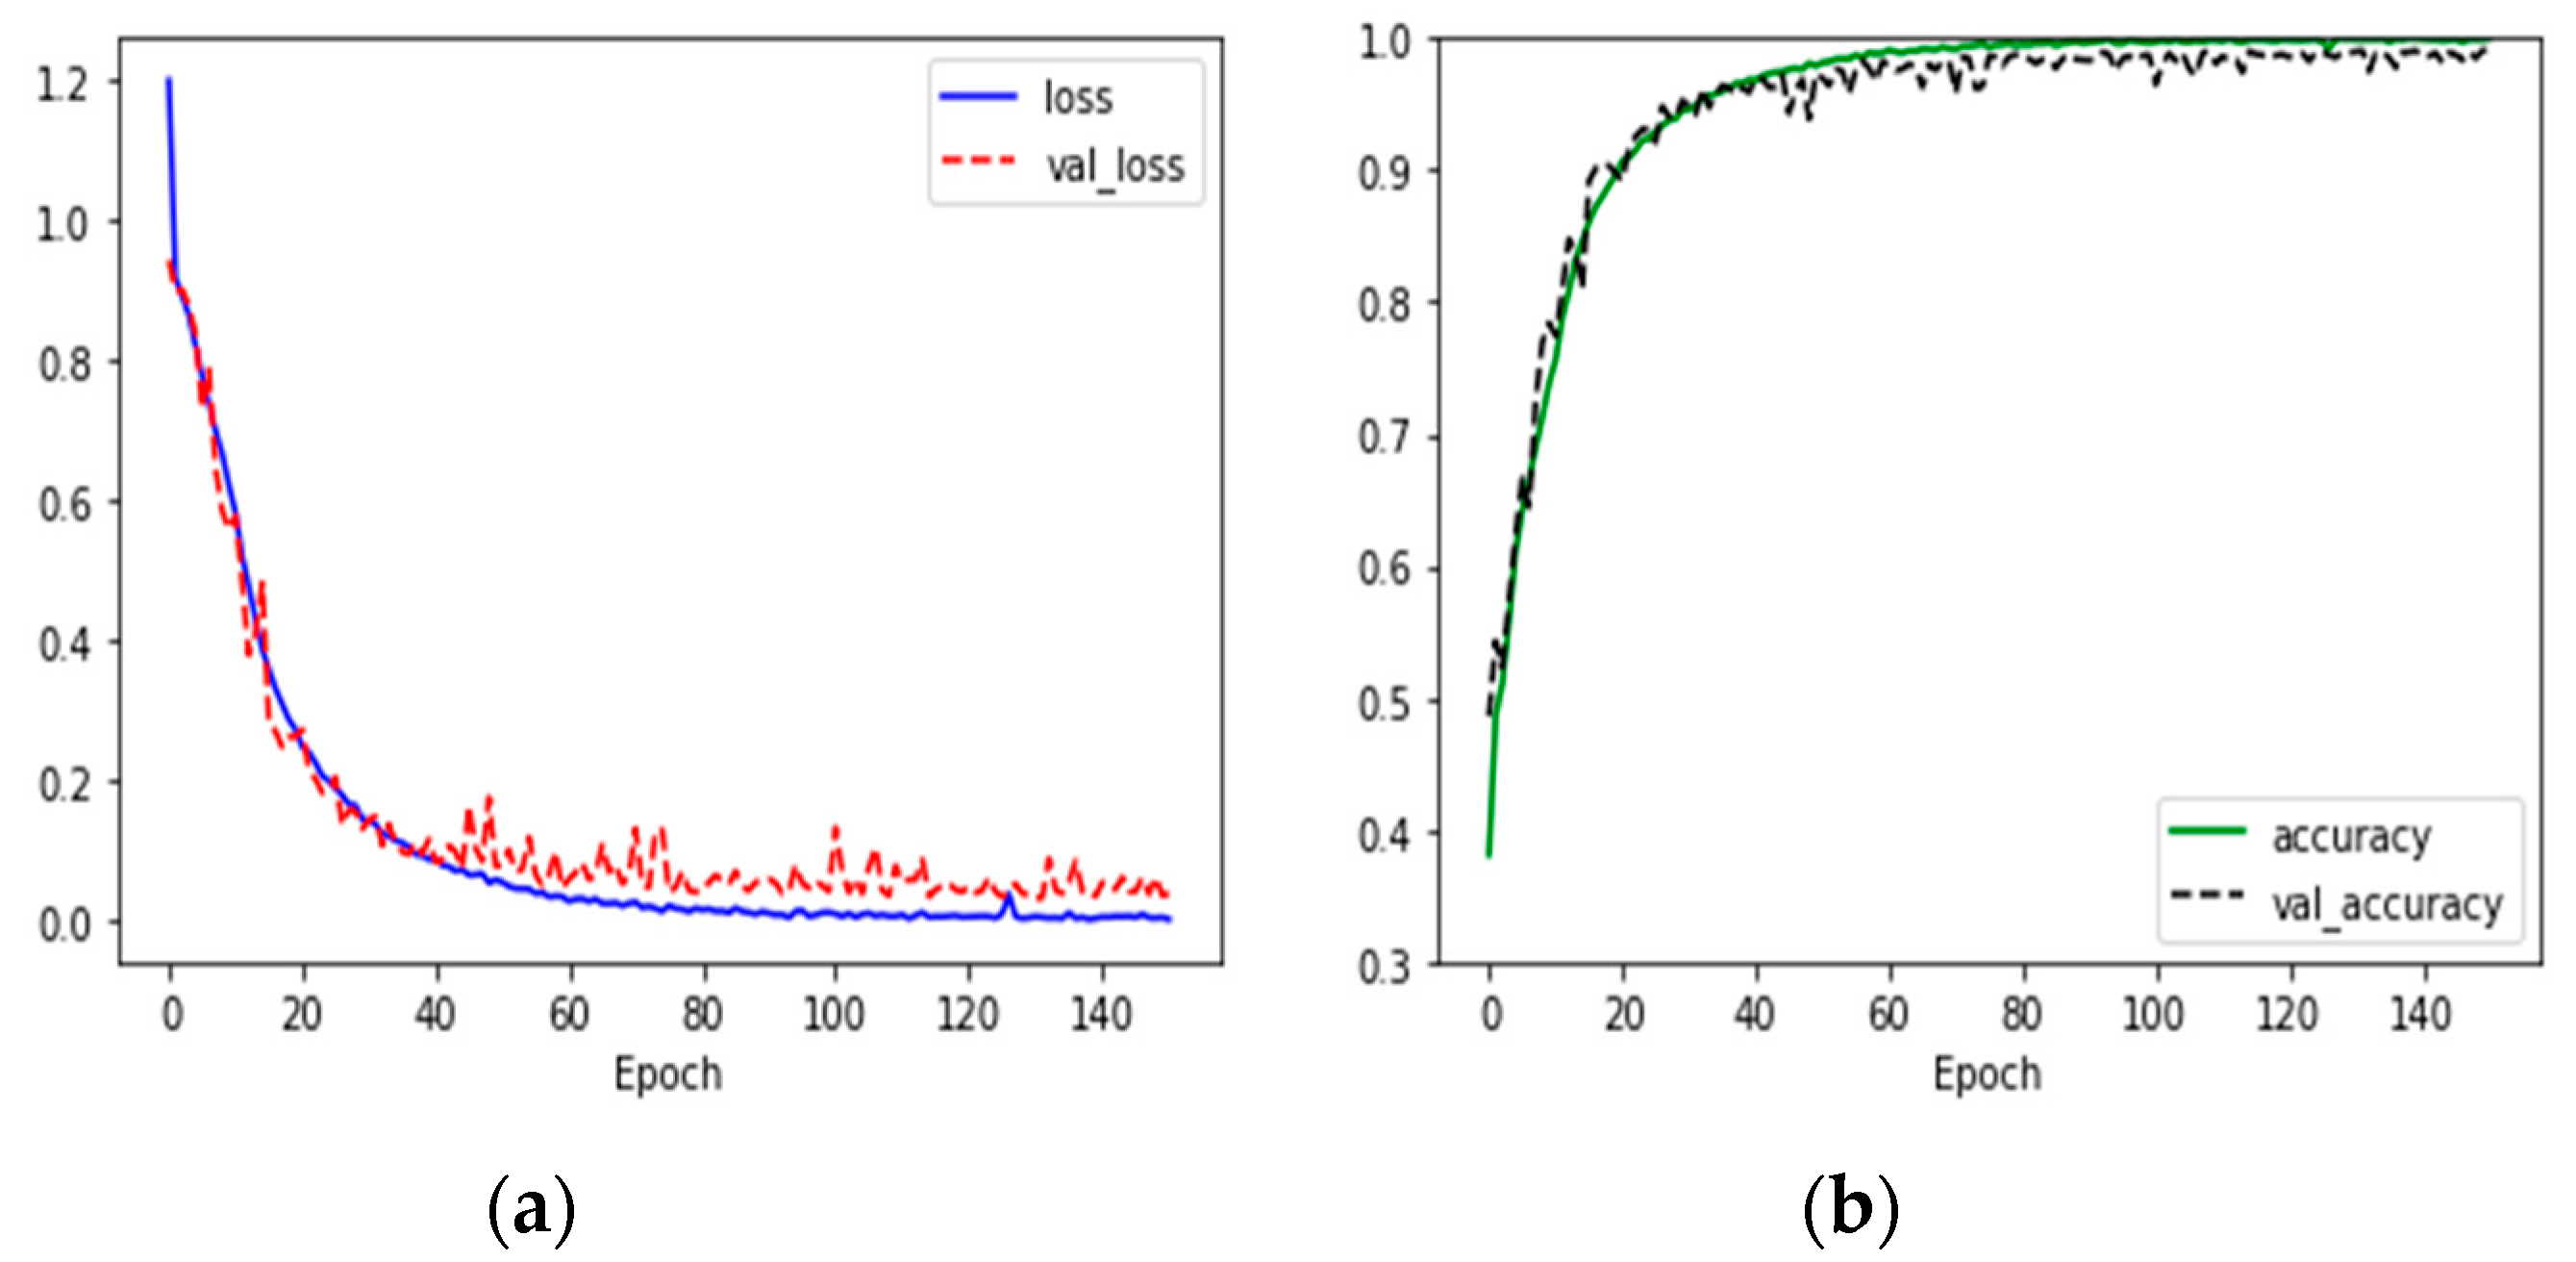
Based on the CNN model, the loss of train data and test data was found to be 0.008 and 0.097, respectively, and the accuracy was 0.998 and 0.982, respectively (see Figure 5 and Table 9).
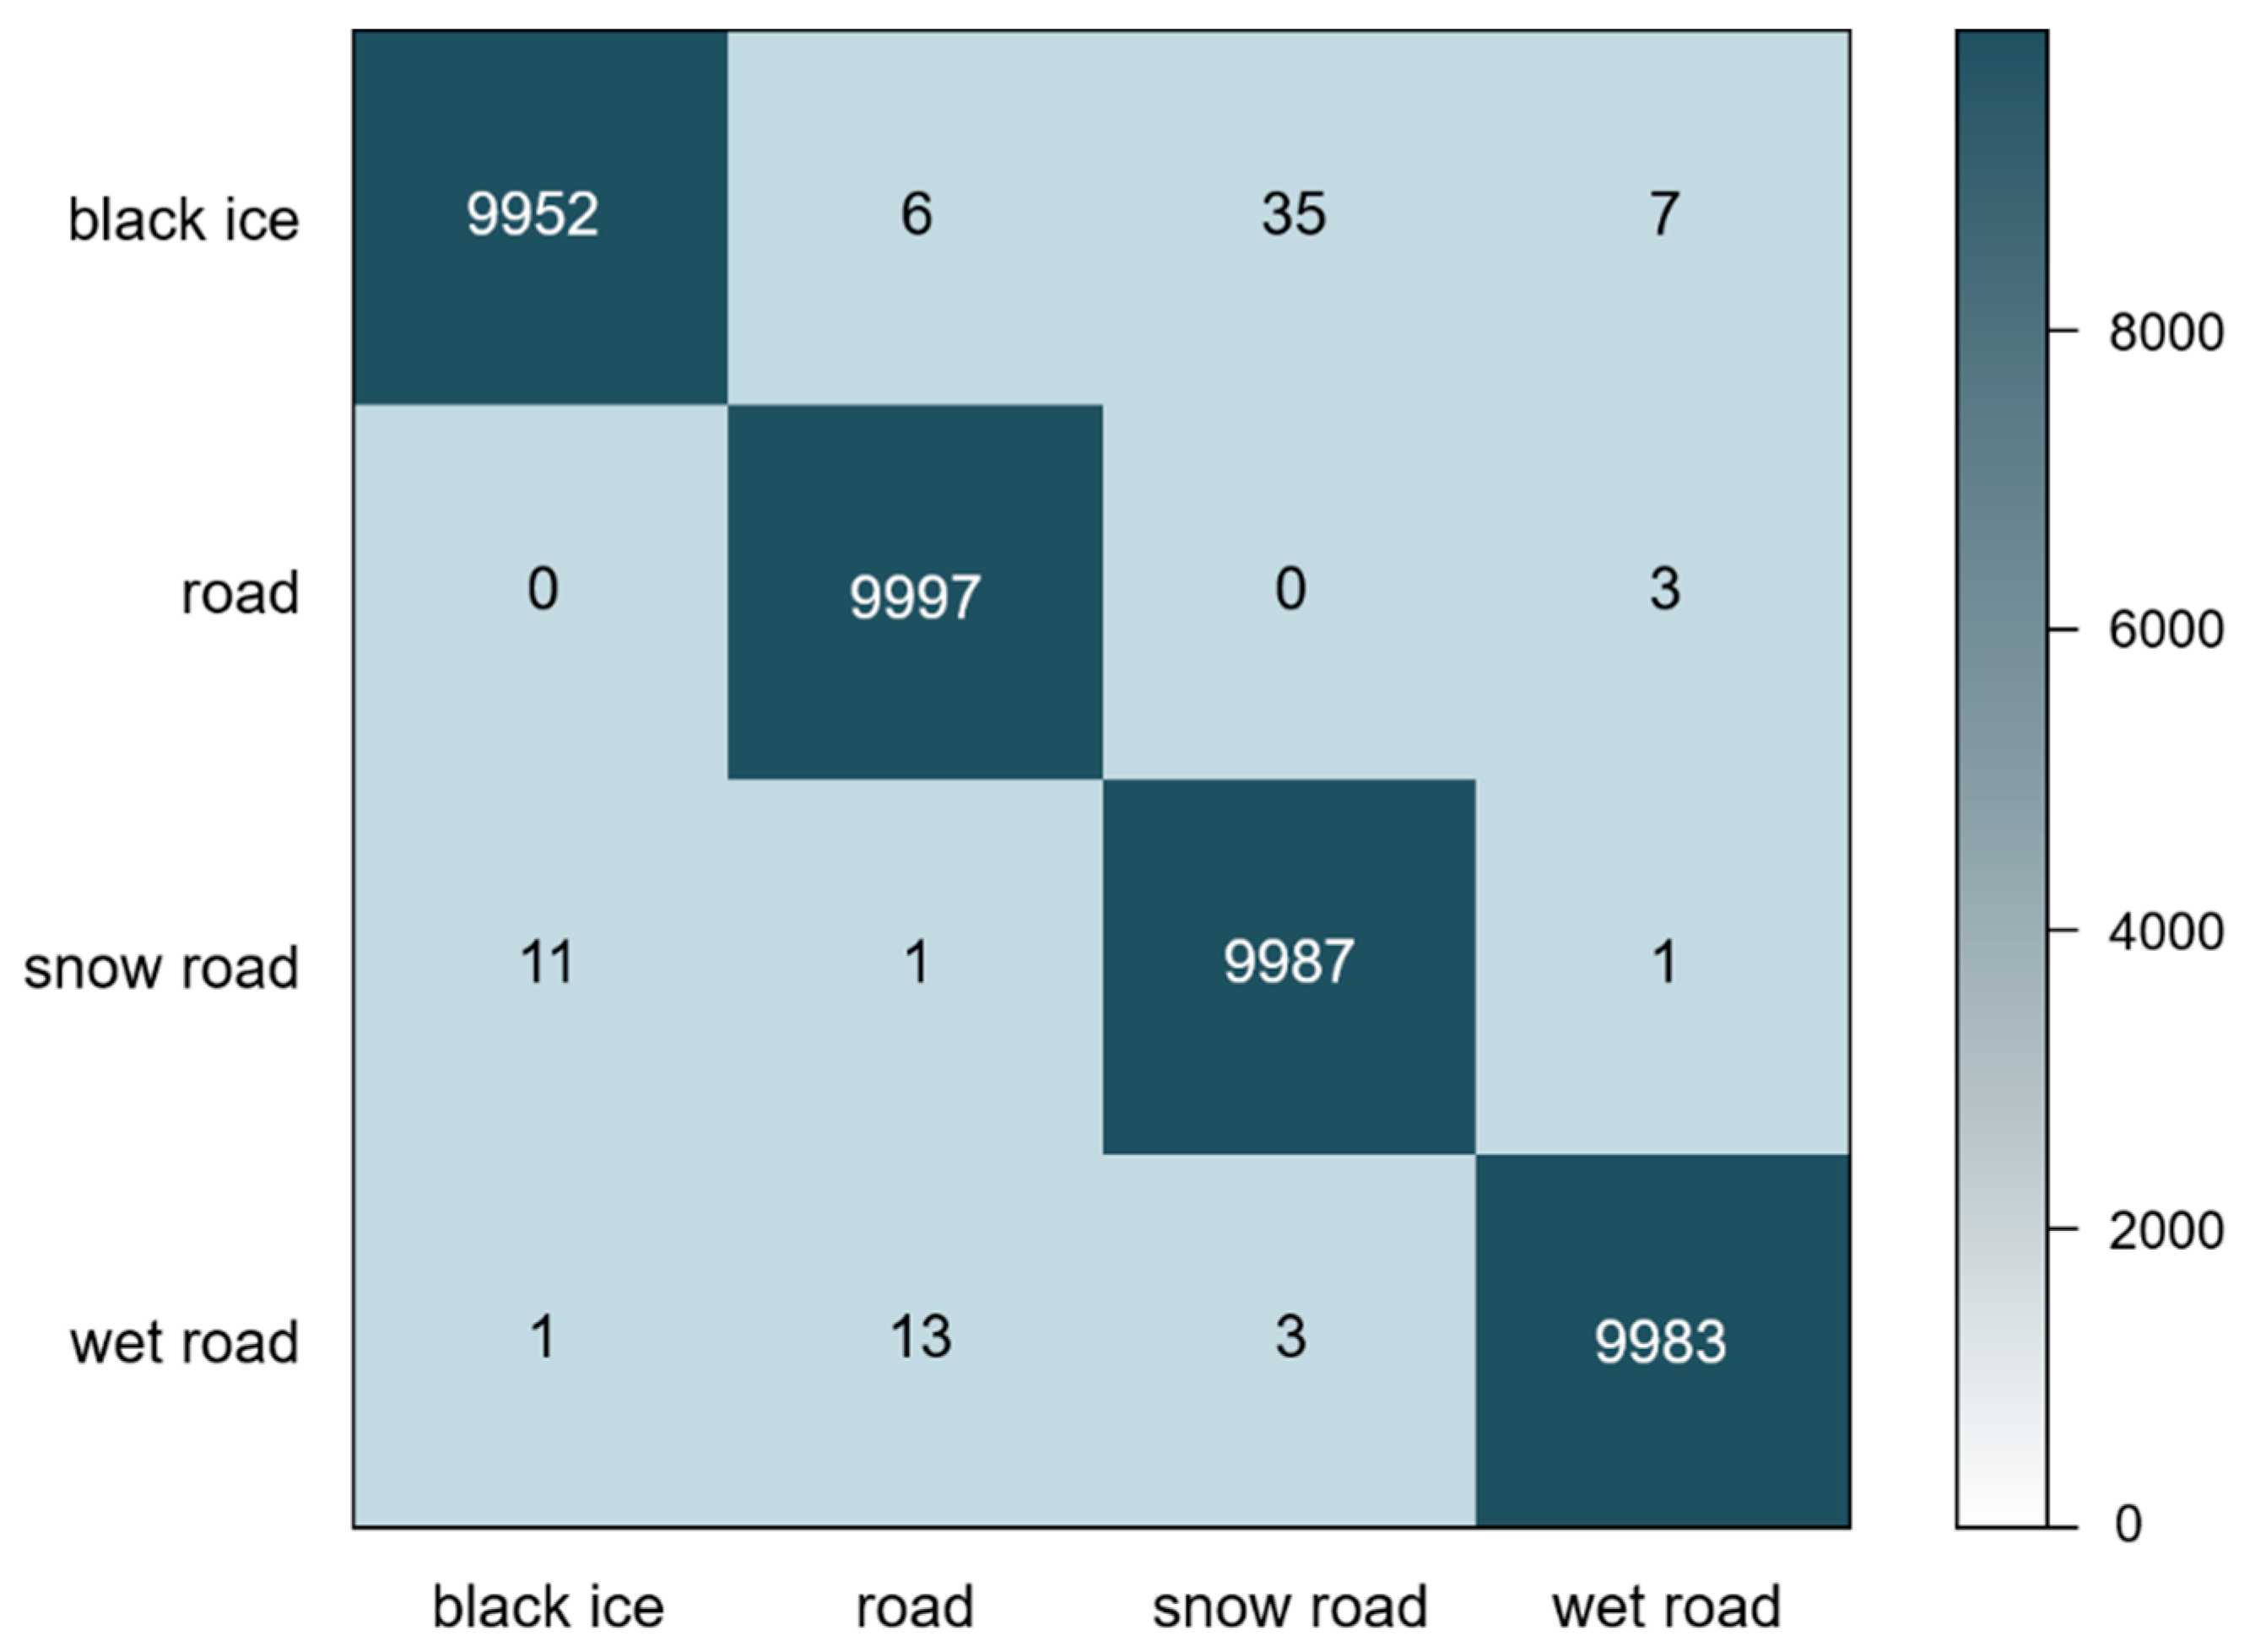
For more detailed learning results analysis, performance indicators by class were identified with train data and test data. First, we analyzed a confusion matrix for train data and checked the classification results by class. Confusion matrix is a matrix for comparing the predicted class with the actual class to measure the prediction performance through training, with the x-axis representing the predicted class and the y-axis representing the actual class. The results of the Confusion matrix (Figure 6) showed that some mutual confusion occurred between black ice and snow road, and when the actual class was wet road, it was predicted as road.
Secondly, the calculation and analysis of accuracy, precision, and recall of each class was conducted on test data. The calculation results of each performance indicator are shown in Table 10. This shows that the accuracy of black ice, wet road and snow road is measured as relatively low, which is estimated to be the result of loss of light characteristics in the same way as the Confusion matrix analyzed earlier. However, the average values of accuracy, precision and call were 0.982, 0.983, 0.983, and 0.983, which are considered to have produced significant learning outcomes, even though the data are not relevant to learning.
4.2. Discussion
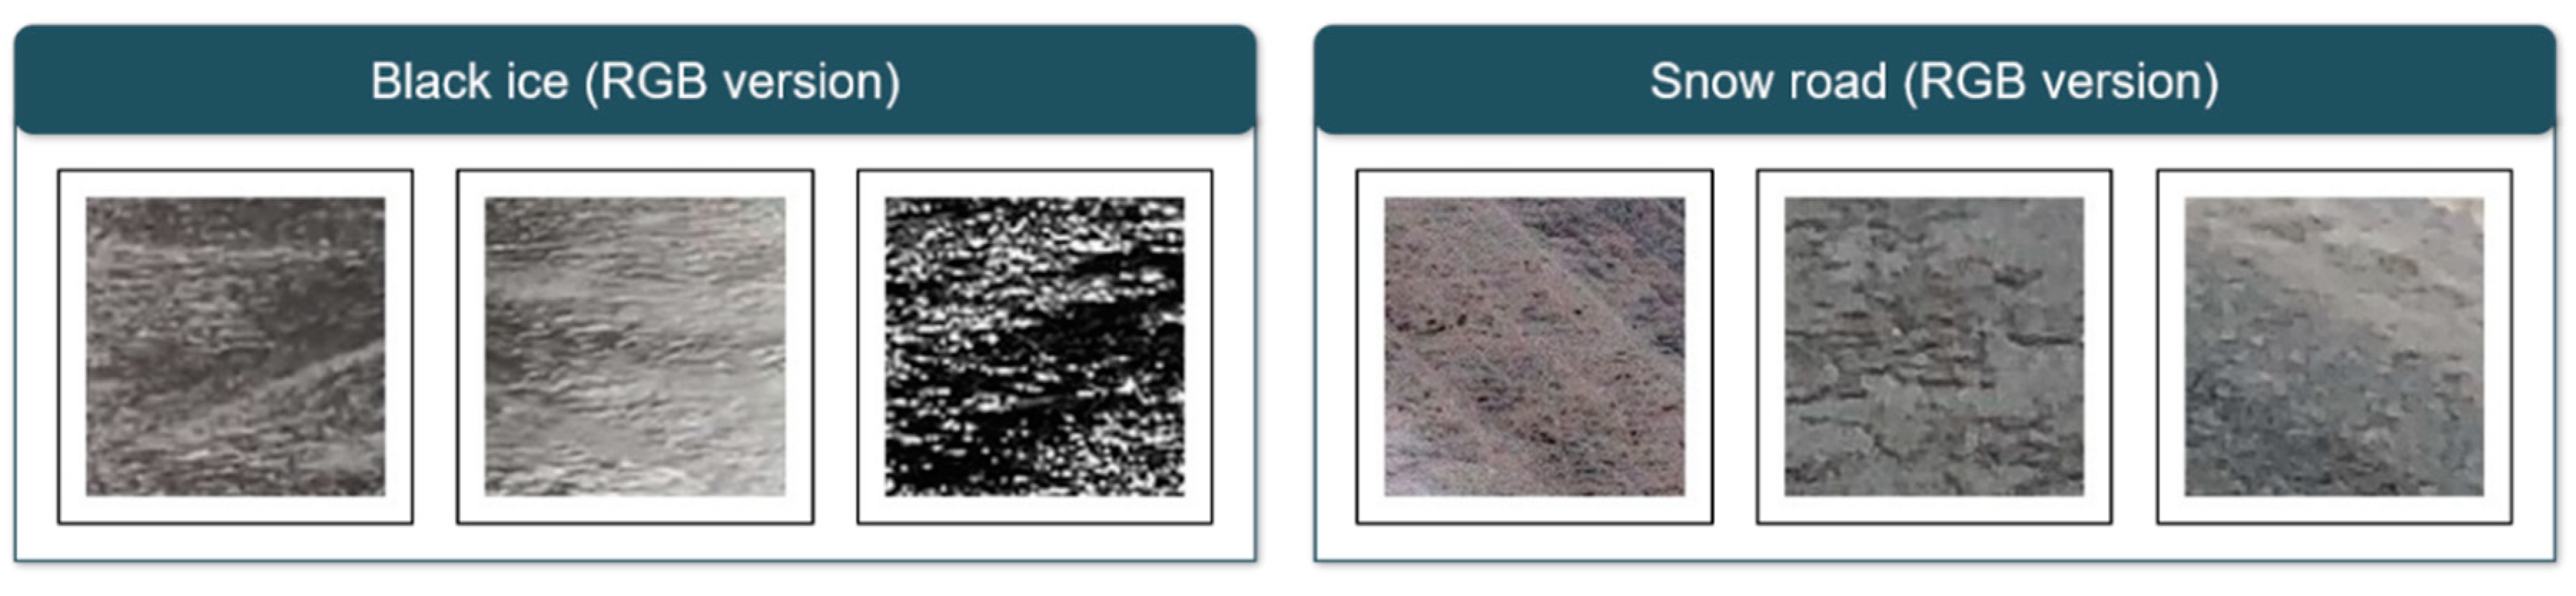
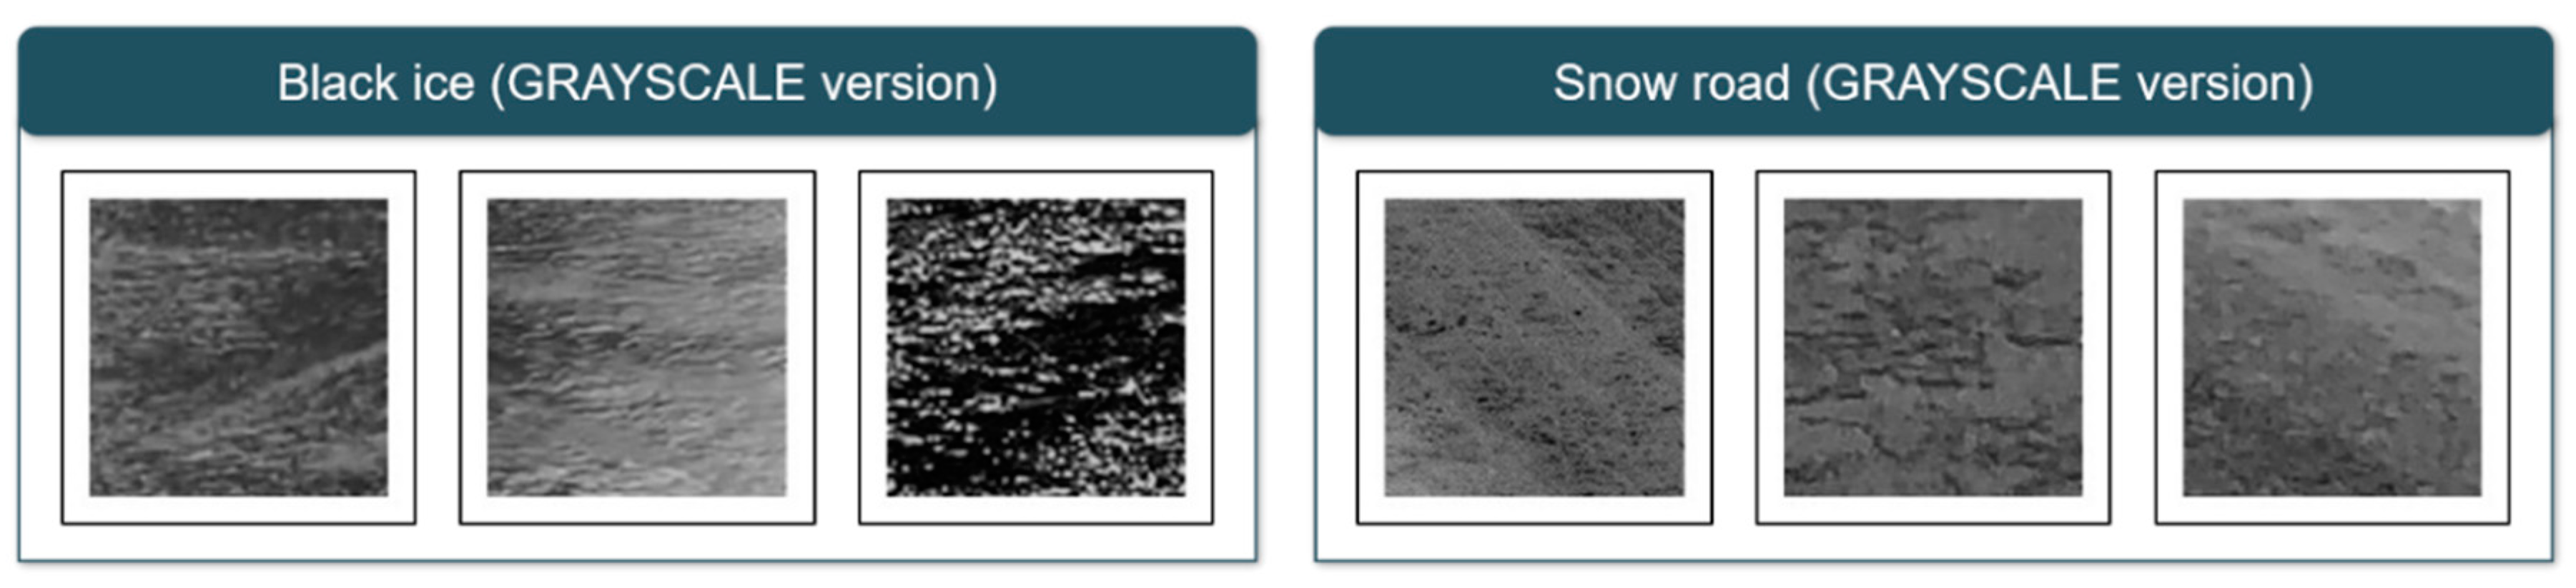
The 69-car collision on the Virginia Expressway in December 2019 and the traffic collision on the Yeongcheon Expressway in Korea in December of the same year were all caused by black ice. As such, casualties from black ice accidents continue to occur worldwide. To prevent this, measures such as installing grooving (a construction method that makes small grooves on the surface of the road to reduce braking distance), installing LED signs, and installing heat wires on the road are currently being proposed. However, since the proposed measures are not a preliminary measure to prevent accidents, a proactive strategy to prevent black ice accidents is being devised. Accordingly, the study was conducted to detect black ice in advance using AI methodologies to extract high accuracy. As further confirmed earlier, the existing black ice detection method is expected to present a prevention measure using light [10,15], as a methodology using light sources is used. This strategy is due to the light reflection feature of black ice, and the image data used in this study also needs to be considered. As confirmed by the analysis results, we have checked that the black ice and snow road appear in the Confusion matrix, and we will explain the cause through the train data of two categories. Figure 7 shows the RGB version of train data, with black ice data showing reflections of light, and snow road data showing snow crystals and slush. However, in this study, because the neural network was designed low due to the limitations of computing and the transformation to GRAYSCALE was carried out (Figure 8), it was difficult to clearly identify these characteristics, resulting in confusion between the two classes and relatively low black ice accuracy of the test data.
4.3. Application Method
We propose an application that can take advantage of the CNN-based black ice detection method we proposed. It will offer a means of preventing accidents by being mounted on AVs and CCTVs. First of all, it is expected that the camera attached to the vehicle will be able to detect black ice in advance by pre-learning the detection of black ice in accordance with the engineering characteristics of AVs. In addition, CCTV is expected to become an important medium for C-ITS (Cooperative Intelligent Transport System) in the future, so it is expected that it can be installed in a proper black ice accident prediction area to prevent accidents. CCTV and cameras installed in AVs are used to forward information on the presence or absence of black ice to nearby vehicles and take measures to undertake a detour of the area or reduce vehicle speeds to prevent major accidents caused by black ice.
5. Conclusions
This study conducted a study using a CNN to detect black ice that is difficult to judge visually in order to prevent black ice accidents in AVs. Data were collected via classification into four classes, and each class’s train, validation, and test data were set through pre-processing of split, padding, and augmentation. Unlike the DCNN model, the CNN model proposed in this study was designed to be relatively simple but showed an excellent performance with an accuracy of about 96%. This suggests that it is more effective to optimize the neural network depth according to the object to be detected rather than to detect black ice by increasing the amount of computation through a complex neural network model. In addition, in this study, a neural network was designed and learned through GRAYSCALE as a feature of black ice mainly formed at dawn, but it was found that some specific classes were confused due to the loss of light characteristics. Accordingly, we plan to conduct research on neural network design that is more optimized for black ice detection by utilizing RGB images in the future. Additionally, since the data were collected through Google Image Search, only images detected close to the object are classified. Accordingly, we plan to construct a CNN model applicable to various situations by setting the distance and angle to the object to be detected in various ways [48,49,50] in the future.
This study is significant in that black ice, which is deemed a potential risk factor even in the era of AVs, was detected using AI, not sensors and wavelengths. It is expected that this will prevent black ice accidents of AVs and will be used as basic data for future convergence research.
Author Contributions
Conceptualization, M.K. and K.H.; Data curation, H.L.; Formal analysis, H.L.; Methodology, M.K.; Project administration, M.K. and J.S.; Software, H.L.; Supervision, K.H.; Visualization, H.L.; Writing—original draft, H.L., M.K. and K.H.; Writing—review and editing, M.K. and K.H. All authors have read and agreed to the published version of the manuscript.
Funding
This research was supported by Basic Science Research Program through the National Research Foundation of Korea (NRF) funded by the Ministry of Education (No. 2020R1F1A106988411).
Conflicts of Interest
The authors declare no conflict of interest.
References
- Lee, K.; Jeon, S.; Kim, H.; Kum, D. Optimal path tracking control of autonomous vehicle: Adaptive full-state linear quadratic gaussian (lqg) control. IEEE Access 2019, 7, 109120–109133. [Google Scholar] [CrossRef]
- Singh, S. Critical Reasons for Crashes Investigated in the National Motor Vehicle Crash Causation Survey (No. DOT HS 812 115); NHTSA’s National Center for Statistics and Analysis: Washington, DC, USA, 2015. [Google Scholar]
- Federal Ministry of Transport and Digital Infrastructure. Ethics Commission: Automated and Connected Driving; Federal Ministry of Transport and Digital Infrastructure: Berlin, Germany, 2017.
- National Highway Traffic Safety Administration. Federal Automated Vehicles Policy: Accelerating the Next Revolution in Roadway Safety; National Highway Traffic Safety Administration: Washington, DC, USA, 2016.
- Abraham, H.; Lee, C.; Brady, S.; Fitzgerald, C.; Mehler, B.; Reimer, B.; Coughlin, J.F. Autonomous vehicles and alternatives to driving: Trust, preferences, and effects of age. In Proceedings of the Transportation Research Board 96th Annual Meeting, Washington, DC, USA, 8–12 January 2017. [Google Scholar]
- Zhang, T.; Tao, D.; Qu, X.; Zhang, X.; Lin, R.; Zhang, W. The roles of initial trust and perceived risk in public’s acceptance of automated vehicles. Transp. Res. Part C Emerg. Technol. 2019, 98, 207–220. [Google Scholar] [CrossRef]
- Hartwich, F.; Witzlack, C.; Beggiato, M.; Krems, J.F. The first impression counts–A combined driving simulator and test track study on the development of trust and acceptance of highly automated driving. Transp. Res. Part F Traffic Psychol. Behav. 2019, 65, 522–535. [Google Scholar] [CrossRef]
- Kim, K.; Kim, B.; Lee, K.; Ko, B.; Yi, K. Design of integrated risk management-based dynamic driving control of automated vehicles. IEEE Intell. Transp. Syst. Mag. 2017, 9, 57–73. [Google Scholar] [CrossRef]
- The NewYork Times Online. Available online: https://www.nytimes.com/2020/10/26/technology/driverless-cars.html (accessed on 3 December 2020).
- Tabatabai, H.; Aljuboori, M. A novel concrete-based sensor for detection of ice and water on roads and bridges. Sensors 2017, 17, 2912. [Google Scholar] [CrossRef] [Green Version]
- Alimasi, N.; Takahashi, S.; Enomoto, H. Development of a mobile optical system to detect road-freezing conditions. Bull. Glaciol. Res. 2012, 30, 41–51. [Google Scholar] [CrossRef] [Green Version]
- Abdalla, Y.E.; Iqbal, M.T.; Shehata, M. Black Ice detection system using Kinect. In Proceedings of the IEEE 30th Canadian Conference on Electrical and Computer Engineering (CCECE), Windsor, ON, Canada, 30 April–3 May 2017; pp. 1–4. [Google Scholar]
- Minullin, R.G.; Mustafin, R.G.; Piskovatskii, Y.V.; Vedernikov, S.G.; Lavrent’ev, I.S. A detection technique for black ice and frost depositions on wires of a power transmission line by location sounding. Russ. Electr. Eng. 2011, 82, 541–543. [Google Scholar] [CrossRef]
- Gailius, D.; Jačėnas, S. Ice detection on a road by analyzing tire to road friction ultrasonic noise. Ultragarsas Ultrasound 2007, 62, 17–20. [Google Scholar]
- Ma, X.; Ruan, C. Method for black ice detection on roads using tri-wavelength backscattering measurements. Appl. Opt. 2020, 59, 7242–7246. [Google Scholar] [CrossRef]
- Han, J.; Koo, B.; Choi, K. Obstacle detection and recognition system for self-driving cars. Converg. Inf. Pap. 2017, 7, 229–235. (In Korean) [Google Scholar]
- Gao, H.; Cheng, B.; Wang, J.; Li, K.; Zhao, J.; Li, D. Object classification using CNN-based fusion of vision and LIDAR in autonomous vehicle environment. IEEE Trans. Ind. Inform. 2018, 14, 4224–4231. [Google Scholar] [CrossRef]
- Ammour, N.; Alhichri, H.; Bazi, Y.; Benjdira, B.; Alajlan, N.; Zuair, M. Deep learning approach for car detection in UAV imagery. Remote Sens. 2017, 9, 312. [Google Scholar] [CrossRef] [Green Version]
- Nafi’i, M.W.; Yuniarno, E.M.; Affandi, A. Vehicle Brands and Types Detection Using Mask R-CNN. In Proceedings of the International Seminar on Intelligent Technology and Its Applications (ISITIA), Surabaya, Indonesia, 28–29 August 2019; pp. 422–427. [Google Scholar]
- Zhang, L.; Lin, L.; Liang, X.; He, K. Is faster R-CNN doing well for pedestrian detection? In Proceedings of the European Conference on Computer Vision, Amsterdam, The Netherlands, 11–14 October 2016; pp. 443–457. [Google Scholar]
- Chen, Y.Y.; Jhong, S.Y.; Li, G.Y.; Chen, P.H. Thermal-based pedestrian detection using faster r-cnn and region decomposition branch. In Proceedings of the International Symposium on Intelligent Signal Processing and Communication Systems (ISPACS), Taipei, Taiwan, 3–6 December 2019; pp. 1–2. [Google Scholar]
- Ammar, A.; Koubaa, A.; Ahmed, M.; Saad, A. Aerial images processing for car detection using convolutional neural networks: Comparison between faster r-cnn and yolov3. arXiv 2019, arXiv:1910.07234. [Google Scholar]
- Benjdira, B.; Khursheed, T.; Koubaa, A.; Ammar, A.; Ouni, K. Car detection using unmanned aerial vehicles: Comparison between faster r-cnn and yolov3. In Proceedings of the 1st International Conference on Unmanned Vehicle Systems-Oman (UVS), Muscat, Oman, 5–7 February 2019; pp. 1–6. [Google Scholar]
- Xie, L.; Ahmad, T.; Jin, L.; Liu, Y.; Zhang, S. A new CNN-based method for multi-directional car license plate detection. IEEE Trans. Intell. Transp. Syst. 2018, 19, 507–517. [Google Scholar] [CrossRef]
- Yu, Y.; Jin, Q.; Chen, C.W. FF-CMnet: A CNN-based model for fine-grained classification of car models based on feature fusion. In Proceedings of the IEEE International Conference on Multimedia and Expo (ICME), San Diego, CA, USA, 23–27 July 2018; pp. 1–6. [Google Scholar]
- Putra, M.H.; Yussof, Z.M.; Lim, K.C.; Salim, S.I. Convolutional neural network for person and car detection using yolo framework. J. Telecommun. Electron. Comput. Eng. 2018, 10, 67–71. [Google Scholar]
- Zhu, Z.; Liang, D.; Zhang, S.; Huang, X.; Li, B.; Hu, S. Traffic-sign detection and classification in the wild. In Proceedings of the IEEE Conference on Computer Vision and Pattern Recognition, Las Vegas, NV, USA, 27–30 June 2016; pp. 2110–2118. [Google Scholar]
- Vennelakanti, A.; Shreya, S.; Rajendran, R.; Sarkar, D.; Muddegowda, D.; Hanagal, P. Traffic sign detection and recognition using a cnn ensemble. In Proceedings of the IEEE International Conference on Consumer Electronics (ICCE), Las Vegas, NV, USA, 11–13 January 2019; pp. 1–4. [Google Scholar]
- Alghmgham, D.A.; Latif, G.; Alghazo, J.; Alzubaidi, L. Autonomous traffic sign (ATSR) detection and recognition using deep CNN. Procedia Comput. Sci. 2019, 163, 266–274. [Google Scholar] [CrossRef]
- Peemen, M.; Mesman, B.; Corporaal, H. Speed sign detection and recognition by convolutional neural networks. In Proceedings of the 8th International Automotive Congress, Eindhoven, The Netherlands, 16–17 May 2011; pp. 162–170. [Google Scholar]
- Malbog, M.A. MASK R-CNN for Pedestrian Crosswalk Detection and Instance Segmentation. In Proceedings of the IEEE 6th International Conference on Engineering Technologies and Applied Sciences (ICETAS), Kuala Lumpur, Malaysia, 20–21 December 2019; pp. 1–5. [Google Scholar]
- Tabernik, D.; Skočaj, D. Deep learning for large-scale traffic-sign detection and recognition. IEEE Trans. Intell. Transp. Syst. 2019, 21, 1427–1440. [Google Scholar] [CrossRef] [Green Version]
- Kukreja, R.; Rinchen, S.; Vaidya, B.; Mouftah, H.T. Evaluating Traffic Signs Detection using Faster R-CNN for Autonomous driving. In Proceedings of the IEEE 25th International Workshop on Computer Aided Modeling and Design of Communication Links and Networks (CAMAD), Pisa, Italy, 14–16 September 2020; pp. 1–6. [Google Scholar]
- Boujemaa, K.S.; Berrada, I.; Bouhoute, A.; Boubouh, K. Traffic sign recognition using convolutional neural networks. In Proceedings of the International Conference on Wireless Networks and Mobile Communications (WINCOM), Rabat, Morocco, 1–4 November 2017; pp. 1–6. [Google Scholar]
- Qian, R.; Liu, Q.; Yue, Y.; Coenen, F.; Zhang, B. Road surface traffic sign detection with hybrid region proposal and fast R-CNN. In Proceedings of the 12th International Conference on Natural Computation, Fuzzy Systems and Knowledge Discovery (ICNC-FSKD), Changsha, China, 13–15 August 2016; pp. 555–559. [Google Scholar]
- Shustanov, A.; Yakimov, P. CNN design for real-time traffic sign recognition. Procedia Eng. 2017, 201, 718–725. [Google Scholar] [CrossRef]
- Lee, H.S.; Kim, K. Simultaneous traffic sign detection and boundary estimation using convolutional neural network. IEEE Trans. Intell. Transp. Syst. 2018, 19, 1652–1663. [Google Scholar] [CrossRef] [Green Version]
- Carrillo, J.; Crowley, M.; Pan, G.; Fu, L. Design of Efficient Deep Learning models for Determining Road Surface Condition from Roadside Camera Images and Weather Data. arXiv 2020, arXiv:2009.10282. [Google Scholar]
- Pan, G.; Muresan, M.; Yu, R.; Fu, L. Real-time Winter Road Surface Condition Monitoring Using an Improved Residual CNN. Can. J. Civ. Eng. 2020. [Google Scholar] [CrossRef]
- Singh, J.; Shekhar, S. Road damage detection and classification in smartphone captured images using mask r-cnn. arXiv 2018, arXiv:1811.04535. [Google Scholar]
- Tong, Z.; Gao, J.; Han, Z.; Wang, Z. Recognition of asphalt pavement crack length using deep convolutional neural networks. Road Mater. Pavement Des. 2018, 19, 1334–1349. [Google Scholar] [CrossRef]
- Li, B.; Wang, K.C.; Zhang, A.; Yang, E.; Wang, G. Automatic classification of pavement crack using deep convolutional neural network. Int. J. Pavement Eng. 2020, 21, 457–463. [Google Scholar] [CrossRef]
- LeCun, Y.; Bottou, L.; Bengio, Y.; Haffner, P. Gradient-based learning applied to document recognition. Proc. IEEE 1998, 86, 2278–2324. [Google Scholar] [CrossRef] [Green Version]
- Choubisa, T.; Kashyap, M.; Chaitanya, K.K. Human Crawl vs Animal Movement and Person with Object Classifications Using CNN for Side-view Images from Camera. In Proceedings of the International Conference on Advances in Computing, Communications and Informatics (ICACCI), Bangalore, India, 19–22 September 2018; pp. 48–54. [Google Scholar]
- Keras. Available online: https://keras.io/ (accessed on 11 November 2020).
- Nair, V.; Hinton, G.E. Rectified linear units improve restricted boltzmann machines. In Proceedings of the 27th International Conference on International Conference on Machine Learning, Haifa, Israel, 21–24 June 2010. [Google Scholar]
- Simonyan, K.; Zisserman, A. Very deep convolutional networks for large-scale image recognition. arXiv 2014, arXiv:1409.1556. [Google Scholar]
- Gadd, M.; Newman, P. A framework for infrastructure-free warehouse navigation. In Proceedings of the IEEE International Conference on Robotics and Automation (ICRA), Seattle, WA, USA, 26–30 May 2015; pp. 3271–3278. [Google Scholar]
- Tourani, S.; Desai, D.; Parihar, U.S.; Garg, S.; Sarvadevabhatla, R.K.; Krishna, K.M. Early Bird: Loop Closures from Opposing Viewpoints for Perceptually-Aliased Indoor Environments. arXiv 2020, arXiv:2010.01421. [Google Scholar]
- Chen, X.; Vempati, A.S.; Beardsley, P. Streetmap-mapping and localization on ground planes using a downward facing camera. In Proceedings of the IEEE/RSJ International Conference on Intelligent Robots and Systems (IROS), Madrid, Spain, 1–5 October 2018; pp. 1672–1679. [Google Scholar]
Figure 1.
Learning Environment Setting Process.

Figure 2.
The results of the data split.

Figure 3.
(a) Numbers of 1000 data are randomly selected and set as test data; (b) data augmentation with ImageDataGenerator functions; (c) train data and validation data set at 8:2 ratio.
Figure 3.
(a) Numbers of 1000 data are randomly selected and set as test data; (b) data augmentation with ImageDataGenerator functions; (c) train data and validation data set at 8:2 ratio.

Figure 4.
CNN model structure; (a) after placing the convolutional layer and the max-pooling layer twice, place the dropout layer once and repeat training twice; (b) place the convolutional layer, the max-pooling layer and dropout layer once and repeat training twice; (c) fully-connected and dropout layers are alternately placed and softmax is applied to the output layer.

Figure 5.
Training result: (a) The x-axis of the left graph represents the value of Epoch, the y-axis represents the value of loss; (b) the x-axis of the right graph represents Epoch, and the y-axis represents accuracy.
Figure 5.
Training result: (a) The x-axis of the left graph represents the value of Epoch, the y-axis represents the value of loss; (b) the x-axis of the right graph represents Epoch, and the y-axis represents accuracy.

Figure 6.
Confusion matrix; A matrix written to measure the prediction performance through training, the x-axis represents the predicted class and the y-axis represents the actual class. The results showed that (x,y) = (snow road, black ice) = 35, (black ice, snow road) = 11, (road, wet road) = 13.
Figure 6.
Confusion matrix; A matrix written to measure the prediction performance through training, the x-axis represents the predicted class and the y-axis represents the actual class. The results showed that (x,y) = (snow road, black ice) = 35, (black ice, snow road) = 11, (road, wet road) = 13.

Figure 7.
RGB version of train data (black ice and snow road); in the case of black ice, it can be seen that it shimmers due to light reflection, and in the case of snow data, snow crystals and slush appear.
Figure 7.
RGB version of train data (black ice and snow road); in the case of black ice, it can be seen that it shimmers due to light reflection, and in the case of snow data, snow crystals and slush appear.

Figure 8.
GRAYSCALE version of train data (black ice and snow road); relative to the data in the previous figure, the reflection of black ice and snow crystals and slush are not clearly identified.
Figure 8.
GRAYSCALE version of train data (black ice and snow road); relative to the data in the previous figure, the reflection of black ice and snow crystals and slush are not clearly identified.


Table 1.
The Number of Image Data.
| Road | Wet Road | Snow Road | Black Ice | Total | |
|---|---|---|---|---|---|
| Number | 730 | 610 | 570 | 320 | 2230 |
Table 2.
(Dis) advantage by data size.
| 256 × 256 px | 128 × 128 px | |
|---|---|---|
| Advantage | Easy to identify image characteristics | Large number of images Deep neural network can be implemented |
| Disadvantage | Small number of images Unable to implement deep neural network | Hard to identify image characteristics |
Table 3.
Features of RGB, GRAYSCALE.
| RGB | GRAYSCALE (Black and White) | |
|---|---|---|
| Number of Channels | 3 Channels | 1 Channel |
| Feature | Large data size | Small data size |
| Advantage | Easy to identify image characteristics | No limit on the number of learning data Deep neural networks can be implemented |
| Disadvantage | Limited number of learning data Deep neural network impossible to implement | Hard to identify image characteristics |
Table 4.
Data Augmentation and Learning Results.
| Original Data | Padding Data | ||
|---|---|---|---|
| Data augmentation results |  |  | |
| Learning results | Loss | 1.39 | 0.26 |
| Accuracy | 0.253 | 0.891 | |
Table 5.
Number of data through 1st preprocessing.
| Class | Size | Number |
|---|---|---|
| Road | 150 × 150 px | 4900 |
| Wet road | 4900 | |
| Snow road | 3900 | |
| Black ice | 3900 | |
| Total | 17,600 | |
Table 6.
Setting Data Augmentation Value.
| Transformation Type | Value |
|---|---|
| Rotation | 20 |
| Width shift | 0.15 |
| Height shift | 0.15 |
| Zoom | 0.1 |
Table 7.
Dataset for class.
| Class | Train Data | Validation Data | Test Data | Total |
|---|---|---|---|---|
| Road | 8000 | 2000 | 1000 | 11,000 |
| Wet road | ||||
| Snow road | ||||
| Black ice |
Table 8.
CNN Model Setup Value.
| Class | Value |
|---|---|
| Activation Function | ReLU |
| Kernel size | (3,3) |
| Strides | (2,2) |
| Dropout rate | 0.2 |
| Optimizer | SGD |
| Epoch | 200 |
| Batch size | 32 |
| Earlystopping | 20 |
Table 9.
Training Result.
| Class | Loss | Accuracy |
|---|---|---|
| Train | 0.008 | 0.998 |
| Test | 0.097 | 0.982 |
Table 10.
Accuracy, precision, recall results by class.
| Class | Accuracy | Precision | Recall |
|---|---|---|---|
| Road | 0.996 | 0.99 | 1.00 |
| Wet road | 0.989 | 0.99 | 0.99 |
| Snow road | 0.981 | 0.97 | 0.98 |
| Black ice | 0.961 | 0.98 | 0.96 |
| Average | 0.982 | 0.983 | 0.983 |
Publisher’s Note: MDPI stays neutral with regard to jurisdictional claims in published maps and institutional affiliations. |
© 2020 by the authors. Licensee MDPI, Basel, Switzerland. This article is an open access article distributed under the terms and conditions of the Creative Commons Attribution (CC BY) license (http://creativecommons.org/licenses/by/4.0/).
Share and Cite
MDPI and ACS Style
Lee, H.; Kang, M.; Song, J.; Hwang, K. The Detection of Black Ice Accidents for Preventative Automated Vehicles Using Convolutional Neural Networks. Electronics 2020, 9, 2178. https://0-doi-org.brum.beds.ac.uk/10.3390/electronics9122178
AMA Style
Lee H, Kang M, Song J, Hwang K. The Detection of Black Ice Accidents for Preventative Automated Vehicles Using Convolutional Neural Networks. Electronics. 2020; 9(12):2178. https://0-doi-org.brum.beds.ac.uk/10.3390/electronics9122178
Chicago/Turabian StyleLee, Hojun, Minhee Kang, Jaein Song, and Keeyeon Hwang. 2020. "The Detection of Black Ice Accidents for Preventative Automated Vehicles Using Convolutional Neural Networks" Electronics 9, no. 12: 2178. https://0-doi-org.brum.beds.ac.uk/10.3390/electronics9122178
Note that from the first issue of 2016, this journal uses article numbers instead of page numbers. See further details here.