
Metabolomics of Cerebrospinal Fluid from Healthy Subjects Reveal Metabolites Associated with Ageing

 , , and
Abstract
:1. Introduction
2. Results
3. Discussion
4. Materials and Methods
4.1. Chemicals
4.2. Ethical Approval
4.3. Study Cohort and Collection of Samples
4.4. Metabolite Extraction
4.5. Mass Spectrometry Analysis
4.6. Peak-Picking and Quality Assessment
4.7. Metabolite Identification
4.8. Statistical Analysis
Supplementary Materials
Author Contributions
Funding
Institutional Review Board Statement
Informed Consent Statement
Data Availability Statement
Conflicts of Interest
References
- Niccoli, T.; Partridge, L. Ageing as a Risk Factor for Disease. Curr. Biol. 2012, 22, R741–R752. [Google Scholar] [CrossRef] [Green Version]
- Hou, Y.; Dan, X.; Babbar, M.; Wei, Y.; Hasselbalch, S.G.; Croteau, D.L.; Bohr, V.A. Ageing as a risk factor for neurodegenerative disease. Nat. Rev. Neurol. 2019, 15, 565–581. [Google Scholar] [CrossRef]
- United Nations. World Population Ageing 2019 Highlights; United Nations: New York, NY, USA, 2019; ISBN 9789210045537. [Google Scholar]
- Woolf, S.H.; Schoomaker, H. Life Expectancy and Mortality Rates in the United States, 1959–2017. JAMA 2019, 322, 1996–2016. [Google Scholar] [CrossRef] [PubMed]
- Ho, J.Y.; Hendi, A.S. Recent trends in life expectancy across high income countries: Retrospective observational study. BMJ 2018, 362, k2562. [Google Scholar] [CrossRef] [Green Version]
- Jylhävä, J.; Pedersen, N.L.; Hägg, S. Biological Age Predictors. EBioMedicine 2017, 21, 29–36. [Google Scholar] [CrossRef] [Green Version]
- López-Otín, C.; Blasco, M.A.; Partridge, L.; Serrano, M.; Kroemer, G. The Hallmarks of Aging. Cell 2013, 153, 1194–1217. [Google Scholar] [CrossRef] [Green Version]
- Xia, X.; Chen, W.; McDermott, J.; Han, J.-D.J. Molecular and phenotypic biomarkers of aging. F1000Research 2017, 6, 860. [Google Scholar] [CrossRef] [Green Version]
- Lara, J.; Cooper, R.; Nissan, J.; Ginty, A.T.; Khaw, K.-T.; Deary, I.J.; Lord, J.M.; Kuh, D.; Mathers, J.C. A proposed panel of biomarkers of healthy ageing. BMC Med. 2015, 13, 1–8. [Google Scholar] [CrossRef] [PubMed] [Green Version]
- Zierer, J.; Menni, C.; Kastenmüller, G.; Spector, T.D. Integration of ‘omics’ data in aging research: From biomarkers to systems biology. Aging Cell 2015, 14, 933–944. [Google Scholar] [CrossRef] [PubMed] [Green Version]
- Darst, B.F.; Koscik, R.L.; Hogan, K.J.; Johnson, S.C.; Engelman, C.D. Longitudinal plasma metabolomics of aging and sex. Aging 2019, 11, 1262–1282. [Google Scholar] [CrossRef]
- Rist, M.J.; Roth, A.; Frommherz, L.; Weinert, C.H.; Krüger, R.; Merz, B.; Bunzel, D.; Mack, C.; Egert, B.; Bub, A.; et al. Metabolite patterns predicting sex and age in participants of the Karlsruhe Metabolomics and Nutrition (KarMeN) study. PLoS ONE 2017, 12, e0183228. [Google Scholar] [CrossRef]
- Kochhar, S.; Jacobs, D.M.; Ramadan, Z.; Berruex, F.; Fuerholz, A.; Fay, L.B. Probing gender-specific metabolism differences in humans by nuclear magnetic resonance-based metabonomics. Anal. Biochem. 2006, 352, 274–281. [Google Scholar] [CrossRef] [PubMed]
- Menni, C.; Kastenmüller, G.; Petersen, A.K.; Bell, J.T.; Psatha, M.; Tsai, P.-C.; Gieger, C.; Schulz, H.; Erte, I.; John, S.; et al. Metabolomic markers reveal novel pathways of ageing and early development in human populations. Int. J. Epidemiol. 2013, 42, 1111–1119. [Google Scholar] [CrossRef] [Green Version]
- Yu, Z.; Zhai, G.; Singmann, P.; He, Y.; Xu, T.; Prehn, C.; Roemisch-Margl, W.; Lattka, E.; Gieger, C.; Soranzo, N.; et al. Human serum metabolic profiles are age dependent. Aging Cell 2012, 11, 960–967. [Google Scholar] [CrossRef] [PubMed]
- Bunning, B.J.; Contrepois, K.; Lee-McMullen, B.; Dhondalay, G.K.R.; Zhang, W.; Tupa, D.; Raeber, O.; Desai, M.; Nadeau, K.C.; Snyder, M.P.; et al. Global metabolic profiling to model biological processes of aging in twins. Aging Cell 2020, 19, e13073. [Google Scholar] [CrossRef] [PubMed] [Green Version]
- Lawton, K.A.; Berger, A.; Mitchell, M.; Milgram, K.E.; Evans, A.M.; Guo, L.; Hanson, R.W.; Kalhan, S.C.; Ryals, J.A.; Milburn, M.V. Analysis of the adult human plasma metabolome. Pharmacogenomics 2008, 9, 383–397. [Google Scholar] [CrossRef]
- Chaleckis, R.; Murakami, I.; Takada, J.; Kondoh, H.; Yanagida, M. Individual variability in human blood metabolites identifies age-related differences. Proc. Natl. Acad. Sci. USA 2016, 113, 4252–4259. [Google Scholar] [CrossRef] [Green Version]
- Johnson, L.C.; Parker, K.; Aguirre, B.F.; Nemkov, T.G.; D’Alessandro, A.; Johnson, S.A.; Seals, D.R.; Martens, C.R. The plasma metabolome as a predictor of biological aging in humans. GeroScience 2019, 41, 895–906. [Google Scholar] [CrossRef]
- Psihogios, N.G.; Gazi, I.F.; Elisaf, M.S.; Seferiadis, K.I.; Bairaktari, E.T. Gender-related and age-related urinalysis of healthy subjects by NMR-based metabonomics. NMR Biomed. 2008, 21, 195–207. [Google Scholar] [CrossRef]
- Ivanisevic, J.; Stauch, K.L.; Petrascheck, M.; Benton, H.P.; Epstein, A.A.; Fang, M.; Gorantla, S.; Tran, M.; Hoang, L.; Kurczy, M.E.; et al. Metabolic drift in the aging brain. Aging 2016, 8, 1000–1020. [Google Scholar] [CrossRef] [Green Version]
- Wishart, D.S.; Lewis, M.J.; Morrissey, J.A.; Flegel, M.D.; Jeroncic, K.; Xiong, Y.; Cheng, D.; Eisner, R.; Gautam, B.; Tzur, D.; et al. The human cerebrospinal fluid metabolome. J. Chromatogr. B 2008, 871, 164–173. [Google Scholar] [CrossRef] [PubMed]
- Wilkins, J.M.; Trushina, E. Application of Metabolomics in Alzheimer’s Disease. Front. Neurol. 2018, 8, 719. [Google Scholar] [CrossRef] [PubMed] [Green Version]
- Willkommen, D.; Lucio, M.; Moritz, F.; Forcisi, S.; Kanawati, B.; Smirnov, K.S.; Schroeter, M.; Sigaroudi, A.; Schmitt-Kopplin, P.; Michalke, B. Metabolomic investigations in cerebrospinal fluid of Parkinson’s disease. PLoS ONE 2018, 13, e0208752. [Google Scholar] [CrossRef] [PubMed] [Green Version]
- Herman, S.; Niemelä, V.; Khoonsari, P.E.; Sundblom, J.; Burman, J.; Landtblom, A.-M.; Spjuth, O.; Nyholm, D.; Kultima, K. Alterations in the tyrosine and phenylalanine pathways revealed by biochemical profiling in cerebrospinal fluid of Hun-tington’s disease subjects. Sci. Rep. 2019, 9, 4129. [Google Scholar] [CrossRef] [PubMed] [Green Version]
- Herman, S.; Khoonsari, P.E.; Tolf, A.; Steinmetz, J.; Zetterberg, H.; Åkerfeldt, T.; Jakobsson, P.-J.; Larsson, A.; Spjuth, O.; Burman, J.; et al. Integration of magnetic resonance imaging and protein and metabolite CSF measurements to enable early diagnosis of secondary progressive multiple sclerosis. Theranostics 2018, 8, 4477–4490. [Google Scholar] [CrossRef]
- Herman, S.; Åkerfeldt, T.; Spjuth, O.; Burman, J.; Kultima, K. Biochemical Differences in Cerebrospinal Fluid between Secondary Progressive and Relapsing–Remitting Multiple Sclerosis. Cells 2019, 8, 84. [Google Scholar] [CrossRef] [Green Version]
- Reinke, S.; Broadhurst, D.; Sykes, B.; Baker, G.; Catz, I.; Warren, K.; Power, C.; Reinke, S. Metabolomic profiling in multiple sclerosis: Insights into biomarkers and pathogenesis. Mult. Scler. J. 2014, 20, 1396–1400. [Google Scholar] [CrossRef] [PubMed]
- Cassol, E.; Misra, V.; Dutta, A.; Morgello, S.; Gabuzda, D. Cerebrospinal fluid metabolomics reveals altered waste clearance and accelerated aging in HIV patients with neurocognitive impairment. AIDS 2014, 28, 1579–1591. [Google Scholar] [CrossRef] [Green Version]
- Pålhagen, S.; Qi, H.; Mårtensson, B.; Wålinder, J.; Granerus, A.-K.; Svenningsson, P. Monoamines, BDNF, IL-6 and corticosterone in CSF in patients with Parkinson’s disease and major depression. J. Neurol. 2009, 257, 524–532. [Google Scholar] [CrossRef] [PubMed]
- Panigrahi, S.K.; Toedesbusch, C.D.; McLeland, J.S.; Lucey, B.P.; Wardlaw, S.L. Diurnal Patterns for Cortisol, Cortisone and Agouti-Related Protein in Human Cerebrospinal Fluid and Blood. J. Clin. Endocrinol. Metab. 2020, 105, e1584–e1592. [Google Scholar] [CrossRef]
- Trezzi, J.-P.; Galozzi, S.; Jaeger, C.; Barkovits, K.; Brockmann, K.; Maetzler, W.; Berg, D.; Marcus, K.; Betsou, F.; Hiller, K.; et al. Distinct metabolomic signature in cerebrospinal fluid in early parkinson’s disease. Mov. Disord. 2017, 32, 1401–1408. [Google Scholar] [CrossRef] [PubMed]
- Nagy, E.; Degrell, I. Determination of ascorbic acid and dehydroascorbic acid in plasma and cerebrospinal fluid by liquid chromatography with electrochemical detection. J. Chromatogr. B Biomed. Sci. Appl. 1989, 497, 276–281. [Google Scholar] [CrossRef]
- Shigematsu, Y.; Hata, I.; Tanaka, Y.; Tajima, G.; Sakura, N.; Naito, E.; Yorifuji, T. Stable-isotope dilution gas chromatography–mass spectrometric measurement of 3-hydroxyglutaric acid, glutaric acid and related metabolites in body fluids of patients with glutaric aciduria type 1 found in newborn screening. J. Chromatogr. B 2005, 823, 7–12. [Google Scholar] [CrossRef] [PubMed] [Green Version]
- Yoo, B.C.; Lee, J.H.; Kim, K.-H.; Lin, W.; Kim, J.H.; Park, J.B.; Park, H.J.; Shin, S.H.; Yoo, H.; Kwon, J.W.; et al. Cerebrospinal fluid metabolomic profiles can discriminate patients with leptomeningeal carcinomatosis from patients at high risk for leptomeningeal metastasis. Oncotarget 2017, 8, 101203–101214. [Google Scholar] [CrossRef] [Green Version]
- Sindelar, M.; Dyke, J.P.; Deeb, R.S.; Sondhi, L.; Kaminsky, S.M.; Kosofsky, B.E.; Ballon, U.J.; Crystal, R.G.; Gross, S.S. Untargeted Metabolite Profiling of Cerebrospinal Fluid Uncovers Biomarkers for Severity of Late Infantile Neuronal Ceroid Lipofuscinosis (CLN2, Batten Disease). Sci. Rep. 2018, 8, 15229. [Google Scholar] [CrossRef] [PubMed] [Green Version]
- Plecko, B.; Hikel, C.; Korenke, G.-C.; Schmitt, B.; Baumgartner, M.R.; Baumeister, F.; Jakobs, C.; Struys, E.; Erwa, W.; Stöckler-Ipsiroglu, S. Pipecolic Acid as a Diagnostic Marker of Pyridoxine-Dependent Epilepsy. Neuropediatrics 2005, 36, 200–205. [Google Scholar] [CrossRef] [PubMed]
- Gallagher, R.C.; Van Hove, J.L.K.; Scharer, G.; Hyland, K.; Plecko, B.; Waters, P.J.; Mercimek-Mahmutoglu, S.; Stockler-Ipsiroglu, S.; Salomons, G.S.; Rosenberg, E.H.; et al. Folinic acid-responsive seizures are identical to pyridoxine-dependent epilepsy. Ann. Neurol. 2009, 65, 550–556. [Google Scholar] [CrossRef]
- Johansson, P.; Almqvist, E.G.; Johansson, J.-O.; Mattsson, N.; Hansson, O.; Wallin, A.; Blennow, K.; Zetterberg, H.; Svensson, J. Reduced cerebrospinal fluid level of thyroxine in patients with Alzheimer’s disease. Psychoneuroendocrinology 2013, 38, 1058–1066. [Google Scholar] [CrossRef]
- AFAR. Biomarkers of Aging (American Federation for Aging Research). 2016. Available online: https://www.afar.org/imported/AFAR_BIOMARKERS_OF_AGING_2016.pdf (accessed on 29 January 2020).
- Orentreich, N.; Matias, J.R.; DeFelice, A.; Zimmerman, J.A. Low methionine ingestion by rats extends life span. J. Nutr. 1993, 123, 269–274. [Google Scholar] [PubMed]
- Lee, B.C.; Kaya, A.; Ma, S.; Kim, G.; Gerashchenko, M.V.; Yim, S.H.; Hu, Z.; Harshman, L.G.; Gladyshev, V.N. Methionine restriction extends lifespan of Drosophila melanogaster under conditions of low amino-acid status. Nat. Commun. 2014, 5, 1–12. [Google Scholar] [CrossRef] [Green Version]
- Lee, B.C.; Kaya, A.; Gladyshev, V.N. Methionine restriction and life-span control. Ann. N. Y. Acad. Sci. 2015, 1363, 116–124. [Google Scholar] [CrossRef] [Green Version]
- Wesley, U.V.; Bhute, V.J.; Hatcher, J.F.; Palecek, S.P.; Dempsey, R.J. Local and systemic metabolic alterations in brain, plasma, and liver of rats in response to aging and ischemic stroke, as detected by nuclear magnetic resonance (NMR) spectroscopy. Neurochem. Int. 2019, 127, 113–124. [Google Scholar] [CrossRef] [PubMed]
- Abeling, N.G.G.M.; Van Gennip, A.H.; Barth, P.G.; Van Cruchten, A.; Westra, M.; Wijburg, F.A. Aromatic L-amino acid decarboxylase deficiency: A new case with a mild clinical presentation and unexpected laboratory findings. J. Inherit. Metab. Dis. 1998, 21, 240–242. [Google Scholar] [CrossRef] [PubMed]
- Iacono, R.P.; Kuniyoshi, S.M.; Ahlman, J.R.; Zimmerman, G.J.; Maeda, G.; Pearlstein, R.D. Concentrations of indoleamine metabolic intermediates in the ventricular cerebrospinal fluid of advanced Parkinson’s patients with severe postural instability and gait disorders. J. Neural Transm. 1997, 104, 451–459. [Google Scholar] [CrossRef] [PubMed]
- Meltzer, C.C.; Smith, G.; DeKosky, S.T.; Pollock, B.G.; Mathis, C.A.; Moore, R.Y.; Kupfer, D.J.; Reynolds, C.F., III. Serotonin in Aging, Late-Life Depression, and Alzheimer’s Disease: The Emerging Role of Functional Imaging. Neuropsychopharmacology 1998, 18, 407–430. [Google Scholar] [CrossRef] [Green Version]
- Virmani, A. Role of carnitine esters in brain neuropathology. Mol. Asp. Med. 2004, 25, 533–549. [Google Scholar] [CrossRef]
- Mihalik, S.J.; Goodpaster, B.H.; Kelley, D.E.; Chace, D.H.; Vockley, J.; Toledo, F.G.; Delany, J.P. Increased Levels of Plasma Acylcarnitines in Obesity and Type 2 Diabetes and Identification of a Marker of Glucolipotoxicity. Obesity 2010, 18, 1695–1700. [Google Scholar] [CrossRef] [PubMed] [Green Version]
- Chambers, M.C.; MacLean, B.; Burke, R.D.; Amodei, D.; Ruderman, D.L.; Neumann, S.; Gatto, L.; Fischer, B.; Pratt, B.; Egertson, J.D.; et al. A cross-platform toolkit for mass spectrometry and proteomics. Nat. Biotechnol. 2012, 30, 918–920. [Google Scholar] [CrossRef] [PubMed]
- Röst, H.L.; Sachsenberg, T.; Aiche, S.; Bielow, C.; Weisser, H.; Aicheler, F.; Andreotti, S.; Ehrlich, H.-C.; Gutenbrunner, P.; Kenar, E.; et al. OpenMS: A flexible open-source software platform for mass spectrometry data analysis. Nat. Methods 2016, 13, 741–748. [Google Scholar] [CrossRef]
- Berthold, M.R.; Cebron, N.; Dill, F.; Gabriel, T.R.; Kötter, T.; Meinl, T.; Ohl, P.; Sieb, C.; Thiel, K.; Wiswedel, B. KNIME: The Konstanz Information Miner. In Data Science and Social Research II; Springer International Publishing: Berlin/Heidelberg, Germany, 2008; pp. 319–326. [Google Scholar]
- Venables, W.N.; Ripley, B.D. Package MASS. Available online: http://www.r-project.org (accessed on 17 October 2012).
- Herman, S.; Khoonsari, P.E.; Aftab, O.; Krishnan, S.; Strömbom, E.; Larsson, R.; Hammerling, U.; Spjuth, O.; Kultima, K.; Gustafsson, M. Mass spectrometry based metabolomics for in vitro systems pharmacology: Pitfalls, challenges, and computational solutions. Metabolomics 2017, 13, 79. [Google Scholar] [CrossRef] [PubMed]
- Ritchie, M.E.; Phipson, B.; Wu, D.; Hu, Y.; Law, C.W.; Shi, W.; Smyth, G.K. limma powers differential expression analyses for RNA-sequencing and microarray studies. Nucleic Acids Res. 2015, 43, e47. [Google Scholar] [CrossRef] [PubMed]


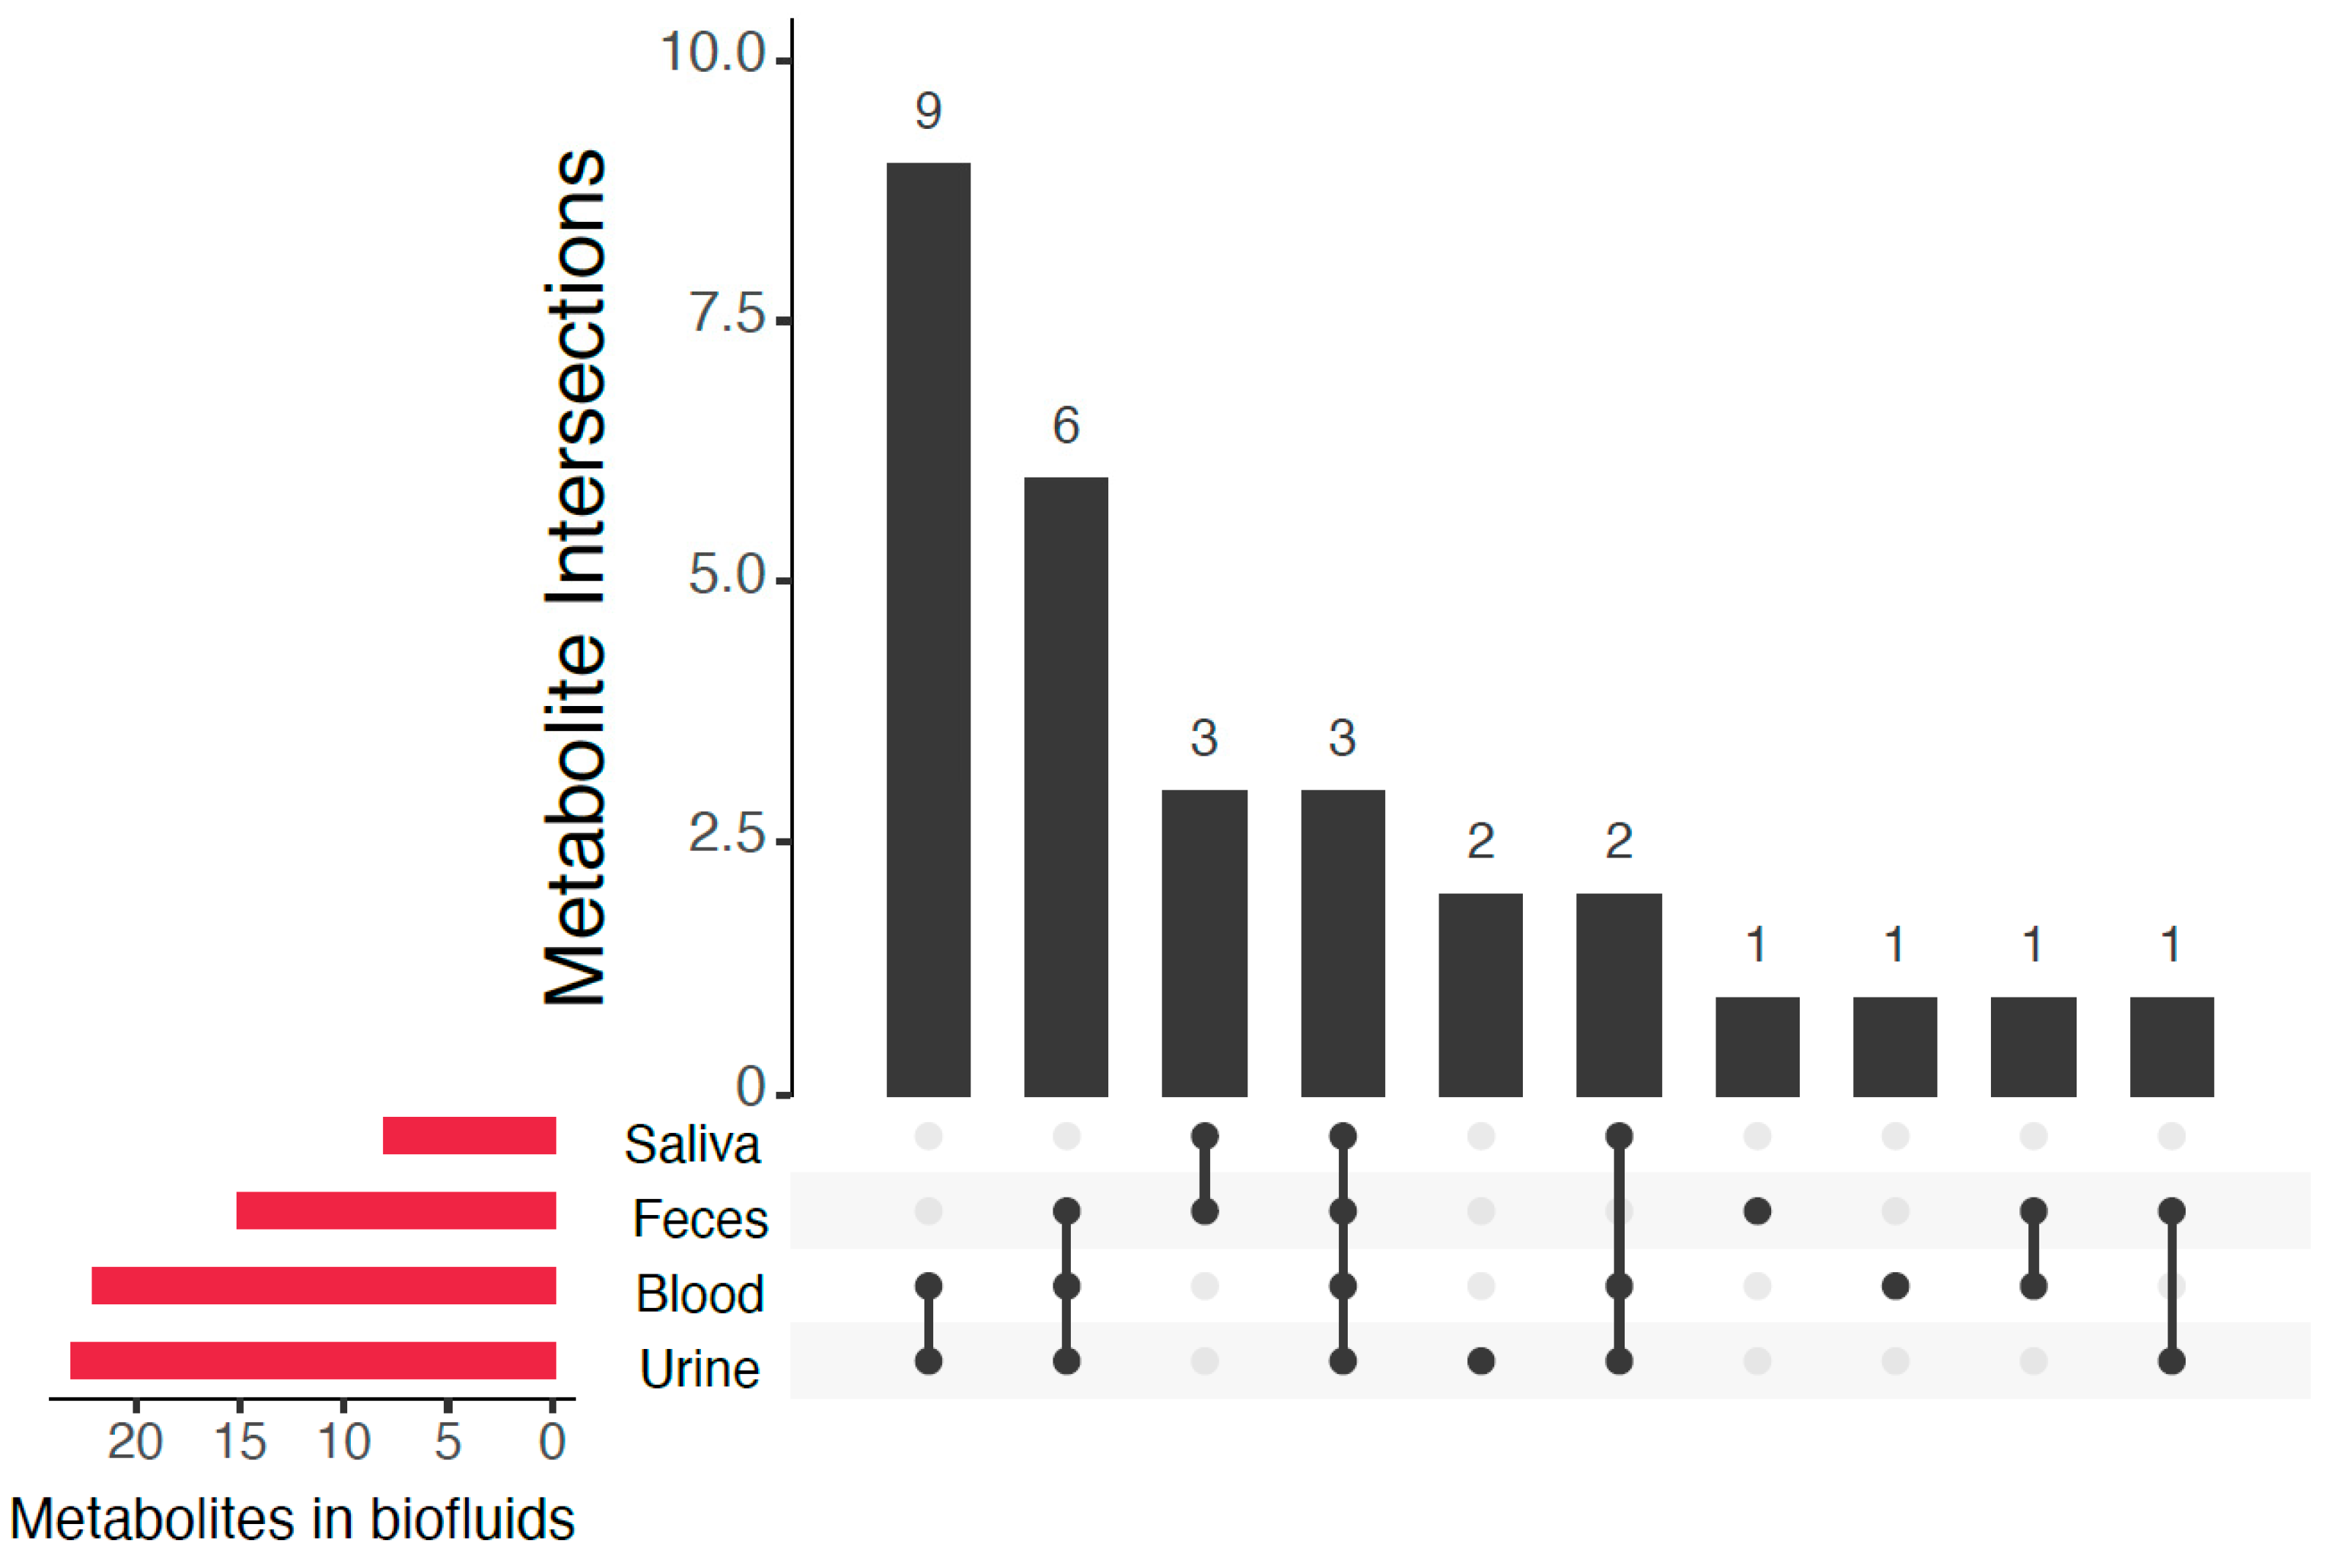
| Metabolite | HMDB ID | Formula | Mass (Da) 1 | Reported in CSF in Literature 2 | Previously Detected in (Biofluids) 3 |
|---|---|---|---|---|---|
| Cortexolone (11-deoxycortisol) | HMDB0000015 | C21H30O4 | 346.214 | No | Urine, blood |
| 1-Methyladenosine | HMDB0003331 | C11H15N5O4 | 281.112 | [27] | Urine, blood |
| 3-(2-Hydroxyphenyl)propanoic acid (melilotic acid) | HMDB0033752 | C9H10O3 | 166.063 | No | Feces |
| 3-Methyladenine | HMDB0011600 | C6H7N5 | 149.070 | No | Urine, blood |
| 4-Acetamidobutanoic acid | HMDB0003681 | C6H11NO3 | 145.074 | [27,29] | Urine, blood, feces |
| 4-Methylcatechol | HMDB0000873 | C7H8O2 | 124.052 | No | Urine, blood, feces |
| 5-Methylcytosine | HMDB0002894 | C5H7N3O | 125.059 | No | Not previously reported (possible source: food/endogenous) |
| Aldosterone | HMDB0000037 | C21H28O5 | 360.194 | No | Urine, blood, saliva |
| Aminoadipic acid | HMDB0000510 | C6H11NO4 | 161.069 | No | Urine, blood, feces, saliva |
| Corticosterone (17-deoxycortisol) | HMDB0001547 | C21H30O4 | 346.214 | [30] | Urine, blood |
| Cortisone | HMDB0002802 | C21H28O5 | 360.194 | [31] | Urine, blood |
| Dehydroascorbic acid | HMDB0001264 | C6H6O6 | 174.016 | [32,33] | Urine, blood |
| Deoxyguanosine | HMDB0000085 | C10H13N5O4 | 267.097 | No | Urine, blood, feces, saliva |
| Glutarylcarnitine | HMDB0013130 | C12H21NO6 | 275.137 | [27,34] | Urine, blood |
| Guanosine | HMDB0000133 | C10H13N5O5 | 283.092 | No | Urine, blood, feces, saliva |
| Indole-3-acetamide | HMDB0029739 | C10H10N2O | 174.079 | No | Urine, blood |
| Methyl jasmonate | HMDB0036583 | C13H20O3 | 224.141 | No | Urine |
| 5’-Methylthioadenosine | HMDB0001173 | C11H15N5O3S | 297.090 | [29,35] | Urine, blood |
| Monoethyl malonic acid | HMDB0000576 | C5H8O4 | 132.042 | No | Blood |
| N-Acetyl-L-alanine | HMDB0000766 | C5H9NO3 | 131.058 | [29,36] | Urine, feces |
| N-Acetylleucine | HMDB0011756 | C8H15NO3 | 173.105 | No | Feces, saliva |
| N-Acetyl-L-methionine | HMDB0011745 | C7H13NO3S | 191.062 | No | Feces, saliva |
| N-Acetyl-L-phenylalanine | HMDB0000512 | C11H13NO3 | 207.090 | [27] | Feces, saliva |
| Niacinamide | HMDB0001406 | C6H6N2O | 122.048 | No | Urine, blood, feces, breast milk |
| N-methyl-L-glutamic Acid | HMDB0062660 | C6H11NO4 | 161.069 | No | Urine |
| l-Norleucine | HMDB0001645 | C6H13NO2 | 131.095 | No | Urine, blood, feces |
| l-Pipecolic acid | HMDB0000716 | C6H11NO2 | 129.079 | [37,38] | Blood, feces |
| Pyrrole-2-carboxylic acid | HMDB0004230 | C5H5NO2 | 111.032 | No | Urine, blood, feces |
| Sebacic acid | HMDB0000792 | C10H18O4 | 202.121 | No | Urine, blood, feces |
| Thyroxine | HMDB0000248 | C15H11I4NO4 | 776.687 | [39] | Urine, blood, saliva |
| trans-Aconitic acid | HMDB0000958 | C6H6O6 | 174.016 | No | Urine, blood |
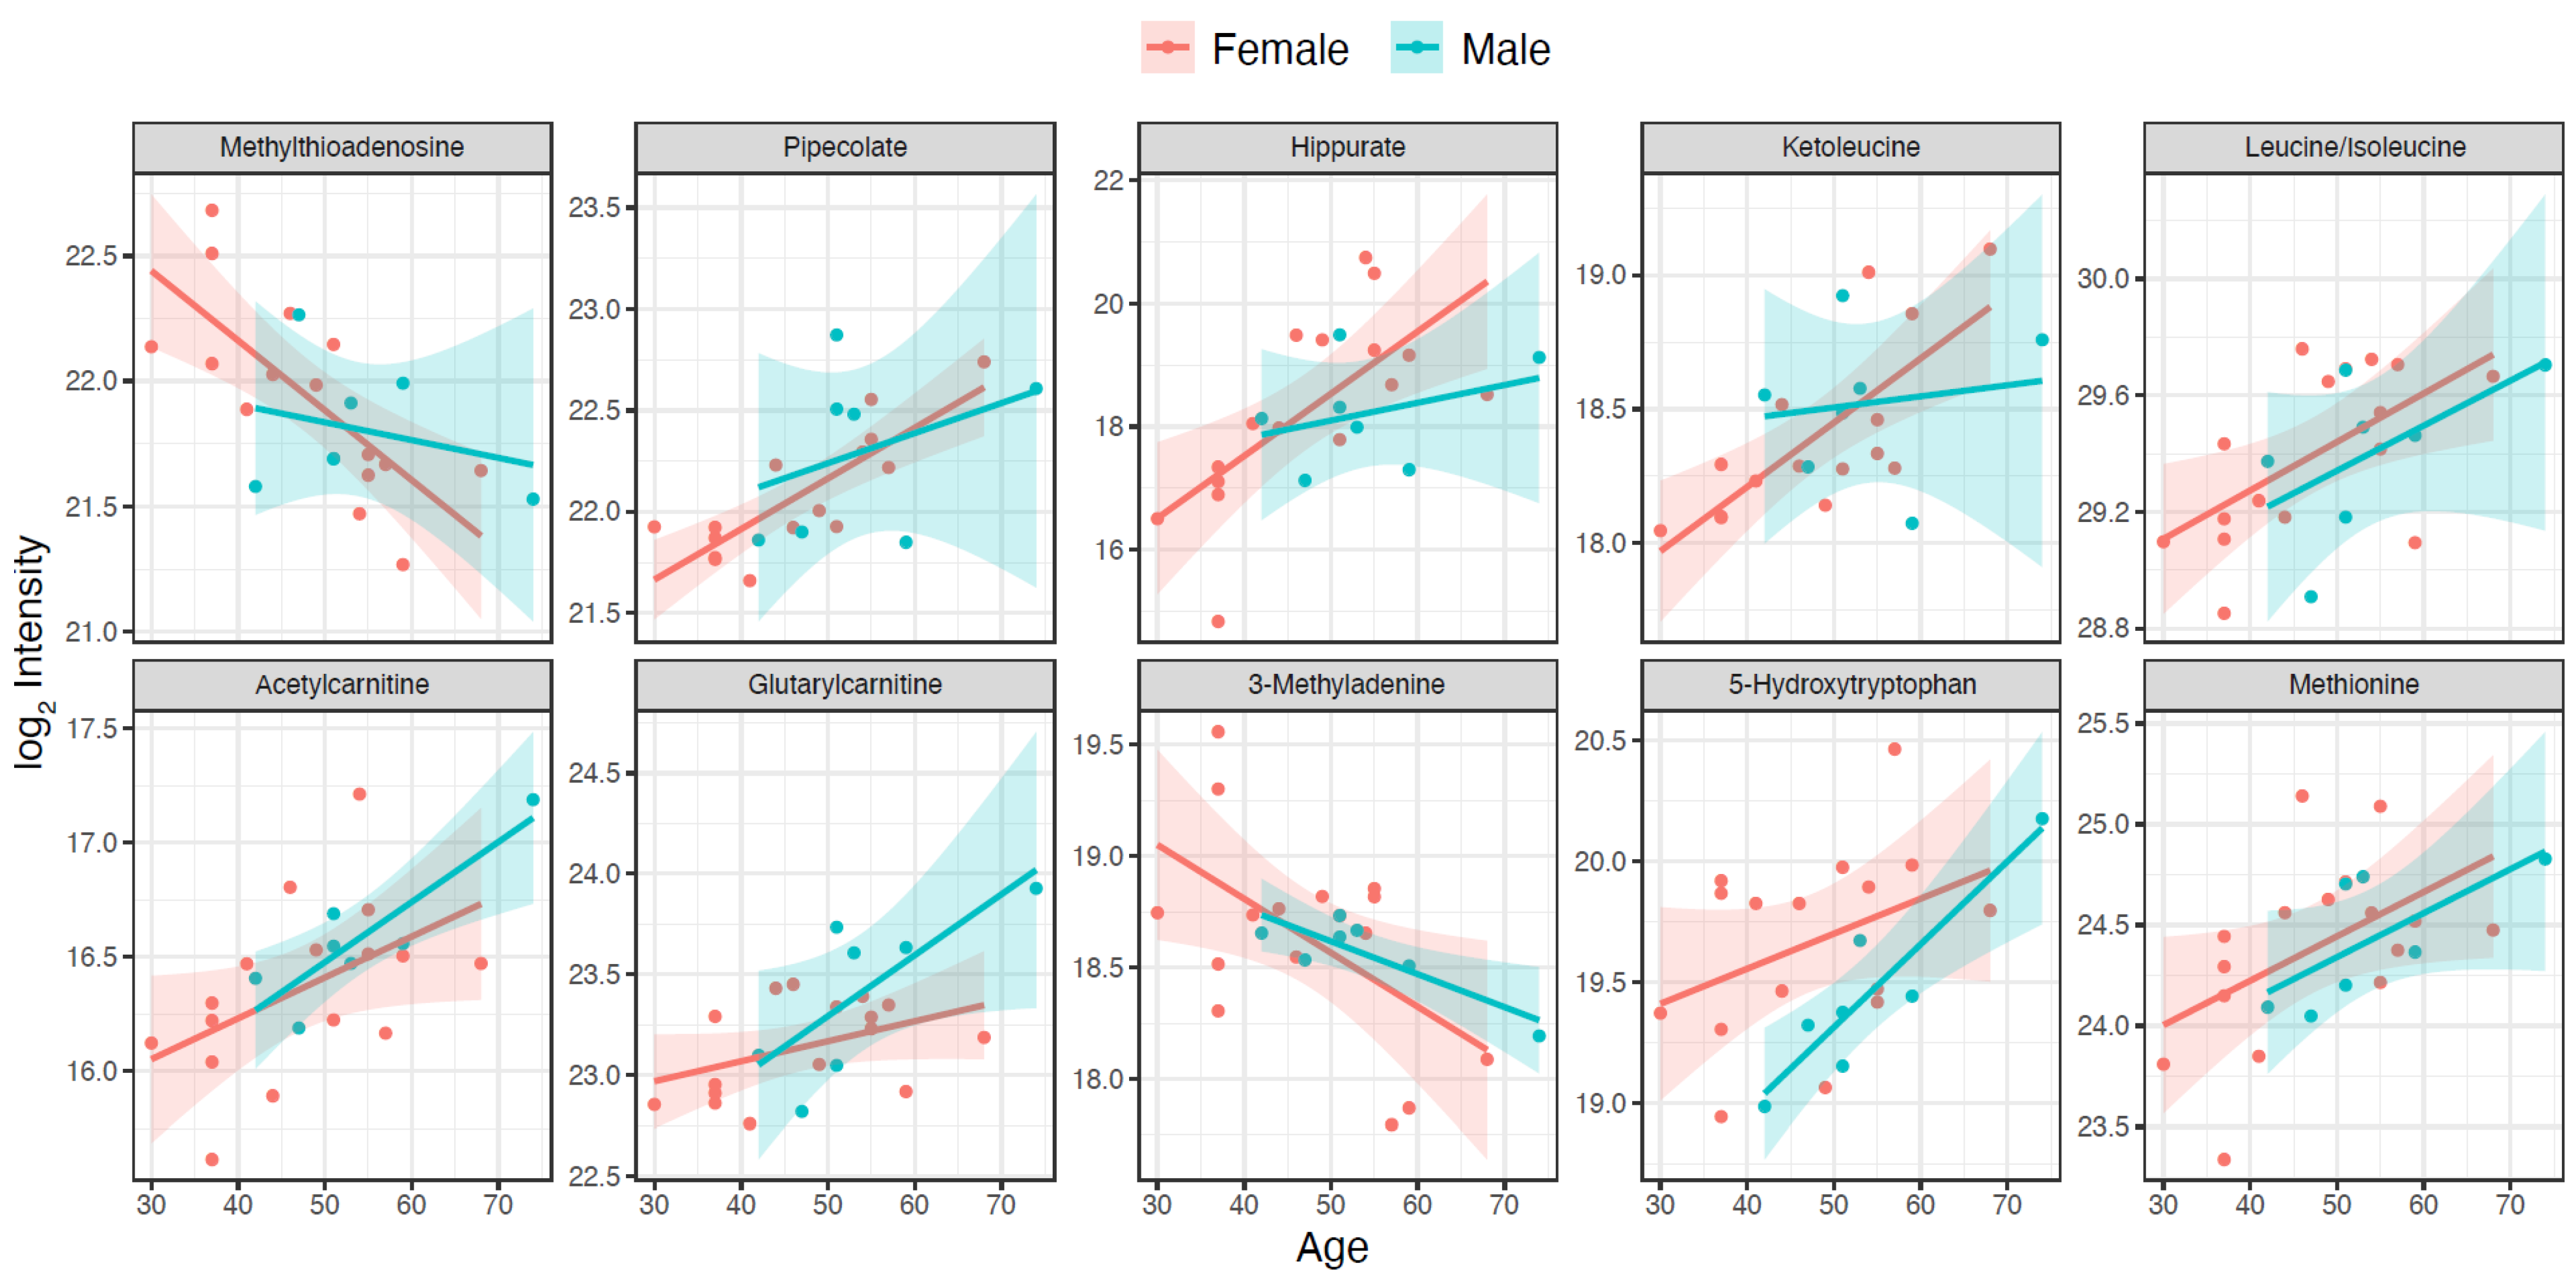
| Metabolite | HMDB ID | q Value | p Age | p Gender | Coefficient for Age Association |
|---|---|---|---|---|---|
| Methylthioadenosine | HMDB0001173 | 0.06018 | 0.00153 | N.S. | −0.02783 |
| Pipecolate | HMDB0000716 | 0.06018 | 0.00168 | N.S. | 0.02495 |
| Hippurate | HMDB0000714 | 0.06018 | 0.00238 | N.S. | 0.10119 |
| Ketoleucine | HMDB0000695 | 0.0673 | 0.00394 | N.S. | 0.024 |
| Isoleucine | HMDB0000172 | 0.0673 | 0.00507 | N.S. | 0.01664 |
| Acetylcarnitine | HMDB0000201 | 0.0673 | 0.00531 | N.S. | 0.0179 |
| Glutarylcarnitine | HMDB0013130 | 0.07023 | 0.00647 | N.S. | 0.00995 |
| 3-Methyladenine | HMDB0011600 | 0.07857 | 0.00827 | N.S. | −0.02422 |
| 5-Hydroxytryptophan | HMDB0000472 | 0.08464 | 0.01002 | 0.04078 | 0.01451 |
| Methionine | HMDB0000696 | 0.09243 | 0.01216 | N.S. | 0.02202 |
| Gender | n | Age in Years, Mean (±SD) | Age Range in Years |
|---|---|---|---|
| Female | 16 | 47.3 (± 10.4) | 30–68 |
| Male | 7 | 53.9 (± 10.3) | 42–74 |
Publisher’s Note: MDPI stays neutral with regard to jurisdictional claims in published maps and institutional affiliations. |
© 2021 by the authors. Licensee MDPI, Basel, Switzerland. This article is an open access article distributed under the terms and conditions of the Creative Commons Attribution (CC BY) license (http://creativecommons.org/licenses/by/4.0/).
Share and Cite
Carlsson, H.; Rollborn, N.; Herman, S.; Freyhult, E.; Svenningsson, A.; Burman, J.; Kultima, K. Metabolomics of Cerebrospinal Fluid from Healthy Subjects Reveal Metabolites Associated with Ageing. Metabolites 2021, 11, 126. https://0-doi-org.brum.beds.ac.uk/10.3390/metabo11020126
Carlsson H, Rollborn N, Herman S, Freyhult E, Svenningsson A, Burman J, Kultima K. Metabolomics of Cerebrospinal Fluid from Healthy Subjects Reveal Metabolites Associated with Ageing. Metabolites. 2021; 11(2):126. https://0-doi-org.brum.beds.ac.uk/10.3390/metabo11020126
Chicago/Turabian StyleCarlsson, Henrik, Niclas Rollborn, Stephanie Herman, Eva Freyhult, Anders Svenningsson, Joachim Burman, and Kim Kultima. 2021. "Metabolomics of Cerebrospinal Fluid from Healthy Subjects Reveal Metabolites Associated with Ageing" Metabolites 11, no. 2: 126. https://0-doi-org.brum.beds.ac.uk/10.3390/metabo11020126