Calcium and Potassium Spectra in the EUV


Fakultät für Physik und Astronomie, Ruhr-Universität Bochum, AIRUB, 44780 Bochum, Germany
Atoms 2020, 8(4), 73; https://0-doi-org.brum.beds.ac.uk/10.3390/atoms8040073
Submission received: 28 August 2020
/
Revised: 30 September 2020
/
Accepted: 2 October 2020
/
Published: 14 October 2020
(This article belongs to the Section Atomic, Molecular and Nuclear Spectroscopy and Collisions)
Abstract
:In online data bases, the entries on extreme ultraviolet (EUV) spectra of Ca are much more sparse than those of neighbouring elements such as Ar, K, Sc and Ti. This may be a result of experimental problems with Ca in the laboratory as well as of the limited role of multiply charged Ca ions in solar observations. Beam-foil EUV spectra of Ca and K are presented that provide survey data of a single element each.
1. Introduction
Early in the 19th century Wollaston and Fraunhofer detected dark lines in their prism spectra of the Sun, and Fraunhofer labelled the strongest of these lines by capital letters of the alphabet. A few decades later Kirchhoff and Bunsen recognized that those dark lines agreed in position with bright lines in the spectra of a flame seeded with specific materials. Thus it was eventually learned that Fraunhofer’s line ‘G’ (partly) originates from calcium (Ca, atomic number ) atoms, and his lines ‘H’ and ‘K’ belong to singly charged Ca ions. Evidently, Ca is abundant enough in the Sun to feature prominently in the solar visible spectrum.
Subsequently, the various spectra of Ca have been studied in flames, arcs, sparks, and whatever plasma discharge light sources seemed appropriate, and the extent of the spectral coverage has expanded from the visible to the infrared (IR), ultraviolet (UV), vacuum ultraviolet (VUV, wavelengths below 200 nm), and extreme ultraviolet (EUV, wavelengths below 110 nm) to the X-ray range (wavelengths shorter than, say, 5 nm). However, the NIST ASD online database [1] lists only about 60 lines of Ca VI to Ca XIV in the wavelength range 10 to 80 nm. In contrast, the data entries on the next lower or heavier ions, K (, about 550 lines), Sc (, about 400 lines), and Ti (, about 800 lines), are much more numerous. Contrary to most other elements, the NIST ASD wavelength tables on many Ca spectra state Ritz wavelengths only, that is, results from term analysis rather than original measurement. Apparently the study of Ca in spectroscopic light sources has posed larger experimental problems than for many other elements. Many of the experimental data on Ca are of inconsistent quality and cannot be used as reliable references.
I have therefore looked again at some of the recent spectroscopic literature on Ca, especially some under-evaluated Ca data of my own experiments (none of these Ca data are of the high accuracy required for a completion of the NIST ASD tables), and I offer suggestions for future work. I am leaving out of my discussion any spectroscopic work on neutral Ca atoms or on Ca ions in low charge states. Also, the properties of Ca ions with very few electrons can nowadays be computed to high precision with various ab initio approaches such as Multi-Configuration Dirac-Hartree-Fock (MCDHF), Many-Body Perturbation Theory (MBPT), Relativistic Configuration Interaction (RCI), or Multi-Reference Møller-Plesset (MRMP); for a recent discussion on the capabilities of some of these techniques see [2].
A number of studies have addressed the EUV spectra of multiply charged ions of calcium (for references see [1,3,4,5]). This work focuses on the charge state ions from Ca to Ca. Some of the earlier compilations [5,6] are more extensive (on Ca data) than the present NIST ASD online database [1]. However, there are some abrupt wavelength coverage limits (especially for some ions of Ca), if a data source did not extend further. This is often a question of laboratory equipment. For example, normal-incidence spectrometers have a poor efficiency below a wavelength of about 40 nm, and many grazing-incidence spectrometers are inefficient above 35 to 40 nm. NIST ASD work bridges such problematic wavelength ranges via term analysis and theoretical study. A compilation by Fawcett [7] covers transitions in the shell, based on observed data and systematic isoelectronic analyses. A more recent compilation, the CHIANTI database [8,9,10,11,12,13], combines (mostly) solar observations with computations and contains computed EUV spectra of elements that are prominent in stars. Ca is moderately prominent in solar EUV spectra. However, in spectral ranges of high line density, such as the EUV from 17 to about 30 nm, lines of Fe dominate the solar coronal emission [14] and probably mask some of the (typically weaker) Ca features.
Ca spectra can be employed for the diagnostics of tokamak plasma discharges [15], which requires not only wavelength spectra but also transition rates provided both in NIST ASD and CHIANTI. CHIANTI provides spectral modelling results for a number of electron density values. A recent evaluation of the EUV spectra of a tokamak plasma containing Ar and Ca [16] found a number of cases for high charge states of Ca (such as Ca XIV, Ca XV) in which parts of some line multiplets matched the predicted line intensity patterns while other components of the same multiplet did not. The multiplet line intensity patterns can be estimated from first principles [17] if the coupling is not too far from LS coupling; the CHIANTI collisional-radiative model modifies these patterns according to the coronal environmental conditions. Drastic deviations of experiment from theory might arise from line blends or imperfect wavelengths. For the low-density tokamak plasma discharge, most Ar and Ca data were found to be compatible with CHIANTI [16]. A key problem in using astrophysical observations as used for CHIANTI is interference from a large number of other elements; the identification of a given line with a given element cannot be tested.
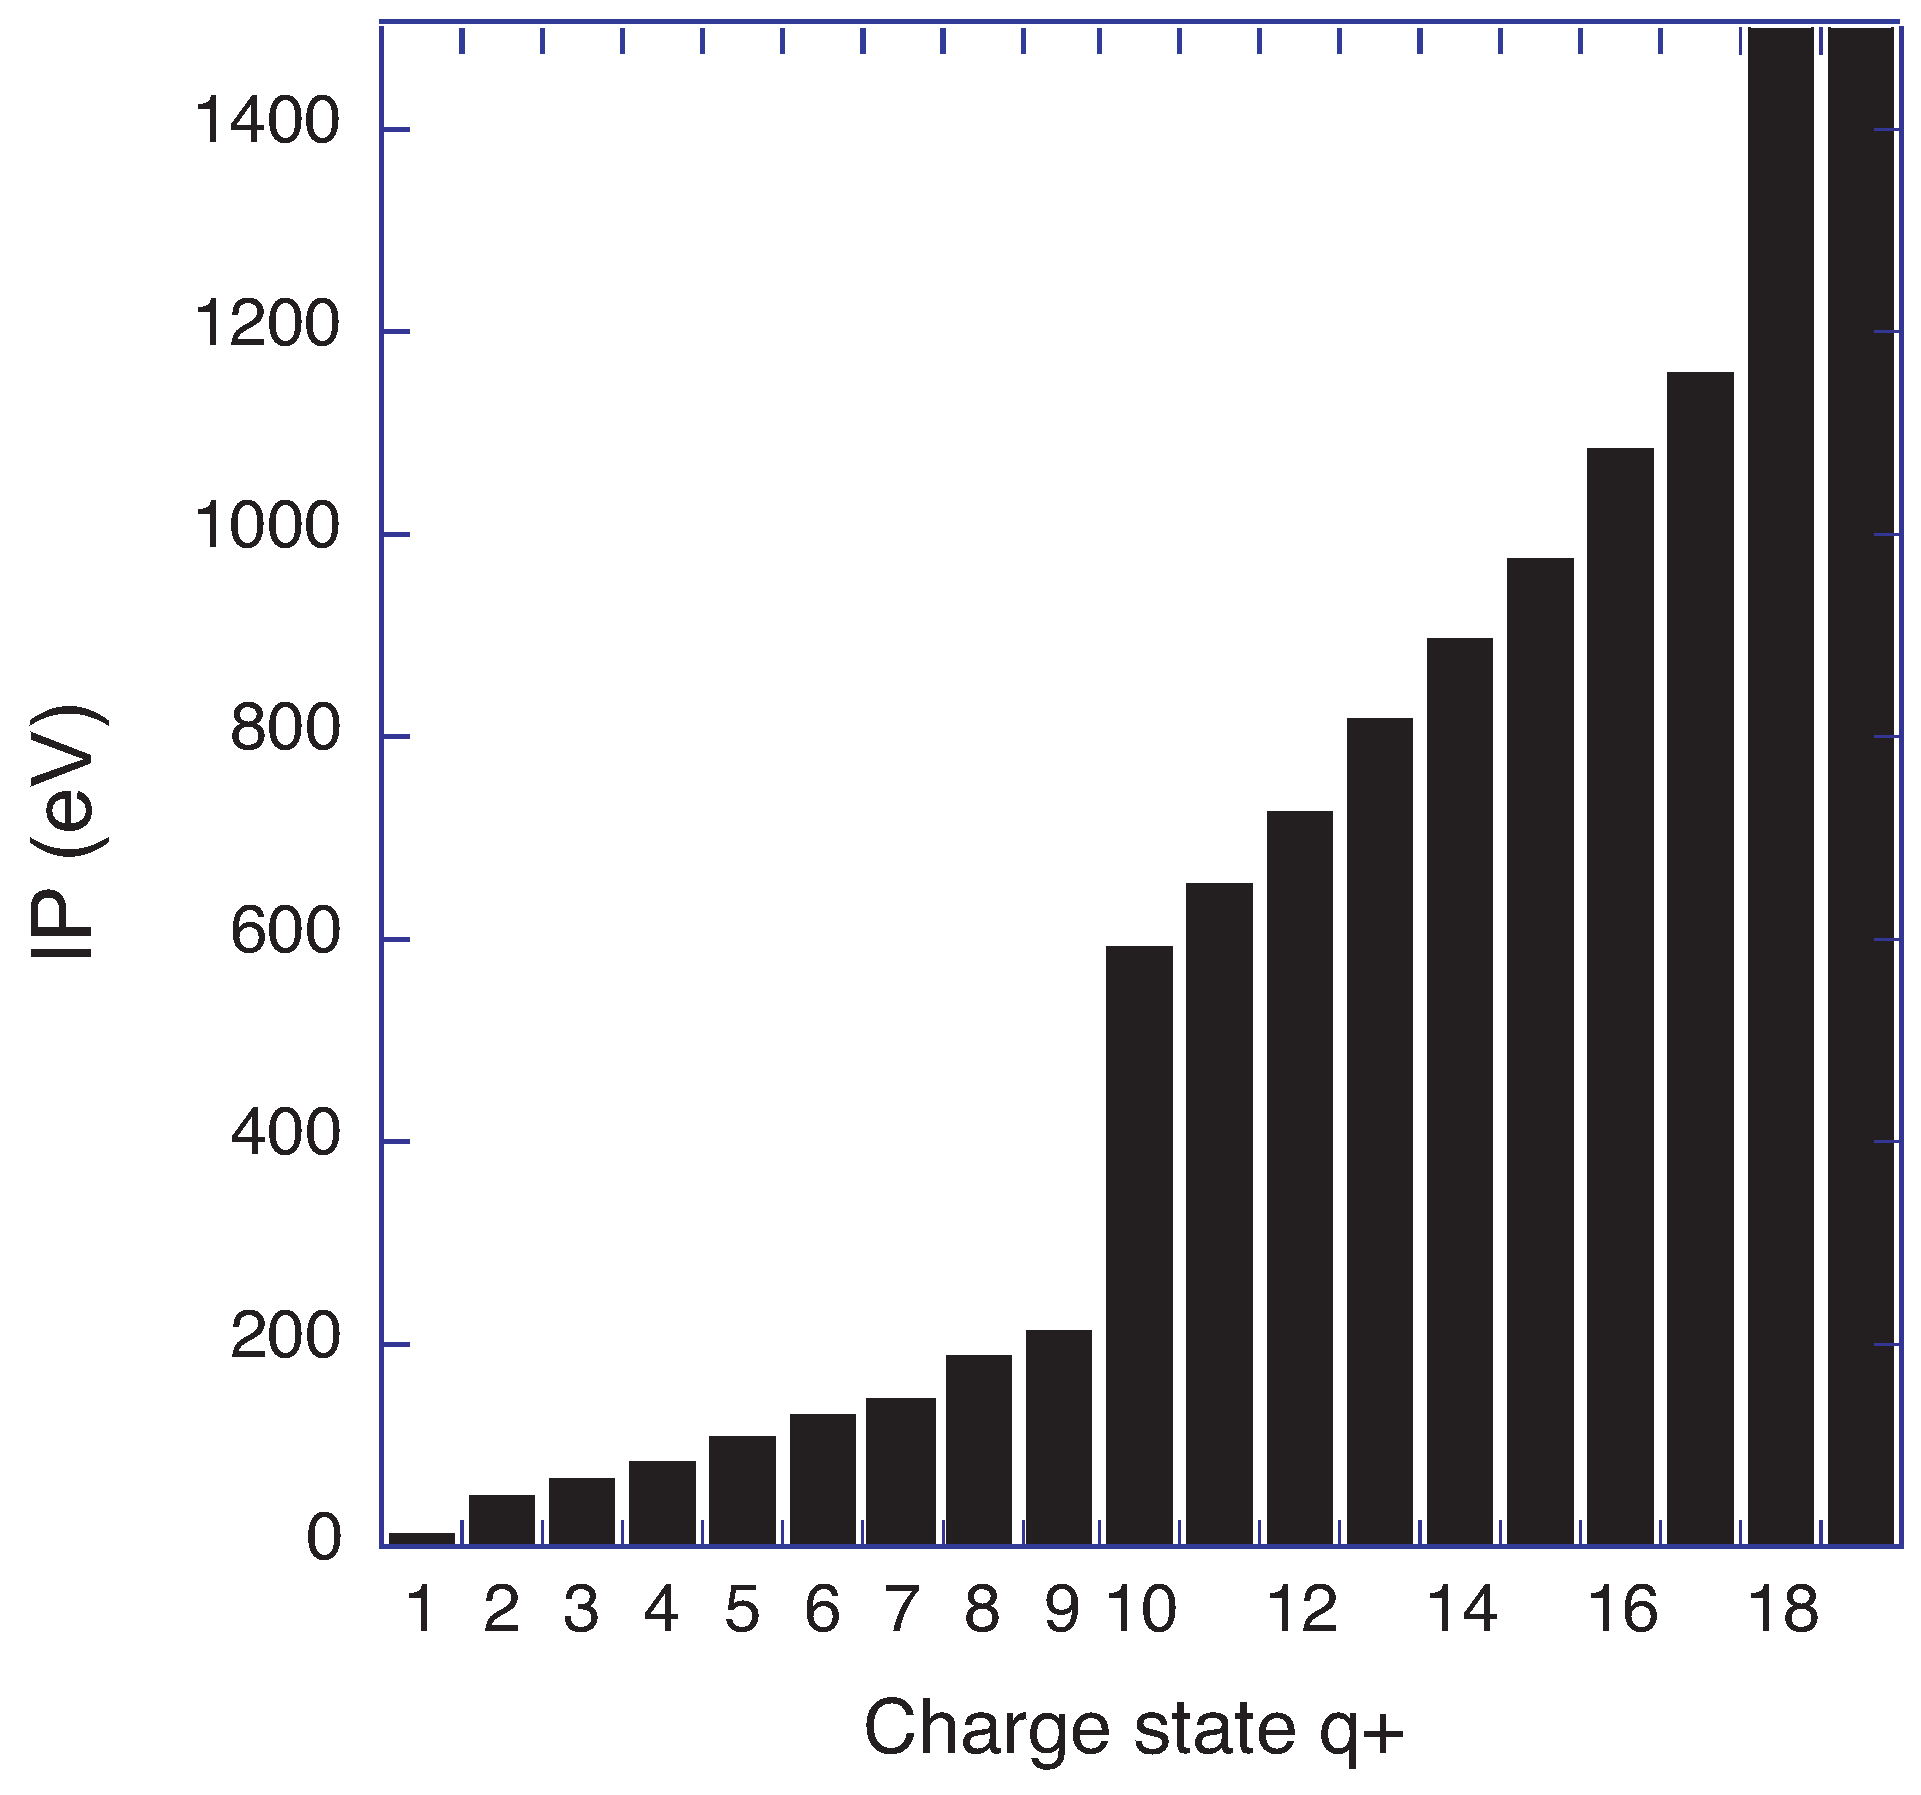
In the laboratory one may expect that it is possible to distinguish the elements. For example, the plasma experiment [16] introduced Ca and F by laser ablation of CaF, so that the appearance time of presumed Ca or F lines could be cross-linked to the time structure of the injection process. In fact, no F lines were identified, and some of the purported Ca lines did not match the injection pulses. In experiments at an electron beam ion trap (EBIT) at Livermore [18,19,20], Ca was introduced as a low-pressure vapour from a heated chemical compound. Eventually, high-resolution spectra were recorded in the wavelength band 12.4 to 13.4 nm [21]. The electron beam energy was varied so that spectra of an ion cloud with a predetermined highest ion charge state could be compared and thus the spectra to which individual lines belonged be estimated, if not always determined. Such an analysis makes use of the calculated or measured ionization potentials of all charge states (see Figure 1). Numerous previously unknown lines were seen and seemed to fill a gap in the sparse listings of Ca data in the NIST ASD database. The same spectral range was later covered in the aforementioned tokamak plasma experiment with Ca and F injection [16], which, however, did not confirm the Ca data in [21]. For all elements lighter and for many elements heavier than Ca (in particular of the iron group) the spectra are sufficiently well known to exclude that any of those could explain the EBIT observations. It was concluded instead that a much heavier element, such as Ba (), a component of the electron gun material in EBIT, had likely contaminated the experiment.
Potassium, like other odd-atomic number elements, is less abundant in the Sun than nearby even-number elements and hence it is not represented among Fraunhofer’s strongest lines. For accelerator-based atomic physics studies of multiply charged ions, the preferred (tandem) accelerator type requires the injection of negative ions. These are not easily formed of K or potassium-carrying compounds, and consequently K yields a relatively weak signal. However, K is easy to excite as an atom in many other ways, and therefore the literature base for K data is more ample than for Ca data. A set of beam-foil EUV spectra of K is presented below as a counterpart to the Ca spectra.
Here we will discuss Ca data that precede those in [16,21]. Parts of the data have been published before [3,4]. The data have been obtained by beam-foil spectroscopy at the Bochum Dynamitron tandem accelerator laboratory, more than two decades ago. The technique is explained in the next section along with peculiarities of the experimental procedures. The motivation for presenting results from older measurements is that in beam-foil spectroscopy one handles a mono-isotopic ion beam, so that all spectra observed stem from a single element each, in this case calcium and potassium, respectively, and that any elemental ambiguity is avoided.
2. Beam-Foil Spectroscopy
There is anecdotal evidence from the 1950s of nuclear physicists noting visible light in their scattering chambers where fast ion beams were interacting with thin foil targets. In about 1963, Kay (in the UK) and Bashkin (in the USA) recognized the possible atomic physics interest in such foil-excited ion beams, and both researchers laid out the basic properties of such a measurement technique [22,23]. For about a third of a century the field evolved, thrived [24], and wilted [25].
The key feature is a fast (on the order of 1% of the speed of light and faster) ion beam passing through a thin foil which merely provides a dense electron target. The ions lose but a small fraction of their energy and remain (mostly) in a well collimated beam. The collisions with the many electrons of the target material occur frequently and energetically. The efficient excitation results in very line-rich spectra. Inner-shell ionization as well as multiple excitation occur, followed by Auger decay. With higher ion beam energies, the ions reach higher charge states, with a predictable charge state distribution.
Ionization and excitation take place in a high density environment, but then the fast ions leave the foil within a fraction of a picosecond and continue on their flight path in high vacuum, practically without further collisions. Because the ions remain on a common beam trajectory, one can observe a given spectral feature and follow its decay, with distance from the exciter foil (usually in the range of a few m to many cm) serving as a measure of time after excitation. This way, the mean lifetimes of atomic levels can be measured, in the range from a few picoseconds to many nanoseconds. The methods and certain complications are explained in References [24,25], along with examples and achievements. The technique has proved an efficient tool for ions of all charge states and all elements.
Charge State Distributions
The use of a gas or foil stripper has been essential in many ion accelerator schemes since the 1940s. Charge state distributions (CSD) within ion beams that have been passed through a thin foil have been a topic of interest and concern in most heavy-ion accelerator laboratories, because one wants to select a specific ion charge state and isotope, or for feeding a specific ion beam to another accelerator stage. The charge state of the ion travelling through a thin foil (or a gas) evolves as a dynamic balance of electron loss (by collisions with the tiny nuclei, the target electron cores, and the quasi-free electrons of the target material) and electron capture (from the quasi-free electrons of the target material). An early collision model by Dmitriev and Nikolaev [26,27] yielded basically correct results, but a fair number of formulas were developed to yield more accurate estimates, including fits to the growing body of experimental data.
Some of these prescriptions address low-, medium-, or high-energy ion beams specifically. For example, the studies by Sayer, Delaunay, and Shima et al. [28,29,30] have addressed work at ion beam energies from some 0.1 MeV/amu to a few MeV/amu (amu is the atomic mass unit or mass number), which is typical for many industry and university laboratories. The results of these studies largely agree with each other, which is not surprising, because they have been adjusted to experimental data. Two decades later, national accelerator centres entered a new working range of some 10 MeV/amu and higher. The ETACHA code [31] was explicitly optimized to describe the CSD at ion beam energies that are available at the high energy accelerator at GANIL (France).
Around the year 2000, a group around T. Nandi began to publish beam-foil data on few-electron ions of elements in the iron group (for representative examples, see [32,33,34,35]). In physics terms, this was largely a continuation of much earlier work elsewhere [36,37,38,39], but still of some interest. Beam-foil studies of lighter elements had shown dozens of spectral lines in the X-ray wavelength range of interest [40]. The data in [32,33,34,35] showed two wide lines from a solid state X-ray detector. References [32,33,34,35] described levels and their decays in two- and three-electron ions, for example in V, at ion beam energies of 100 and 158 MeV. The aforementioned papers on CSD [28,29,30] indicated that the charge state fraction of He-like V at 100 MeV should be about 0.1%, and of Li-like V 1.4%, that is, these charge state ions should practically not be present. At the higher ion beam energy of 158 MeV, the corresponding fractions should be about 3.1% and 14.6%, respectively. How could the production of the high charge states discussed possibly be ascertained at these ion beam energies? The first papers [32,33] do not even comment on this essential aspect of the reported work. Later papers [34,35] mention reference [31]: Apparently the production of high charge states was estimated solely on the basis of the predictions of the ETACHA code whose own authors explicitly state that it is not applicable at lower ion energies—such as those in [32,33,34,35]. The charge state fractions predicted by the code outside its range of applicability are unreliable and, indeed, unrealistic. Only a more powerful heavy-ion accelerator could have produced the desired charge state ions; Reference [30] indicates an ion beam energy range about twice as high as the higher energy used in the Nandi experiment—as was, indeed, used in the earlier, original experiments [36,37,38,39]. The Nandi experiment in fact did not produce sufficient amounts of the charge states (few-electron ions) reported, and hence the subsequent discussion based on this assumption was fallacious. Specific levels in two- and three-electron ions behave differently from five- and six-electron ions (likely produced in the Nandi experiment) with their different atomic structure. The only way to prove the presence of the wanted ions is to repeat the experiment with equipment of significantly better spectroscopic capabilities. To date, however, no such experiment has been reported by the Nandi group. In the present study, the appearance of the line spectra of individual charge state ions closely matches the CSD work [28,29,30].
3. Beam-foil Data on Calcium
3.1. Spectra
The operation of a tandem ion accelerator requires the provision of negative ions, in this case CaO, which yields a higher ion beam current than is available with Ca. Ca is a difficult element for any heavy-ion tandem accelerator. The Dynamitron tandem accelerator laboratory at Ruhr-Universität Bochum successfully trained the sputter ion source [41,42] to provide the highest output among similar facilities and handled high ion beam currents (of other elements) reliably. Nevertheless, the Ca ion beam current remained smaller by an order of magnitude than the ion beam currents achieved with other elements. The CaO molecule splits inside the gas stripper in the high voltage terminal of the tandem accelerator, and the Ca ion carries on with only a fraction of the kinetic energy of the original molecule. This circumstance significantly limits the final ion beam energy achievable. The combination of intended wavelength coverage and necessary signal statistics within the time budget of a multi-user facility limits the spectral resolving power that may be employed. Even if higher spectral resolution can be achieved by using narrower spectrometer slits, a meaningful level of signal statistics is required for statistical reliability. Better quality data can be gathered only at the high cost of operating time or multichannel detection.
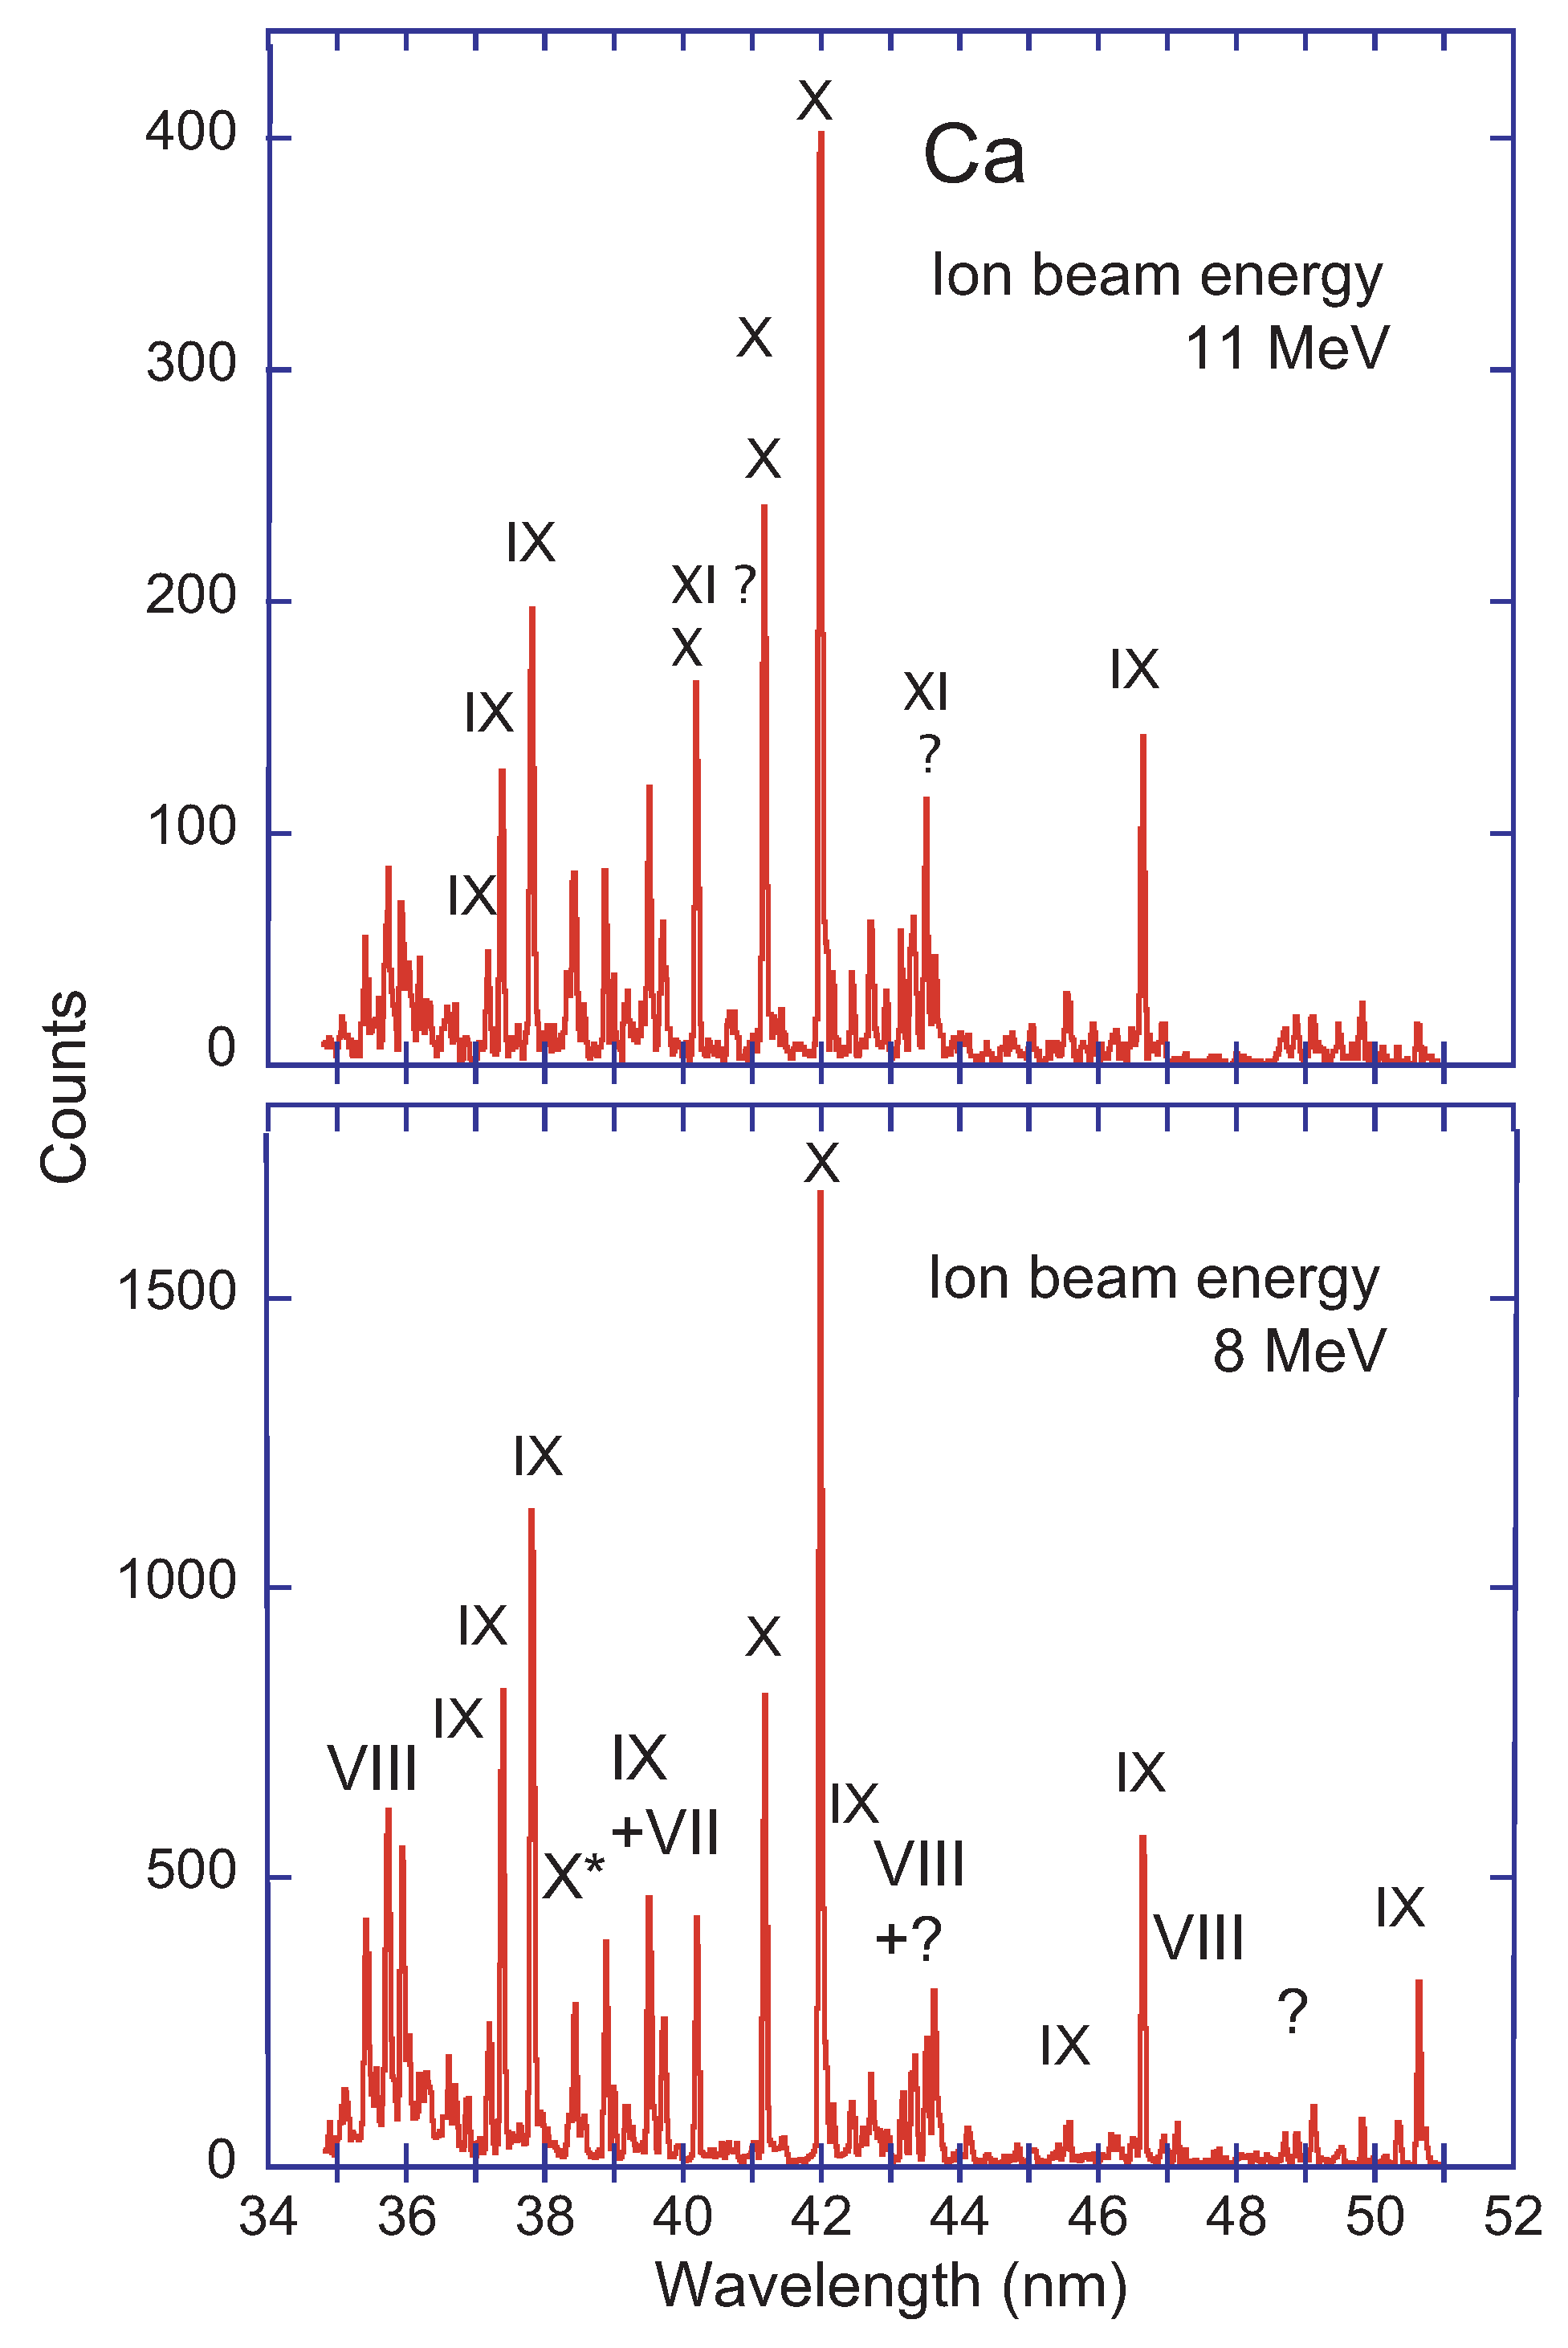
The spectrometer employed was a McPherson Mod. 247 grazing-incidence scanning monochromator equipped with a channeltron detector. The exit slit head motion was monitored by a Heidenhain Moiré fringe length gauge reading to ±1 m. The R = 2.2 m diffraction grating featured a groove density of 600 l/mm. A slit width of 50 m (80 m) resulted in a line width (FWHM) of 0.035 nm (0.06 nm). The detection efficiency function of the spectrometer favoured the wavelength range near 20 nm, but permitted measurements up to and even beyond 60 nm [43,44]. More details and other spectrum samples can be found in References [3,4]. Figure 2 shows Ca beam-foil spectra obtained at ion beam energies of 8 and 11 MeV, respectively. In order to avoid visual clutter in this and the further figures, the spectrum numbers are indicated only for some prominent lines and line groups. Most of the marked lines are listed in the NIST ASD tables [1] and thus easily identified. The spectrum labels often mark groups of lines without individual fiducial markers. Given the high number of line blends, the figures would otherwise be overburdened with labels that still would identify only a fraction of the lines. Several line groups (for example, near = 43 nm and = 49 nm) are earmarked with a question mark to indicate the lack of literature data.
The finite section of the ion beam observed by the spectrometer corresponds to a time-of-flight interval of the ions on the order of 100 ps. The spectra depicted in the present figures have all been recorded with the exciter foil inside the detection window and cover about the first 80 ps of the decays. This is roughly commensurate with many of the level lifetimes of the ions under study.
The spectra have been recorded under different conditions (ion beam energy, foil position, etc.), so that there is no common intensity scale. The spectral line identifications in this and the subsequent figures are based on the NIST ASD tables [1], augmented by Kelly’s compilations [5,6] and the CHIANTI tables (version 8 [12]). At the higher ion beam energy, the Ca X lines (near = 41 nm and = 42 nm) are somewhat brighter than nearby Ca IX and Ca VIII lines. The Ca VIII line group near 36 nm appears relatively brightly at the lower ion beam energy. This line group is not mentioned in the NIST ASD database. The CHIANTI database lists many Ca VIII lines, with intensities obtained from collisional-radiative models. Under the CHIANTI model conditions (electron density clearly lower than the solid-state density in the exciter foil), the lines near 36 nm are expected to be rather weak, whereas the beam-foil spectra show them clearly. The literature indicates a few Ca VIII lines in the group near = 43 nm. The observed signal is higher at the higher ion beam energy, suggesting the presence of unidentified lines of higher charge states as well. At 40.15 nm and at 43.55 nm there are lines that are brighter at the higher ion beam energy. Both line positions are close to predictions for Ca XI [4], but not close to the predictions of Ca XI in the CHIANTI tables [12]. Unfortunately, the computations [4] do not include any spectrum simulation on the basis of collisional-radiative modelling. CHIANTI also predicts the wavelengths of transitions just beyond the established energy levels; most (if not all) of these wavelengths are not close enough to observed spectral features to suggest identification. As mentioned in the introduction, various computational schemes have claimed (almost) spectroscopic accuracy [2]. This can be tested primarily for some principal transitions (mostly those connecting to the ground state; for examples see [45,46,47,48,49] and references therein). For transitions between higher-lying levels, the line density in a spectrum is often high, and the accuracy of even excellent computations in many cases is then not high enough to distinguish between the candidate lines.
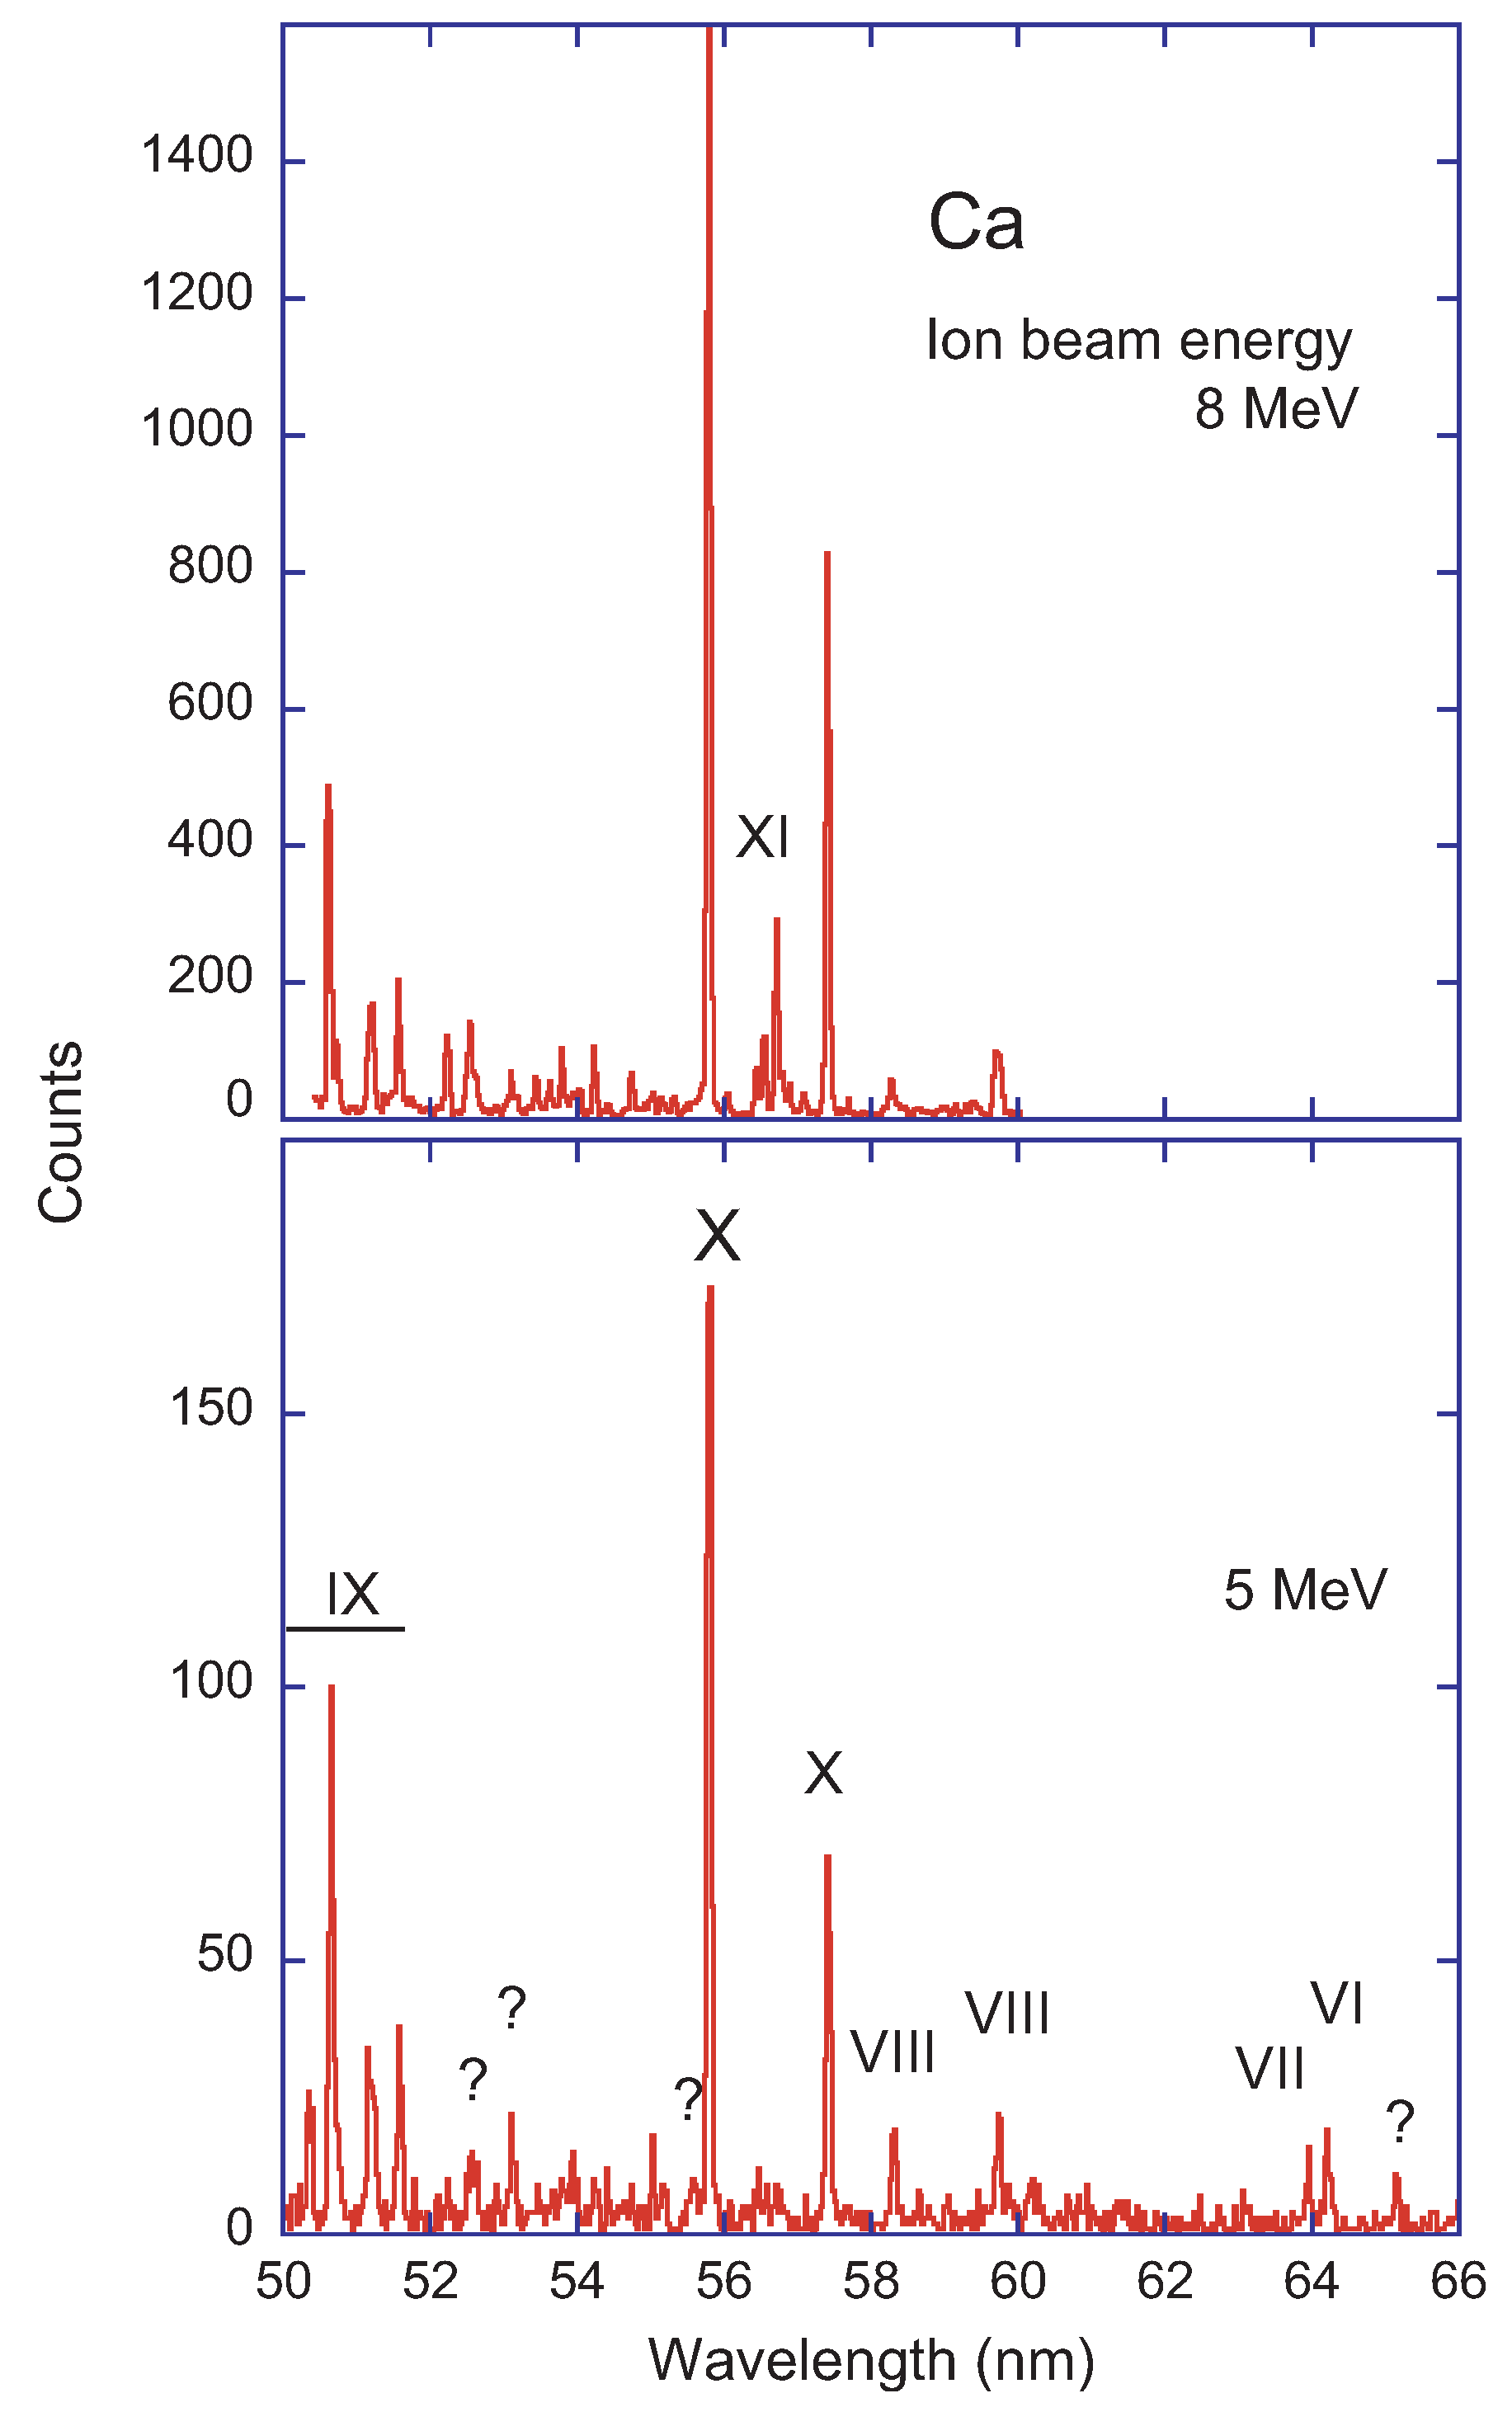
Figure 3 shows Ca beam-foil spectra obtained at ion beam energies of 5 and 8 MeV, respectively. The gap between the Ca X 3s-3p resonance lines near = 55.8 and = 57.4 nm is largely empty at an ion beam energy of 5 MeV, but at an ion beam energy of 8 MeV it contains a group of lines. This step in the charge state distribution [29,30] identifies the additional lines as belonging to Ca XI, and their line pattern has been confirmed by ab-initio atomic structure computations [4]. Those computations established the identities of a fair number of other lines as well. Such a clear discrimination of charge states as demonstrated in Figure 3 is rarely seen in beam-foil spectra. The spectra are dominated by lines of Ca IX and Ca X, with some known much weaker lines of Ca VI, Ca VII, Ca VIII, and Ca IX. There is a considerable number of unidentified, but statistically robust, even weaker lines, that can be seen in spectra recorded at two ion beam energy settings.
The ionization potentials of the Ca ions (Figure 1) show a large step from Na-like ions (single valence electron) to Ne-like ions (tightly bound closed shells). In devices such as an electron beam ion trap (EBIT) [18,19,20], the mono-energetic electron beam can be adjusted to take advantage of this step; thus it is easy to produce a charge state distribution in the trapped ion cloud that features Ne-like ions as the highest-charged ones. In beam-foil spectroscopy, the interaction of the ion beam (with its own bound electrons) with the target foil electrons (with their own energy distribution) is more smeared out in collision energy. Consequently, the ion beam energy threshold for producing the next higher charge state is less well defined than with the electron beam energy in an EBIT. Nevertheless, it may happen that at one given ion beam energy a certain charge state is not yet reached, but at higher energies it is, and spectral features belonging to that charge state ion show up.
How do predictions of the charge state distribution fare compare to the spectroscopically identified charge states in Figure 2 and Figure 3? There is a saying among accelerator people that any such predictions for highly-charged ions are no better than ±1 unit. For the Ca ion charge states and at the ion beam energies of interest here, the predictions by Delaunay [29] versus those by Shima et al. [30] differ by much less than one charge state. Neither Delaunay nor Shima et al. expect more than 2% Ne-like ions at the lower beam energy, but about 10% at 8 MeV, as is borne out by the data (Figure 3). In beam-foil spectroscopy the 3s-3p and 3p-3d lines of Na-like are boosted by massive cascade repopulation and show among the brightest lines in the present spectra even if the charge state fraction may be small at unfavourable ion energies. The Delaunay tables predict Na-like ions to be dominant (charge state fraction just above 30%) between 10 and 11 MeV ion beam energy, while the table of Shima et al. places the maximum just below 12 MeV. Delaunay and Shima et al. predict little change for Na-like ions and a slight increase for Ne-like ion contributions.
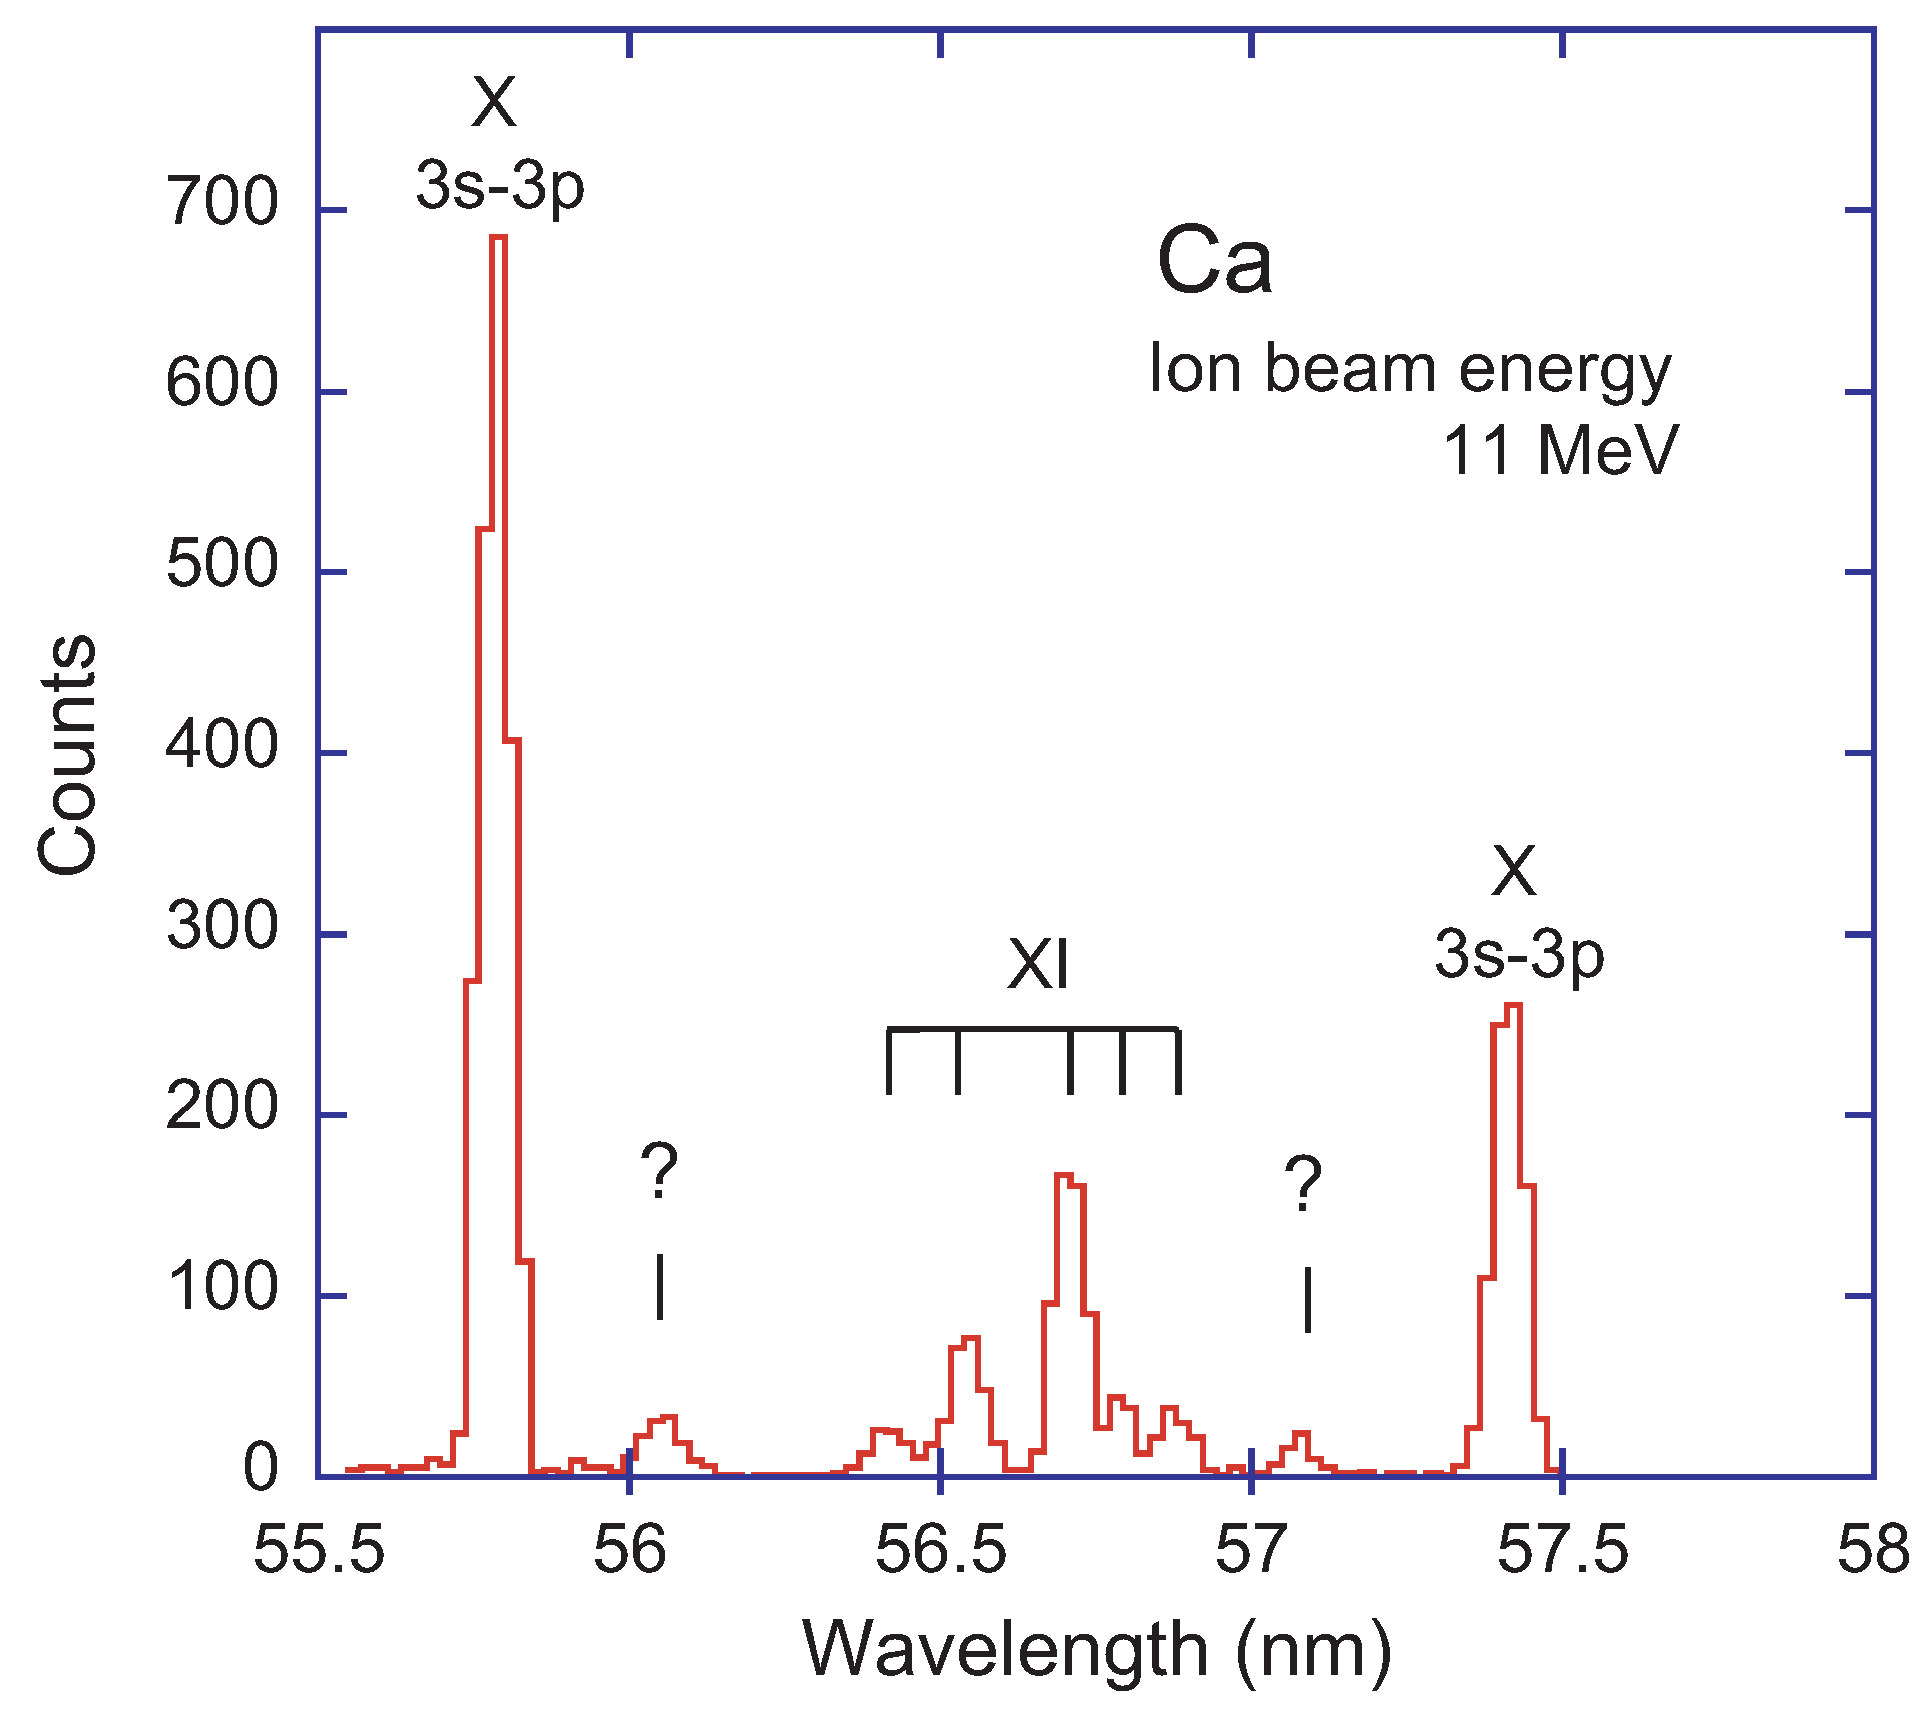
Figure 4 shows the Ca beam-foil spectrum near the 3s-3p resonance transitions of Ca X. The line group in the middle can be identified by atomic structure computations [4] as belonging to Ca XI. However, there are further weak lines not yet identified in the literature.
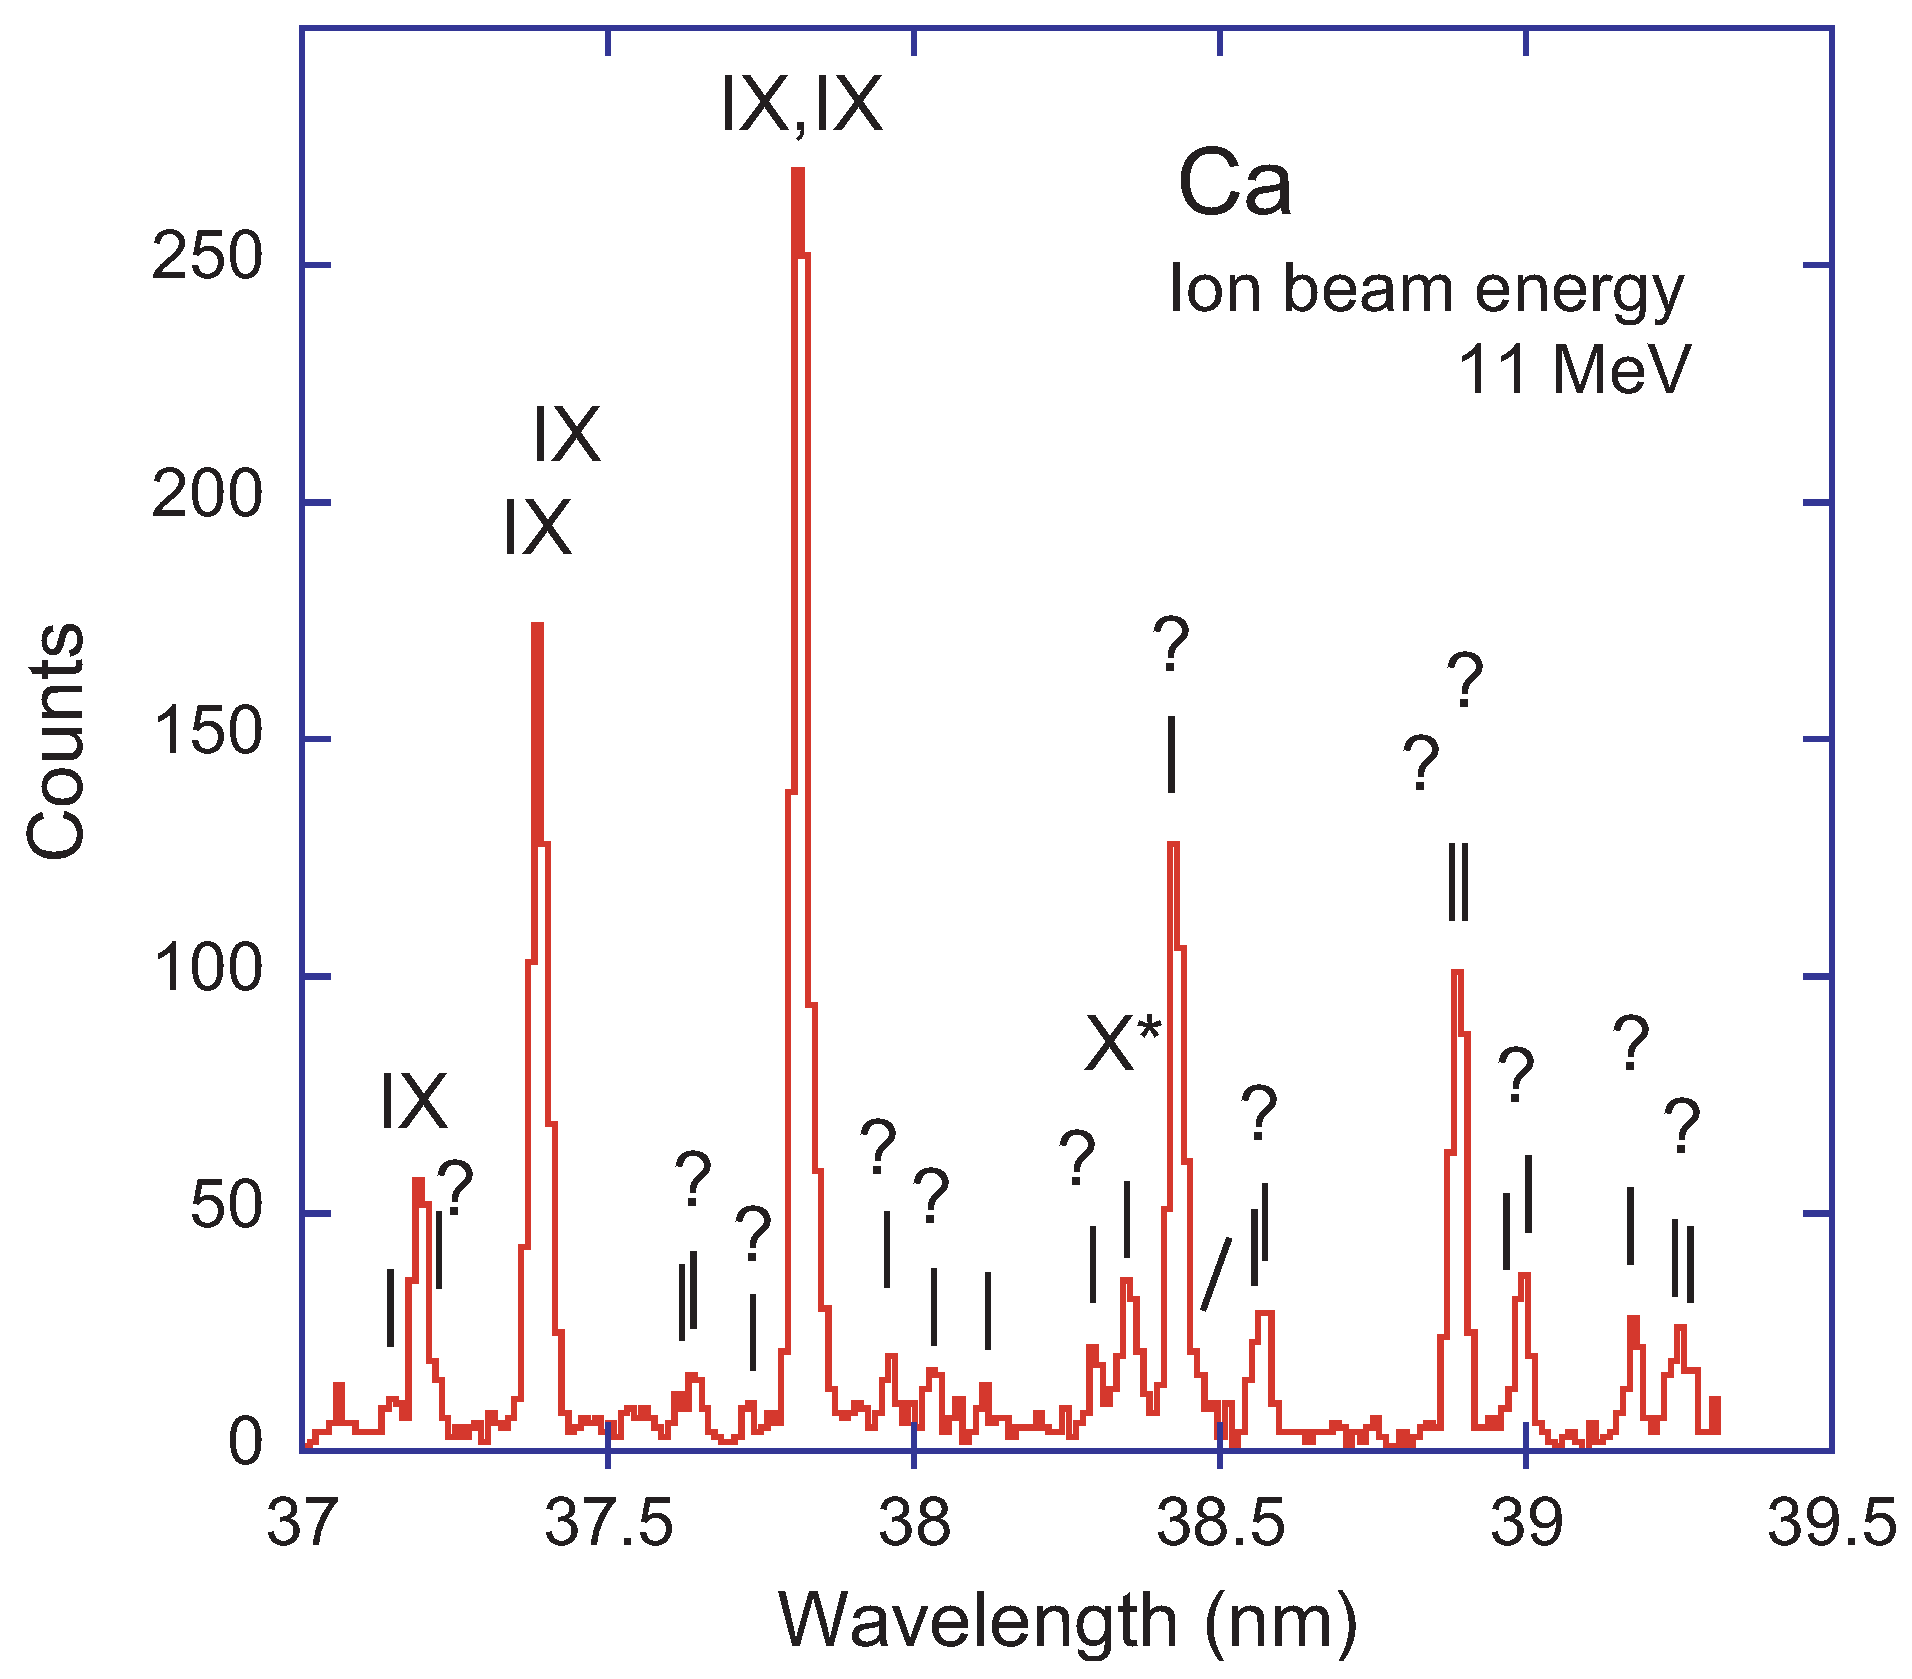
Signal statistics and spectral resolution contribute to the discernibility of weak spectral features. The channeltron detector had a dark rate of 1 to 2 counts per minute. Thus the typical background in the spectra shown amounts to about 1 count per channel. Rather weak features of the proper line width (typically about 3 channels FWHM) can be discriminated from the background. Figure 5 shows the beam-foil spectrum of Ca near the most prominent line of the doubly excited spectrum Ca X* [50,51]. There are several lines that are almost as narrow as single transitions should appear, but nevertheless they are known [1] to represent blends of Ca IX lines. Fiducial markers indicate a multitude of unidentified Ca lines, most of them of low signal and thus difficult to judge for the presence of line blends. Even so, they make up the numerical majority of spectral features in this sample. Further measurements at higher resolving power together with accurate theoretical computations would be necessary to classify many of the presently unidentified spectral features.
3.2. Lifetime Measurements
Beam-foil spectroscopy has unique capabilities for lifetime measurements (whereas, with few exceptions, the spectroscopy of stationary light sources has reached a higher resolving power). Therefore the earlier study of Ca [3] mostly addressed level lifetimes. Na-like ions with their single valence electron outside a closed-shell core are considered well calculable [52]. The Ca X lifetime values in this experiment turned out longer than the prediction (lower decay rate), if still within the scatter expected of any such data. A colleague proposed corrections to theory instead [53], suggesting to cancel the one or other decay channel so that one might find out after which of these closures lifetime “prediction" and measurement might match. However, quantum mechanics does not permit such arbitrary selection rules.
On the other hand, in the same experiment several Ca IX lifetime results turned out shorter than predicted. In the most interesting of these cases in such a Mg-like ion, relativity opens (via multiplet mixing) an intercombination decay channel for the 3p D level to the 3s3p P level, which had been overlooked in several computations (see [3]). The beam-foil study added another significant data point to this isoelectronic sequence. The interested reader is advised that [3] contains a repeated typo: the 3p D level was mistakenly replaced by the 3s3d D label in several locations.
4. Beam-foil Data on Potassium
The ion beam current with KO out of the ion source and K delivered by the accelerator was about a factor of 30 lower than achieved with “easy” elements of the iron group. An earlier experiment addressed mostly n = 3 and n = 4 levels of the F-like spectrum of K (K XI) and presented sections of the beam-foil spectrum [54]. The experimental parameters have been discussed there and correspond to the parameters for Ca mentioned above.
4.1. Survey Spectrum of Potassium, 37 to 75 nm
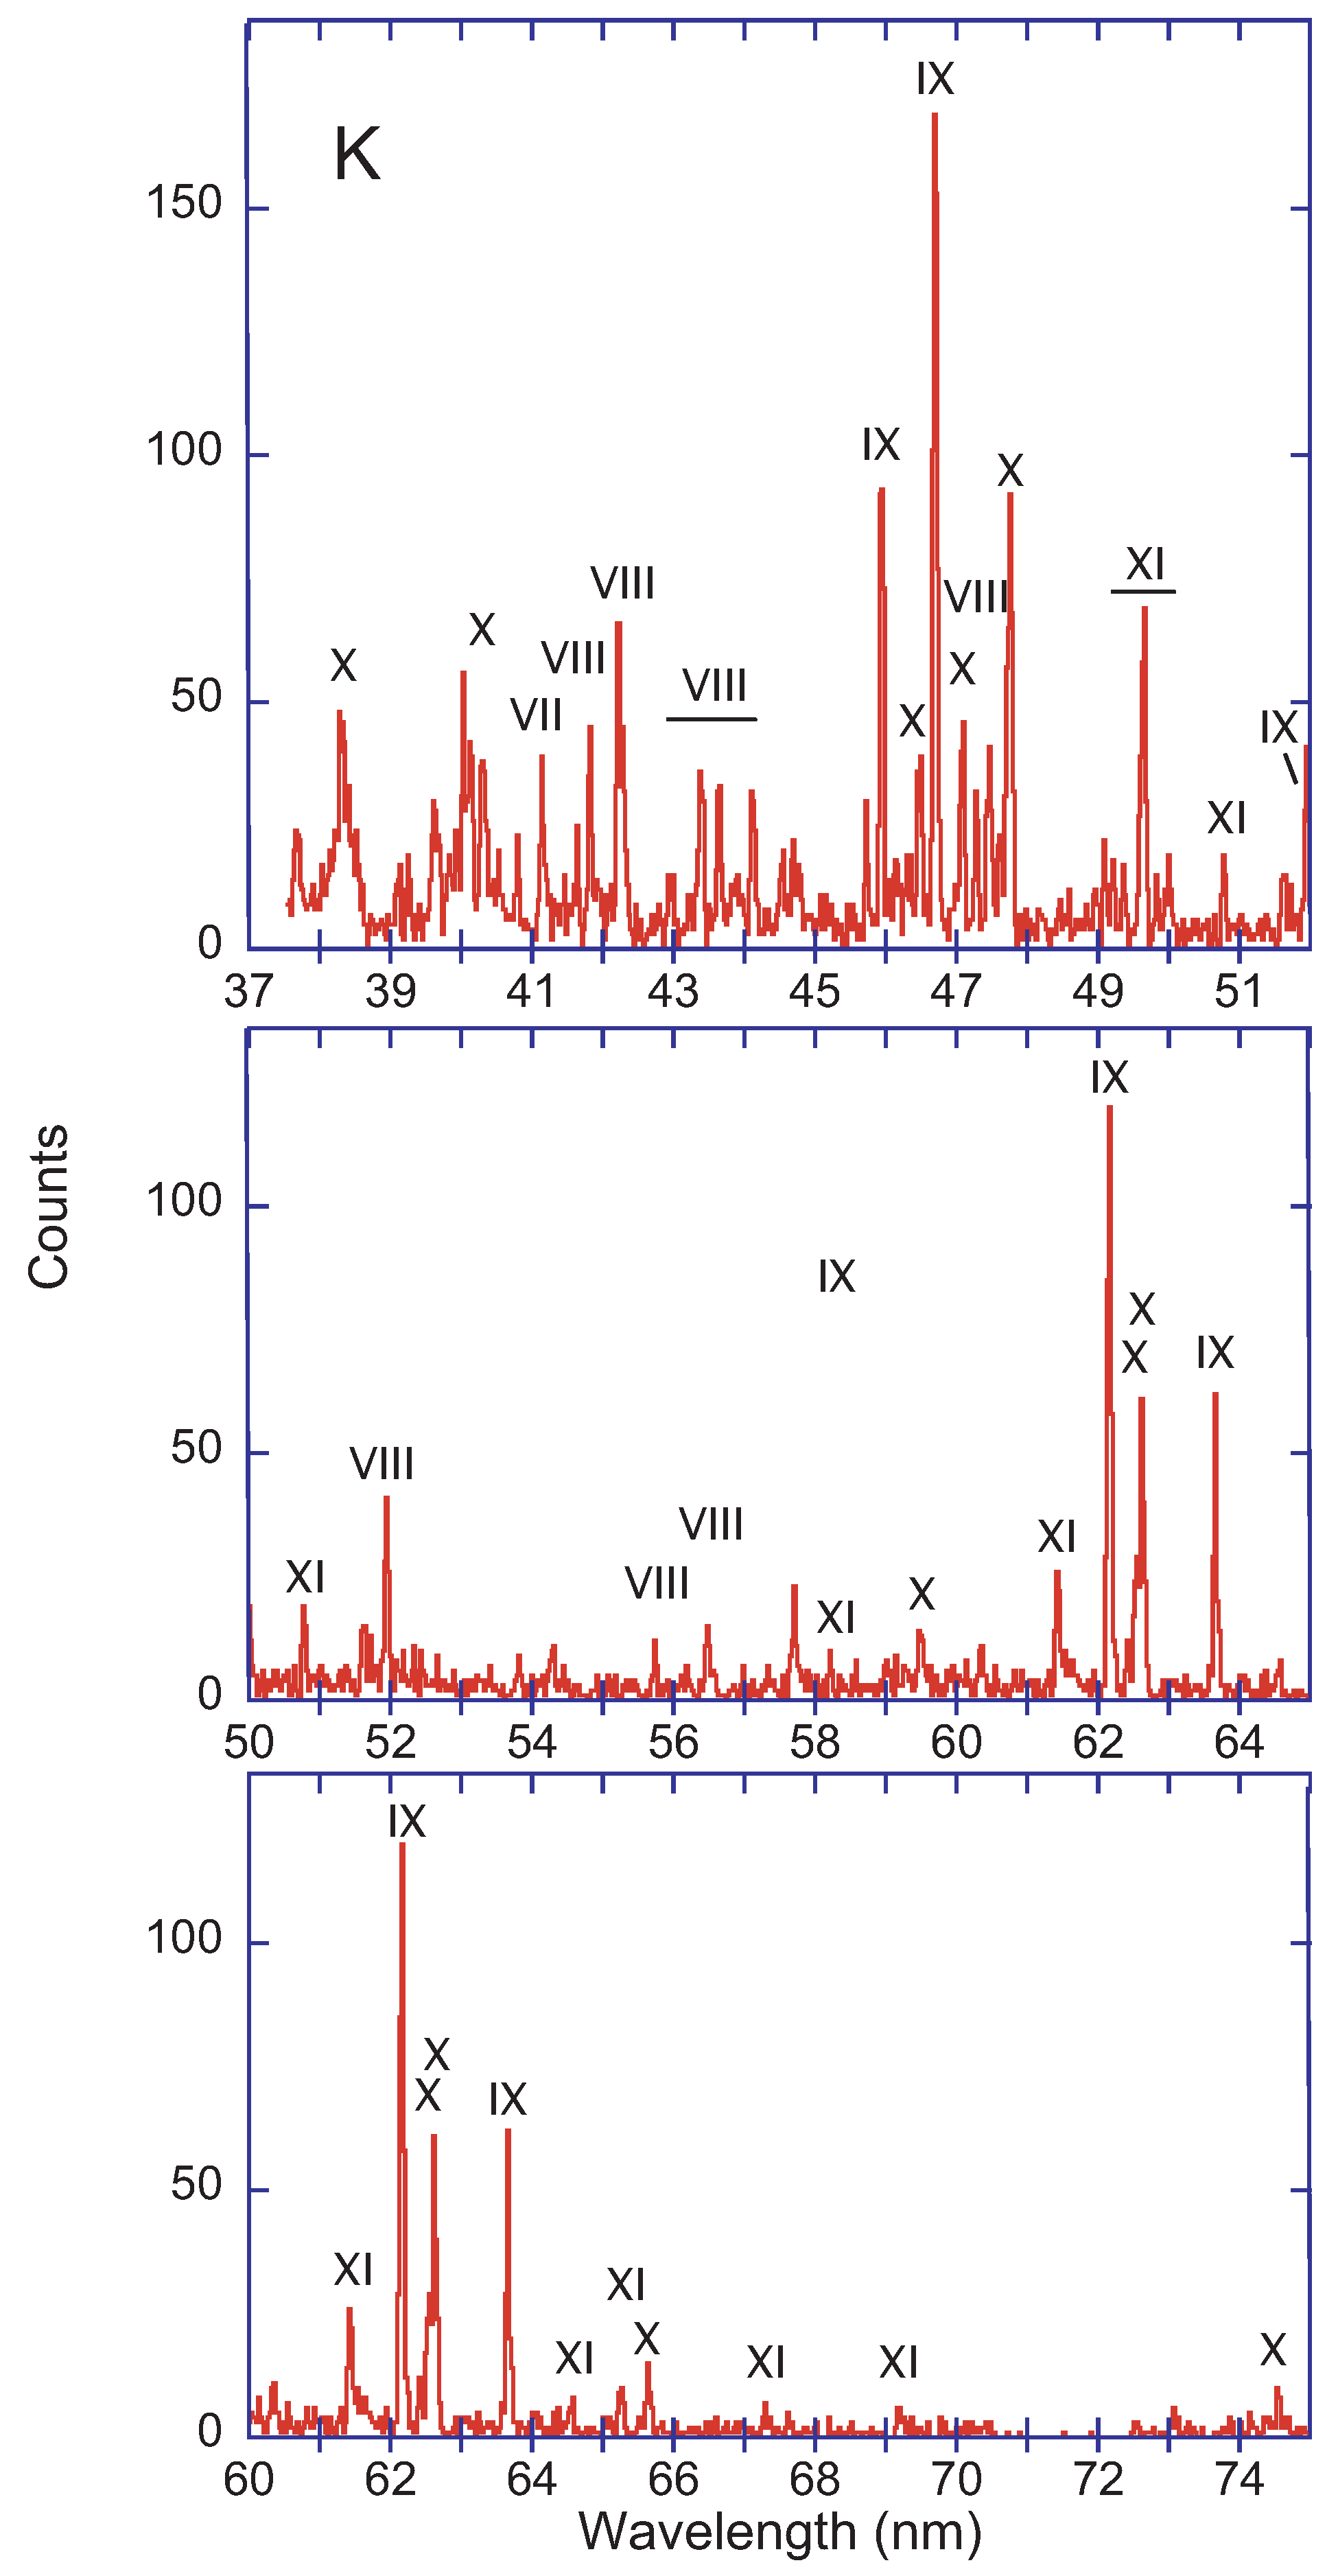
Figure 6 shows a display of the beam-foil EUV spectrum of K that is longer compared to the earlier study [54], which emphasized specific details in K XI. The motivation for presenting a more complete display is the multitude of easily observed K lines, of which the strongest lines in the wavelength range 37 to 75 nm are well known and labelled by the spectrum number in Figure 6. The charge state distribution [28,29,30] at an ion beam energy of 12.8 MeV lets us expect prominent lines of K VIII to K XII. Because of the atomic structure, the highest of these charge states (spectrum K XII) is actually not expected to show up in this wavelength range. K VII and lower charge state spectra have many lines in this wavelength range, but the associated ion charge states are too low in the production cross section to contribute visibly (with perhaps the exception of one K VII line near 41.1 nm). There are many more lines listed in the data bases [1,5,6] that are not all identifiable in this beam-foil spectrum. Several K XI lines have been identified [54] with the aid of semi-empirically adjusted Hartree-Fock Relativistic (HFR) computations. The HFR code is a derivative of the Cowan code [55]. The Cowan code employed is of limited accuracy as a predictive tool, but various parameters can be adjusted to match experimental data. In this way the computational accuracy can be improved incrementally while maintaining a consistent view of the whole atomic system. Finally, several lines in the spectrum, many in only partly resolved groups, cannot yet be identified from the literature. Examples lie near 37.65, 38.0–38.5, 39.65, 40–41, 44.5–44.75, 46.1–46.3, 47.3–47.6, 51.6, 53.8–54.3, 57.3–58, 61.5–61.8, and 66.1 nm. Just short of 40.50 nm the 4f-5g transition array of Ca X is expected, short of 50.0 nm the 4f-5g transition array of Ca IX, and close to 61.62 nm the 5g-6h transition array of Ca XI. These transitions between levels of maximum angular momentum (known as yrast transitions in nuclear physics) are often prominent in beam-foil spectra, because the decays of many high-n, high-ℓ levels are funnelled through such transitions. Another few weak lines appear in the wavelength range 67–75 nm where the spectrometer efficiency is rather low [43,44]. The line group at 74.5 nm is likely the K X (Ne-like) 5g-6h transition array. At 50.0 nm the K IX (Na-like) 4f-5g transition array is expected, and a line just short of that wavelength is clearly seen.
Figure 7 shows a detail of the range covered in Figure 6, but at an ion beam energy of 5 MeV. In contrast to Figure 6, where the wavelength interval of 48 to 49 nm almost appears as a gap in the spectrum, at this lower ion beam energy a line multiplet of K VII dominates, and a K X line appears with low intensity. The K VII 3s3p P–3s3p P multiplet has four components, with expected relative intensities of 10, 20, 40, and 20 [17], in the sequence of increasing wavelength. The spectrometer efficiency curve is practically flat over this interval [43,44], and the observation closely matches the predicted line ratios. The uncertainty of the line ratios in this measurement is dominated by counting statistics; the amplitude of the weak component is determined to within about 8%, and that of the strong component to within about 4%. In this case, the line identifications and the line ratios in the multiplet are consistent.
As the example of the tokamak experiment shows, this consistency check is a helpful way to detect shortcomings in a spectrum analysis. I have encountered attempts at classification that were based solely on the agreement of measured and computed wavelengths. When using theoretical data, it is imperative to check whether for an assumed classification all components of a given line multiplet are compatible with the observed spectrum. It is important to be cognizant of the applicability and accuracy limits that theoretical methods still do have, to avoid misusing their predictions.
4.2. Potassium Spectrum 10 to 21 nm
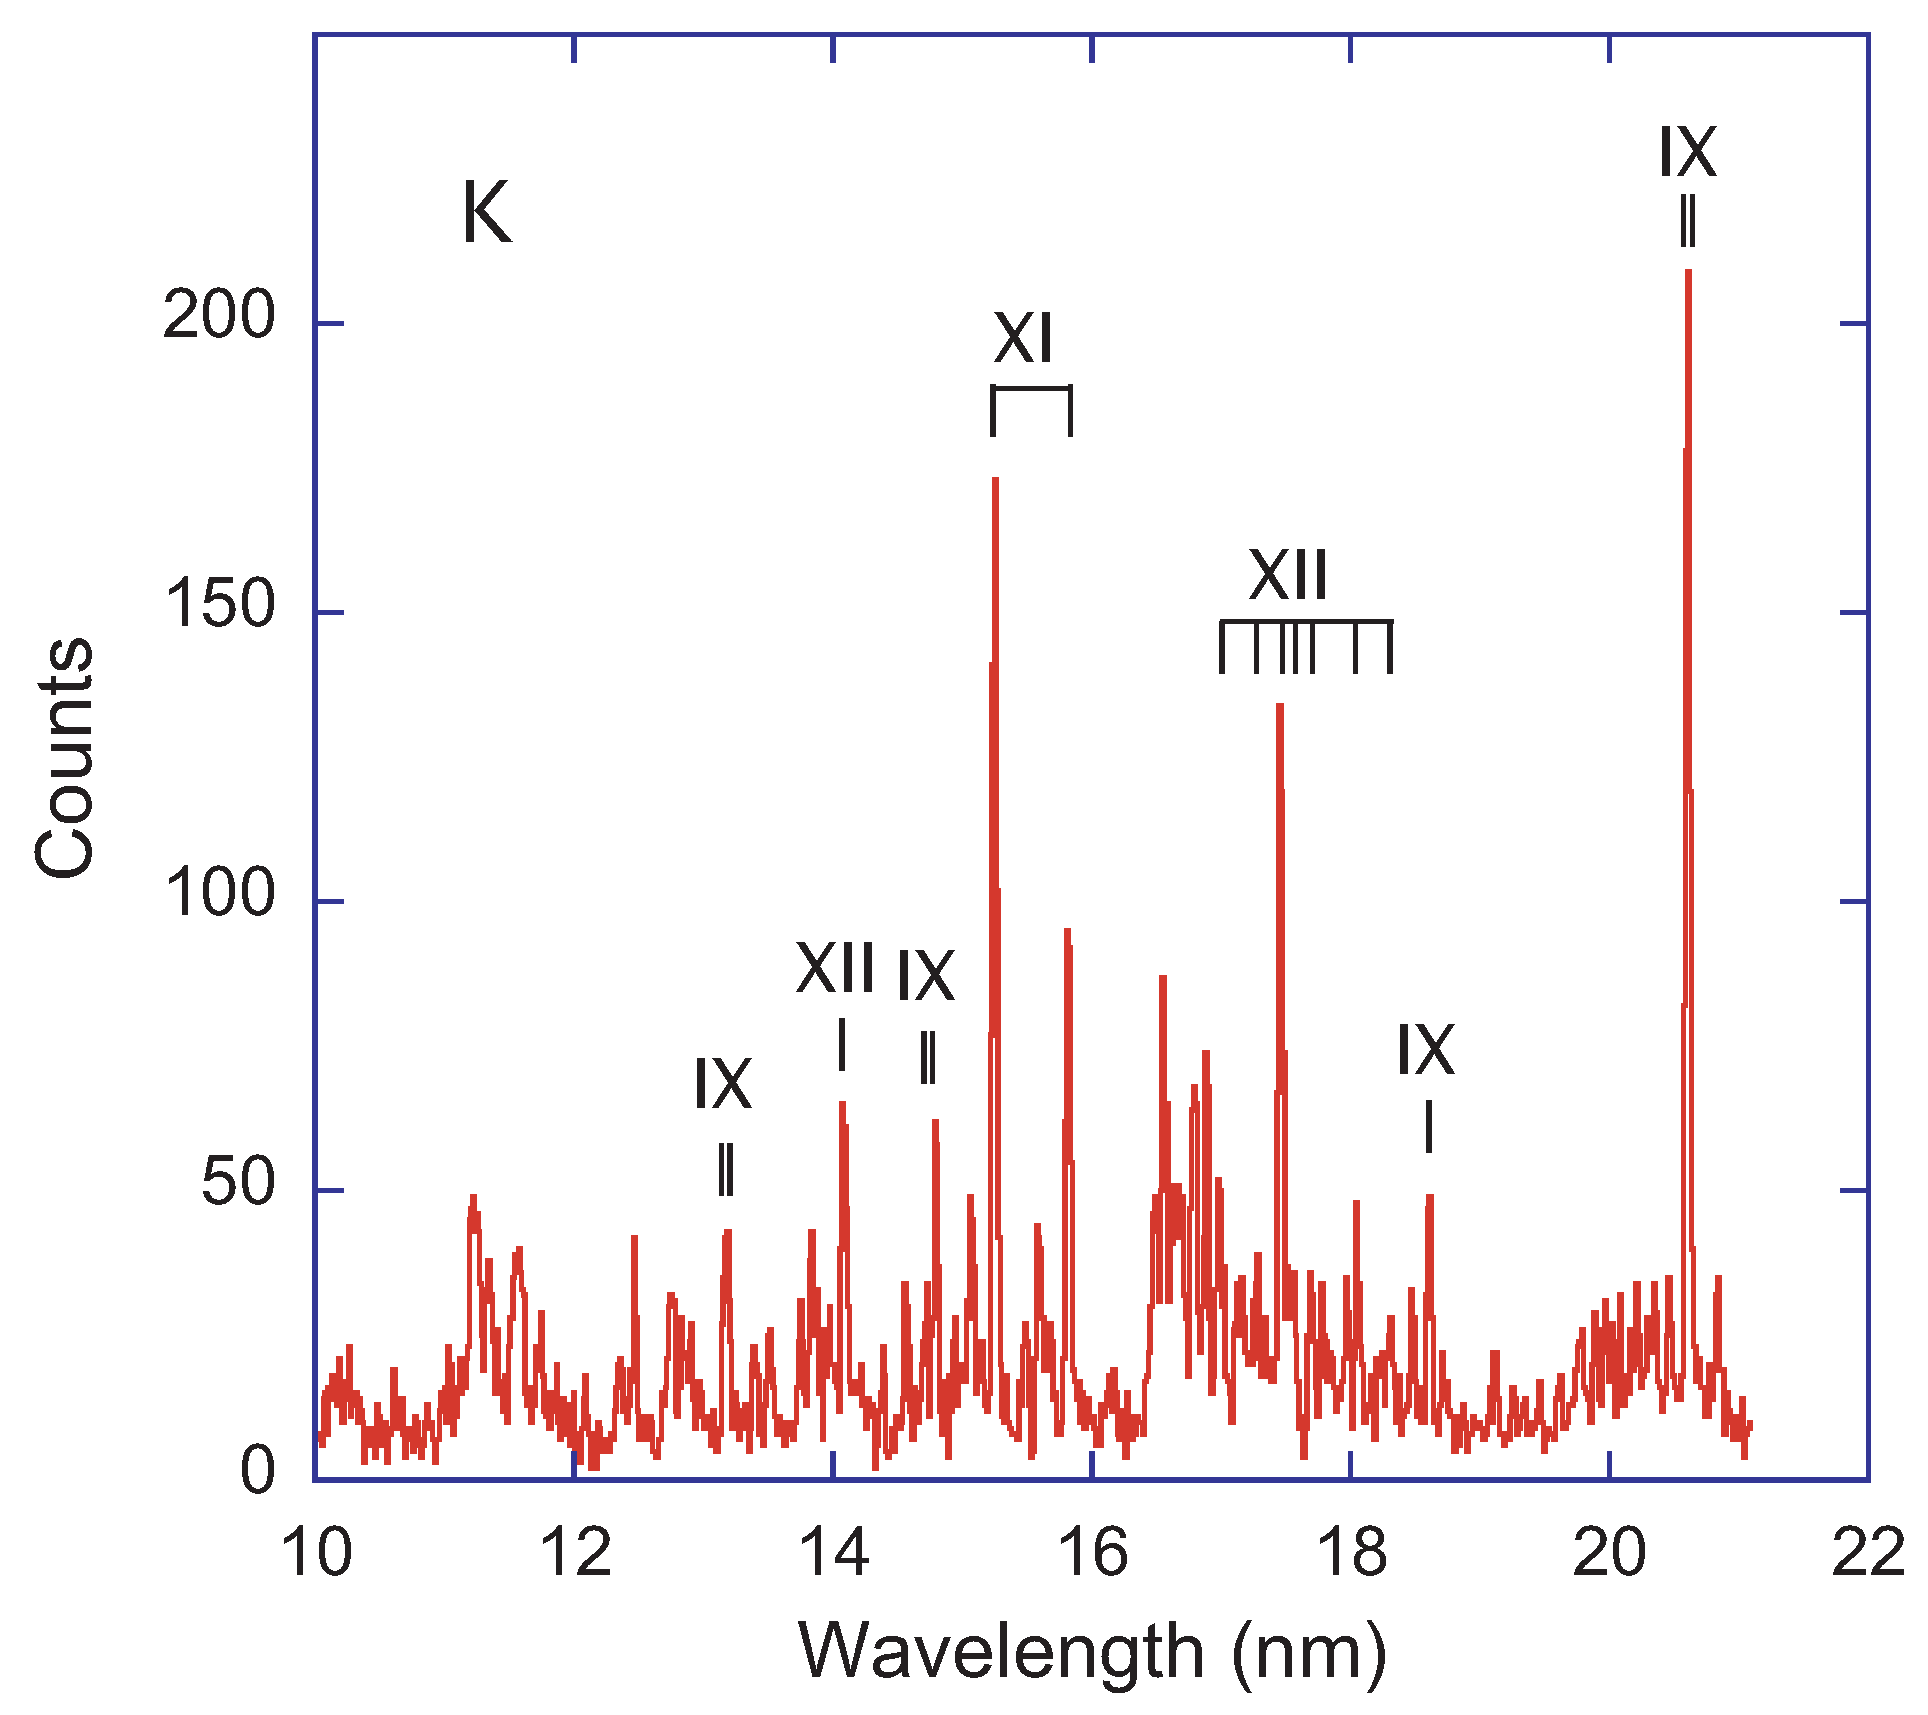
It has been noted above that the NIST ASD online database holds many more entries on EUV lines of K than of Ca. One of the wavelength ranges in which the number of entries differs is the range below 20 nm. Figure 8 shows a beam-foil spectrum of K in the wavelength range from 10 to 21 nm. The ion beam energy of 12.8 MeV is expected to maximize the spectrum signal for K X (Ne-like), and to provide a high yield of K IX (Na-like) and K XI (F-like). The spectrum shows a multitude of weak lines the investigation of which would profit from better signal statistics. Also warranted are more wavelength references throughout the wavelength interval. This is a notorious problem in beam-foil spectroscopy where only a single element is present in the spectra. In this spectrum, four features can be identified unambiguously and used as initial wavelength anchors. They are the K XI 2s2p P–2s2p S transitions at 15.2462 and 15.8126 nm [1], respectively, the lower levels of which have been studied in detail by Edlén [56,57,58], the K XII 2s2p P–2s2p P transition at = 17.4412 nm, and the K IX 2p3d–2p4f transition array at 20.58 nm. Near the 17.4412 nm–line (by far the strongest component of the multiplet) other components of the same transition multiplet can be recognized from the NIST ASD tables. Also, the K IX 3d-5f and 3d-6f lines of the NIST ASD tables find counterparts among the weaker lines below 15 nm. These lines could serve as further reference lines, if the spectral resolution was slightly better. Several (unmarked) lines in the wavelength interval 13.5 to 13.94 nm arise from K XI [54]. (This publication gives references to early work on this spectrum.) The NIST ASD tables list a fair number of lines as belonging to K X, but without further identification. The present beam-foil spectrum at least corroborates their identification with potassium.
4.3. Branching Ratio Measurement
In the F-like spectrum K XI there is a displaced n = 2 level worth studying, the upper level of the line doublet 2s2p P–2s2p S in the middle of Figure 8. This multiplet connects the two lowest terms in the level scheme of K XI, and the excitation requires the lowest energy of any electric dipole transition in this ion. The line doublet therefore can serve as an indicator that in a light source this ionization stage has been reached. For this reason, CHIANTI [12] lists these two lines, although K otherwise is of little interest in solar spectroscopy. However, the lines are not listed in the Kelly tables [6], whereas many other K lines are. (The corresponding lines of Ca XII are not listed in the NIST ASD tables.) Recent computations have treated these levels and transitions along the isoelectronic sequence [48,59].
Given the atomic structure situation and the small 2s2p P fine structure interval in comparison to the 2s-2p term difference, the branching ratio of the two decays of the same upper level ought to reflect the ratio of the statistical weights of the lower levels, that is a factor of two. Since the individual transition rates depend on the third power of the transition energy, the actual line ratio is expected as 2.23 in K XI (2.19 in Ar X and 2.28 in Ca XII, respectively). The spectrum in Figure 8 yields a value of 2.3 ± 0.3, which includes a 20% correction for the detection efficiency of the spectrometer used [44]. The uncertainty of the result is dominated by that of the steepness of the efficiency curve. Across the spectrum in Figure 8, the detection efficiency increases with wavelength by about a factor of 4 to 5. The observed value of the line ratio agrees with expectation.
It may be interesting to check the same ratio for the neighbouring elements Ar and Ca. Ar is not available at a tandem ion accelerator (no negative Ar ions to start from), and the Bochum Ca beam-foil spectra had a starting point at somewhat longer wavelengths. However, the aforementioned measurement at a tokamak plasma [16] included, both, Ar and Ca in the appropriate charge states. The observations at the tokamak resulted in signal ratios of 6.22 for Ar and of 3.5 for Ca, instead of the simple estimates mentioned above. Obviously, in either case the signal must have had additional contributions to the stronger line that spoiled the straightforward interpretation of the signal ratio as a line ratio or branching ratio. Indeed, this conclusion has been drawn in that paper [16], but it is not clear which blending partners contributed how much. The blending seemed to matter less in Ca than in Ar, but spectroscopy on its own is often insufficient to disentangle a close blend. Theory and collisional-radiative spectral modelling may help to clarify a difficult measurement situation. However, the tokamak plasma contained further elements besides the wanted Ar and Ca (and some F), which would cause additional problems in spectral modelling. Moreover, in this case the wavelengths CHIANTI holds for the two Ar X lines are incorrect by 0.5%, a rare occurrence. “Incorrect” in this case does not mean a chance disagreement with some other measurement, but a deviation from Edlén’s systematic study of many ions along the isoelectronic sequence [57], a cornerstone among wavelength references. Moreover, an electron beam ion trap study with very high spectral resolution [60] has corroborated Edlén’s Ar X wavelengths that are also used in the NIST ASD tables. Another detail concerns transition rates and line ratios. In F-like ions from Ar X to Fe XVIII, the line ratio obtained from the ratio of the transition wavelengths (decay of a common upper level) progresses regularly along the isoelectronic sequence. In contrast, the ratio of transition rates given in the NIST ASD tables or CHIANTI progresses irregularly, with deviations between less than 1% to about 10% between the predictions and in comparison to the above estimate. A spectrometer with a flat efficiency curve in the range from 7 to 20 nm should be suitable to yield such line ratios for all elements of the iron group.
The line ratio result for K XI is compatible with the estimate based on the wavelength ratio and with more detailed computations within the 15% experimental error estimate. A similar agreement has been found for Cl-like ions of iron group elements [61], which feature n = 3 electrons instead of the n = 2 electrons in the F-like ions, between measurement and several computations. For the Cl-like ions it was also feasible to do beam-foil lifetime measurements, and there the computations scattered by about a factor of two, indicating that the absolute values of the transition rates are not as well predicted as their ratio. For F-like ions, two recent calculations provide lifetimes of the 2s2p S level. Jönsson et al. [48] apply RCI computations and find good agreement of the results obtained in Babushkin and Coulomb gauges, respectively. Aggarwal [59] presents lifetime results of MCHF computations that are very close to those reported by Jönsson et al., and lifetime results obtained by using the GRASP code that (for K XI to V XV) are shorter by about 10%. Unfortunately, no lifetime measurement has been reported for K XI.
5. Discussion
It is useful to study spectra of a given element or atomic system in a variety of light sources. I have mentioned the non-confirmation of “Ca" spectra recorded at an EBIT near wavelengths of = 13 nm [21] by a tokamak experiment [16]. Some of the wavelengths of lines of highly charged Ca ions, which after solar observations were assumed to be known and thus listed in the CHIANTI data base, were not found in that same tokamak experiment [16]. The EUV spectrum of the tokamak plasma (with wavelengths from 10 to 25 nm) was dominated by Ar and Ca, but contained several strong lines from contaminants as well. A corresponding spectrum from a foil-excited ion beam might have shown the Ca lines exclusively. Such an element-pure spectrum is available at longer wavelengths, up to 60 nm. In this range many, mostly weak, lines remain unidentified, since the databases on Ca lines are rather sparse. The present spectra should be useful in the analysis of data from other light sources, because the beam-foil light source is uni-elemental. A similarly mono-isotopic spectrum of K has been presented that can serve for systematic cross checks with the Ca spectra. Moreover, it has been demonstrated how clean line ratio measurements can be in the absence of interference from lines of other elements. An archive search for corresponding data of heavier elements is underway.
Funding
This research received no external funding.
Conflicts of Interest
The author declares no conflict of interest.
References
- Kramida, A.; Ralchenko, Y.; Reader, J.; NIST ASD Team. NIST Atomic Spectra Database (Version 5.7.1); National Institute of Standards and Technology: Gaithersburg, MD, USA, 2019. Available online: https://physics.nist.gov/asd (accessed on 21 June 2020).
- Jönsson, P.; Gaigalas, G.; Rynkun, P.; Radžiūtė, L.; Ekman, J.; Gustafsson, S.; Hartman, H.; Wang, K.; Godefroid, M.; Froese Fischer, C.; et al. Multiconfiguration Dirac-Hartree-Fock Calculations with Spectroscopic Accuracy: Applications to Astrophysics. Atoms 2017, 5, 16. [Google Scholar] [CrossRef]
- Träbert, E.; Pinnington, E.H.; Kernahan, J.A.; Doerfert, J.; Granzow, J.; Heckmann, P.H.; Hutton, R. Beam-foil study of the lifetimes of n = 3 levels in Na-like Ca X, Mg-like Ca IX and Si-like Ca VII. J. Phys. B Atomic Mol. Opt. Phys. 1996, 29, 2647–2659. [Google Scholar] [CrossRef]
- Ishikawa, Y.; López-Encarnación, J.M.; Träbert, E. N = 3–3 transitions of Ne-like ions in the iron group, especially Ca10+ and Ti12+. Phys. Scr. 2009, 79, 025301. [Google Scholar] [CrossRef]
- Kelly, R.L.; Palumbo, L.J. Atomic and Ionic Emission Lines below 2000 Å: Hydrogen through Krypton; Naval Research Lab.: Washington, DC, USA, 1978. [Google Scholar]
- Kelly, R.L. Atomic and Ionic Spectrum Lines below 2000 Angstroms: Hydrogen through Krypton; American Institute of Physics: New York, NY, USA, 1987. [Google Scholar]
- Fawcett, B.C. Wavelengths and classifications of emission lines due to 2s22pn-2s2pn+1 and 2s2pn-2pn+1 transitions, Z ≤ 28. At. Data Nucl. Data Tab. 1975, 16, 135–164. [Google Scholar] [CrossRef]
- Dere, K.P.; Landi, E.; Mason, H.E.; Monsignori Fossi, B.C.; Young, P.R. CHIANTI—An atomic database for emission lines. Astrophys. J. 1997, 125, 149–173. [Google Scholar] [CrossRef] [Green Version]
- Dere, K.P.; Landi, E.; Young, P.R.; Del Zanna, G.; Landini, M.; Mason, H.E. CHIANTI—An atomic database for emission lines. Astron. Astrophys. 2009, 498, 915–929. [Google Scholar] [CrossRef]
- Landi, E.; Del Zanna, G.; Young, P.R.; Dere, K.P.; Mason, H.E. CHIANTI—An atomic database for emission lines. XII. Version 7 of the database. Astrophys. J. Supp. 2012, 744, 99. [Google Scholar] [CrossRef] [Green Version]
- Landi, E.; Young, P.R.; Dere, K.P.; Del Zanna, G.; Mason, H.E. CHIANTI—An atomic database for emission lines. XIII. Soft X-ray improvements and other changes. Astrophys. J. Supp. 2013, 763, 86. [Google Scholar] [CrossRef]
- Del Zanna, G.; Dere, K.P.; Young, P.R.; Landi, E.; Mason, H.E. CHIANTI—An atomic database for emission lines. Version 8. Astron. Astrophys. 2015, 582, 56. [Google Scholar] [CrossRef]
- Del Zanna, G.; Young, P.R. Atomic data for plasma spectroscopy: The CHIANTI database, improvements and challenges. Atoms 2020, 8, 46. [Google Scholar] [CrossRef]
- Malinovsky, M.; Heroux, L. An analysis of the solar extreme-ultraviolet between 50 and 300 Å. Astrophys. J. 1973, 181, 1009–1030. [Google Scholar] [CrossRef]
- Keenan, F.P.; Aggarwal, K.M.; Berrington, K.A. XUV diagnostic line ratios for carbon-like Ca XV and a comparison with tokamak plasma observations. Phys. Scr. 1992, 45, 336–339. [Google Scholar] [CrossRef]
- Träbert, E.; Beiersdorfer, P.; Lepson, J.K.; Reinke, M.L.; Rice, J.E. EUV spectra and line ratios of multiply ionized calcium and argon atoms in a laboratory plasma. Astrophys. J. 2018, 865, 148. [Google Scholar] [CrossRef]
- White, H.E.; Eliason, A.Y. Relative intensity tables for spectrum lines. Phys. Rev. 1933, 44, 753–756. [Google Scholar] [CrossRef]
- Levine, M.A.; Marrs, R.E.; Henderson, J.R.; Knapp, D.A.; Schneider, M.B. The electron beam ion trap: A new instrument for atomic physics measurements. Phys. Scr. 1988, 22, 157–163. [Google Scholar] [CrossRef]
- Levine, M.A.; Marrs, R.E.; Bardsley, J.N.; Beiersdorfer, P.; Bennett, C.L.; Chen, M.H.; Cowan, T.; Dietrich, D.; Henderson, J.R.; Knapp, D.A.; et al. The use of an electron beam ion trap in the study of highly charged ions. Nucl. Instrum. Meth. Phys. Res. 1989, 43, 431–440. [Google Scholar] [CrossRef]
- Beiersdorfer, P. A “brief” history of spectroscopy on EBIT. Can. J. Phys. 2008, 86, 1–10. [Google Scholar] [CrossRef]
- Träbert, E.; Beiersdorfer, P.; Brickhouse, N.S.; Golub, L. High-resolution laboratory spectra on the λ131 channel of the AIA instrument on board the Solar Dynamics Observatory. Astrophys. J. Suppl. 2014, 211, 14. [Google Scholar] [CrossRef] [Green Version]
- Kay, L. A van de Graaff beam as a source of atomic emission spectra. Phys. Lett. 1963, 5, 36–37. [Google Scholar] [CrossRef]
- Bashkin, S.; Meinel, A.B. Laboratory Excitation of the Emission Spectrum of a Nova. Astrophys. J. 1964, 139, 413–415. [Google Scholar] [CrossRef]
- Träbert, E. Accelerator-Based Atomic Physics Techniques and Applications; Shafroth, S.M., Austin, J.C., Eds.; American Institute of Physics: Washington, DC, USA, 1997; p. 567. [Google Scholar]
- Träbert, E. Beam-foil spectroscopy—Quo vadis? Phys. Scr. 2008, 78, 038103. [Google Scholar] [CrossRef]
- Dmitriev, I.S.; Nikolaev, V.S. Semi-empirical method for the calculation of the equilibrium distribution of charges in a fast-ion beam. Soviet Phys. JETP 1965, 20, 409–415, Submitted to J. Exptl. Theoret. Phys. (USSR) 1964, 47, 615–623. [Google Scholar]
- Nikolaev, V.S.; Dmitriev, I.S. On the equilibrium charge distribution in heavy element ion beams. Phys. Lett. 1968, 28A, 277–278. [Google Scholar] [CrossRef]
- Sayer, R.O. Semi-empirical formulas for heavy-ion stripping data. Rev. Phys. Appl. 1977, 12, 1543–1546. [Google Scholar] [CrossRef] [Green Version]
- Delaunay, B. Heavy-ion stripping. Nucl. Instrum. Meth. 1977, 146, 101–113. [Google Scholar] [CrossRef]
- Shima, K.; Kuno, N.; Yamanouchi, M.; Tawara, H. Equilibrium charge fractions of ions of Z = 4–92 emerging from a carbon foil. Atomic Data Nucl. Data Tables 1992, 51, 173–241. [Google Scholar] [CrossRef]
- Rozet, J.P.; Stéphan, C.; Vernhet, D. ETACHA: A program for calculating charge states at GANIL energies. Nucl. Instr. Meth. Phys. Res. B 1996, 107, 67–70. [Google Scholar] [CrossRef]
- Nandi, T.; Marketos, P.; Joshi, P.; Singh, R.P.; Safvan, C.P.; Verma, P.; Mandal, A.; Roy, A.; Bhowmik, R.K. Lifetime of 1s2s2p 4 in V20+ using beam-foil techniques. Phys. Rev. A 2002, 66, 052510. [Google Scholar] [CrossRef]
- Ahmad, N.; Karn, R.K.; Marketos, P.; Nandi, T. Peculiar time dependence of unexpected lines in delayed beam-foil X-ray spectra of V, Fe and Ni. Nucl. Instrum. Meth. Phys. Res. B 2005, 233, 191–195. [Google Scholar] [CrossRef]
- Nandi, T. Effect of satellites on the 2 3 level lifetime in He-like ions. Nucl. Instrum. Meth. Phys. Res. B 2005, 233, 244–249. [Google Scholar] [CrossRef]
- Nandi, T.; Ahmad, N.; Wani, A.A. Lifetime for Li-like Ti 1s2s2p 4Po level using a mode of beam—Two-foil experiments. Phys. Rev. A 2005, 72, 022711. [Google Scholar] [CrossRef]
- Gould, H.; Marrus, R.; Schmieder, R.W. Lifetime of the 2 3S1 state of heliumlike argon (Z = 18) and heliumlike titanium (Z = 22). Phys. Rev. Lett. 1973, 31, 504–507. [Google Scholar] [CrossRef]
- Gould, H.; Marrus, R.; Mohr, P.J. Radiative decay of the 2 3S1 and 2 3P2 states of heliumlike vanadium (Z = 23) and iron (Z = 26). Phys. Rev. Lett. 1974, 33, 676–680. [Google Scholar] [CrossRef]
- Buchet, J.P.; Buchet-Poulizac, M.C.; Denis, A.; Désesquelles, J.; Druetta, M.; Grandin, J.P.; Husson, X. Wavelength measurement of the 1s2s 3S1–1s2p 3P2 transition in heliumlike Fe24+. Phys. Rev. A 1981, 23, 3354–3356. [Google Scholar] [CrossRef]
- Buchet, J.P.; Buchet-Poulizac, M.C.; Denis, A.; Désesquelles, J.; Druetta, M.; Grandin, J.P.; Huet, M.; Husson, X.; Lecler, D. Radiative lifetimes and oscillator strengths for 2s-2p transitions in He-, Li-, and Be-like iron. Phys. Rev. A 1984, 30, 309–315. [Google Scholar] [CrossRef]
- Träbert, E.; Armour, I.A.; Bashkin, S.B.; Jelley, N.A.; O’Brien, R.; Silver, J.D. The X-ray spectra of H-like, He-like and Li-like silicon ions after foil excitation. J. Phys. B Atomic Mol. Phys. 1979, 12, 1665–1676. [Google Scholar] [CrossRef]
- Middleton, R. A Negative-Ion Cookbook; Department of Physics, University of Pennsylvania: Philadelphia, PA, USA, 1990. [Google Scholar]
- Brand, K. Performance of the reflected beam sputter source. Rev. Phys. Appl. 1977, 12, 1453–1457. [Google Scholar] [CrossRef]
- Träbert, E.; Heckmann, P.H.; Raith, B.; Sander, U. Beam-foil based efficiency calibration of a grazing-incidence spectrometer. Phys. Scr. 1980, 22, 363–366. [Google Scholar] [CrossRef]
- Träbert, E. Extended relative efficiency calibration of a grazing incidence monochromator and applications in fast-beam spectroscopy. Phys. Scr. 1984, T8, 112–116. [Google Scholar] [CrossRef]
- Träbert, E.; Beiersdorfer, P.; Hell, N.; Brown, G.V. Measurement of the 3s1/2-3p3/2 resonance line of sodiumlike Eu52+. Phys. Rev. A 2015, 92, 022509. [Google Scholar] [CrossRef] [Green Version]
- Santana, J.A.; Träbert, E. Resonance and intercombination lines in Mg-like ions of atomic numbers Z = 13–92. Phys. Rev. A 2015, 91, 022503. [Google Scholar] [CrossRef] [Green Version]
- Jönsson, P.; Bengtsson, P.; Ekman, J.; Gustafsson, S.; Karlsson, L.B.; Gaigalas, G.; Froese Fischer, C.; Kato, D.; Murakami, I.; Sakaue, H.A.; et al. Relativistic CI calculations of spectroscopic data for the 2p6 and 2p53l configurations in Ne-like ions between Mg III and Kr XXVII. Atomic Data Nucl. Data Tables 2012, 100, 1–154. [Google Scholar] [CrossRef]
- Jönsson, P.; Alkauskas, A.; Gaigalas, G. Energies and E1, M1, E2 transition rates for states of the 2s22p5 and 2s2p6 configurations in fluorine-like ions between Si VI and W LXVI. Atomic Data Nucl. Data Tables 2013, 99, 431–446. [Google Scholar] [CrossRef]
- Jönsson, P.; Radžiūtė, L.; Gaigalas, G.; Godefroid, M.; Marques, J.P.; Brage, T.; Froese Fischer, C.; Grant, I. Accurate multiconfiguration calculations of energy levels, lifetimes, and transition rates for the silicon isoelectronic sequence Ti IX – Ge XIX, Sr XXV, Zr XXVII, Mo XXIX. Astron. Astrophys. 2016, 585, A26. [Google Scholar] [CrossRef] [Green Version]
- Jupén, C.; Engström, L.; Hutton, R.; Reistad, N.; Westerlind, M. Analysis of core-excited n = 3 configurations in S VI, Cl VII, Ar VIII and Ti XII. Phys. Scr. 1990, 42, 44–50. [Google Scholar] [CrossRef]
- Träbert, E. The allure of high total angular momentum levels in multiply-excited ions. Atoms 2019, 7, 103. [Google Scholar] [CrossRef] [Green Version]
- Hutton, R.; Engström, L.; Träbert, E. Observation of a discrepancy between experimentally determined atomic lifetimes and relativistic predictions for highly ionized members of the Na I isoelectronic sequence. Phys. Rev. Lett. 1988, 60, 2469–2472. [Google Scholar] [CrossRef]
- Gupta, G.P.; Msezane, A.Z. Calculated energy levels and lifetimes in Ca X. J. Phys. B Atomic Mol. Opt. Phys. 2006, 39, 4977–4984. [Google Scholar] [CrossRef]
- Jupén, C.; Träbert, E. The 2p43s, 3p and 3d configurations in K XI. J. Phys. B Atomic Mol. Opt. Phys. 2001, 34, 3053–3061. [Google Scholar] [CrossRef]
- Kramida, A. Cowan code: 50 years of growing impact on atomic physics. Atoms 2019, 7, 64. [Google Scholar] [CrossRef] [Green Version]
- Edlén, B. A critical compilation of energy levels in the configurations 2sm2pk (m = 2,1,0) of F I-, O I- and Be I-like spectra. Phys. Scr. 1981, 22, 593–602. [Google Scholar] [CrossRef]
- Edlén, B. Accurate values of the energy intervals in the configurations 2s22s22pk (k = 1–5). Phys. Scr. 1982, 26, 71–83. [Google Scholar] [CrossRef]
- Edlén, B. Comparison of theoretical and experimental level values of the n = 2 complex in ions isoelectronic with Li, Be, O and F. Phys. Scr. 1983, 28, 51–67. [Google Scholar] [CrossRef]
- Aggarwal, K.M. Radiative rates for E1, E2, M1, and M2 transitions in F-like ions with 12 ≤ Z ≤ 23. Atomic Data Nucl. Data Tables 2019, 127–128, 22–130. [Google Scholar] [CrossRef] [Green Version]
- Beiersdorfer, P.; Träbert, E. High-resolution laboratory measurements of coronal lines near the Fe IX line at 171 Å. Astrophys. J. 2018, 854, 114. [Google Scholar] [CrossRef]
- Träbert, E. Experimental checks on calculations for Cl-, S- and P-like ions of the iron group elements. J. Phys. B Atomic Mol. Opt. Phys. 1996, 29, L217–L224. [Google Scholar] [CrossRef]
Publisher’s Note: MDPI stays neutral with regard to jurisdictional claims in published maps and institutional affiliations. |
Figure 1.
Ionization potentials of various Ca ions ([5] and others). The much higher values for one- and two-electron ions have been truncated.
Figure 1.
Ionization potentials of various Ca ions ([5] and others). The much higher values for one- and two-electron ions have been truncated.

Figure 2.
Ca beam-foil spectra obtained at ion beam energies of 8 and 11 MeV, respectively. In order to avoid visual clutter, the spectrum numbers are indicated only for some prominent lines and line groups. Line width 0.06 nm.
Figure 2.
Ca beam-foil spectra obtained at ion beam energies of 8 and 11 MeV, respectively. In order to avoid visual clutter, the spectrum numbers are indicated only for some prominent lines and line groups. Line width 0.06 nm.

Figure 3.
Ca beam-foil spectra obtained at ion beam energies of 5 and 8 MeV, respectively. Line width 0.06 nm.
Figure 3.
Ca beam-foil spectra obtained at ion beam energies of 5 and 8 MeV, respectively. Line width 0.06 nm.

Figure 4.
Ca beam-foil spectrum near the 3s-3p resonance transitions of Ca X. Line width 0.05 nm.

Figure 5.
Spectrum of Ca near the most prominent line of the doubly excited spectrum Ca X*. Fiducial markers indicate a multitude of unidentified Ca lines. Line width 0.03 nm.
Figure 5.
Spectrum of Ca near the most prominent line of the doubly excited spectrum Ca X*. Fiducial markers indicate a multitude of unidentified Ca lines. Line width 0.03 nm.

Figure 6.
Spectrum of K at an ion beam energy of 12.8 MeV. Line width 0.06 nm. Identified spectral features are marked by the spectrum number.
Figure 6.
Spectrum of K at an ion beam energy of 12.8 MeV. Line width 0.06 nm. Identified spectral features are marked by the spectrum number.

Figure 7.
Detail spectrum of K at an ion beam energy of 5 MeV. Line width 0.045 nm. Identified spectral features are marked by the spectrum number. The K VII transition array marked is discussed in the text.
Figure 7.
Detail spectrum of K at an ion beam energy of 5 MeV. Line width 0.045 nm. Identified spectral features are marked by the spectrum number. The K VII transition array marked is discussed in the text.

Figure 8.
Spectrum of K at an ion beam energy of 12.8 MeV. Line width 0.035 nm. The most prominent lines are marked by the spectrum number. The detection efficiency rises from the left to the right of the figure by a factor of about four [44].
Figure 8.
Spectrum of K at an ion beam energy of 12.8 MeV. Line width 0.035 nm. The most prominent lines are marked by the spectrum number. The detection efficiency rises from the left to the right of the figure by a factor of about four [44].

© 2020 by the author. Licensee MDPI, Basel, Switzerland. This article is an open access article distributed under the terms and conditions of the Creative Commons Attribution (CC BY) license (http://creativecommons.org/licenses/by/4.0/).
Share and Cite
MDPI and ACS Style
Träbert, E. Calcium and Potassium Spectra in the EUV. Atoms 2020, 8, 73. https://0-doi-org.brum.beds.ac.uk/10.3390/atoms8040073
AMA Style
Träbert E. Calcium and Potassium Spectra in the EUV. Atoms. 2020; 8(4):73. https://0-doi-org.brum.beds.ac.uk/10.3390/atoms8040073
Chicago/Turabian StyleTräbert, Elmar. 2020. "Calcium and Potassium Spectra in the EUV" Atoms 8, no. 4: 73. https://0-doi-org.brum.beds.ac.uk/10.3390/atoms8040073
Note that from the first issue of 2016, this journal uses article numbers instead of page numbers. See further details here.