Article

Glucagon Prevents Cytotoxicity Induced by Methylglyoxal in a Rat Neuronal Cell Line Model

Department of Internal Medicine, Division of Diabetes, Aichi Medical University School of Medicine, Nagakute 480-1195, Japan
*
Author to whom correspondence should be addressed.
Submission received: 16 December 2020 / Revised: 11 February 2021 / Accepted: 12 February 2021 / Published: 15 February 2021
(This article belongs to the Special Issue Pancreatic Islets of Langerhans: Not Only Beta-Cells)

Abstract

:
Although diabetic polyneuropathy (DPN) is a frequent diabetic complication, no effective therapeutic approach has been established. Glucagon is a crucial hormone for glucose homeostasis but has pleiotropic effects, including neuroprotective effects in the central nervous system. However, the importance of glucagon in the peripheral nervous system (PNS) has not been clarified. Here, we hypothesized that glucagon might have a neuroprotective function in the PNS. The immortalized rat dorsal root ganglion (DRG) neuronal cell line 50B11 was treated with methylglyoxal (MG) to mimic an in vitro DPN model. The cells were cultured with or without glucagon or MG. Neurotoxicity, survival, apoptosis, neurite projection, cyclic adenosine monophosphate (cAMP), and protein kinase A (PKA) were examined. Glucagon had no cytotoxicity and rescued the cells from neurotoxicity. Cell survival was increased by glucagon. The ratio of apoptotic cells, which was increased by MG, was reduced by glucagon. Neurite outgrowth was accelerated in glucagon-treated cells. Cyclic AMP and PKA accumulated in the cells after glucagon stimulation. In conclusion, glucagon protected the DRG neuronal cells from MG-induced cellular stress. The cAMP/PKA pathway may have significant roles in those protective effects of glucagon. Glucagon may be a potential target for the treatment of DPN.

1. Introduction

Diabetic polyneuropathy (DPN) is a chronic diabetic complication. DPN causes diabetic feet, including foot infections, ulcers, and limb amputations. Intensive blood glucose control has been proven to prevent the development of DPN in type 1 diabetes [1,2]. Additionally, etiology-oriented therapeutic approaches to DPN have been proposed and used in limited countries: an aldose reductase inhibitor epalrestat in Japan and India [3] and alpha-lipoic acid and benfotiamine in Germany [4,5]. However, no approach has yet achieved sufficient efficacies in DPN.
Glucagon is a 29 amino acid peptide secreted from alpha cells in the pancreas and is responsible for glucose homeostasis by glucose efflux from the liver [6]. Other than gluconeogenesis, glucagon has pleiotropic effects: cardioprotection [7,8] and reduction of obesity [9]. Regarding the nervous systems, it has been reported that in post-traumatic brain injury, glucagon produced a significant neuroprotective effect [10]. Recently, Li et al. reported that a triagonist of glucagon-like peptide-1(GLP-1)/gastric inhibitory polypeptide/glucagon receptors produced neurotrophic and neuroprotective action by reducing cell cytotoxicity and glutamate excitotoxicity by elevating cyclic adenosine monophosphate (cAMP) levels in human neuroblastoma cell-line SH-SY5Y [11]. However, no previous study has reported the neuroprotective effect of glucagon in the peripheral nervous system. We previously reported that deficiency of glucagon gene-derived peptides, including GLP-1 and glucagon, caused peripheral neuropathy in mice [12]. Additionally, we have revealed that GLP-1 receptor agonists showed neuroprotective effects in an in vitro model of oxidative insult and an in vivo model of DPN [13,14]. Here, we investigated the neuroprotective effects of glucagon on the dorsal root ganglion (DRG) neuronal cells.
To investigate the effects of glucagon at the cellular level, we utilized cellular stress induced by methylglyoxal (MG). Several factors are suggested to be responsible for DPN, including aldose reductase activation [15,16], deposition of advanced glycation end-products (AGEs) [17], oxidative stress [18,19,20,21], increased release of inflammatory mediators [22,23], and lack of neurotrophic factors [24,25,26]. MG is a significant source of intracellular AGEs and causes cytotoxicity [27], apoptosis [28], mitochondrial reactive oxygen species (ROS) production [29,30], and reduction of cellular viability [31]. It was reported by Beatrice et al. that MG (250–750 μM) reduced cellular viability, transient accumulation of intracellular [Ca2+]i, and neurite outgrowth in mouse DRG neurons [32]. Under normal physiological conditions, MG is formed as a byproduct of glycolysis, which is usually detoxified by various systems, mainly the glyoxalase system. However, in hyperglycemic conditions such as diabetes, the formation of MG has been found to be accelerated [29,33]. Plasma MG concentration is elevated in patients with poorly controlled type 2 diabetes compared to those of healthy persons [34,35]. Accumulating evidence has suggested that a high MG level is the key factor for developing DPN [36]. A study showed that in streptozotocin-induced diabetic mice, a high level of MG in the sciatic nerve has been found [37]. Patients with DPN showed a reduction in glyoxalase activity when compared to patients with diabetes [38]. It was reported that MG-derived AGEs such as hydroimidazolones of MG were associated with the progression of DPN with type 1 diabetes [39]. Hence, we hypothesized that MG could become a key regulator to reproduce DPN conditions in vitro. Therefore, in this study, we have used the immortalized DRG neuronal cells treated by MG to assume the effect of glucagon on the peripheral nervous system in patients with diabetes.

2. Materials and Methods

Until declaration, all reagents and materials were purchased from Thermo Fisher Scientific (Waltham, MA, USA).

2.1. Cell Culture

The DRG neuronal cell line (50B11) was established and kindly provided by Dr. A. Höke (Johns Hopkins University, Baltimore, MD, USA) [40]. The cells were maintained at 37 °C under 5% carbon dioxide in the maintaining media (MM) consisting of Neurobasal™ medium supplemented with 10% fetal bovine serum (FBS), 2 mmol/L L-glutamine, and B-27 supplementTM. For each experiment, cells were cultured in the treatment medium (TM) consisting of Dulbecco’s Modified Eagle Medium (DMEM) (Cat: 11965-092, 40 mmol/L glucose) supplemented with 5% FBS. In TM, the cells were treated with or without glucagon (1 or 100 pmol/L) or forskolin, an activator of adenylate cyclase, (10 or 25 μmol/L). Cellular stress was produced by MG (0.1 or 0.5 mmol/L). The stock solution of 1 mM glucagon was made by resolving glucagon in 0.1 N HCl. For the control condition in each experiment, the same amount of 0.1 N HCl without glucagon was supplemented.

2.2. Cytotoxicity Measurement

Cells were seeded into 96-well plates at a density of 1 × 10⁴ cells/well in 100μL of TM and incubated for 24 h. After 6 h of treatments with glucagon or forskolin in the presence or absence of MG, cytotoxicity was measured using a lactate dehydrogenase (LDH) assay (Cytotoxicity LDH Assay Kit-WST, Dojindo Laboratories, Mashiki, Japan) according to the manufacturer’s instructions. Optical density (OD) was measured by determining the absorbance at 490 nm using a microplate reader (SpectraMax M5, Molecular Devices, Sunnyvale, CA, USA). The lysis buffer served by the manufacturer revealed maximum LDH release, which was used as high control. Low control was a condition without any treatment. Cytotoxicity was calculated by the following formula: cytotoxicity (%) = (sample OD − low control OD)/(high control OD − low control OD) × 100. All OD values were used after subtraction of the background value from each OD value.

2.3. Cell Survival Assay

Cell survivalwas evaluated using a CellTiter96™ AQueous One Solution Cell Proliferation assay (Promega Corporation, Madison, WI, USA) which employed 3-(4,5-dimethylthiazol-2-yl)-5-(3-carboxymethoxyphenyl)-2-(4-sulfophenyl)-2H-tetrazolium (MTS) according to the manufacturer’s protocol. Cells were seeded into 96-well plates at a density of 1 × 10⁴ cells/well in 100 μL TM. After 24 h, the cells were treated with or without MG in the presence or absence of glucagon. After 6 h of treatment, cell survival was determined using absorbance at 490 nm, which was measured on a microplate reader (SpectraMax M5). The following formula measured survival: cell survival (%) = (sample OD/control OD) × 100. Each OD value was used after subtraction of the background value from each OD value.

2.4. Apoptosis Estimation

Cells were seeded in a 24-well plate at a density of 5 × 10⁴ cells/well in 500 μL TM. After 24 h of incubation, apoptosis was induced by 0.5 mmol/L of MG. The degree of apoptosis was measured by using an APOPercentageTM assay (Biocolor, Belfast, Northern Ireland, UK) according to the manufacturer’s instructions. The assay is a dye uptake assay, which stains only apoptotic cells with a purple dye. Apoptosis was assessed after 6 h of exposure to MG with or without glucagon. The cells were gently washed twice with 500 μL of phosphate-buffered saline (PBS) per well to remove the non-cell bound dye and fixed with 2% paraformaldehyde (PFA). To count the total number of cells, cells were counterstained with 4′,6-diamidino-2-phenylindole (DAPI). Photographs were taken by using a charge-coupled device (CCD) camera-equipped microscope (IX73, Olympus Corporation, Tokyo, Japan). The percentage of apoptosis was measured by the number of apoptotic cells divided by the total number of cells.

2.5. Mitochondrial ROS Measurement

Mitochondrial ROS was assessed using MitoSOXTM Red mitochondrial superoxide indicator [41]. Cells were seeded in a 24-well plate at a density of 3 × 10⁴ cells/well in TM. After 6 h of treatment with glucagon or 25 μmol/L forskolin in the presence or absence of MG, cells were washed with PBS. The cells were exposed to 5 μmol/L of MitoSOXTM Red for 10 min at 37 °C. After another washing with PBS, cells were counterstained with DAPI. The fluorescence signal was observed using an IX73 inverted microscope (Olympus Corporation).

2.6. Neurite Outgrowth

The cells were seeded in a 6-well plate at a density of 1 × 10⁵ cells/well in TM. Neurite outgrowth was checked after 24 h of treatment with glucagon or 25 µmol/L forskolin. The cells were fixed with 2% PFA for 10 min at 4 °C. After the fixation, photographs were taken using a CCD camera-equipped microscope (IX73, Olympus Corporation). The cells with neurite outgrowth were defined as the cells with neurite projection which is equal to or longer than the length of the cell body [42]. The percentage of cells with neurites was calculated by the number of cells with neurites divided by the total number of cells.

2.7. cAMP Measurement

Concentration of intracellular cAMP was measured using an enzyme immunoassay kit (Cayman Chemical, Ann Arbor, MI, USA) [43,44]. The cells were seeded in a 6-well plate at a density of 5 × 10⁵ cells/well in MM. After 24 h, the cells were treated with or without glucagon or 10 µmol/L of forskolin for 20 min. The cells were collected from the wells by scraping after 20 min of treatment with 0.1 mol/L hydrochloric acid on ice. The supernatant was collected after centrifugation and a cAMP assay was performed according to the manufacturer’s instructions.

2.8. Protein Kinase A (PKA) Activity Detection

To quantify the activity of cAMP-dependent PKA [45], a PKA Colorimetric Activity kit (Thermo Fisher Scientific, Waltham, MA, USA) was used. The cells were seeded in a 6-well plate at a density of 5 × 10⁵ cells/well in MM. After 24 h, the cells were treated with or without glucagon in the presence or absence of 10 µmol/L H89, PKA inhibitor [46], in MM. After 30 min, the cells were incubated with a cell lysis buffer supplied by the manufacturer for another 30 min on ice with occasional vortexing. After 10 min of centrifugation, the supernatant was collected and used to perform a PKA assay according to the manufacturer’s instructions.

2.9. Statistical Analysis

All data are presented as mean ± standard deviation (SD). All data was produced in at least three individual and separate experiments. Student’s t-test and one-way analysis of variance, followed by Bonferroni’s test, were performed using IBM SPSS statistics 20 (Armonk, NY, USA). A p-value of less than 0.05 was considered statistically significant.

3. Results

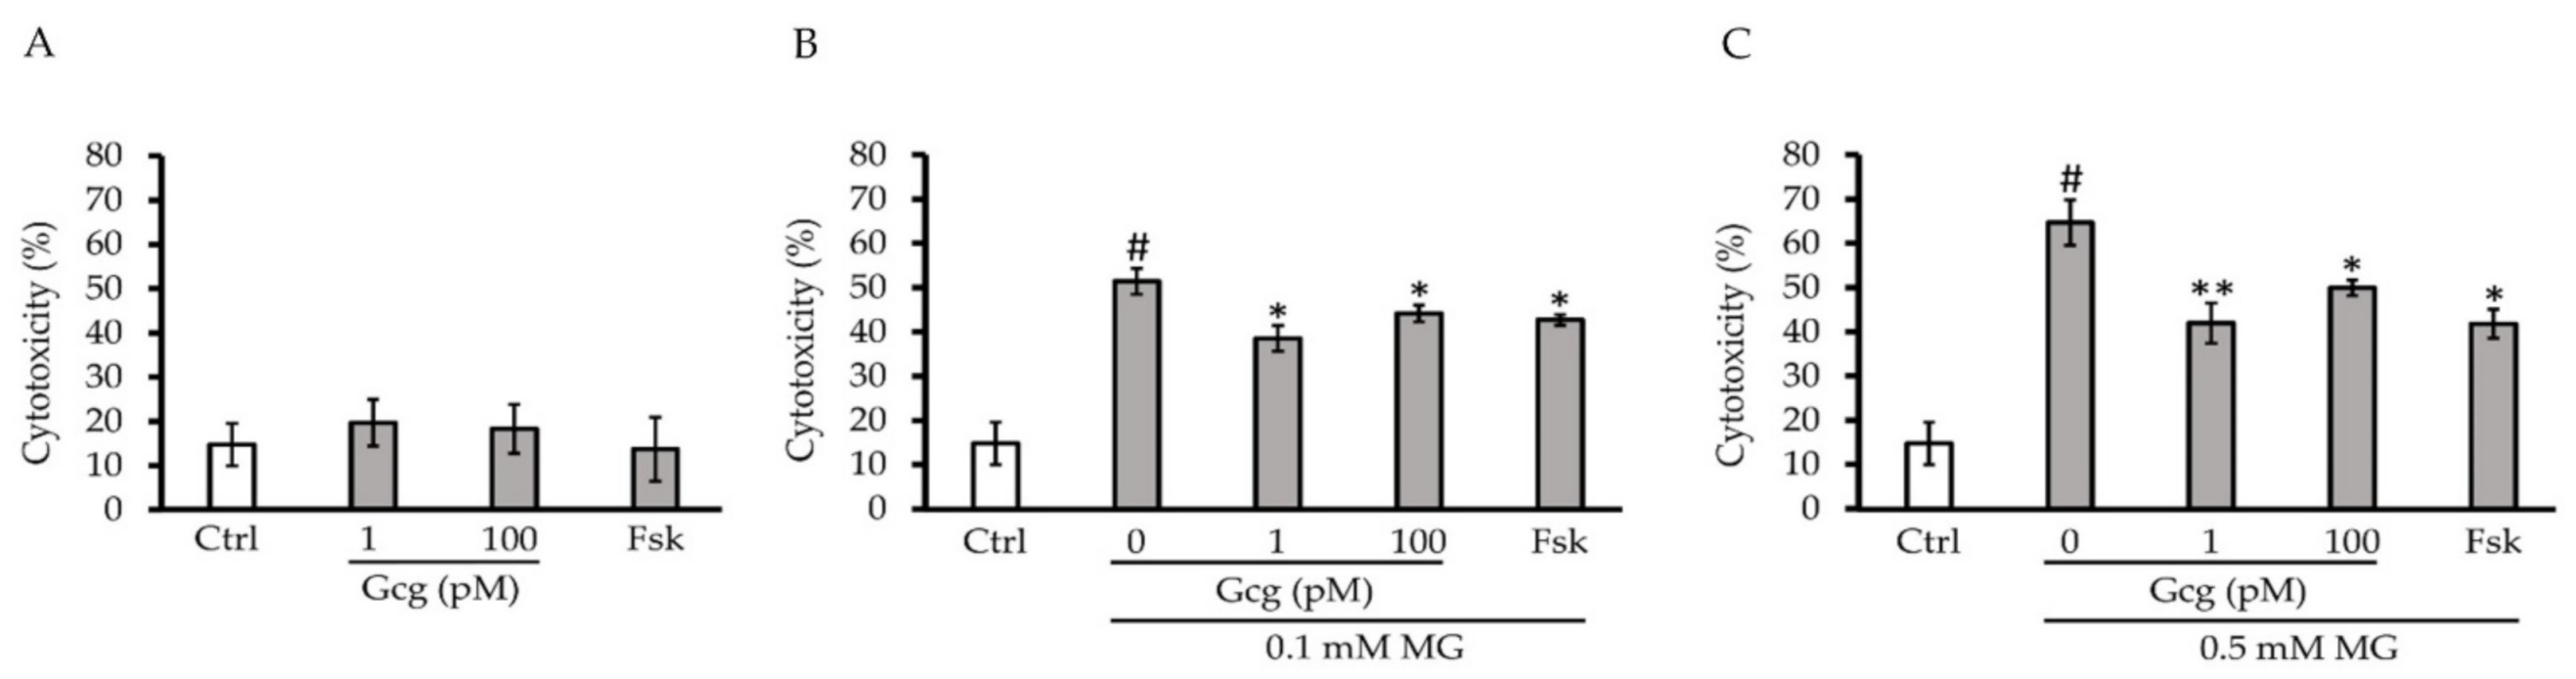
3.1. Glucagon Decreased Cytotoxicity Induced by MG

After 6 h of treatment, there was no cytotoxicity produced by glucagon or forskolin (control 14.8 ± 4.8%, 1 pmol/L glucagon 19.7 ± 5.3, p = 0.39 versus control, 100 pmol/L glucagon 18.3 ± 5.5, p = 0.53, 25 µmol/L forskolin 13.7 ± 7.3, p = 0.87; n = 3 in each group) (Figure 1A). Although 0.1 and 0.5 mmol/L of MG exhibited significant cytotoxicity in the cells, glucagon and forskolin significantly attenuated the cytotoxicity (0.1 mmol/L MG: control 51.5 ± 2.9%, p < 0.005 versus no treatment with MG or other agents, 1 pmol/L glucagon 38.5 ± 2.9, p < 0.05 versus control, 100 pmol/L glucagon 44.2 ± 1.9, p < 0.05, 25 µmol/L forskolin 42.7 ± 1.2, p < 0.05; 0.5 mmol/L MG: control 64.7 ± 5.2%, p < 0.001 versus no treatment with MG or other agents, 1 pmol/L glucagon 42.0 ± 4.6, p < 0.01 versus control, 100 pmol/L glucagon 50.0 ± 1.8, p < 0.05, 25 µmol/L forskolin 41.8 ± 3.3, p < 0.05; n = 3 in each group) (Figure 1B,C).

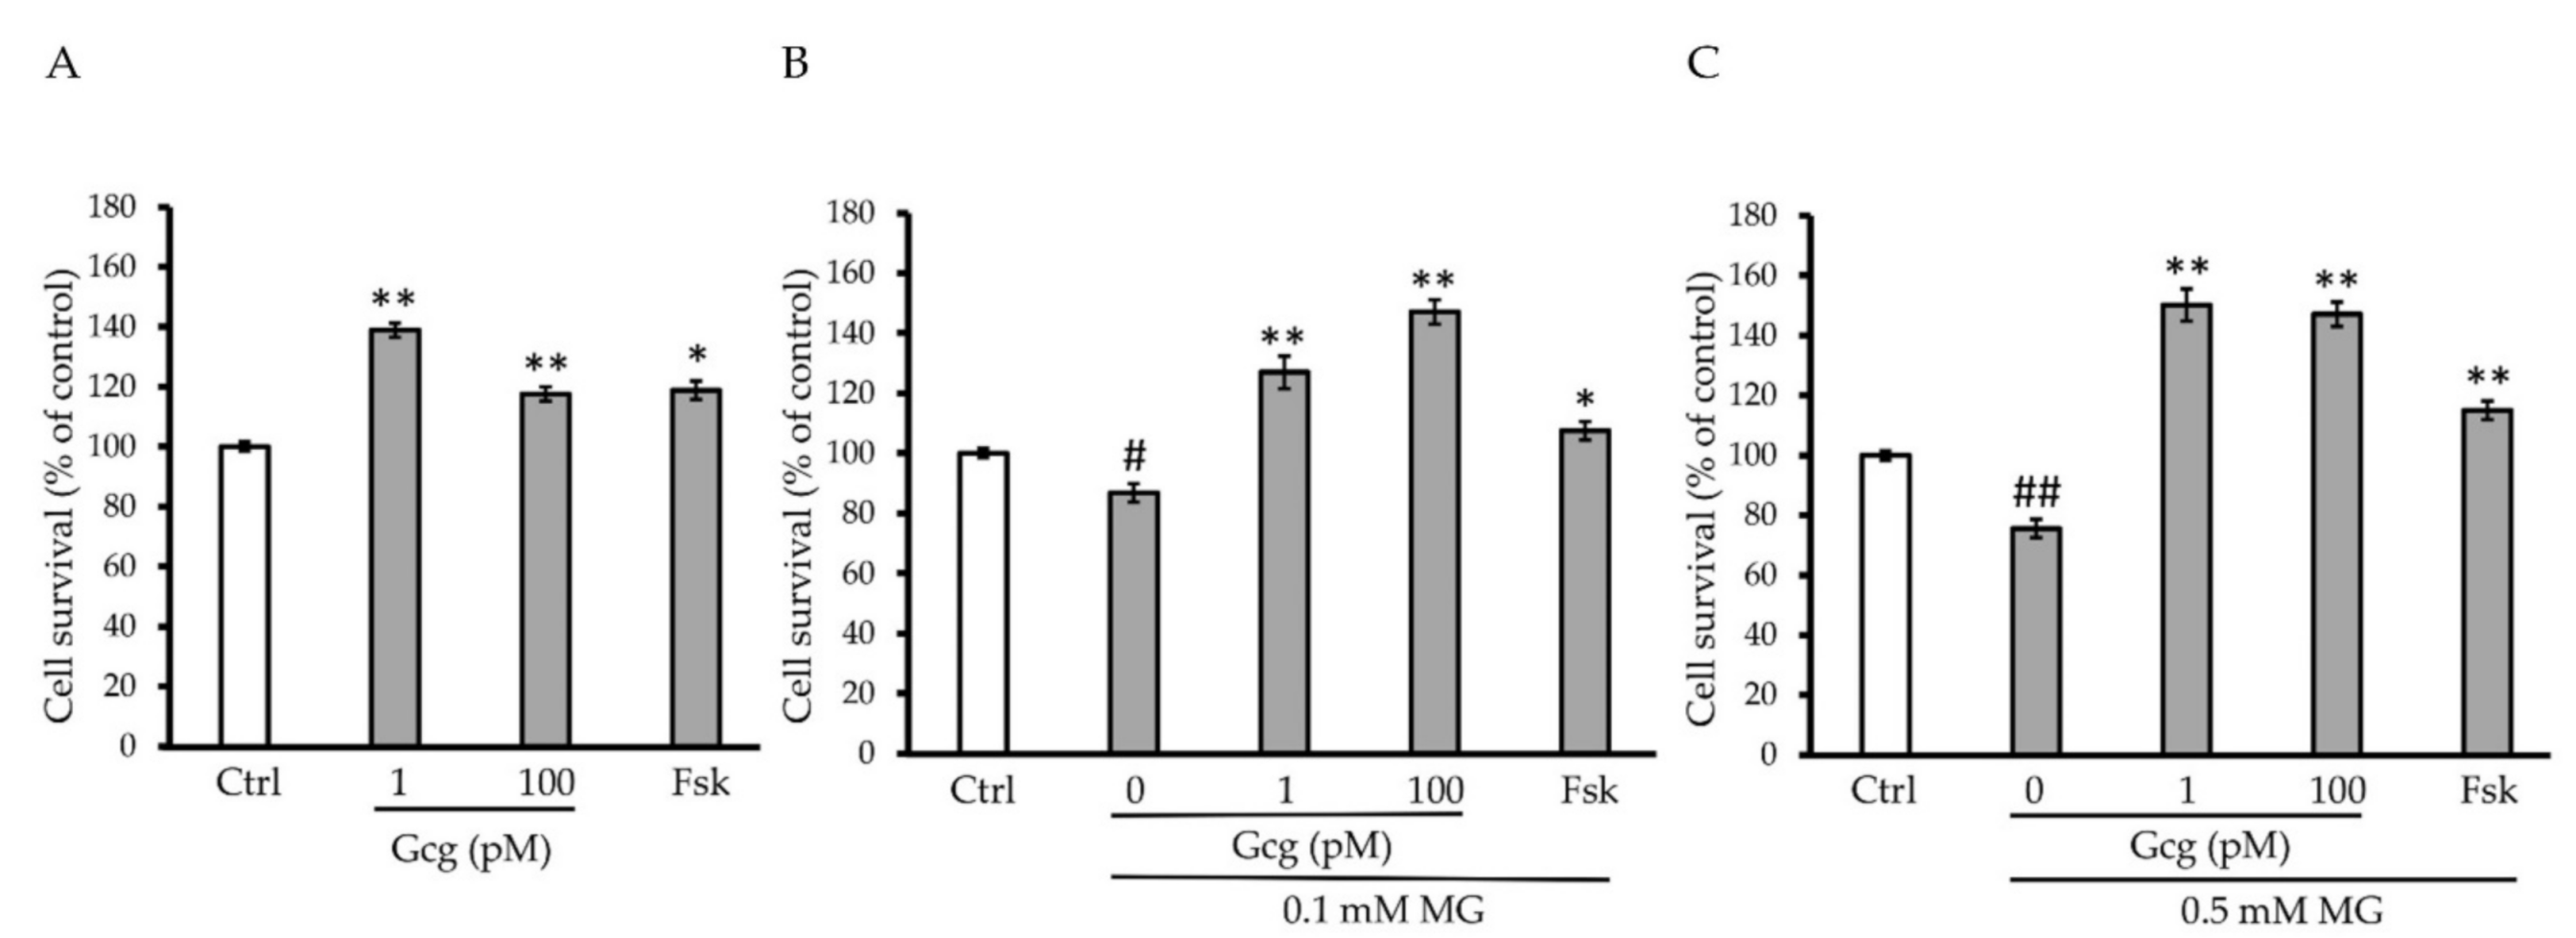
3.2. Survival of DRG Neuronal Cells Was Promoted by Glucagon

The survival of DRG neuronal cells was decreased by MG (no MG 100.0 ± 1.5%; 0.1 mmol/L MG 86.8 ± 3.1, p < 0.05 versus no MG; 0.5 mmol/L MG 75.5 ± 1.5, p < 0.001; n = 3 in each group) (Figure 2A–C). However, glucagon and forskolin had the capability to improve the decrease in survival (no MG: 1 pmol/L glucagon 138.9 ± 2.3, p < 0.001 versus no glucagon, 100 pmol/L glucagon 117.6 ± 2.4, p < 0.001, 25 µmol/L forskolin 118.8 ± 3.0, p < 0.01; 0.1 mmol/L MG: 1 pmol/L glucagon 127.0 ± 5.4, p < 0.001 versus no glucagon, 100 pmol/L glucagon 147.0 ± 4.1, p < 0.001, 25 µmol/L forskolin 107.0 ± 3.1, p < 0.01; 0.5 mmol/L MG: 1 pmol/L glucagon 150.2 ± 3.2, p < 0.001 versus no glucagon, 100 pmol/L glucagon 147.0 ± 2.7, p < 0.001, 25 µmol/L forskolin 115.1 ± 3.1, p < 0.001; n = 3 in each group) (Figure 2B,C).

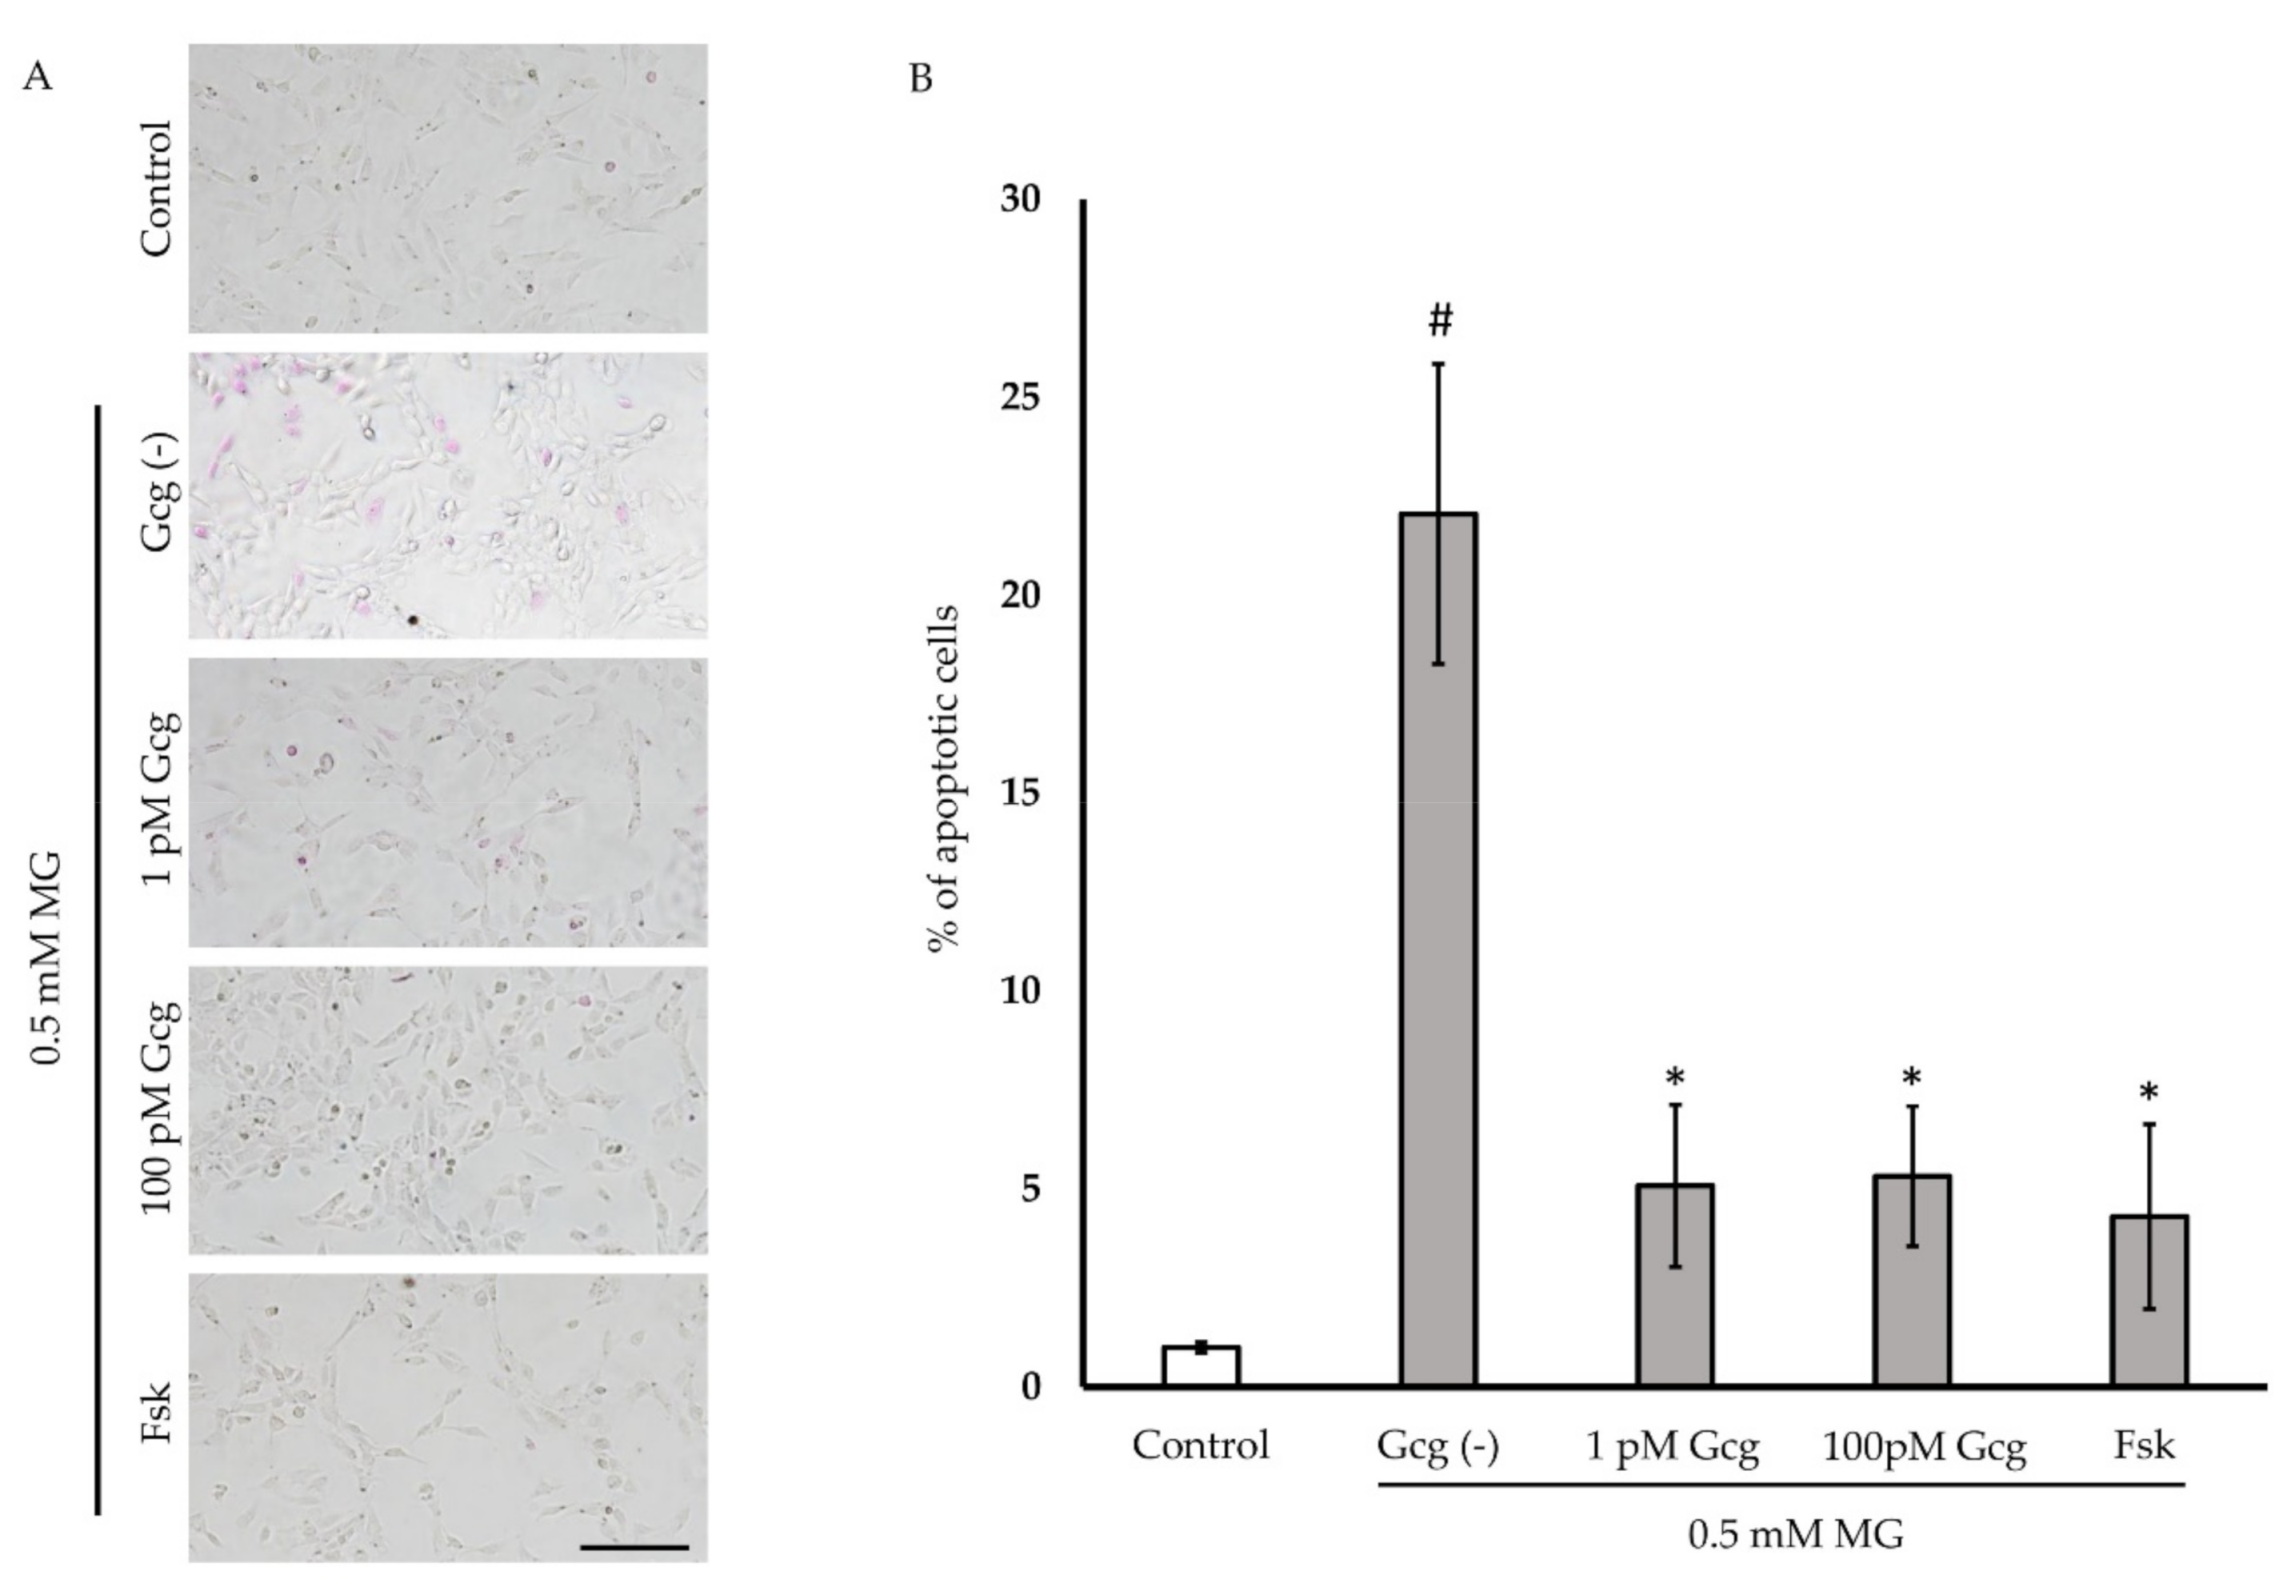
3.3. Glucagon Attenuated MG-Induced Apoptosis

Six hours after treatment with 0.5 mmol/L of MG, more than 20% of the neuronal cells exhibited apoptosis (Figure 3A,B). The percentage of apoptotic cells was reduced in the cells treated with glucagon or forskolin (no MG 1.0 ± 0.1%; 0.5 mmol/L MG 22.1 ± 3.8, p < 0.001 versus no MG; 1 pmol/L glucagon 5.1 ± 2.1, p < 0.05 versus group with glucagon (−)/MG (+); 100 pmol/L glucagon 5.3 ± 1.8, p < 0.05; 25 µmol/L forskolin 4.3 ± 2.3, p < 0.05; n = 3 in each group).

3.4. Mitochondrial ROS Production Induced by MG Was Inhibited by Glucagon

Incubation for 6 h with MG promoted mitochondrial ROS production in DRG neuronal cells (no MG 100.0 ± 27.2%; 0.5 mmol/L MG 11795.7 ± 3948.2, p < 0.05) (Figure 4). However, the increase in ROS production induced by MG was inhibited by glucagon or forskolin (1 pmol/L glucagon 1687.9 ± 193.7, p < 0.05 versus no glucagon with MG, 100 pmol/L glucagon 2651.8 ± 894.2, p < 0.05, 25 µmol/L forskolin 912.5 ± 822.4, p < 0.05).

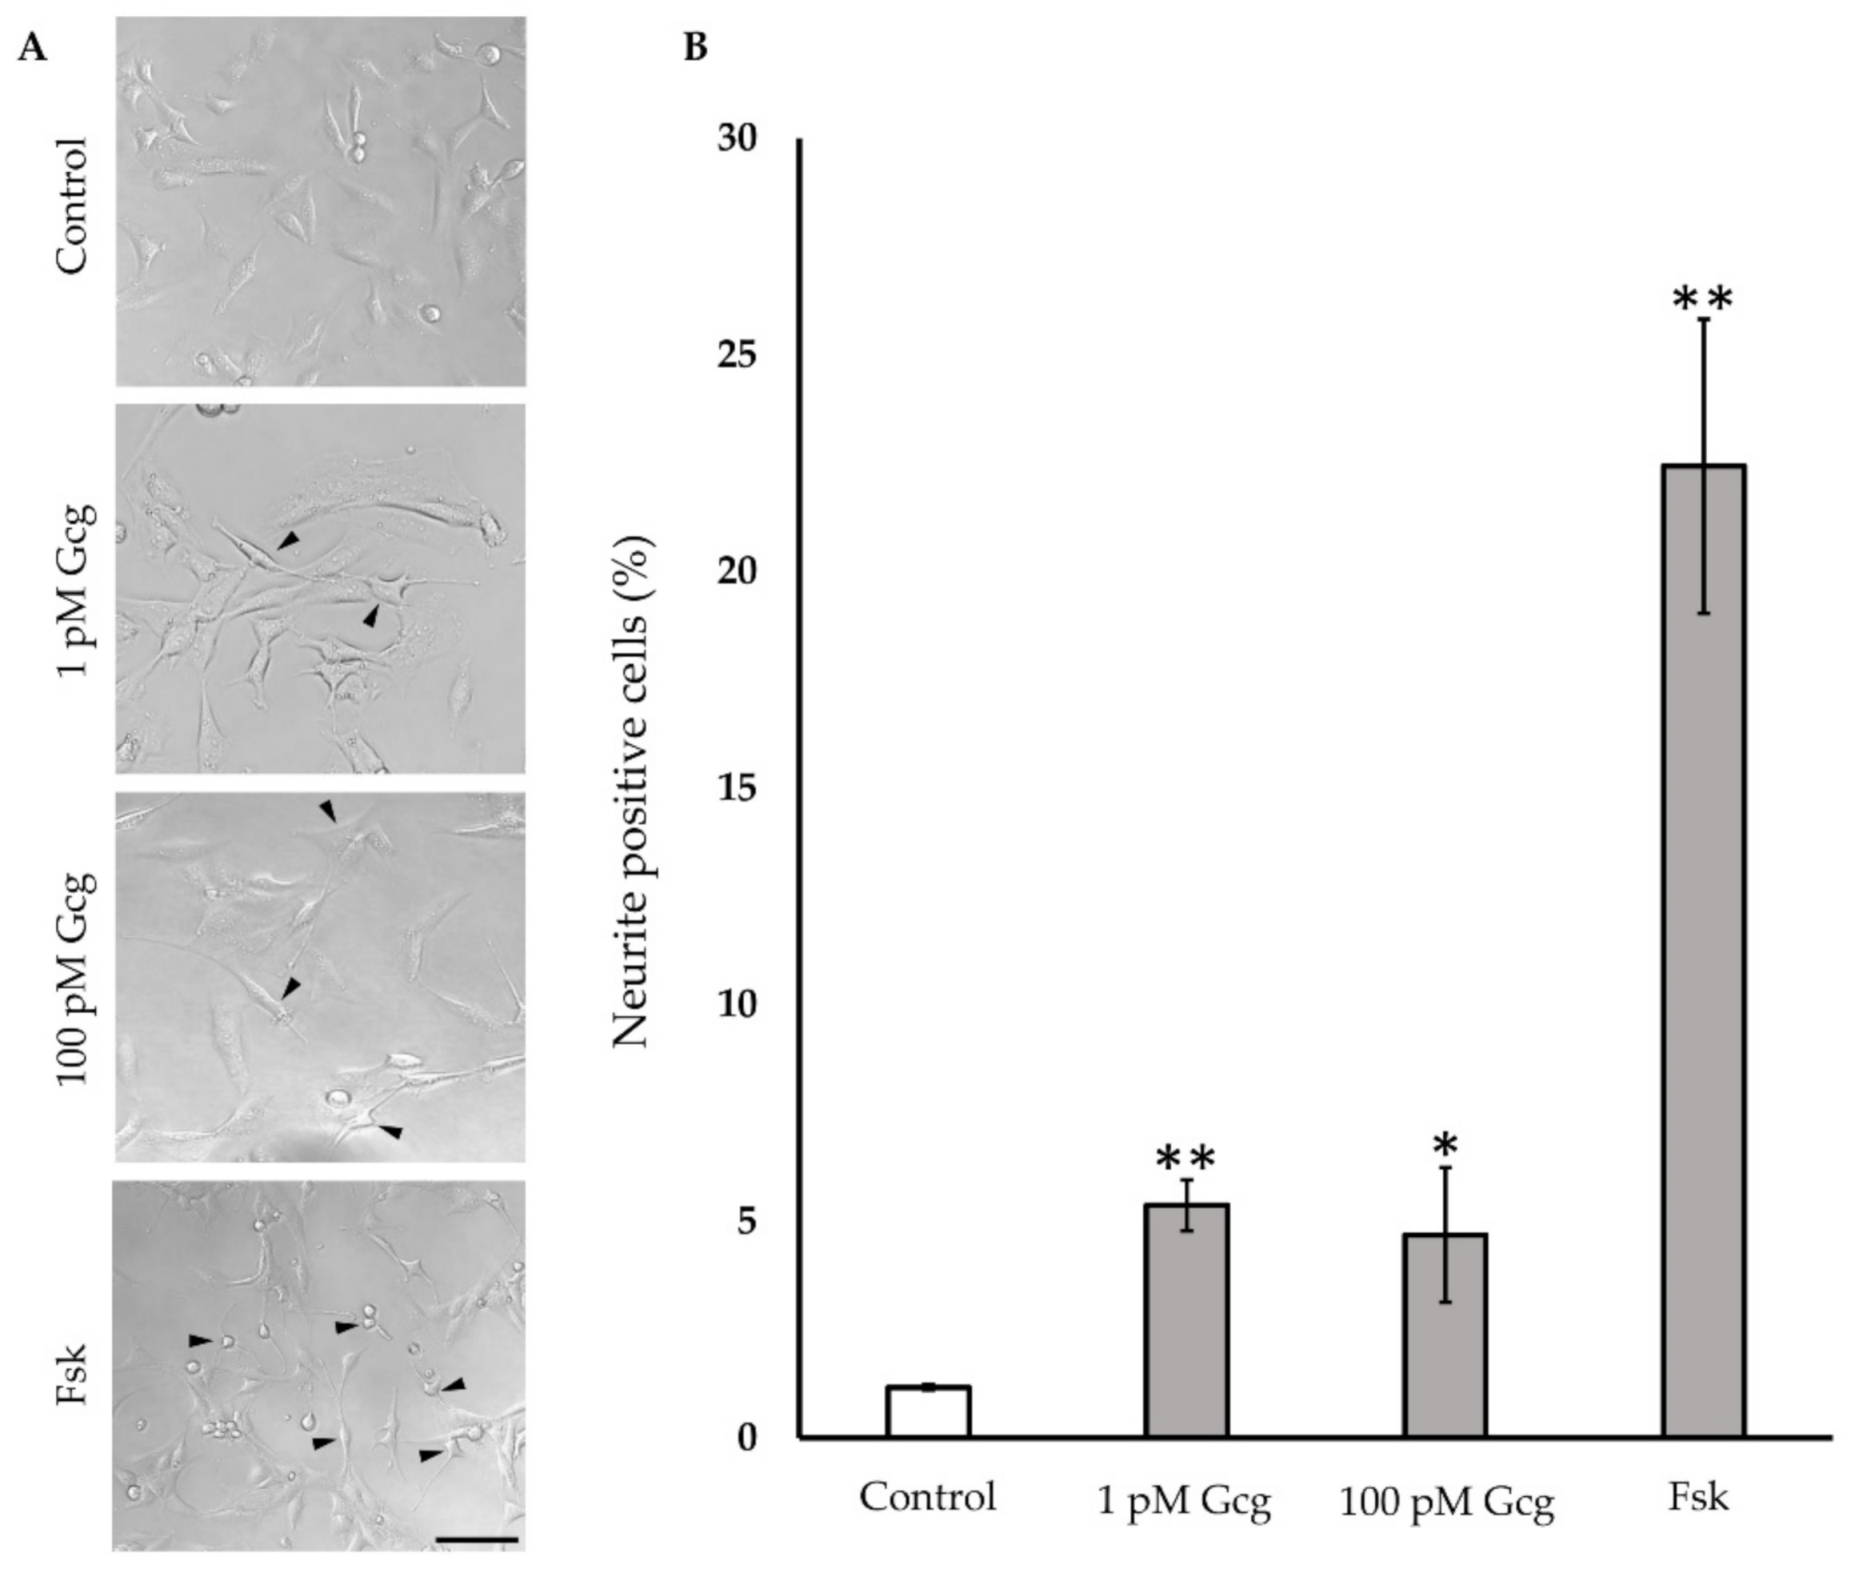
3.5. Neurite Projection Was Increased by Glucagon

After a 24-h treatment of neuronal cells with glucagon or forskolin, neuronal outgrowth was evaluated (Figure 5). Glucagon and forskolin significantly promoted neuronal outgrowth; no neurite projection was found in the cells without treatment (control 1.18 ± 0.06%; 1 pmol/L glucagon 5.4 ± 0.6%, p < 0.001 versus control, 100 pmol/L glucagon 4.7 ± 1.6, p < 0.05, 25 μmol/L forskolin 22.4 ± 3.4, p < 0.001).

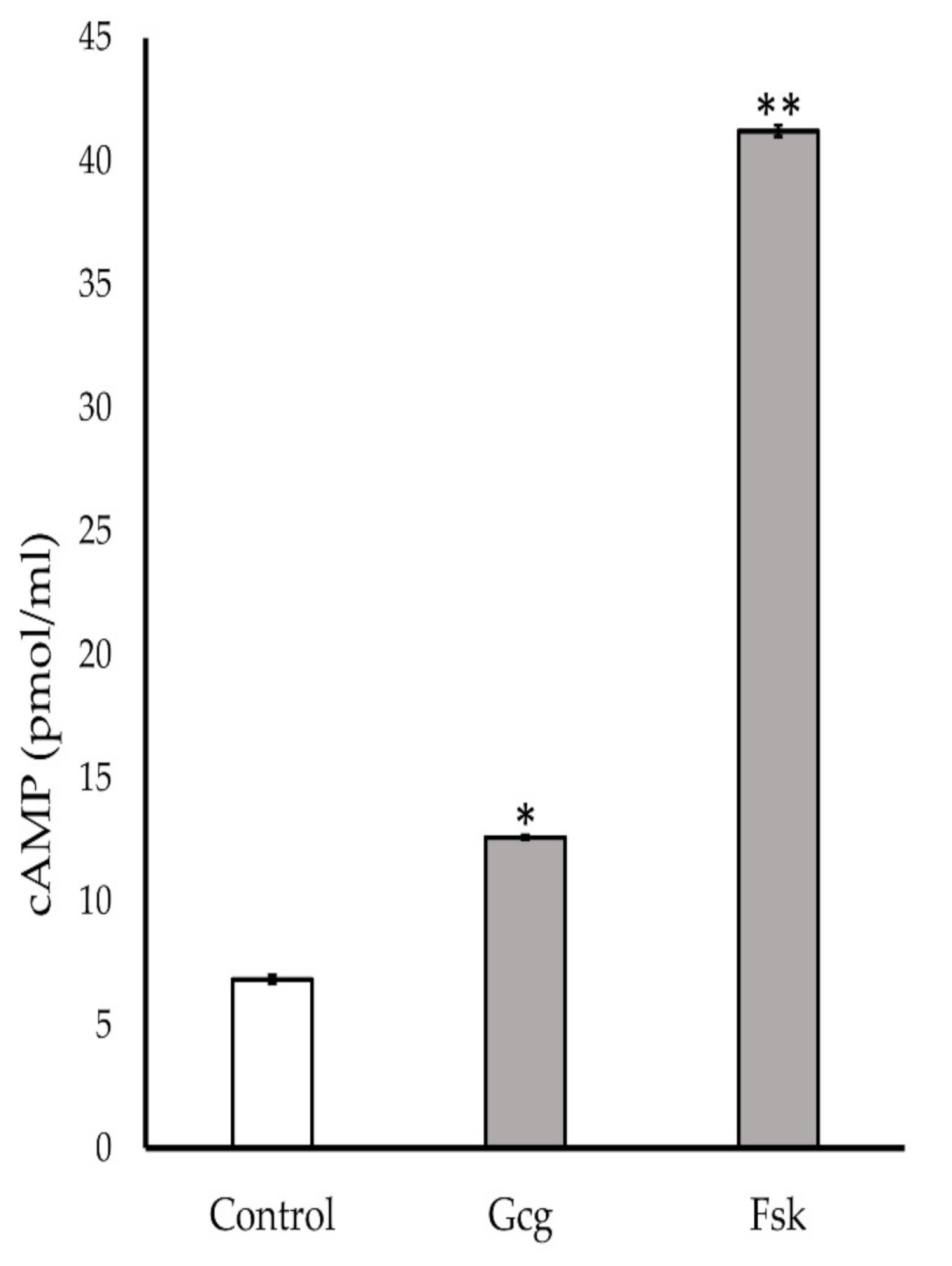
3.6. Production of Cyclic Adenosine Monophosphate (cAMP) Increased by Glucagon Stimulation

The neuronal cells were treated with MM for 20 min with glucagon or forskolin. Glucagon and forskolin showed significant production of cAMP (control 6.9 ± 0.2 pmol/mL; 1 pmol/L glucagon 12.6 ± 0.1, p < 0.05 versus control, 10 µmol/L forskolin 41.2 ± 0.2, p < 0.001) (Figure 6).

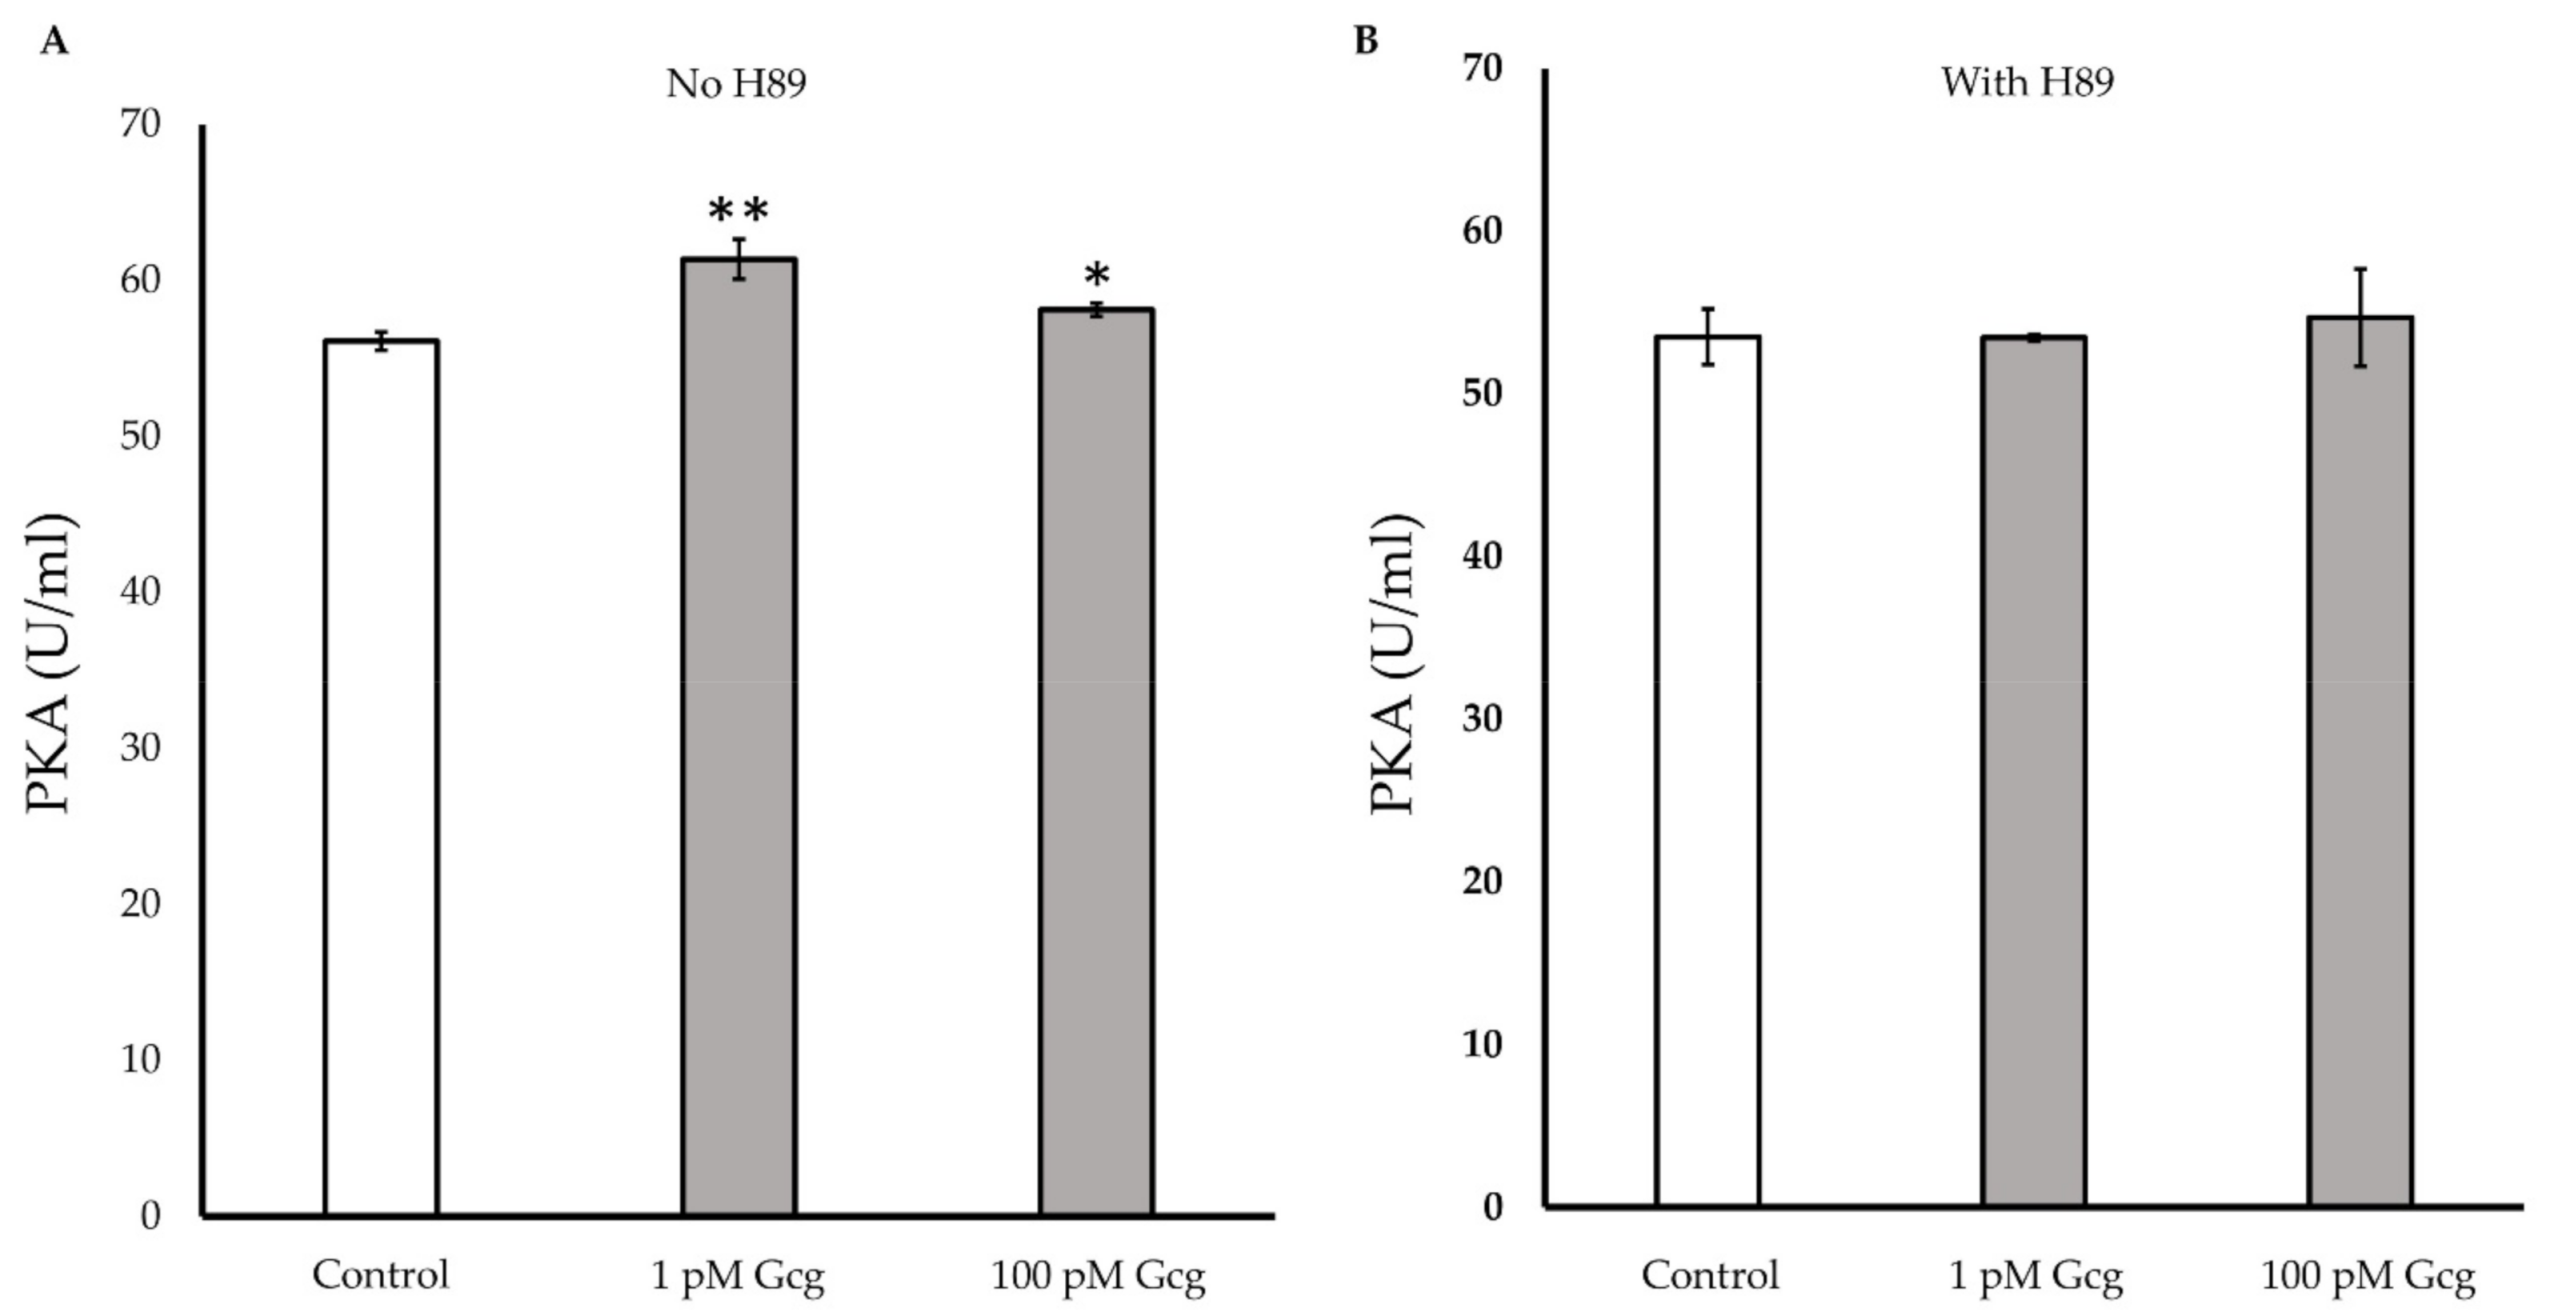
3.7. PKA Activity Was Increased by Glucagon

After 30 min of treatments with 1 or 100 pmol/L of glucagon, the glucagon significantly increased intracellular PKA activity (control 56.1 ± 0.6 U/mL; 1 pmol/L glucagon 61.4 ± 1.3, p < 0.01 versus control, 100 pmol/L glucagon 58.1 ± 0.4, p < 0.05) (Figure 7A). When the cells were treated with glucagon in the presence of the PKA inhibitor, no significant increase in PKA was observed (control 53.5 ± 1.7; 1 pmol/L glucagon 53.5 ± 0.2, p = 0.97 versus control, 100 pmol/L glucagon 54.7 ± 3.0, p = 0.65) (Figure 7B).

4. Discussion

In this study, we have revealed the neuroprotective functions of glucagon in peripheral neuronal cells for the first time. First, we have investigated the cytoprotective effects of glucagon in the neuronal cell-line 50B11 from the cell stress induced by MG. The results show that glucagon reduced neurotoxicity, apoptosis, mitochondrial ROS production, and promoted neuronal survival. Second, we verified the regulatory roles of glucagon in cellular biology; glucagon promoted neuronal elongation and increased intracellular cAMP and PKA activities. When investigating the roles of glucagon, even in physiological concentrations of glucagon, neuronal cells suffered no significant cytotoxicity. Furthermore, glucagon increased cell survival. Although one previous study indicated direct cytoprotective effects of glucagon in hepatocytes [47], the current study is the first report of cytoprotective effects in neuronal cells. To examine further cytoprotective potential of glucagon, experiments using the cell stress model were performed. As a result, cytoprotective effects were proven in a cytotoxicity assay, cell survival assay, and apoptosis assay. Additionally, mitochondrial oxidative stress was decreased by the supplementation of glucagon. These results clearly indicate the beneficial effects of glucagon, even in stressed circumstances, on DRG neuronal cells. To clarify the regulatory mechanisms of these effects in-depth, the intracellular signaling cAMP/PKA pathway was examined. The cAMP/PKA pathway has been verified in hepatocytes to be an intracellular signaling pathway activated by glucagon stimulation [48]. Regarding the nervous system, it has been reported in the central nervous system that activation of cAMP/PKA pathway increased synaptic plasticity [49], enhanced neurotransmitter release [50], and reduced cellular vulnerability to oxidative stress in astrocytes [51]. Additionally, it was reported that increase of cAMP promoted the regeneration of DRG axons in a mice model of sciatic nerve injury [52]. Therefore, we evaluated the association of cAMP and PKA in a cell line treated with glucagon. Treatment with physiological concentrations of glucagon successfully promoted accumulation of cAMP and activation of PKA in the cells. Additionally, neurite outgrowths, which have been proven to be enhanced by cAMP analogs in peripheral neuronal cells [42], were promoted by glucagon. This is the first study that identified the activation of the cAMP/PKA pathway induced by glucagon in DRG neuronal cells. Although the activation of the cAMP/PKA pathway might produce the neuroprotective effects of glucagon, the current study includes no experiment in which cAMP/PKA activation was examined during the exposition to the cellular stress by MG. Therefore, further research to elucidate the intracellular mechanisms in the neuroprotective effects of glucagon should be performed in the future.
There are four limitations in the current study. First, this cell line is immortalized; although neurons in vivo rarely proliferate, the neuronal cells rapidly proliferate. Therefore, the current results, especially cytotoxicity and cell survival, may be altered in DRG neurons in vivo. To overcome this limitation, further research using primary cultures of DRG or in vivo animal studies should be considered in the future. Second, a single stressor, MG, was used for a short duration in this study. However, DPN is a chronic diabetic complication whose pathogenesis consists of multiple factors. Although we have struggled to improve the in vitro model of DPN using longer durations of treatment with lower concentrations of MG, inconsistent results were observed. Combinations with other stressors may improve this drawback. Third, we have verified the effects of glucagon using an in vitro model. As glucagon increases the blood glucose level, chronic administration of glucagon as a treatment of DPN may worsen glycemic condition [53]. Therefore, to realize the administration of glucagon in the treatment of DPN, it is necessary to develop technology to overcome the issue, e.g., the development of tissue-specific agonists and drug delivery systems. Fourth, the changes of PKA activity were moderate. The activity of PKA changed only ~5% between conditions with or without glucagon. Furthermore, the PKA inhibitor H89 barely inhibited the activities. The mild changes might be caused by the shortage of exposure time to H89. Further experimental efforts should be performed in the future.

5. Conclusions

In conclusion, we have successfully verified novel neuroprotective actions of glucagon against MG-induced cellular stress in peripheral neuronal cells. Our report may support identifying the pharmacological effects of glucagon in neurons for future study and opens a hidden era to study glucagon for future researchers.

Author Contributions

Conceptualization, M.S.M., T.H., Y.Y., Y.M., M.K., S.T., Y.K., J.N., H.K.; data curation, M.S.M. and T.H.; formal analysis, M.S.M. and T.H.; investigation, M.S.M., methodology, M.S.M., T.H, J.N., H.K.; project administration, H.K.; supervision, T.H., J.N. and H.K.; writing—original draft, M.S.M.; writing—review and editing, T.H., J.N. and H.K. All authors have read and agreed to the published version of the manuscript.

Funding

This research received no external funding.

Data Availability Statement

Not applicable.

Acknowledgments

The authors would like to thank Tatsuhito Miyake and Yuji Nakagomi, Laboratory for Electron Microscopy, Aichi Medical University, Institute of Comprehensive Medical Research, Division of Advanced Research Promotion, for their technical assistance in the microscopy analyses.

Conflicts of Interest

The authors declare no conflict of interest.

References

  1. The Diabetes Control and Complications Trial Research Group. The effect of intensive diabetes therapy on measures of autonomic nervous system function in the Diabetes Control and Complications Trial (DCCT). Diabetologia 1998, 41, 416–423. [Google Scholar] [CrossRef] [PubMed] [Green Version]
  2. The Diabetes Control and Complications Trial Research Group. The effect of intensive diabetes therapy on the development and progression of neuropathy. The Diabetes Control and Complications Trial Research Group. Ann. Intern. Med. 1995, 122, 561–568. [Google Scholar] [CrossRef]
  3. Hotta, N.; Akanuma, Y.; Kawamori, R.; Matsuoka, K.; Oka, Y.; Shichiri, M.; Toyota, T.; Nakashima, M.; Yoshimura, I.; Sakamoto, N.; et al. Long-term clinical effects of epalrestat, an aldose reductase inhibitor, on diabetic peripheral neuropathy: The 3-year, multicenter, comparative Aldose Reductase Inhibitor-Diabetes Complications Trial. Diabetes Care 2006, 29, 1538–1544. [Google Scholar] [CrossRef] [PubMed] [Green Version]
  4. Ang, C.D.; Alviar, M.J.; Dans, A.L.; Bautista-Velez, G.G.; Villaruz-Sulit, M.V.; Tan, J.J.; Co, H.U.; Bautista, M.R.; Roxas, A.A. Vitamin B for treating peripheral neuropathy. Cochrane Database Syst. Rev. 2008, 16, CD004573. [Google Scholar] [CrossRef] [PubMed]
  5. Stracke, H.; Gaus, W.; Achenbach, U.; Federlin, K.; Bretzel, R.G. Benfotiamine in diabetic polyneuropathy (BENDIP): Results of a randomised, double blind, placebo-controlled clinical study. Exp. Clin. Endocrinol. Diabetes 2008, 116, 600–605. [Google Scholar] [CrossRef] [PubMed] [Green Version]
  6. Jiang, G.; Zhang, B. Glucagon and regulation of glucose metabolism. Am. J. Physiol. Endocrinol. Metab. 2003, 284, E671–E678. [Google Scholar] [CrossRef] [PubMed] [Green Version]
  7. Parmley, W.; Glick, G.; Sonnenblick, E. Cardiovascular effects of glucagon in man. N. Engl. J. Med. 1968, 279, 12–17. [Google Scholar] [CrossRef] [PubMed]
  8. Williams, J.; Childress, R.; Chip, J.; Border, J. Hemodynamic effects of glucagon in patients with heart disease. Circulation 1969, 39, 38–47. [Google Scholar]
  9. Habegger, K.M.; Stemmer, K.; Cheng, C.; Müller, T.D.; Heppner, K.M.; Ottaway, N.; Holland, J.; Hembree, J.L.; Smiley, D.; Gelfanov, V.; et al. Fibroblast Growth Factor 21 Mediates Specific Glucagon Actions. Diabetes 2013, 62, 1453–1463. [Google Scholar] [CrossRef] [Green Version]
  10. Fanne, R.; Nassar, T.; Mazuz, A.; Waked, O.; HeymanS, N.; Hijazi, N.; Goelman, G.; Higazi, A. Neuroprotection by glucagon: Role of gluconeogenesis. J. Neurosurg. 2011, 114, 85–91. [Google Scholar] [CrossRef]
  11. Li, Y.; Glotfelty, E.; Namdar, I.; Tweedie, D.; Olson, L.; Hoffer, B.; DiMarchi, R.; Pick, C.; NH, G. Neurotrophic and neuroprotective effects of a monomeric GLP-1/GIP/Gcg receptor triagonist in cellular and rodent models of mild traumatic brain injury. Exp. Neurol. 2020, 324, 113113. [Google Scholar] [CrossRef] [PubMed]
  12. Motegi, M.; Himeno, T.; Nakai-Shimoda, H.; Inoue, R.; Ozeki, N.; Hayashi, Y.; Sasajima, S.; Mohiuddin, M.; Asano-Hayami, E.; Kato, M.; et al. Deficiency of glucagon gene-derived peptides induces peripheral polyneuropathy in mice. Biochem. Biophys. Res. Commun. 2020, 532, 47–53. [Google Scholar] [CrossRef] [PubMed]
  13. Mohiuddin, M.; Himeno, T.; Inoue, R.; Miura-Yura, E.; Yamada, Y.; Nakai-Shimoda, H.; Asano, S.; Kato, M.; Motegi, M.; Kondo, M.; et al. Glucagon-like peptide-1 receptor agonist protects dorsal root ganglion neurons against oxidative insult. J. Diabetes Res. 2019, 2019, 9426014. [Google Scholar] [CrossRef] [Green Version]
  14. Himeno, T.; Kamiya, H.; Naruse, K.; Harada, N.; Ozaki, N.; Seino, Y.; Shibata, T.; Kondo, M.; Kato, J.; Okawa, T.; et al. Beneficial effects of exendin-4 on experimental polyneuropathy in diabetic mice. Diabetes 2011, 60, 2397–2406. [Google Scholar] [CrossRef] [Green Version]
  15. Goto, Y.; Hotta, N.; Shigeta, Y.; Sakamoto, N.; Kikkawa, R. Effects of an aldose reductase inhibitor, epalrestat, on diabetic neuropathy. Clinical benefit and indication for the drug assessed from the results of a placebo-controlled double-blind study. Biomed. Pharmacother. 1995, 49, 269–277. [Google Scholar] [CrossRef]
  16. Ziegler, D.; Papanas, N.; Schnell, O.; Nguyen, B.; Nguyen, K.; Kulkantrakorn, K.; Deerochanawong, C. Current concepts in the management of diabetic polyneuropathy. Diabetes Investig. 2020, in press. [Google Scholar] [CrossRef] [PubMed]
  17. Yagihashi, S.; Yamagishi, S.; Wada, R. Pathology and pathogenetic mechanisms of diabetic neuropathy: Correlation with clinical signs and symptoms. Diabetes Res. Clin. Pract. 2007, 77, S184–S189. [Google Scholar] [CrossRef]
  18. Vincent, A.M.; McLean, L.L.; Backus, C.; Feldman, E.L. Short-term hyperglycemia produces oxidative damage and apoptosis in neurons. Faseb. J. 2005, 19, 638–640. [Google Scholar] [CrossRef] [PubMed]
  19. Chuang, Y.C. Mitochondrial dysfunction and oxidative stress in seizure-induced neuronal cell death. Acta. Neurol. Taiwan 2010, 19, 3–15. [Google Scholar] [PubMed]
  20. Alam, M.A.; Chowdhury, M.R.; Jain, P.; Sagor, M.A.; Reza, H.M. DPP-4 inhibitor sitagliptin prevents inflammation and oxidative stress of heart and kidney in two kidney and one clip (2K1C) rats. Diabetol. Metab. Syndr. 2015, 7, 107. [Google Scholar] [CrossRef] [Green Version]
  21. Fan, L.; Cacicedo, J.; Ido, Y. Impaired nicotinamide adenine dinucleotide (NAD+ ) metabolism in diabetes and diabetic tissues: Implications for nicotinamide-related compound treatment. J. Diabetes Investig. 2020, 11, 1403–1419. [Google Scholar] [CrossRef] [PubMed]
  22. Younger, D.; Rosoklija, G.; Hays, A.; Trojaborg, W.; Latov, N. Diabetic peripheral neuropathy: A clinicopathologic and immunohistochemical analysis of sural nerve biopsies. Muscle Nerve 1996, 19, 722–727. [Google Scholar] [CrossRef]
  23. Conti, G.; Scarpini, E.; Baron, P.; Livraghi, S.; Tiriticco, M.; Bianchi, R.; Vedeler, C.; Scarlato, G. Macrophage infiltration and death in the nerve during the early phases of experimental diabetic neuropathy: A process concomitant with endoneurial induction of IL-1beta and p75NTR. J. Neurol. Sci. 2002, 195, 35–40. [Google Scholar] [CrossRef]
  24. Leinninger, G.M.; Vincent, A.M.; Feldman, E.L. The role of growth factors in diabetic peripheral neuropathy. J. Peripher. Nerv. Syst. 2004, 9, 26–53. [Google Scholar] [CrossRef] [PubMed]
  25. Nakazawa, T.; Tamai, M.; Mori, N. Brain-derived neurotrophic factor prevents axotomized retinal ganglion cell death through MAPK and PI3K signaling pathways. Investig. Ophthalmol. Vis. Sci. 2002, 43, 3319–3326. [Google Scholar] [PubMed]
  26. Munson, J.B.; Shelton, D.L.; McMahon, S.B. Adult mammalian sensory and motor neurons: Roles of endogenous neurotrophins and rescue by exogenous neurotrophins after axotomy. J. Neurosci. 1997, 17, 470–476. [Google Scholar] [CrossRef]
  27. Lee, H.; Seo, I.; Suh, D.; Lee, H.; Park, H.T. A novel mechanism of methylglyoxal cytotoxicity in neuroglial cells. J. Neurochem. 2009, 108, 273–284. [Google Scholar] [CrossRef]
  28. Lee, J.H.; Parveen, A.; Do, M.H.; Kang, M.C.; Yumnam, S.; Kim, S.Y. Molecular mechanisms of methylglyoxal-induced aortic endothelial dysfunction in human vascular endothelial cells. Cell Death. Dis. 2020, 11, 1–15. [Google Scholar] [CrossRef]
  29. Beisswenger, P.J.; Howell, S.K.; O’Dell, R.M.; Wood, M.E.; Touchette, A.D.; Szwergold, B.S. α-Dicarbonyls Increase in the Postprandial Period and Reflect the Degree of Hyperglycemia. Diabetes Care 2001, 24, 726–732. [Google Scholar] [CrossRef] [Green Version]
  30. Chan, C.; Huang, D.; Huang, Y.; Hsu, S.; Kang, L.; Shen, C.; Lin, W. Methylglyoxal induces cell death through endoplasmic reticulum stress-associated ROS production and mitochondrial dysfunction. J. Cell Mol. Med. 2016, 20, 1749–1760. [Google Scholar]
  31. Figarola, J.L.; Singhal, J.; Rahbar, S.; Awasthi, S.; Singhal, S.S. LR-90 prevents methylglyoxal-induced oxidative stress and apoptosis in human endothelial cells. Apoptosis 2014, 19, 776–788. [Google Scholar] [CrossRef] [PubMed] [Green Version]
  32. Radu, B.; Dumitrescu, D.; Mustaciosu, C.; Radu, M. Dual effect of methylglyoxal on the intracellular Ca2+ signaling and neurite outgrowth in mouse sensory neurons. Cell Mol. Neurobiol. 2012, 32, 1047–1057. [Google Scholar] [PubMed]
  33. McLellan, A.; Thornalley, P.; Benn, J.; Sonksen, P. Glyoxalase system in clinical diabetes mellitus and correlation with diabetic complications. Clin. Sci. 1994, 87, 21–29. [Google Scholar] [CrossRef] [PubMed] [Green Version]
  34. Lapolla, A.; Flamini, R.; Lupo, A.; Aricò, N.; Rugiu, C.; Reitano, R.; Tubaro, M.; Ragazzi, E.; Seraglia, R.; Traldi, P. Evaluation of glyoxal and methylglyoxal levels in uremic patients under peritoneal dialysis. Ann. N. Y. Acad. Sci. 2005, 1043, 217–224. [Google Scholar] [CrossRef] [PubMed]
  35. Lapolla, A.; Flamini, R.; Dalla Vedova, A.; Senesi, A.; Reitano, R.; Fedele, D.; Basso, E.; Seraglia, R.; Traldi, P. Glyoxal and methylglyoxal levels in diabetic patients: Quantitative determination by a new GC/MS method. Clin. Chem. Lab. Med. 2003, 41, 1166–1173. [Google Scholar] [CrossRef]
  36. Andersen, S.; Witte, D.; Dalsgaard, E.; Andersen, H.; Nawroth, P.; Fleming, T.; Jensen, T.; Finnerup, N.; Jensen, T.; Lauritzen, T.; et al. Risk factors for incident diabetic polyneuropathy in a cohort with screen-detected type 2 diabetes followed for 13 Years: ADDITION-Denmark. Diabetes Care 2018, 41, 1068–1075. [Google Scholar] [CrossRef] [Green Version]
  37. Thornalley, P.; Battah, S.; Ahmed, N.; Karachalias, N.; Agalou, S.; Babaei-Jadidi, R.; Dawnay, A. Quantitative screening of advanced glycation endproducts in cellular and extracellular proteins by tandem mass spectrometry. Biochem. J. 2003, 375, 581–592. [Google Scholar] [CrossRef]
  38. Skapare, E.; Konrade, I.; Liepinsh, E.; Strele, I.; Makrecka, M.; Bierhaus, A.; Lejnieks, A.; Pirags, V.; Dambrova, M. Association of reduced glyoxalase 1 activity and painful peripheral diabetic neuropathy in type 1 and 2 diabetes mellitus patients. J. Diabetes Complicat. 2013, 27, 262–267. [Google Scholar] [CrossRef]
  39. Genuth, S.; Sun, W.; Cleary, P.; Gao, X.; Sell, D.; Lachin, J.; Monnier, V. Skin advanced glycation end products glucosepane and methylglyoxal hydroimidazolone are independently associated with long-term microvascular complication progression of type 1 diabetes. Diabetes 2015, 64, 266–278. [Google Scholar] [CrossRef] [Green Version]
  40. Chen, W.; Mi, R.; Haughey, N.; Oz, M.; Höke, A. Immortalization and characterization of a nociceptive dorsal root ganglion sensory neuronal line. J. Peripher. Nerv. Syst. 2007, 12, 121–130. [Google Scholar]
  41. Kauffman, M.E.; Kauffman, M.K.; Traore, K.; Zhu, H.; Trush, M.A.; Jia, Z.; Li, Y.R. MitoSOX-based flow cytometry for detecting mitochondrial ROS. React. Oxyg. Species 2016, 2, 361–370. [Google Scholar] [CrossRef] [PubMed] [Green Version]
  42. Radio, N.; Breier, J.; Shafer, T.; Mundy, W. Assessment of chemical effects on neurite outgrowth in PC12 cells using high content screening. Toxicol. Sci. 2008, 105, 106–118. [Google Scholar] [PubMed] [Green Version]
  43. Pradelles, P.; Grassi, J.; Chabardes, D.; Guiso, N. Enzyme immunoassays of adenosine cyclic 3′,5′-monophosphate and guanosine cyclic 3′,5′-monophosphate using acetylcholinesterase. Anal. Chem. 1989, 61, 447–453. [Google Scholar] [CrossRef]
  44. Iwai, T.; Ito, S.; Tanimitsu, K.; Udagawa, S.; Oka, J. Glucagon-like peptide-1 inhibits LPS-induced IL-1beta production in cultured rat astrocytes. Neurosci. Res. 2006, 55, 352–360. [Google Scholar] [CrossRef]
  45. Koschinski, A.; Zaccolo, M. Activation of PKA in cell requires higher concentration of cAMP than in vitro: Implications for compartmentalization of cAMP signalling. Sci. Rep. 2017, 7, 1–12. [Google Scholar]
  46. Limbutara, K.; Kelleher, A.; Yang, C.; Raghuram, V.; Knepper, M. Phosphorylation changes in response to kinase inhibitor H89 in PKA-null cells. Sci. Rep. 2019, 9, 2814. [Google Scholar] [CrossRef] [PubMed] [Green Version]
  47. Sinclair, E.; Yusta, B.; Streutker, C.; Baggio, L.; Koehler, J.; Charron, M.; Drucker, D. Glucagon receptor signaling is essential for control of murine hepatocyte survival. Gastroenterology 2008, 135, 2096–2106. [Google Scholar] [CrossRef] [Green Version]
  48. Jelinek, L.; Lok, S.; Rosenberg, G.; Smith, R.; Grant, F.; Biggs, S.; Bensch, P.; Kuijper, J.; Sheppard, P.; Sprecher, C. Expression cloning and signaling properties of the rat glucagon receptor. Science 1993, 259, 1614–1616. [Google Scholar] [CrossRef]
  49. Waltereit, R.; Weller, M. Signaling from cAMP/PKA to MAPK and synaptic plasticity. Mol. Neurobiol. 2003, 27, 99–106. [Google Scholar]
  50. Savchenko, A.; Barnes, S.; Kramer, R.H. Cyclic-nucleotide-gated channels mediate synaptic feedback by nitric oxide. Nature 2020, 390, 694–698. [Google Scholar] [CrossRef] [PubMed] [Green Version]
  51. Shim, M.S.; Kim, K.-Y.; Bu, J.H.; Nam, H.S.; Jeong, S.W.; Park, T.L.; Ellisman, M.H.; Weinreb, R.N.; Ju, W.-K. Elevated intracellular cAMP exacerbates vulnerability to oxidative stress in optic nerve head astrocytes. Cell Death Dis. 2018, 9, 1–18. [Google Scholar] [CrossRef] [PubMed]
  52. Qiu, J.; Cai, D.; Dai, H.; McAtee, M.; Hoffman, P.; Bregman, B.; Filbin, M. Spinal axon regeneration induced by elevation of cyclic AMP. Neuron 2002, 34, 895–903. [Google Scholar] [CrossRef] [Green Version]
  53. Kedia, N. Treatment of severe diabetic hypoglycemia with glucagon: An underutilized therapeutic approach. Diabetes Metab. Syndr. Obes. 2011, 4, 337–346. [Google Scholar] [CrossRef] [PubMed] [Green Version]
Figure 1. Cytotoxicity assay: (A) After 6 h of treatment with glucagon or forskolin, no significant cytotoxicity was identified. (B,C) Although 0.1 and 0.5 mmol/L methylglyoxal (MG) exhibited significant cytotoxicity in the cells, glucagon (1, 100 pmol/L) and forskolin (25 µmol/L) significantly attenuated cytotoxicity. # p < 0.001 versus control without MG; ** p < 0.005 versus control, * p < 0.05 versus control. Ctrl: control, Gcg: glucagon, MG: methylglyoxal, Fsk: forskolin, mM: mmol/L, pM: pmol/L.
Biomolecules 11 00287 g001
Figure 2. Cell survival assay: (AC) MG significantly reduced the survival of dorsal root ganglion (DRG) neuronal cells. Glucagon and forskolin increased the cell survival which was reduced by MG. # p < 0.05 versus control without MG, glucagon, or forskolin; ## p < 0.001 versus control without MG, glucagon, or forskolin; * p < 0.01 and ** p < 0.001 versus control. n = 3 in each group. Error bars: standard deviation. Ctrl: control, Gcg: glucagon, MG: methylglyoxal, Fsk: forskolin, mM: mmol/L, pM: pmol/L.
Biomolecules 11 00287 g002
Figure 3. Apoptosis estimation: (A) Apoptotic cells were stained with purple dye. Many apoptotic cells were observed in the cells treated with 0.5 mM MG (control). However, the number of apoptotic cells was low in cells treated with glucagon or forskolin. Scale bar: 200 µm. (B) The percentage of apoptosis was significantly reduced in the cells treated with glucagon or forskolin. # p < 0.05 versus MG (−); * p < 0.05 versus MG treatment without glucagon or forskolin (control). n = 3 in each group. Error bars: standard deviation. Gcg: glucagon, MG: methylglyoxal, Fsk: forskolin, pM: pmol/L, mM: mmol/L.
Biomolecules 11 00287 g003
Figure 4. Mitochondrial reactive oxygen species (ROS) measurement: (A) The fluorescence images of MitoSOX™ (red) showed mitochondrial ROS production of neuronal cells with or without glucagon or forskolin in the presence or absence of MG. Blue: DAPI (nuclei). Scale bar: 200 μm. (B) The fluorescence intensity quantified by ImageJ software. The production of ROS by MG was significantly reduced in the cells treated with glucagon or forskolin. # p < 0.05 versus MG (−); * p < 0.05 versus control with MG; n = 3 in each group. Error bars: standard deviation, Gcg: glucagon, MG: methylglyoxal, Fsk: forskolin, mM: mmol/L, pM: pmol/L.
Biomolecules 11 00287 g004
Figure 5. Neurite outgrowth: (A) Light microscopic photography showed the neurite projection in DRG neuronal cells with or without glucagon and forskolin. Arrowheads indicate cells with neurite. Scale bar: 100 μm. (B) The percentage of neurite positive neurons was higher in the cells treated with glucagon and forskolin. ** p < 0.001 versus control; * p < 0.05 versus control; n = 3 in each condition; Error bars: standard deviation. Gcg: glucagon, MG: methylglyoxal, Fsk: forskolin, pM: pmol/L.
Biomolecules 11 00287 g005
Figure 6. Cyclic adenosine monophosphate (cAMP) assay: Accumulation of cAMP was found in the cells treated with 1 pmol/L glucagon or 10 μmol/L forskolin. * p < 0.05 versus control, ** p < 0.001 versus control; Error bars: standard deviation. Gcg: glucagon, Fsk: forskolin.
Biomolecules 11 00287 g006
Figure 7. Protein kinase A (PKA) detection: (A) The activity of PKA significantly increased in the cells treated with 1 or 100 pmol/L of glucagon. (B) When the cells were treated with glucagon in the presence of the PKA inhibitor H89, no significant increase in PKA was observed. * p < 0.05 versus control, ** p < 0.01 versus control, Error bars: standard deviation. Gcg: glucagon, Fsk: forskolin, pM: pmol/L.
Biomolecules 11 00287 g007
Publisher’s Note: MDPI stays neutral with regard to jurisdictional claims in published maps and institutional affiliations.

