
Crisis Map Design Considering Map Cognition
by
Ping Du
1,2,3,*, 
Dingkai Li
1,2,3,
Tao Liu
1,2,3,
Liming Zhang
1,2,3,
Xiaoxia Yang
4 and
Yikun Li
1,2,3 1
Faculty of Geomatics, Lanzhou Jiaotong University, Lanzhou 730070, China
2
National-Local Joint Engineering Research Center of Technologies and Applications for National Geographic State Monitoring, Lanzhou 730070, China
3
Gansu Provincial Engineering Laboratory for National Geographic State Monitoring, Lanzhou 730070, China
4
College of Earth Science, Chengdu University of Technology, Chengdu 610059, China
*
Author to whom correspondence should be addressed.
ISPRS Int. J. Geo-Inf. 2021, 10(10), 692; https://0-doi-org.brum.beds.ac.uk/10.3390/ijgi10100692
Submission received: 22 July 2021
/
Revised: 7 October 2021
/
Accepted: 11 October 2021
/
Published: 14 October 2021
(This article belongs to the Special Issue GIScience for Risk Management in Big Data Era)
Abstract
:Crisis maps play a significant role in emergency responses. Users are challenged to interpret a map rapidly in emergencies, with limited visual information-processing resources and under time pressure. Therefore, cartographic techniques are required to facilitate their map cognition. In this study, we analyzed the exogenous and endogenous disruptions that users needed to overcome when they were reading maps. The analysis results suggested that cartographers’ taking the stressors into consideration could promote the cognitive fit between cartographers and users, improving map cognition and spatial information supply–demand matching. This paper also elaborates the course of map visual information processing and related graphic variables to visual attention attributes. To improve the users’ map cognition in time-critical emergency situations, crisis map design principles and a methodology were proposed. We developed three fire emergency rescue road maps and performed two evaluations to verify the effectiveness of the principles. Our experiments showed that the principles could effectively facilitate the users’ rapid map perception and proper understanding, by reducing their cognitive load, and could improve the quality of the crisis maps to some extent.
1. Introduction
Maps are important because they have the potential to represent large amounts of information regarding an area of interest within a single frame and in a comprehensible manner [1]. During crisis response, it is critical to share and understand complex spatial, thematic, and temporal information in a timely, visual, and compelling way [2]. Crisis maps are often generated during an event and must be interpreted quickly under pressure [3]. They are special-purpose thematic maps on which objects, phenomena, or actions specific to crisis management are highlighted using appropriate cartographic symbols and represented according to their importance [4]. As practical tools in crisis response, maps have intuitive, informative, well-targeted, and topic-prominent characters, providing the users with adequate visualization supports for situation analysis, decision-making, and risk communication.
Map reading is a complex process, in which people interpret various visual representations within the context of their informational needs, goals, knowledge, and experience [5]. Often risk is expressed in the form of maps [6]. During emergencies, all tasks are time sensitive, and the speed with which one can read and interpret a map can make the difference between lives and property being saved or lost [7]. When users read crisis maps in risky and unstable emergencies, they face many stressors, which are events that provoke stress [8]. Timely and accurate information about ongoing events is crucial for users seeking to effectively respond to a crisis [9]. Thus, map reading speed is of paramount importance [10]. Although map images are presented with legends, descriptive text, and explanatory information in some cases, the interpretation of information in the map relies almost wholly on the map image alone [11]. As humans have limited visual information-processing resources, combined with time pressure and stress, users’ map cognition is greatly hindered. A mechanism called selective attention, or visual attention, in the human visual system directs human vision to parts of interest in a visual scene. These parts are called salient regions, and their saliencies correspond to how much attention can be focused on them [12]. Therefore, cartographers must understand the process of visual information to be handled during map reading and, on this basis, utilize salient regions of the map image to promote the users’ rapid perception, proper understanding, and effective map use in time-critical emergencies.
This paper is concerned with cartographic techniques for improving users’ map cognition in emergencies, based on visual attention. This study discusses the background regarding previous related studies (Section 2), analyzes users’ stressors in crisis map cognition (Section 3), discusses the cognitive fit in spatial information supply–demand matching, illustrates the process of visual information handled in a users’ map cognition, and relates graphic variables to visual attention attributes (Section 4). Then, based on the perceptual template model (PTM), crisis map design principles and methods to reduce the users’ cognitive workload are proposed (Section 5). Subsequently, three crisis maps are designed and evaluated to show the effectiveness and feasibility of the principles and methods (Section 6), and finally, the conclusions and future work in this field are presented (Section 7).
2. Related Research
2.1. Crisis Mapping
Crisis mapping is commonly used today to describe the holistic integration and visualization of location-enabled information to support a broad spectrum of humanitarian relief and emergency management activities [13]. It is a new genre of mapping for decision making and risk communication [14]. Cartographers recognized the key role of maps in emergency response a long time ago. At present, most studies aim to improve crisis mapping efficiency, and mainly focus on the important parts of mapping, such as mapping methods and symbology.
The template-based technique has become the major mode of crisis mapping, because of its advantages of a reusable template, high production efficiency, and automatic mapping [15]. Xu [16] proposed emergency thematic map template design principles and formed an emergency thematic map template by module combination. Qian [17] analyzed the design method and principles of a parametric template for emergency mapping and illustrated the fundamental problems with the example of earthquake emergency map template design. Zheng et al. [18] proposed a new rapid emergency map design method using template technology based on the knowledge obtained from a set of questionnaires and eye movement tracking experiments. Besides template technology, there have been numerous other research works about web-based mapping [13,19,20,21,22] and remote-sensing-data-based mapping [23,24,25].
With regard to crisis map symbology, Kostelnick and Hoeniges [26] summarized four general challenges related to the development of crisis map symbology, including methods for developing symbol taxonomies, considerations for designing crisis map symbols, standardization of crisis map symbols, and sharing and promulgation of crisis map symbols. Dymon [3] analyzed the existing emergency map symbology found in various forms, and proposed a theoretical framework for the design of an emergency mapping symbology. Anthony et al. [7] developed a visually enabled, web-based interactive symbol store to help crisis map makers share point symbols. In addition, there exists further studies of map symbols for specific emergency events [27,28,29,30].
Although many previous studies have an important guiding significance for improving crisis mapping efficiency, there has been less research on crisis map design from the perspective of map visual cognition. This article contributes to the field of crisis map design, while fully considering users’ stressors in map cognition. We sought cartographic techniques that utilized salient regions of the map image to improve the users’ map cognition in emergencies.
2.2. Spatial Cognition
Spatial cognition is the process whereby people understand the environments in which they are living, including the position, dependence, changes, and principles of matter and phenomenon [31]. Visual cognition is the main form of spatial cognition. The process of spatial cognition follows the general procedures by which a human knows about common things, including perception, representation, memory, and thinking. Two types of spatial cognition must be considered during map making and use: real world cognition for cartographers and map cognition for users, each of which is responsible for an important transformation [32]. The first transformation is an abstraction process from non-cartographic material to a map-presentable form, which is determined by the spatial cognition of the cartographers; the second is the interpretation of spatial information from a map, which is determined by the users. The level of spatial cognition is decisive for the extent and effect of the corresponding transformation, and directly influences the information load and map use.
Map cognition, namely geospatial cognition based on maps, realizes people’s understanding of geographical space by reading a map [33]. Map cognition is affected by numerous factors, such as map information load, human visual physiology, reading habits, psychological factors, proficiency, and map use environments. Chen [34] analyzed the necessity for spatial cognition research on electronic maps and summarized the characteristics and main contents of electronic-map spatial cognition. Zheng [35] developed a personalized map cognition factor model and evaluated the suitability of personalized maps.
Some studies have explored the effects of emergencies on users’ map cognition abilities. Du et al. [36] pointed out that the psychological constraints on emergency management had an adverse effect on users’ map cognition. Zhou et al. [37] concluded that people experienced more difficulty reading maps under time pressure after conducting a wayfinding experiment using eye-tracking and a verbal protocol. Lin et al. [38] examined the effect of repeated exposures to indoor environments on people’s indoor wayfinding performance under normal conditions and during a fire emergency, and the results revealed a significant negative impact of mental stress caused by the fire emergency on participants’ wayfinding performance. Hammond [39] distinguished two groups of stressors that eventually increase the stress level of users. Exogenous disruptions arise from outside the system, such as fire, noise, heat, and interruptions from external physical breakdowns. Endogenous disruptions emerge from the task situation itself, including time pressure or a computer program with bugs.
2.3. Visiual Attention
Although there is always more information in a scene, the brain can process only a fraction because of its limited computational capacity. Visual attention implements an information-processing bottleneck that allows only a small part of the incoming sensory information to reach the short-term memory and visual awareness [40]. The mechanism of visual attention significantly reduces the amount of data in human visual processing by enabling people to rapidly orientate towards the visual areas that carry more useful information. These specific areas that produce special stimuli in visual processing are considered to have visual saliency.
As a visualization of spatial information, a map is mainly processed by human vision. Visual attention is a crucial concept established in map design and map reading [41]. Fabrikant et al. [42] investigated the relationship between thematic relevance and perceptual salience in static weather map displays. The analysis results of eye-movement recordings showed that the salient display design affected the viewing behavior and response time of test participants. Hegarty et al. [43] concluded that users were more accurate if they viewed maps that made task-relevant information more visually salient. Swienty et al. [44] proposed attention-guiding geo-visualization principles and methodologies to facilitate a user’s attention when reading maps. These studies all explained that saliency-based map design can improve the efficiency of human visual processing.
3. Stressors in Crisis Map Cognition
3.1. Relationship between Stress and Cognition
In a crisis, people may be faced with an urgent task requiring quick decision-making [45]. A wrong decision can aggravate the situation and lead to even more significant losses of life and property. Therefore, they are always under a huge amount of stress. Cognitive theories indicate that stress impairs performance by increasing the attention given to negative thoughts [46]. On the one hand, stress weakens cognitive functions, concentration, and logical and abstract thinking. This weakening is caused by a high level of emotional activity, which disturbs information processing [45].
On the other hand, cognitive load also increases the selective attention given to stressors, amplifies stress levels, and is detrimental to the ability to focus attention on other relevant issues [47]. The term cognitive load can be considered as the amount of work required to acquire and use information [48]. Since the working memory is vulnerable to overloading, two types of adverse cognitive load exist: intrinsic and extraneous [49]. The intrinsic cognitive load is related to the complexity of the visual information; it is more difficult to process complex information and this results in a higher cognitive load. The extraneous cognitive load will increase due to distractions or a poor representation of information [50]. After synthesizing the above two aspects, map elements have to be easily understood and interpreted for map use in a crisis situation [51].
3.2. Stressors
Based on the stressor theory of Hammond, we analyzed the stressors that affect the users’ map cognition under emergencies. The exogenous and endogenous disruptions that users must deal with when reading maps are listed as Table 1.
Exogenous disruptions mainly include emergency events, losses, major hazard sources, significant hidden dangers, and unfavorable environmental conditions. In the Emergency Response Law of the People’s Republic of China, emergency events are divided into four categories: natural disasters, accidental disasters, public health events, and social security events [52]. Losses refer to a significant amount of damage to life, property, resources, and the environment due to these events, such as the amount of deaths, injuries, and property damage. Major hazard sources refer to the sites or facilities that produce, transport, use, or store hazardous substances for a long time or temporarily, and where the quantity of hazardous substances is equal to or exceeds a critical quantity [53]. Significant hidden danger is a hidden dangerous factor which may cause severe casualties and substantial economic losses. Unfavorable environmental conditions refer to severe external environmental conditions, such as cold weather, snowy ground, or slippery roads. As a part of objective reality, exogenous disruptions exert detrimental effects on the users’ map cognition.
Endogenous disruptions mainly include ineffective maps, emergency tasks, psychological constraints on emergency management, and the user’s negative background. The users’ cognitive level is affected by the map itself. The lack of cartographic symbols for communication in crisis situations and visually overloaded maps reduce legibility and make orientation and understanding essential crisis information difficult [5]. Successful decision making during emergency situations depends on the availability and relevancy of information, presented in the right time and in an understandable way [54]. Emergency tasks refer to plans and schemes implemented for emergency rescue and loss reduction. Emergency tasks must be performed quickly, accurately, and effectively. The impact of emergency tasks on map cognition is mainly reflected in their complexity and time urgency. Psychological constraints on emergency management refer to the user’s highly intense psychological status, usually manifested as excitement, anxiety, fear, or even mental conflict. Such a negative mental status directly affects the user’s ability for map cognition. The user’s background mainly involves age, spatial abilities, expertise [55], prior knowledge, education level, and cognitive style. Some studies have found that a user’s background has different effects on visual cognition. People’s reasoning, working memory, and perceptual speed decline with increasing age [56]. Spatial abilities affect performance, as well as memory, especially in spatial tasks [57]. Prior knowledge in a certain field can significantly improve their visual searching ability [58]. In addition, individual differences in human cognitive style affect user performance [59]. They can affect work with a map, at least in the subprocesses [60]. Therefore, the user’s negative background, such as older age, poor map literacy, less emergency experience, low education level, or inappropriate cognitive style, can hamper their map cognition ability to some extent.
3.3. Cognitive Fit in Spatial Information Supply–Demand Matching
In rapid emergency responses, the spatial information required by users must be transmitted quickly and accurately by cartographers through crisis maps. From the users’ viewpoint, their demands are the reliable obtainment of spatial information they need from the maps. From the cartographers’ perspective, they aim to transmit the most valuable geospatial information in the most suitable presentation to users by fully considering their stressors. Fast information matching occurs between demand and supply, which involves crisis maps as the carrier. The matching is driven by emergency events and users’ spatial information needs. The matching goal is the users’ final efficient execution of tasks through an accurate information obtainment in the shortest time.
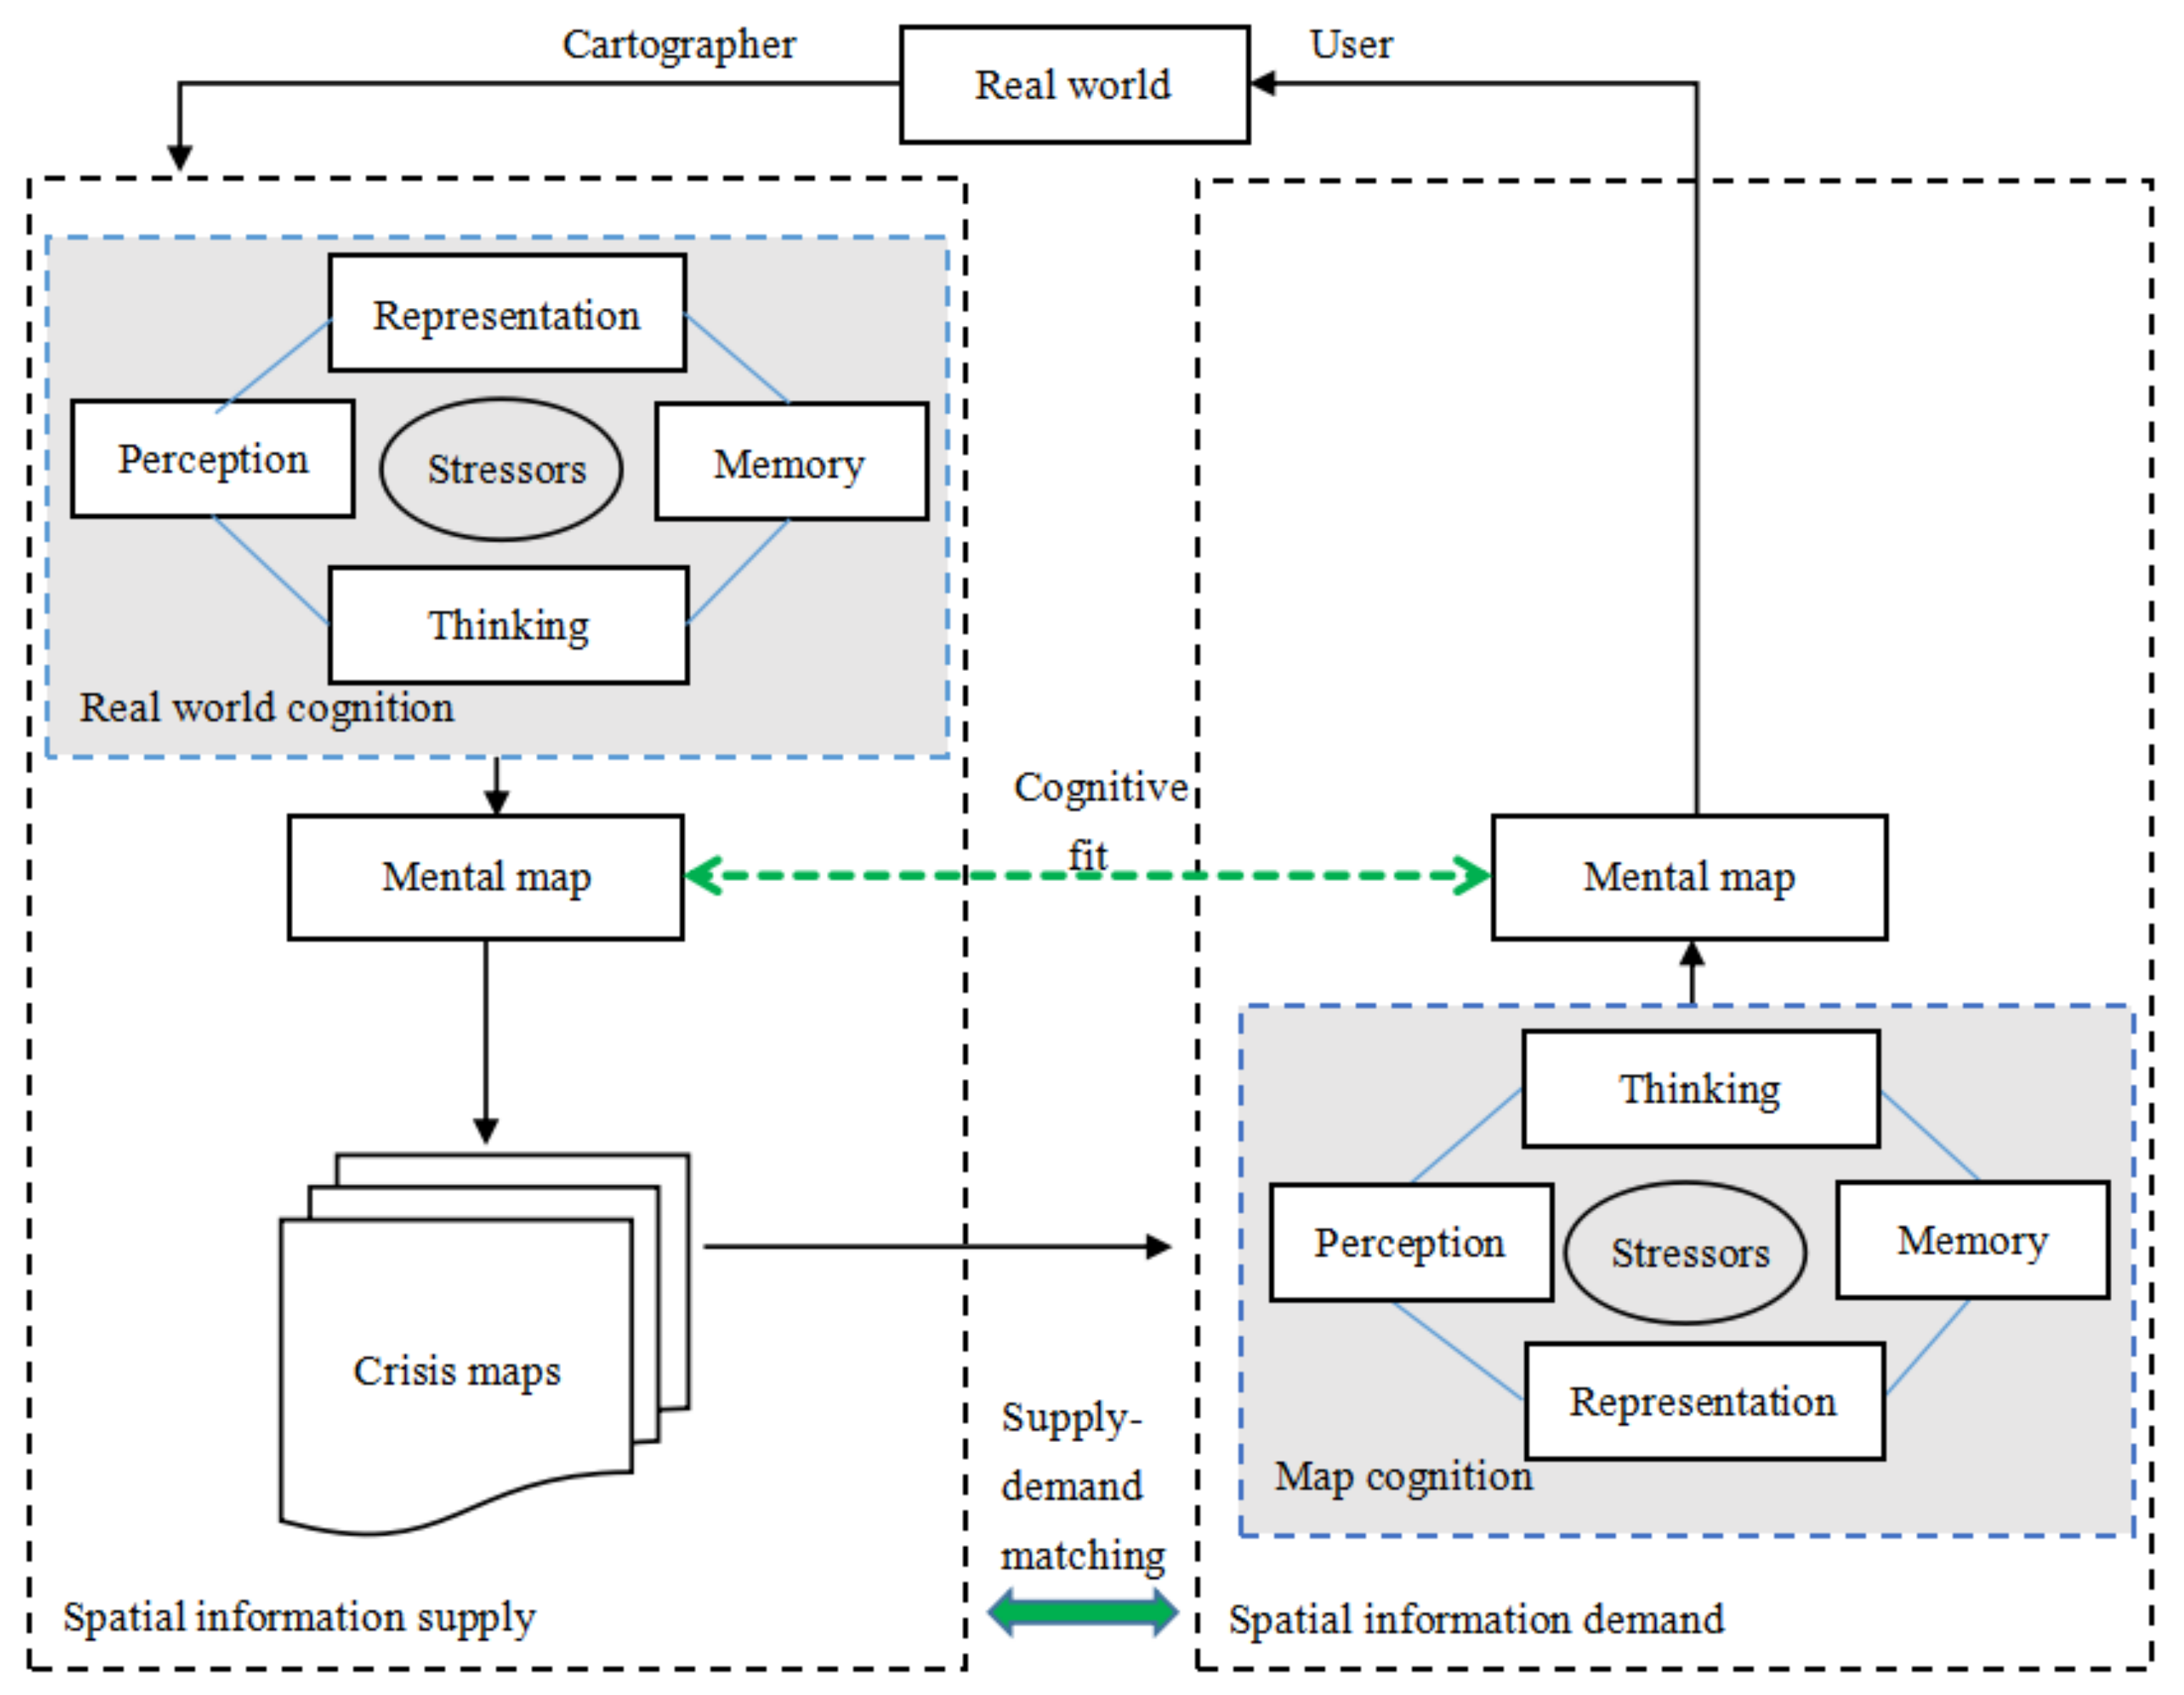
Supply–demand matching is based on two types of spatial cognition: real world cognition for cartographers, and map cognition for users. These two types of spatial cognition are related and facilitate each other, constituting a complete process of geospatial cognition. The subject of real-world cognition is cartographers. After they generate a mental map by real-world cognition, they produce crisis maps in an understandable way for the users. On the users’ side, they obtain spatial information through the development of a mental map during map cognition. The process of spatial cognition and information matching is shown in Figure 1.
Building a mental map from a map is more difficult for the user than for cartographers, who map from the real world [61]. If cartographers completely consider the stressors, their understanding of the real world will become more pertinent and effective. They will form more detailed, specific, and targeted mental maps to guide their map design. This is helpful for users to build their mental maps. As cartographers fully consider stressors, users will form a more accurate mental map, which is similar to the cartographers’ after their map cognition. Furthermore, the mental map will allow them a better recognition of the real world they are facing. This shows that efficient supply–demand matching depends on the similarity of the mental maps between cartographers and users. According to the theory of cognitive fit, the similarity between two types of mental maps can be regarded as the degree of cognitive fit of cartographers and users. The cognitive fit theory suggests that a problem-solving task and the problem representation of that task influence the effectiveness of the problem-solving process [62]. The higher the cognitive fit, the more the usability and readability of the crisis map is enhanced. In other words, the more similar a users’ mental map is to the cartographers’, the more supply–demand matching it will achieve and the less map reading time will be required by the users.
4. Crisis Map Visual Cognition
In contrary to analogue maps, where the production time leads to universality and maximal information saturation, nowadays cartographers should make maps for users with an appropriate amount of information in emergency [63]. In order to facilitate users in obtaining spatial information in the shortest time, it is important for cartographers to design a map that is most conducive to efficient human visual processing. Visual information is transmitted and analyzed along the visual pathway between specific brain structures in the map cognition process. Therefore, it is advantageous to understand the cognitive processes and the underlying functions of visual brain areas in order for cartographers to design cognitively adequate geovisualizations [44]. They can control the information flow using cartographic techniques, to attract users’ visual attention and thus improve the users’ map cognition by focusing their limited visual resources only on the spatial information they need urgently.
4.1. Crisis Map Visual Cognition Process
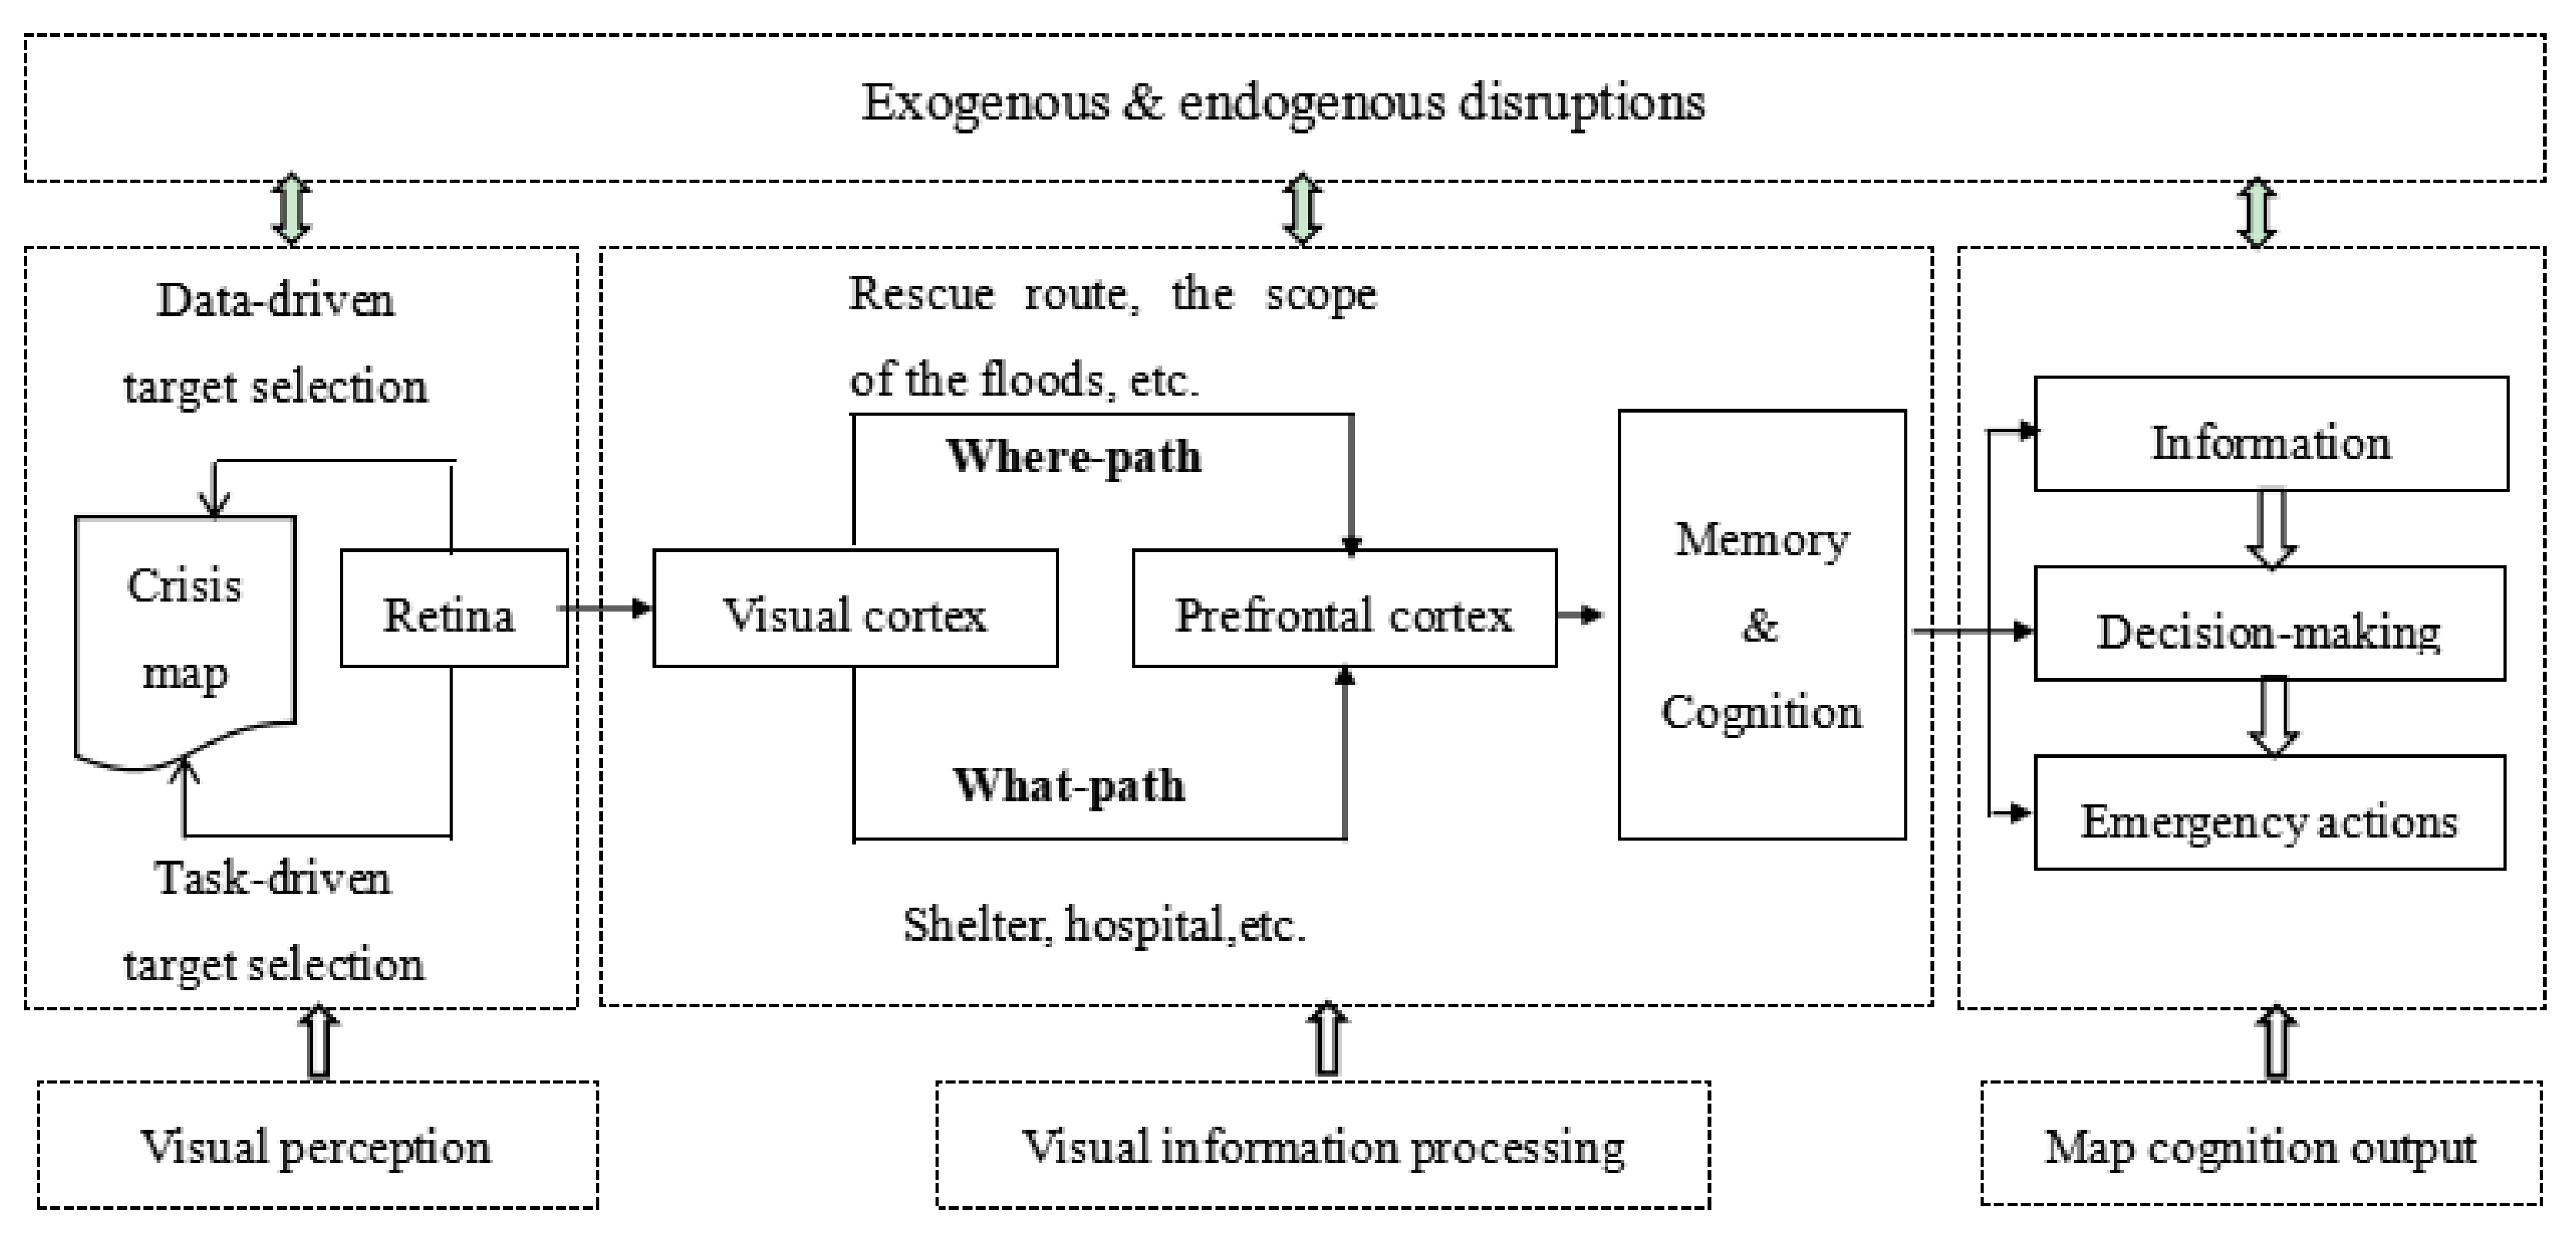
Crisis map visual cognition can be divided into three steps: visual perception, visual information processing, and output of the cognitive outcome (Figure 2). Exogenous and endogenous disruptions persist throughout the cognition.
4.1.1. Visual Perception
Visual perception of crisis maps is mainly realized by the human visual attention mechanism, which can be divided into two processes, i.e., “bottom-up” and “top-down”, coexisting in the human brain [64]. During the bottom-up process, attention is attracted exogenously towards stimuli of high physical salience [65]. This process is data-driven selective attention. During the top-down process, attention is directed endogenously to favor the processing of features, objects, or spatial locations that are associated with a task goal, reward, or potential danger [66]. This process is emergency task-driven selective attention. It is evident that emphasizing the task-relevant features in a salient way can improve both “bottom-up” and “top-down” visual perception.
4.1.2. Visual Information Processing
Crisis map information is first transmitted to the human retina through the above two forms of visual perception. Then, visual information enters the primary visual cortex. From there, visual information progresses along two parallel hierarchical streams: the ventral stream and the dorsal stream. The ventral stream, sometimes called the “what pathway”, is mainly concerned with the recognition and identification of visual stimuli [40], such as shelters, hospitals, etc. The dorsal stream, sometimes called the “where pathway”, is primarily concerned with the spatial properties of visual information, such as the rescue path, the scope of the floods, etc.
Studies have shown that map visual variables stimulate the what and where pathways selectively [44,67]. For example, size, color, and transparency can stimulate both the what and where pathways at the same time, while shape only works on the what pathway [44]. These findings provide a basis for cartographers to utilize some visual variables that act on the what and where pathways simultaneously, to attract the users’ visual attention rapidly.
4.1.3. Output of Cognition
After the above processing, the map visual information is incorporated in the prefrontal cortex and matched with the user’s existing domain knowledge. Finally, map cognitive results are output in the form of information, decision-making, and emergency action. Information refers to the desired spatial information the user obtained from a map, such as the effects and distribution of disasters, population transfer routes, and traffic disruptions. Decision-making refers to the user’s selection of the most suitable solution from all possible schemes in the current emergency situations, after weighing up decision alternatives. Emergency action refers to the behaviors of the user in crisis response, such as transfer of victims, material distribution, and medical rescue. Obviously, among the outputs of map cognition, information is the basis for decision-making and emergency actions.
5. Crisis Map Design Principles and Method
5.1. Perceptual Template Model
The PTM is used to describe the internal signal processing mechanism of the visual system. It is a theoretical and empirical framework for directly assessing the mechanisms of attention by systematically manipulating the amount and/or characteristics of the external noise added to the signal stimuli and measuring the modulations of perceptual discriminability (signal and noise levels) in the cognitive processes [68]. The PTM includes five components: a perceptual template with certain tuning characteristics, a nonlinear transducer function, multiplicative internal noise, independent additive internal noise, and a decision process. Selective attention can improve task performance by interacting with a perceptual template [69]. According to the PTM theory, selective attention can be improved by three mechanisms: stimulus enhancement, external noise exclusion, and internal noise reduction. These mechanisms are similar to three aspects of signal processing: amplification, improved filtering, and modified gain control.
5.2. Crisis Map Design Principles Based on PTM
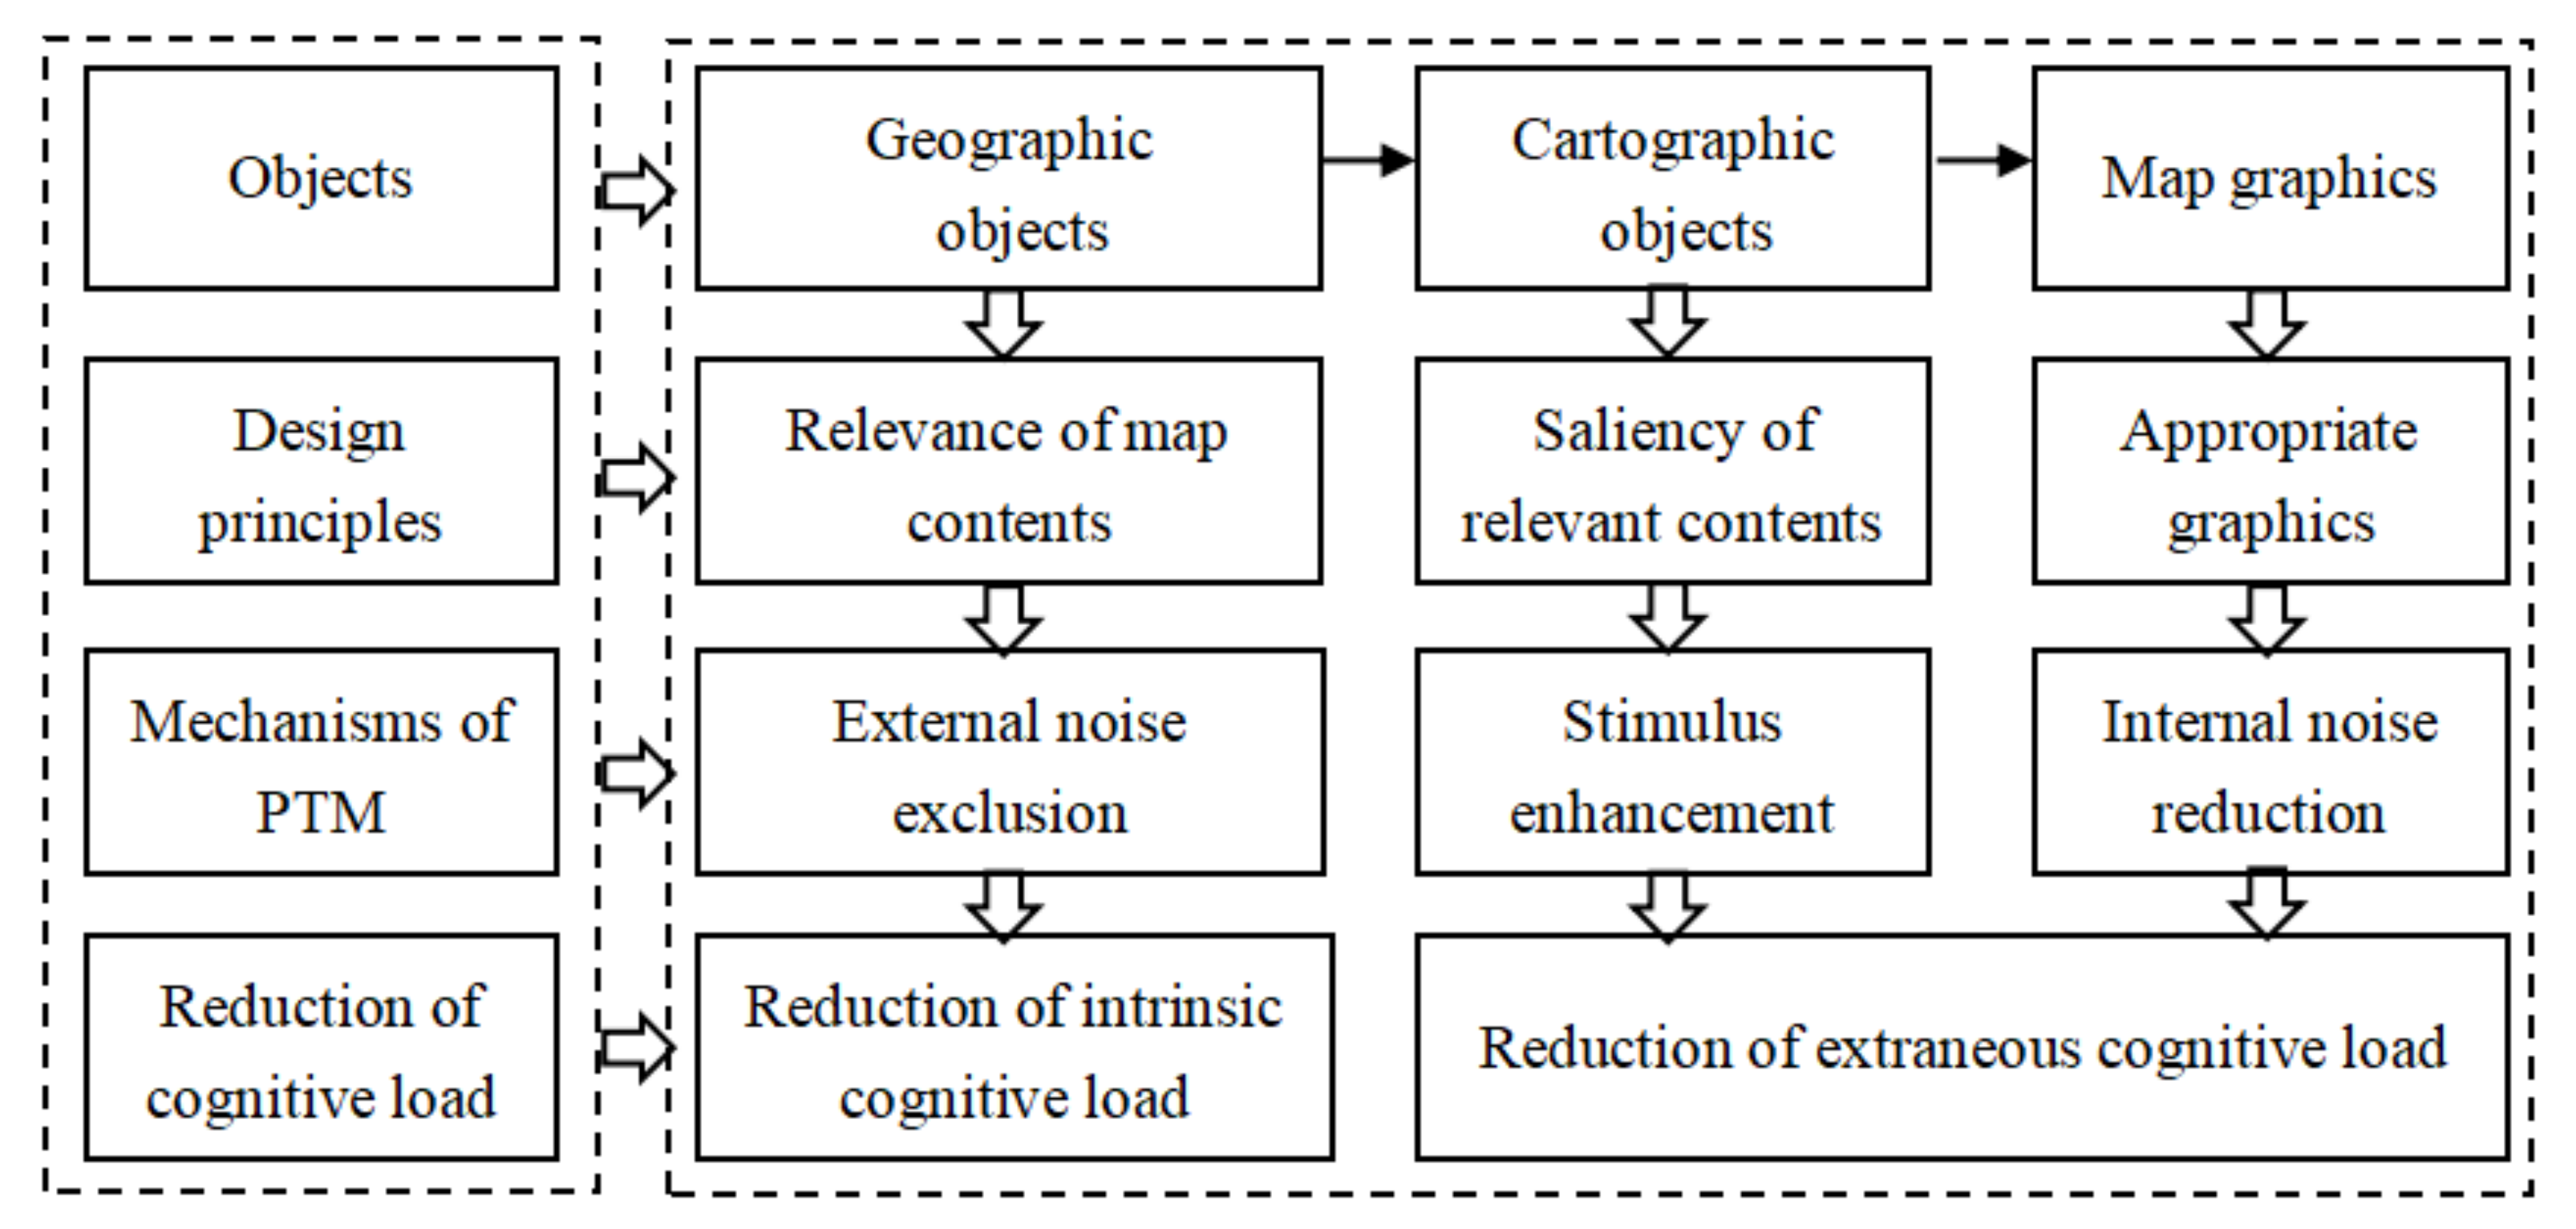
We can categorize objects related to a crisis map into three classes: geographic objects for risk data [70], cartographic objects for geographic objects that are portrayed on the map [70,71], and map graphics describing cartographic objects. To ensure a good cognitive fit between cartographers and users and to minimize adverse cognitive loads, we established the following crisis map design principles, based on the above attention mechanisms: (1) map contents should be thematically relevant; (2) relevant contents should be visually salient; and (3) crisis map graphics should be appropriate. The crisis map design principles and the fundamental mechanisms they are based on are illustrated in Figure 3.
5.2.1. Relevance of Map Contents
As the complexity of emergency maps arises from the large amount of information they hold [70] and as the users search for visual information related to their tasks [72], the cartographers should depict the relevant geographic objects and omit irrelevant ones. The relevance of map contents is the key basis for selecting geographic objects that need to be expressed on the map. This rule corresponds to the mechanism of external noise exclusion in PTM. This mechanism filters external noise in stimulus signals, which focuses the selective attention on specific spatial regions or stimulus features. External noise exclusion only improves the performance at high external noise levels [73]. After the occurrence of a disaster, cartographers are faced with large amounts of spatial, thematic, and temporal information, which can be considered as a high external noise level. The selection of geographic objects is necessary and can be realized with the measure of relevance to disaster semantics (i.e., task relevance) and spatial semantics (i.e., spatial relevance). Cartographers select the relevant geographic objects, from coarse to fine, through a step-by-step analysis. The selection can effectively reduce the users’ intrinsic cognitive load and greatly promote their top-down map cognition. The most valuable geospatial information that best fits the users’ needs in the current situation is transmitted from the cartographers to the users through information filtration based on the relevance of map contents. Usually, the amount of the cartographic objects is reduced on a small-scale map, according to the relevance of geographic objects, their real-world counterparts, and vice versa.
- Task relevance
Task relevance embodies the degree of satisfaction between geographic objects and user tasks. It is an effective method for cartographers to quantify map contents. Geographic objects can be coarsely assessed by the logical operations: “relevant” and “irrelevant”. Taking a medical rescue map as an example, the geographic objects with medical and emergency rescue attributes are relevant, such as hospitals and temporary medical rescue places. Relevant geographic objects can be finely categorized into two groups, according to their task relevance: high-demand and medium-demand geographic objects. High-demand geographic objects are closely related to the users’ tasks and need to be represented with cartographic objects in the most detailed manner. Sometimes, high-demand geographic objects can be further subdivided into several distinct levels, because of the complexity of the task: first-level geographic objects, second-level geographic objects, etc. While the medium-demand geographic objects have less task relevance, they still have a certain relationship with the users’ tasks. Although their corresponding cartographic objects are not those most directly used by the users, they often play an auxiliary role in emergency situations.
- Spatial relevance
In addition to task relevance, geographic objects need to be evaluated by spatial relevance. Spatial relevance refers to the degree of spatial alienation between geographic objects and tasks, which is usually expressed by distance. The closer geographic objects are, the greater the spatial relevance they have. Still taking the medical rescue map as an example, closer hospitals or temporary medical rescue locations have a better availability for medical rescue tasks.
5.2.2. Saliency of Relevant Map Contents
Cartographic objects are used to represent geographic objects on maps. Their expression is determined by the relevance of geographic objects. If cartographers use map visual variables reasonably, making the relevant information more salient, with the irrelevant information being removed or diluted, the efficiency of the users’ visual searching and decision-making will be improved [72]. Geographic objects with high relevance and their corresponding cartographic objects should have high visual saliency, but should not be too salient, to avoid the loss of the more global geographic information required for spatial reference and successful orientation and navigation in the physical space [44]. This rule reflects the mechanism of stimulus enhancement in PTM. External noise exclusion filters irrelevant contents to reduce external noise. Stimulus enhancement can improve performance only when the external noise level is low [73]. As stimulus enhancement underlies the performance improvement at the attended location, the thematically relevant contents should be conveyed with cartographic objects in a visually salient manner. The saliency of the relevant content allows users to locate important information on the map more efficiently and rapidly. Moreover, in this way, users’ attention can be directed to the critical information, and the users’ extraneous cognitive load is reduced.
As discussed in Section 4, some visual variables can guide human visual attention and promote the decoding of map information. Therefore, different visual variables and their combinations can be utilized to express the relevant geographic objects, by enhancing the visuals of their corresponding cartographic objects.
5.2.3. Appropriate Map Graphics
Studies have shown that existing crisis maps are not always readable, because of graphic choices which are not always relevant [5]. Thus, the portrayal of cartographic objects with appropriate map graphics is important. This rule is based on the mechanism of internal noise reduction in PTM. Internal multiplicative noise reduction improves the performance at all levels of external noise. Map graphics is a system of symbols consisting of map symbols and of mutual relationships between symbols (syntactic dimension), the relationship of symbols according to the presented objects (semantic dimension), and the relationship of a user with the symbols (pragmatic dimension) [74]. Map graphics include basic geometric and graphic elements (point, line, and area) and cartographic symbols primarily used to depict the position and quality of objects [75]. Map graphics are especially significant for communication in emergencies, because the quick and correct interpretation of maps can safeguard lives and property. Inappropriate graphics reduce the legibility of maps and increase users’ extraneous cognitive loads, because they fail to portray cartographic objects clearly and effectively.
Map graphics should meet various demands. Frangeö laid down the conditions that should be fulfilled to meet these demands [76]. To decrease the users’ cognitive overheads, cartographers should refer to these conditions to ensure the appropriate usage of map graphics when crisis maps are designed.
5.3. Crisis Map Design Method
We followed the above-mentioned design principles by adopting the design method proposed in [77]. The design includes two major visual layers: the spatial reference that offers the context for the focal information is in the visual background (base map), while the thematic information is in the visual foreground. The contrast of the visual foreground and background should be increased, and the visual hierarchy of related and non-related geographic objects should be highlighted to accelerate visual information processing.
5.3.1. Base Map
The base map also shows the relationship between emergency thematic information and the general geographic environment, besides the function of orientation and positioning. The selection of geographic objects to be depicted with cartographic objects on the base map should take their relevance into account. We should not excessively ignore the base map contents, because oversimplification will result in a gap between thematic information and the base map. Similarly, we should not select too much content, because overloading will result in the insufficient prominence of the emergency thematic information. For example, the base map of natural disaster maps generally contains geomorphology, but public health crisis maps do not. This stems from the fact that natural disasters often destroy landforms, while public health emergencies have no relationship with landform, so it can be ignored [17]. Factors affecting content selection include scale and map demonstration methods, except for the relevance of geographic objects. The base map should be designed in the least salient manner, with appropriate map graphics to produce a continuum for the users’ visual searching efficiency.
5.3.2. Thematic Information Visual Layer
The thematic information visual layer is the primary information source for map users. Geographic objects with high relevance should be encoded using cartographic objects in a salient manner to capture users’ visual attention quickly and make their attention moderately persistent. We choose the size and color to improve the visual saliency of cartographic objects, and increase the contrast between the base map and the thematic information visual layer with transparency, because the above three visual variables can stimulate both the what and where pathways simultaneously. In addition, the selected color should be consistent with its symbolism [78]; for example, red should represent danger, whereas green safety.
6. Crisis Map Design and Evaluation
6.1. Crisis Map Design Case
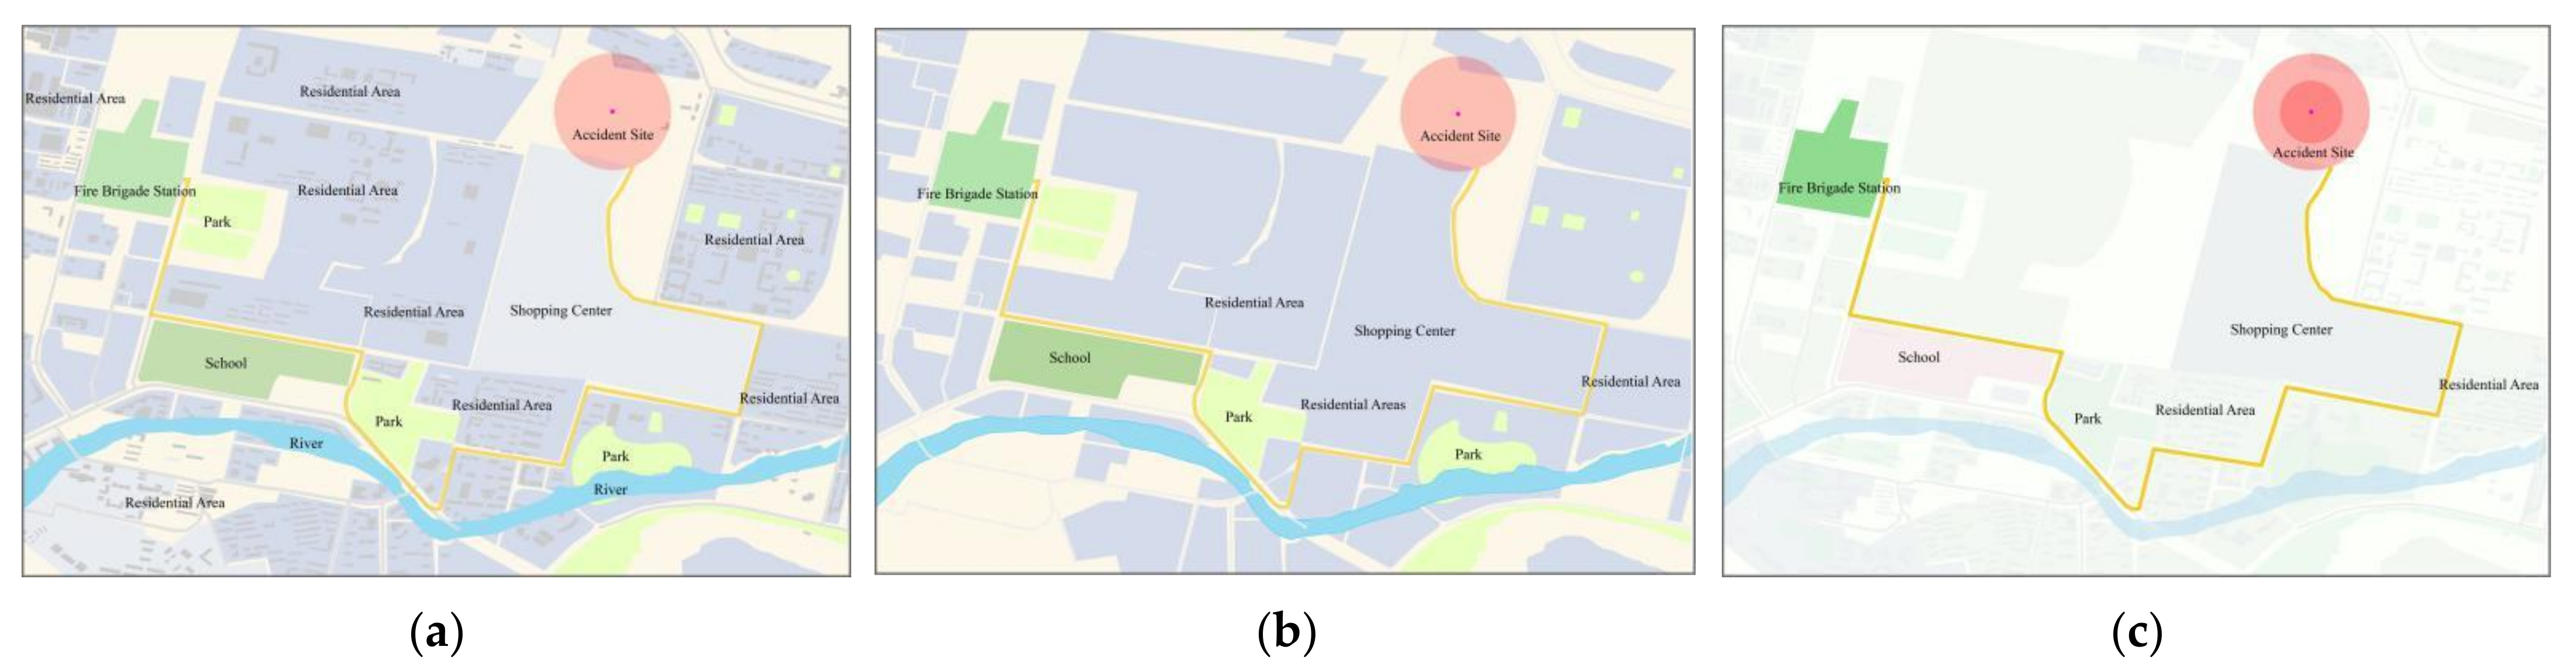
We used the above-mentioned method to produce a fire emergency rescue road map, which is a spatial information backup for fire crews after fire and traffic accidents occur. The geographic objects depicted with cartographic objects on the base map include schools, shopping centers, parks, rivers, residential areas, etc. Their corresponding cartographic objects as an auxiliary when reading maps should not dominate the visualization, and their visual differences should not be very large. The thematic information visual layer includes the route, fire brigade station, and accident site, etc. These geographic objects should be represented with salient cartographic objects to ensure certain visual differences between the background and foreground. We produced another two maps on the same theme to verify the effectiveness of the fire emergency rescue road map design. Figure 4a shows a non-relevance filtered and non-saliency map. Figure 4b is a relevance filtered but non-saliency map. Figure 4c is a relevance filtered and saliency map. The three maps are shown in Figure 4.
6.2. Evaluation of the Map
We used two methods to test the design of the three maps. The first was Itti’s visual saliency model, aiming at the evaluation of bottom-up map cognition [40]. The second was a map reaction time experiment, targeting the evaluation of top-down map cognition.
6.2.1. Model Based Evaluation
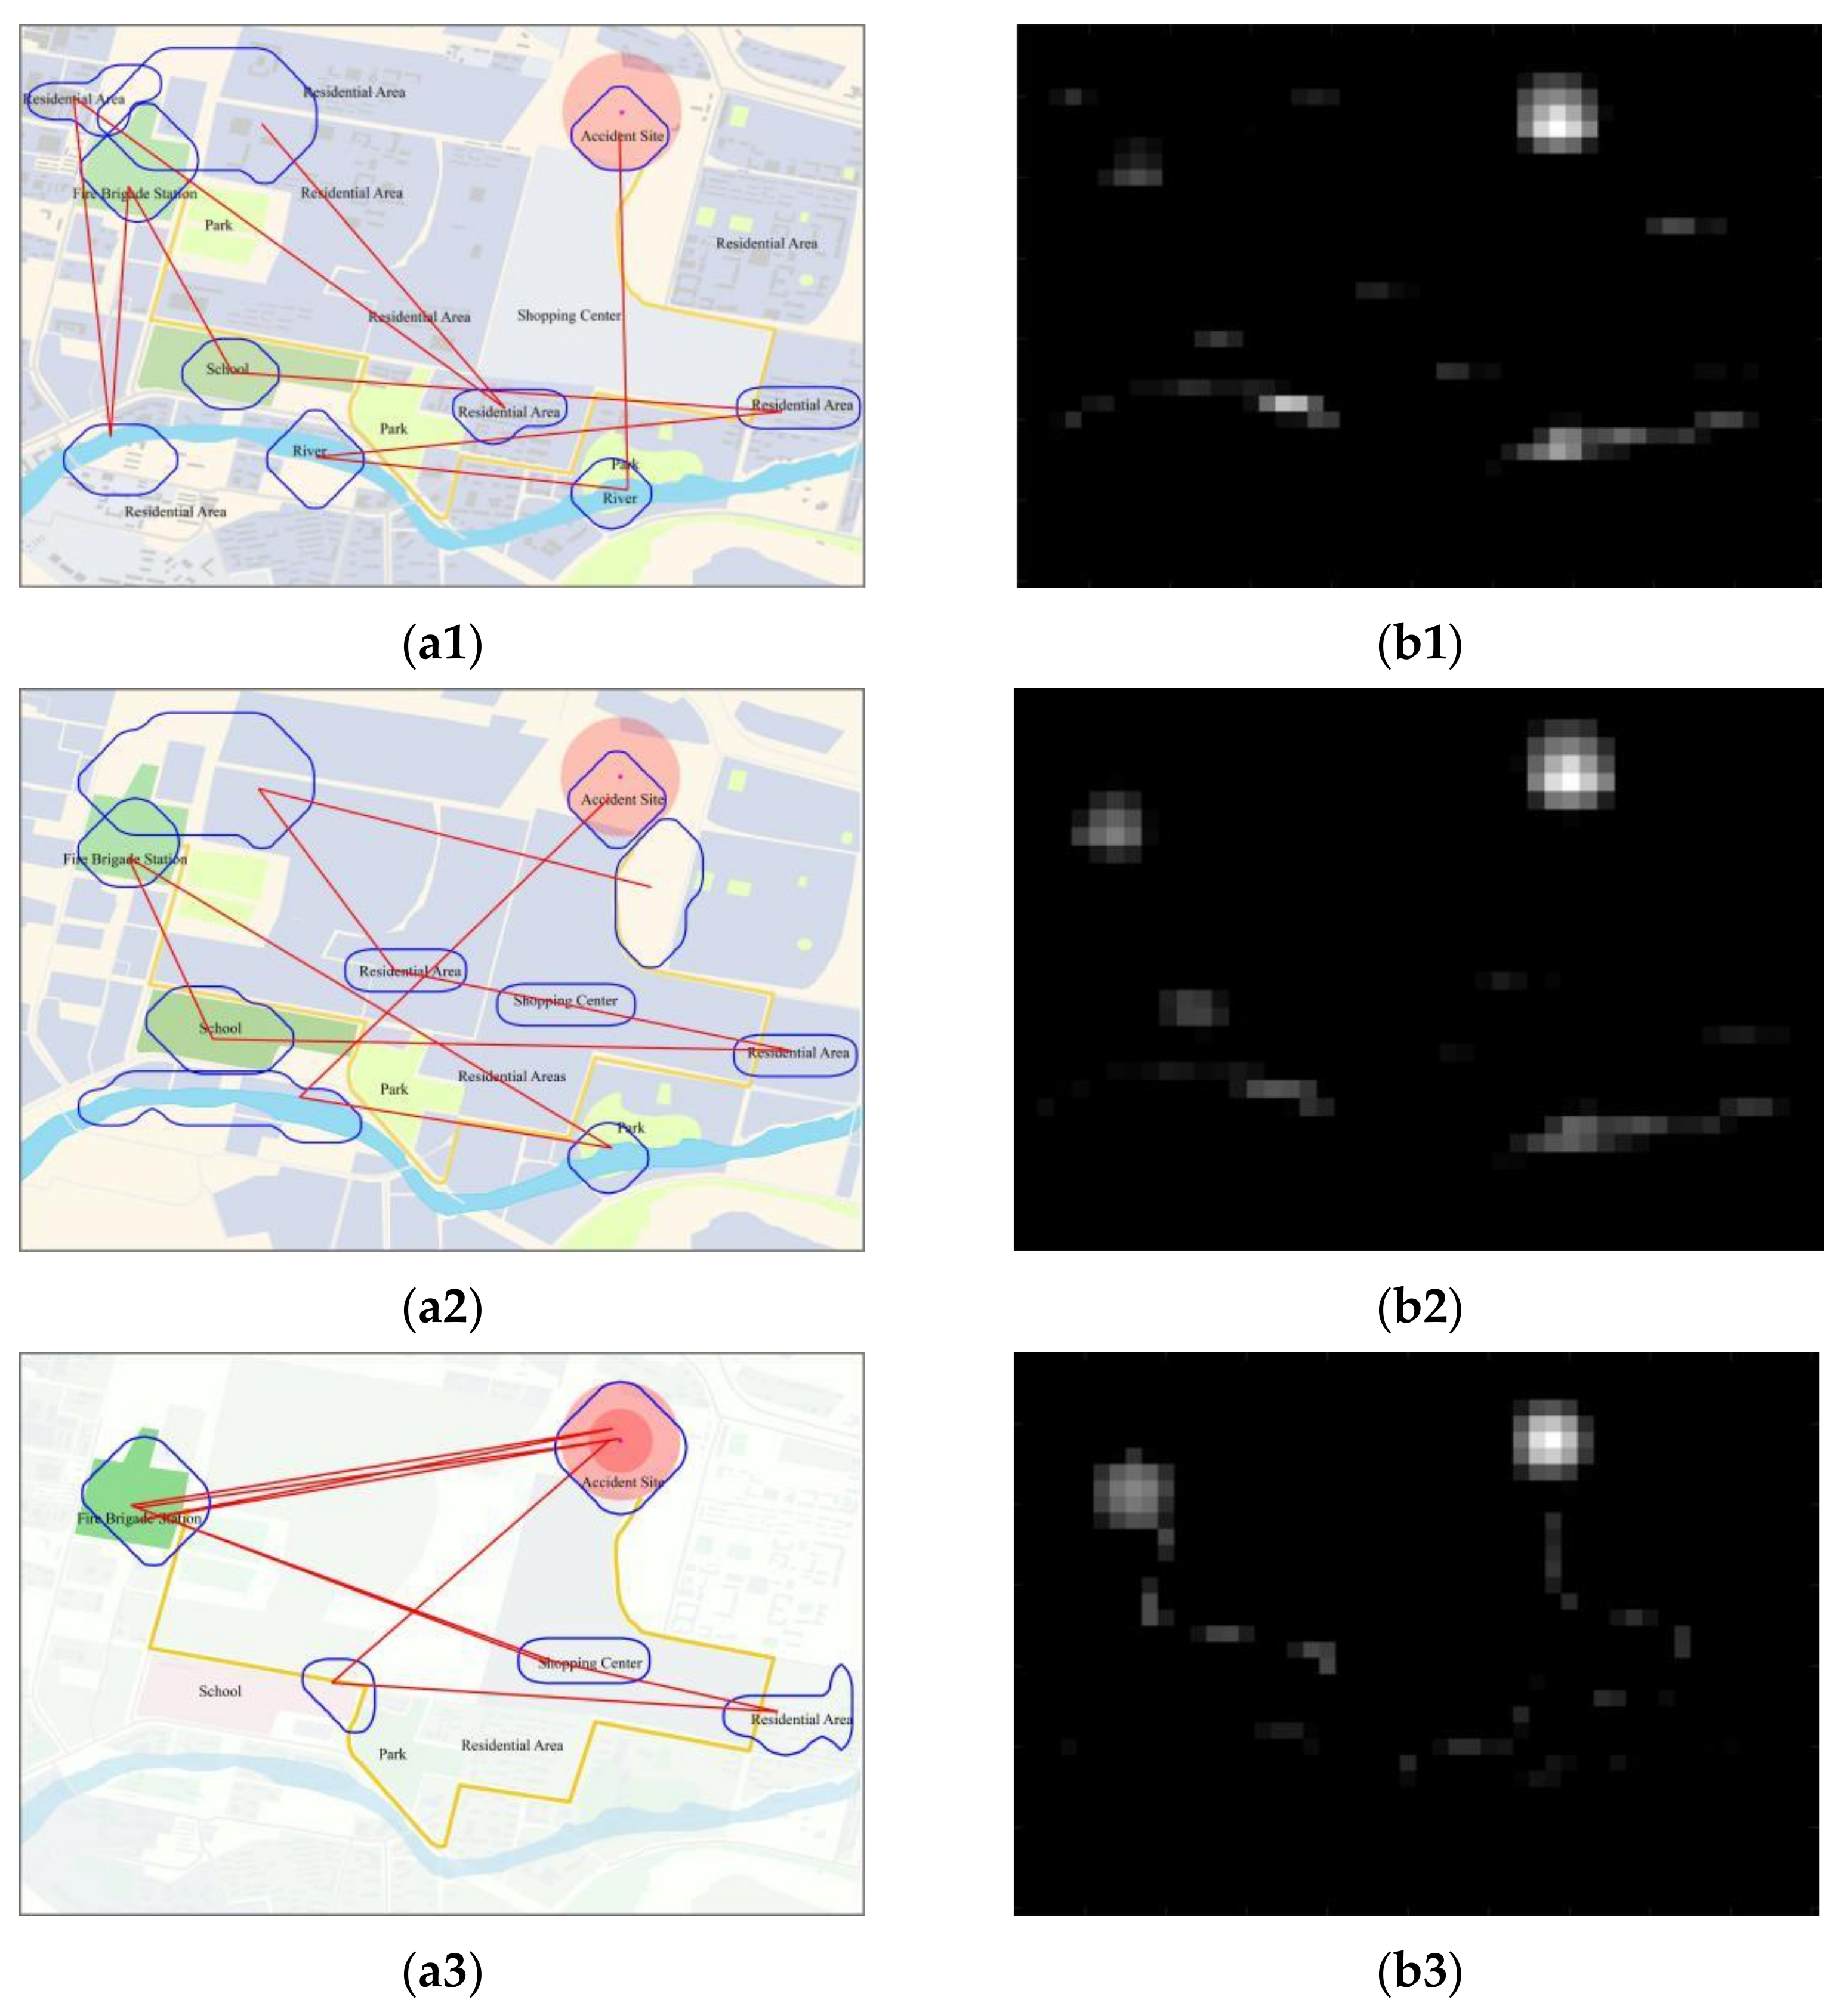
Itti’s visual saliency model is bottom-up guided. It simulates users’ attention focus and visual conversion when they are handling images. The model can not only predict users’ gaze paths and attention fixation positions, but also compute their number of visual conversions and reading time. An attention-based map that indicates the most salient regions can be generated from the model. Figure 5 shows the results calculated with the model for the three maps in Figure 4. The areas enclosed by blue lines in Figure 5a1–a3 represent eye fixation positions. The red lines are the predictions of the users’ visual scan paths made by the model. Irregular faculae in the attention-based maps, shown in Figure 5b1–b3, denote the most salient regions in the corresponding maps.
For the map in Figure 4a, information was not relevant filtered and was not visualized in a salient manner. The scan paths, shown in Figure 5a1, not only pass through the cartographic objects related to the users’ task, such as the accident site and the fire brigade station, but also the unrelated objects, such as rivers, parks, schools, and residential areas. The salient area, shown in Figure 5b1, shows some uncorrelated objects falling in the salient areas, and they occupy a part of the users’ attention and increase the map cognitive load.
Figure 4b is the relevance filtered but non-saliency map. The scan paths, shown in Figure 5a2, pass through the relevant objects, such as the accident site and the fire brigade station, but the scan path is spread throughout the map. Similarly, the saliency faculae in Figure 5b2 cover a big area, which indicates the low efficiency and high time requirement for reading the map.
For the map in Figure 4c, the information was relevance filtered and visualized in a salient way. The scan paths completely pass through the most relevant cartographic objects, as shown in Figure 5a3. This suggests that attention is attracted by the most relevant objects when reading the map. The saliency area calculated by the model, shown in Figure 5b3, coincides with the location of cartographic objects in the thematic information visual layer, which indicates that the relevant information has a higher saliency and can capture the user’s visual attention at the first instance.
The Itti’s visual saliency model can also calculate the cumulative query time of cartographic objects and visual conversions by assuming users are reading the maps, as shown in Table 2. The longer the cumulative time, the higher the time cost for map reading. The more the visual conversions, the higher the efficiency in capturing attention. Table 2 shows that (1) the model cannot detect the route in the maps of Figure 4a,b, so their visual conversions are 0. (2) The query time of the cartographic objects in the thematic information layer of the map in Figure 4c was generally shorter than that of Figure 4a,b. (3) The cartographic objects in the map thematic information layer in Figure 4c have more visual conversions than Figure 4a,b. (4) For the map in Figure 4c, the query time of cartographic objects in the thematic information layer was far less than that of the base map. (5) For the map in Figure 4c, the cartographic objects in the thematic information layer have more visual conversions than the base map.
The above experimental results show that our proposed crisis map design principles and methods can reduce the users’ query time for acquiring relevant information by catching their attention effectively in bottom-up map cognition.
6.2.2. Empirical Evaluation: The Reaction Time Experiment
Itti’s visual saliency model proves that the map in Figure 4c has a strong “bottom-up” visual guidance attribute. To evaluate the top-down map cognitive effect, we used E-Prime 2.0 software to design an experiment to obtain the reaction time for users reading the three maps in Figure 4.
- Participants
The study sample comprised 60 right-handed students (32 males, 28 females) of the Lanzhou Jiaotong University, aged 21–25 years (M = 24.81; SD = 0.89). They all reported normal or corrected-to-normal vision and no neurological diseases. Before the experiment, we assessed them with a state-trait anxiety inventory form (STAI-Form Y) [79], and the results showed that their scores were lower than the norm.
- Experimental materials
Two types of experimental materials were employed: the three maps mentioned above, and 240 s video clips about various historical disasters. The video clips were utilized to induce a state anxiety in the subjects, to simulate their psychological state in emergencies. Before the formal experiment, we recruited another 10 volunteers to validate the video clips for inducing a state of anxiety using E-Prime 2.0 software. The 10 volunteers were required to fill in the STAI-Form Y before and after watching video clips, and their scores were tested by the paired-sample t-test. The evaluation results of the video clips are presented in Table 3.
The results showed that there was a significant difference in the scores of the STAI-Form Y before and after the induction of a state of anxiety (t(9) = −22.25, p < 0.001), and the anxiety levels of the volunteers were higher than the norm (52.70 > 45.31), indicating the video clips are effective for anxiety arousal.
- Procedure
Sixty participants were divided into three groups (A, B, C), with twenty people in each, in which group A and group B both contained eleven males and nine females, and group C had ten males and ten females. The experiment was conducted under quiet and room temperature conditions, according to the paradigm of visual searching. Each participant was asked to wear headphones to complete the test independently on the computer. Before the experiment started, the procedure was explained to the participants. However, no information regarding the study purpose was given, to avoid a response bias [80,81]. In the experiment, the participants were asked to find the targets on the map according to the instruction and then make the corresponding key response. The computer automatically recorded the key response of the participants, and the time unit was milliseconds. To maximize the simulation of emergencies, the subjects were required to respond as quickly as possible, on the premise of ensuring the correct rate.
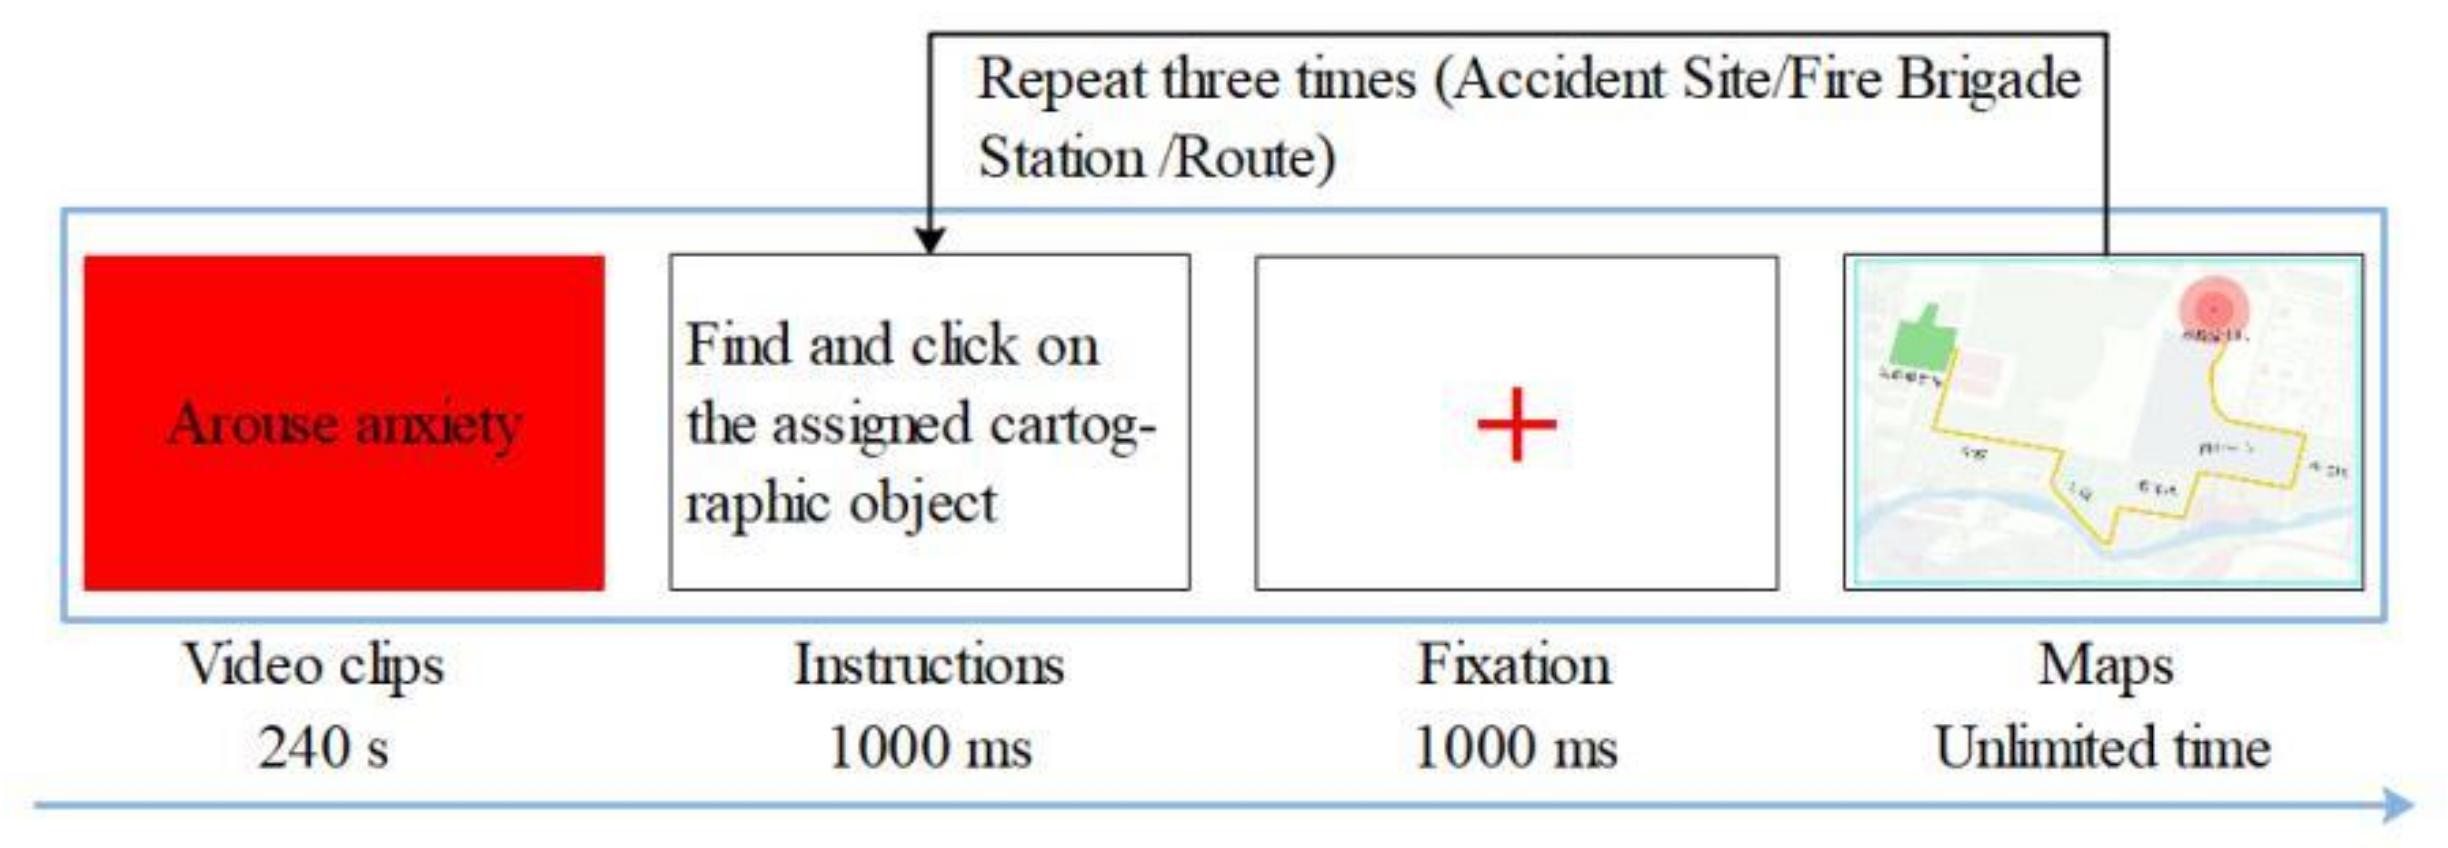
The experiment consisted of three trials. Each group carried out a trial on the map corresponding to its group name in Figure 4. First, the video clips were shown to each participant to arouse anxiety. Then, we assigned a visual target to each participant, told him/her to search for it on the map in the shortest time possible and click the target with the mouse. Next, we presented a 1000 ms fixation “+” for the participant. Finally, the participant began to search for the targets on the map, including the accident site, the fire brigade station, and the route, and we recorded the time from the map appearance to the mouse click. As the route is a line symbol, the participants were told to click on a position that was close to it as possible. Each participant searched three times and 20 participants in each group completed a trial. The experimental process followed by each participant is shown in Figure 6.
- Results
We obtained 180 mouse clicks after three trials. For each map, the mouse click accuracy and reaction time is listed in Table 4. The reaction times of the three groups were tested using a paired-sample t-test, and the results are presented in Table 5. The reaction time of 20 participants in group A, group B and group C is shown in Table A1, Table A2 and Table A3 in the Appendix A.
- (1)
- Compared with group A, groups B and C spent less time, because the Figure 4a map tested by group A did not filter the irrelevant contents, whereas the maps tested by group B (t(59) = 16.22, p < 0.001) and group C (t(59) = 18.83, p < 0.001) filtered the irrelevant contents. The reduction of distractors in the Figure 4b, c maps significantly improved the performance of the participants.
- (2)
- Compared with group B, group C (t(59) = 10.61, p < 0.001) took less time. Although the Figure 4b map filtered irrelevant contents, the geographic objects with high relevance had the same visual saliency with other objects, creating little difference between all cartographic objects on the map. The salient design provided the best performance in group C.
- (3)
- The fact that group C spent the least time and had the highest accuracy implied the effectiveness and feasibility of our map design principles and methods.
7. Conclusions
Crisis maps play a significant role in emergency management. In essence, crisis maps are a special type of thematic map. Their special purpose and environment make their visualization design different from ordinary thematic maps. We studied the design of crisis map from the perspective of map cognition. The stressors, namely the exogenous and endogenous disruptions in emergencies, affect users’ cognitive performance, while the cognitive load amplifies stress levels. Considering the stressors when designing a crisis map will promote the cognitive fit between the cartographers and the users during the spatial information supply–demand matching. To create more effective maps for use in emergencies, we established crisis map design principles and a methodology based on the visual attention mechanism and PTM. The outcomes of Itti’s visual saliency model and the reaction time experiment verified the efficiency of the principles and methods in both for bottom-up and top-down map cognition.
Recording eye-movement was also important to measure a user’s cognitive workload [82] and to investigate top-down driven activities. Swienty et al. utilized Itti’s model to pre-evaluate geovisualization designs, then used more precise eye movement recordings to confirm the validity of their approach [44]. In the future, we will also perform eye-movement experiments to perform further evaluation. In addition, we will design more types of crisis map to verify the effectiveness of our proposed principles.
Author Contributions
All the authors contributed to the crisis map design principles and this manuscript. Ping Du proposed the methodology and wrote the draft of the manuscript. Dingkai Li analyzed the stressors and performed the experiments. Tao Liu analyzed the results of evaluation. Liming Zhang, Xiaoxia Yang and Yikun Li guided the research and revised the manuscript. All authors have read and agreed to the published version of the manuscript.
Funding
This research was funded by the National Nature Science Foundation of China (No. 42061060, 41761088, and 41771444), Tianyou innovation team of Lanzhou Jiaotong University (TY202001)and LZJTU EP 201806.
Acknowledgments
The authors are grateful to the anonymous reviewers, whose comments and suggestions have helped us to improve the context and presentation of the article.
Conflicts of Interest
The authors declare no conflict of interest.
Appendix A

Table A1.
The Reaction Time of Group A (Figure 4a map).
Table A1.
The Reaction Time of Group A (Figure 4a map).
| Participants Number | Reaction Time of Searching Visual Targets (ms) | ||
|---|---|---|---|
| Fire Brigade Station | Route | Accident Site | |
| 1 | 1241 | 1316 | 1126 |
| 2 | 1239 | 1208 | 1266 |
| 3 | 1237 | 1341 | 1270 |
| 4 | 978 | 1125 | 1021 |
| 5 | 1297 | 1224 | 1084 |
| 6 | 1313 | 954 | 1274 |
| 7 | 1124 | 1213 | 1299 |
| 8 | 1231 | 1279 | 1219 |
| 9 | 1385 | 1399 | 1301 |
| 10 | 979 | 1246 | 1098 |
| 11 | 1293 | 1141 | 1222 |
| 12 | 1310 | 1421 | 1277 |
| 13 | 1115 | 1355 | 1220 |
| 14 | 1296 | 1287 | 1295 |
| 15 | 1430 | 1424 | 1223 |
| 16 | 2145 | 2012 | 1789 |
| 17 | 1281 | 1225 | 1282 |
| 18 | 946 | 959 | 1426 |
| 19 | 1311 | 1311 | 1303 |
| 20 | 989 | 1160 | 1025 |
Table A2.
The Reaction Time of Group B (Figure 4b map).
Table A2.
The Reaction Time of Group B (Figure 4b map).
| Participants Number | Reaction Time of Searching Visual Targets (ms) | ||
|---|---|---|---|
| Fire Brigade Station | Route | Accident Site | |
| 1 | 729 | 853 | 733 |
| 2 | 828 | 728 | 791 |
| 3 | 870 | 722 | 736 |
| 4 | 798 | 920 | 770 |
| 5 | 762 | 901 | 850 |
| 6 | 869 | 753 | 747 |
| 7 | 842 | 844 | 902 |
| 8 | 737 | 728 | 903 |
| 9 | 770 | 877 | 805 |
| 10 | 774 | 844 | 784 |
| 11 | 858 | 740 | 823 |
| 12 | 783 | 885 | 799 |
| 13 | 706 | 756 | 710 |
| 14 | 846 | 728 | 829 |
| 15 | 821 | 758 | 776 |
| 16 | 835 | 837 | 752 |
| 17 | 842 | 884 | 895 |
| 18 | 780 | 856 | 818 |
| 19 | 807 | 709 | 829 |
| 20 | 843 | 977 | 828 |
Table A3.
The Reaction Time of Group C (Figure 4c map).
Table A3.
The Reaction Time of Group C (Figure 4c map).
| Participants Number | Reaction Time of Searching Visual Targets (ms) | ||
|---|---|---|---|
| Fire Brigade Station | Route | Accident Site | |
| 1 | 661 | 755 | 758 |
| 2 | 624 | 652 | 509 |
| 3 | 756 | 532 | 723 |
| 4 | 693 | 687 | 687 |
| 5 | 804 | 698 | 783 |
| 6 | 637 | 637 | 424 |
| 7 | 633 | 689 | 451 |
| 8 | 534 | 654 | 690 |
| 9 | 603 | 699 | 671 |
| 10 | 651 | 620 | 678 |
| 11 | 740 | 734 | 810 |
| 12 | 783 | 816 | 804 |
| 13 | 549 | 731 | 640 |
| 14 | 558 | 550 | 737 |
| 15 | 784 | 693 | 753 |
| 16 | 711 | 606 | 520 |
| 17 | 654 | 746 | 762 |
| 18 | 815 | 673 | 709 |
| 19 | 617 | 665 | 699 |
| 20 | 693 | 763 | 772 |
References
- Raubal, M.; Panov, I. A Formal Model for Mobile Map Adaptation. In Location Based Services and TeleCartography II; Gartner, G., Rehrl, K., Eds.; Springer: Berlin/Heidelberg, Germany, 2009; pp. 11–34. [Google Scholar]
- Divjak, A.K.; Apo, A.; Pribievi, B. Cartographic Symbology for Crisis Mapping: A Comparative Study. ISPRS Int. J. Geo Inf. 2020, 9, 142. [Google Scholar] [CrossRef] [Green Version]
- Dymon, U.J. An analysis of emergency map symbology. Int. J. Emerg. Manag. 2003, 1, 227–237. [Google Scholar] [CrossRef]
- Kuveždić Divjak, A.; Lapaine, M. Crisis Maps—Observed Shortcomings and Recommendations for Improvement. ISPRS Int. J. Geo Inf. 2018, 7, 436. [Google Scholar] [CrossRef] [Green Version]
- Thompson, A.M.; Lindsay, J.M.; Leonard Graham, S. More Than Meets the Eye: Volcanic Hazard Map Design and Visual Communication. In Advs in Volcanology; Springer: Berlin/Heidelberg, Germany, 2017. [Google Scholar]
- Shirish, R. Spatial data to complement the use of space-based information for disaster management. In Geoinformation for Disaster and Risk Management, Examples and Best Practices; Bandrova, T., Zlatanova, S., Konecny, M., Eds.; Joint Board of Geospatial Information Societies (JB GIS) and United Nations Office for Outer Space Affairs (UNOOSA): Copenhagen, Denmark, 2010; pp. 19–24. ISBN 978-87-90907-88. [Google Scholar]
- Robinson, A.C.; Pezanowski, S.; Troedson, S.; Bianchetti, R.; Blanford, J.; Stevens, J.; Guidero, E.; Roth, R.E.; MacEachren, A.M. Symbol Store: Sharing map symbols for emergency management. Cartogr. Geogr. Inf. Sci. 2013, 40, 415–426. [Google Scholar] [CrossRef]
- Stachoň, Z.; Šašinka, Č.; Talhofer, V. Perceptions of Various Cartographic Representations Under Specific Conditions. In Geographic Information and Cartography for Risk and Crisis Management; Konecny, M., Zlatanova, S., Bandrova, T., Eds.; Springer: Berlin/Heidelberg, Germany, 2010; pp. 349–360. ISBN 978-3-642-03441-1. [Google Scholar]
- Bruijn, J.D.; Moel, H.D.; Jongman, B.; Wagemaker, J.; Aerts, J.C.J.H. TAGGS: Grouping Tweets to Improve Global Geoparsing for Disaster Response. J. Geovis. Spat. Anal. 2018, 2, 2. [Google Scholar] [CrossRef] [Green Version]
- Cheong, L.; Kinkeldey, C.; Burfurd, I.; Bleisch, S.; Duckham, M. Evaluating the impact of visualization of risk upon emergency route-planning. Int. J. Geogr. Inf. Sci. 2019, 34, 1022–1050. [Google Scholar] [CrossRef]
- Leonard, G.S.; Stewart, C.; Wilson, T.M.; Procter, J.N.; Scott, B.J.; Keys, H.J.; Jolly, G.E.; Wardman, J.B.; Cronin, S.J.; Mcbride, S.K. Integrating multidisciplinary science, modelling and impact data into evolving, syn-event volcanic hazard mapping and communication: A case study from the 2012 tongariro eruption crisis, New Zealand. J. Volcanol. Geotherm. Res. 2014, 286, 208–232. [Google Scholar] [CrossRef]
- Hu, Y.; Xing, X.; Ma, W.Y.; Chia, L.T.; Rajan, D. Salient Region Detection Using Weighted Feature Maps Based on the Human Visual Attention Model. In Advances in Multimedia Information, Proceedings of the PCM 2004, 5th Pacific Rim Conference on Multimedia, Tokyo, Japan, 30 November–3 December 2004; Springer: Berlin/Heidelberg, Germany, 2004. [Google Scholar]
- Liu, S.B.; Palen, L. The New Cartographers: Crisis Map Mashups and the Emergence of Neogeographic Practice. Cartogr. Geogr. Inf. Sci. 2010, 37, 69–90. [Google Scholar] [CrossRef] [Green Version]
- Dymon, U.J. The role of emergency mapping in disaster response. Columbia Law Rev. 1990, 3, 204–206. [Google Scholar]
- Sun, Y.; Du, D.; Zhou, Y. A Pattern-Plate-Based Technique for Thematic Mapping. Geomat. Inf. Sci. Wuhan Univ. 1998, 23, 171–174. [Google Scholar]
- Xu, L. The Design and Production of Emergency Thematic Map Based on Template Technology. Master’s Thesis, PLA Information Engineering University, Zhengzhou, China, 2012. [Google Scholar]
- Qian, L. Research on Emergency Map Rapid Mapping Method Based on Parametric Template. Master’s Thesis, PLA Information Engineering University, Zhengzhou, China, 2015. [Google Scholar]
- Zheng, S.; Li, Y.; Fang, X.; Qian, L. Emergency Thematic Map Design Based on the Eye Tracking Experiments and Template Technologies. J. Inf. Eng. Univ. 2016, 17, 106–111. [Google Scholar]
- Norheim-Hagtun, I.; Meier, P. Crowdsourcing for Crisis Mapping in Haiti. Innov. Technol. Gov. Glob. 2010, 5, 81–89. [Google Scholar] [CrossRef]
- Roche, S.; Propeck-Zimmermann, E.; Mericskay, B. GeoWeb and crisis management: Issues and perspectives of volunteered geographic information. Geojournal 2013, 78, 21–40. [Google Scholar] [CrossRef] [PubMed]
- Middleton, S.E.; Middleton, L.; Modafferi, S. Real-time crisis mapping of natural disasters using social media. IEEE Intell. Syst. 2014, 29, 9–17. [Google Scholar] [CrossRef] [Green Version]
- Alexander, D.E. Social media in disaster risk reduction and crisis management. Sci. Eng. Ethics 2014, 20, 717–733. [Google Scholar] [CrossRef]
- Boccardo, P. New perspectives in emergency mapping. Eur. J. Remote Sens. 2013, 46, 571–582. [Google Scholar] [CrossRef] [Green Version]
- Voigt, S.; Giulio-Tonolo, F.; Lyons, J.; Kučera, J.; Jones, B.; Schneiderhan, T.; Platzeck, G.; Kaku, K.; Hazarika, M.K.; Czaran, L.; et al. Global trends in satellite-based emergency mapping. Science 2016, 353, 247–252. [Google Scholar] [CrossRef]
- Chen, J.; Chen, L.; Liao, A.; Zhu, W. Photomap producing for wenchuan earthquake disaster emergency. J. Remote Sens. 2009, 13, 162–168. [Google Scholar]
- Kostelnick, J.C.; Hoeniges, L.C. Map Symbols for Crisis Mapping: Challenges and Prospects. Cartogr. J. 2018, 56, 59–72. [Google Scholar] [CrossRef]
- Jia, Y. Research on the Design of Public Safety Incident Emergency Symbol. Master’s Thesis, PLA Information Engineering University, Zhengzhou, China, 2010. [Google Scholar]
- Cao, L.; Liu, X. Designing and implement of icons and characters for the special topics of earthquake emergency rescues. Earthq. Res. Sichuan 2010, 2, 45–47. [Google Scholar]
- Li, X.; Li, Z.; Huang, M.; Dai, B. A preliminary research on symbol for earthquake disaster situation. J. Nat. Disasters 2010, 19, 147–154. [Google Scholar]
- Xu, J.; Xu, X.; Nie, G.; Hu, C. Earthquake emergency situation plotting technology based on GIS. Geomat. Inf. Science Wuhan Univ. 2011, 36, 66–70. [Google Scholar]
- Gao, J. Cartographic tetrahedron: Explanation of cartography in the digital era. Acta Geod. Cartogr. 2004, 33, 6–11. [Google Scholar]
- Yu, D. Design Theory, Method and Application of Thematic Atlas. Ph.D. Thesis, Wuhan Universiy, Wuhan, China, 2011. [Google Scholar]
- Zhang, B.; Zhu, J.; Wang, J. Research on Geo-spatial Cognitive Procession on Maps. J. Henan Univ. 2007, 37, 486–491. [Google Scholar]
- Chen, Y. Spatial Cognition Research on Electronic Maps. Prog. Geogr. 2001, 20 (Suppl. 1), 63–68. [Google Scholar]
- Zheng, S. Research on Personalized Map Cognition Mechanism. Acta Geod. Cartogr. 2016, 45, 1008. [Google Scholar]
- Du, P.; Liu, T.; Li, D.; Yang, X. Rapid mapping of emergency scenario and cartographic information transmission. Acta Geod. Cartogr. 2019, 48, 747–755. [Google Scholar]
- Yixuan, Z.; Xueyan, C.; Lei, Z.; Qin, T. How does gender affect indoor wayfinding under time pressure? Cartogr. Geogr. Inf. Sci. 2020, 47, 367–380. [Google Scholar]
- Jing, L.; Lijun, C.; Nan, L. Assessing the influence of repeated exposures and mental stress on human wayfinding performance in indoor environments using virtual reality technology. Adv. Eng. Inform. 2019, 39, 53–61. [Google Scholar]
- Hammond, K.R. Judgments Under Stress; Oxford University Press: New York, NY, USA, 2021. [Google Scholar]
- Itti, L.; Koch, C. Computational modelling of visual attention. Nat. Rev. Neurosci. 2001, 2, 194–203. [Google Scholar] [CrossRef] [PubMed] [Green Version]
- Lloyd, R.E. Attention on Maps. Cartogr. Perspect. 2005, 52, 28–57. [Google Scholar] [CrossRef]
- Fabrikant, S.I.; Hespanha, S.R.; Hegarty, M. Cognitively Inspired and Perceptually Salient Graphic Displays for Efficient Spatial Inference Making. Ann. Assoc. Am. Geogr. 2010, 100, 13–29. [Google Scholar] [CrossRef]
- Hegarty, M.; Canham, M.S.; Fabrikant, S.I. Thinking about the weather: How display salience and knowledge affect performance in a graphic inference task. J. Exp. Psychol. 2010, 36, 37–53. [Google Scholar] [CrossRef] [Green Version]
- Swienty, O.; Reichenbacher, T.; Reppermund, S.; Zihl, J. The Role of Relevance and Cognition in Attention-guiding Geovisualisation. Cartogr. J. 2008, 45, 227–238. [Google Scholar] [CrossRef]
- Hana, S.; Jaromir, K. Comparative Research of Visual Interpretation of Aerial Images and Topographic Maps for Unskilled Users: Searching for Objects Important for Decision-Making in Crisis Situations. ISPRS Int. J. Geo Inf. 2017, 6, 231. [Google Scholar]
- Angelidis, A.; Solis, E.; Lautenbach, F.; Willem, V.D.D.; Putman, P. I’m going to fail! Acute cognitive performance anxiety increases threat-interference and impairs WM performance. PLoS ONE 2019, 14, e0210824. [Google Scholar] [CrossRef] [PubMed] [Green Version]
- Braunstein-bercovitz, H. Does stress enhance or impair selective attention? the effects of stress and perceptual load on negative priming. Anxiety Stress Coping 2003, 16, 345–357. [Google Scholar] [CrossRef]
- Rick, L.B.; Robert, E.L. The Cognitive Load of Geographic Information. Prof. Geogr. 2006, 58, 209–220. [Google Scholar]
- Sweller, J. Cognitive load theory, learning difficulty, and instructional design. Learn. Instr. 1994, 4, 295–312. [Google Scholar] [CrossRef]
- Kristien, O.; Philippe, D.M.; Veerle, F.; Eva, V.A.; Frank, W. Interpreting maps through the eyes of expert and novice users. Int. J. Geogr. Inf. Sci. 2012, 26, 1773–1788. [Google Scholar]
- Akella, M.K. First Responders and Crisis Map Symbols: Clarifying Communication. Am. Cartogr. 2009, 36, 19–28. [Google Scholar] [CrossRef]
- The General Office of the NPC Standing Committee. Emergency Response Law of the People’s Republic of China; People’s Publishing House: Beijing, China, 2008. [Google Scholar]
- Identification of Major Hazard Installations for Hazardous Chemicals. Available online: http://c.gb688.cn/bzgk/gb/showGb?type=online&hcno=E976F49B263D7579CCABD419B1E40225 (accessed on 15 May 2021).
- Šašinka, Č.; Zdeněk, S.; Petr, K.; Tamm, S.; Matas, A.; Kukaňová, M. The Impact of Global/Local Bias on Task-Solving in Map-Related Tasks Employing Extrinsic and Intrinsic Visualization of Risk Uncertainty Maps. Cartogr. J. 2019, 56, 175–191. [Google Scholar] [CrossRef]
- Lokka, I.; Cöltekin, A. Simulating Navigation with Virtual 3D Geovisualization—A Focus on Memory Related Factors. In ISPRS Archives of the Photogrammetry, Remote Sensing and Spatial Information Sciences (Vol. XLI-B2); Halounová, L., Ed.; ISPRS: Prague, Czech Republic, 2016; pp. 671–673. [Google Scholar]
- Sharit, J.; Hernández, M.A.; Czaja, S.J.; Pirolli, P. Investigating the Roles of Knowledge and Cognitive Abilities in Older Adult Information Seeking on the Web. ACM Trans. Comput. Hum. Interact. 2008, 15, 3–17. [Google Scholar] [CrossRef]
- Miyake, A.; Friedman, N.P.; Rettinger, D.A.; Shah, P.; Hegarty, M. How are visuospatial working memory, executive functioning, and spatial abilities related? A latent-variable analysis. J. Exp. Psychol. Gen. 2001, 130, 621–640. [Google Scholar] [CrossRef] [PubMed]
- Matzen, L.E.; Haass, M.J.; Mcnamara, L.A.; Stevens-Adams, S.M.; Mcmichael, S.N. Effects of professional visual search experience on domain-general and domain-specific visual cognition. In Proceedings of the International Conference on Augmented Cognition, Los Angeles, CA, USA, 2–7 August 2015. [Google Scholar]
- Ke, Q.; Wang, X. Research on the integration of cognitive style and information search behavior. Inf. Stud. Theory Appl. 2011, 34, 35–39. [Google Scholar]
- Opach, T.; Popelka, S.; Dolezalova, J.; Rød, J.K. Star and polyline glyphs in a grid plot and on a map display: Which perform better? Cartogr. Geogr. Inf. Sci. 2017, 2, 400–419. [Google Scholar] [CrossRef]
- Huang, H. Research on Multi-Scale Spatial Data Model Based on Ontology and Its Consistency; Science Press: Beijing, China, 2017. [Google Scholar]
- Teets, J.M.; Tegarden, D.P.; Russell, R.S. Using Cognitive Fit Theory to Evaluate the Effectiveness of Information Visualizations: An Example Using Quality Assurance Data. IEEE Trans. Vis. Comput. Graph. 2010, 16, 841–853. [Google Scholar] [CrossRef] [PubMed]
- Konecny, M.; Friedmannova, L.; Staněk, K. An adaptive cartographic visualization for support of the crisis management. In CaGIS Publications Autocarto; CaGIS: Vancouver, WA, USA, 2006; pp. 100–105. [Google Scholar]
- Liang, Y.; Liu, H.Z. Study of image retrieval based on vision attention mechanism. J. Beijing Union Univ. 2010, 24, 30–35. [Google Scholar]
- Yantis, S.; Jonides, J. Abrupt visual onsets and selective attention: Voluntary versus automatic allocation. J. Exp. Psychol. Hum. Percept. Perform. 1990, 16, 121–134. [Google Scholar] [CrossRef] [PubMed]
- Maunsell, J.H.; Treue, S. Feature-based attention in visual cortex. Trends Neurosci. 2006, 29, 317–322. [Google Scholar] [CrossRef] [Green Version]
- Swienty, O.; Zhang, M.; Reichenbacher, T.; Meng, L. Establishing a neurocognition-based taxonomy of graphical variables for attention-guiding geovisualisation. Proceedings of SPIE-Geoinformatics 6751, Nanjing, China, 25–27 May 2007; p. 675109. [Google Scholar]
- Lu, Z.L.; Dosher, B.A. External noise distinguishes attention mechanisms. Vis. Res. 1998, 38, 1183–1198. [Google Scholar] [CrossRef] [Green Version]
- Yang, T. Spatial and Feature-Based Attention in Visual Processing. Adv. Psychol. 2013, 3, 221–226. [Google Scholar]
- Chesneau, E. A model for the automatic improvement of colour contrasts in maps: Application to risk maps. Int. J. Geogr. Inf. Sci. 2011, 25, 89–111. [Google Scholar] [CrossRef]
- Li, W.; Wu, H. Fractal Attenuation Analysis of Cartographic Object’s Self-similarity on Cartographic Generalization. Geomat. Inf. Sci. Wuhan Univ. 2005, 30, 309–312. [Google Scholar]
- Dong, W.; Liao, H.; Zhan, Z.; Liu, B.; Wang, S.; Yang, T. New research progress of eye tracking-based map cognition in cartography since 2008. Acta Geogr. Sin. 2019, 74, 599–614. [Google Scholar]
- Lu, Z.L.; Dosher, B.A. Spatial attention: Different mechanisms for central and peripheral temporal precues? J. Exp. Psychology Hum. Percept. Perform. 2000, 26, 1534–1548. [Google Scholar] [CrossRef]
- Paj, R. New Map Graphics of Topographic Maps of the Republic of Croatia. Kartogr. Geoinformacije 2008, 1, 1. [Google Scholar]
- Spiess, A.; Baumgartner, U.; Arn, S. Topographic Maps—Map Graphic and Generalisation; Cartographic Publication Series No. 17; Swiss Society of Cartography: Zurich, Switzerland, 2002. [Google Scholar]
- Frangeö, S. Map Graphics in Digital Cartography. Ph.D. Thesis, University of Zagreb, Zagreb, Croatia, 1998. (In Croatian). [Google Scholar]
- Swienty, O.; Wu, H.; Zhu, Q.; Zhang, M.; Reichenbacher, T. Attention guiding visualization of geospatial information. In Proceedings of the Geoinformatics 2006: Geospatial Information Technology, Wuhan, China, 28 October 2006; p. 642101. [Google Scholar]
- Long, Y.; Wen, Y.; Sheng, Y. Electronic Cartography; Science Press: Beijing, China, 2006. [Google Scholar]
- Li, W.; Qian, M. Revision of the state-trait anxiety inventory with sample of Chinese college students. Acta Sci. Nat. Univ. Pekin. 1995, 31, 108–114. [Google Scholar]
- Nichols, A.L.; Maner, J.K. The Good-Subject Effect: Investigating Participant Demand Characteristics. J. Gen. Psychol. 2008, 135, 151–166. [Google Scholar] [CrossRef] [PubMed]
- Orne, M.T. On the social psychology of the psychological experiment: With particular reference to demand characteristics and their implications. Am. Psychol. 1962, 17, 776–783. [Google Scholar] [CrossRef]
- May, J.G.; Kennedy, R.S.; Williams, M.C.; Dunlap, W.P.; Brannan, J.R. Eye movement indices of mental workload. Acta Psychol. 1990, 75, 75–89. [Google Scholar] [CrossRef]
Figure 1.
Cognitive fit in spatial cognition and information matching.

Figure 2.
Crisis map visual cognition process.

Figure 3.
Design principles of crisis maps based on PTM.

Figure 4.
Three different fire emergency rescue road maps: (a) non-relevance filtered and non-saliency map; (b) relevance filtered but non-saliency map; and (c) relevance filtered and saliency map.
Figure 4.
Three different fire emergency rescue road maps: (a) non-relevance filtered and non-saliency map; (b) relevance filtered but non-saliency map; and (c) relevance filtered and saliency map.

Figure 5.
The scan paths and salient regions computed with the Itti model: (a1) the scan paths of the non-relevance filtered and non-saliency map; (b1) the salient regions of the non-relevance filtered and non-saliency map; (a2) the scan paths of the relevance filtered but non-saliency map; (b2) the salient regions of the relevance filtered but non-saliency map; (a3) the scan paths of the relevance filtered and saliency map; and (b3) the salient regions of the relevance filtered and saliency map.

Figure 6.
Experimental process of crisis map reaction time evaluation.

Table 1.
Stressors affecting users’ map cognition under emergencies.
| Stressor | Main Items | Examples |
|---|---|---|
| Exogenous disruptions | Emergency events | Earthquake, flood, etc. |
| Losses | Death toll, property loss, etc. | |
| Major hazard sources | Liquid oxygen storage tank, explosions factory, etc. | |
| Significant hidden dangers | Potential landslides, hidden dangers in fire, etc. | |
| Unfavorable environmental conditions | Rugged topography, heavy rainstorm, etc. | |
| Endogenous disruptions | Ineffective map | Visual overload, inappropriate graphics, etc. |
| Emergency tasks | Medical rescue, crowd evacuation, etc. | |
| Psychological constraints on emergency management | Anxiety, fear, etc. | |
| User’s negative background | Older age, poor map literacy, etc. |
Table 2.
Query time of cartographic objects and visual conversions.
| Map | Thematic Layer | Base Map | ||||
|---|---|---|---|---|---|---|
| Accident Site | Fire Brigade Station | Route | Residential Areas | Park | Accident Site | |
| Figure 4a map | Query time | 101.1 ms | 160.1 ms | / | 290.9 ms | 380.4 ms |
| Visual conversions | 2 | 2 | 0 | 4 | 1 | |
| Figure 4b map | Query time | 97.7 ms | 174.0 ms | / | 238.7 ms | 297.5 ms |
| Visual conversions | 3 | 3 | 0 | 2 | 1 | |
| Figure 4c map | Query time | 94.4 ms | 175.8 ms | 183.1 ms | 573.4 ms | 382.5 ms |
| Visual conversions | 8 | 5 | 6 | 3 | 2 | |
The Note: ‘/’ means Itti’s visual saliency model could not detect the route.
Table 3.
Evaluation of inducing anxiety from the video clips.
| T Matched (M ± SD) | Std.Error Mean | t | Sig. | Norm (M ± SD) | |
|---|---|---|---|---|---|
| Before | After | ||||
| 30.45 ± 7.18 | 52.70 ± 5.82 | −22.25 | −18.845 | 0.000 | 45.31 ± 11.99 |
Table 4.
The experimental accuracy and reaction time for each group.
| Group A (Figure 4a Map) | Group B (Figure 4b Map) | Group C (Figure 4c Map) | |||||||
|---|---|---|---|---|---|---|---|---|---|
| Cartographic Objects | Fire Brigade Station | Route | Accident Site | Fire Brigade Station | Route | Accident Site | Fire Brigade Station | Route | Accident Site |
| Accuracy | 100% | 85% | 98% | 100% | 80% | 100% | 100% | 90% | 100% |
| Average time | 1257 ms | 1280 ms | 1251 ms | 805 ms | 815 ms | 804 ms | 675 ms | 680 ms | 679 ms |
| Overall average time | 1262.67 ms | 808 ms | 678 ms | ||||||
Table 5.
Paired samples test of map reaction time.
| Pairs | Paired Differences | t | Sig. | |||
|---|---|---|---|---|---|---|
| Mean | Std.Deviation | Std.Error Mean | ||||
| Pair 1 | A-B | 454.67 | 217.15 | 28.03 | 16.22 | 0.000 |
| Pair 2 | A-C | 584.67 | 240.45 | 31.04 | 18.83 | 0.000 |
| Pair 3 | B-C | 130.00 | 94.91 | 12.25 | 10.61 | 0.000 |
Publisher’s Note: MDPI stays neutral with regard to jurisdictional claims in published maps and institutional affiliations. |
© 2021 by the authors. Licensee MDPI, Basel, Switzerland. This article is an open access article distributed under the terms and conditions of the Creative Commons Attribution (CC BY) license (https://creativecommons.org/licenses/by/4.0/).
Share and Cite
MDPI and ACS Style
Du, P.; Li, D.; Liu, T.; Zhang, L.; Yang, X.; Li, Y. Crisis Map Design Considering Map Cognition. ISPRS Int. J. Geo-Inf. 2021, 10, 692. https://0-doi-org.brum.beds.ac.uk/10.3390/ijgi10100692
AMA Style
Du P, Li D, Liu T, Zhang L, Yang X, Li Y. Crisis Map Design Considering Map Cognition. ISPRS International Journal of Geo-Information. 2021; 10(10):692. https://0-doi-org.brum.beds.ac.uk/10.3390/ijgi10100692
Chicago/Turabian StyleDu, Ping, Dingkai Li, Tao Liu, Liming Zhang, Xiaoxia Yang, and Yikun Li. 2021. "Crisis Map Design Considering Map Cognition" ISPRS International Journal of Geo-Information 10, no. 10: 692. https://0-doi-org.brum.beds.ac.uk/10.3390/ijgi10100692
Note that from the first issue of 2016, this journal uses article numbers instead of page numbers. See further details here.