

ISPRS Int. J. Geo-Inf. 2024, 13(5), 141; https://0-doi-org.brum.beds.ac.uk/10.3390/ijgi13050141 - 23 Apr 2024
Abstract
►
Show Figures
Human movements in urban areas are essential to understand human–environment interactions. However, activities and associated movements are full of uncertainties due to the complexity of a city. In this paper, we propose a novel sensor-based approach for spatiotemporal event detection based on the
[...] Read more.
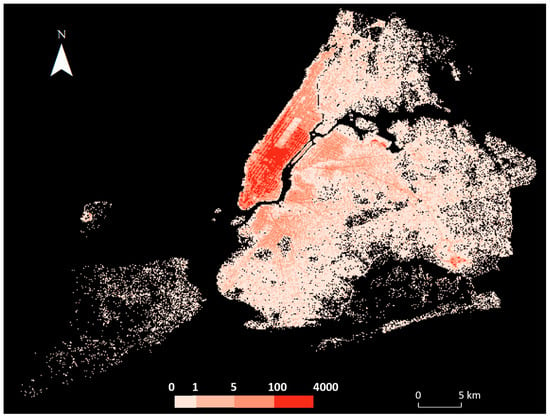
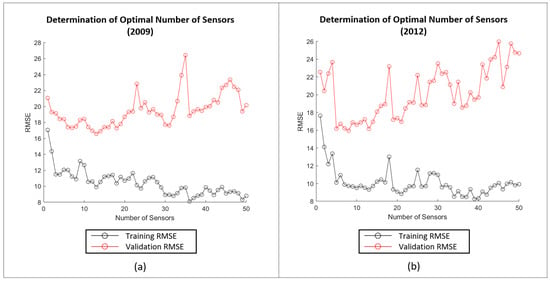
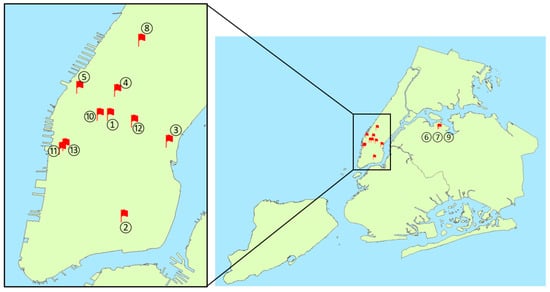
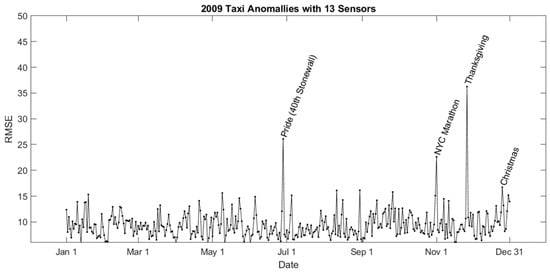
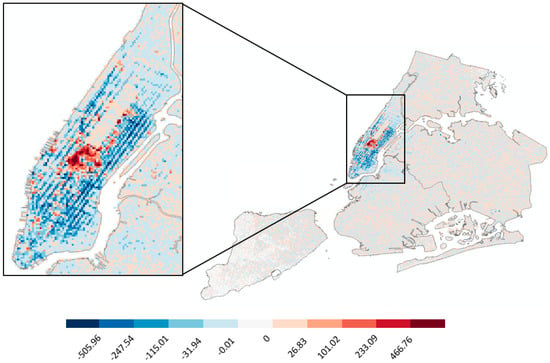
Human movements in urban areas are essential to understand human–environment interactions. However, activities and associated movements are full of uncertainties due to the complexity of a city. In this paper, we propose a novel sensor-based approach for spatiotemporal event detection based on the Discrete Empirical Interpolation Method. Specifically, we first identify the key locations, defined as “sensors”, which have the strongest correlation with the whole dataset. We then simulate a regular uneventful scenario with the observation data points from those key locations. By comparing the simulated and observation scenarios, events are extracted both spatially and temporally. We apply this method in New York City with taxi trip record data. Results show that this method is effective in detecting when and where events occur.
Full article
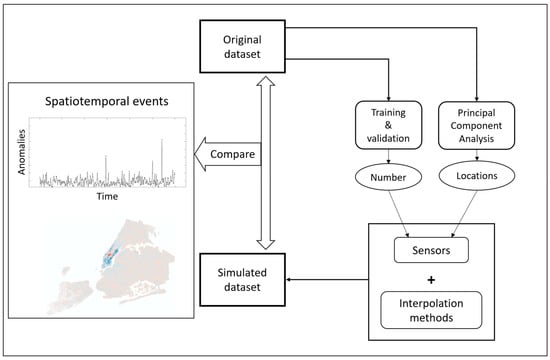
Figure 1


